Development of Efficient External Multi-Hazard Risk Quantification Methodology for Nuclear Facilities


1
Department of Civil and Environmental Engineering, Hanbat National University, Daejeon 34158, Korea
2
Mechanical and Structural Safety Research Division, Korea Atomic Energy Research Institute, Daejeon 34057, Korea
3
Department of Civil Engineering, Pusan National University, Busan 46241, Korea
*
Authors to whom correspondence should be addressed.
Energies 2019, 12(20), 3925; https://doi.org/10.3390/en12203925
Submission received: 5 August 2019
/
Revised: 14 October 2019
/
Accepted: 15 October 2019
/
Published: 16 October 2019
(This article belongs to the Section G: Energy and Buildings)
Abstract
:Probabilistic safety assessment (PSA) of nuclear facilities on external multi-hazards has become a major issue after the Fukushima accident in 2011. However, the existing external hazard PSA methodology is for single hazard events and cannot cover the impact of multi-hazards. Therefore, this study proposes a methodology for quantifying multi-hazard risks for nuclear energy plants. Specifically, we developed an efficient multi-hazard PSA methodology based on the probability distribution-based Boolean algebraic approach and sampling-based method, which are currently single-hazard PSA methodologies. The limitations of the probability distribution-based Boolean algebraic approach not being able to handle partial dependencies between the components are solved through this sampling-based method. In addition, we devised an algorithm that was more efficient than the existing algorithm for improving the limits of the current sampling-based method, as it required a significant computational time. The proposed methodology was applied from simple examples to single- and multi-hazard PSA examples of actual nuclear power plants. The results showed that the proposed methodology was verified in terms of accuracy and efficiency perspectives. Regarding the sampling-based method, it was confirmed that the proposed algorithm yielded fragility and risk results that have similar degrees of accuracy, even though it extracted a smaller number of samples than the existing algorithm.
1. Introduction
Recent events worldwide have demonstrated that natural hazards cannot be neglected in evaluating the risk of industrial facilities. Accordingly, several studies have been conducted related to natural hazard risk assessment [1,2,3,4]. Basco and Salzano [1] analyzed the hazards related to tsunamis and their impact on the industrial equipment tanks. The fragility functions for this have been specifically defined with respect to tsunami waves and debris. Salzano et al. [2] dealt with the seismic risk analysis of industrial facilities where tanks, reactors, and pumps are installed. Their study specifically discussed the simplified procedures and methodologies based on a historical database and literature data on natural-technological accidents for seismic risk assessment. Fabbrocino et al. [3] studied the issue of integrating structural seismic risk into quantitative probabilistic seismic risk analysis by a representative study case regarding an oil storage plant. Prabhu et al. [4] described a generalized probabilistic methodology for estimating facility downtime under multi-hazard scenarios. Using the Boolean logic, the component vulnerabilities to different hazards were combined. This research demonstrated the applicability of the methodology on industrial plants.
With this background, especially for the nuclear industry, since the cause of the 2011 Fukushima Nuclear Power Plant (NPP) accident turned out to be the multi-hazards from the earthquake and the tsunami, there has been a need to explore various accident scenarios in order to improve the nuclear safety. Multi-hazards can be manifested in a variety of forms, including concurrently occurred hazards (e.g., earthquakes and tsunamis) and sequentially occurred multiple hazards (e.g., earthquake-induced landslides and earthquake-induced fires) [5]. The recent 2016 Kumamoto earthquake and the 2018 Hokkaido earthquake induced slope collapse, and such slope collapse subsequently caused the failures of adjacent major infrastructures, such as roads, buildings, and chemical plants. This accident shows the potential threat that such multi-hazards may also occur around nuclear facilities when they are located near a slope such as the ones in Korea.
Currently, the method to probabilistically evaluate the safety of nuclear facilities against the potential impact of external hazards is called External Event Probabilistic Safety Assessment (EE-PSA) [6,7,8,9]. Such assessments have been conducted to identify and improve the safety of nuclear plants from external accidents. Generally, for the nuclear facilities, the EE-PSA probabilistically predicts the possibility of damage to the reactor core due to external hazards. Thus, the safety of the overall nuclear facilities is assessed against external hazards based on this predicted assessment. Methodologically, the EE-PSA is an integrated process that obtains a single risk value by performing an external hazard analysis, fragility analysis, accident scenario analysis, and risk quantification. It also takes into account the randomness and uncertainty associated with these analyses and quantifications. However, the conventional EE-PSA of the nuclear facilities has been carried out for a single hazard, and the multiple hazards occurring simultaneously or sequentially have not been considered because of their low possibilities of occurrence and difficulties in handling these.
For the nuclear facilities, the integrated codes for quantifying the current single-hazard EE-PSA risks are SEISM, SEISMIC, EQESRA, and PRASSE. They are all probability distribution-based Boolean algebraic quantification methodologies [10,11,12]. The commonality of the above mentioned codes is based on the Electric Power Research Institute (EPRI) separation-of-variable (SOV) method, which is a single-hazard fragility analysis method proposed by EPRI [13]. These codes accept component fragility information as input data and evaluate the system fragility by using Boolean algebra. However, the risk quantification analysis method that uses Boolean algebra has a limitation in accurately evaluating the partial dependency between the components. The inter-component dependency is a phenomenon that may occur in the different components on the same floor or the same components on the same floor under an external hazard event, which can be quantified to different degrees of correlation coefficient values. Such inter-component dependency has been found to have a non-negligible impact on the single-hazard EE-PSA results through the risk sensitivity analyses regarding various actual nuclear power plants [14]. Specifically, the method of dealing with such inter-component dependency basically assumes a joint log-normal probability distribution between the random variables, with respect to the fragility information having inter-component dependency information. Accordingly, the inter-component dependency information is represented by a correlation coefficient matrix composed of correlation coefficients between component fragilities. Here, the defined correlation coefficient value is the Pearson correlation coefficient, which shows the strength and direction of the linear relationship between two random variables and is defined as the covariance of the variables divided by the product of their standard deviations. The correlation coefficients between these components are obtained from analysis, testing, field measurements, empirical data, and expert judgment. Recently, there have been attempts to quantify the partial dependency between components by using a flexible relation of nodes and a conditional probability table within the Bayesian network technique in order to conduct the single- and multi- hazard PSA methods considering inter-component correlations [15,16,17]. However, in the safety assessment of nuclear facilities, it is expected to apply the strictly proven concepts due to the significant impact that nuclear facilities can get in the event of an accident. Therefore, this new technique has not been applied yet to the risk quantification of the nuclear facilities.
Under these circumstances, Watanabe et al. [18] developed a sampling-based risk quantification method (called SECOM2-DQFM) to consider precisely the partial dependencies between components based on the fragility method developed by JAERI (Japan Atomic Energy Research Institute) (also known as the response coefficient method) [19]. From the SECOM2-DQFM’s fragility analysis stage, the component is sampled by separating this into a response R and a capacity C. Based on comparing the values from the samplings of R and C, the state of the component is classified into safety (“0”) and failure (“1”). Based on such component state information, the states of the sub-system and the top-system are evaluated as “0” and “1” through the various logic gates on the fault tree. The probability of failure of each component, sub-system, and top-system is also evaluated by the ratio between the number of total samples and the number of failure state samples (i.e., samples having “1”). By iteratively performing this procedure for each external hazard intensity, the component and system fragility curves are ultimately derived. Due to this method’s features, it is possible to take into account all of the partial dependencies between the components in the sampling stage. The method also has the advantage of being able to obtain an accurate solution if a sufficient number of samples is extracted. In addition, since the partial dependency relationship between the response and the capacity can be evaluated separately, it is possible to perform a more detailed analysis. However, since this method is a sampling-based method there is a disadvantage in that the computational time is relatively large because a large number of samples must be extracted in order to get a value close to the exact solution [20,21]. In addition, there is a disadvantage that a large number of input variables has to be defined in connection with the features of the JAERI fragility methodology compared to the risk quantification method based on the existing EPRI SOV fragility input-based method. Most importantly, there is a fundamental limitation that the analytical time is quite large because sufficient samples must be extracted for the response R and the capacity C for every single external hazard intensity. An analytical study has been conducted to assess the probabilistic reliability and fragility analyses under specific loads at a level of a single component and a structure in the nuclear industry [22]. However, this study did not extend from the component level fragility to the overall plant level system fragility assessment stage.
For the safety analysis of the nuclear facility, most of the risk quantification methods developed so far are methodologies for single external-hazard events. Therefore, expanding the existing single-hazard EE-PSA methodology is essential for quantifying the risk of nuclear facilities for multiple hazards. Conceptually, multi-hazard risk quantification can be expressed in the following equation:
Here, ai represents the hazard intensity of each external hazard i considered. For a single external-hazard event case, the external event hazard information (H) and system fragility information (Pf|s) are expressed as a one-dimensional function in a conventional single external-hazard event, and the corresponding final risk is quantified through the one-dimensional integral. However, in quantifying multi-hazard risks, the hazard and fragility are expressed in a multi-dimensional space, and the final risk is quantified through multi-dimensional integration. Therefore, in deriving the multi-dimensional system fragility results, the Boolean algebra or the sampling extraction and comparison should be performed in a multi-dimensional area. In addition, the collection of reliable original data on the fragility and the hazard is essential for an accurate multi-hazard risk assessment. However, such data collection is one of the most challenging parts of the risk assessment process. Since the focus of this study was on improving risk assessment methods, detailed multi-hazard data collection has not been covered in detail.
Therefore, under this background, we propose a methodology for quantifying the multi-hazard risks of the nuclear facilities by extending the existing single-hazard EE-PSA methodology. Specifically, we develop an efficient multi-hazard PSA methodology by utilizing the current single-hazard EE-PSA methodology such as the probability distribution-based Boolean algebraic approach and the sampling-based method. Here, the limitations on not being able to deal with the partial dependencies of the probability distribution-based Boolean algebraic approach are solved through the sampling-based method. In addition, a more efficient algorithm is proposed to improve the current sampling-based method, which requires a long computational time. Finally, in the sampling-based method, the number of input variables is minimized by reducing the existing input variables to the basic input variables of the EPRI SOV’s fragility method. As a result, the originality and significance of this study are to present a multi-hazard PSA method that is not currently in the nuclear energy industry and to increase the computational efficiency of the existing sampling-based EE-PSA method (i.e., DQFM).
In order to verify the validity of the proposed multi-hazard PSA methodology for the nuclear facilities, four examples were applied, and the results from the different methods within the methodology were compared for accuracy and efficiency. The four selected examples were deployed in a way that increased the complexity of the system. In particular, the third and fourth examples were for the single EE-PSA and the multi-hazard PSA of an actual nuclear power plant, respectively.
2. Existing Methodology and Proposed Algorithm
2.1. Existing Single-Hazard EE-PSA Methodology
The process of obtaining the conditional probability of failure of a component due to the intensity of an external hazard by considering the randomness and the uncertainty of the external hazard and the component is called fragility analysis. There are several approaches to analyze this but, currently, the safety factor method (or also known as the separation of variables (SOV) method devised by the U.S. EPRI [13]) is commonly used in the nuclear industry. This method describes the fragility of a single component as the following lognormal cumulative distribution [10,11,12,23,24], which is expressed as three main parameters:
where a denotes the hazard intensity, Φ [.] means the standard normal cumulative distribution function, a means the intensity of the external hazard, and Am represents the median hazard performance value. The βc is a composite log-standard deviation that incorporates log-standard deviations, which indicate randomness (βr) and uncertainty (βu) that can be calculated by βc = (βr2 + βu2)0.5. This obtained distribution information of a single component fragility is ultimately used as a basic input to EE-PSA. Currently, the typical single-hazard EE-PSA used in the nuclear industry is carried out using the probability distribution-based Boolean algebraic quantification method [10,11,12]. Such an approach has a limitation of not being able to consider the partial dependency between components as mentioned before. Even if this method is applied to the partial dependency problem, it is impossible to derive an exact solution. Accordingly, SSMRP [25] once considered a seismic partial correlation between the components within an AND condition through a multiple integration method in the case of AND conditions between the components. However, even such attempts conservatively assessed the risk values by taking an upper bound of the exact solution through assuming the independence in the case of an OR condition.
Another method utilized in the nuclear industry for fragility analysis is the JAERI approach, which is also known as the response factor method [19]. Although the JAERI approach is essentially similar to the EPRI SOV method, it is characterized as having a more granular breakdown of the Am coefficient used in the EPRI SOV method by using the actual response R and the capacity C to describe the fragility distribution. The fragility of the component from the JAERI approach is expressed as a function as follows:
where Rm and Cm are the median values associated with response and capacity. Due to the method’s characteristics, deviations from the randomness and uncertainty of R and C exist, respectively. The βRr and βRu, respectively, mean a log-standard deviation with respect to the randomness and uncertainty associated with the response R. The βCr and βCu each represent a log-standard deviation with respect to the randomness and uncertainty from the capacity C. As with the EPRI SOV method, the log-standard deviations, which represent the randomness and uncertainty of each of the above R and C, can be incorporated into a composite log-standard deviation in terms of a square root expression (βRc = (βRr2 + βRu2)0.5 and (βCc = (βCr2 + βCu0.5). From this composite expression of the log-standard deviation, the fragility of a single component can finally be expressed as one distribution, as shown in the above equation.
Due to the above-mentioned JAERI approach feature, this approach has demanded a relatively larger number of inputs (Rm, Cm, βRr, βCr, βRu, βCu) than the EPRI fragility SOV method (Am, βr, βu) when performing the EE-PSA based on the input data of component fragilities. However, this approach has an advantage in that the correlation between the response and the capacity can be separated more finely. In addition, the system’s fragility analysis can be intuitively extended to the sampling-based fragility analysis when evaluating the fragility of the system. Therefore, Watanabe et al. [18] proposed a sampling-based fragility assessment method (i.e., the DQFM: Direct Quantification of Fault Tree using the Monte Carlo simulation) that has the advantages of the JAERI approach. This method is represented by the following equations in the component-level fragility evaluation. In addition, the related calculation flow-chart and detailed procedure are well described in their publication:
where LN(α, β) represents the log-normal distribution along the median α and the log-standard deviation β. As shown in the above expression, a sufficient number of samples that follow the distribution of R and C is taken for each component at each hazard intensity. The state conditions of each component at each hazard intensity are expressed in a binary state (i.e., safe (“0”) or fail (“1”)) by comparing the values of R and C from each of the samples extracted. In addition, for each sample, the status of the sub-systems and top systems is evaluated based on a defined fault tree (i.e., a combination of OR gates and AND gates) and component binary status, so that their status is also expressed as binary. Ultimately, at each hazard intensity, the probability of failure of each component, sub-system, and top system is determined by the number of samples having a failure state (“1”) divided by the total number of samples.
The advantage of this method is that it can intuitively take into account component correlations, since it can extract samples by considering the correlation between the components at the sampling stage. In addition, the conservatism/non-conservatism of the results due to the approximation of the solution can be ruled out because securing a sufficient number of samples can make it close to the exact solution. Due to the inherent nature of the developed algorithm, it is necessary to extract a large number of samples for R and C random variables at each hazard intensity. Thus, it has a shortcoming of requiring a high computational cost. In addition, because this is a method for single external hazards, expanding this method is essential for quantifying the risks regarding the multi-hazards.
2.2. Multi-Hazard PSA Quantification Methodology
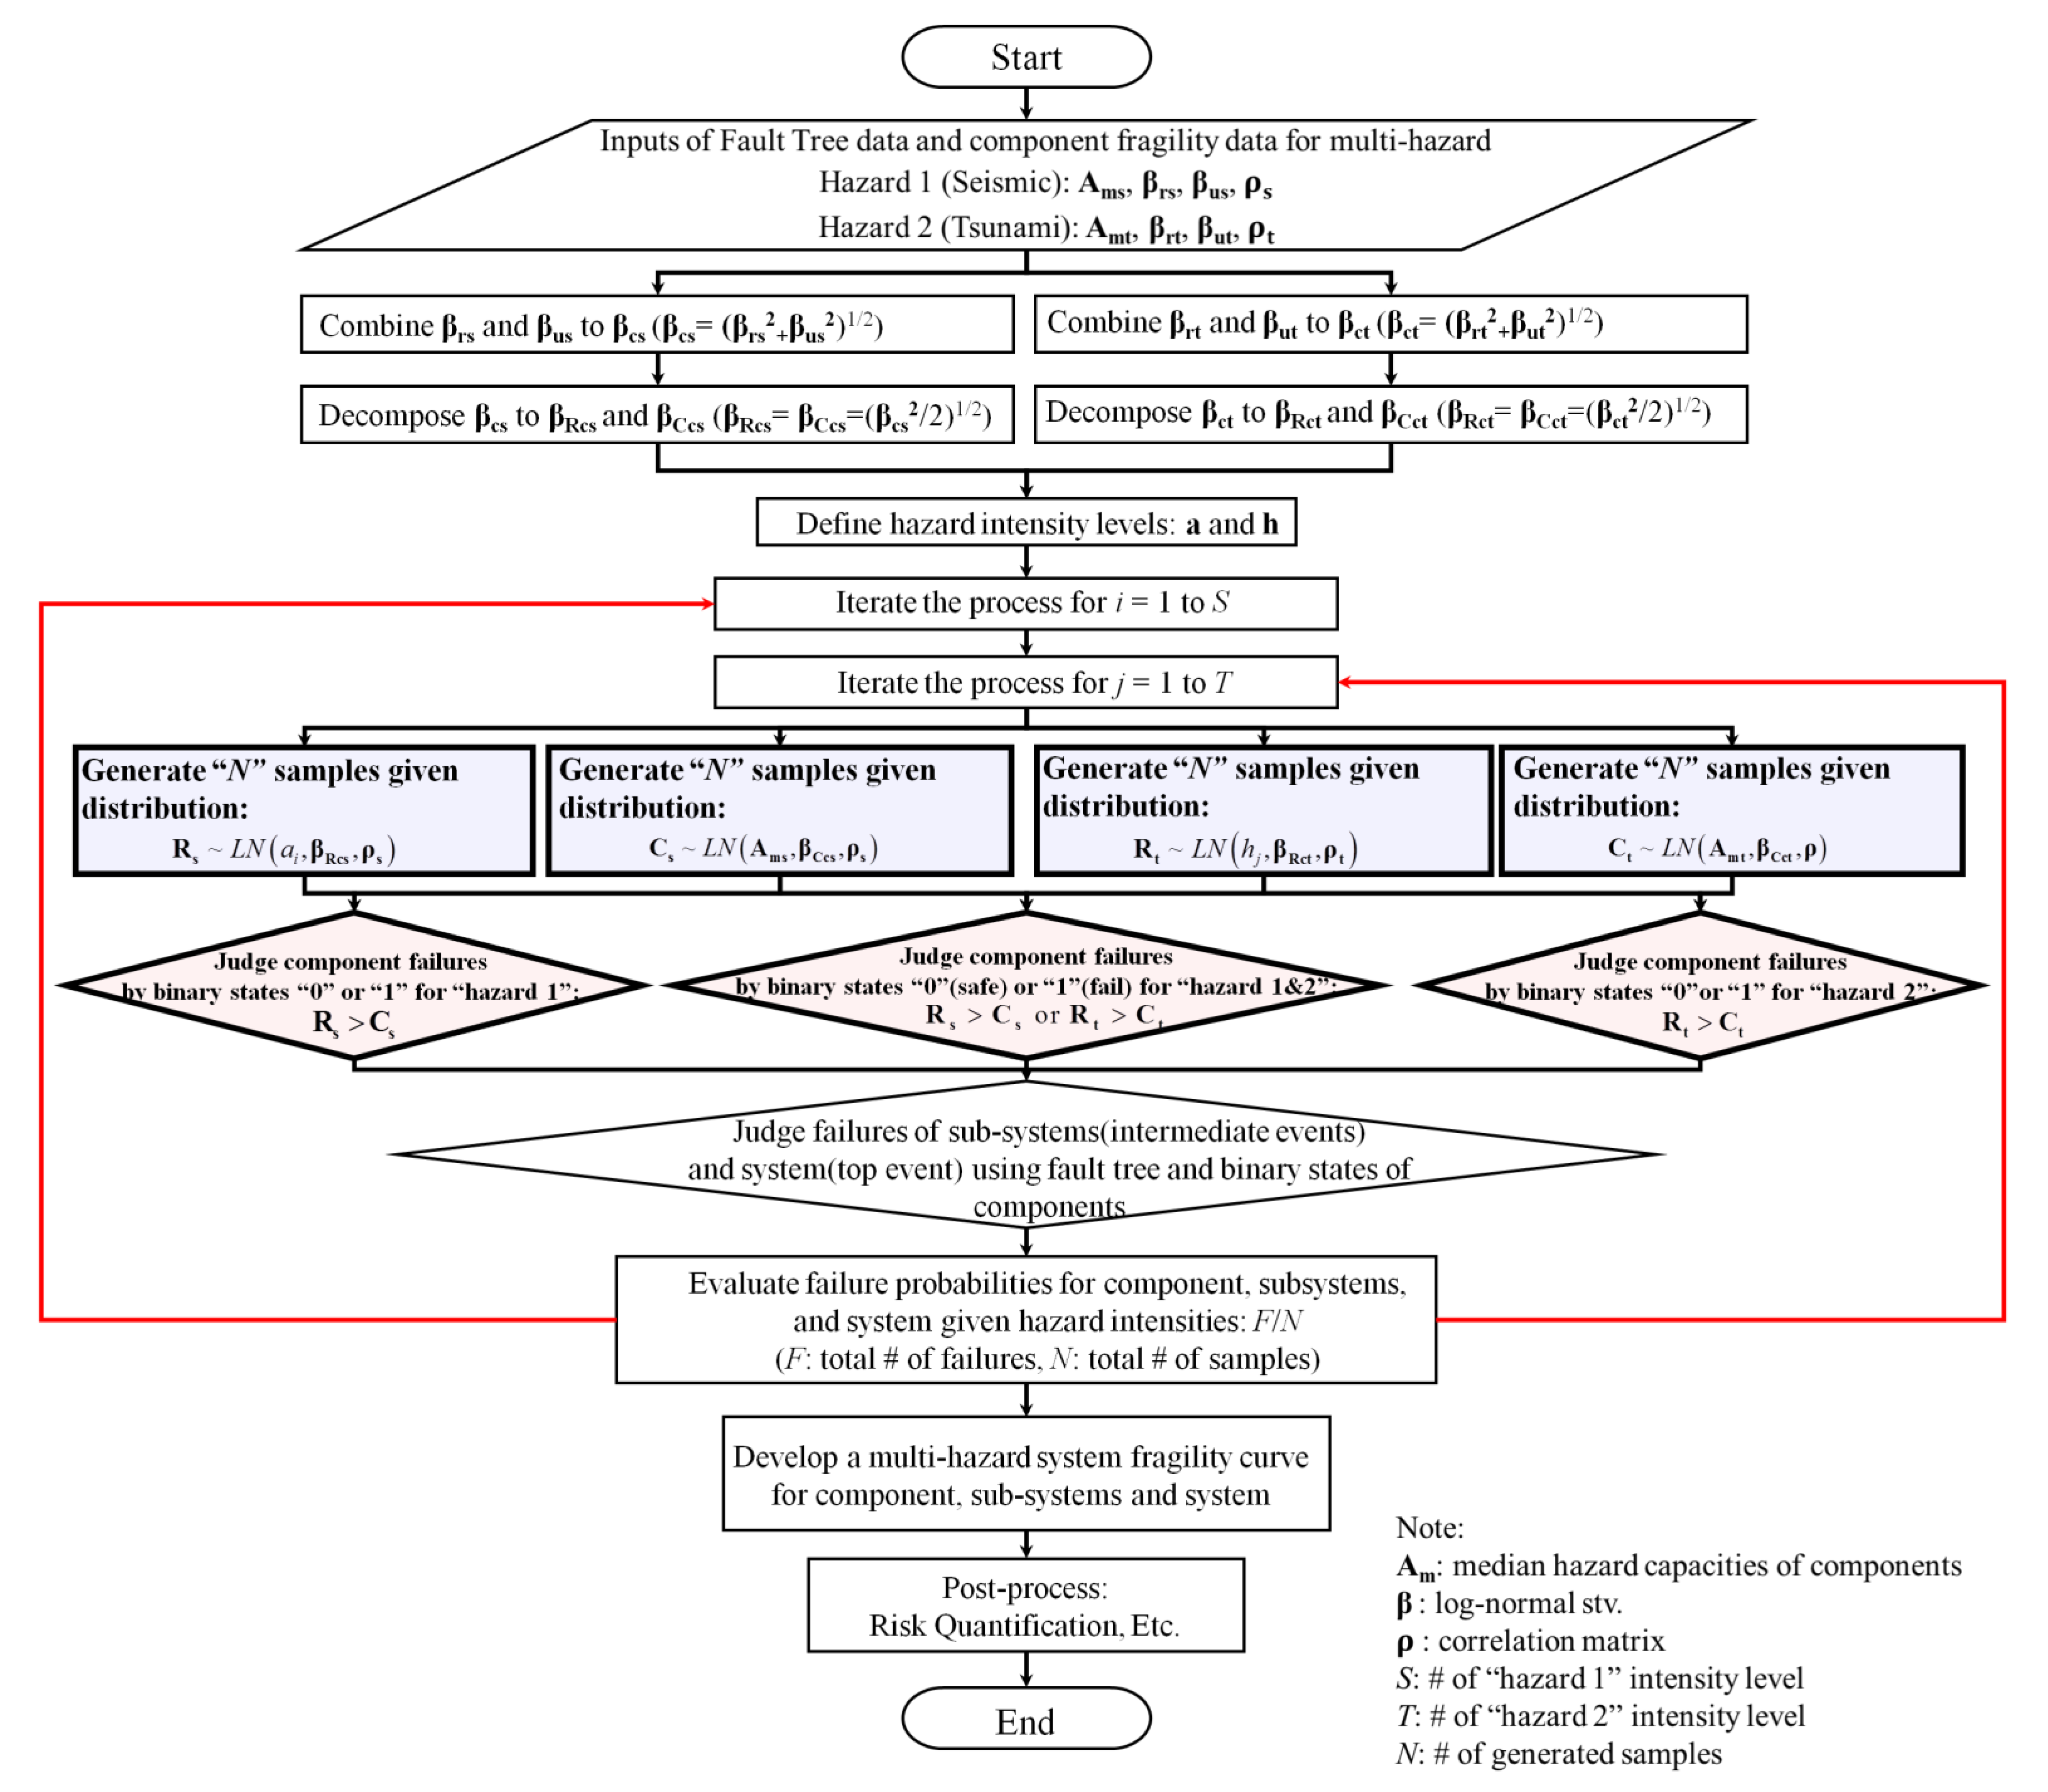
Section 2.2 aims to introduce the methodology to extend the existing single-hazard EE-PSA methodologies, which include the probability distribution-based Boolean methodology and the sampling methodology using the Monte Carlo method (DQFM), to the multi-hazard PSA methodology. In addition, this extended sampling methodology uses an approach that utilizes relatively few EPRI fragility inputs rather than using JAERI fragility inputs as a seismic fragility input method. Specifically, in this Subsection, we propose a methodology for quantifying multi-hazard risks based on the existing single-hazard EE-PSA methodologies of the probability distribution-based Boolean algebraic approach and the Monte Carlo method-based sampling method. To do this, we extend the Boolean algebraic approach of the existing single-hazard EE-PSA methodology and apply it to a multi-hazard PSA method. Additionally, we propose a sampling-based multi-hazard PSA quantification algorithm by extending the DQFM, which is an algorithm from the existing sampling-based method regarding a single hazard. An extended DQFM (hereinafter referred to as E-DQFM) for quantifying multi-hazard PSA risks is developed, as shown in Figure 1. Figure 1 shows external-hazard events of an earthquake and tsunami as an example of the multi-hazards. Here, the proposed E-DQFM methodology improved the efficiency of fragility input by not using a large number of JAERI fragility inputs as a fragility input method, but by using a relatively small number of EPRI fragility inputs.
The detailed description of this method is as follows: (1) Information on FT models and component fragility information related to external hazards (i.e., earthquakes and tsunamis) (EPRI SOV fragility method-based input variables) are entered. (2) Separate log-standard deviations βr and βu are combined into a composite log-standard deviation βc, and then βc is decomposed into the βRc and βCc of log-standard deviations for R and C. (3) Each external-hazard event’s intensity is defined. (4) A sufficient number of samples is extracted following the distribution of R and C with respect to each external hazard for each component according to a sequential combination of the two external hazard intensities defined. In relation to the single- and multi- hazards, the R and C values of the extracted samples are compared with each other, and the binary states of the extracted samples are accordingly represented as safe (“0”) or fail (“1”). (5) Based on the binary states of the N samples of the components, the states of the sub-systems and the top system are determined as binary states on a sample-by-sample basis. (6) The probability of failure for multi-hazards is calculated in proportion to the total number of samples (“N”) and number of failure systems (“F”) in the component, sub-systems, and top system. (7) The combinations of external-hazard event intensities continue to change, and stages (4)–(6) are iteratively performed for each altered combination to obtain a two-dimensional multi-hazard fragility surface in each of the components, sub-systems, and top-systems. (8) Finally, based on the bi-dimensional multi-fragility surface of the component, sub-systems, and top- systems, the final risk probability (typically expressed as an annual core damage frequency) is obtained by convolving this multi-fragility surface with the multi-hazard surface (See Equation (1)).
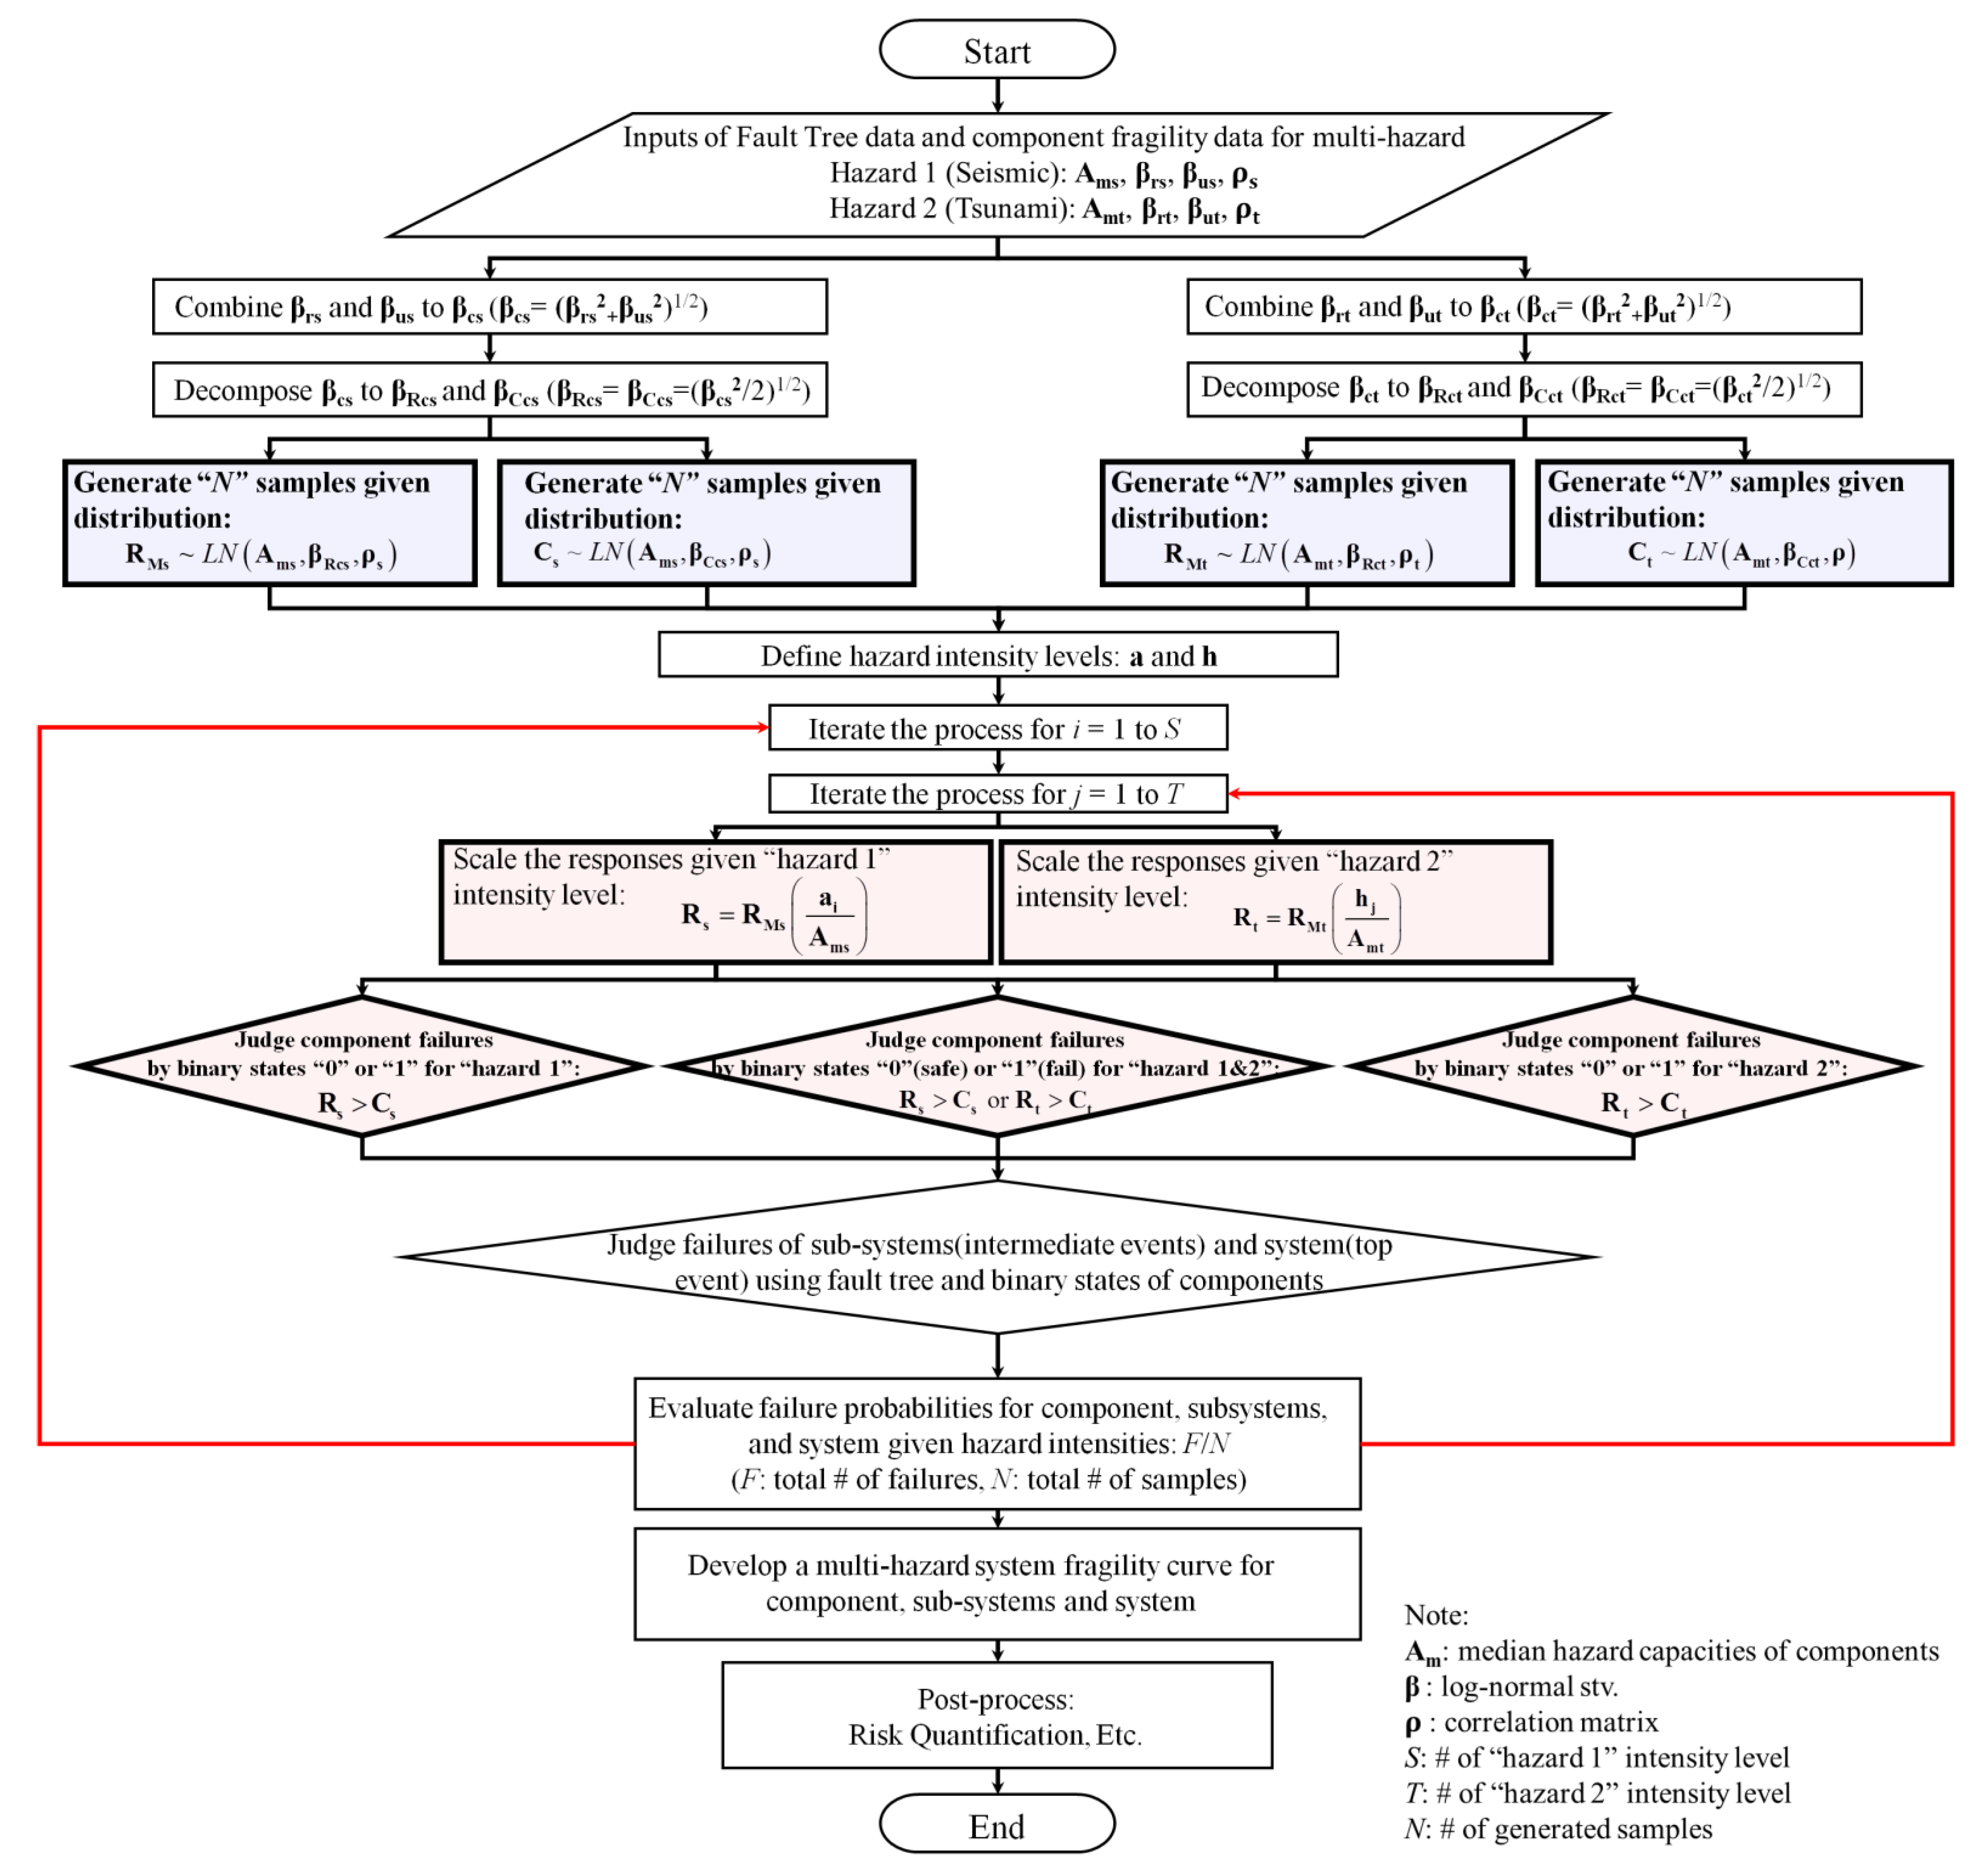
2.3. Improvement in Sampling-Based Multi-Hazard PSA Quantification Code
Since the sampling-based multi-hazard PSA algorithm, which extends the existing single-hazard DQFM algorithm described in Figure 1, is required to extract a large amount of samples for R and C random variables for each external hazard intensity, it still has a disadvantage of demanding a large computational cost. Therefore, in this study, we developed a more efficient sampling-based multi-hazard PSA quantification algorithm that improves the fundamental disadvantages shown in Figure 2. Specifically, to enhance the efficiency of the existing DQFM algorithm, the focus is on improving the original algorithmic procedure instead of utilizing the state-of-the-art sampling techniques. The overall procedure of algorithms shown in Figure 1 and Figure 2 is similar. The main difference is that while the algorithm of Figure 1 extracts samples for R and C in every external hazard intensity, the algorithm of Figure 2 extracts samples for R and C only in a particular external hazard intensity, and only once. In the improved algorithm of Figure 2, the samples of R and C extracted at the median hazard performance’s intensity level are scaled and reused at different external hazard intensities. Such an approach can reduce the number of sampling times significantly and brings efficiency to system fragility calculations because the approach is sampled only once at a specific external hazard intensity and is reused at different external hazard intensities. Additionally, this approach can be especially beneficial for the multi-hazard system fragility and risk quantification assessment, which requires the consideration of all sequential combinations of multi-hazard intensities.
3. Results and Discussions: Simple Examples
3.1. Example 1: C1 ∩ C2
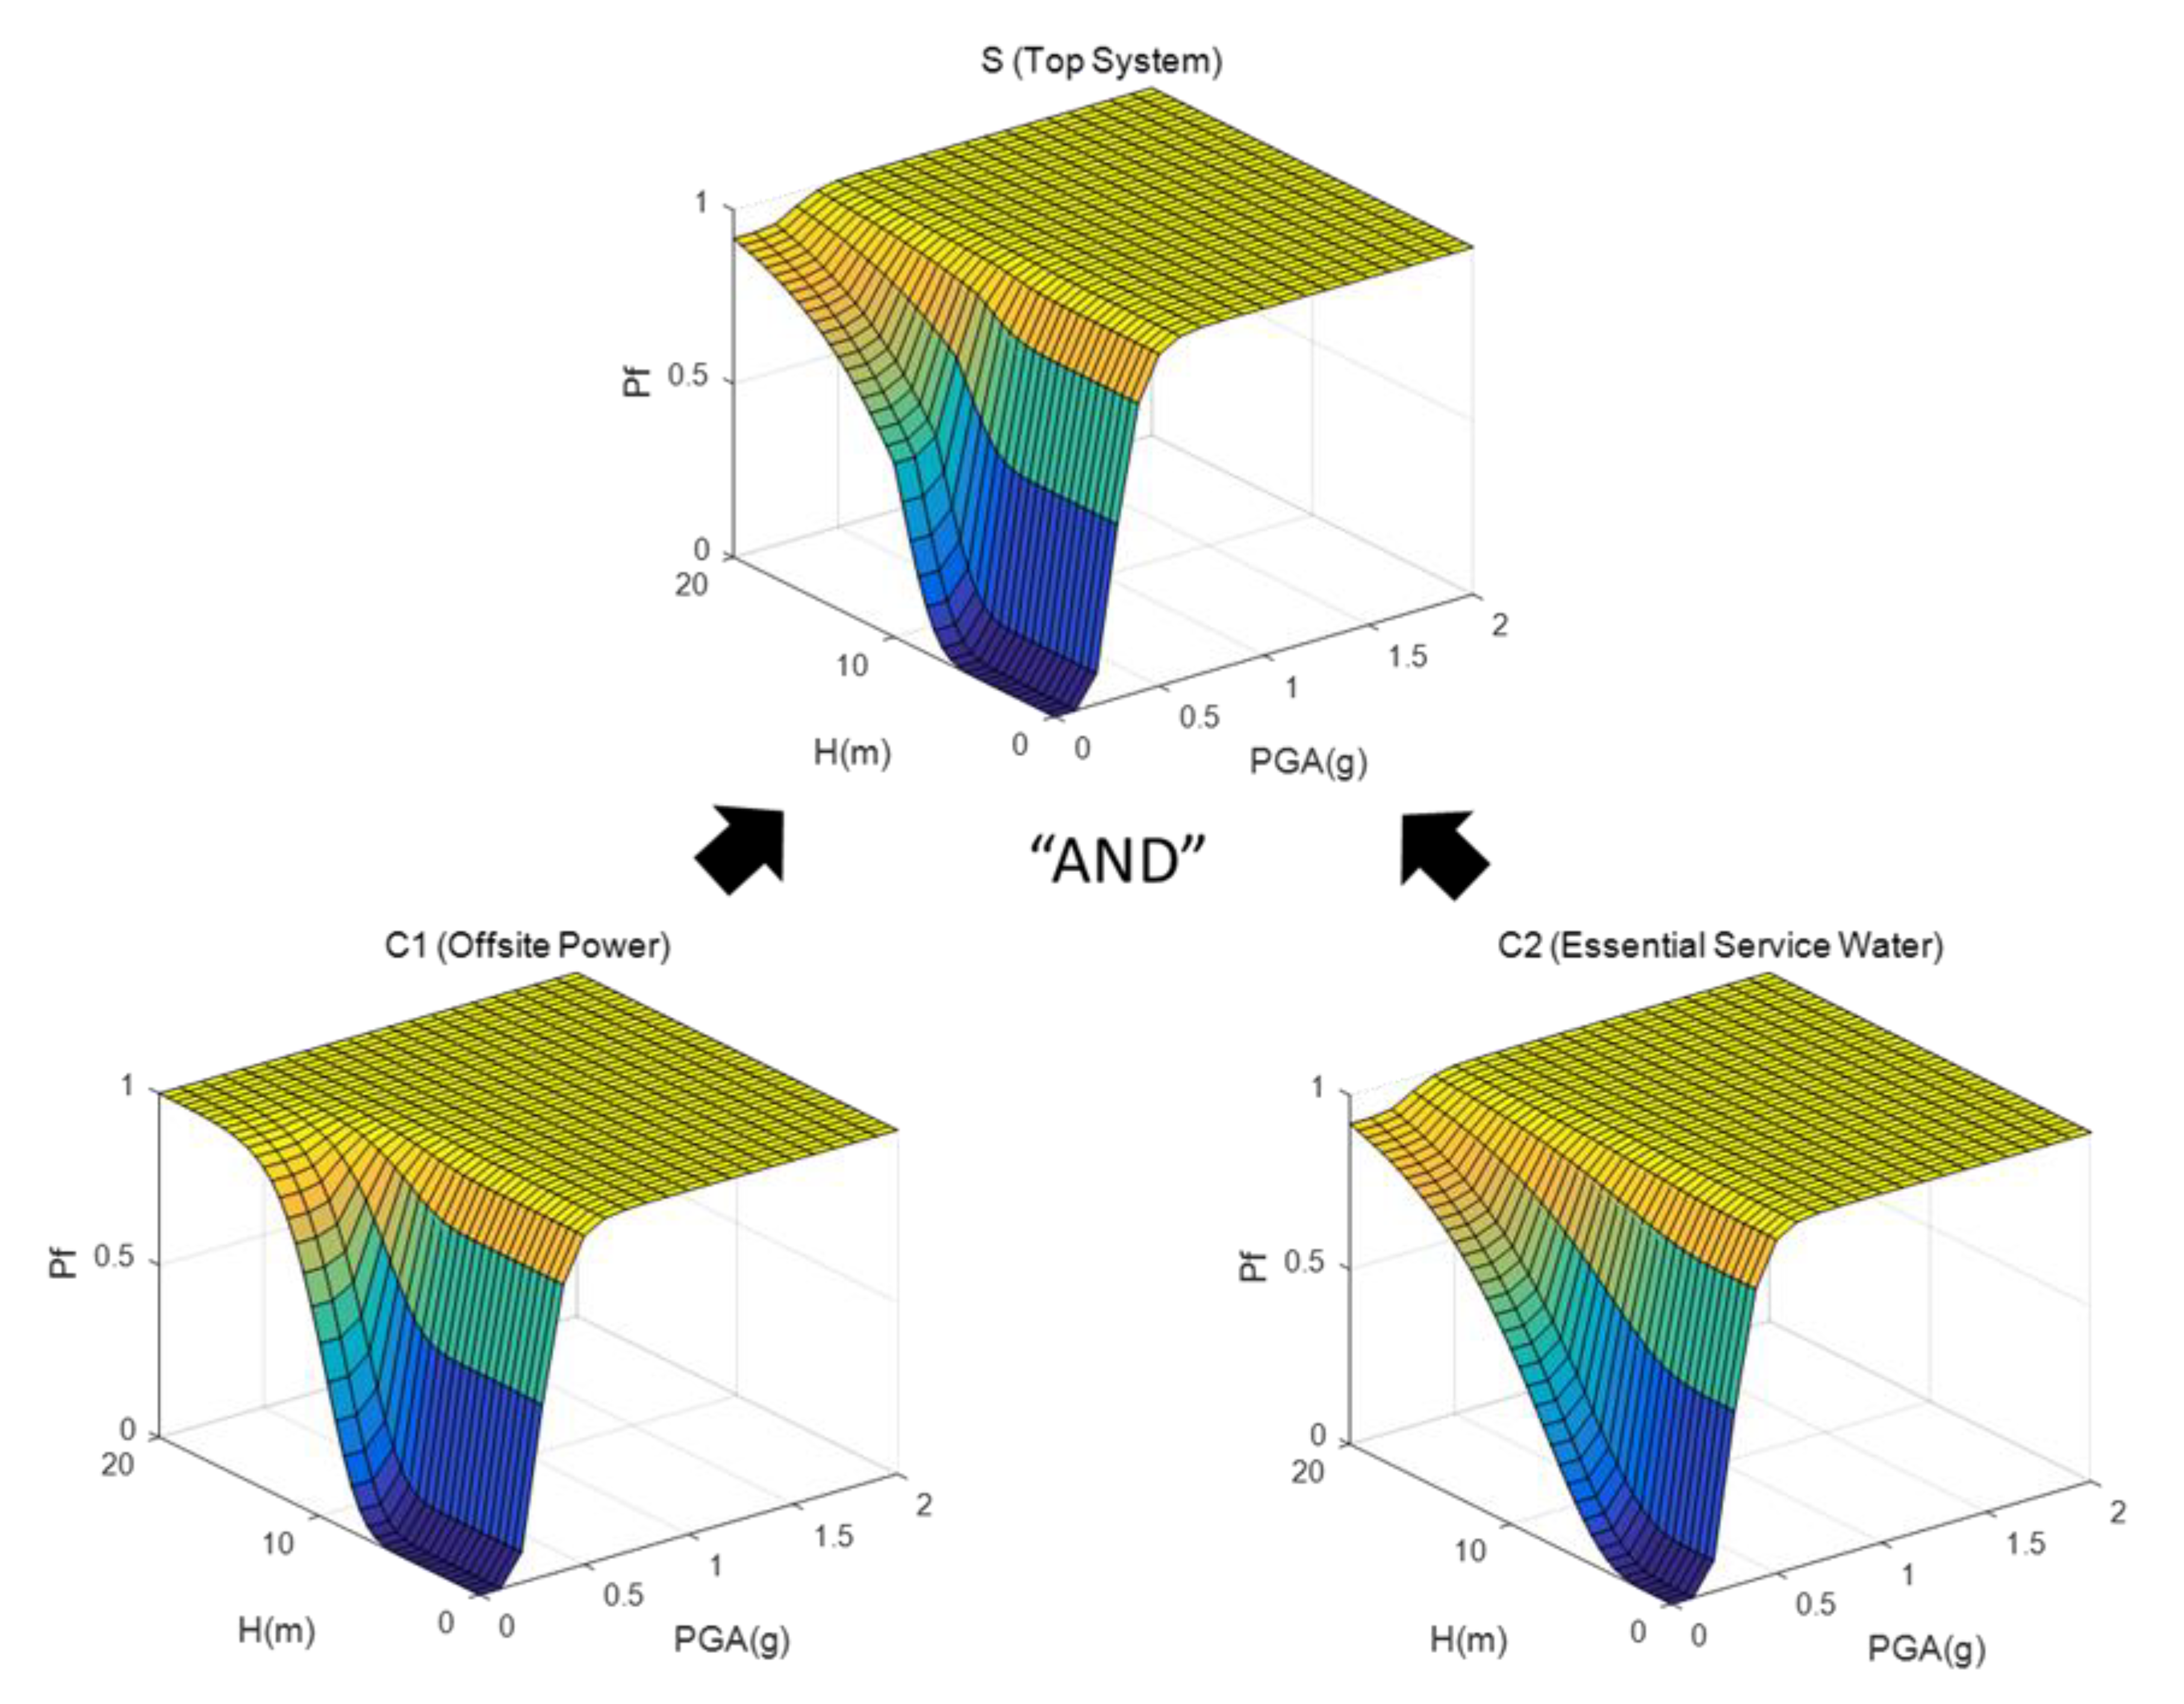
In order to verify the proposed multi-hazard PSA method, with respect to the P(C1 ∩ C2) example for a multi-hazard of an earthquake and a tsunami, the multi-hazard system fragility surfaces were obtained in the case of (1) an independent condition, (2) a fully dependent condition (ρs = ρt = 1), and (3) a partially dependent condition (ρs = ρt = 0.7), which this condition is only defined within each external hazard event. Such example denotes a parallel system. This parallel system does not function only when both components have failed. This characteristic for the parallel system is frequently utilized in the nuclear facility in order to secure a redundancy for the system’s safety feature. The surfaces are calculated using three different methods: (a) The probability distribution-based Boolean algebraic approach (“Boolean”), (b) extended DQFM method (“E-DQFM”), and (c) the improved DQFM method (“proposed” or “I-DQFM”), and their results are compared with each other. Table 1 shows the fragility information of components for the earthquake and tsunami external hazard event set up for this study. The failure modes between the external hazard events within the component were assumed to be independent of each other, and the component was assumed to be destroyed, even if only one failure mode occurred in either external hazard event. It should be noted here that P(C1) or P(C2), i.e., the fragility of a single component, is represented by a 1-D curve in a single external hazard event, but is expressed as a 2-D surface for the multi-hazards of the earthquake and tsunami considered.
For the Boolean algebraic approach, the system fragility value of P(C1 ∩ C2) was obtained by P(C1) × P(C2) for the independent condition and by min(P(C1),P(C2)) for the fully dependent condition, respectively. Note that in the case of the Boolean algebraic approach, an exact solution can be obtained only if it is independent or fully dependent. Thus, the accuracy of the solutions from the sampling-based methods is verified by comparing it with that of the Boolean algebraic approach for independent and fully dependent conditions. However, since the Boolean algebraic approach cannot provide accurate solutions for the partial dependency condition, the results between the sampling-based methods are only compared with each other and the appropriateness of the results are evaluated through such a comparison. In the analyses of all methods, the earthquake hazard intensity was based on a peak ground acceleration (PGA) and divided into 21 pieces from 0 g to 2 g at intervals of 0.1 g. The tsunami hazard intensity was based on the water height and divided into a total of 41 at a 0.5 m interval from 0 m to 20 m.
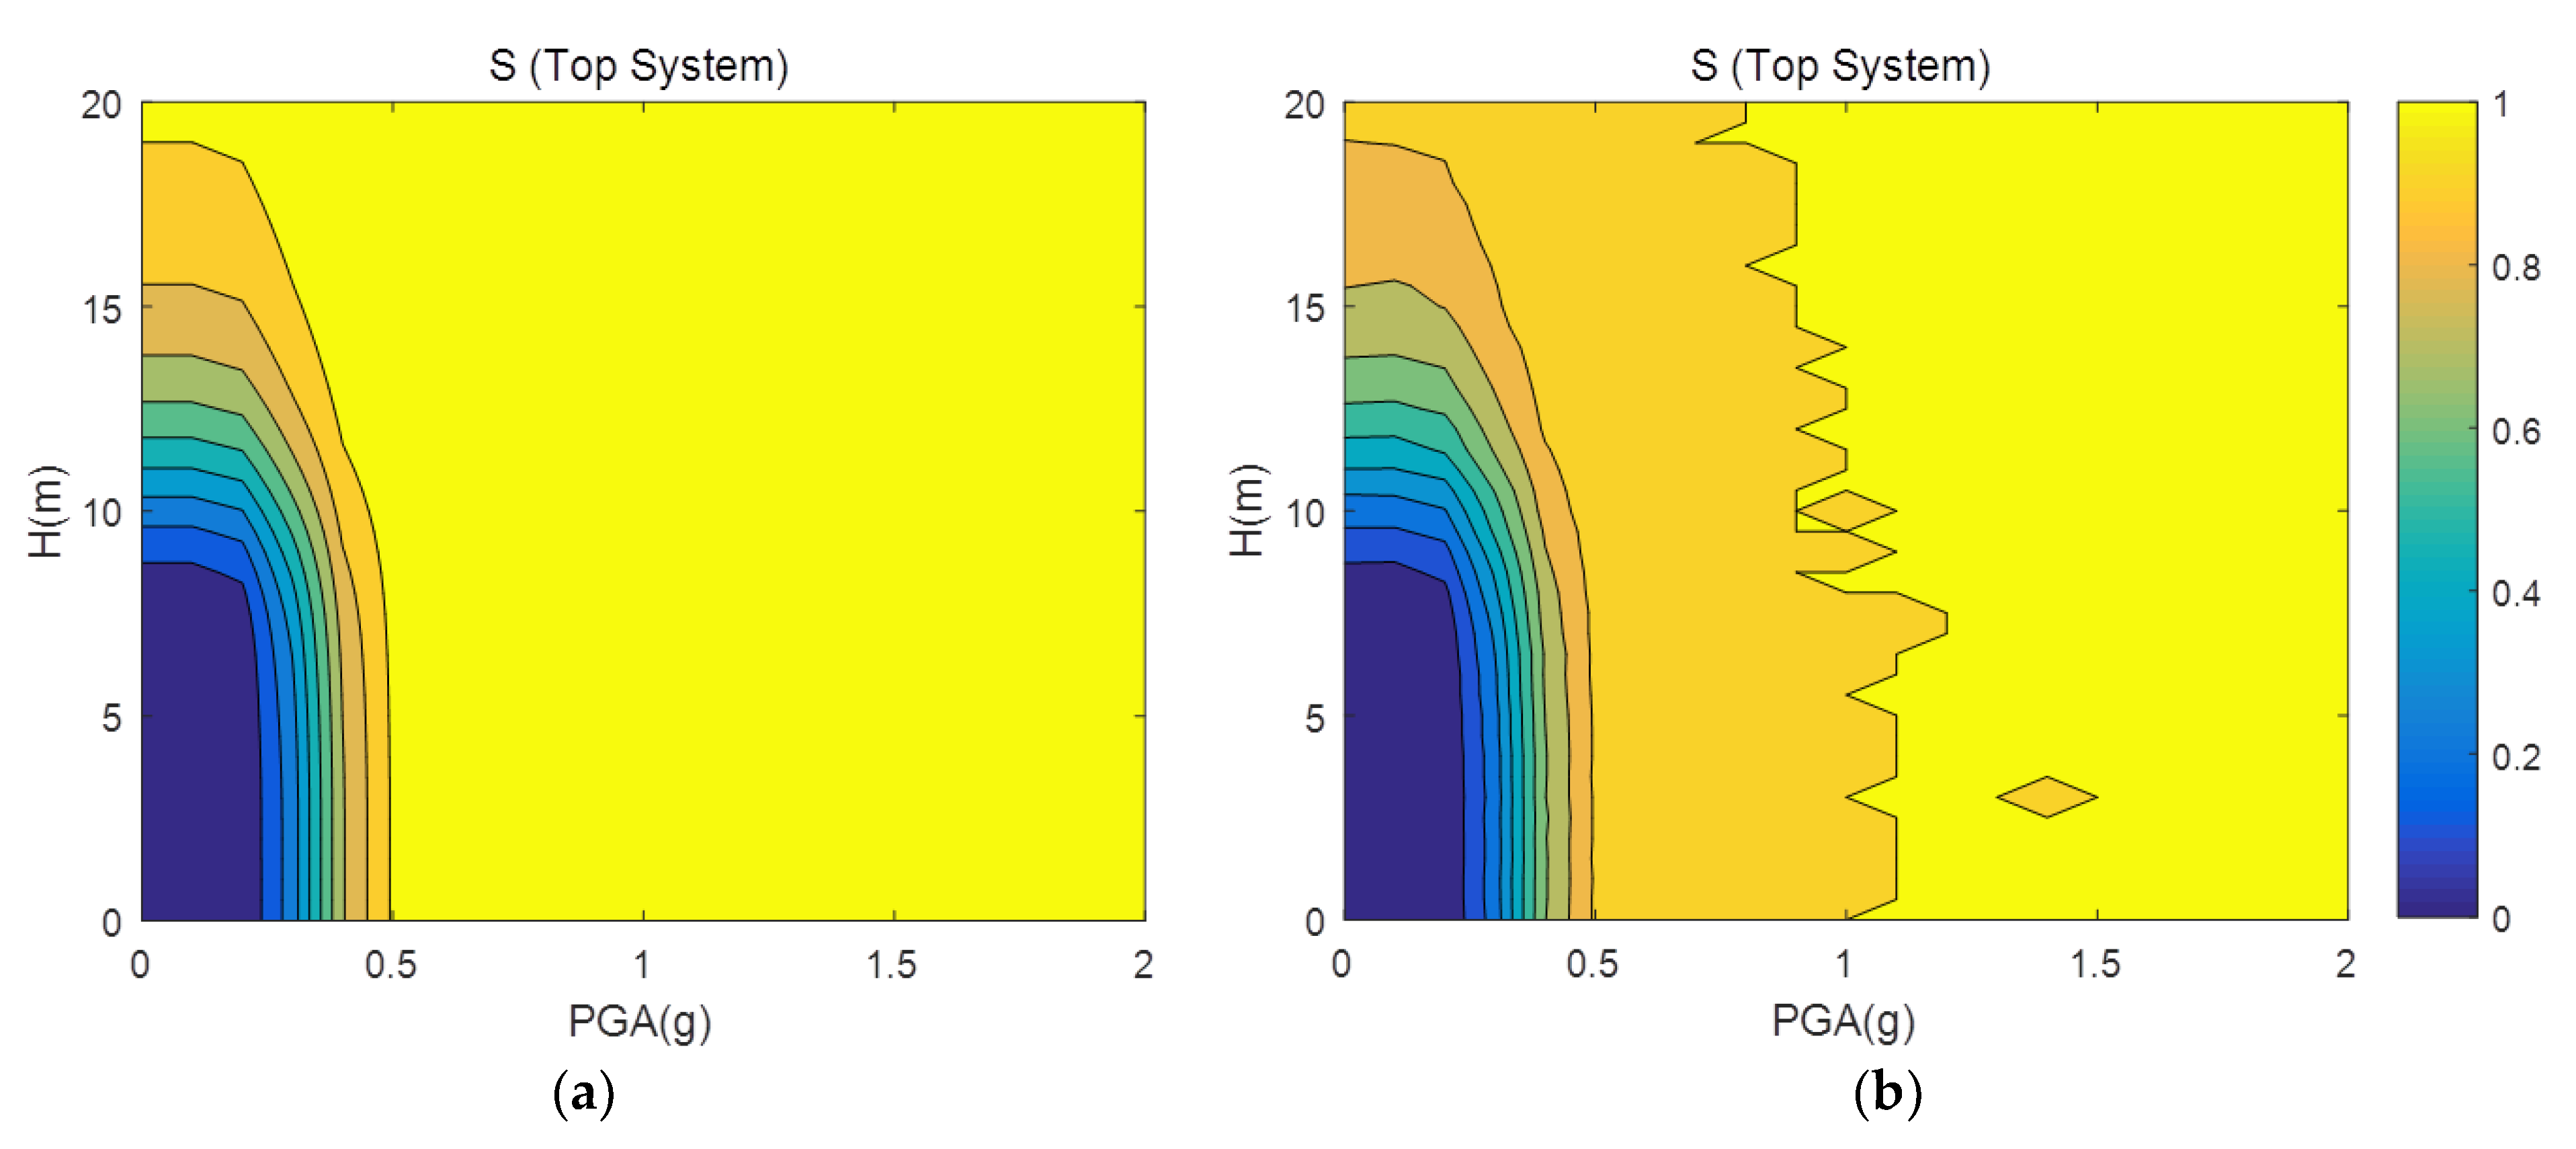
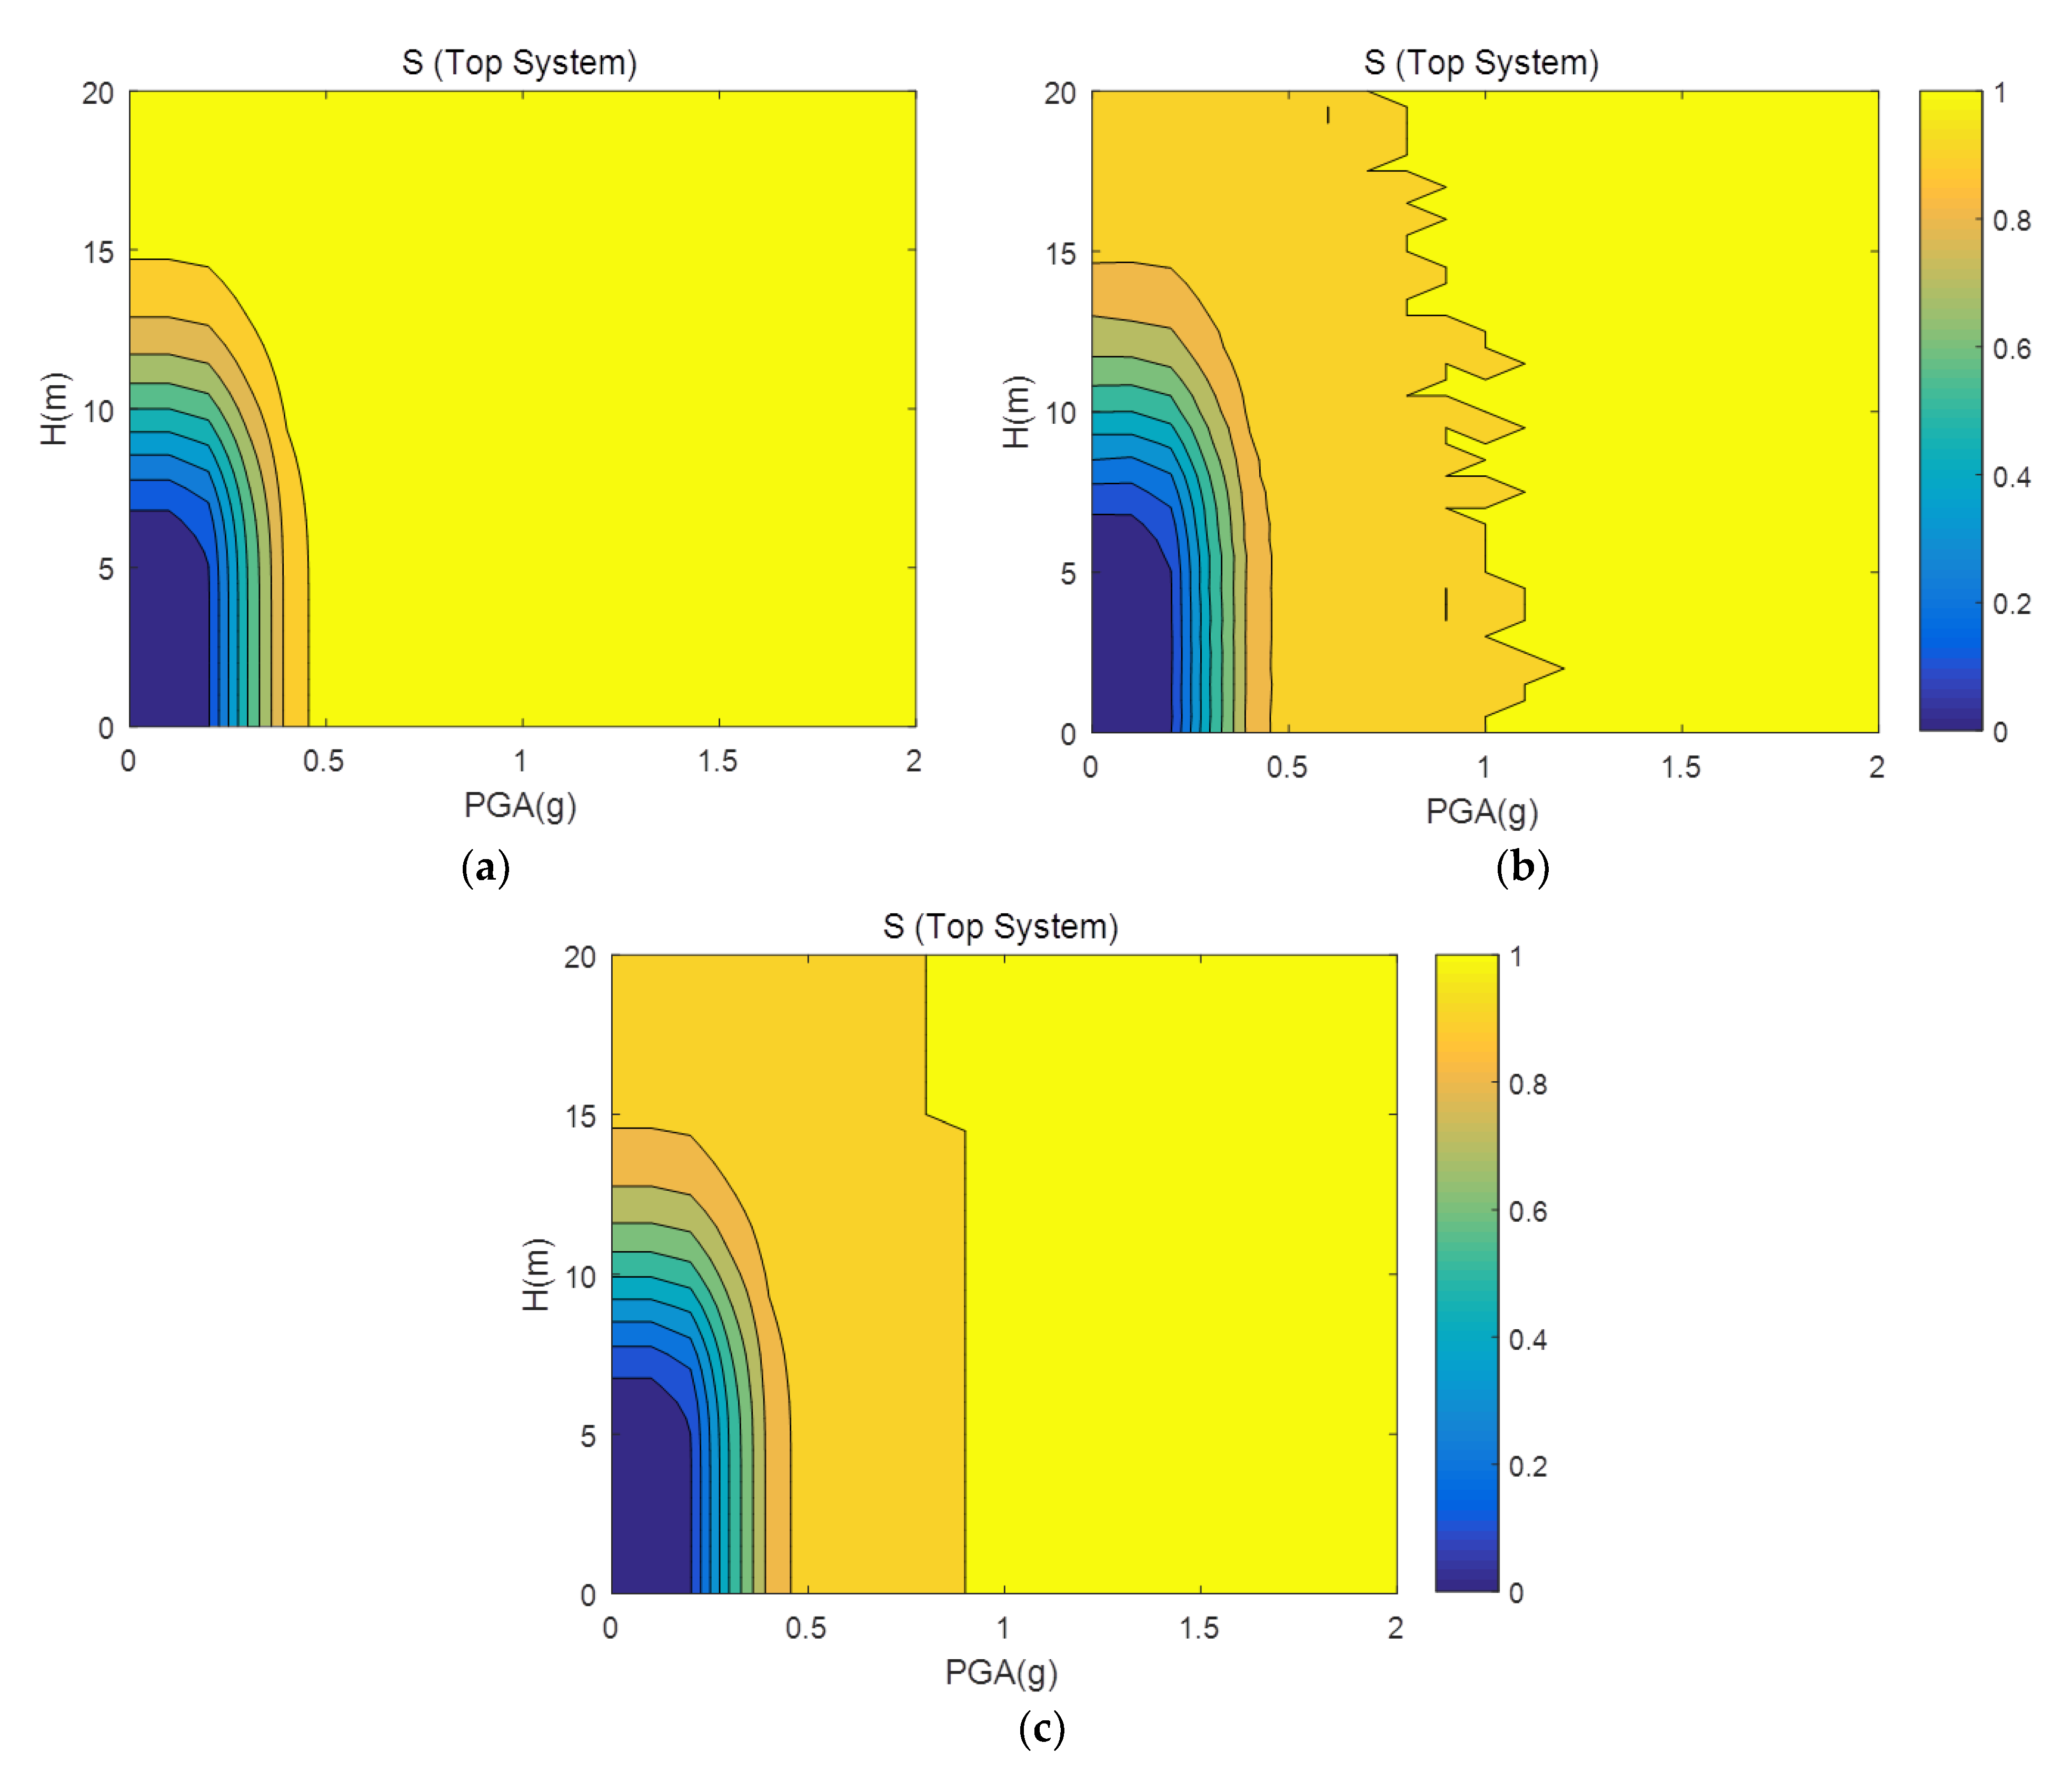
As a result, Figure 3 shows the graphical process of deriving the multi-hazard system fragility surface results using the Boolean algebraic approach with respect to independent conditions. Figure 4 and Figure 5 show the contour maps of the multi-hazard system fragility results through three different methods in the context of independent and fully dependent conditions, respectively. As can be seen in these two figures, the results of the E-DQFM method and the proposed method are almost identical to those of the Boolean algebraic approach. The quantitative comparison results were obtained through R2 and RMSE (Root Mean Squared Error). The results are summarized in Table 2. The R2 means the coefficient of determination and has a value between 0 and 1, and the higher the correlation between the predicted data and the exact data, the closer to 1. The RMSE is the square root of the sum of the squared difference between the predicted data and the exact data, and the closer the value is to zero, the higher the correlation is between the two data sets. In Table 2, it can be seen that the E-DQFM method and the proposed method have a similar degree of accuracy. However, since the E-DQFM method extracts N = 1 × 10⁴ samples per a combination of multi-hazard intensities (PGA: 21 × H: 41) for a multi-hazard system fragility surface calculation, the 1 × 104 × 2 (R and C) × 2 (seismic and tsunami) × 21 (PGA) × 41 (H) samples were extracted.
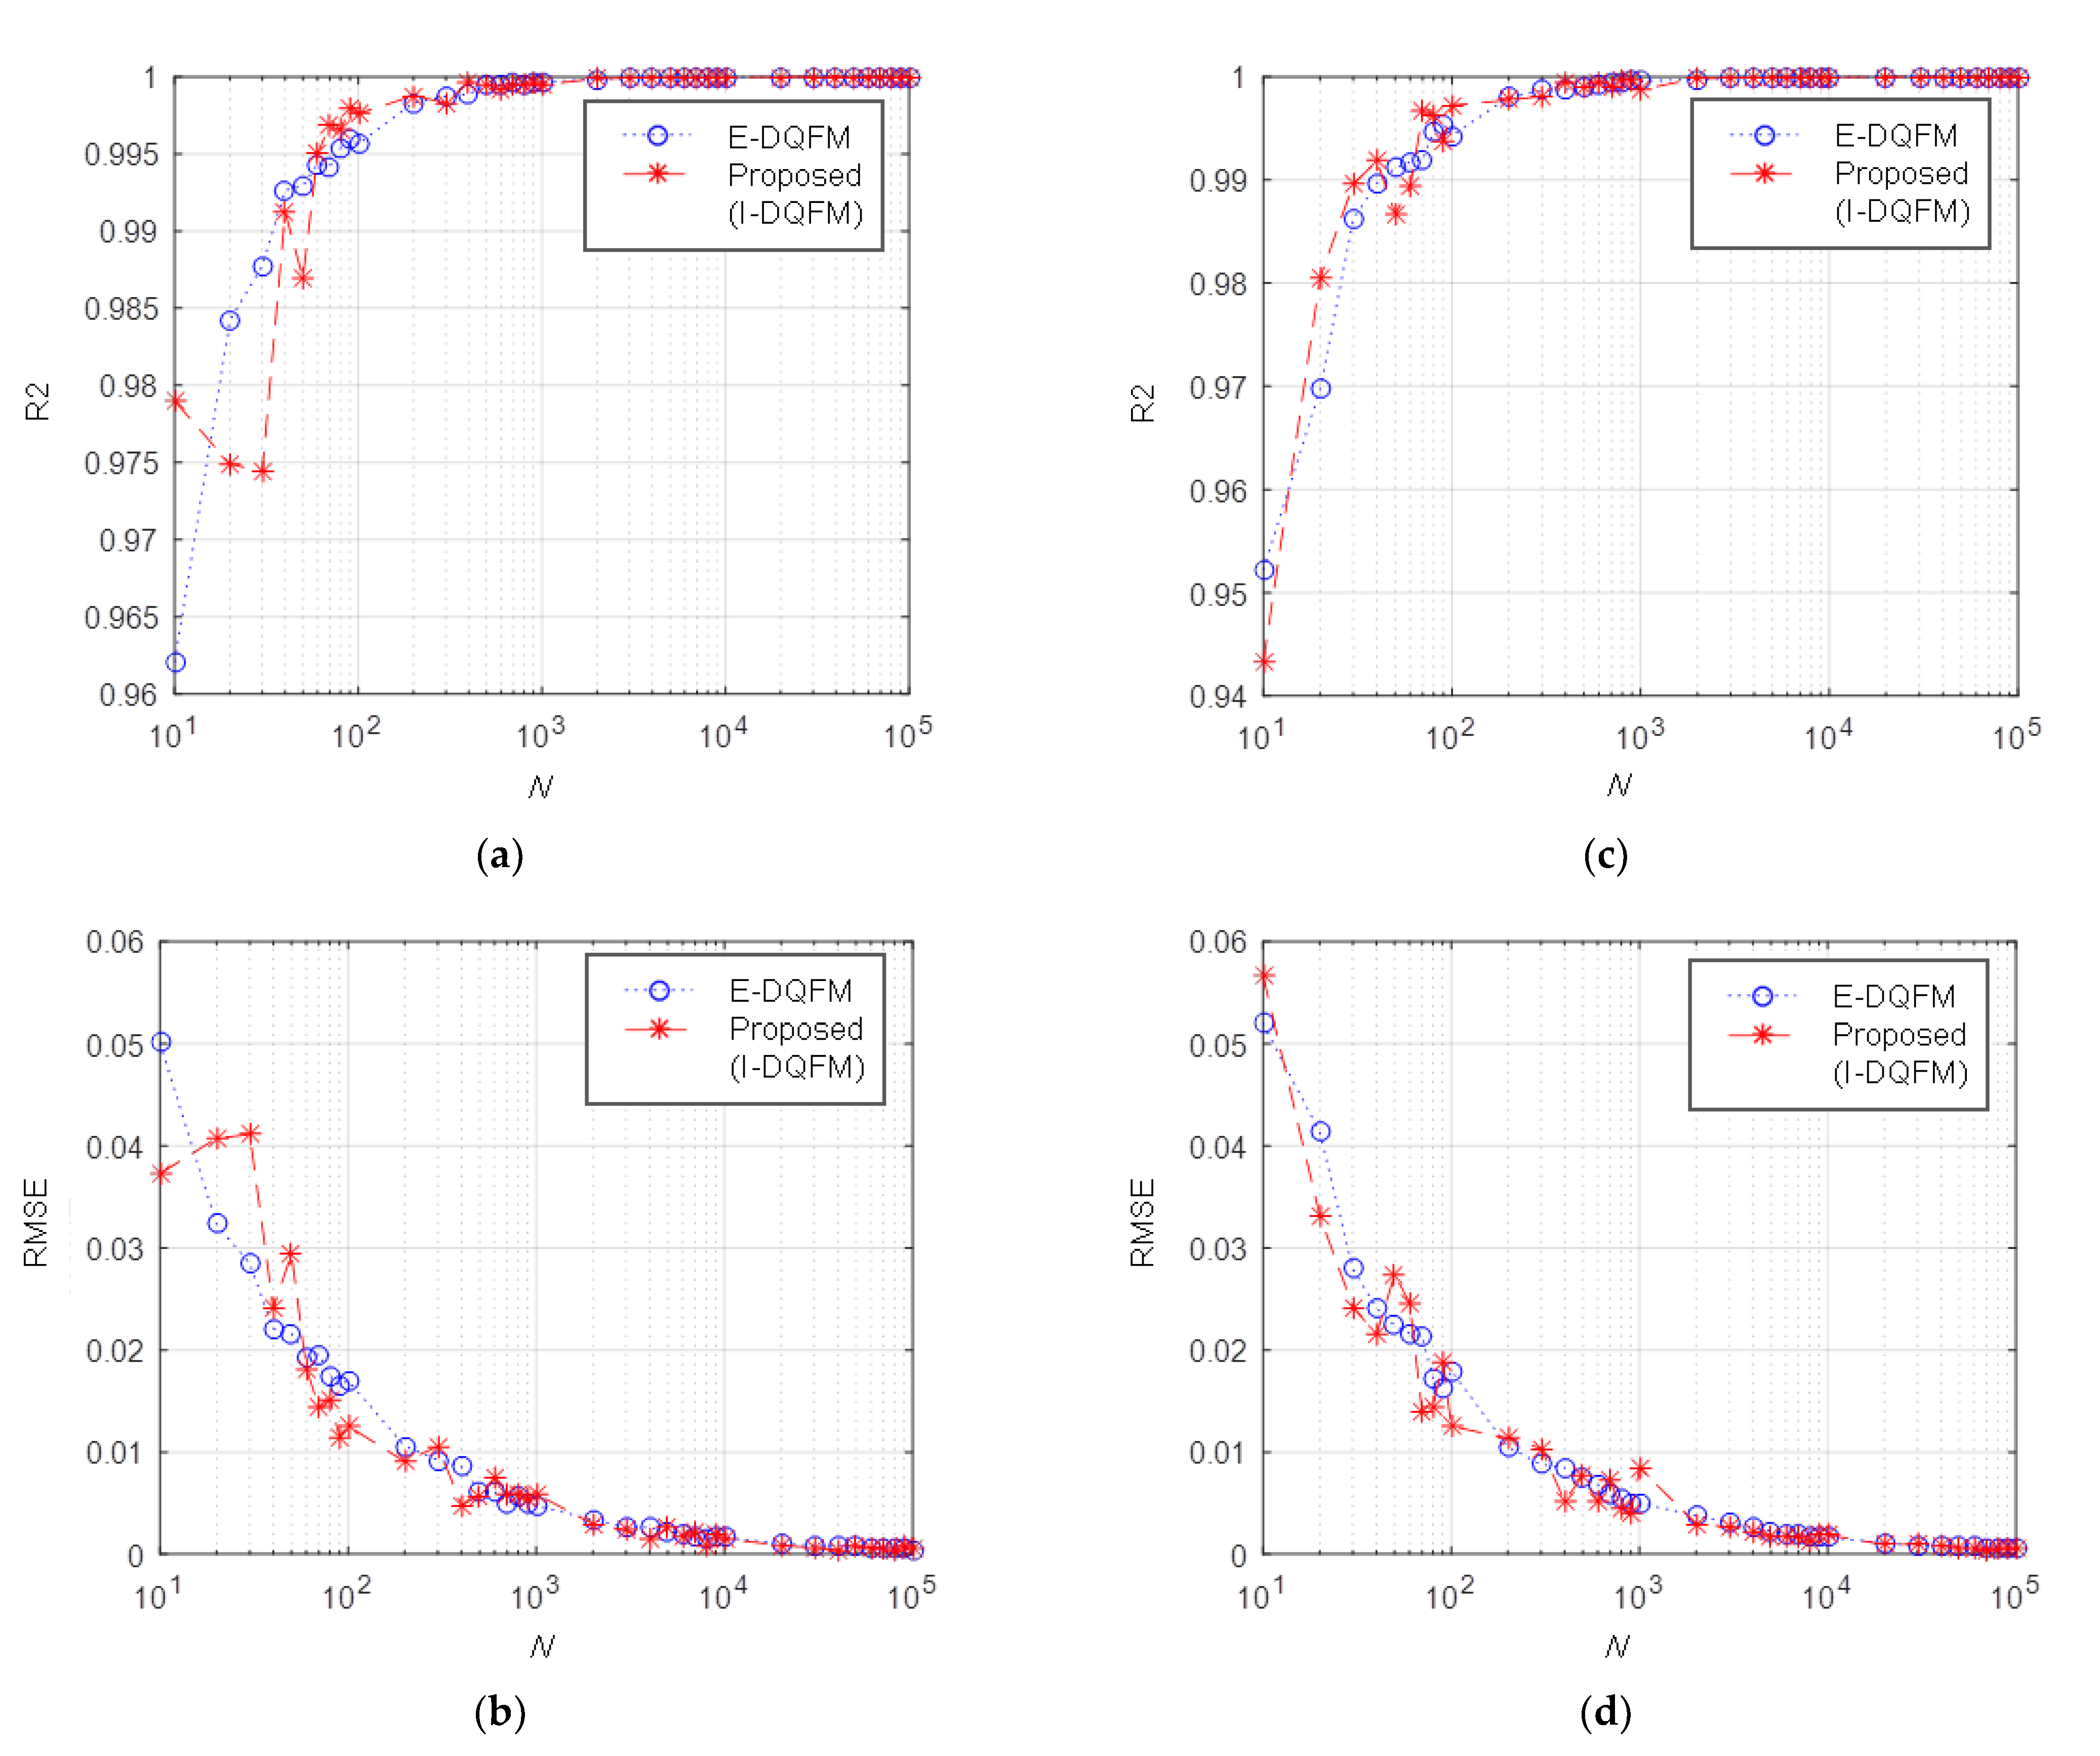
On the other hand, in the case of the proposed method, only the 1 × 104 × 2 (R and C) × 2 (seismic and tsunami) samples were used because the values of the N = 1 × 10⁴ samples of R and C extracted at the median hazard performance intensity level were scaled and re-used in other combinations of external hazard intensities. It can be seen that the proposed algorithm developed in this study secured the efficiency of the calculation process by extracting fewer samples while achieving a similar level of accuracy than using the existing DQFM algorithm. Since it is impossible to obtain the exact solution using the Boolean algebraic approach in the case of the partial dependency condition, the multi-hazard system fragility results obtained from the E-DQFM and the proposed method (I-DQFM) were compared with each other and shown in Figure 6. The reason why we compared these two results is to confirm the appropriateness of the obtained results by a reciprocal comparison in the situation where an exact solution does not exist. It is observed that the results of both methods are similar to each other. Thus, both methods confirm the accuracy of the results against each other. In addition, we examined the degree of convergence of solutions from the E-DQFM method and the proposed method according to the number of “N” samples. Figure 7 concretely shows the convergence results of solutions from the E-DQFM method and the proposed method according to the number of “N” samples. As can be seen in Figure 7, if the number of samples of both methods is more than approximately N = 1 × 10⁴ samples under the two conditions of independent and fully dependent, the results from both methods converge to almost the exact solution. Additionally, it can be seen that there is almost no difference in the accuracy of the solution according to the number of “N” samples from the E-DQFM method and the proposed method. It is noteworthy that we confirm in all of the “N” sample domains that the proposed method using the same number of “N” samples, but fewer total sample extracts, is more efficient than the E-DQFM method, as described above.
3.2. Example 2: (C1 ∪ C2) ∩ C3
In this example, the validity of the proposed multi-hazard risk quantification methodology is verified with respect to the case where the union and intersection are combined. This example denotes a serial and parallel combination system as a more general example than the previous example, and the results of three different methods are compared and verified against each other. Also, for this example, the multi-hazard system fragility surfaces are obtained in the case of (1) an independent condition, (2) a fully dependent condition (ρs = ρt = 1), and (3) a partially dependent condition (ρs = ρt = 0.7), in which this condition is only defined within each external hazard event. The surfaces are calculated using three different methods: (a) The probability distribution-based Boolean algebraic approach (“Boolean”), (b) the extended DQFM method (“E-DQFM”), and (c) the improved DQFM method (“proposed” or “I-DQFM”), and their results are compared with each other. Here, the fragility information of the components and the relation between the failure modes of the external hazard events are set to be the same as those of example 1.
For the Boolean algebraic approach, the system fragility value of P((C1∪C2) ∩ C3) was calculated by using the expression of [1 − (1 − P (C1)) × (1 − P (C2))] × P(C3) for the independent condition and the min(max(P(C1),P(C2)),P(C3)) for the fully dependent condition, respectively. This Boolean approach can obtain precise solutions for the independent or the fully dependent conditions. However, in the case of the partial dependent condition, as mentioned above, since the Boolean algebraic approach could not be used, the multi-hazard system fragility for such condition was calculated through the sampling-based methods only. The intensity distribution for each external hazard was identical to that shown in Example 1.
As a result, the multi-hazard system fragility results acquired from the E-DQFM method and from the proposed method for the independent condition and the fully dependent condition were compared with the fragility results of the Boolean algebraic method, and such comparisons are represented in Figure 8 and Figure 9, respectively. The quantitative comparison results are summarized in Table 3 through the R2 and the RMSE. As can be seen from the Figures and Tables, even in this example of a more complex system than the previous example, the proposed method yields results similar to the E-DQFM method, but the number of extracted samples is lower, thus making it more efficient. In the case of the partially dependent condition, Figure 10 compares and shows the multi-hazard system fragility results of the E-DQFM method and the proposed method, and it can be seen that there is almost no difference in results. Figure 11 shows the convergence results of the solutions from the E-DQFM method and the proposed method according to the number of samplings “N” with respect to this example. As in the above example 1, there is almost no difference in the convergence pattern between the two methods. When N = 1 × 10⁴ or more, the results of both sampling methods are close to the exact solutions.
4. Results and Discussions: Application of Proposed Methodology to an Actual Nuclear Power Plant
4.1. Single-Hazard PSA Results and Validation
In this subsection, we first verify the accuracy of the proposed method and algorithm by applying the proposed multi-hazard risk quantification methodology to the actual seismic PSA problem of the Limerick Generating Station (LGS). A single seismic PSA assesses the final risk by convolving a 1-D seismic system fragility curve with a 1-D seismic hazard curve. The seismic system fragility curve is derived from information from the component fragility analysis and the related systems analysis based on this fragility information. The information about seismic hazard curves and component fragility curves related to the LGS nuclear power plant is well presented in Ellingwood [10] and Kim et al. [11]. The system analysis’ system model equation for getting a system fragility curve is shown below:
Here, represents the complement of Si, and A is defined as follows: TsEsUX, TsRb, TsRpv, TsEsCmC2, TsRbCm, and TsEbWm represent the six dominant sequences that lead to the core damage and are initiated by a seismic event. CM represents the reactor core damage accident event and can be expressed briefly, as shown in Equation (13), as the sum of the six accident scenarios in Equations (7)–(12):
As can be seen from the above system model equation, the reactor core damage accident occurs due to various combinations of intersections and unions between the component failure events. In addition, the component fragility information and the random failure probabilities are utilized as input data. With respect to this example, the Boolean algebraic approach can obtain exact solutions, as in examples 1 and 2, for the independent condition or the fully dependent condition, but cannot calculate exact solutions for the partially dependent condition. Therefore, in order to verify the proposed method, which is the purpose of this example, we only looked at two cases. The first case considered independent conditions between all the components. The other case was that the components in the reactor building (i.e., S11, S12, S13 and S14) were set to be fully dependent, the components in the DG building (i.e., S15 and S16) were considered to be fully dependent, and all of the other components were assumed to be independent. In this example, the seismic hazard intensity was set to be uniformly distributed from 0.05 g to 2.0 g at a 0.01 g interval based on PGA. Thus, the total number of the seismic hazard intensities considered was 196 each.
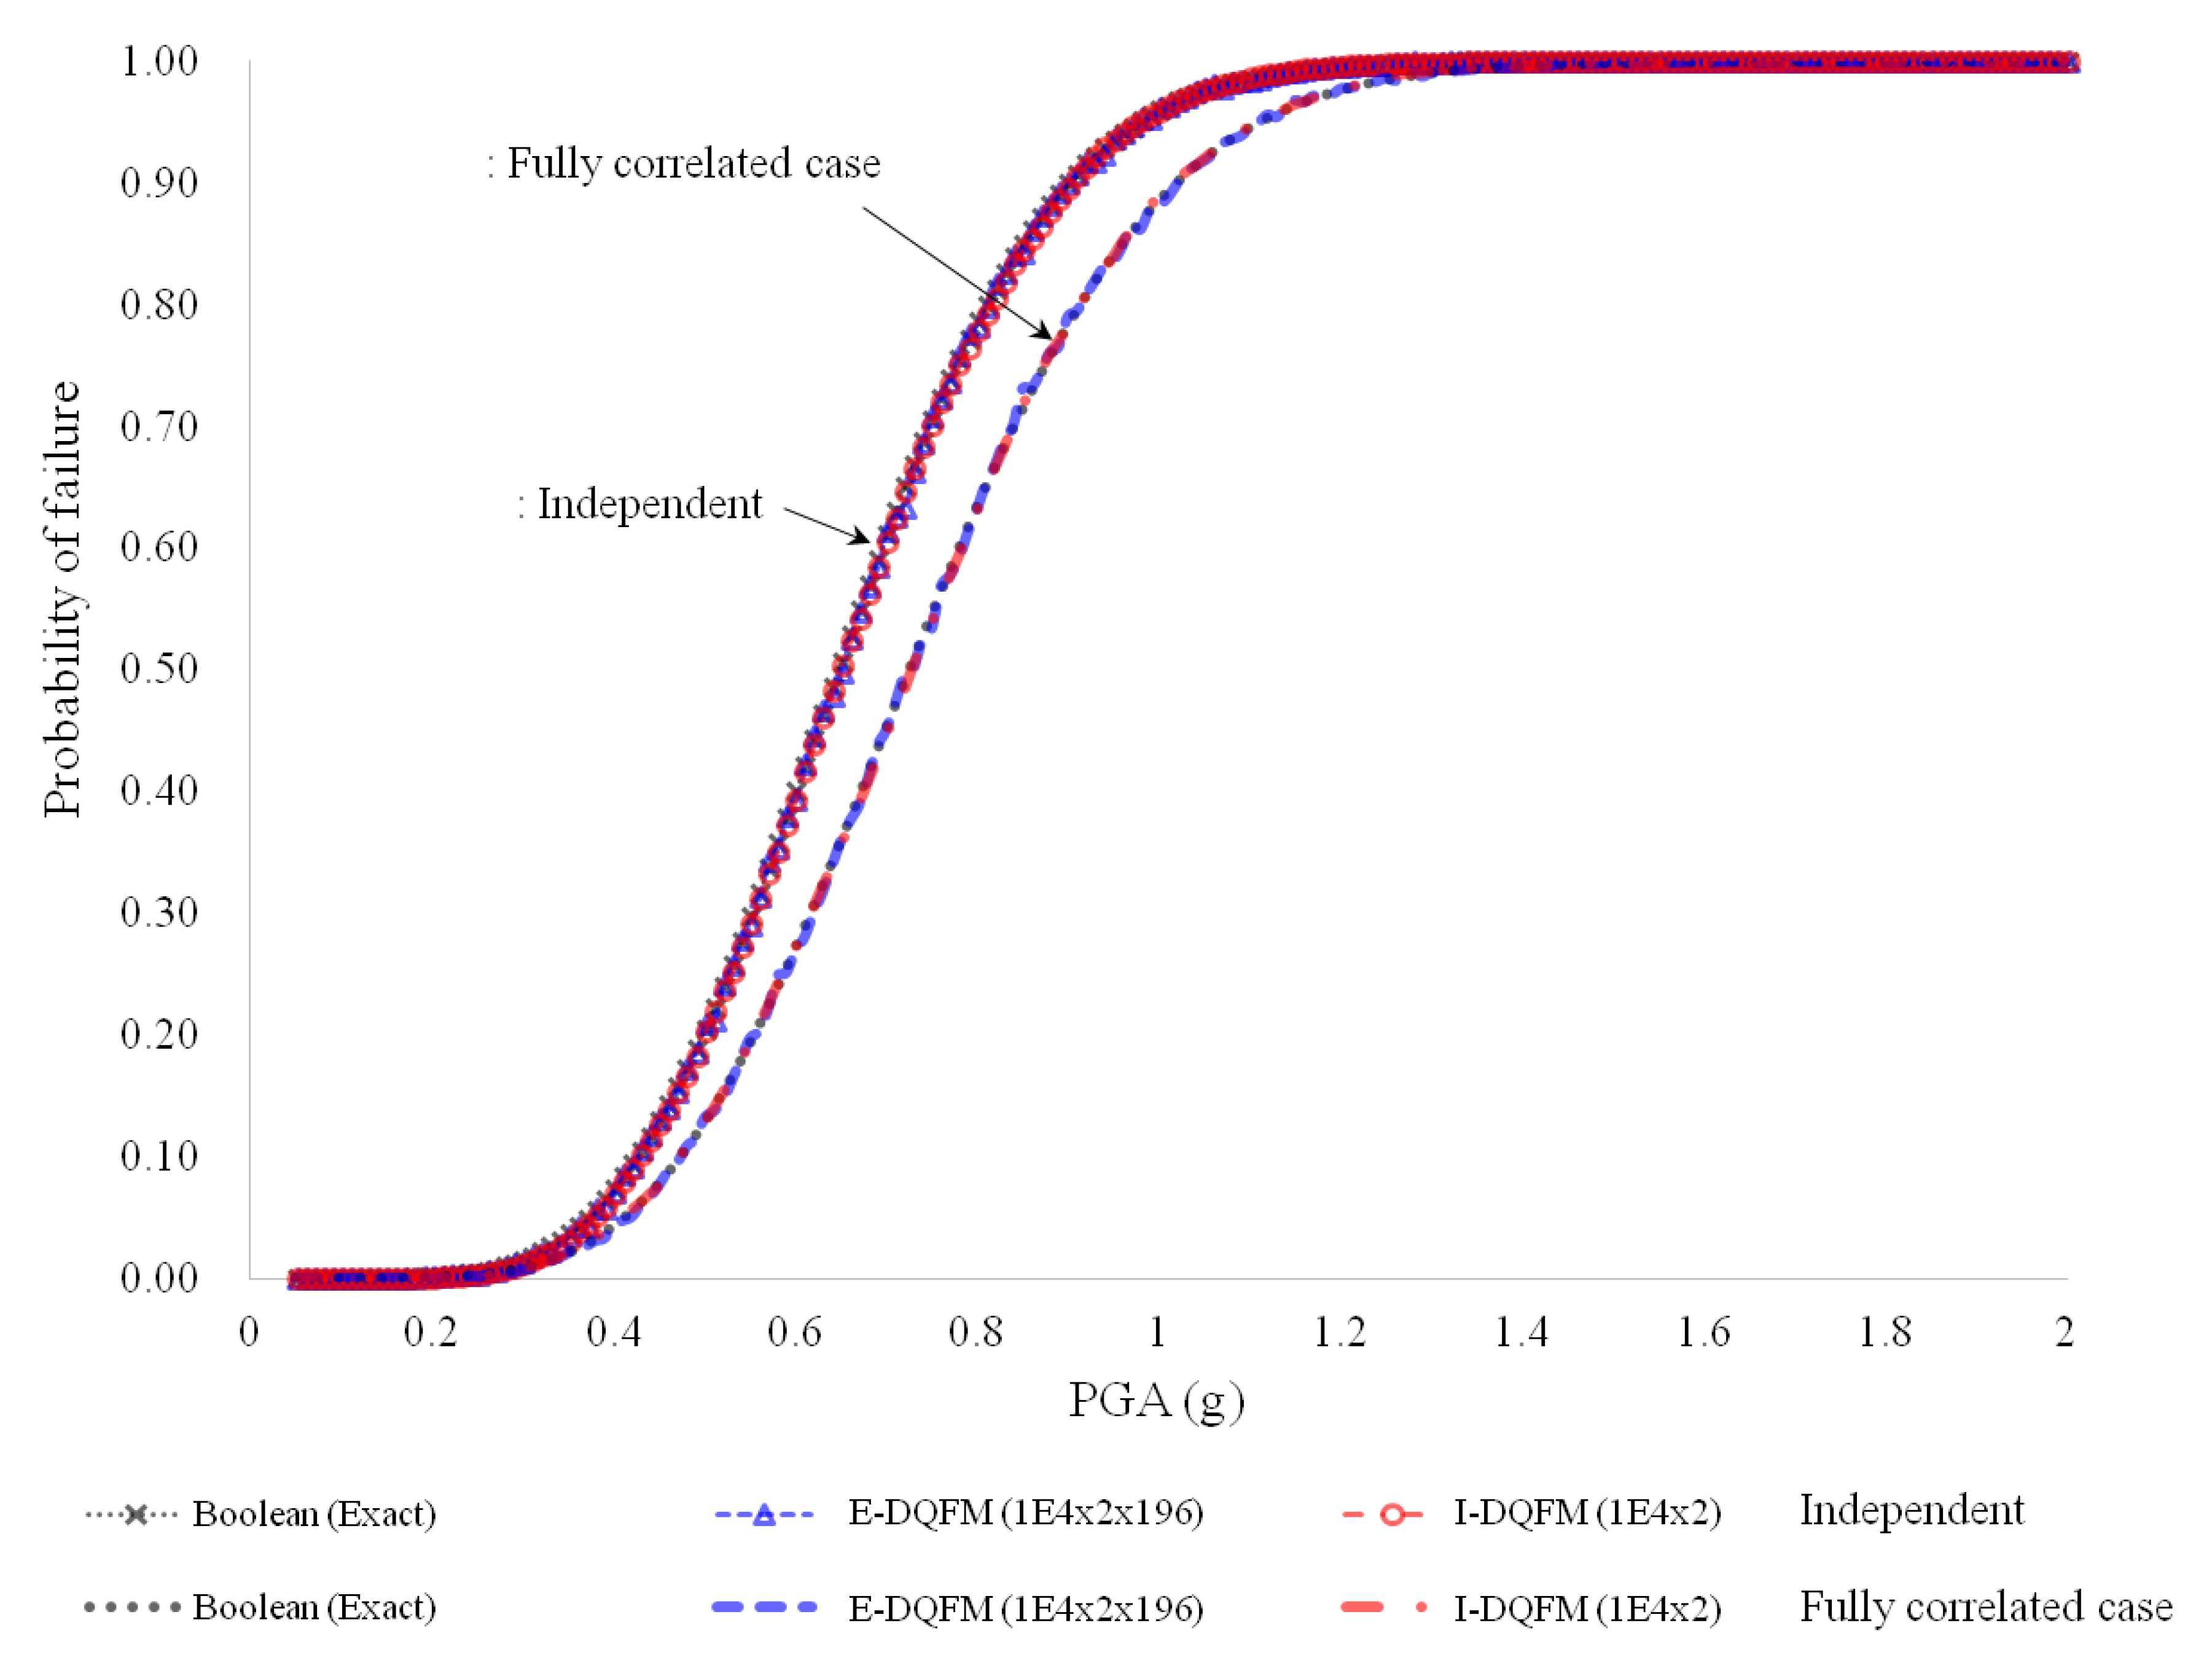
As a result, the fragility results of the proposed method with respect to the CM sequence in the case of the independent condition and fully dependent condition are shown in Figure 12. For comparison purposes, the fragility results of the E-DQFM method and of the Boolean algebraic method on the same conditions are also presented in this Figure. The quantitative comparison results are summarized in Table 4 and Table 5 for the high-confidence-low-probability-of-failure (HCLPF) and risk for all accident scenarios. In addition, Table 4 shows all of the single seismic PSA results performed in the independent condition of the same problem in other studies [10,11] for the verification objective. As illustrated in Figure 12 and Table 4 and Table 5, we can confirm that the proposed method yields a HCLPF and risk value that is almost identical to the exact solution, even for a single-hazard PSA problem. Also, when compared to the E-DQFM method (i.e., 1 × 104 × 2 (R and C) × 196 (PGA) samples), we can see that the proposed method produces almost identical results, even though it extracts a much smaller number of samples (i.e., 1 × 104 × 2 (R and C) samples).
4.2. Multi-Hazard PSA Results and Validation
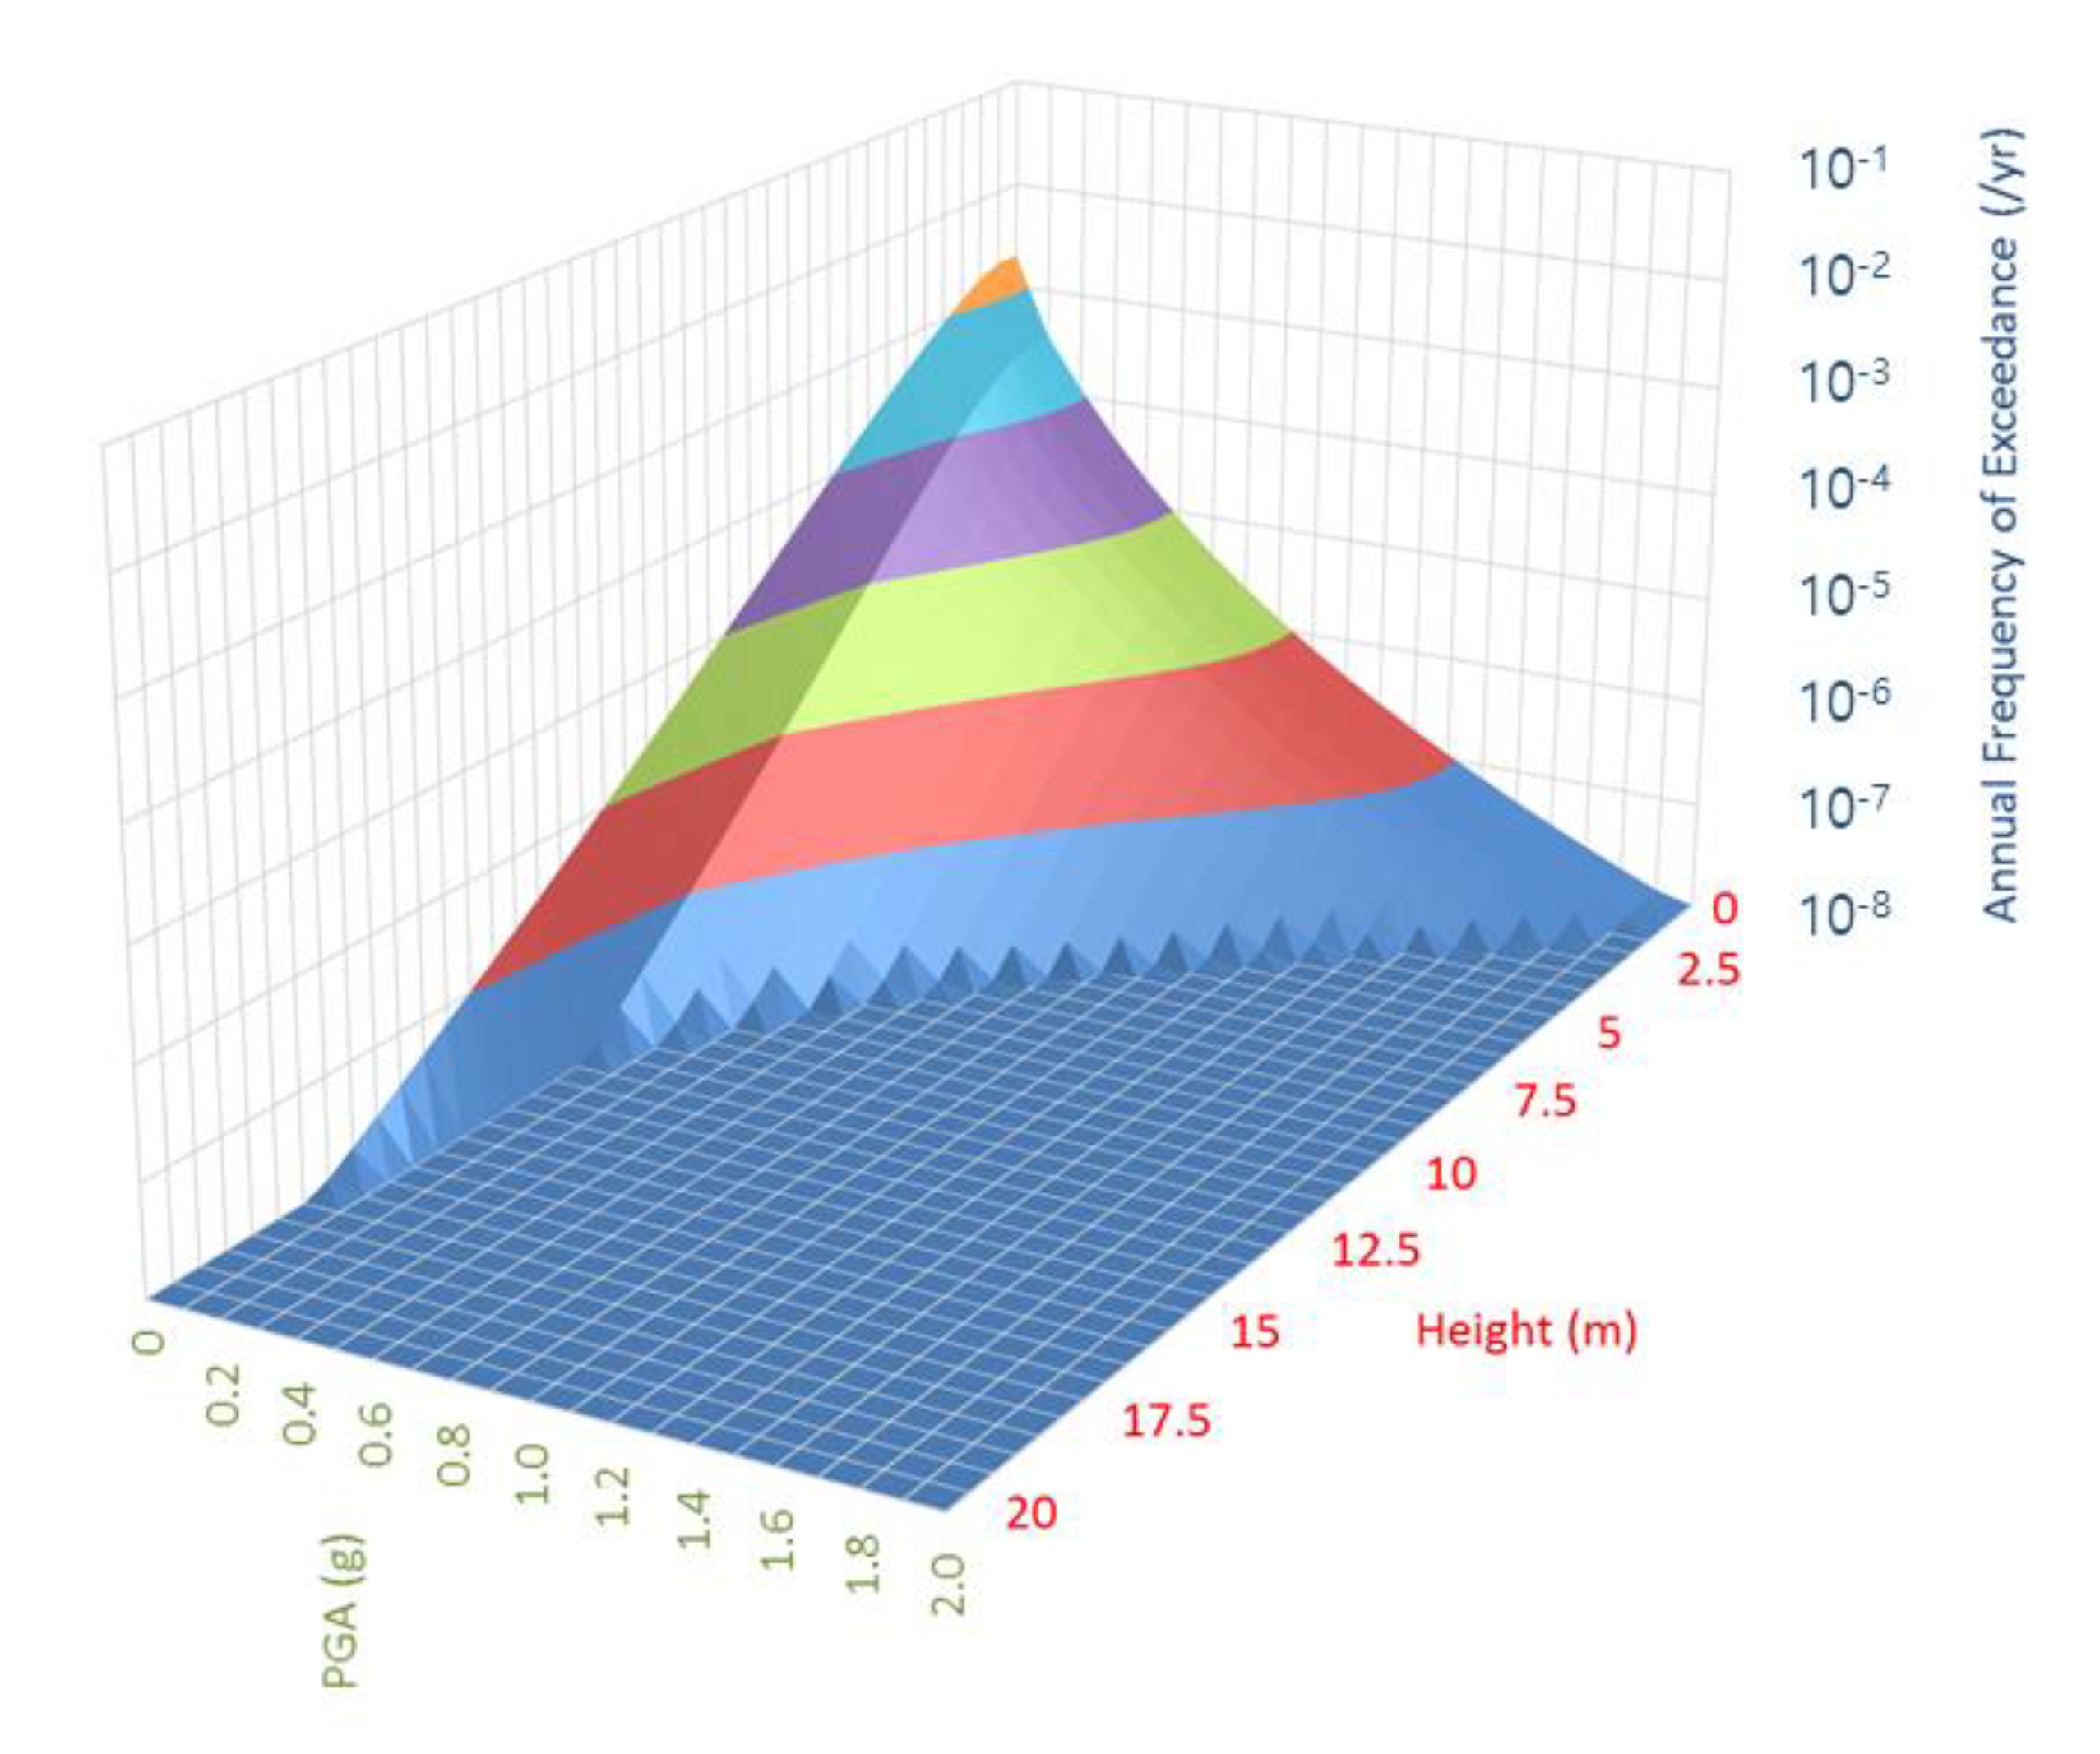
In this subsection, we describe the multi-hazard PSA problem of earthquakes and tsunamis based on the single seismic PSA example of the LGS NPP described in the previous subsection. This example aims for a high degree of verification of the multi-hazard risk quantification methodology proposed in this study, with respect to the general multi-hazard problems of the actual NPP. For this purpose, the component fragility information on the tsunami hazard was set up based on actual experience and expert input by considering the approximate location of components, resistance to water, etc., and Table 6 shows such data. In addition, for the multi-hazard hazard information, the seismic-tsunami multi-hazard surface shown in Figure 13 that was obtained from existing studies on the tsunami PSA [26] and on the earthquake-tsunami multi-hazards [27] was utilized in this study. It was observed that correlations exist between the earthquake and tsunami hazards, as shown in Figure 13. The impact of these hazard correlations in the risk calculations cannot be taken into account through the existing single-hazard EE-PSA approach, but can be assessed by considering such an effect if using the multi-hazard PSA methodology proposed in this study.
For this example, the previous single seismic PSA example of the LGS NPP was extended to the PSA problem of the earthquake-tsunami multi-hazard. Specifically, the multi-hazard system fragility surfaces were obtained in the case of (1) independent conditions between all components, (2) fully dependent conditions between components only within the reactor building and the DG building, respectively, and (3) partially dependent conditions between components only within the reactor building and the DG building (ρs = ρt = 0.7), respectively. These conditions were only defined within each external hazard event. The surfaces were calculated using three different methods: (a) The Probability distribution-based Boolean algebraic approach (“Boolean”), (b) the Extended DQFM method (“E-DQFM”), and (c) the improved DQFM method (“Proposed” or “I-DQFM”), and their results were compared with each other. Here, it is assumed that the relationship between the failure modes between the earthquake and tsunami hazards is independent of each other, as shown in examples 1 and 2.
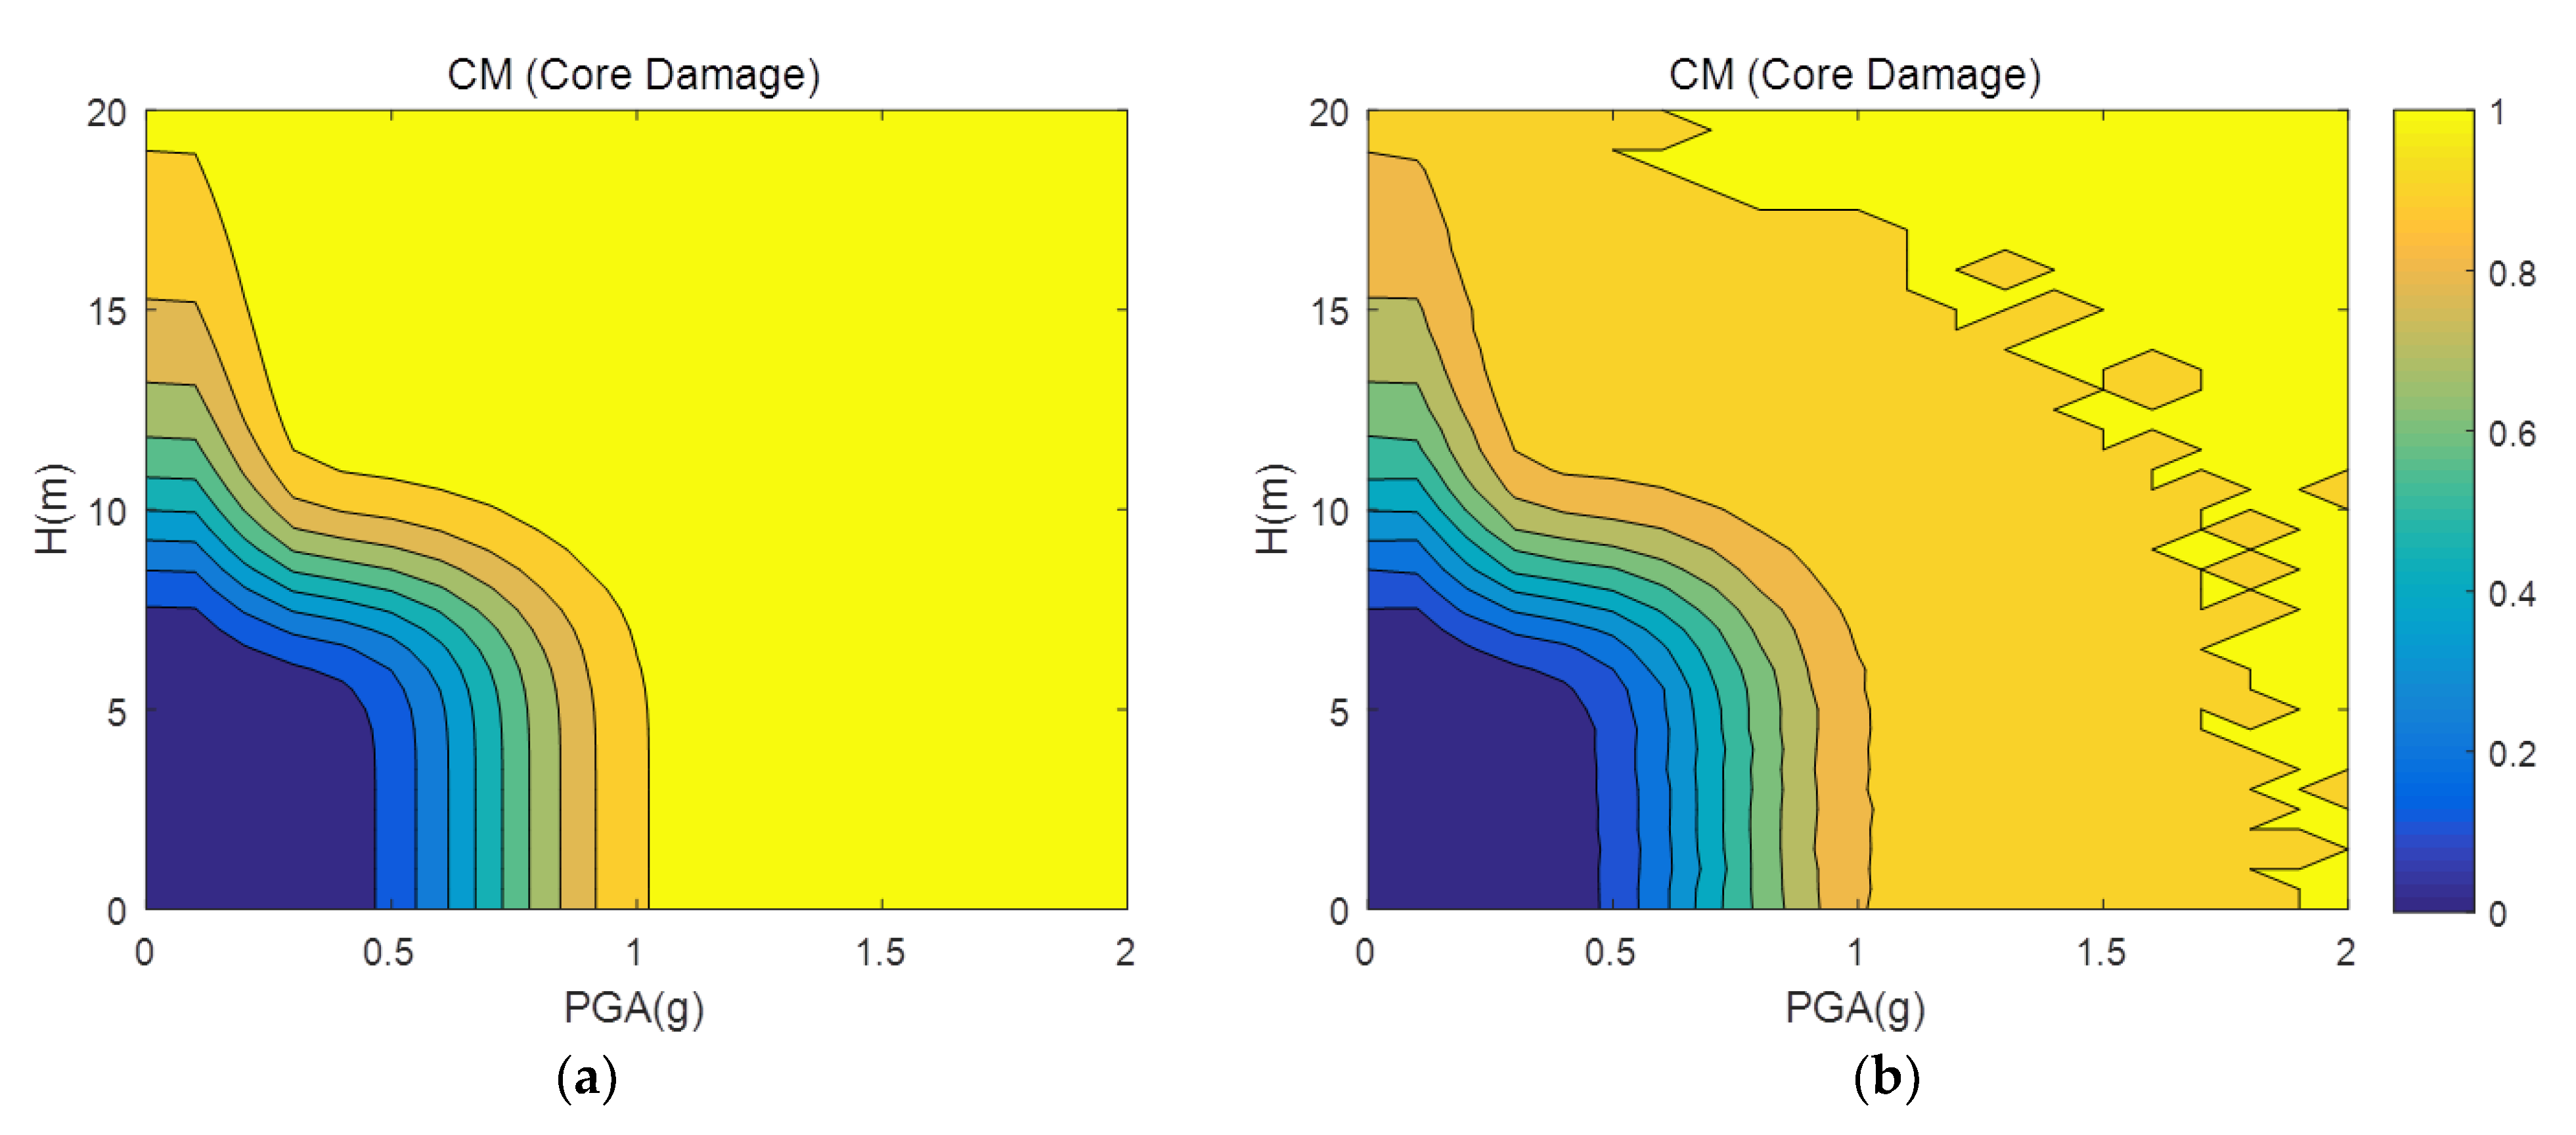
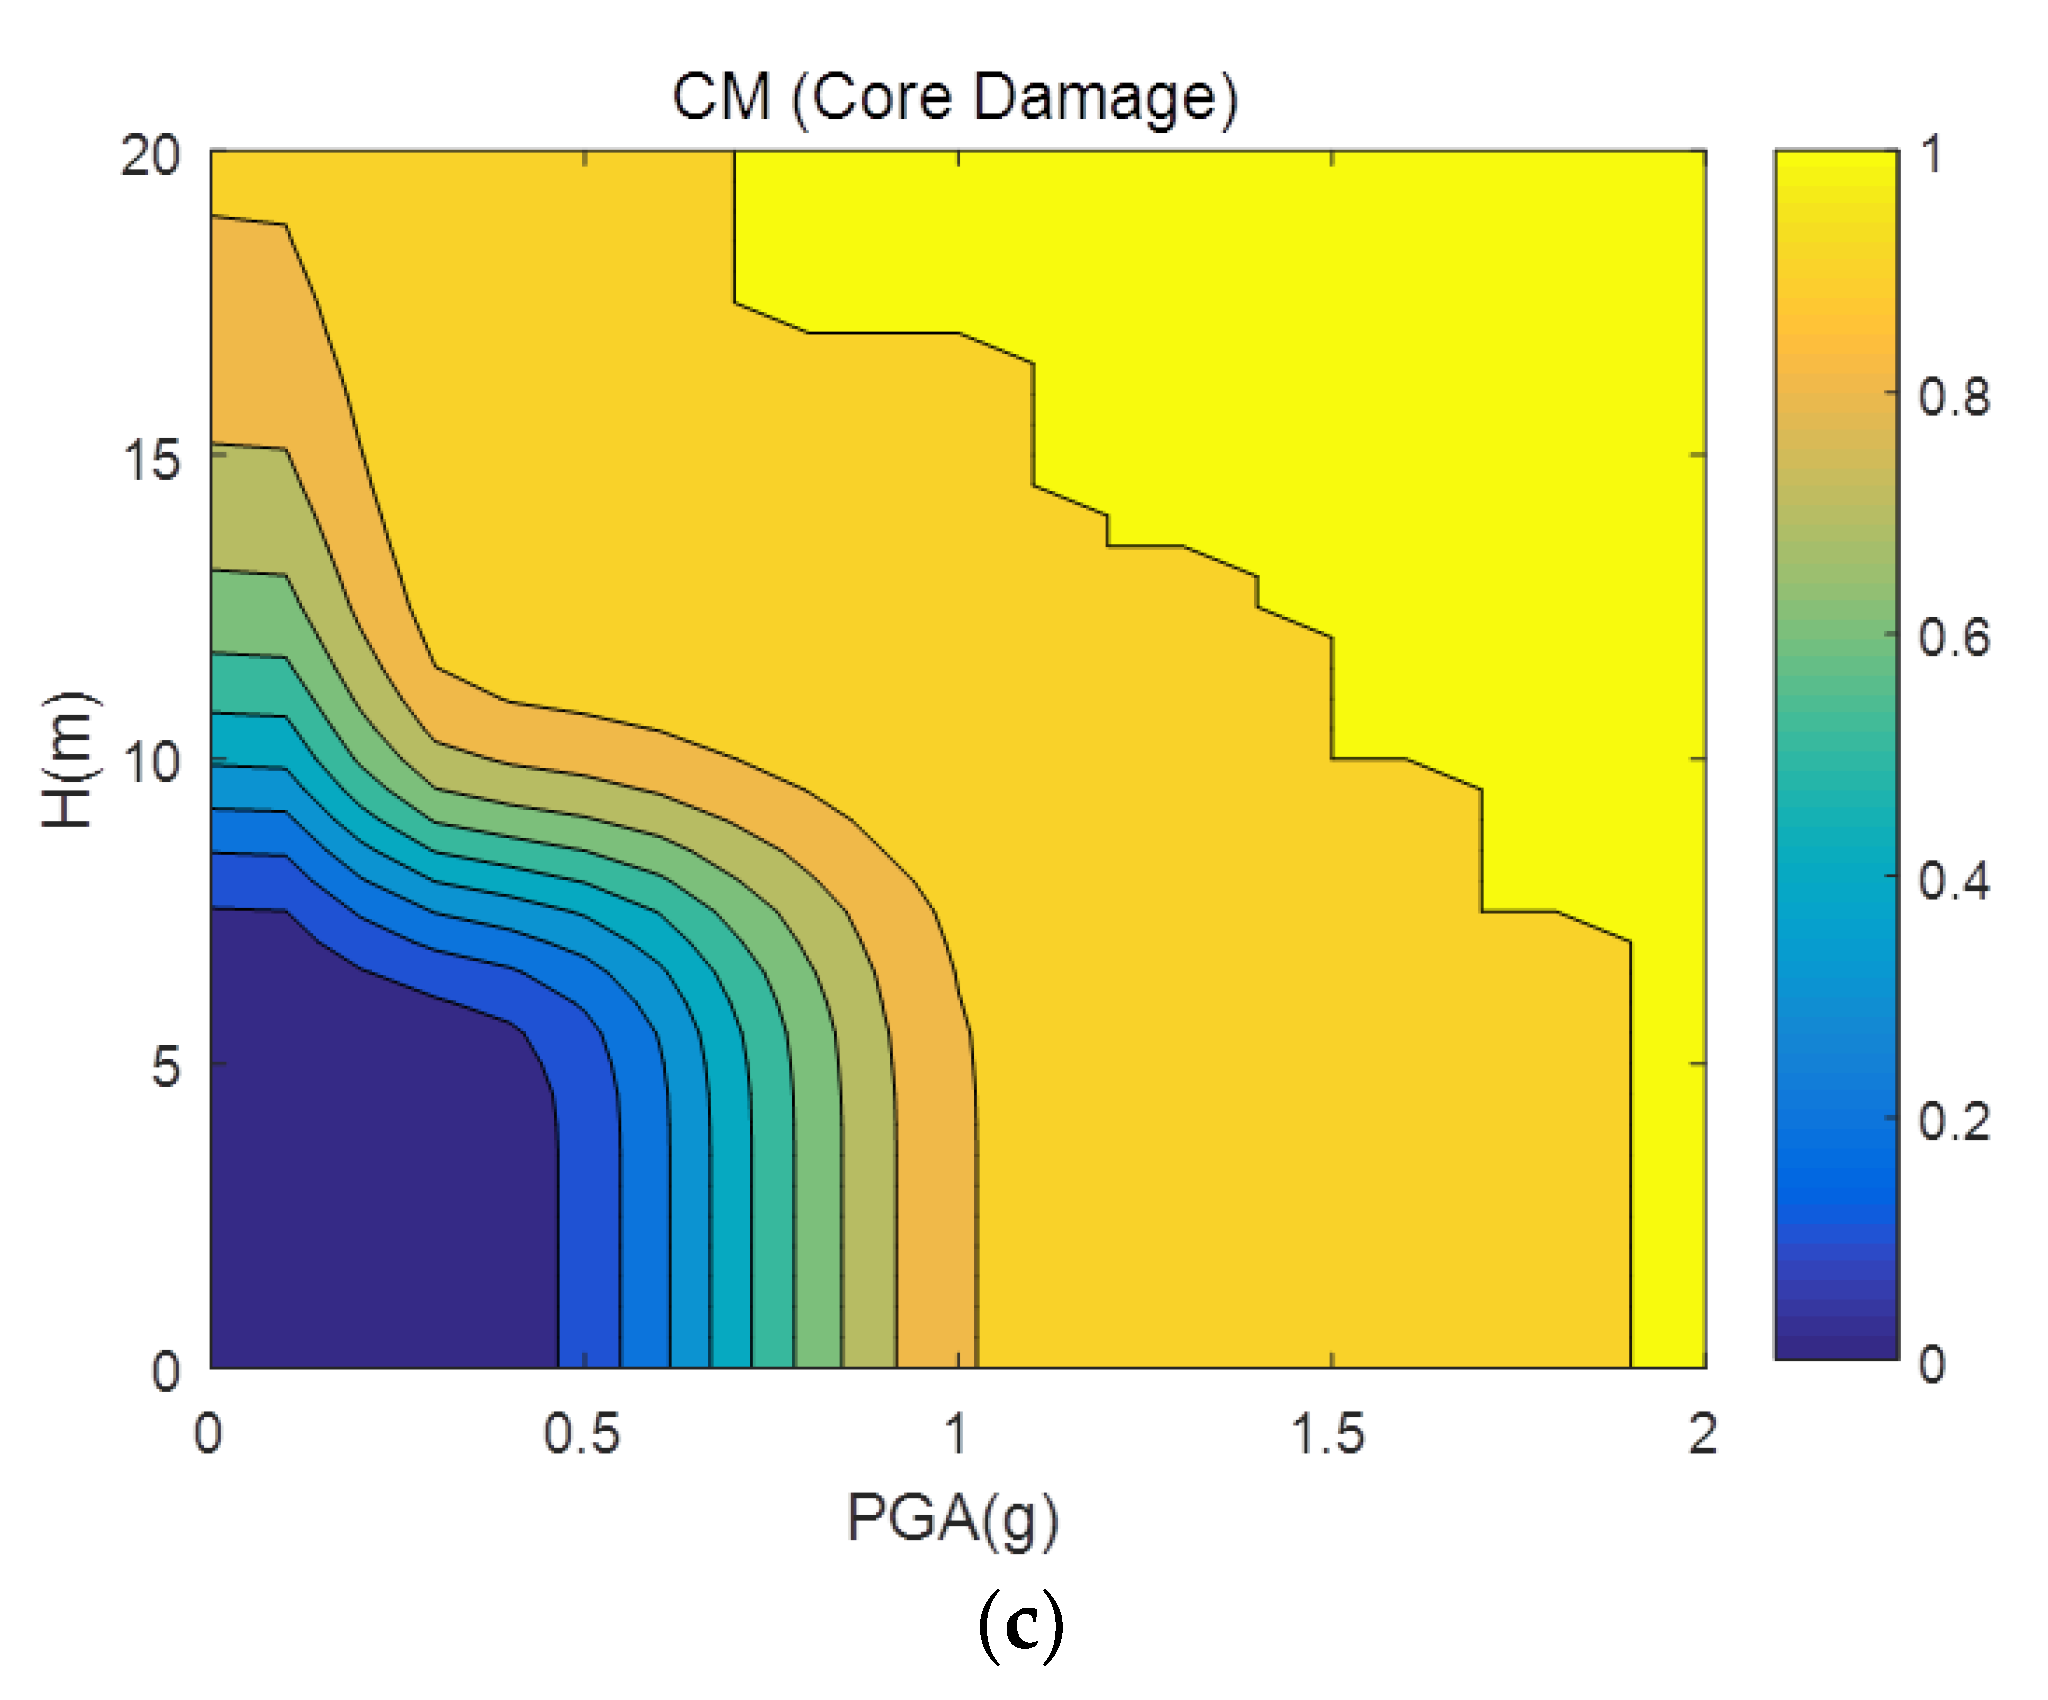
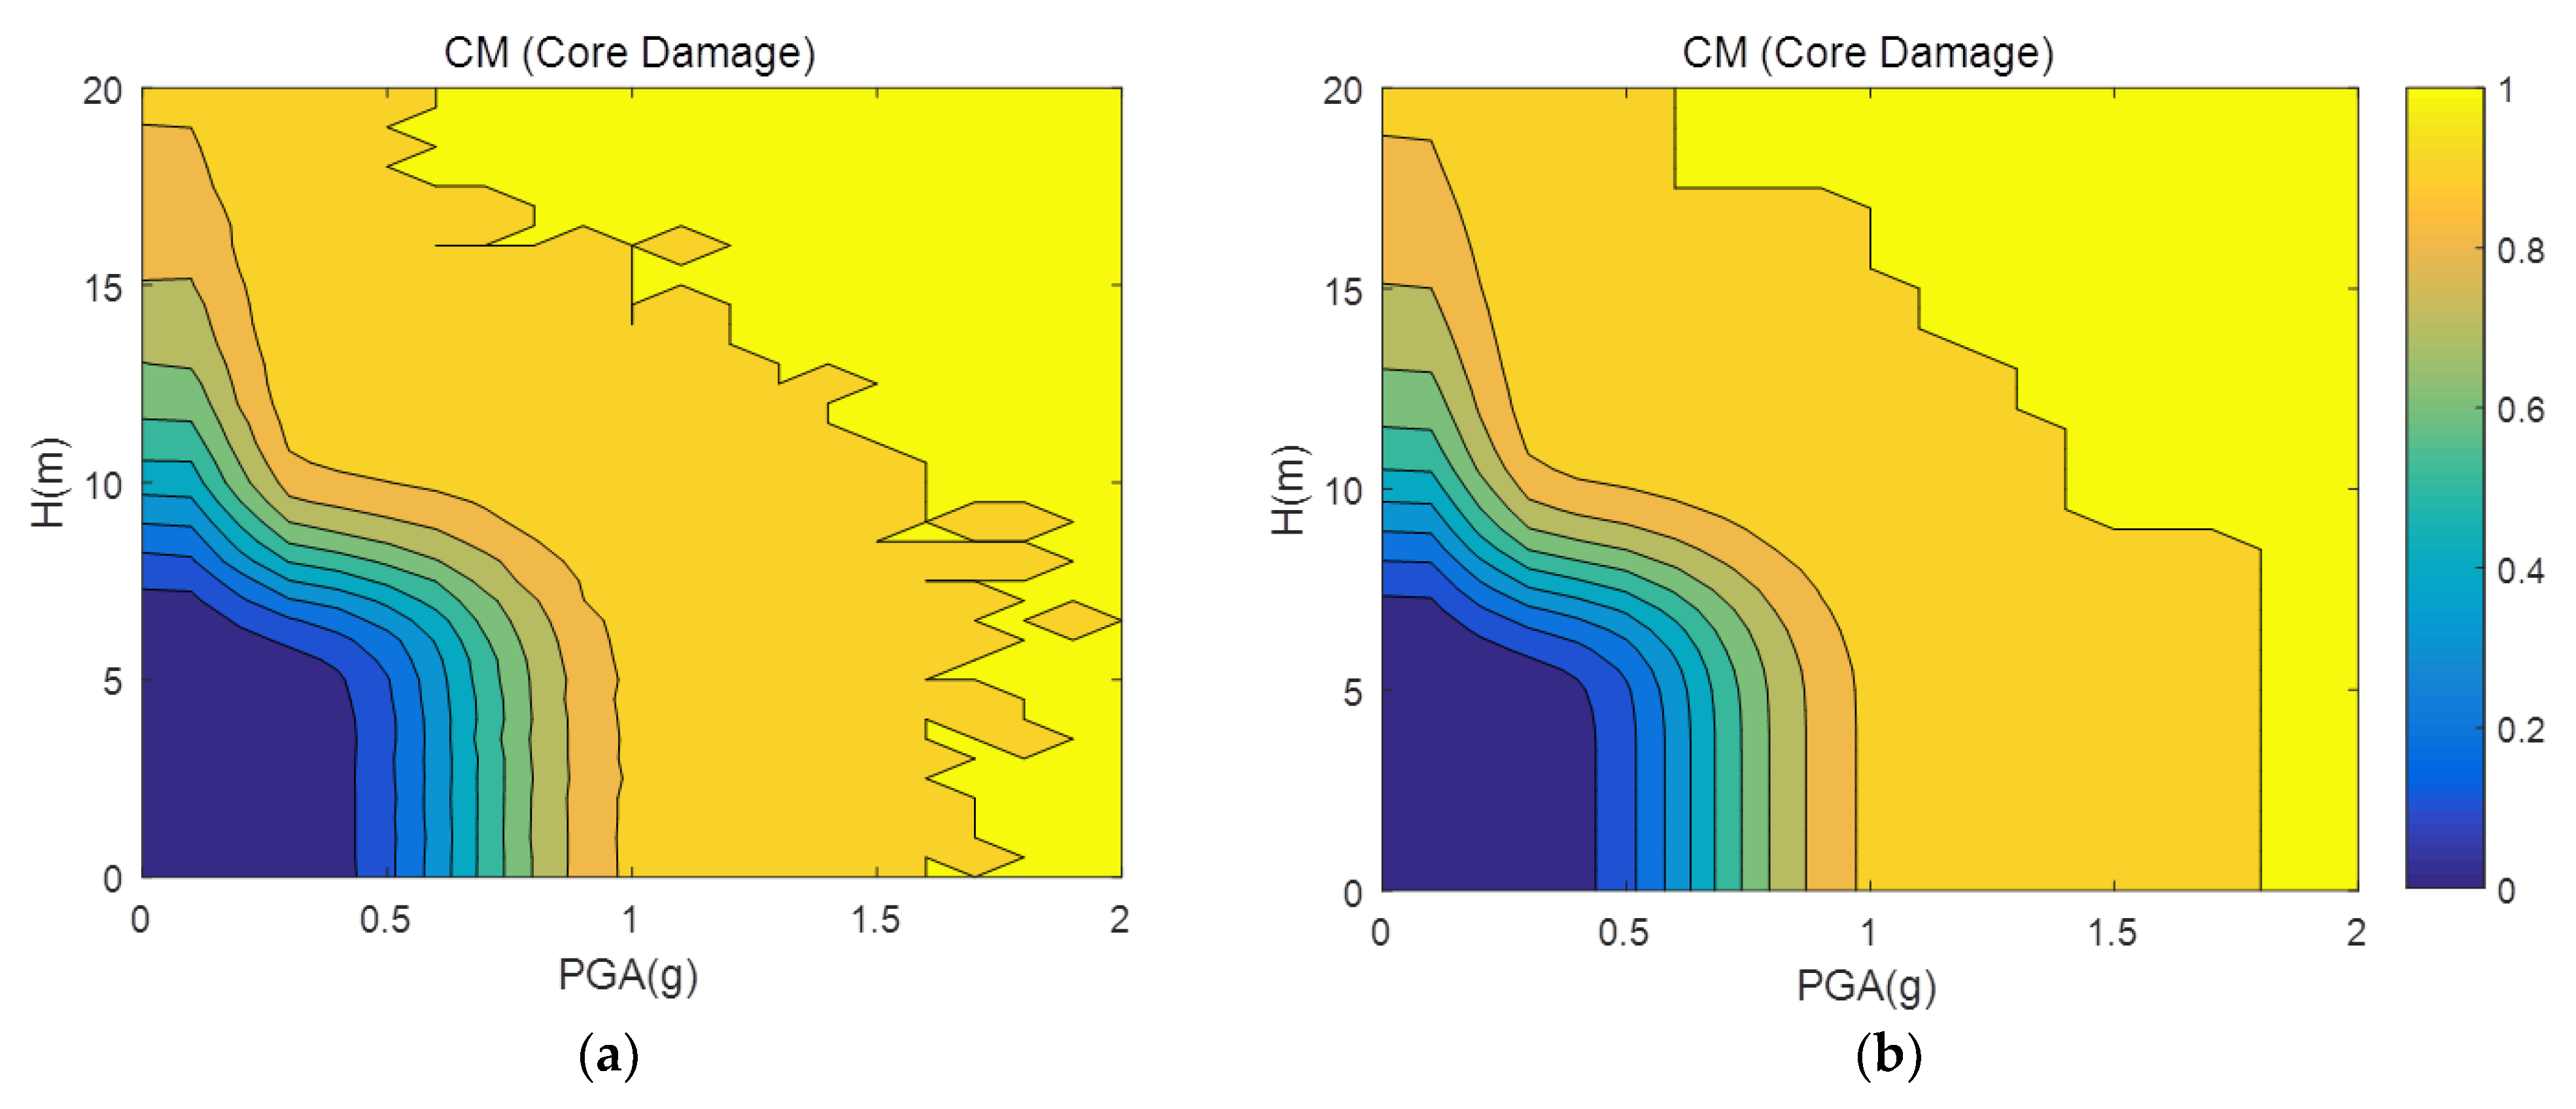
As a result, the results of the multi-hazard system fragility of the proposed method, the E-DQFM method, and the Boolean algebraic method with respect to the CM sequence in the case of independent and fully dependent conditions within the hazard event are represented and compared in Figure 14 and Figure 15. The quantitative comparison was performed by summarizing and comparing multi-hazard risk values for all accident scenarios, as shown in Table 7 and Table 8. As can be seen from the related Figures and Tables, we can confirm that the proposed method can evaluate the multi-hazard system fragility and risk values that are consistent with the exact solutions, not only in the single-hazard PSA problem, but also in the multi-hazard PSA problem. In addition, even in the case of the multi-hazard PSA problem, the proposed method can obtain results that are almost close to the exact solutions with fewer number of samples compared with the E-DQFM method. In the case of the partial dependency condition, Figure 16 and Table 9 show a comparison of the multi-hazard system fragility and risk results of the E-DQFM method and the proposed method, and it can be observed that there is no difference in the results. Finally, Figure 16 shows the convergence results of the solutions through the E-DQFM method and the proposed method according to the change in the number of “N” samples in relation to this example of the multi-hazard risk assessment of the actual NPP. As in the above examples 1 and 2, there is almost no difference in the solution convergence pattern between the two methods, and when N = 1E4 or more, the results of both sampling methods become close to the exact solutions. This result indicates that the number of “N” samples for the exact risk assessment and the solution convergence pattern is also similar, even if the target plant becomes complicated. Therefore, the multi-hazard PSA methodology proposed in this study can be utilized as an effective tool for efficiently quantifying the plant’s risks when subjected to the threat of multiple external hazard events.
5. Summary and Conclusions
In this study, we proposed a methodology to quantify multi-hazard risks by extending the existing single-hazard EE-PSA methodology. We developed an efficient multi-hazard PSA methodology based on the probability distribution-based Boolean algebraic approach and sampling-based method, which are currently basic methods of the single-hazard PSA methodology. Specifically, we extended the probability distribution-based Boolean algebraic approach, which is the basic method for quantifying existing single-hazard EE-PSA risks, to a method to quantify multi-hazard PSA risks. This is the most efficient way to assess exact solutions of system fragility and risks regarding a complete independent condition and a fully dependent condition between components within each hazard event. However, it has a limitation that it cannot consider a partially dependent condition between the component fragilities. Therefore, a sampling-based method was introduced to deal with this partial dependent problem. A single-hazard EE-PSA technique (DQFM) was previously proposed, which could take into account the partial correlations between the component’s vulnerabilities. However, this is a method that can basically consider single-hazard EE-PSA problems. Thus, in this study, we proposed an extended algorithm of the existing DQFM to consider multi-hazard PSA problems. In addition, we proposed a more efficient algorithm by improving the shortcomings of the basic algorithm of the current DQFM, which takes a great deal of computational time. Finally, in the sampling-based method, the existing input variables (Rm, Cm, βRr, βCr, βRu, βCu) of the existing DQFM method were reduced to the basic inputs of the EPRI SOV method (Am, βr, βu) to minimize the number of input variables.
The proposed multi-hazard PSA methodology was applied from the simple earthquake and tsunami multi-hazard examples to the single-hazard and multi-hazard PSA examples of the actual NPP, and the results are summarized as follows. The three methods developed within the multi-hazard PSA methodology yielded the same results with respect to a simple intersection example, a more general example of intersection and union, and an actual seismic-tsunami multi-hazard example of the NPP. Thus, the validity of methods could be verified mutually. Specifically, based on the results of the probability distribution-based Boolean algebraic method, which can obtain exact solutions for the independent and fully dependent conditions, the results of the E-DQFM method and those of the proposed method, which improves the existing DQFM algorithm, were compared. Such a comparison result shows that the proposed method secures similar accuracy in the solutions, even though it utilizes fewer samples than the E-DQFM method. Additionally, in the case of the partially dependent condition, the Boolean algebraic approach did not yield the result due to the characteristics of the method, but the E-DQFM method and the proposed method calculated similar results, which could prove the validity of the methods. In addition, the proposed methodology was applied to the PSA problem of a single earthquake hazard of an actual NPP, and the proposed methodology proved its accuracy by calculating almost the same value as the previous research results in the same problem. Finally, the numerical stability and accuracy of the results were investigated by changing the number of samples “N” with respect to the E-DQFM method and the proposed method for all the examples. The results showed that when N = 1 × 10⁴ or more, the results of both sampling methods become almost close to the exact solutions, and the solution convergence patterns of both methods were similar.
A large amount of data is required to actually apply the multi-hazard PSA methodology proposed in this study. Since the Fukushima nuclear accident in 2011, as the awareness of a multi-hazard event has increased, many studies have been conducted to date [1,21]. In addition, one study was conducted on the quantification of dependencies between components in nuclear facilities in the event of an external hazard [14]. From such a perspective, the proposed multi-hazard PSA methodology is considered to be applicable under the current dataset situation. In particular, it is believed that this methodology can be used to predict external hazard risks, even in situations where there is not enough data, through appropriate engineering judgments and data assumptions. As a result, it is expected that the proposed multi-hazard PSA method can be used to evaluate the risk quantification efficiently and accurately by taking into account all of the dependencies between the components under the multi-hazard events.
Author Contributions
Conceptualization: S.K., J.G.H., and M.K.K.; methodology: S.K., and J.H.K.; validation: S.K.; formal analysis: S.K. and J.G.H.; data curation: S.K. and J.G.H.; writing—original draft preparation: S.K.; writing—review and editing: S.K., J.G.H., M.K.K., and J.H.K.; funding acquisition: M.K.K.
Funding
This study was funded by the National Research Foundation of Korea (NRF) grant funded by the Korean government (NRF-2017M2A8A4015290).
Conflicts of Interest
The authors declare no conflict of interest.
Nomenclature

| Acronyms and Symbols | Description |
| DQFM | Direct quantification of fault tree using the Monte Carlo simulation |
| E-DQFM | Extended DQFM |
| EE-PSA | External event probabilistic safety assessment |
| EPRI | Electric Power Research Institute |
| EPRI SOV method | EPRI separation-of-variable method |
| HCLPF | High-confidence-low-probability-of-failure |
| I-DQFM | Improved DQFM (proposed) |
| JAERI | Japan Atomic Energy Research Institute |
| LGS | Limerick generating station |
| NPP | Nuclear power plant |
| PGA | Peak ground acceleration |
| PSA | Probabilistic safety assessment |
| R2 | Coefficient of determination |
| RMSE | Root mean squared error |
| Am, βr, βu (or Am, βc) | EPRI SOV method fragility input variables |
| CM | Reactor core damage accident |
| Rm, Cm, βRr, βCr, βRu, βCu | JAERI fragility input variables |
| TsEsUX, TsRb, TsRpv, TsEsCmC2, TsRbCm, TsEbWm | Six dominant sequences that lead to the core damage |
| ρs, ρt | Correlation coefficients |
References
- Basco, A.; Salzano, E. The vulnerability of industrial equipment to tsunami. J. Loss Prev. Process Ind. 2017, 50, 301–307. [Google Scholar] [CrossRef]
- Salzano, E.; Agreda, A.G.; Di Carluccio, A.; Fabbrocino, G. Risk assessment and early warning systems for industrial facilities in seismic zones. Reliab. Eng. Syst. Saf. 2009, 94, 1577–1584. [Google Scholar] [CrossRef]
- Fabbrocino, G.; Iervolino, I.; Orlando, F.; Salzano, E. Quantitative risk analysis of oil storage facilities in seismic areas. J. Hazard. Mater. 2005, 123, 61–69. [Google Scholar] [CrossRef] [PubMed]
- Prabhu, S.; Javanbarg, M.; Lehmann, M.; Atamturktur, S. Multi-peril risk assessment for business downtime of industrial facilities. Nat. Hazards 2019, 97, 1327–1356. [Google Scholar] [CrossRef]
- Gallina, V.; Torresan, S.; Critto, A.; Sperotto, A.; Glade, T.; Marcomini, A. A review of multi-risk methodologies for natural hazards: Consequences and challenges for a climate change impact assessment. J. Environ. Manag. 2016, 168, 123–132. [Google Scholar] [CrossRef] [PubMed]
- EPRI. Seismic Probabilistic Risk Assessment Implementation Guide; TR-1002989; Electric Power Research Institute: Palo Alto, CA, USA, 2003. [Google Scholar]
- ASME/ANS. Addenda to ASME/ANS RA-S-2008—Standard for Level 1/Large Early Release Frequency Probabilistic Risk Assessment for Nuclear Power Plant Applications; ASME/ANS RA-Sa-2009; The American Society of Mechanical Engineers: New York, NY, USA, 2009. [Google Scholar]
- ASCE. Seismic Analysis of Safety-Related Nuclear Structures and Commentary; ASCE/SEI 4-16; American Society of Civil Engineers: Reston, VA, USA, 2017. [Google Scholar]
- Kwag, S.; Hahm, D. Development of an Earthquake-induced Landslide Risk Assessment Approach for Nuclear Power Plants. Nucl. Eng. Technol. 2018, 50, 1372–1386. [Google Scholar] [CrossRef]
- Ellingwood, B. Validation studies of seismic PRAs. Nucl. Eng. Des. 1990, 123, 189–196. [Google Scholar] [CrossRef]
- Kim, J.H.; Choi, I.-K.; Park, J.-H. Uncertainty analysis of system fragility for seismic safety evaluation of NPP. Nucl. Eng. Des. 2011, 241, 2570–2579. [Google Scholar] [CrossRef]
- Kwag, S.; Oh, J.; Lee, J.M.; Ryu, J.S. Bayesian based seismic margin assessment approach: Application to research reactor system. Earthq. Struct 2017, 12, 653–663. [Google Scholar]
- EPRI. Methodology for Developing Seismic Fragilities; TR-103959; Electric Power Research Institute: Palo Alto, CA, USA, 1994. [Google Scholar]
- USNRC. Correlation of Seismic Performance in Similar SSCs (Structures, Systems, and Components); NUREG/CR-7237; United States Nuclear Regulatory Commission, Office of Nuclear Regulatory Research: Washington, DC, USA, 2017.
- Kwag, S.; Gupta, A. Probabilistic risk assessment framework for structural systems under multiple hazards using Bayesian statistics. Nucl. Eng. Des. 2017, 315, 20–34. [Google Scholar] [CrossRef]
- Tolo, S.; Patelli, E.; Beer, M. Robust vulnerability analysis of nuclear facilities subject to external hazards. Stoch. Environ. Res. Risk Assess. 2017, 31, 2733–2756. [Google Scholar] [CrossRef]
- Kwag, S.; Oh, J.; Lee, J.M. Application of Bayesian statistics to seismic probabilistic safety assessment for research reactor. Nucl. Eng. Des. 2018, 328, 166–181. [Google Scholar] [CrossRef]
- Watanabe, Y.; Oikawa, T.; Muramatsu, K. Development of the DQFM method to consider the effect of correlation of component failures in seismic PSA of nuclear power plant. Reliab. Eng. Syst. Saf. 2003, 79, 265–279. [Google Scholar] [CrossRef]
- Ebisawa, K.; Abe, K.; Muramatsu, K.; Itoh, M.; Kohno, K.; Tanaka, T. Evaluation of response factors for seismic probabilistic safety assessment of nuclear power plants. Nucl. Eng. Des. 1994, 147, 197–210. [Google Scholar] [CrossRef]
- Kawaguchi, K.; Uchiyama, T.; Muramatsu, K. Efficiency of analytical methodologies in uncertainty analysis of seismic core damage frequency. J. Power Energy Syst. 2012, 6, 378–393. [Google Scholar] [CrossRef]
- Muta, H.; Uchiyama, K.M.T.; Nishida, A.; Furuya, O.; Takada, T. Reliability Enhancement of Seismic Risk Assessment of NPP as Risk Management Fundamentals-Development of a New Mathematical Framework for Uncertainty Analysis. In Proceedings of the 13th International Conference on Probabilistic Safety Assessment and Management (PSAM 13), Seoul, Korea, 2–7 October 2016. [Google Scholar]
- Prinja, N.K.; Ogunbadejo, A.; Sadeghi, J.; Patelli, E. Structural reliability of pre-stressed concrete containments. Nucl. Eng. Des. 2017, 323, 235–244. [Google Scholar] [CrossRef] [Green Version]
- Kennedy, R.P.; Cornell, C.A.; Campbell, R.D.; Kaplan, S.; Perla, H.F. Probabilistic seismic safety study of an existing nuclear power plant. Nucl. Eng. Des. 1980, 59, 315–338. [Google Scholar] [CrossRef]
- Kwag, S.; Gupta, A. Computationally efficient fragility assessment using equivalent elastic limit state and Bayesian updating. Comput. Struct. 2018, 197, 1–11. [Google Scholar] [CrossRef]
- Wells, J.W.; George, L.L.; Cummings, G.E. Seismic Safety Margins Research Program, Phase 1 Final Report: Systems Analysis (Project VII); NUREG/CR-2015; Lawrence Livermore National Laboratory: Livermore, CA, USA, 1984; Volume 8.
- Kim, M.K.; Choi, I.-K. A tsunami PSA methodology and application for NPP site in Korea. Nucl. Eng. Des. 2012, 244, 92–99. [Google Scholar] [CrossRef]
- KAERI. Development of Site Risk Assessment & Management Technology including Extreme External Events; KAERI/RR-4225/2016; Korea Atomic Energy Research Institute: Daejeon, Korea, 2017. [Google Scholar]
Figure 1.
Flowchart of extended DQFM algorithm for multi-hazard risk assessment.

Figure 2.
Flowchart of improved DQFM algorithm (“proposed”) for multi-hazard risk assessment.

Figure 3.
Multi-hazard system fragility results of the Boolean algebraic approach regarding the example C1 ∩ C2 (independent condition).
Figure 3.
Multi-hazard system fragility results of the Boolean algebraic approach regarding the example C1 ∩ C2 (independent condition).

Figure 4.
Comparison of the multi-hazard system fragility results regarding the example C1 ∩ C2 ((1) independent condition): (a) Boolean; (b) E-DQFM; (c) proposed (I-DQFM).
Figure 4.
Comparison of the multi-hazard system fragility results regarding the example C1 ∩ C2 ((1) independent condition): (a) Boolean; (b) E-DQFM; (c) proposed (I-DQFM).


Figure 5.
Comparison of the multi-hazard system fragility results regarding the example C1 ∩ C2 ((2) fully dependent condition)): (a) Boolean; (b) E-DQFM; (c) proposed (I-DQFM).
Figure 5.
Comparison of the multi-hazard system fragility results regarding the example C1 ∩ C2 ((2) fully dependent condition)): (a) Boolean; (b) E-DQFM; (c) proposed (I-DQFM).

Figure 6.
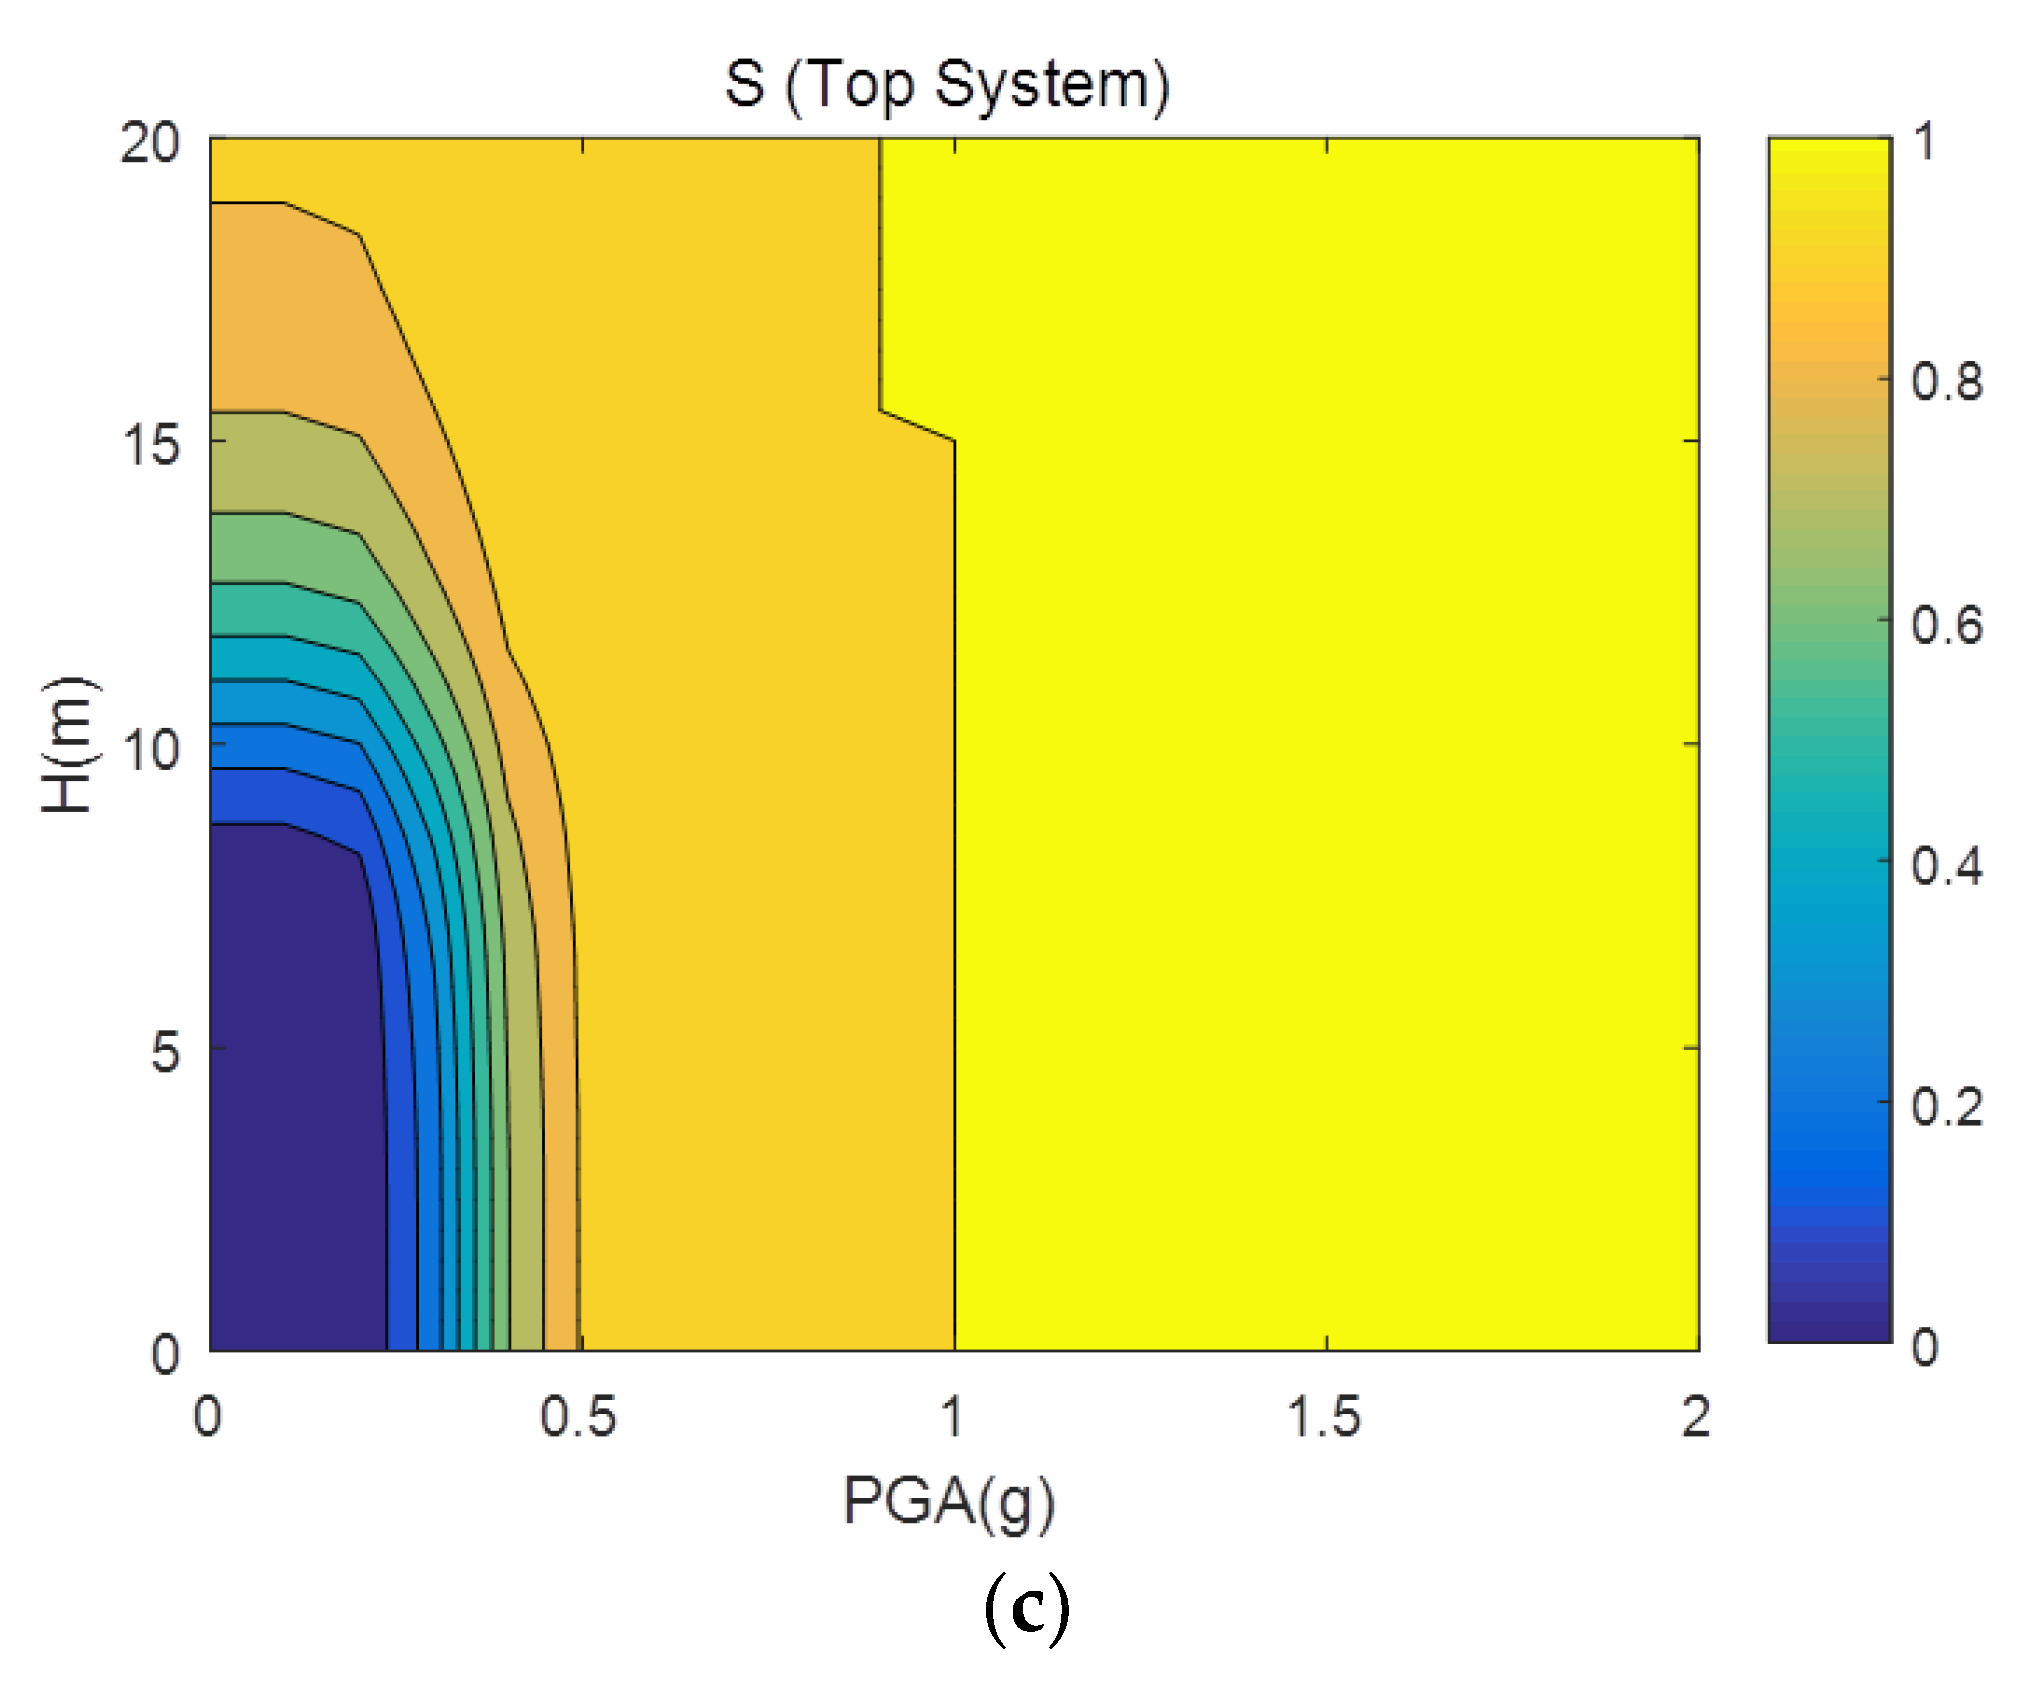
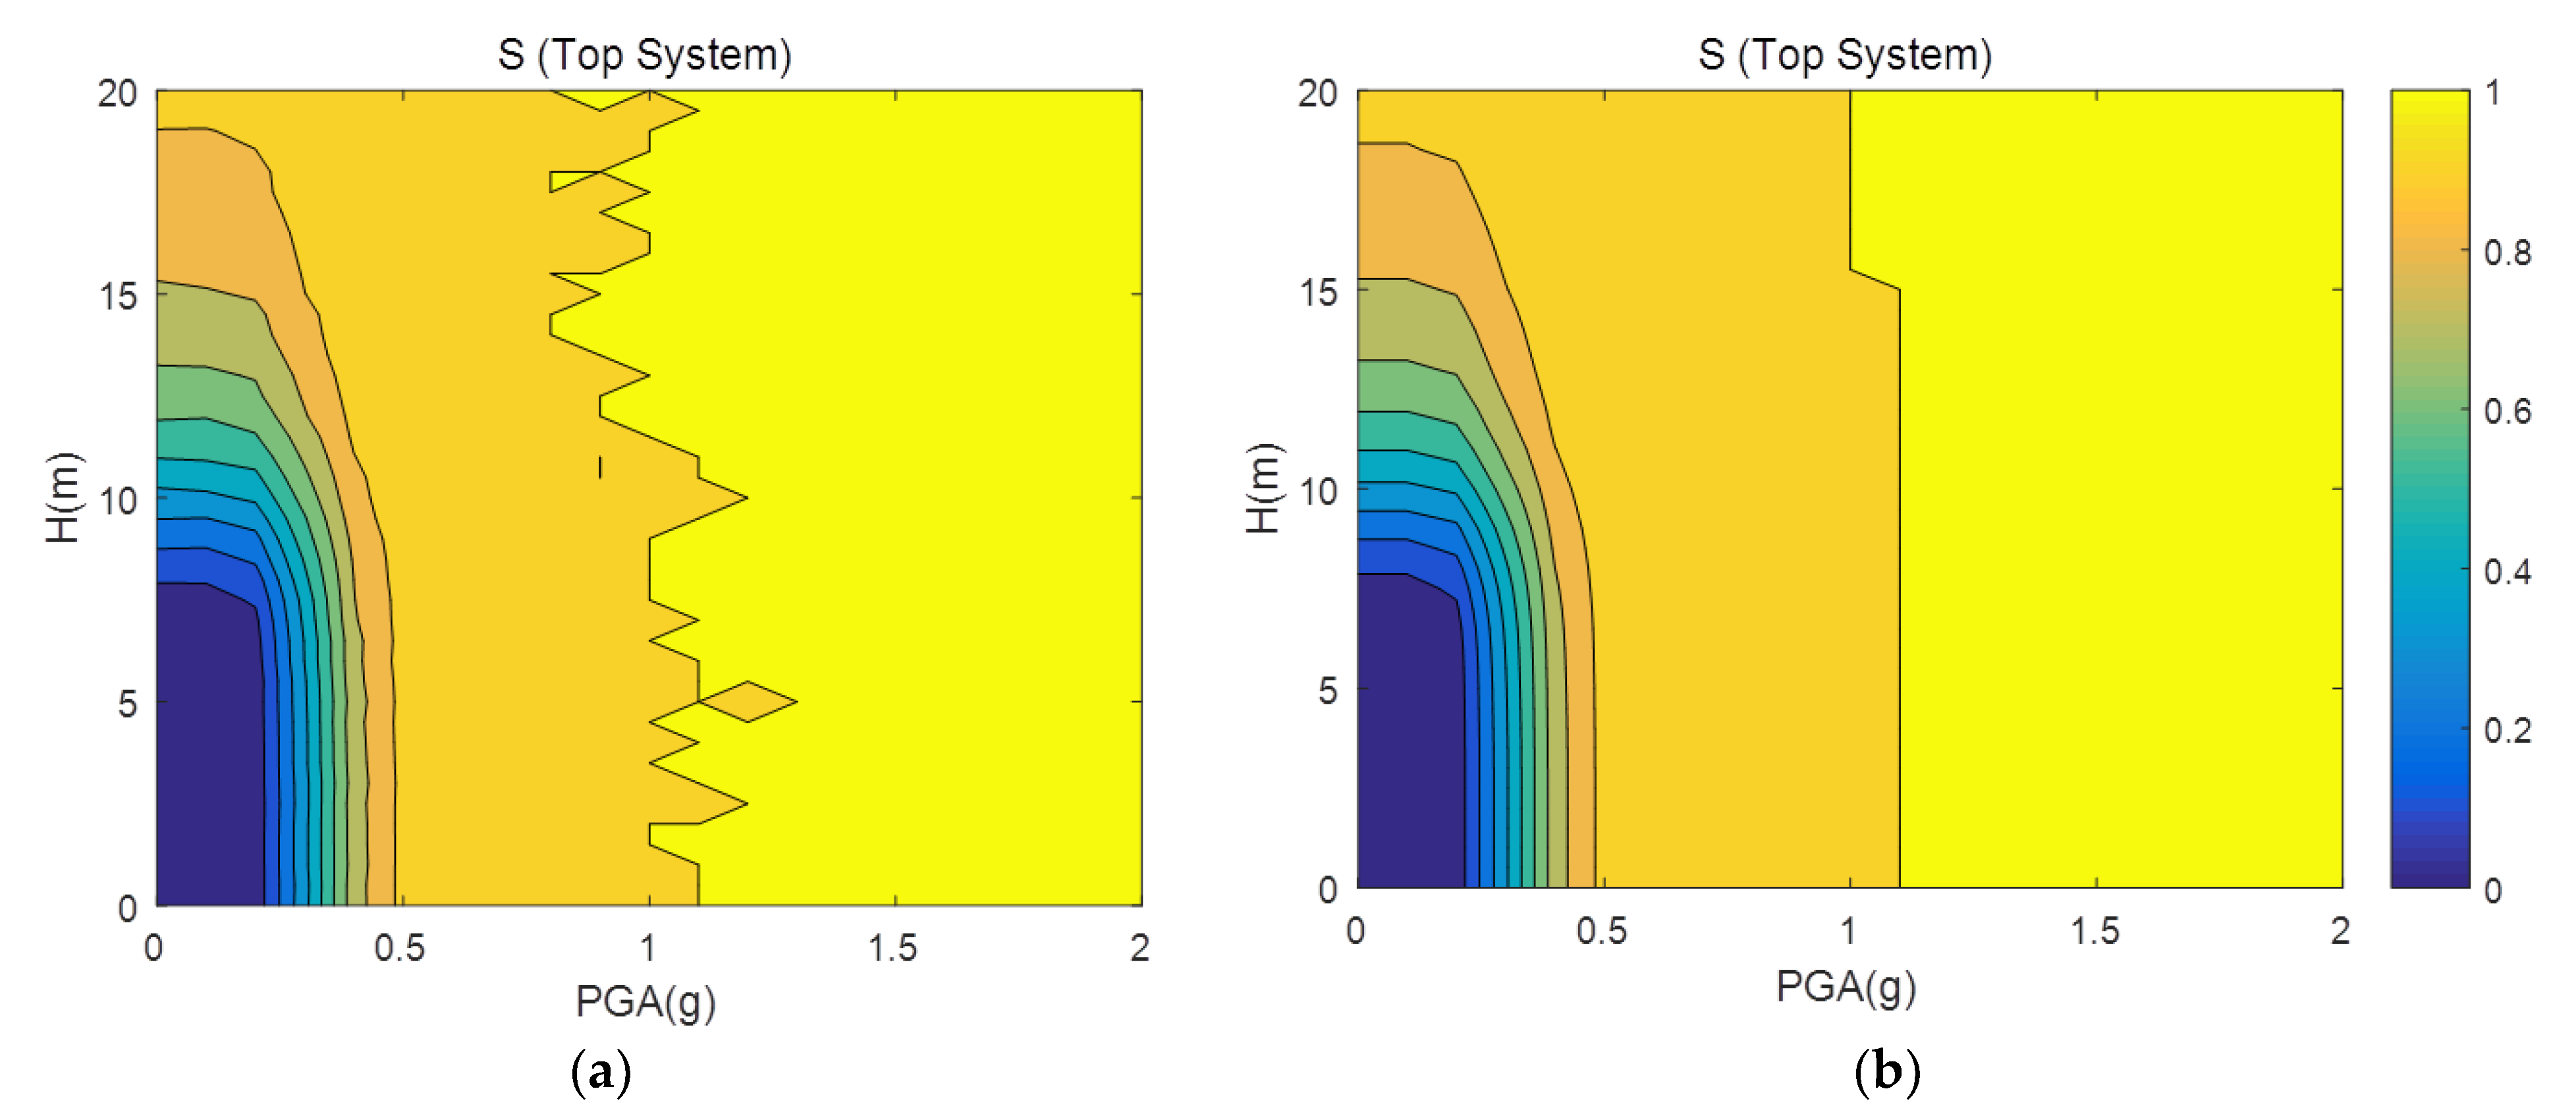
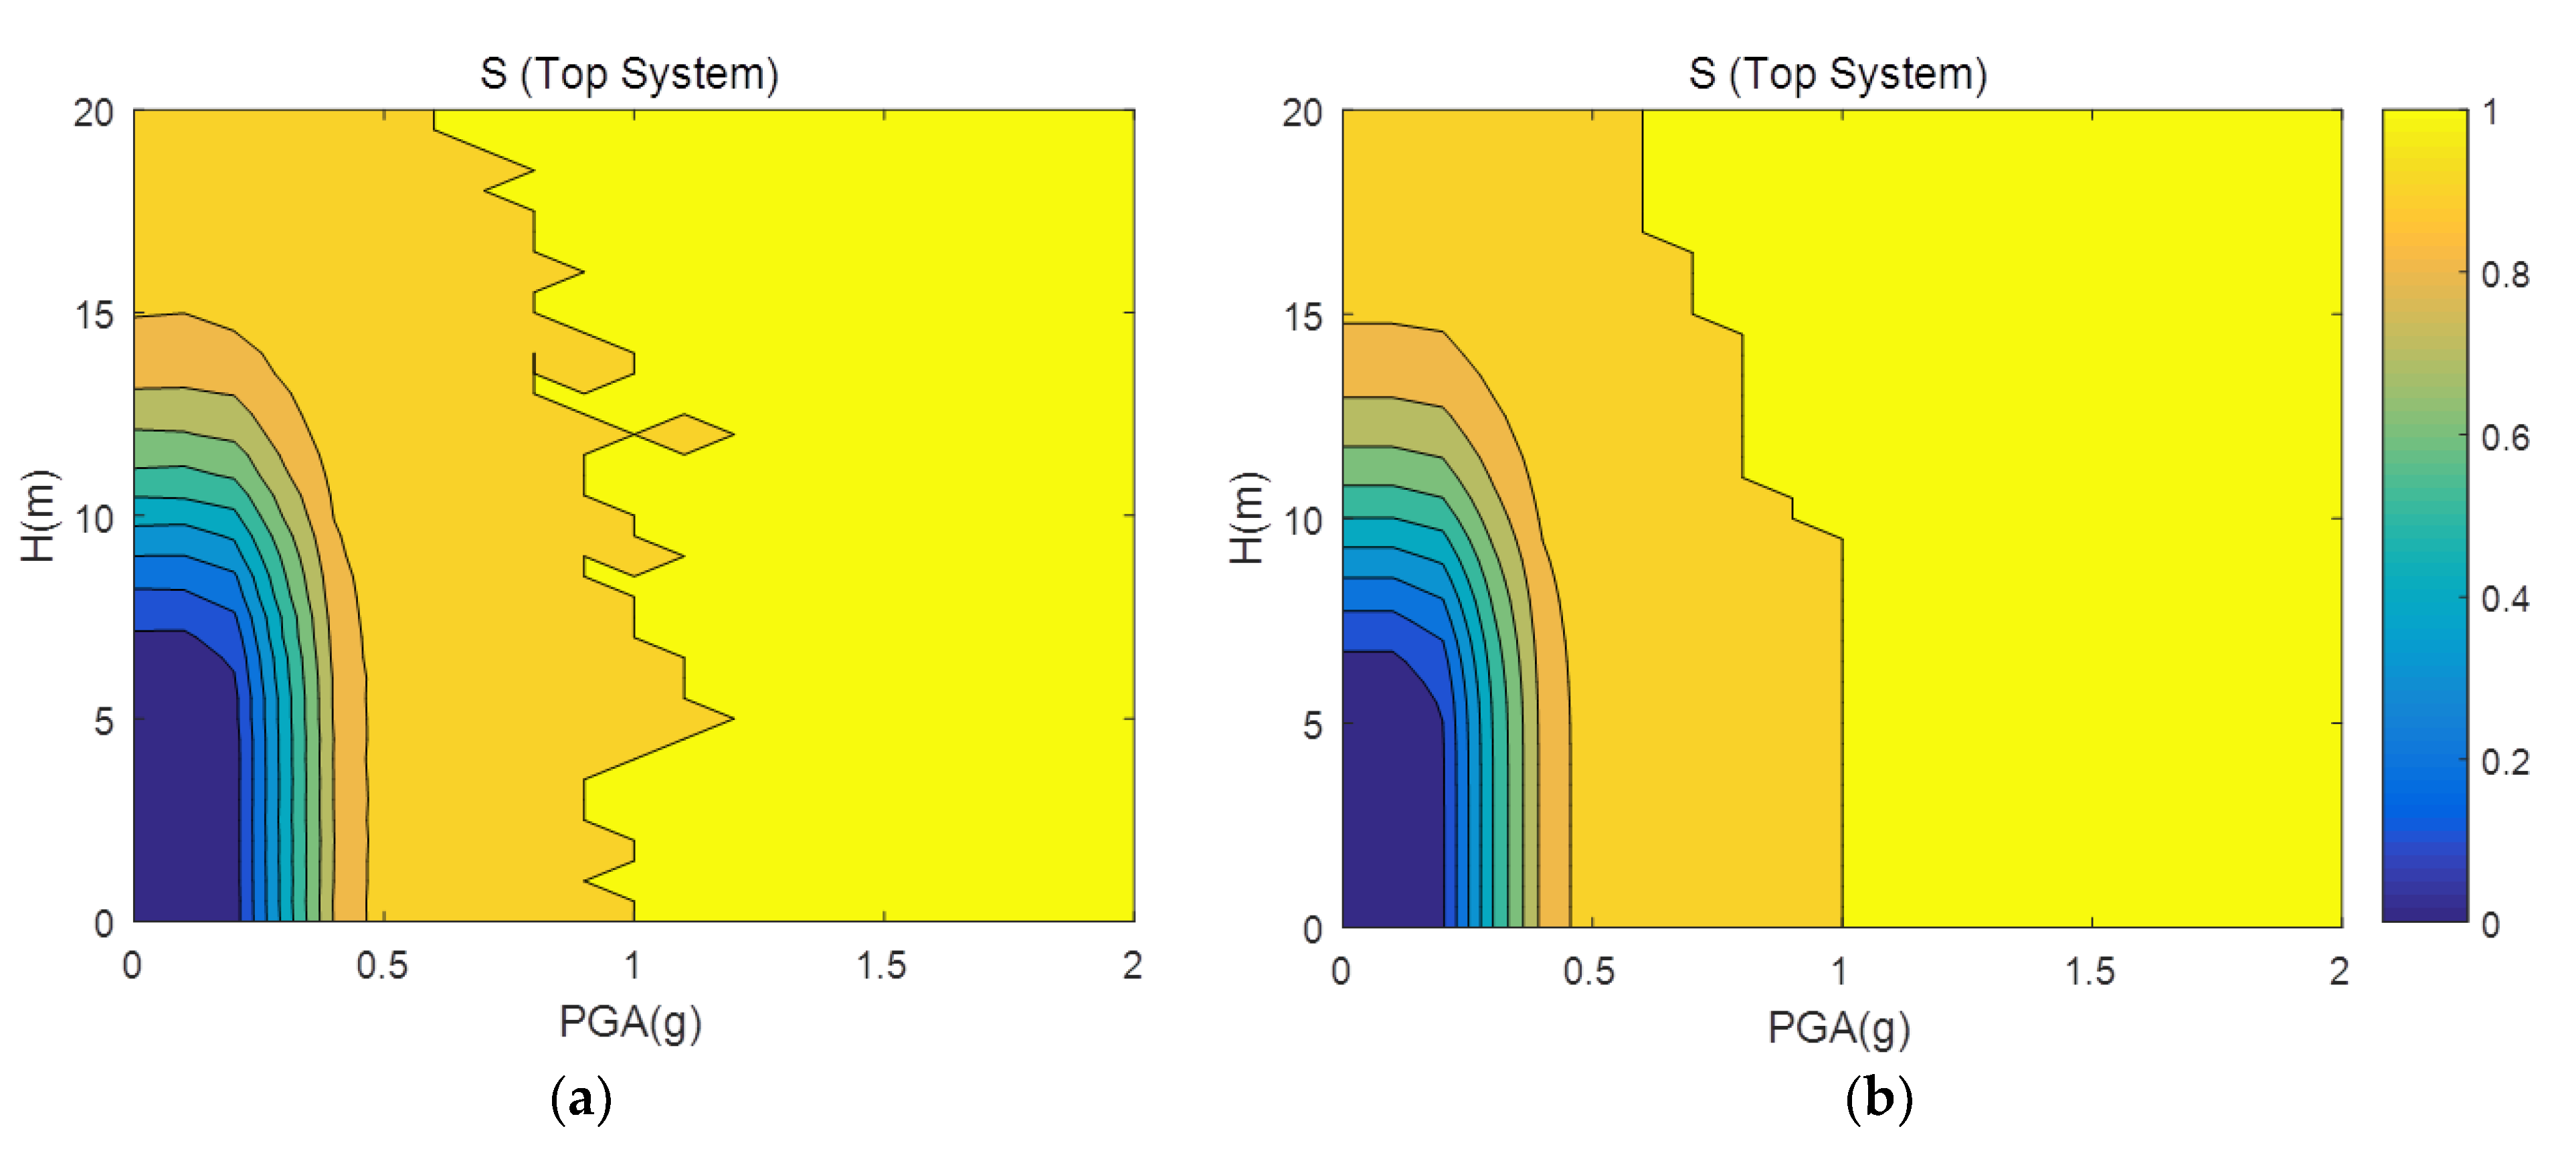
Comparison of multi-hazard system fragility results regarding the example C1 ∩ C2 ((3) partially dependent condition): (a) E-DQFM; (b) proposed (I-DQFM).
Figure 6.
Comparison of multi-hazard system fragility results regarding the example C1 ∩ C2 ((3) partially dependent condition): (a) E-DQFM; (b) proposed (I-DQFM).

Figure 7.
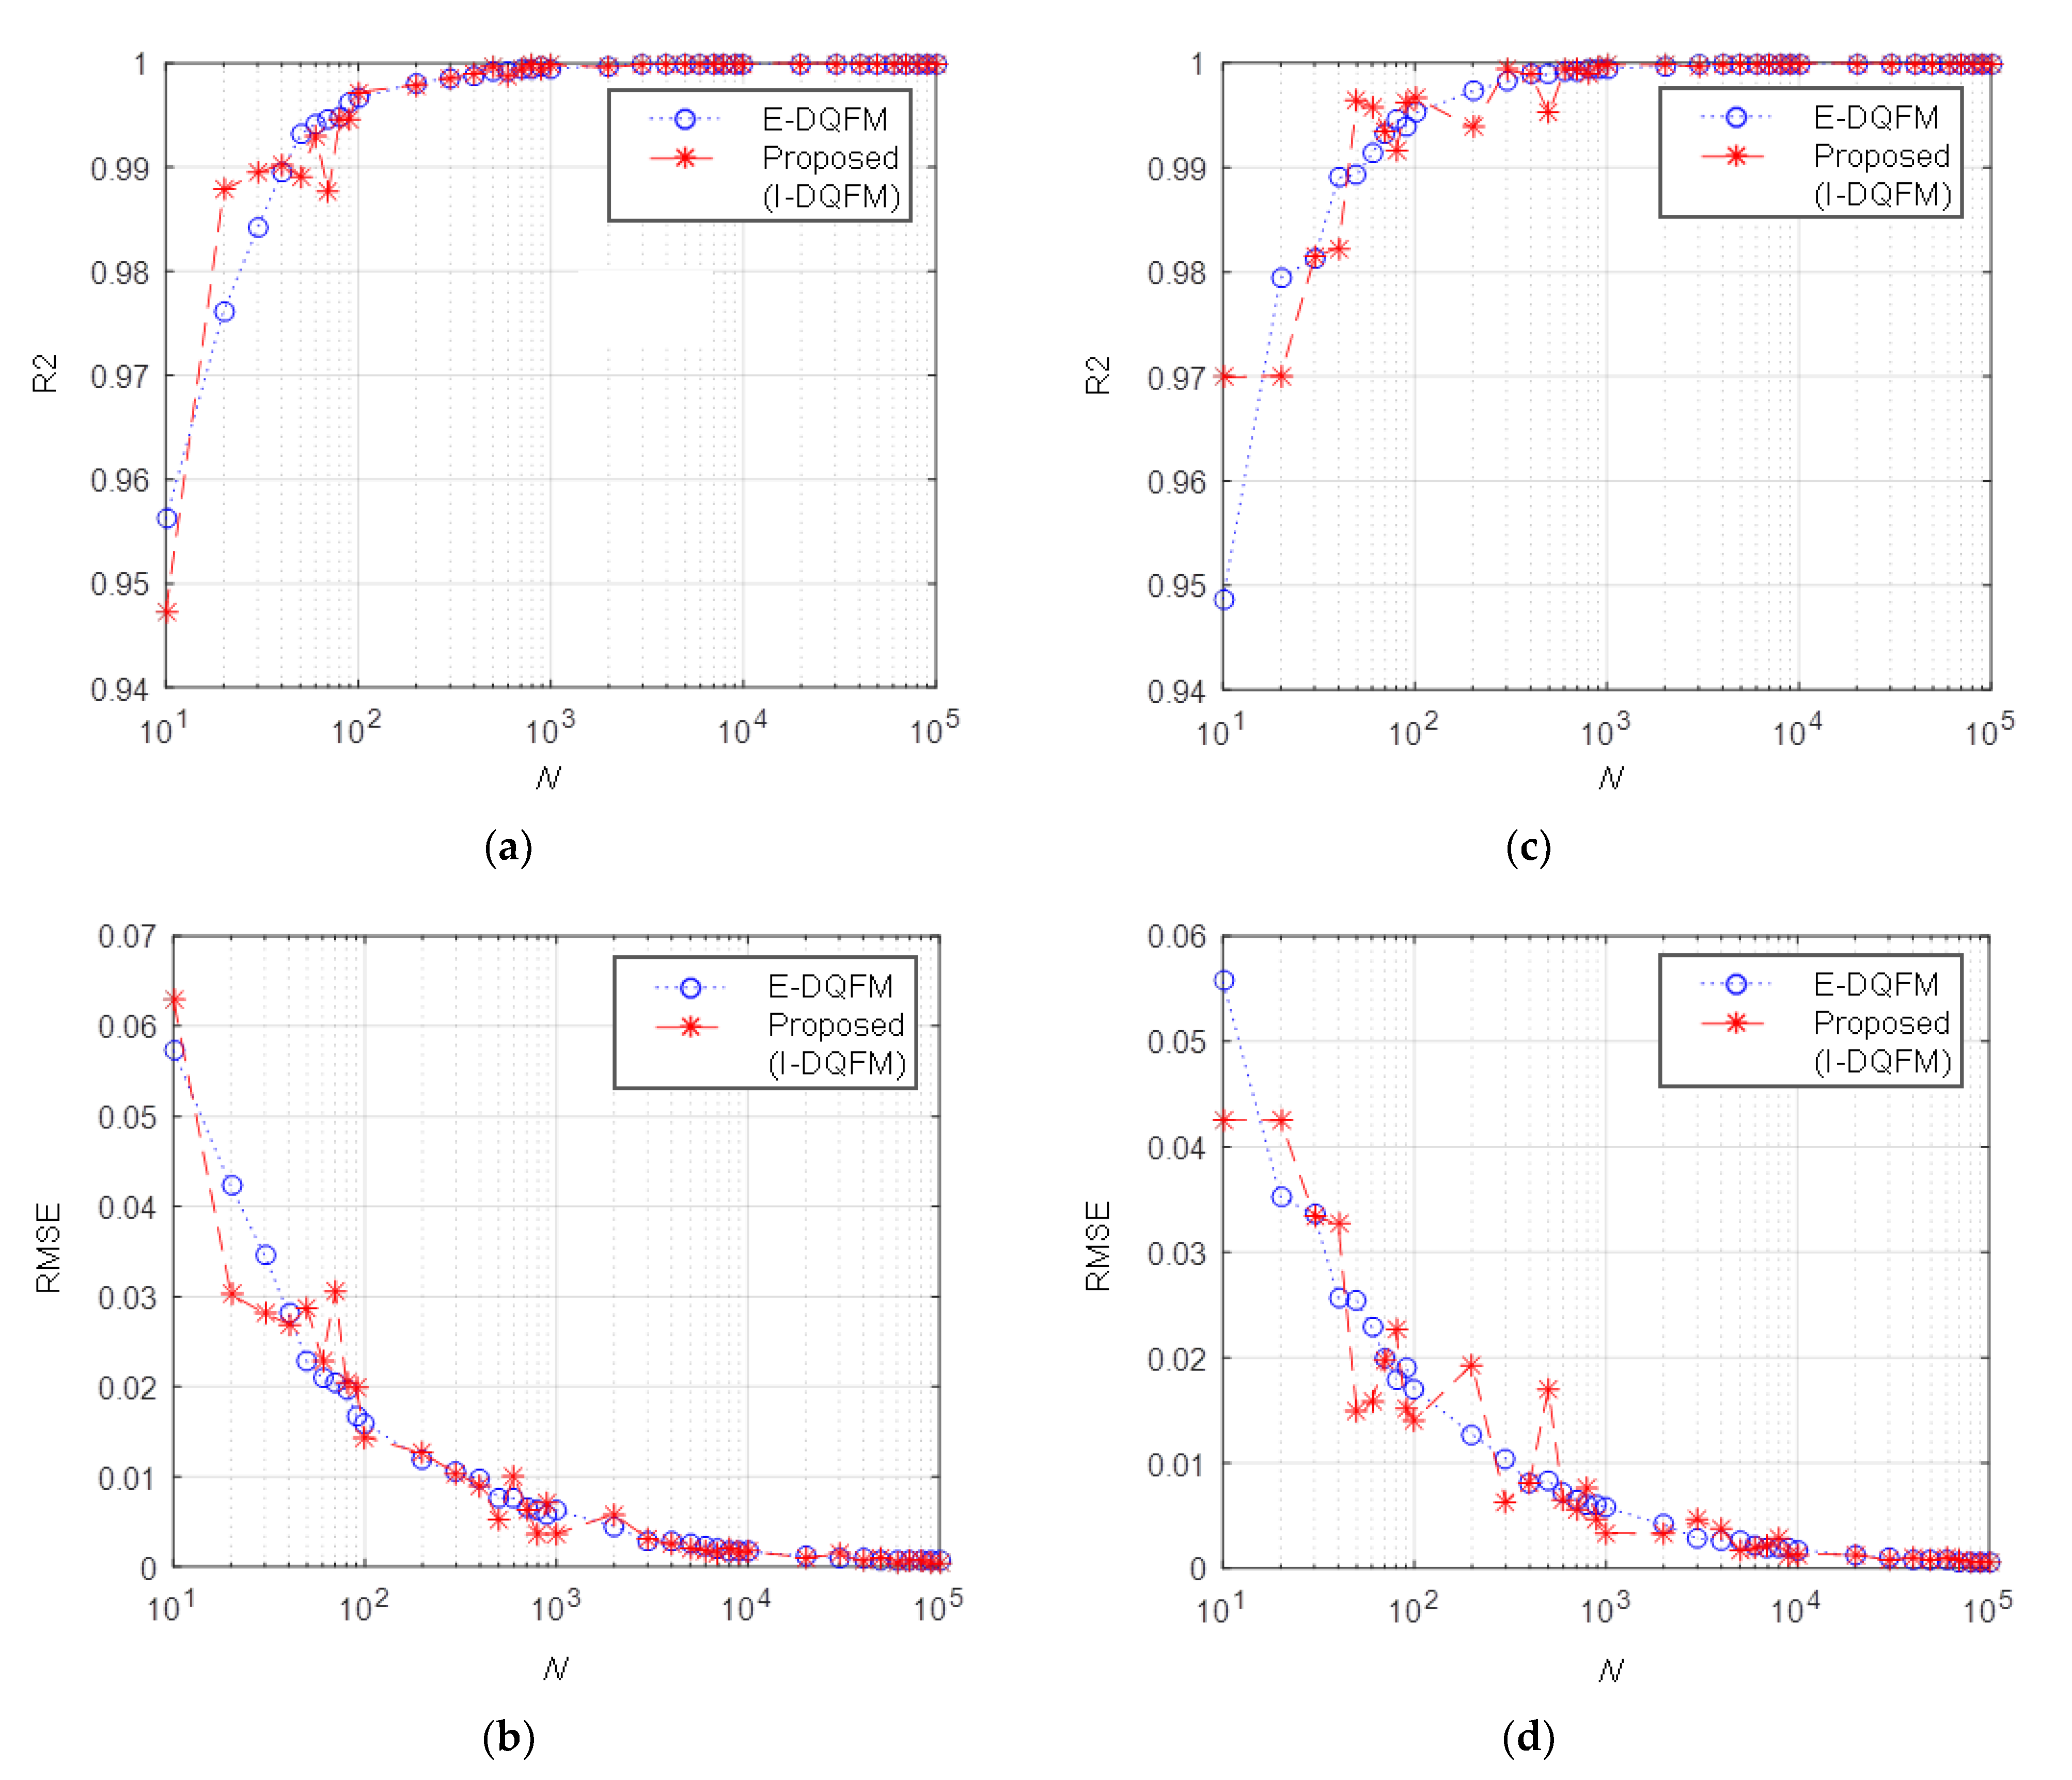
The R2 and RMSE comparison of E-DQFM and proposed method according to the number of samplings number “N” regarding the C1 ∩ C2 example: (a) R2 for independent case; (b) RMSE for independent case; (c) R2 for fully correlated case; (d) RMSE for fully correlated case.
Figure 7.
The R2 and RMSE comparison of E-DQFM and proposed method according to the number of samplings number “N” regarding the C1 ∩ C2 example: (a) R2 for independent case; (b) RMSE for independent case; (c) R2 for fully correlated case; (d) RMSE for fully correlated case.

Figure 8.
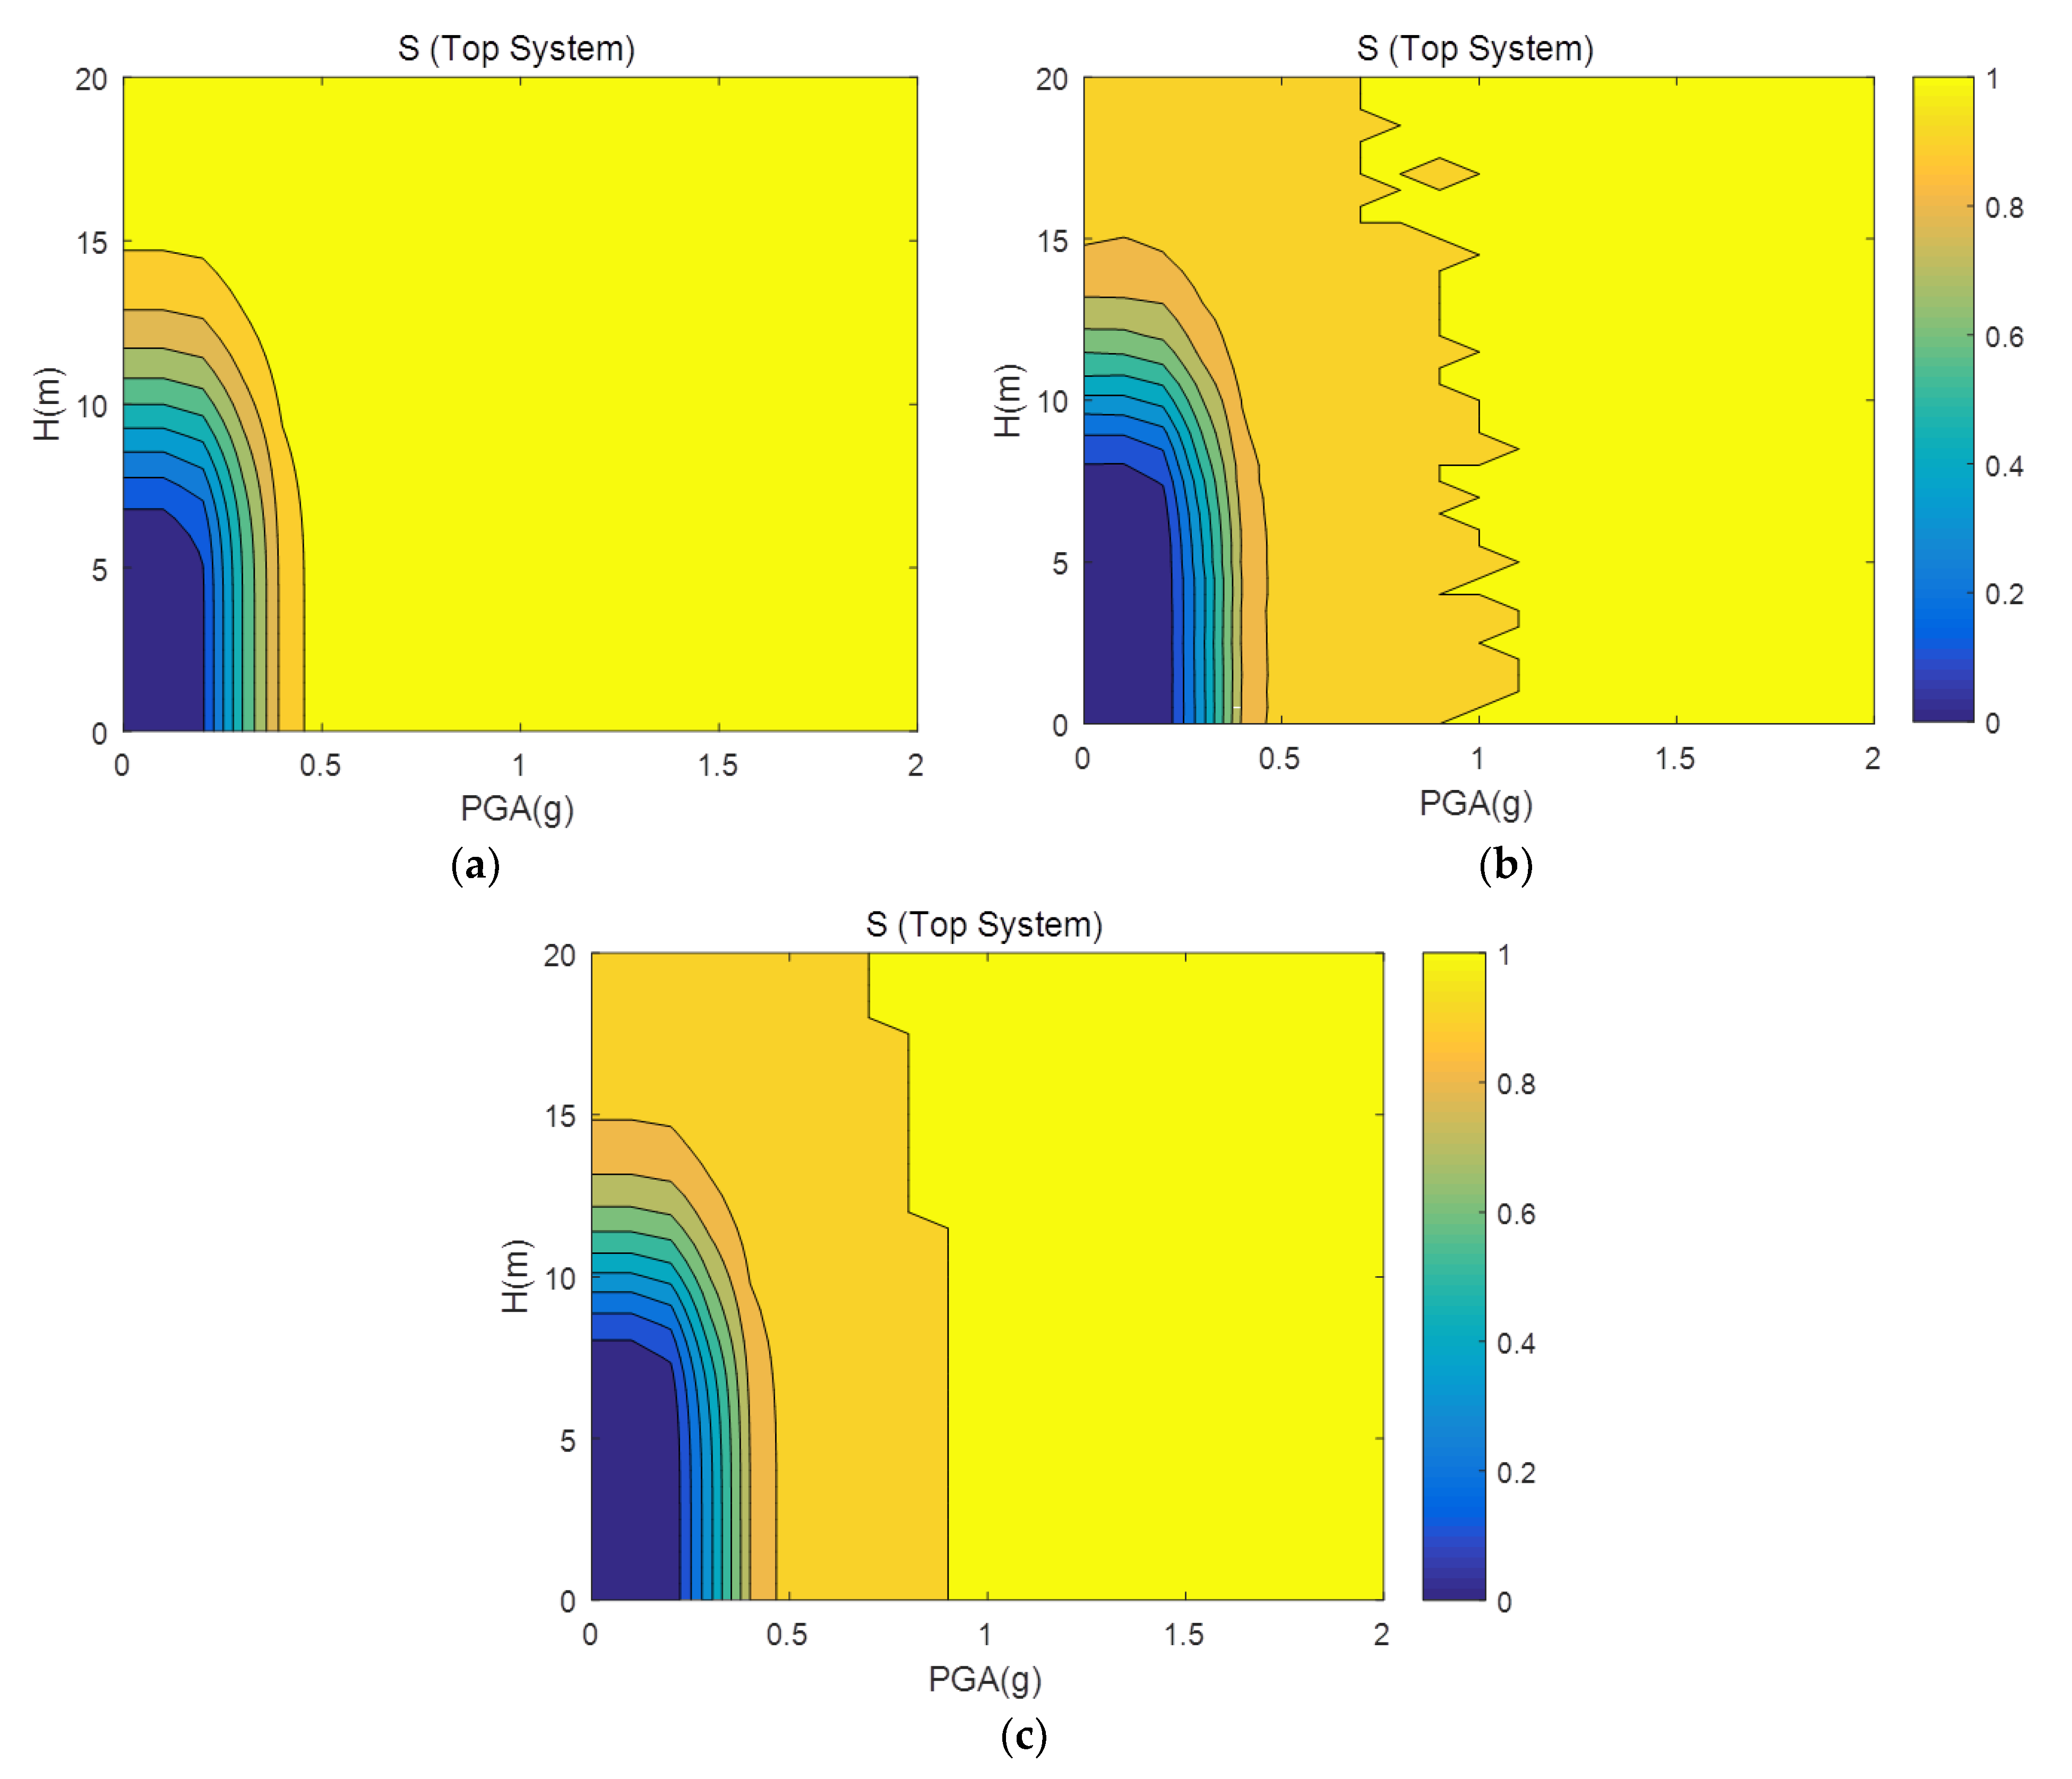
Comparison of multi-hazard system fragility results regarding the example (C1 ∪ C2) ∩ C3 ((1) independent condition): (a) Boolean; (b) E-DQFM; (c) proposed (I-DQFM).
Figure 8.
Comparison of multi-hazard system fragility results regarding the example (C1 ∪ C2) ∩ C3 ((1) independent condition): (a) Boolean; (b) E-DQFM; (c) proposed (I-DQFM).

Figure 9.
Comparison of multi-hazard system fragility results regarding the example (C1 ∪ C2) ∩ C3 ((2) fully dependent condition)): (a) Boolean; (b) E-DQFM; (c) proposed (I-DQFM).
Figure 9.
Comparison of multi-hazard system fragility results regarding the example (C1 ∪ C2) ∩ C3 ((2) fully dependent condition)): (a) Boolean; (b) E-DQFM; (c) proposed (I-DQFM).

Figure 10.
Comparison of multi-hazard system fragility results regarding the example (C1 ∪ C2) ∩ C3 ((3) partially dependent condition): (a) E-DQFM; (b) proposed (I-DQFM).
Figure 10.
Comparison of multi-hazard system fragility results regarding the example (C1 ∪ C2) ∩ C3 ((3) partially dependent condition): (a) E-DQFM; (b) proposed (I-DQFM).

Figure 11.
R2 and RMSE comparison of E-DQFM and proposed method according to the number of samplings “N” regarding (C1 ∪ C2) ∩ C3 example: (a) R2 for independent case; (b) RMSE for independent case; (c) R2 for fully correlated case; (d) RMSE for the fully correlated case.
Figure 11.
R2 and RMSE comparison of E-DQFM and proposed method according to the number of samplings “N” regarding (C1 ∪ C2) ∩ C3 example: (a) R2 for independent case; (b) RMSE for independent case; (c) R2 for fully correlated case; (d) RMSE for the fully correlated case.

Figure 12.
Comparison of mean seismic fragility curves: “LGS NPP CM sequence”.

Figure 13.
Seismic-tsunami multi-hazard surface information.

Figure 14.
Comparison of multi-hazard system fragility results (“CM sequence”) regarding the LGS NPP example ((1) independent condition): (a) Boolean; (b) E-DQFM; (c) proposed (I-DQFM).
Figure 14.
Comparison of multi-hazard system fragility results (“CM sequence”) regarding the LGS NPP example ((1) independent condition): (a) Boolean; (b) E-DQFM; (c) proposed (I-DQFM).

Figure 15.
Comparison of multi-hazard system fragility results (“CM sequence”) regarding the LGS NPP example ((2) fully dependent condition): (a) Boolean; (b) E-DQFM; (c) proposed (I-DQFM).
Figure 15.
Comparison of multi-hazard system fragility results (“CM sequence”) regarding the LGS NPP example ((2) fully dependent condition): (a) Boolean; (b) E-DQFM; (c) proposed (I-DQFM).


Figure 16.
Comparison of multi-hazard system fragility results (“CM sequence”) regarding the LGS NPP example ((3) partially dependent condition): (a) E-DQFM; (b) proposed (I-DQFM).
Figure 16.
Comparison of multi-hazard system fragility results (“CM sequence”) regarding the LGS NPP example ((3) partially dependent condition): (a) E-DQFM; (b) proposed (I-DQFM).

Table 1.
Fragility information of components for an earthquake and a tsunami external hazard event.
| Component | Seismic Event (PGA, g) | Tsunami Event (Height, m) | |||
|---|---|---|---|---|---|
| Ams | βcs | Amt | βct | ||
| C1 | Offsite Power | 0.3 g | 0.3 | 10 m | 0.2 |
| C2 | Essential Service Water | 0.3 g | 0.3 | 10 m | 0.5 |
| C3 | CST | 0.3 g | 0.3 | 10 m | 0.3 |
Table 2.
Comparison results of R2 and RMSE of a multi-hazard system fragility curve obtained from the E-DQFM and the proposed method on example “C1 ∩ C2”.
Table 2.
Comparison results of R2 and RMSE of a multi-hazard system fragility curve obtained from the E-DQFM and the proposed method on example “C1 ∩ C2”.
| Correlation Coefficients | Values and # of Samples | E-DQFM | Proposed (I-DQFM) | ||
|---|---|---|---|---|---|
| R2 | RMSE | R2 | RMSE | ||
| ρ = 0 (Independent) | Values | 0.999963 | 0.001655 | 0.999933 | 0.002248 |
| #of Samples | 1 × 10⁴ (N) × 4 × 21(PGA) × 41(H) | 1 × 10⁴ (N) × 4 | |||
| ρ = 1 (Fully Correlated) | Values | 0.999951 | 0.001717 | 0.999984 | 0.000982 |
| #of Samples | 1 × 10⁴ (N) × 4 × 21(PGA) × 41(H) | 1 × 10⁴ (N) × 4 | |||
Table 3.
Comparison of the results of R2 and RMSE of a multi-hazard system fragility curve obtained from the E-DQFM and the proposed method, for example, “(C1 ∪ C2) ∩ C3”.
Table 3.
Comparison of the results of R2 and RMSE of a multi-hazard system fragility curve obtained from the E-DQFM and the proposed method, for example, “(C1 ∪ C2) ∩ C3”.
| Correlation Coefficients | Values and # of Samples | E-DQFM | Proposed (I-DQFM) | ||
|---|---|---|---|---|---|
| R2 | RMSE | R2 | RMSE | ||
| ρ = 0 (Independent) | Values | 0.999963 | 0.001570 | 0.999991 | 0.000781 |
| #of Samples | 1 × 10⁴ (N) × 4 × 21(PGA) × 41(H) | 1 × 10⁴ (N) × 4 | |||
| ρ = 1 (Fully Correlated) | Values | 0.999963 | 0.001444 | 0.999940 | 0.001841 |
| #of Samples | 1 × 10⁴ (N) × 4 × 21(PGA) × 41(H) | 1 × 10⁴ (N) × 4 | |||
Table 4.
Mean seismic risk for “LGS NPP”: Independent case.
| Sequence | Ellingwood (1990) [10] | Kim et al. (2011) [11] | Boolean Expression (Exact) | E-DQFM (1E4(N) × 2 × 196) | Proposed(I-DQFM) (1E4(N) × 2) | ||||
|---|---|---|---|---|---|---|---|---|---|
| Risk | HCLPF | Risk | HCLPF | Risk | HCLPF | Risk | HCLPF | Risk | |
| TsEsUX | 3.40 × 10⁻⁶ | 0.295 | 3.83 × 10⁻⁶ | 0.29 | 3.84 × 10⁻⁶ | 0.30 | 3.54 × 10⁻⁶ | 0.31 | 3.62 × 10⁻⁶ |
| TsRb | 1.10 × 10⁻⁶ | 0.416 | 1.16 × 10⁻⁶ | 0.41 | 1.14 × 10⁻⁶ | 0.40 | 1.15 × 10⁻⁶ | 0.41 | 1.10 × 10⁻⁶ |
| TsRpv | 4.70 × 10⁻⁷ | 0.546 | 4.65 × 10⁻⁷ | 0.54 | 4.67 × 10⁻⁷ | 0.53 | 4.63 × 10⁻⁷ | 0.54 | 4.60 × 10⁻⁷ |
| TsEsCmC2 | 1.50 × 10⁻⁶ | 0.421 | 1.47 × 10⁻⁶ | 0.42 | 1.47 × 10⁻⁶ | 0.41 | 1.47 × 10⁻⁶ | 0.42 | 1.49 × 10⁻⁶ |
| TsRbCm | 6.00 × 10⁻⁷ | 0.516 | 6.42 × 10⁻⁷ | 0.51 | 6.40 × 10⁻⁷ | 0.51 | 6.42 × 10⁻⁷ | 0.52 | 6.27 × 10⁻⁷ |
| TsEbWm | 1.20 × 10⁻⁷ | - | 1.29 × 10⁻⁷ | - | 1.24 × 10⁻⁷ | - | 1.70 × 10⁻⁷ | - | 9.59 × 10⁻⁸ |
| CM | 5.00 × 10⁻⁶ | 0.281 | 5.40 × 10⁻⁶ | 0.28 | 5.44 × 10⁻⁶ | 0.29 | 5.18 × 10⁻⁶ | 0.29 | 5.16 × 10⁻⁶ |
Table 5.
Mean seismic risk for “LGS NPP”: Fully correlated case.
| Sequence | Boolean Expression (Exact) | E-DQFM (1 E 4(N) × 2 × 196) | Proposed (I-DQFM) (1E4(N) × 2) | |||
|---|---|---|---|---|---|---|
| HCLPF | Risk | HCLPF | Risk | HCLPF | Risk | |
| TsEsUX | 0.35 | 1.76 × 10⁻⁶ | 0.34 | 1.46 × 10⁻⁶ | 0.36 | 1.45 × 10⁻⁶ |
| TsRb | 0.41 | 1.14 × 10⁻⁶ | 0.41 | 1.13 × 10⁻⁶ | 0.4 | 1.20 × 10⁻⁶ |
| TsRpv | 0.54 | 4.67 × 10⁻⁷ | 0.54 | 4.65 × 10⁻⁷ | 0.54 | 4.71 × 10⁻⁷ |
| TsEsCm2C | 0.47 | 8.27 × 10⁻⁷ | 0.48 | 8.27 × 10⁻⁷ | 0.48 | 7.98 × 10⁻⁷ |
| TsRbCm | 0.51 | 6.40 × 10⁻⁷ | 0.52 | 6.38 × 10⁻⁷ | 0.51 | 6.52 × 10⁻⁷ |
| TsEbWm | - | 1.27 × 10⁻⁷ | - | 6.49 × 10⁻⁸ | - | 1.14 × 10⁻⁷ |
| CM | 0.31 | 3.84 × 10⁻⁶ | 0.31 | 3.47 × 10⁻⁶ | 0.31 | 3.57 × 10⁻⁶ |
Table 6.
Multi-hazard component fragility and random failure probability information of the LGS nuclear power plant.
Table 6.
Multi-hazard component fragility and random failure probability information of the LGS nuclear power plant.
| Components | Seismic Event | Tsunami Event | ||||||
|---|---|---|---|---|---|---|---|---|
| Ams (g) | βrs | βus | Amt (m) | βrt | βut | Mean Failure Rate (per yr) | ||
| S1 | Offsite power | 0.2 | 0.2 | 0.25 | 10 | 0.354 | 0.354 | - |
| S2 | Condensate storage tank | 0.24 | 0.23 | 0.31 | 10 | 0.212 | 0.212 | - |
| S3 | Reactor internals | 0.67 | 0.28 | 0.32 | - | - | - | - |
| S4 | Reactor enclosure structure | 1.05 | 0.31 | 0.25 | - | - | - | - |
| S6 | Reactor pressure vessel | 1.25 | 0.28 | 0.22 | - | - | - | - |
| S10 | SLC tank | 1.33 | 0.27 | 0.19 | - | - | - | - |
| S11 | 440-V bus/SG breakers | 1.46 | 0.38 | 0.44 | 11 | 0.212 | 0.212 | - |
| S12 | 440-V bus transformer breaker | 1.49 | 0.36 | 0.43 | 11 | 0.212 | 0.212 | - |
| S13 | 125/250-V DC bus | 1.49 | 0.36 | 0.43 | 11 | 0.212 | 0.212 | - |
| S14 | 4-kV bus/SG | 1.49 | 0.36 | 0.43 | 11 | 0.212 | 0.212 | - |
| S15 | Diesel generator circuit | 1.56 | 0.32 | 0.41 | 11 | 0.212 | 0.212 | - |
| S16 | Diesel generator heat and vent | 1.55 | 0.28 | 0.43 | - | - | - | - |
| S17 | RHR heat exchangers | 1.09 | 0.32 | 0.34 | 10 | 0.212 | 0.212 | - |
| DGR | Diesel generator common mode | - | - | - | - | - | - | 0.00125 |
| WR | Containment heat removal | - | - | - | - | - | - | 0.00026 |
| CR | Scram system mechanical failure | - | - | - | - | - | - | 10−5 |
| SLCR | Standby liquid control | - | - | - | - | - | - | 0.01 |
Table 7.
Mean multi-hazard risk for “LGS NPP”: Independent case.
| Sequence | Risk (/yr) | ||
|---|---|---|---|
| Boolean Expression (Exact) | E-DQFM (1E4 × 4 × 21 × 41) | Proposed (I-DQFM) (1E4 × 4) | |
| TsEsUX | 7.40 × 10⁻⁶ | 7.38 × 10⁻⁶ | 7.29 × 10⁻⁶ |
| TsRb | 1.04 × 10⁻⁶ | 1.05 × 10⁻⁶ | 1.02 × 10⁻⁶ |
| TsRpv | 4.10 × 10⁻⁷ | 4.11 × 10⁻⁷ | 4.11 × 10⁻⁷ |
| TsEsCmC2 | 1.41 × 10⁻⁶ | 1.41 × 10⁻⁶ | 1.35 × 10⁻⁶ |
| TsRbCm | 5.83 × 10⁻⁷ | 5.85 × 10⁻⁷ | 5.72 × 10⁻⁷ |
| TsEbWm | 7.14 × 10⁻⁷ | 7.47 × 10⁻⁷ | 7.31 × 10⁻⁷ |
| CM | 9.62 × 10⁻⁶ | 9.65 × 10⁻⁶ | 9.59 × 10⁻⁶ |
Table 8.
Mean multi-hazard risk for “LGS NPP”: Fully correlated case.
| Sequence | Risk (/yr) | ||
|---|---|---|---|
| Boolean Expression (Exact) | E-DQFM (1E4 × 4 × 21 × 41) | Proposed (I-DQFM) (1E4 × 4) | |
| TsEsUX | 3.66 × 10⁻⁶ | 3.60 × 10⁻⁶ | 3.58 × 10⁻⁶ |
| TsRb | 1.04 × 10⁻⁶ | 1.04 × 10⁻⁶ | 1.02 × 10⁻⁶ |
| TsRpv | 4.10 × 10⁻⁷ | 4.09 × 10⁻⁷ | 4.28 × 10⁻⁷ |
| TsEsCmC2 | 7.59 × 10⁻⁷ | 7.49 × 10⁻⁷ | 8.01 × 10⁻⁷ |
| TsRbCm | 5.83 × 10⁻⁷ | 5.84 × 10⁻⁷ | 5.81 × 10⁻⁷ |
| TsEbWm | 9.80 × 10⁻⁷ | 1.03 × 10⁻⁶ | 1.02 × 10⁻⁶ |
| CM | 6.79 × 10⁻⁶ | 6.77 × 10⁻⁶ | 6.77 × 10⁻⁶ |
Table 9.
Mean multi-hazard risk for “LGS NPP”: Partially correlated case.
| Sequence | Risk (/yr) | |
|---|---|---|
| E-DQFM (1E4 × 4 × 21 × 41) | Proposed (I-DQFM) (1E4 × 4) | |
| TsEsUX | 5.53 × 10⁻⁶ | 5.47 × 10⁻⁶ |
| TsRb | 1.04 × 10⁻⁶ | 1.04 × 10⁻⁶ |
| TsRpv | 4.07 × 10⁻⁷ | 3.96 × 10⁻⁷ |
| TsEsCmC2 | 1.11 × 10⁻⁶ | 1.08 × 10⁻⁶ |
| TsRbCm | 5.79 × 10⁻⁷ | 5.81 × 10⁻⁷ |
| TsEbWm | 7.96 × 10⁻⁷ | 8.21 × 10⁻⁷ |
| CM | 8.14 × 10⁻⁶ | 8.11 × 10⁻⁶ |
© 2019 by the authors. Licensee MDPI, Basel, Switzerland. This article is an open access article distributed under the terms and conditions of the Creative Commons Attribution (CC BY) license (http://creativecommons.org/licenses/by/4.0/).
Share and Cite
MDPI and ACS Style
Kwag, S.; Ha, J.G.; Kim, M.K.; Kim, J.H. Development of Efficient External Multi-Hazard Risk Quantification Methodology for Nuclear Facilities. Energies 2019, 12, 3925. https://doi.org/10.3390/en12203925
AMA Style
Kwag S, Ha JG, Kim MK, Kim JH. Development of Efficient External Multi-Hazard Risk Quantification Methodology for Nuclear Facilities. Energies. 2019; 12(20):3925. https://doi.org/10.3390/en12203925
Chicago/Turabian StyleKwag, Shinyoung, Jeong Gon Ha, Min Kyu Kim, and Jung Han Kim. 2019. "Development of Efficient External Multi-Hazard Risk Quantification Methodology for Nuclear Facilities" Energies 12, no. 20: 3925. https://doi.org/10.3390/en12203925
Note that from the first issue of 2016, this journal uses article numbers instead of page numbers. See further details here.