Application of Non-Thermal Plasma for NOx Reduction in the Flue Gases
by
 ,
,
Rolandas Paulauskas
1,*, 
Indrek Jõgi
2,
Nerijus Striūgas
3,
Dainius Martuzevičius
1,
Kalev Erme
2,
Jüri Raud
2 and
Martynas Tichonovas
1 1
Faculty of Chemical Technology, Kaunas University of Technology, Radvilenu road 19, LT50254 Kaunas, Lithuania
2
Laboratory of Plasma Physics, Institute of Physics, University of Tartu, W. Ostwaldi st. 1, 50411 Tartu, Estonia
3
Laboratory of Combustion Processes, Lithuanian Energy Institute, Breslaujos st. 3, LT44403 Kaunas, Lithuania
*
Author to whom correspondence should be addressed.
Energies 2019, 12(20), 3955; https://doi.org/10.3390/en12203955
Submission received: 16 September 2019
/
Revised: 14 October 2019
/
Accepted: 16 October 2019
/
Published: 17 October 2019
Abstract
:Over the years, ever more stringent requirements on the pollutant emissions, especially NOX, from combustion systems burning natural gas are introduced by the European Union (EU). Among all NOX reduction methods, the flue gas treatment by plasma is widely applied and could be used for both small scale and domestic combustion systems. However, the removal efficiency depends on concentrations of oxygen, water vapor, traces of hydrocarbons, and nitrogen oxides in flue gas. In order to analyze the application of the NOX reduction for small-scale or domestic combustion systems, experiments of NOX reduction by non-thermal plasma from real flue gases originating from premixed methane combustion at different equivalence ratio (ER) values were performed. It was determined that the residual oxygen in flue gas plays an important role for improvement of NO to NO2 oxidation efficiency when O2 concentrations are equal to or higher than 6%. The power consumption for the plasma oxidation constituted approximately 1% of the burner power. In the case of ozone treatment, the addition of O3 to flue gas showed even more promising results as NO formed during combustion was fully oxidized to NO2 at all ER values.
1. Introduction
Even though the substitution of fossil fuels with renewable energy sources is going in the right direction, natural gas consumption for heat and power production is still increasing and has grown by 3% over the last year [1]. Natural gas is considered a relatively clean fuel compared to other types of fossil fuels and more efficient and reliable than the renewable energy sources [2]. Nonetheless, the usage of natural gas still leads to emissions of hazardous pollutants to the atmosphere. During combustion of these gases, nitrogen oxides NOX (NO and NO2) are produced that have negative impacts on human health and cause environmental problems such as acid rain, photochemical smog and ozone layer depletion [3,4,5]. Due to these problems, the European Union is tightening the requirements of environmental protection and requires to increase the energy efficiency and to find a way to reduce NOX emissions from combustion systems using natural gas [6]. One of the alternatives to address this issue is to use lean combustion. In this way, emissions of NOX are reduced due to lower combustion temperature, which in turn depends on the air-fuel ratio. This method is mostly used for gas turbines [7], however, it is difficult to implement in gas burners presently used in industrial and domestic combustion systems. The lean combustion could lead to flame extinction or instability, vibrations, reduced combustion efficiency and equipment longevity [8,9,10]. Taking into account these disadvantages, another solution for NOX reduction is removal of these pollutants from flue gas in exhaust. It is usually achieved by selective catalytic reduction, wet absorption or storage by adsorption [11,12,13]. In the case of catalytic reduction, the nitrogen oxides are reduced to nitrogen and oxygen. During absorption, the nitrogen oxides are absorbed into liquids where they are reduced by certain reducing agents or used as nitric acid. Both NOX removal routes suffer from poor adsorption and absorption of NO which is the main constituent of NOX [11]. This problem can be solved by oxidizing NO to NO2 or further to N2O5. The oxidation to NO2 improves the efficiency of the catalytic reduction at low temperatures [14,15,16] while the oxidation to N2O5 is beneficial for the absorption of nitrogen oxides [17,18]. It is achieved using non-thermal plasma, which in most cases is generated using a corona discharge or a dielectric barrier discharge device [11,14,15,16,19,20]. Besides, the non-thermal plasma has showed promising results in the field of human health protection by using non-thermal plasma for disinfection [21,22] and the environment by improving air and water quality [23,24,25,26]. Moreover, plasma was applied to remove NOX from real flue gases of power plants and diesel engines [17,18,27] or synthetic flue gases representing certain types of real flue gas [14,15,16,28,29,30,31]. Most often, the used gases represent exhausts from diesel engines or coal power plants which contain relatively large concentrations of nitrogen oxides and hydrocarbons. In the case of natural gas combustion, the NOX concentrations are relatively small (≤200 ppm) and the hydrocarbon content is avoided as the industrial and the domestic combustion systems are working with excess of air.
The excess of air results in changes of flue gas composition which in turn influences the effect of plasma. At very low O2 fraction, plasma may directly remove NOX by reducing NO to N2 and O2 [32,33,34]. The increase of oxygen content above 3–5% in gas mixture reduces the NOX conversion efficiency and even increases NOX generation in the NOX treatment device [34,35]. At these conditions, the main plasma effect is the conversion of NO to NO2 which is desirable for removal methods based on adsorption and absorption. It has been shown that the direct plasma oxidation becomes inefficient at NOX concentrations above 200–300 ppm [20]. The presence of water may improve the NOX removal [36,37] by converting NO2 to HNO2 and HNO3 [32,36,38]. Efficiency of NO conversion to NO2 and NOX removal may be further increased in the presence of hydrocarbons [28,29,30,31]. Another possibility to improve the NOX oxidation efficiency at high NOX concentrations is to use ozone instead of the direct plasma oxidation [20]. At the same time, both direct plasma and ozone oxidation resulted in comparable efficiencies at low NOX and high O2 concentration [39] whereas the direct plasma oxidation may further benefit from the presence of hydrocarbons [39]. The change in gas composition due to the variation of air equivalence ratio makes the prediction of the NOX oxidation efficiency even more complicated.
Reviewed works show that the flue gas treatment by plasma has a wide applicability and has been tested in areas ranging from industrial purposes to automotive applications. However, there is a gap of information on application of the NOX reduction by plasma for small scale combustion systems. Among these systems, gas boilers are widely used as domestic devices for heating and supplying hot water in Europe [40,41]. Moreover, the production of biogas, whose main component is CH4, is increasing as well and usage of these types of gases may lead to proliferation of small scale combustion systems resulting in increased emissions [42]. In this case, to reduce pollutant emissions to the environment, the treatment by plasma could be also adapted for such combustion systems, but it requires a deeper knowledge on the removal efficiency as it depends on the concentrations of oxygen, water vapor, traces of hydrocarbons and nitrogen oxides in the flue gas.
Due to these reasons, the present study was carried out in order to investigate the NOX removal from real flue gases originating from methane combustion with excess of air and expand the knowledge on the NOX treatment by plasma for small scale combustion systems. For a deeper knowledge on the NOX reduction effect due to the flue gas composition, the direct plasma oxidation and the ozone oxidation were investigated. Furthermore, the effect of catalyst was studied to improve the oxidation of NO2 to N2O5 by ozone.
2. Materials and Methods
Description of Combustion and NOX Removal System
In order to investigate the NOX removal efficiency from flue gases, the experimental setup was prepared as presented in Figure 1.
The combustion rig was constructed from a specially designed premixed air–gas burner with a mesh-type nozzle (2) and a closed combustion chamber (1) made of a 60 cm high and 8.2 cm diameter quartz glass tube. For combustion, methane from a gas cylinder (99.6% purity) and air from the compressed air system located in the research facility were used. Flow of air and methane was controlled by flow meters (3) (an operating range for air and methane was 30 L/min and 10 L/min, respectively, with an error of 2% at full scale) and supplied to the premixing chamber via steel pipes. The burner was operated at different air equivalence ratios ranging from 0.8 to 1.4 in increments of 0.2 to recreate the combustion conditions used in small scale combustion systems [43,44]. The inlet parameters for fuel and air flows are given in Table 1.
At the exit of the combustion chamber, a suction probe (4) with the diameter of 8 mm was inserted at a 30 cm distance from the burner nozzle and a rotary vane pump (5) was used to collect flue gas from the combustion chamber. The suction flow rate of 3.2 L/min was set by a flow meter and flue gas were supplied through a condensation unit (6) to the NOX removal system for treatment. The condensation unit was used to avoid the clogging of the flow controller due to water vapour condensation inside. Further, flue gas was treated by three separate methods: A—the direct plasma treatment, B—the ozone treatment and C—the ozone treatment with TiO2 catalyst (see Figure 1). In all cases, three experiments were conducted at each point to reduce uncertainty.
- In the case of direct plasma treatment, the exhaust gas flow was directed through a volume barrier discharge (VBD) device (8) of a coaxial design (see Figure 1 section A). The inner high-voltage electrode was a stainless steel tube with the outer diameter of 14 mm, the dielectric barrier was made from a quartz tube with the inner diameter of 16.3 mm and the outer grounded electrode was a steel mesh wrapped around the quartz tube. The length of the active zone was 8.5 cm. The high voltage was provided by a signal generator amplified by an Industrial Test Equipment Co power amplifier and a transformer. The frequency of the voltage varied from 80 Hz to 500 Hz. The specific input energy (SIE) of plasma was obtained by dividing the plasma input power determined by the method of Lissajous figures [45,46] by the flow rate of the gas. Besides, during the direct plasma treatment, the VBD device was heated by a wire heater to 60 °C to avoid the condensation of water vapor on dielectric surfaces. The condensed water could result in resistive losses which interferes with the input power measurement from the Lissajous figures. The temperature in the discharge reactor was measured by an Osensa Innovations fiber–optical sensor FTX-100-Gen.
- In the case of ozone treatment, ozone was produced from pure oxygen (99.999% of purity) with a flow rate of 0.5 L/min in the VBD device and the produced ozone flow was then mixed with the exhaust gas flow (see Figure 1 section B). Whereas, the flue gas was not supplied through the plasma, the VBD device was not heated in this experiment. The SIE was calculated by dividing the plasma input power by the flow rate of exhaust gas flow. The ozone concentration injected into the flue gas was obtained from the SIE by measuring the ozone production in absence of the flue gas.
- In the case of ozone treatment with a TiO2 catalyst, an additional reaction chamber was placed downstream from the mixing point of flue gas and ozone (see Figure 1 section C). The dimensions of the reaction chamber were similar to those of the VBD device. Degussa P25 TiO2 nanopowder with the mass of 0.5 g was pressed on the inner surface of the reactor chamber. The catalytic reactor was placed into the electrically heated oven and the reactor temperature was kept at 100 °C during the experiments. The temperature in the reactor was measured by the Osensa Innovations fiber–optical sensor FTX-100-gen. Additional ozone treatment experiments without the presence of catalyst were also carried out in this configuration for direct comparison of the effect of catalyst.
The gas composition after the direct and indirect plasma treatment was determined by IR absorption and UV absorption. The IR absorption spectra were registered by an IR absorption cell with the length of 18 cm placed into an Interspec 2020 FTIR spectrometer. The average of 10 spectra (collection time of two minutes) was used to measure CO2, CO and trace amounts of nitrogen oxides. The UV absorption spectra were registered with an UV absorption cell (24 cm length) placed between Hamamatsu L2D2 deuterium lamp used as the UV source and Ocean Optics USB4000 spectrometer used to collect the spectra. The UV absorption cell was heated to 60 °C to decrease the condensation of water vapor and nitrogen acids on the quartz windows. The UV absorption spectra were used to determine the concentrations of NO and NO2 according to the methodology described in earlier studies [47,48].
3. Results and Discussions
3.1. Emissions from Methane Combustion
In order to analyze the efficiency of NOX removal from flue gases, experiments were performed at rich, normal and lean combustion regimes. Besides, the lean combustion was achieved at two air equivalence ratio values (1.2 and 1.4), which in most cases are used in atmospheric combustion systems [43,49]. The flame images obtained at different equivalence ratio (ER) values are presented in Figure 2.
Before starting the experiments with NOX treatment, initial emissions of CO, CO2, NO and NO2 were measured at every point of ER. The intensities of CO2 and CO in FTIR spectra at different ER values are shown in Figure 3a. These intensities allow us to compare the amount of CO2 in the flue gas because they are proportional to CO2 concentrations. The highest CO2 concentration in the flue gas was obtained at the ER value of 1. This result was expected because the methane flow was kept constant and only an air flow was changed at different ER values (see Table 1). At the rich combustion regime, CO2 concentrations are lower compared to the ER point of 1.0 due to incomplete combustion of methane. This is indicated by the detection of a considerable amount of CO. Increasing the amount of combustible air results in a rapidly decreasing concentration of CO molecules as there is sufficient oxygen to fully oxidize the carbon atoms and to form CO2. At ER ≥ 1, air begins to dilute flue gas causing the CO2 concentration to drop (see Figure 3a).
The concentrations of NO and NO2 at different ER values are shown in Figure 3b. At the rich combustion condition (ER = 0.8) an average concentration of NO was 37 ppm due to a low concentration of oxygen atoms [50]. The highest concentrations of NO were determined at ER values of 1.0 and 1.2. The increased amount of air reduced the flame temperature and concentrations of NO decreased to 27 ppm at ER point of 1.4. NO2 concentrations increased with increasing ER values (Figure 3b) as NO was oxidized to NO2 by the oxygen atoms in the flue gas [51].
3.2. Direct Plasma Treatment
The results obtained by using the direct plasma method for the flue gas treatment are presented in Figure 4. It indicates the removal of NO and the formation of NO2. The produced NO2 concentration was practically equal to that of the removed NO at ER values above 1, whereas at ER values below 1, the produced NO2 concentration was approximately 60% of the removed NO concentration. The produced NO2 can be attributed to NO oxidation by O radicals and O3 [21]. In the case of ER = 0.8, the residual amount of NO was either oxidized to HNO2 by OH radicals or reduced to N2 and O2. UV absorption and IR spectra showed no traces of HNO2 or HNO3 which suggests that an additional NO removal was caused by the reduction. At ER value 1.4, some NO was oxidized to NO2 even when the plasma reactor was not working. It explains the higher final NO2 concentration compared to the inlet NO concentration. The plasma may also produce additional NOX and N2O but this effect of plasma remains small at the used SIE values [52].
At all ER values, the 90% removal of NO was achieved at specific input energy (SIE) values below 30 J/L keeping the same heat output of the burner (0.56 kW). The power input required for removal of NO should be only a small fraction of the power of the burner heat output. At lean combustion conditions, the highest efficiency of NO removal was reached at SIE values of 21 J/L and 10 J/L respectively at ER point of 1.2 and 1.4 (see Figure 4). Moreover, the obtained results show that an increased oxygen content in the flue gas leads to decreased demand of the plasma power, but at ER value of 1.4, the flame is lifted up and less stable (see Figure 2). The SIE values 10–20 J/L multiplied by the total gas flow in the burner 9–14 L/min gives an estimate of the power which is required to oxidize NO in the exhaust gas to NO2. The required power remained below 5 W which is less than 1% of the power obtained from the methane burning.
The efficiency of NO removal was further evaluated by assuming the residual amount to be an exponential function
where NO0 is the inlet concentration of NO and kE is the removal rate which characterizes the efficiency of NO removal process [53,54,55]. According to Jõgi et al. [20], the exponential function is applicable for the fitting of NO oxidation when the back-reaction of NO2 to NO by O radicals limits the oxidation of NO to NO2.
Fitting by the exponential function (1) was reasonably good at lower ER values while at the highest ER value, the linear function could also be used. In this case, the NOX concentration was lower, while the production efficiency of O radicals and ozone was higher which reduced the importance of back-reaction [20] and made the dependence between NO oxidation and SIE linear [36]. The kE can be obtained by plotting ln(NO0/NO) as a function of SIE. The value of kE as a function of ER is shown in Figure 5.
The smallest value (0.09 L/J) of kE was obtained at stoichiometric ER. An increment of the combustion air amount led to increase of the removal rate kE to 0.123 L/J and to 0.156 L/J at ER values 1.2 and 1.4, respectively. The increase of kE at higher ER values can be explained by the increased oxygen concentration which improves the production of oxygen radicals and ozone responsible for NO oxidation to NO2 [56,57]. The oxygen concentration further decreased at ER values below 1 where the importance of an oxidative removal channel also clearly decreased. At the same time, the N radical production increases at very low oxygen concentration [32] which can explain the increase of kE value and is consistent with the experimentally observed smaller fraction of NO oxidized to NO2. A possible explanation for the increased oxidation efficiency at the lowest ER value is the presence of hydrocarbons which is known to enhance the oxidation of NO to NO2 [58].
3.3. Ozone Treatment
The back-reaction of NO2 to NO by O radicals limits the oxidation efficiency in the direct plasma treatment and this reaction can be avoided when only ozone reaches the flue gas. The concentrations of NO and NO2 as functions of SIE during the indirect ozone treatment are shown in Figure 6 for different ER values. It should be noted that in these experiments the initial values of NO concentrations were somewhat smaller due to the dilution by 0.5 L/min of O2. The removal of NO and production of NO2 was a linear function of SIE up to the point where all NO was removed and NO2 concentration achieved the value (40 ppm) of inlet NO concentration. At higher SIE values, the NO2 concentration remained practically constant while ozone appeared in the outlet and the concentration of ozone increased proportionally to the SIE. The oxidation of NO to NO2 did not depend on the air ER and was solely a function of ozone production. Furthermore, the oxidation of NO was achieved at an order of magnitude lower input energy values than in the case of direct plasma treatment. The efficiency of NO oxidation to NO2 was calculated from the slope of linear fit of experimental results shown in Figure 6 and taking into account the dilution of exhaust gas by 0.5 L/min of O2. The efficiency was 25 ppm of NO per (J/L) which is comparable to the ozone production efficiency of 30 ppm of O3 per (J/L) of the same device [52]. It should be noted that this efficiency was achieved by using pure oxygen. The ozone production efficiencies in dry air are two to three times lower [52]. Nevertheless, the NO oxidation efficiency by ozone produced from dry air would still be higher than the NO oxidation efficiency by plasma.
These results show that in the case of ozone treatment, NO is oxidized to NO2 by O3: NO + O3 → NO2 + O2. This reaction is relatively fast occurring in a sub second time-scale. As a consequence, all produced ozone was effectively consumed by the oxidation of NO until all NO was oxidized to NO2. At even higher inlet ozone concentrations, the produced NO2 can be oxidized to N2O5 by the reactions NO2 + O3 → NO3 + O2 and NO2 + NO3 + M → N2O5. The oxidation of NO2 to N2O5 is slow and takes tens of seconds to occur which explains the practically constant NO2 concentration and linearly increasing ozone concentration at higher SIE values. The removal rate did not depend on the ER ratio because ozone was produced from pure oxygen independently of the flue gas composition.
3.4. Ozone Treatment with TiO2 Catalyst
The possibility to improve the oxidation of NO2 to N2O5 was further investigated by including TiO2 catalyst in the reaction zone containing ozone. The reaction chamber was heated to 100 °C because earlier experiments have shown that the catalyst is most efficient at these conditions [59]. Besides, the ozone oxidation also improves at higher temperatures [59] and the results obtained in the presence of catalyst were compared to those obtained in the absence of the catalyst in the same conditions. It should be noted that the catalyst alone had no detectable effect on the NO concentration.
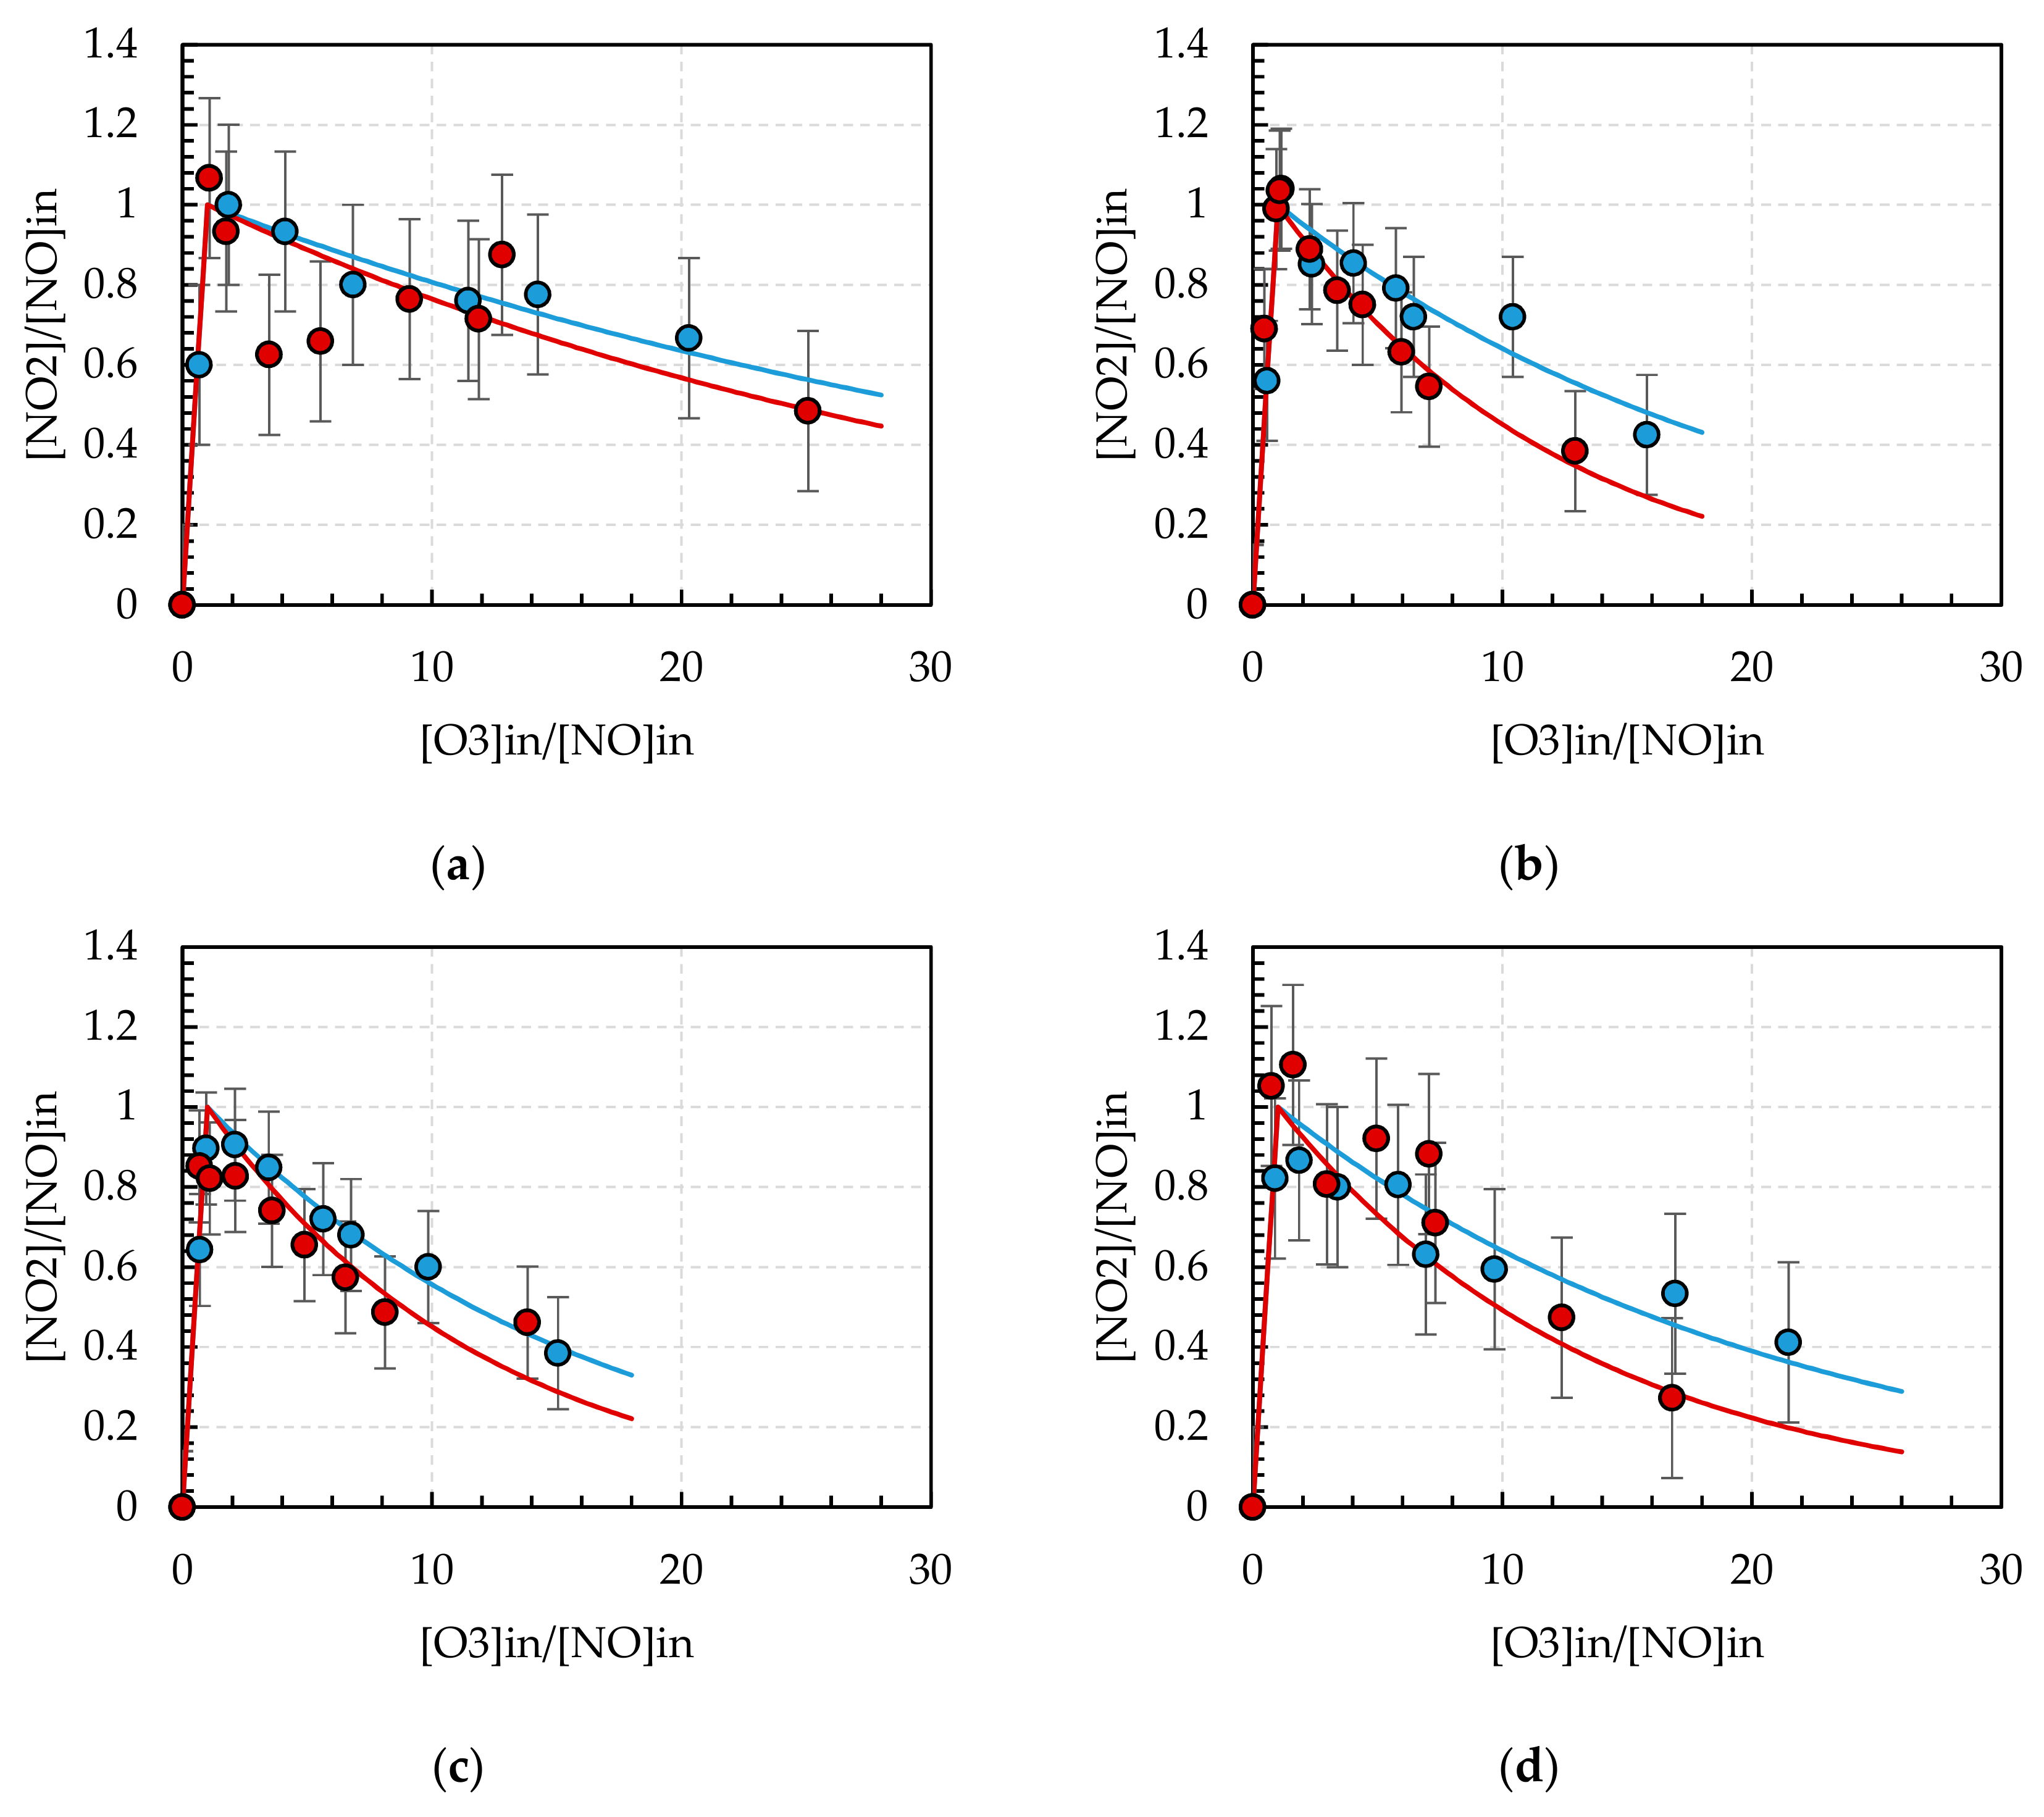
The relative concentration of NO2, [NO2]/[NO]in, as a function of relative inlet ozone concentration, [O3]in/[NO]in, during the indirect ozone treatment in presence and the absence of catalyst is shown in Figure 7 for different ER values. The removal of NO2 was slightly more efficient in the presence of catalyst but the improvement remained within the limits of uncertainty. The removal of NO2 can be attributed to the oxidation to N2O5 which subsequently further reacted with H2O to form HNO3. Traces of HNO3 were also observed in the FTIR spectra but the concentrations were too low for quantitative analysis.
The results were fitted by formula derived for the NO2 oxidation by ozone in dry mixtures of oxygen and nitrogen [20]:
where k is an efficient reaction rate coefficient and τ is the residence time.
According to Equation (2), the removal of NO2 should be less efficient at lower initial NO concentrations and this was also observed in experiments. The catalyst increased the reaction rate k by 10-50%, but the differences remained within the uncertainty of the measurements. Our earlier measurements have demonstrated 2–3 times higher removal efficiency in the presence of TiO2 catalyst [20,59] but these results were obtained in the dry mixtures and at considerably higher NOx concentrations. It is possible that water vapor, CO2, CO or trace amounts of unburned hydrocarbons (only at ER = 0.8) block some of the active sites on the surface and decrease the efficiency of catalyst.
4. Conclusions
The present study was carried out to investigate NOx removal from real flue gas originating from the methane combustion at different ER values using the direct plasma treatment, the ozone treatment and the ozone treatment in the presence of TiO2 catalyst. It was determined that the residual oxygen in the flue gas plays an important role for NO to NO2 oxidation by the direct plasma treatment when O2 concentrations are equal or higher than 6%. At lower O2 concentrations, the NO removal efficiency increases due to the growing importance of other processes. In the case of ozone treatment, addition of O3 to flue gas showed promising results as NO formed during combustion was fully oxidized to NO2 at all ER values. Besides, the ER value had no influence on the NO oxidation efficiency which was determined solely by the ozone production efficiency of the barrier discharge device. However, the efficiency of ozone oxidation of NO2 to N2O5 remained low.
The NO2 oxidation using TiO2 catalyst was higher than in case of ozone but as in the previous case, the effect remained still low. It is considered that supply of low temperature flue gases caused a poor catalytic effect because water vapor, CO2 or unburned hydrocarbons (at ER 0.8) accumulated on the active sites of the catalyst surface.
It was calculated that the NO treatment by plasma for the combustion setup used here consumes only 1% of the total generated power if all the exhaust gas is supplied through the plasma reactor. In the case of ozone treatment, the efficiency is even higher. This also results in a higher economic feasibility of the ozone treatment. The ozone treatment is also more straightforward from the engineering point of view. Ozone is produced by separate DBD based ozonizers and the produced ozone is injected into flue gas. This allows to circumvent the problems related to the condensation of water vapor on the reactor walls and high back-pressure in the case of very high flue gas flow rates.
Author Contributions
R.P.: conceptualization, investigation, methodology, writing—original draft; I.J.: investigation, methodology, software, writing—review and editing; N.S.: data curation, writing—review and editing; D.M.: funding acquisition, project administration, supervision; K.E.: formal analysis, investigation; J.R.: investigation, visualization; M.T.: formal analysis, visualization.
Funding
This project has received funding from European Social Fund (project No 09.3.3-LMT-K-712-02-0168) under grant agreement with the Research Council of Lithuania (LMTLT) and from Estonian Research Council grant no. 585.
Conflicts of Interest
The authors declare no conflict of interest.
References
- Market Observatory for Energy. Quarterly Report Energy on European Gas Markets Market Observatory for Energy DG Energy; European Commission: Brussels, Belgium, 2017; Volume 10. [Google Scholar]
- Aydin, M. Natural gas consumption and economic growth nexus for top 10 natural Gas-Consuming countries: A granger causality analysis in the frequency domain. Energy 2018, 165, 179–186. [Google Scholar] [CrossRef]
- Hill, S.; Douglas Smoot, L. Modeling of nitrogen oxides formation and destruction in combustion systems. Prog. Energy Combust. Sci. 2000, 26, 417–458. [Google Scholar] [CrossRef]
- Boningari, T.; Smirniotis, P.G. Impact of nitrogen oxides on the environment and human health: Mn-based materials for the NOxabatement. Curr. Opin. Chem. Eng. 2016, 13, 133–141. [Google Scholar] [CrossRef]
- Pillier, L.; Idir, M.; Molet, J.; Matynia, A.; De Persis, S. Experimental study and modelling of NOx formation in high pressure counter-flow premixed CH4/air flames. Fuel 2015, 150, 394–407. [Google Scholar] [CrossRef]
- U.S. Energy Information Administration. International Energy Outlook 2016; U.S. Energy Information Administration: Washington, DC, USA, 2016; Volume 0484(2016), ISBN 2025866135.
- McDonell, V. Lean Combustion in Gas Turbines. Lean Combust. 2008, 121-IV. [Google Scholar] [CrossRef]
- Huang, Y.; Yang, V. Dynamics and stability of lean-premixed swirl-stabilized combustion. Prog. Energy Combust. Sci. 2009, 35, 293–364. [Google Scholar] [CrossRef]
- Nair, S.; Lieuwen, T. Acoustic Detection of Blowout in Premixed Flames. J. Propuls. Power 2005, 21, 32–39. [Google Scholar] [CrossRef]
- Abbott, D.J.; Bowers, J.P.; James, S.R. The Impact of Natural Gas Composition Variations on the Operation of Gas Turbines for Power Generation. In Proceedings of the 6th International Conference on the Future of Gas Turbine Technology, Brussels, Belgium, 17–18 October 2012. [Google Scholar]
- Skalska, K.; Miller, J.S.; Ledakowicz, S. Trends in NOxabatement: A review. Sci. Total Environ. 2010, 408, 3976–3989. [Google Scholar] [CrossRef]
- Zhou, H.; Su, Y.; Liao, W.; Deng, W.; Zhong, F. NO reduction by propane over monolithic cordierite-based Fe/Al2O3catalyst: Reaction mechanism and effect of H2O/SO2. Fuel 2016, 182, 352–360. [Google Scholar] [CrossRef]
- Brandenberger, S.; Kröcher, O.; Tissler, A.; Althoff, R. The State of the Art in Selective Catalytic Reduction of NOx by Ammonia Using Metal-Exchanged Zeolite Catalysts. Catal. Rev. 2008, 50, 492–531. [Google Scholar] [CrossRef]
- Mok, Y.S.; Koh, D.J.; Shin, D.N.; Kim, K.T. Reduction of nitrogen oxides from simulated exhaust gas by using plasma–catalytic process. Fuel Process. Technol. 2004, 86, 303–317. [Google Scholar] [CrossRef]
- Mok, Y.S.; Koh, D.J.; Kim, K.T.; Nam, I.-S. Nonthermal Plasma-Enhanced Catalytic Removal of Nitrogen Oxides over V2O5/TiO2 and Cr2O3/TiO2. Ind. Eng. Chem. Res. 2003, 42, 2960–2967. [Google Scholar] [CrossRef]
- Sun Mok, Y.; Young Yoon, E. Effect of ozone injection on the catalytic reduction of nitrogen oxides. Ozone Sci. Eng. 2006, 28, 105–110. [Google Scholar] [CrossRef]
- Stamate, E.; Chen, W.; Jørgensen, L.; Jensen, T.K.; Fateev, A.; Michelsen, P. IR and UV gas absorption measurements during NOx reduction on an industrial natural gas fired power plant. Fuel 2010, 89, 978–985. [Google Scholar] [CrossRef]
- Jakubiak, M.P.; Kordylewski, W.K. Pilot-Scale studies on nox removal from flue gas via no ozonation and absorption into naoh solution. Chem. Process Eng. 2012, 33, 345–358. [Google Scholar] [CrossRef]
- Talebizadeh, P.; Babaie, M.; Brown, R.; Rahimzadeh, H.; Ristovski, Z.; Arai, M. The role of non-thermal plasma technique in NOxtreatment: A review. Renew. Sustain. Energy Rev. 2014, 40, 886–901. [Google Scholar] [CrossRef]
- Jõgi, I.; Erme, K.; Levoll, E.; Raud, J.; Stamate, E. Plasma and catalyst for the oxidation of NOx. Plasma Sources Sci. Technol. 2018, 27, 035001. [Google Scholar] [CrossRef]
- Scholtz, V.; Pazlarova, J.; Souskova, H.; Khun, J.; Julak, J. Nonthermal plasma—A tool for decontamination and disinfection. Biotechnol. Adv. 2015, 33, 1108–1119. [Google Scholar] [CrossRef]
- Belgacem, Z.B.; Carre, G.; Charpentier, E.; Le-Bras, F.; Maho, T.; Robert, E.; Pouvesle, J.M.; Polidor, F.; Gangloff, S.C.; Boudifa, M.; et al. Innovative non-thermal plasma disinfection process inside sealed bags: Assessment of bactericidal and sporicidal effectiveness in regard to current sterilization norms. PLoS ONE 2017, 12, e0180183. [Google Scholar] [CrossRef]
- Krugly, E.; Martuzevicius, D.; Tichonovas, M.; Jankunaite, D.; Rumskaite, I.; Sedlina, J.; Racys, V.; Baltrusaitis, J. Decomposition of 2-naphthol in water using a non-thermal plasma reactor. Chem. Eng. J. 2015, 260, 188–198. [Google Scholar] [CrossRef]
- Holzer, F.; Kopinke, F.-D.; Roland, U. Non-thermal plasma treatment for the elimination of odorous compounds from exhaust air from cooking processes. Chem. Eng. J. 2018, 334, 1988–1995. [Google Scholar] [CrossRef]
- Mitrović, T.; Lazović, S.; Nastasijević, B.; Pašti, I.A.; Vasić, V.; Lazarević-Pašti, T. Non-thermal plasma needle as an effective tool in dimethoate removal from water. J. Environ. Manage. 2019, 246, 63–70. [Google Scholar] [CrossRef] [PubMed]
- Bunoiu, M.; Jugunaru, I.; Bica, I.; Balasoiu, M. Nonthermal Argon Plasma Generator and Some Potential Applications. Ann. West Univ. Timis. Phys. 2015, 58, 38–47. [Google Scholar] [CrossRef] [Green Version]
- Yoshida, K.; Yamamoto, T.; Kuroki, T.; Okubo, M. Pilot-scale experiment for simultaneous dioxin and no x removal from garbage incinerator emissions using the pulse corona induced plasma chemical process. Plasma Chem. Plasma Process. 2009, 29, 373–386. [Google Scholar] [CrossRef]
- Schmidt, M.; Basner, R.; Brandenburg, R. Hydrocarbon assisted NO oxidation with non-thermal plasma in simulated marine diesel exhaust gases. Plasma Chem. Plasma Process. 2013, 33, 323–335. [Google Scholar] [CrossRef]
- Orlandini, I.; Riedel, U. Chemical kinetics of NO removal by pulsed corona discharges. J. Phys. D Appl. Phys 2000, 33, 2467–2474. [Google Scholar] [CrossRef]
- Penetrante, B.M.; Brusasco, R.M.; Merritt, B.T.; Pitz, W.J.; Vogtlin, G.E.; Kung, M.C.; Kung, H.H.; Wan, C.Z.; Voss, K.E. Plasma-Assisted Catalytic Reduction of NOx. In Proceedings of the 1998 Society of Automotive Engineers Fall Fuels and Lubricants Meeting, San Francisco, CA, USA, 19–22 October 1998. [Google Scholar]
- Khacef, A.; Cormier, J.M.; Pouvesle, J.M. NOx remediation in oxygen-rich exhaust gas using atmospheric pressure non-thermal plasma generated by a pulsed nanosecond dielectric barrier discharge. J. Phys. D Appl. Phys. 2002, 35, 1491–1498. [Google Scholar] [CrossRef]
- McLarnon, C.R.; Penetrante, B.M. Effect of Gas Composition on the NOx Conversion Chemistry in a Plasma. In Proceedings of the Society of Automotive Engineers Fall Fuels and Lubricants Meeting, San Francisco, CA, USA, 19–22 October 1998. [Google Scholar]
- Leipold, F.; Fateev, A.; Kusano, Y.; Stenum, B.; Bindslev, H. Reduction of NO in the exhaust gas by reaction with N radicals. Fuel 2006, 85, 1383–1388. [Google Scholar] [CrossRef]
- Zhao, G.-B.; Garikipati, S.V.B.J.; Hu, X.; Argyle, M.D.; Radosz, M. Effect of oxygen on nonthermal plasma reactions of nitrogen oxides in nitrogen. AIChE J. 2005, 51, 1800–1812. [Google Scholar] [CrossRef] [Green Version]
- Zhang, Y.; Tang, X.; Yi, H.; Yu, Q.; Wang, J.; Gao, F.; Gao, Y.; Li, D.; Cao, Y. The byproduct generation analysis of the NOx conversion process in dielectric barrier discharge plasma. RSC Adv. 2016, 6, 63946–63953. [Google Scholar] [CrossRef]
- Yan, K.; Kanazawa, S.; Ohkubo, T.; Nomoto, Y. Oxidation and Reduction Process During NOx Removal and Corona-Induced Nonthermal Plasma. Plasma Chem. Plasma Process. 1999, 19, 421–443. [Google Scholar] [CrossRef]
- Lin, H.; Gao, X.; Luo, Z.; Cen, K.; Pei, M.; Huang, Z. Removal of NOxfrom wet flue gas by corona discharge. Fuel 2004, 83, 1251–1255. [Google Scholar] [CrossRef]
- Sivachandiran, L.; Khacef, A. In situ and ex situ NO oxidation assisted by submicrosecond pulsed multi-pin-to-plane corona discharge: The effect of pin density. RSC Adv. 2016, 6, 29983–29995. [Google Scholar] [CrossRef]
- Jogi, I.; Stamate, E.; Irimiea, C.; Schmidt, M.; Brandenburg, R.; Holub, M.; Bonislawski, M.; Jakubowski, T.; Kaariainen, M.-L.; Cameron, D.C. Comparison of direct and indirect plasma oxidation of NO combined with oxidation by catalyst. Fuel 2015, 144, 137–144. [Google Scholar] [CrossRef]
- Shang, S.; Li, X.; Chen, W.; Wang, B.; Shi, W. A total heat recovery system between the flue gas and oxidizing air of a gas-fired boiler using a non-contact total heat exchanger. Appl. Energy 2017, 207, 613–623. [Google Scholar] [CrossRef]
- Hinrichs, J.; Felsmann, D.; Schweitzer-De Bortoli, S.; Tomczak, H.-J.; Pitsch, H. Numerical and experimental investigation of pollutant formation and emissions in a full-scale cylindrical heating unit of a condensing gas boiler. Appl. Energy 2018, 229, 977–989. [Google Scholar] [CrossRef]
- Scarlat, N.; Dallemand, J.-F.; Fahl, F. Biogas: Developments and perspectives in Europe. Renew. Energy 2018, 129, 457–472. [Google Scholar] [CrossRef]
- Lee, S.; Kum, S.-M.; Lee, C.-E. An experimental study of a cylindrical multi-hole premixed burner for the development of a condensing gas boiler. Energy 2011, 36, 4150–4157. [Google Scholar] [CrossRef]
- Ding, Y.; Durox, D.; Darabiha, N.; Schuller, T. Chemiluminescence based operating point control of domestic gas boilers with variable natural gas composition. Appl. Therm. Eng. 2019, 149, 1052–1060. [Google Scholar] [CrossRef]
- Manley, T.C. The Electric Characteristics of the Ozonator Discharge. J. Electrochem. Soc. 1943, 84, 83–96. [Google Scholar] [CrossRef]
- Jõgi, I.; Bichevin, V.; Laan, M.; Haljaste, A.; Käämbre, H. NO Conversion by Dielectric Barrier Discharge and TiO2 Catalyst: Effect of Oxygen. Plasma Chem. Plasma Process. 2009, 29, 205–215. [Google Scholar] [CrossRef]
- Jõgi, I.; Erme, K.; Haljaste, A.; Laan, M. Oxidation of nitrogen oxide in hybrid plasma-catalytic reactors based on DBD and Fe2O3. EPJ Appl. Phys. 2013, 61. [Google Scholar] [CrossRef]
- Jõgi, I.; Haljaste, A.; Laan, M. Hybrid TiO2 based plasma-catalytic reactors for the removal of hazardous gasses. Surf. Coat. Technol. 2014, 242, 195–199. [Google Scholar] [CrossRef]
- Baukal, C.E. The John Zink Combustion Handbook, 1st ed.; CRC Press: Boca Raton, FL, USA, 2001; ISBN 9781420038699. [Google Scholar]
- Munir, S.; Nimmo, W. Nox Formation during Combustion Process and in-Furnace Control Technologies. J. Pak. Inst. Chem. Eng. 2009, 37, 13–21. [Google Scholar]
- Wiberg, E.; Wiberg, N.; Holleman, A.F. Inorganic Chemistry; Academic Press: Cambridge, MA, USA; De Gruyter: San Diego, CA, USA; Berlin, Germany; New York, NY, USA, 2001; ISBN1 0123526515. ISBN2 9780123526519. [Google Scholar]
- Jõgi, I.; Erme, K.; Levoll, E.; Stamate, E. Radical production efficiency and electrical characteristics of a coplanar barrier discharge built by multilayer ceramic technology. J. Phys. D Appl. Phys. 2017, 50, 465201. [Google Scholar] [CrossRef] [Green Version]
- Yan, K.; Van Heesch, E.J.M.; Pemen, A.J.M.; Huijbrechts, P.A.H.J. From chemical kinetics to streamer corona reactor and voltage pulse generator. Plasma Chem. Plasma Process. 2001, 21, 107–137. [Google Scholar] [CrossRef]
- Rosocha, L.A. Nonthermal plasma applications to the environment: Gaseous electronics and power conditioning. IEEE Trans. Plasma Sci. 2005, 33, 129–137. [Google Scholar] [CrossRef]
- Malik, M.A.; Kolb, J.F.; Sun, Y.; Schoenbach, K.H. Comparative study of NO removal in surface-plasma and volume-plasma reactors based on pulsed corona discharges. J. Hazard. Mater. 2011, 197, 220–228. [Google Scholar] [CrossRef]
- Eliasson, B.; Kogelschatz, U.; Baessler, P. Dissociation of O2 in N2/O2 mixtures. J. Phys. B Mol. Phys. 1984, 17, L797–L801. [Google Scholar] [CrossRef]
- Jõgi, I.; Levoll, E.; Raud, J. Plasma oxidation of NO in O2:N2 mixtures: The importance of back-reaction. Chem. Eng. J. 2016, 301, 149–157. [Google Scholar] [CrossRef]
- Penetrante, B.M.; Bardsley, N.; Hsiao, M.C. Kinetic Analysis of Non-Thermal Plasmas Used for Pollution Control. Jpn. J. Appl. Phys. 1997, 36, 5007–5017. [Google Scholar] [CrossRef]
- Jõgi, I.; Erme, K.; Raud, J.; Laan, M. Oxidation of NO by ozone in the presence of TiO2 catalyst. Fuel 2016, 173, 45–54. [Google Scholar] [CrossRef]
Figure 1.
A scheme of combustion and NOX removal system: 1—a combustion chamber; 2—a gas burner; 3—a rotameter; 4—a probe for collecting the flue gas; 5—a rotary vane pump; 6—a condensation unit; 7—a dielectric barrier discharge device; 8—TiO catalyst.
Figure 1.
A scheme of combustion and NOX removal system: 1—a combustion chamber; 2—a gas burner; 3—a rotameter; 4—a probe for collecting the flue gas; 5—a rotary vane pump; 6—a condensation unit; 7—a dielectric barrier discharge device; 8—TiO catalyst.
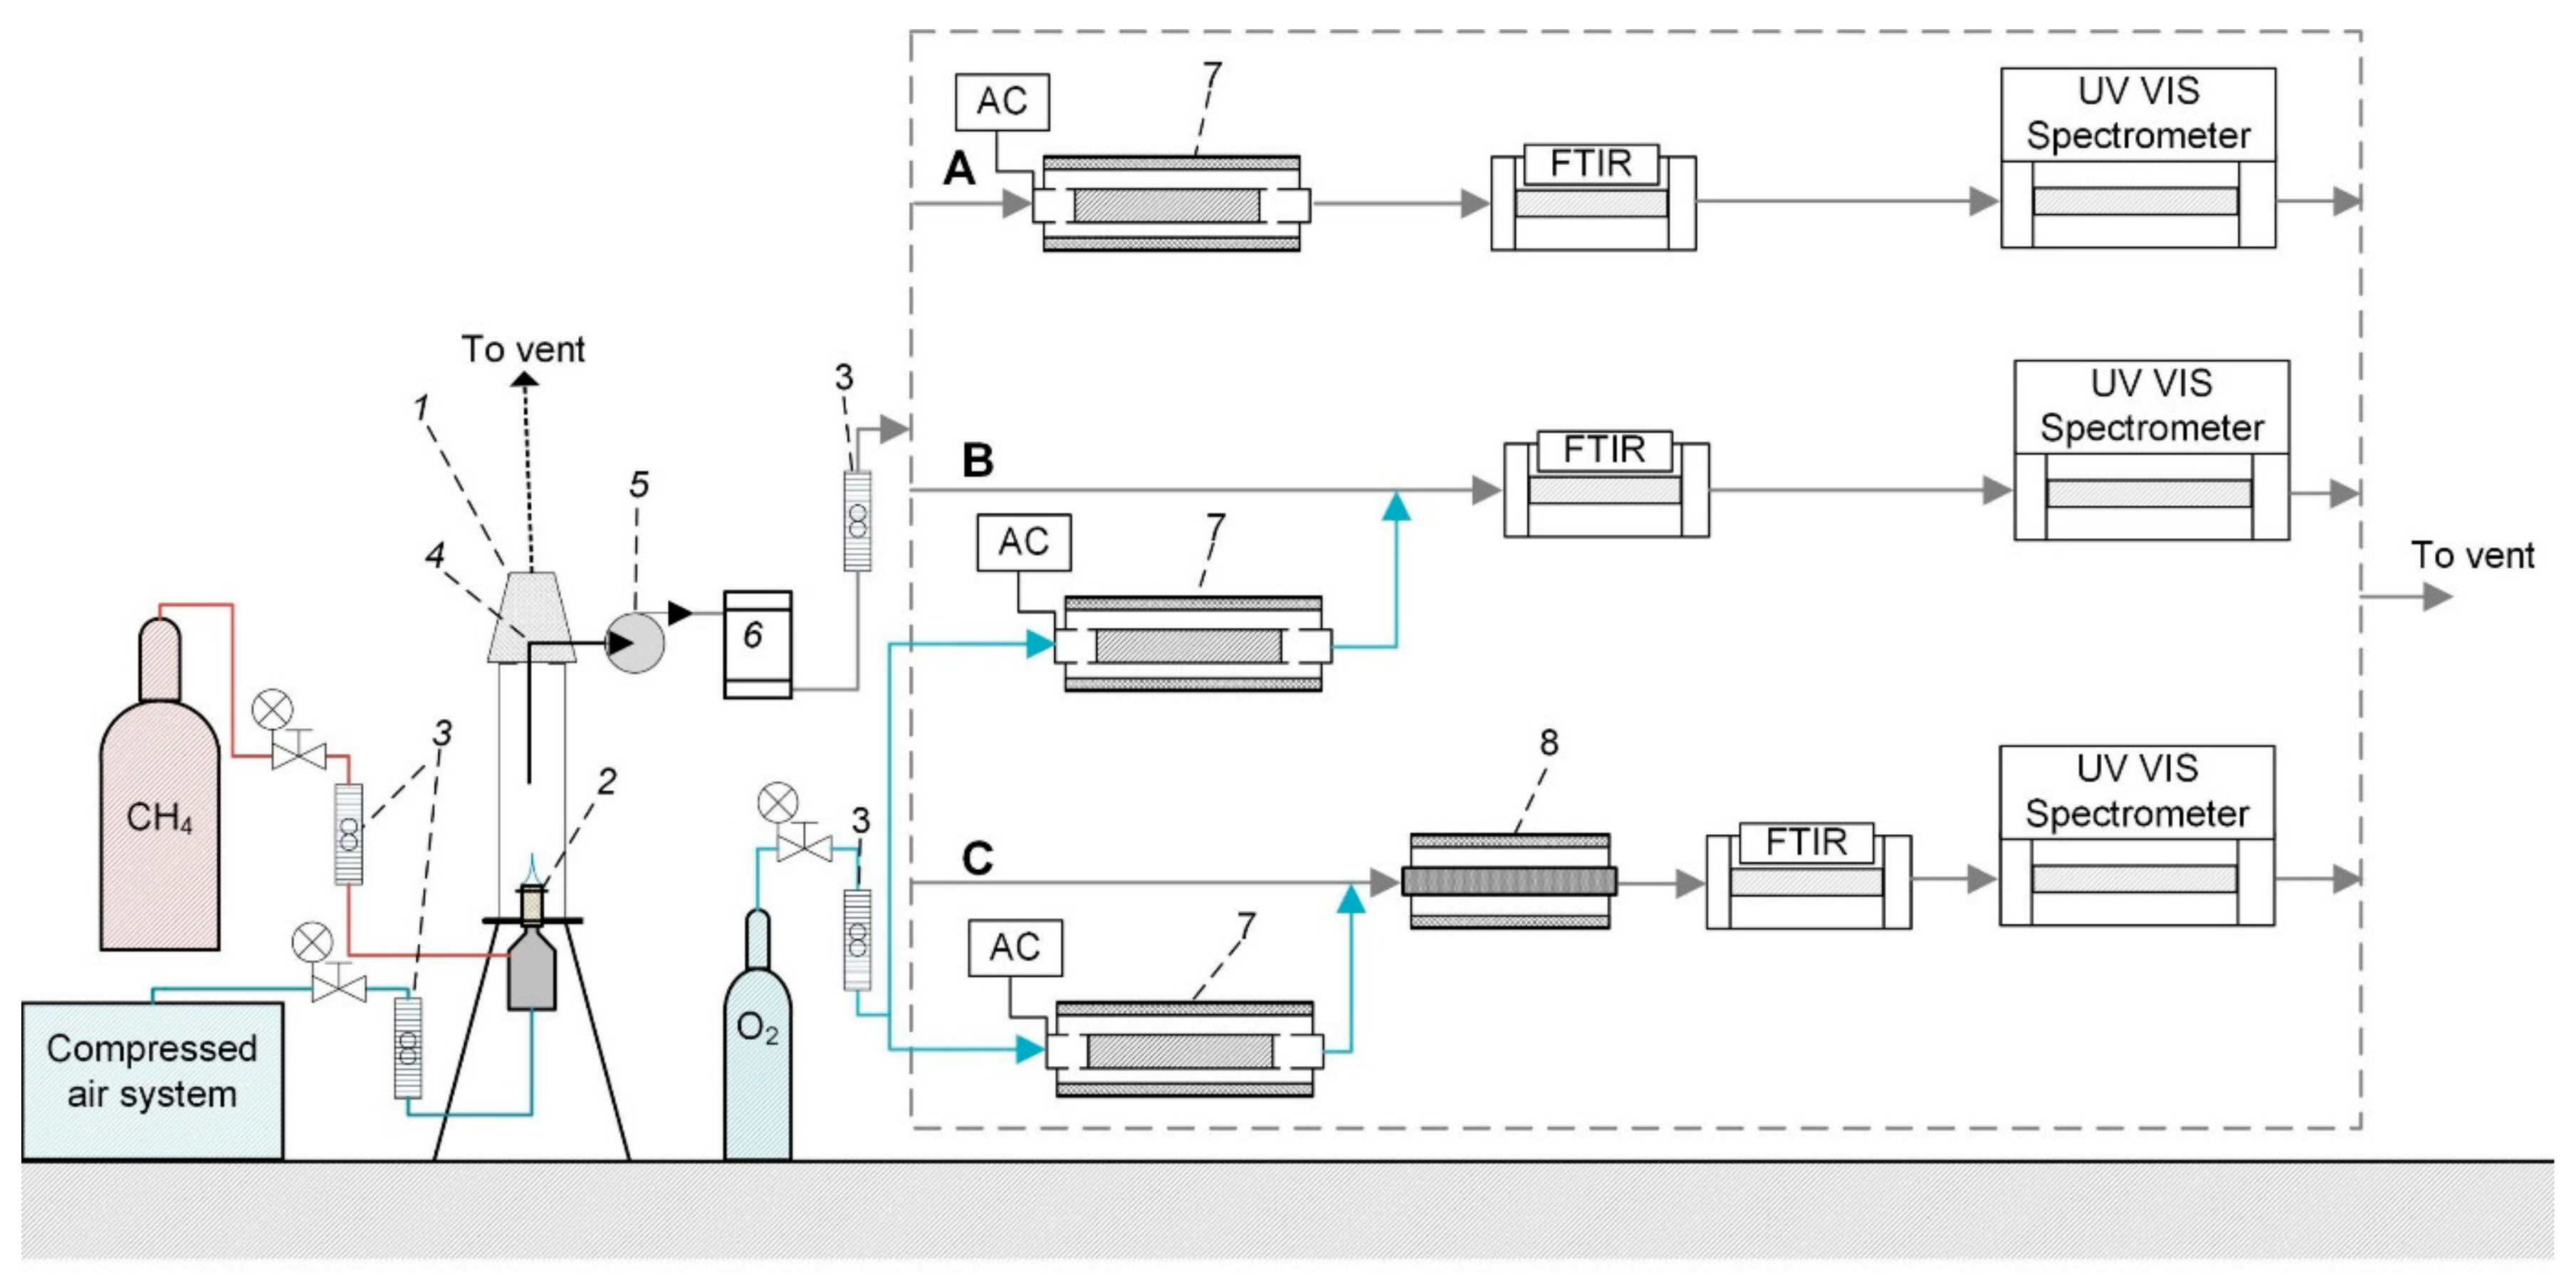
Figure 2.
Methane flame at different equivalence ratio (ER) values.
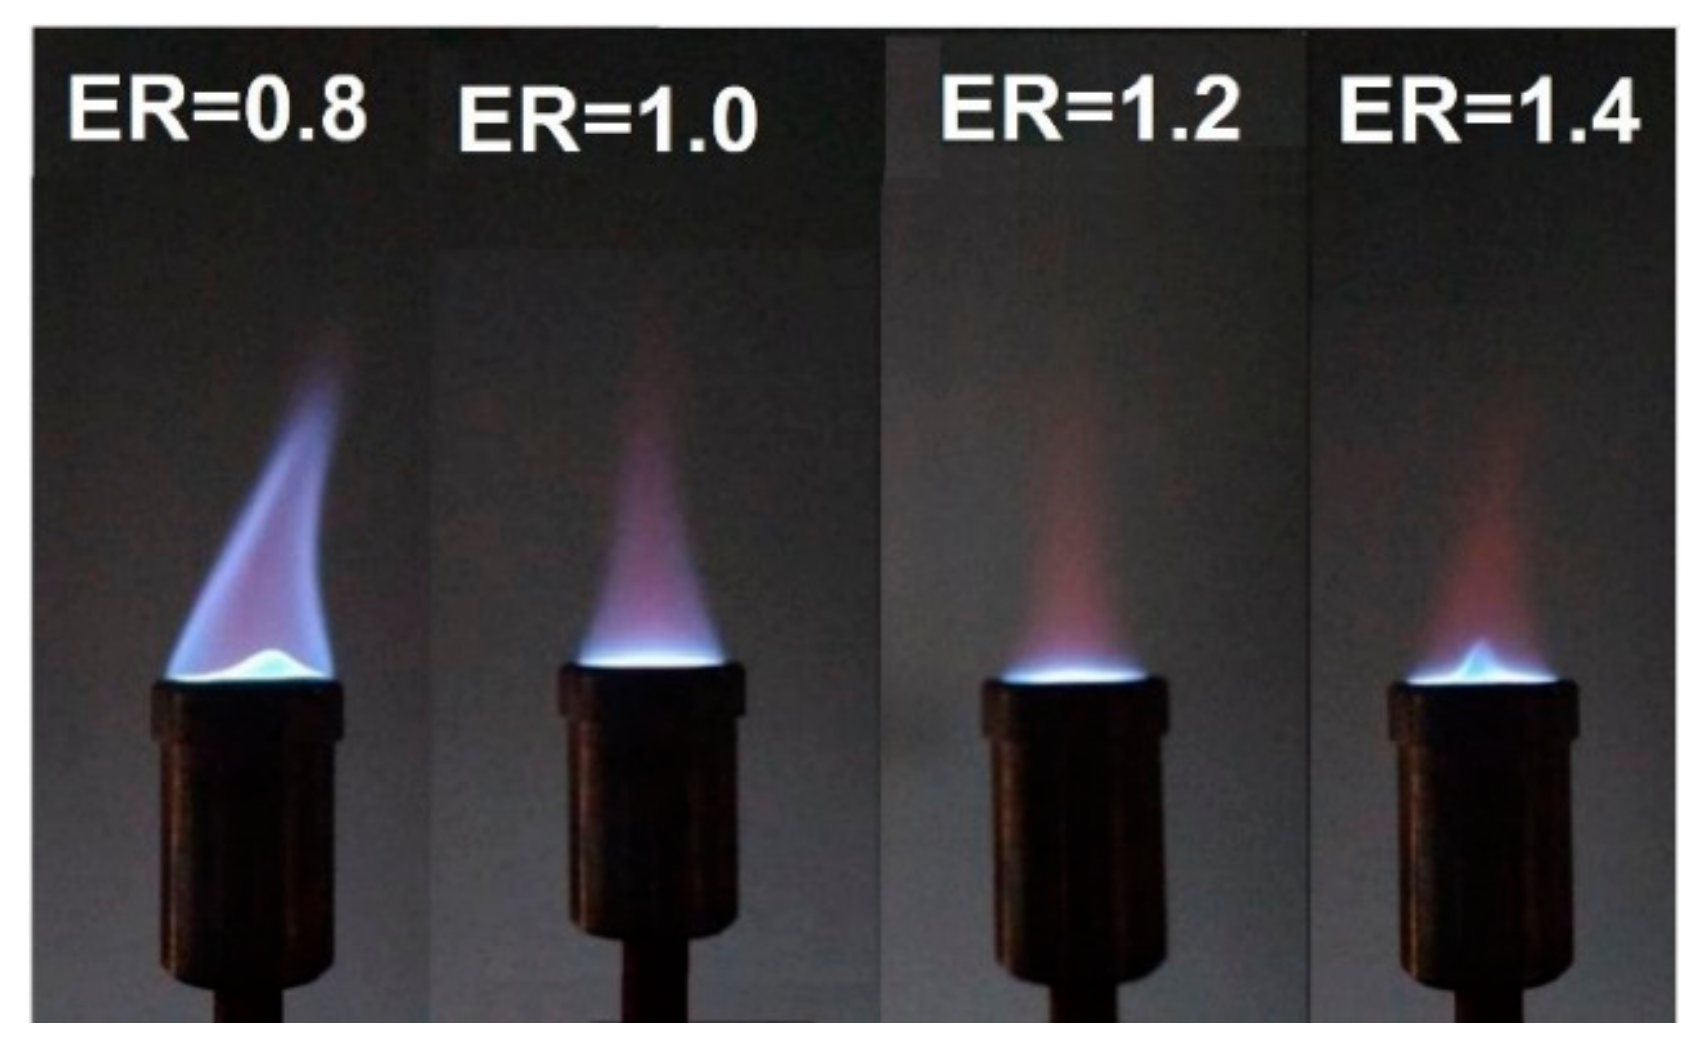
Figure 3.
The effect of ER on the (a) relative concentrations of CO2 and CO and (b) concentration of NO and NO2 in the exhaust gas of the gas burner.
Figure 3.
The effect of ER on the (a) relative concentrations of CO2 and CO and (b) concentration of NO and NO2 in the exhaust gas of the gas burner.
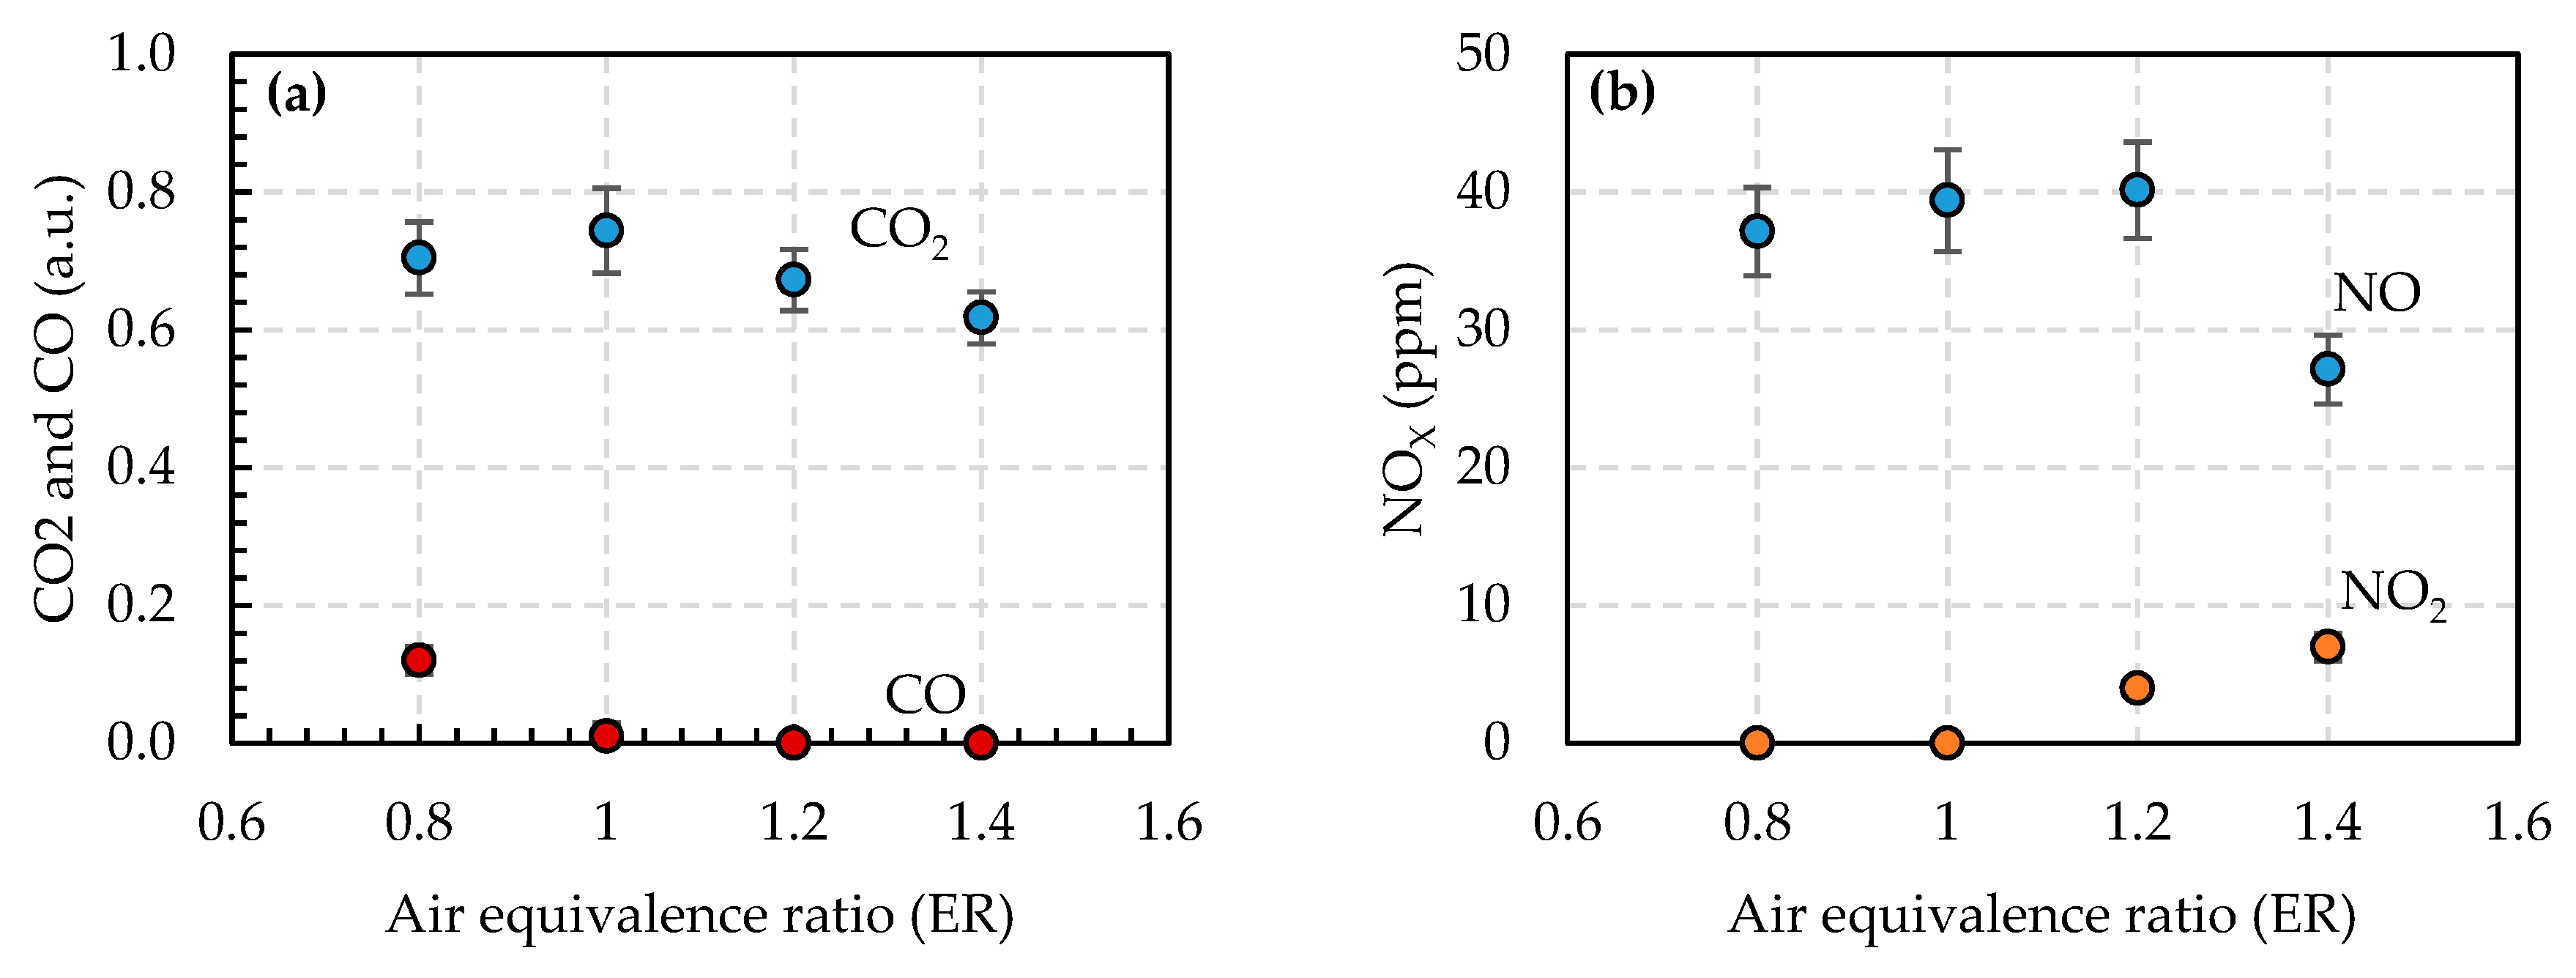
Figure 4.
The direct plasma oxidation of nitrogen oxide at ER (a) 0.8; (b) 1.0; (c) 1.2; (d) 1.4 value (Lines show the fit of experimental results by exponential function (1).
Figure 4.
The direct plasma oxidation of nitrogen oxide at ER (a) 0.8; (b) 1.0; (c) 1.2; (d) 1.4 value (Lines show the fit of experimental results by exponential function (1).
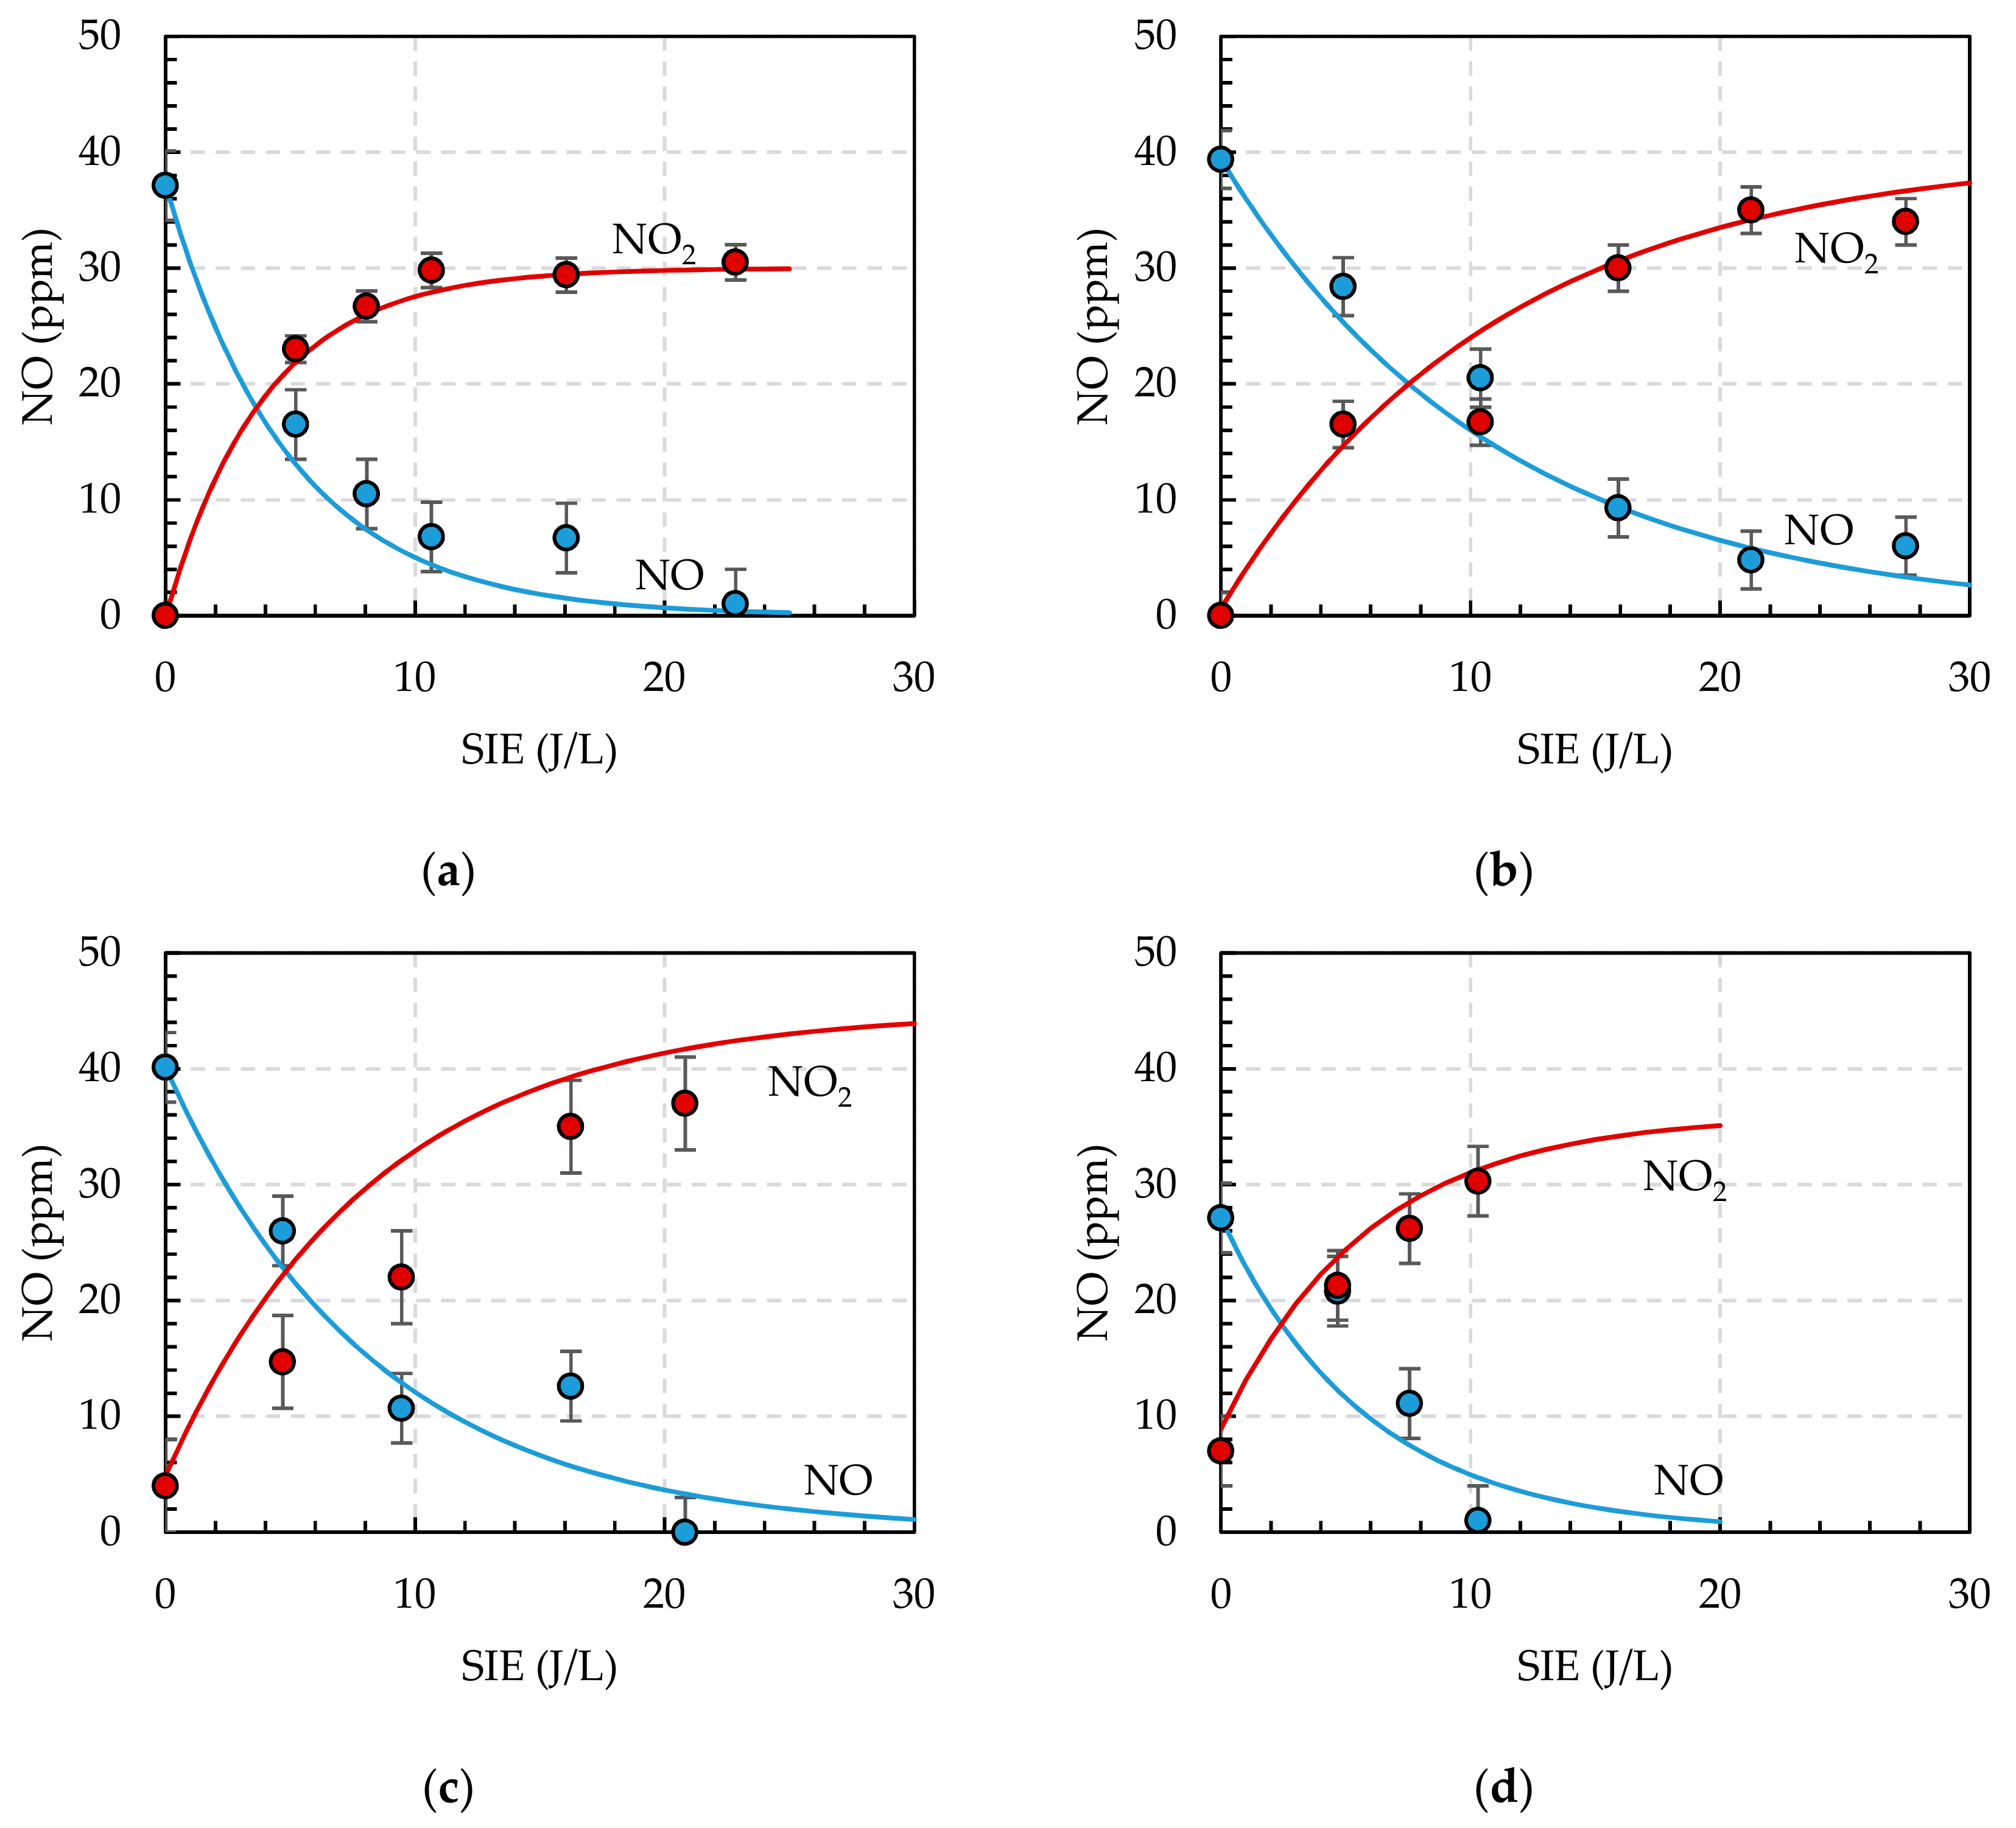
Figure 5.
NO removal efficiency kE as a function of ER.

Figure 6.
The concentrations of NO, NO2 and O3 as a function of specific input energy (SIE) by ozone injection at ER (a) 0.8; (b) 1.0; (c) 1.2; (d) 1.4 value (Lines show theoretical concentrations).
Figure 6.
The concentrations of NO, NO2 and O3 as a function of specific input energy (SIE) by ozone injection at ER (a) 0.8; (b) 1.0; (c) 1.2; (d) 1.4 value (Lines show theoretical concentrations).
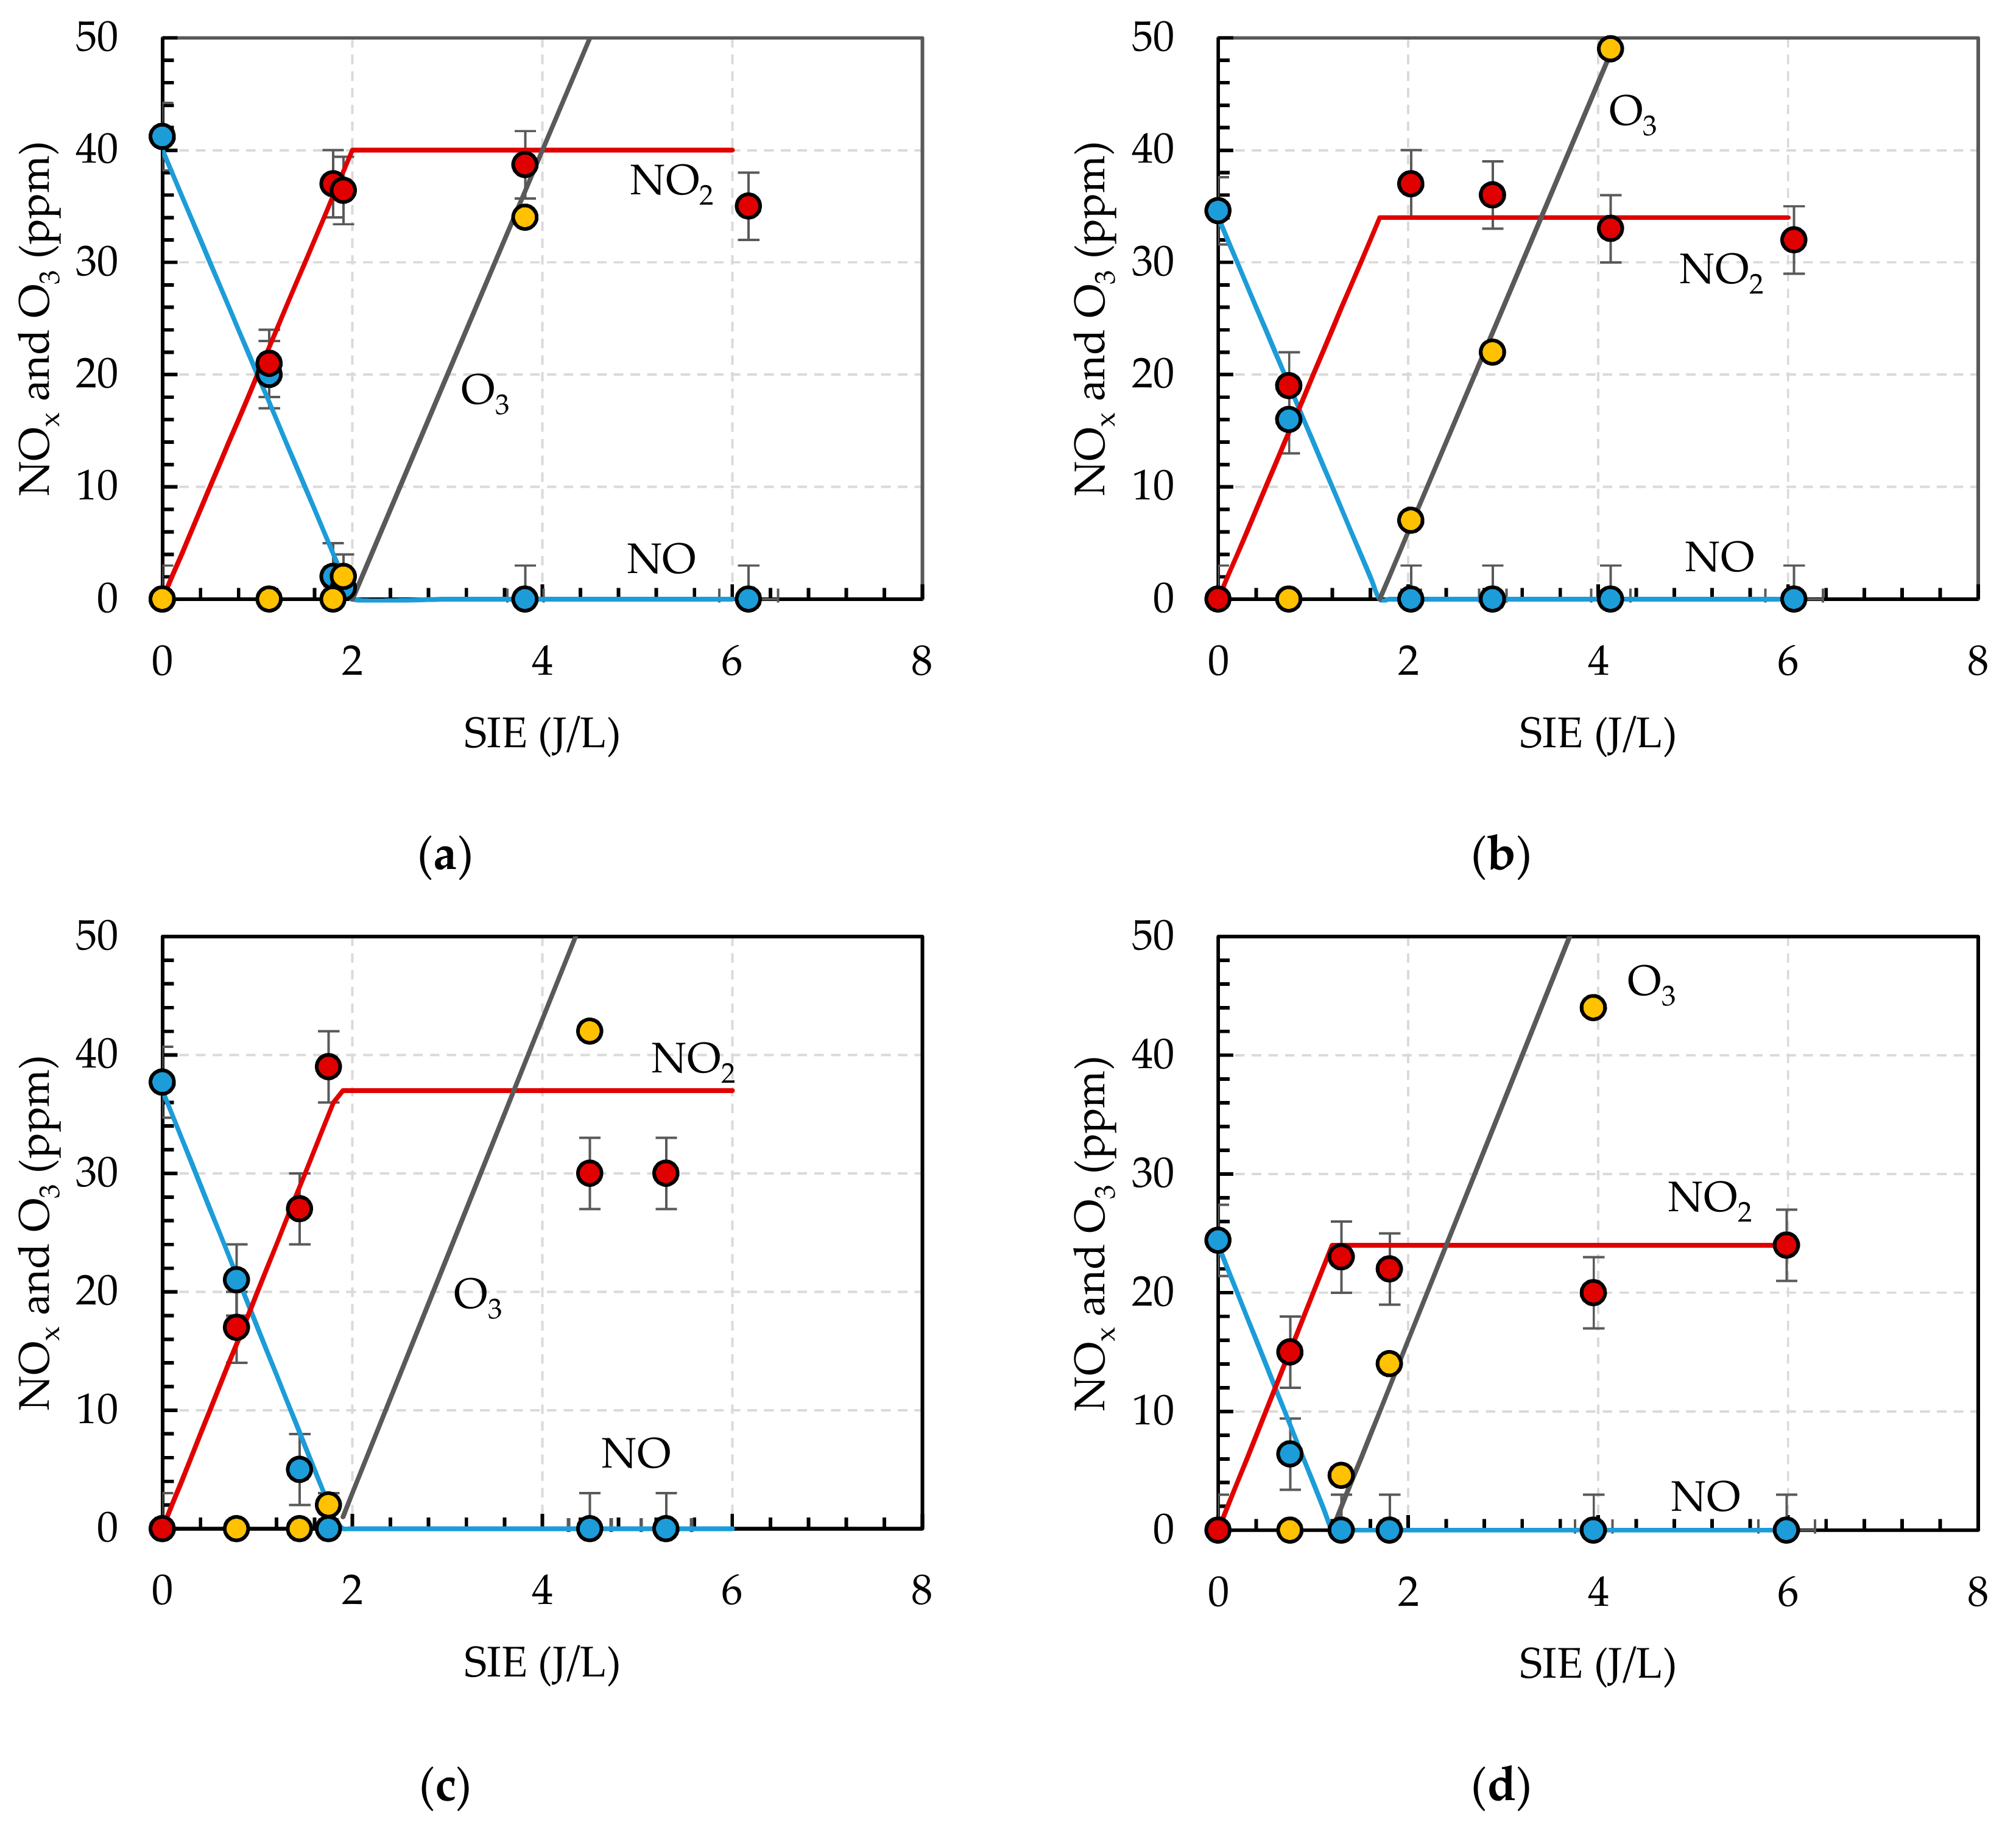
Figure 7.
Relative concentration of NO2, [NO2]/[NO]in, as a function of relative inlet ozone concentration, [O3]in/[NO]in, during the ozone treatment in presence (red circles) and absence (blue circles) of the catalyst at ER (a) 0.8; (b) 1.0; (c) 1.2; (d) 1.4 value (the lines show theoretical values calculated according to the formula (2).

Table 1.
Inlet parameters for fuel and air flows at different air equivalence ratios.
| Air Equivalence Ratio | CH4, L/min | Air, L/min | Overall flow, L/min | Generated Power, kW |
|---|---|---|---|---|
| 0.8 | 1 | 7.6 | 8.6 | 0.56 |
| 1.0 | 9.5 | 10.5 | ||
| 1.2 | 11.4 | 12.4 | ||
| 1.4 | 13.3 | 14.3 |
© 2019 by the authors. Licensee MDPI, Basel, Switzerland. This article is an open access article distributed under the terms and conditions of the Creative Commons Attribution (CC BY) license (http://creativecommons.org/licenses/by/4.0/).
Share and Cite
MDPI and ACS Style
Paulauskas, R.; Jõgi, I.; Striūgas, N.; Martuzevičius, D.; Erme, K.; Raud, J.; Tichonovas, M. Application of Non-Thermal Plasma for NOx Reduction in the Flue Gases. Energies 2019, 12, 3955. https://doi.org/10.3390/en12203955
AMA Style
Paulauskas R, Jõgi I, Striūgas N, Martuzevičius D, Erme K, Raud J, Tichonovas M. Application of Non-Thermal Plasma for NOx Reduction in the Flue Gases. Energies. 2019; 12(20):3955. https://doi.org/10.3390/en12203955
Chicago/Turabian StylePaulauskas, Rolandas, Indrek Jõgi, Nerijus Striūgas, Dainius Martuzevičius, Kalev Erme, Jüri Raud, and Martynas Tichonovas. 2019. "Application of Non-Thermal Plasma for NOx Reduction in the Flue Gases" Energies 12, no. 20: 3955. https://doi.org/10.3390/en12203955
Note that from the first issue of 2016, this journal uses article numbers instead of page numbers. See further details here.