Accurate Evaluation of Steady-State Sheath Voltage and Current in HVDC Cable Using Electromagnetic Transient Simulation


Abstract
:1. Introduction
2. System Description
2.1. HVDC Converter Model
2.2. Cable Model
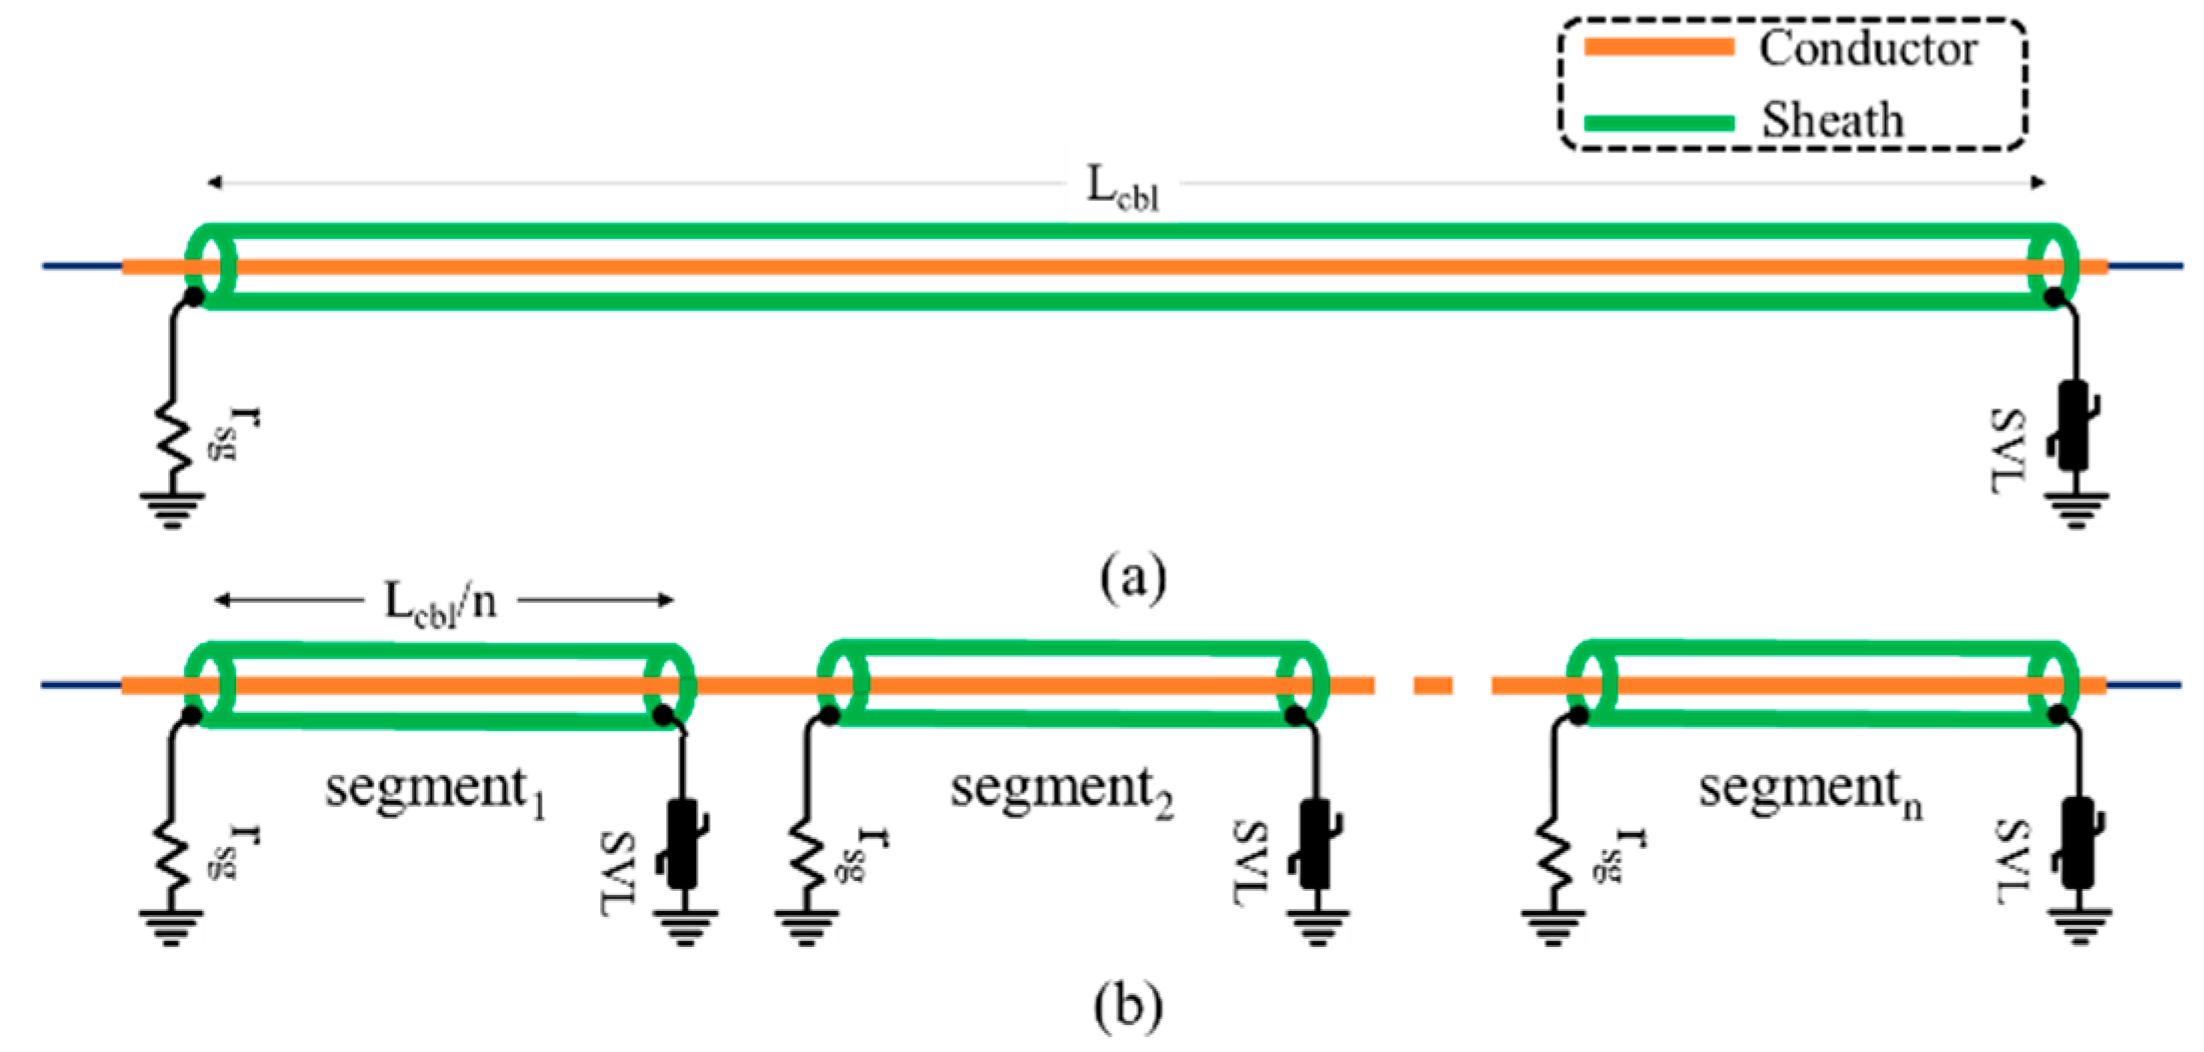
2.3. Sheath Grounding Schemes
- Minimize the sheath voltage.
- Minimize the circulating currents in sheath.
- Minimize the sheath loss.
2.3.1. Terminal Grounding (TG)/ Multipoint Grounding (MPG)
2.3.2. Single Point Grounding (SPG)/ Multiple Single Point Grounding (MSPG)
3. Simulation Setup & Evaluation Method
- t2: 10 (s)
- t1: 5 (s).
- E(xk): (Ik(rms))2 *ϱsheath/Asheath
- Ik(rms): rms current at kth terminal of sheath (A)
- ϱsheath: resistivity of sheath (Ω·m)
- Asheath: cross sectional area of sheath (m2)
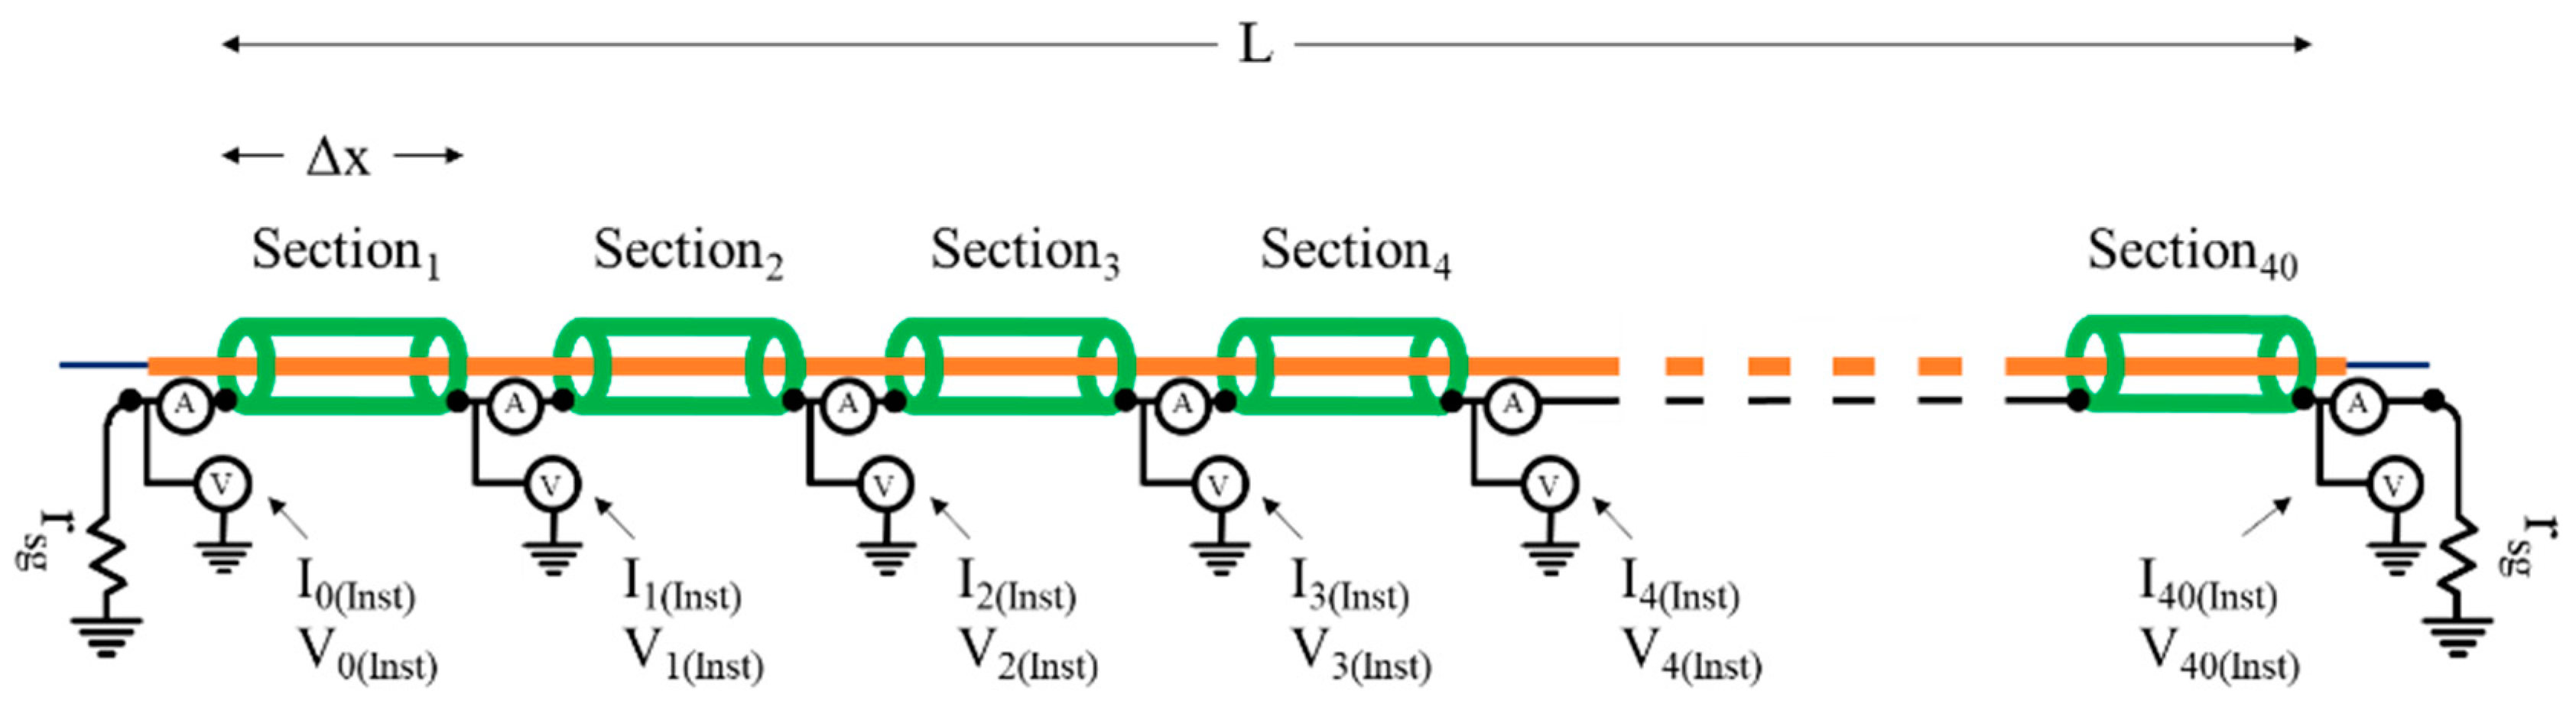
- L: cable length (m)
- Δx: section length (m)
- N: number of sections = 40.
4. Analysis of Electromagnetic Transient (EMT) Model: Limitations and Proposed Solution
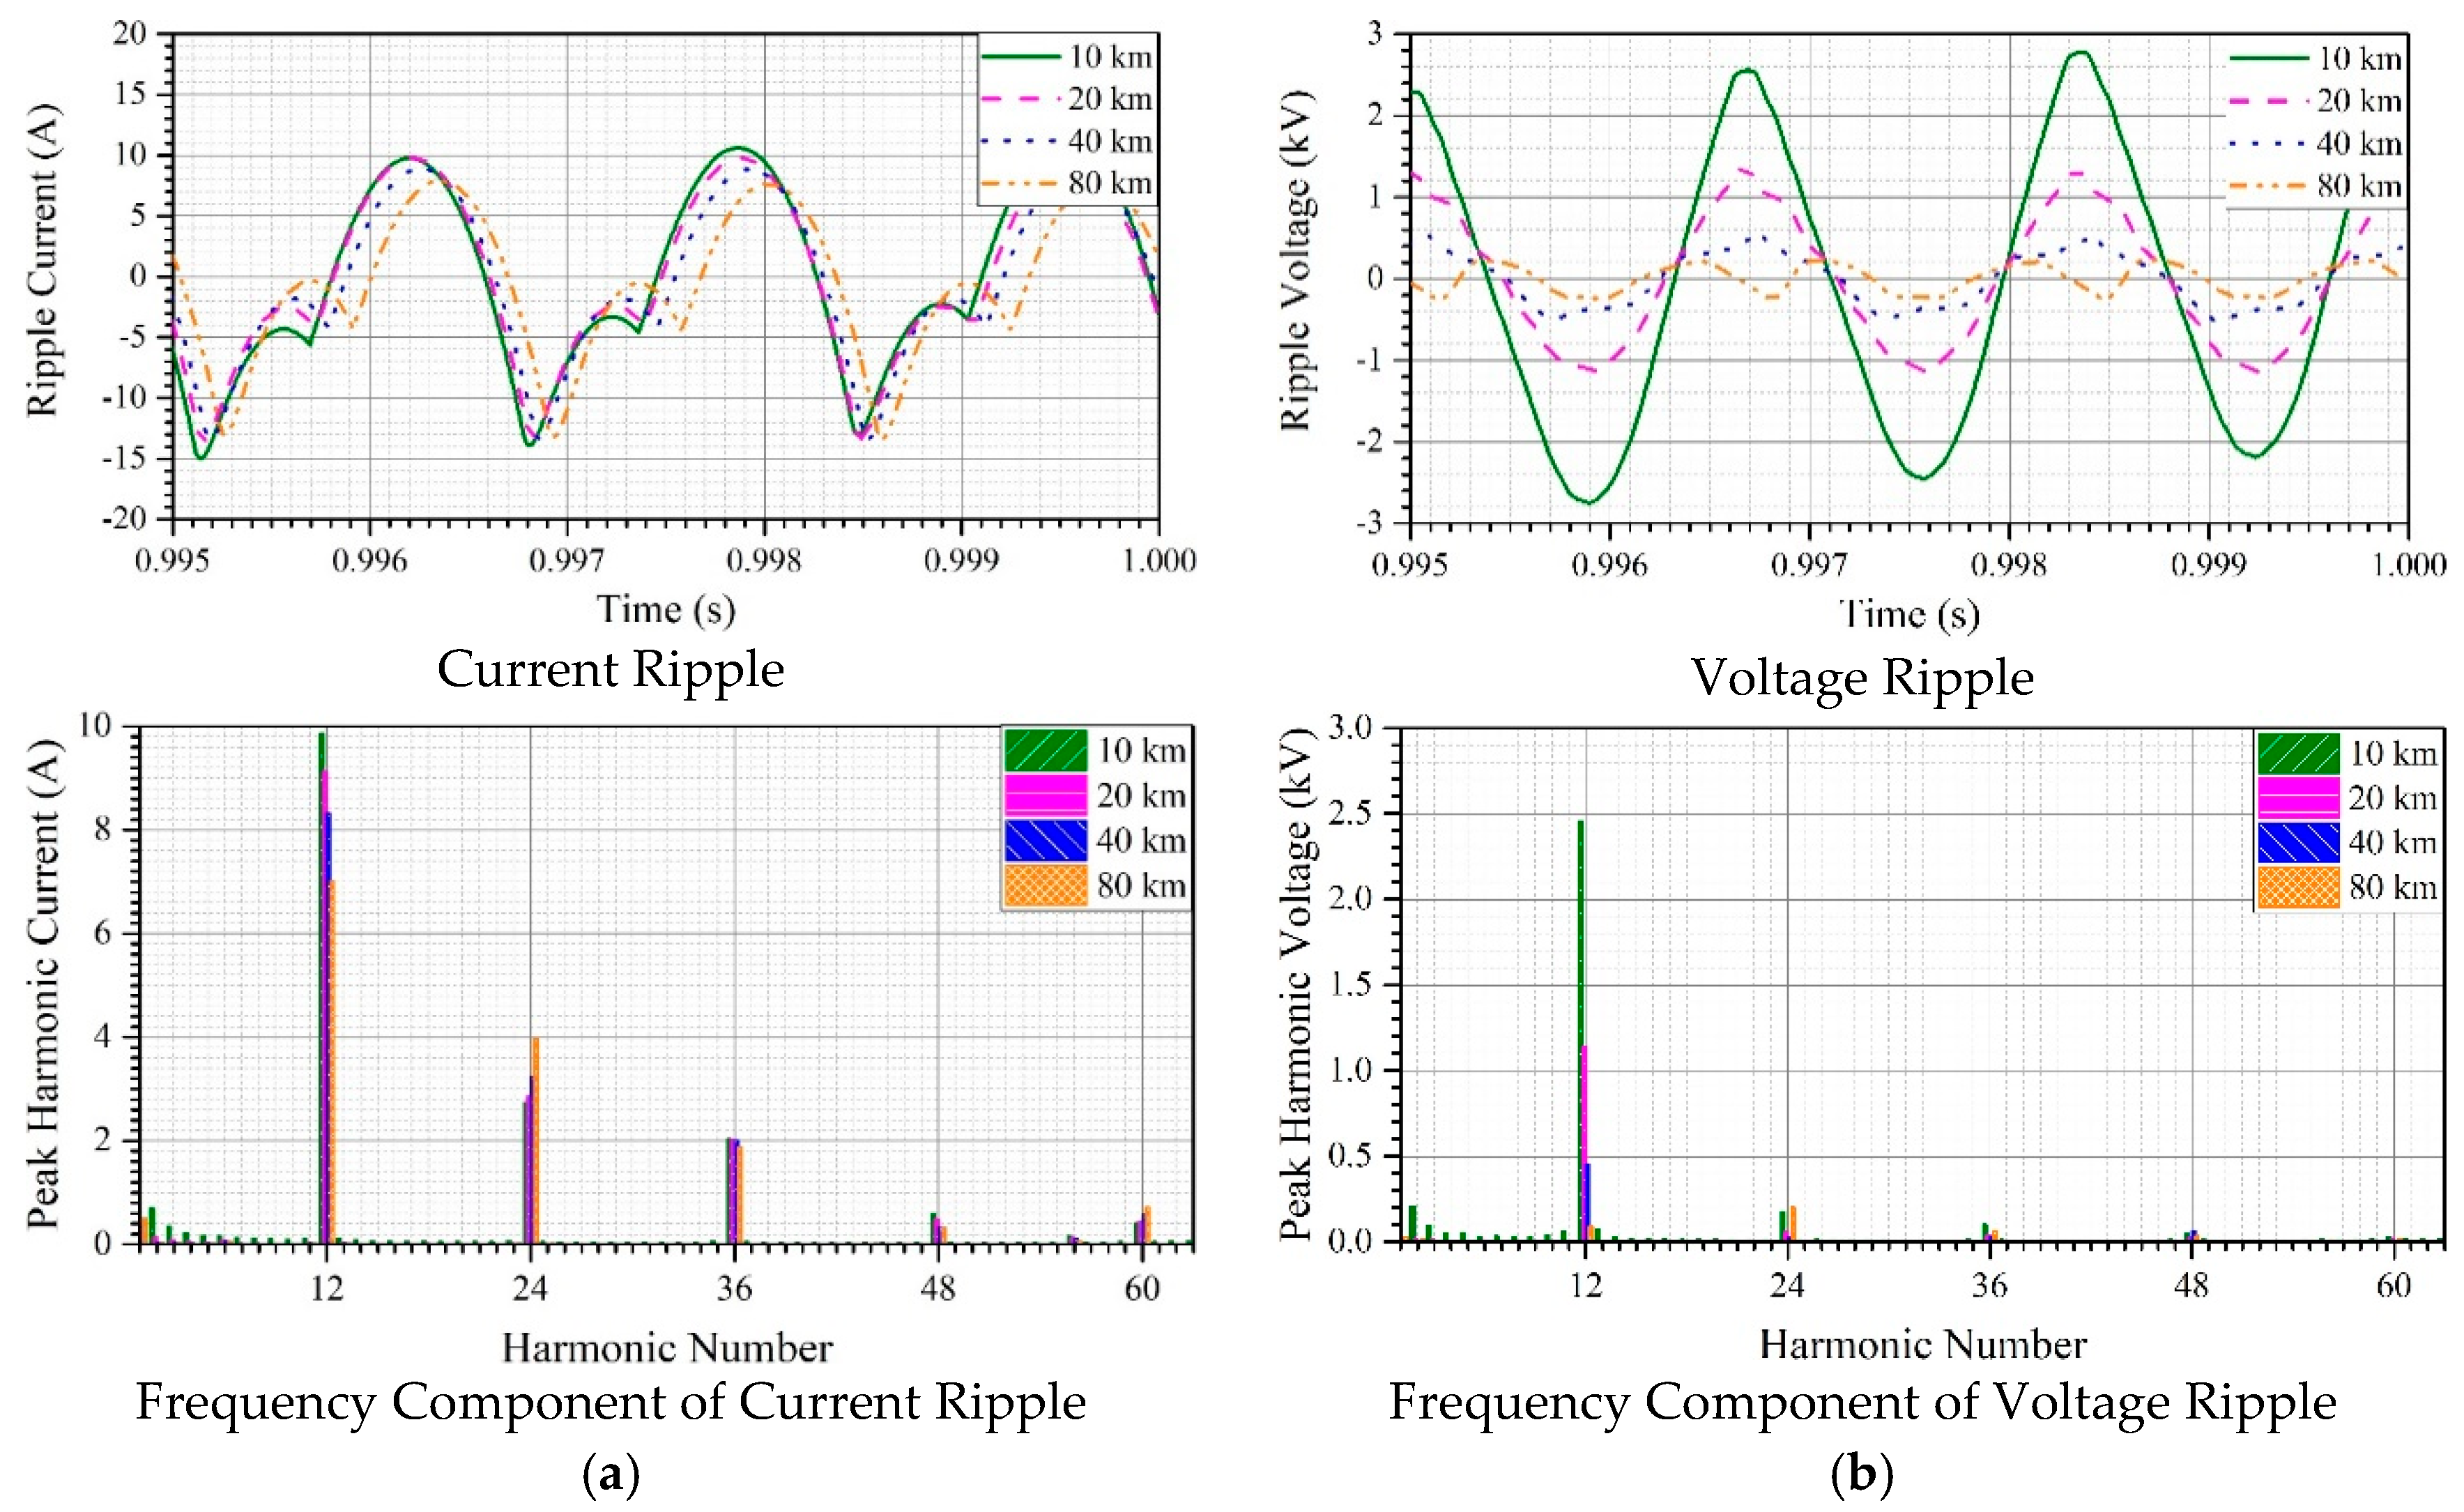
4.1. Ripple Current & Voltage Analysis
- iripple: ripple current in core conductor
- Vripple: ripple voltage in DC line
- ic: charging current.
4.2. Limitations of ULM in Evaluation of Steady State Sheath Voltage and Currents
4.3. Proposed Method for Accurate Evaluation of Sheath Voltage and Current in Steady State
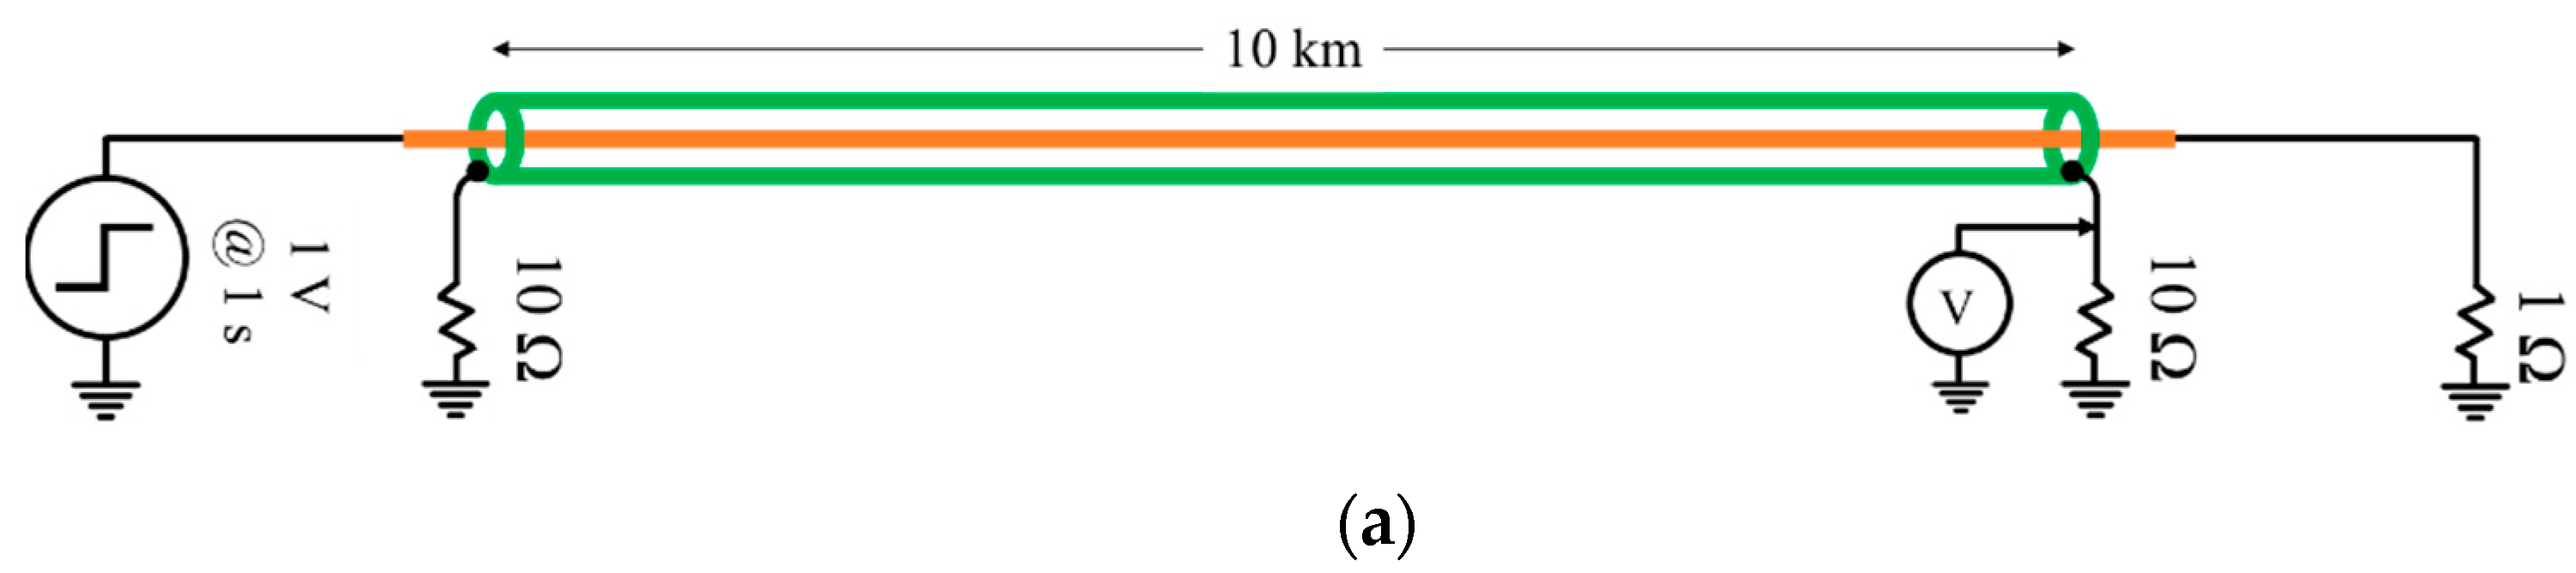
- 1-
- 2-
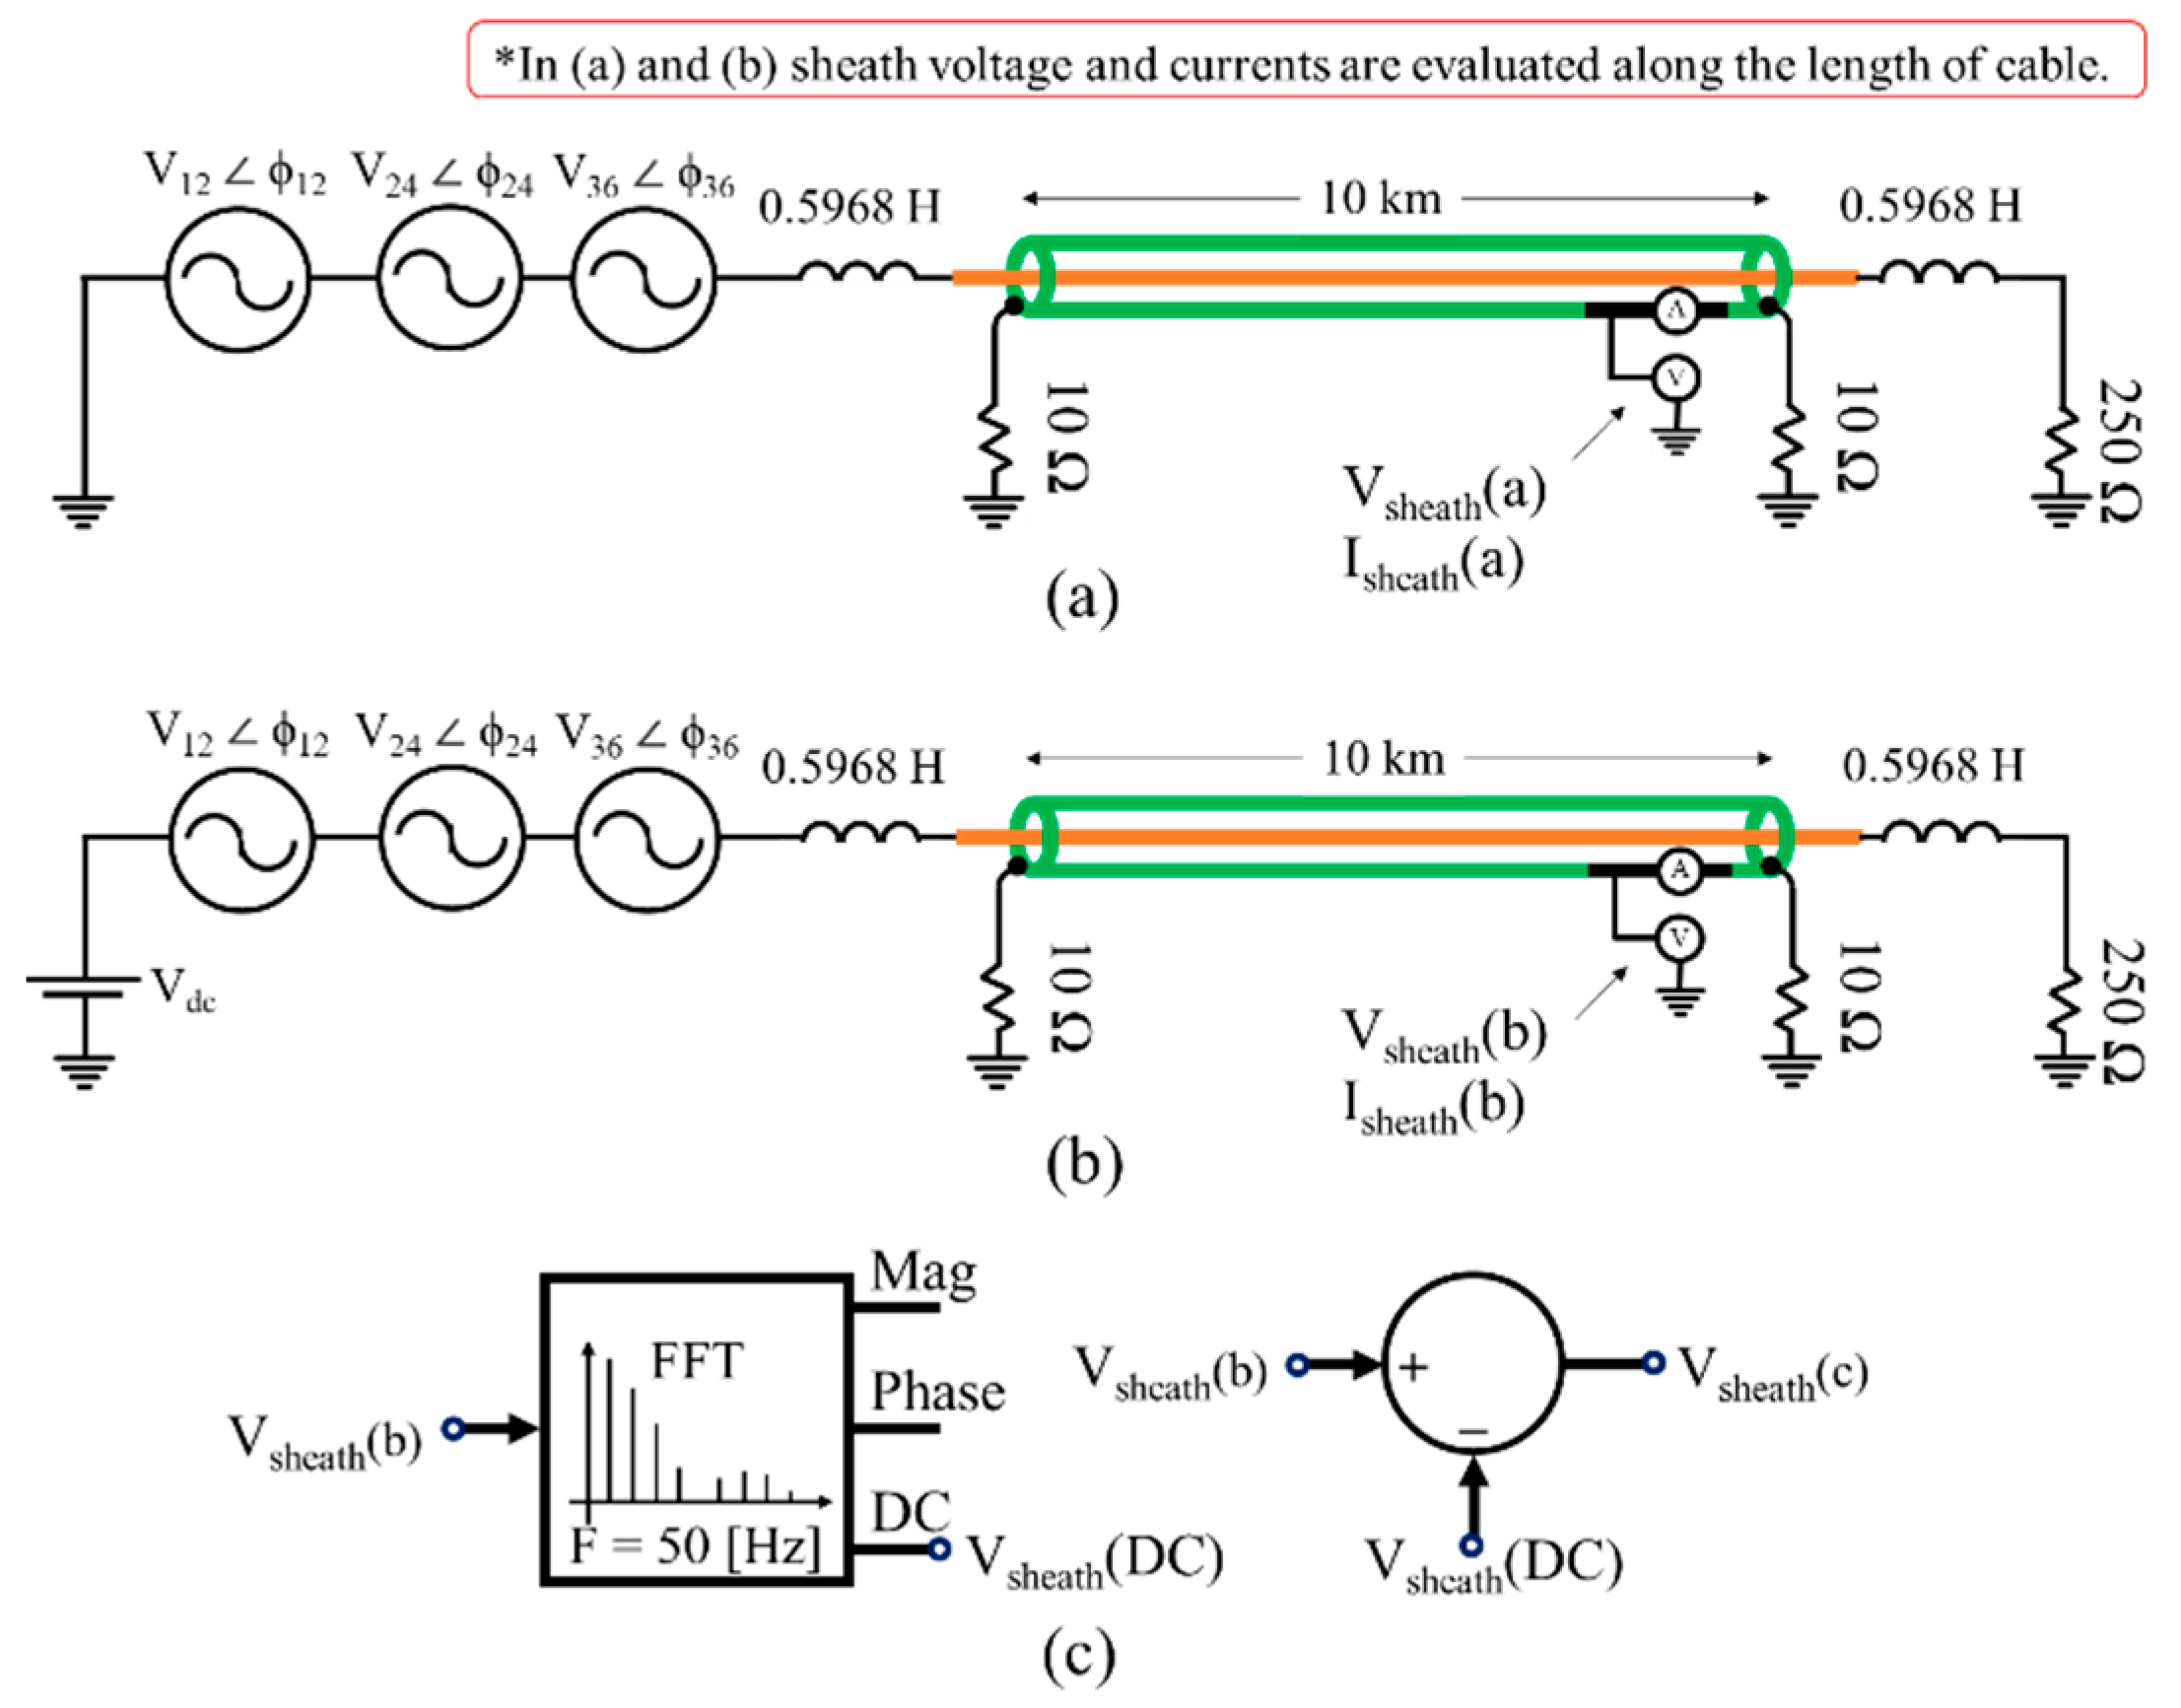
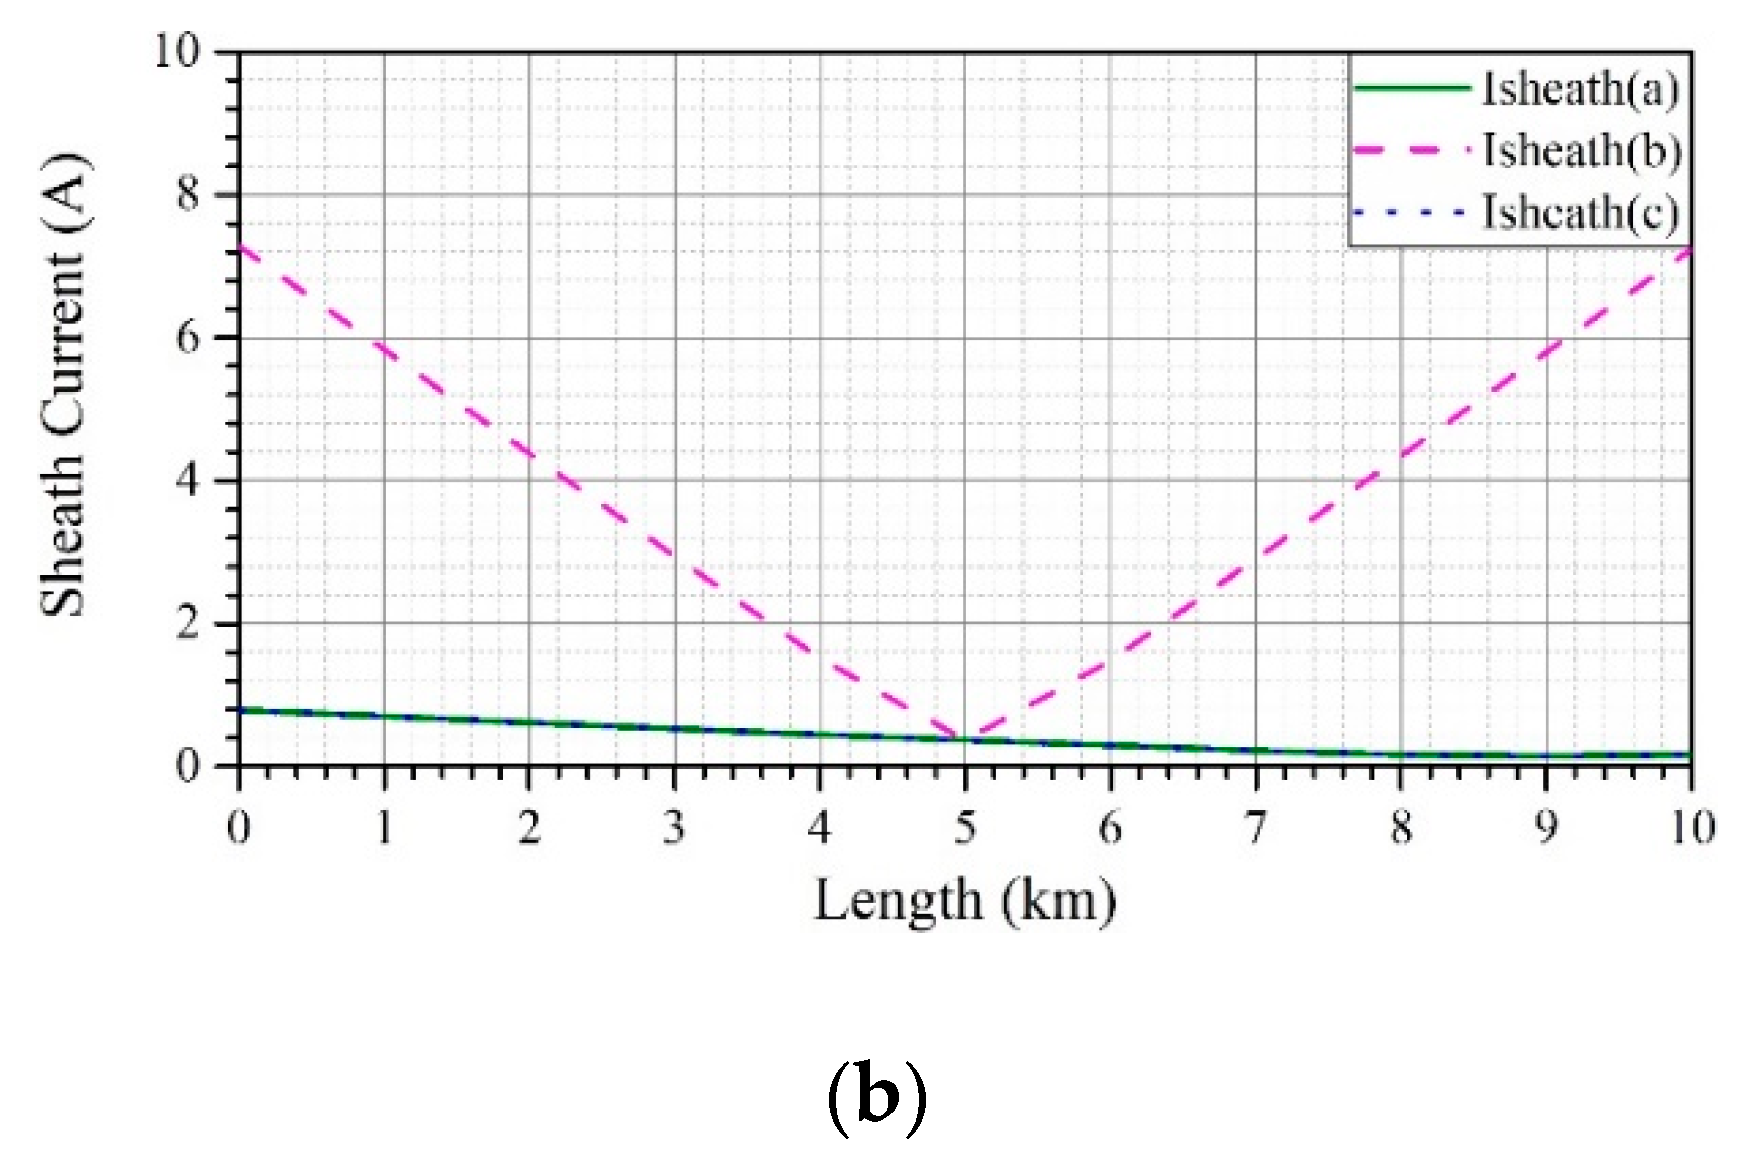
- In Figure 9b the DC source in addition to dominant harmonic voltage sources are applied at sending end of the cable. It can be seen in Figure 10 that resulting rms values of sheath voltage and current are significantly higher than that obtained from harmonic sources alone. This indicates a DC bias introduced to the sheath voltage and current.
- 3-
5. Results
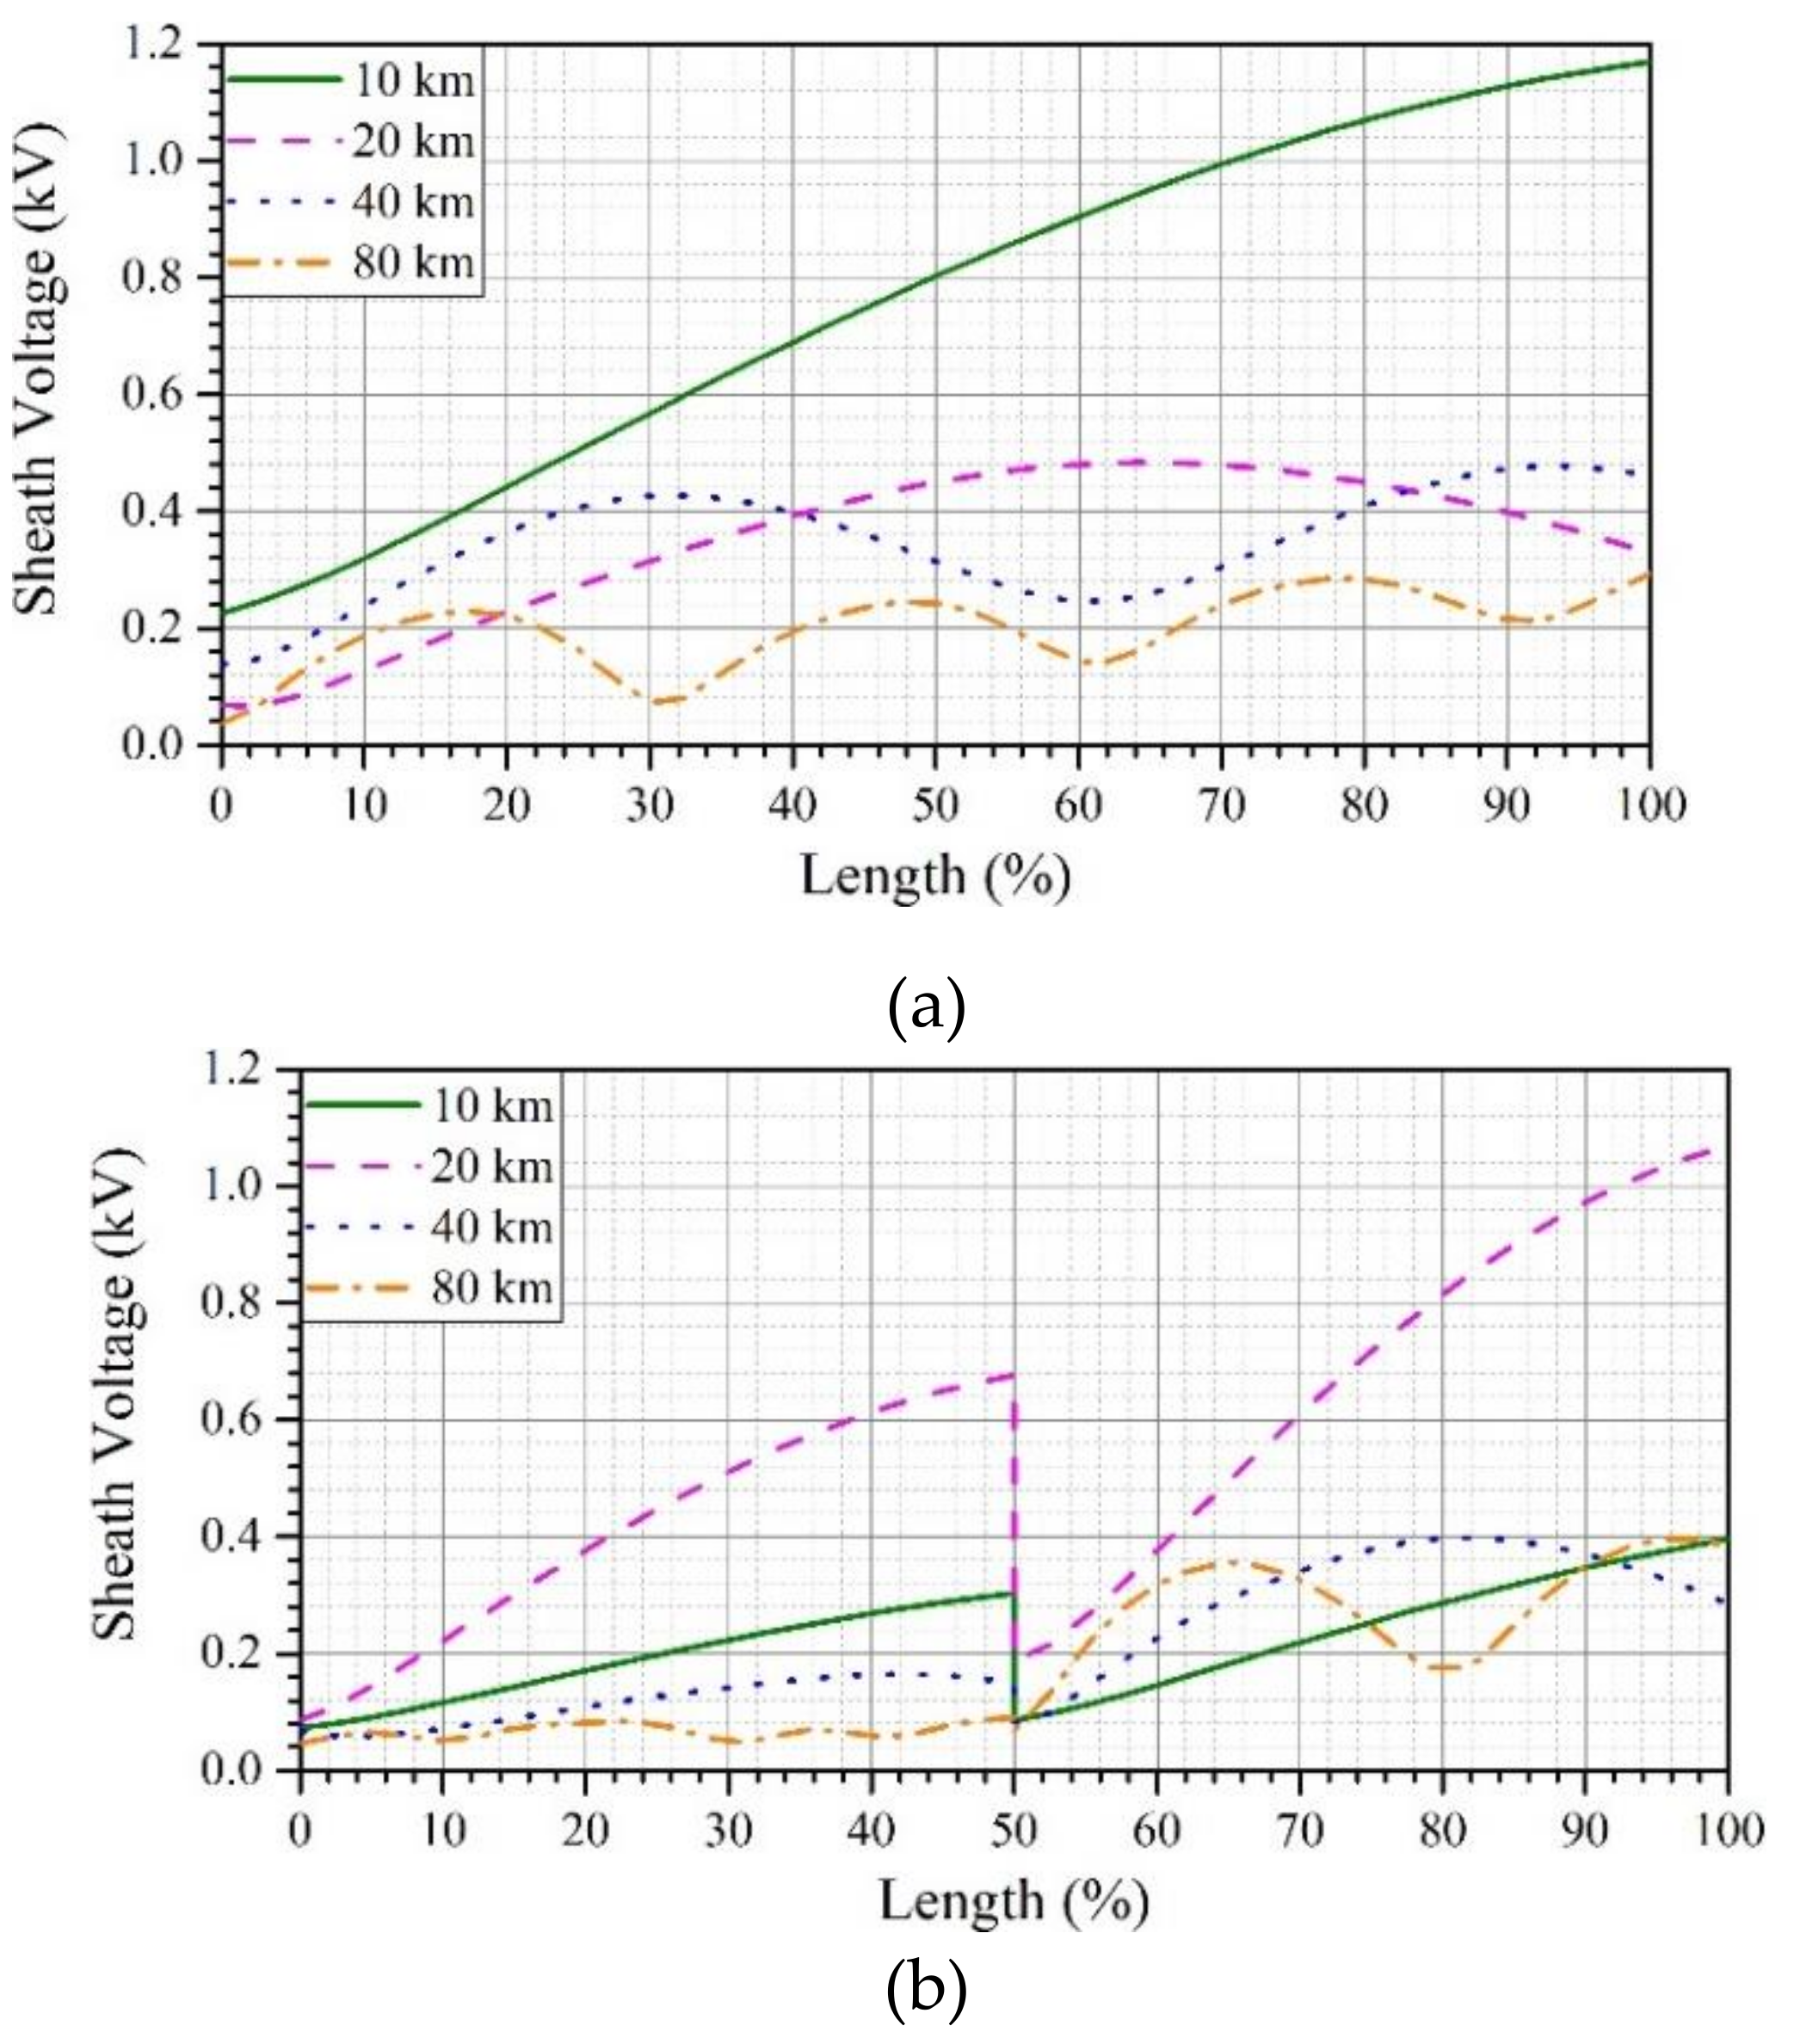
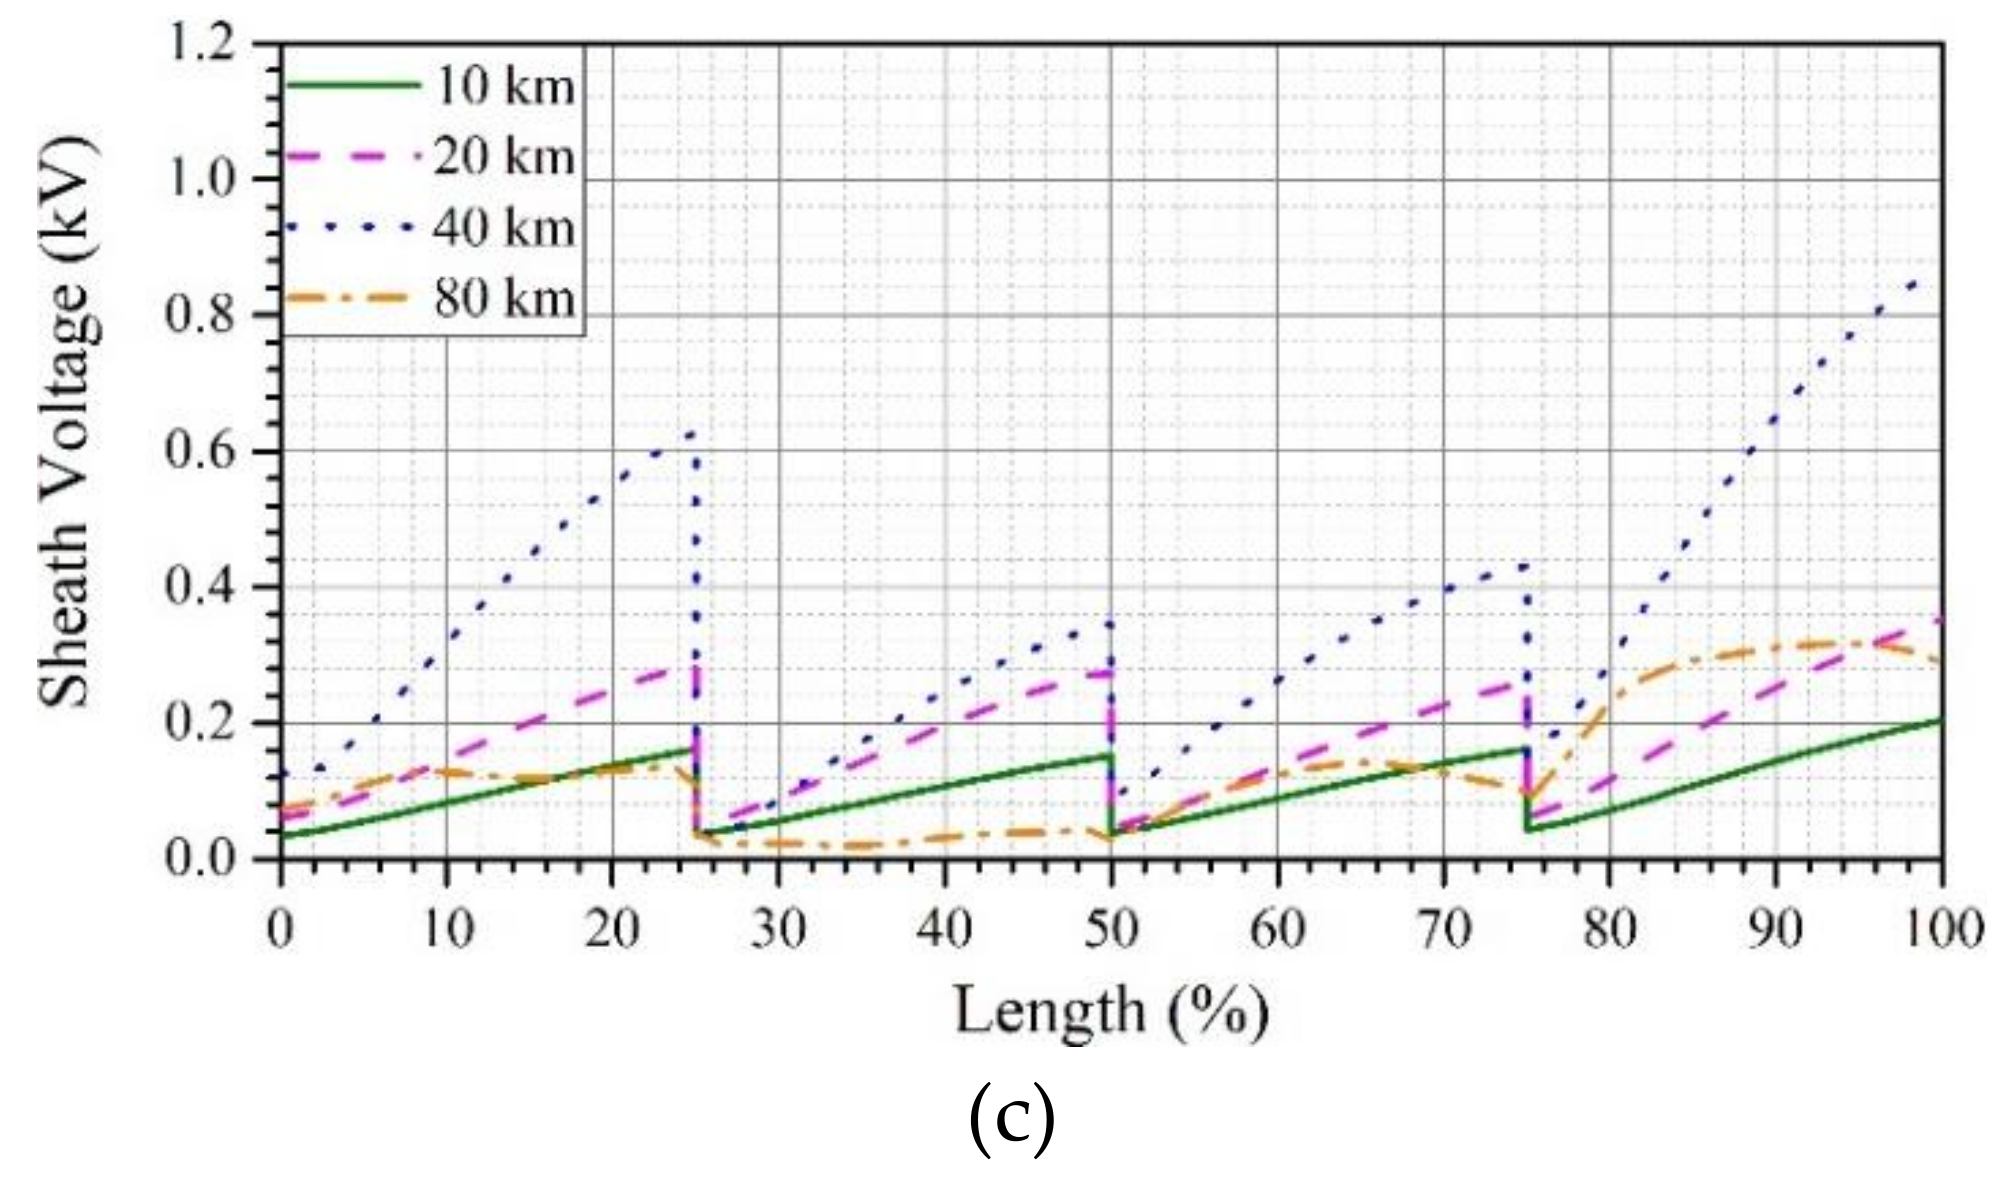
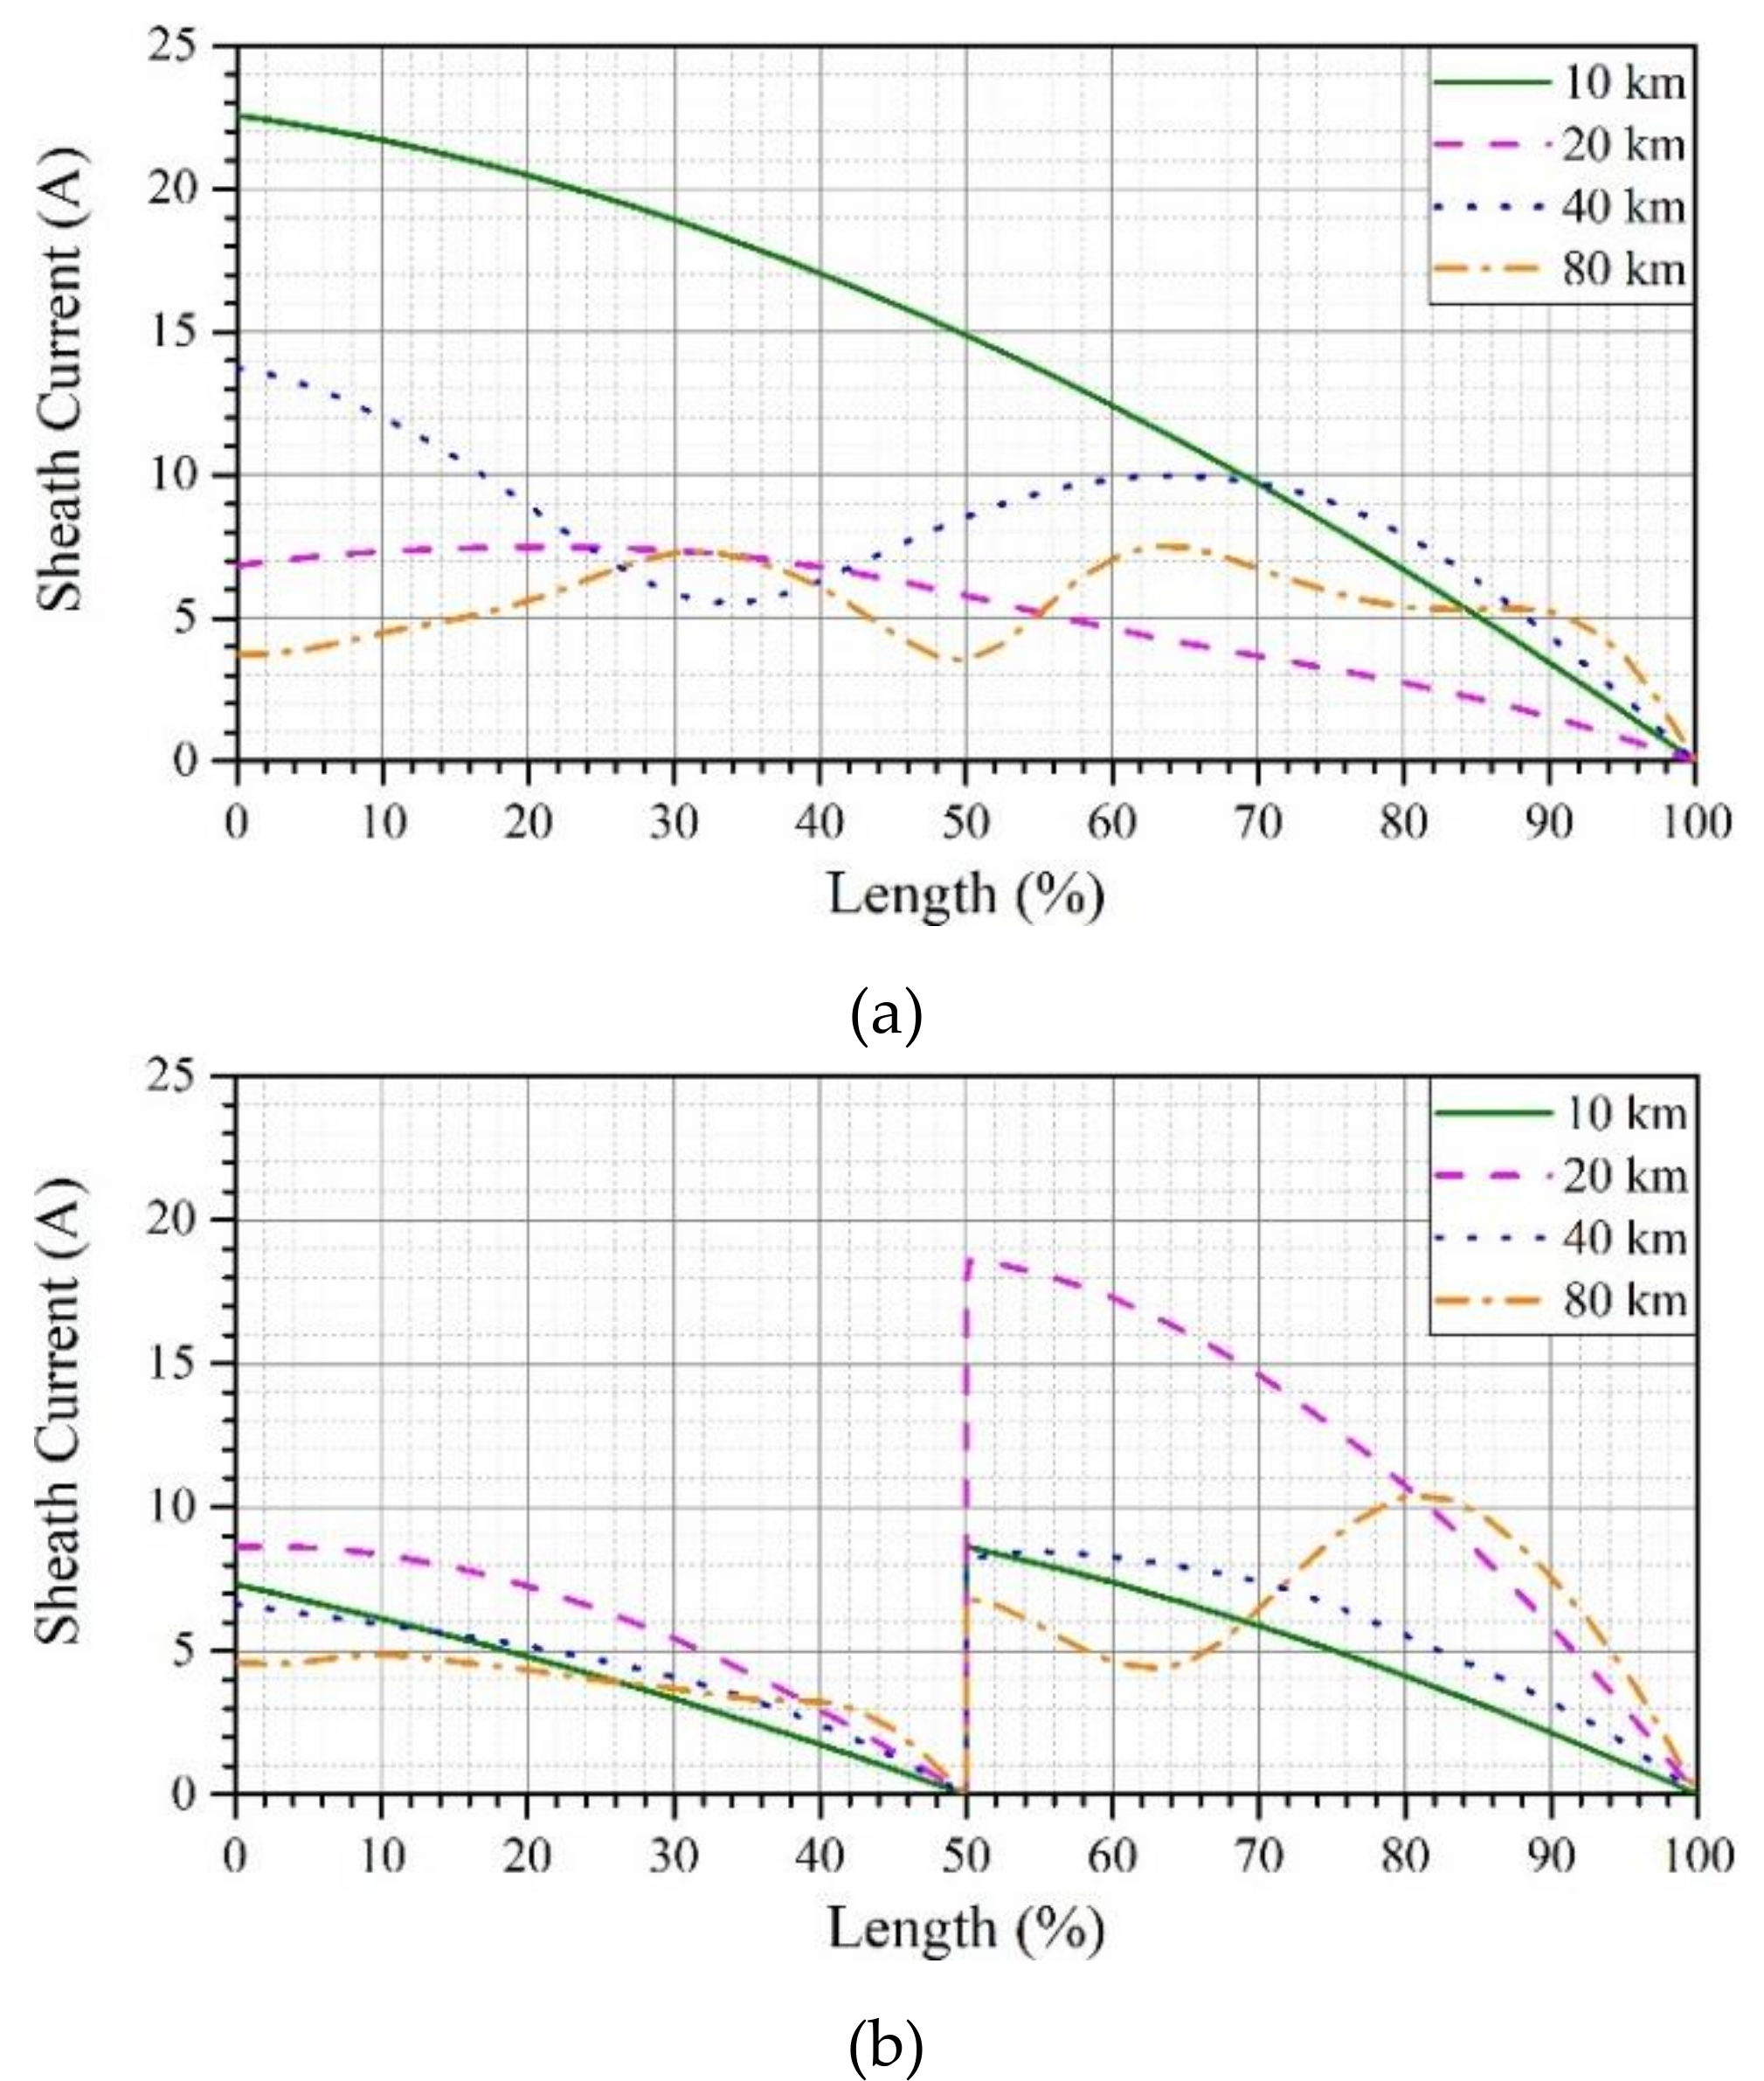
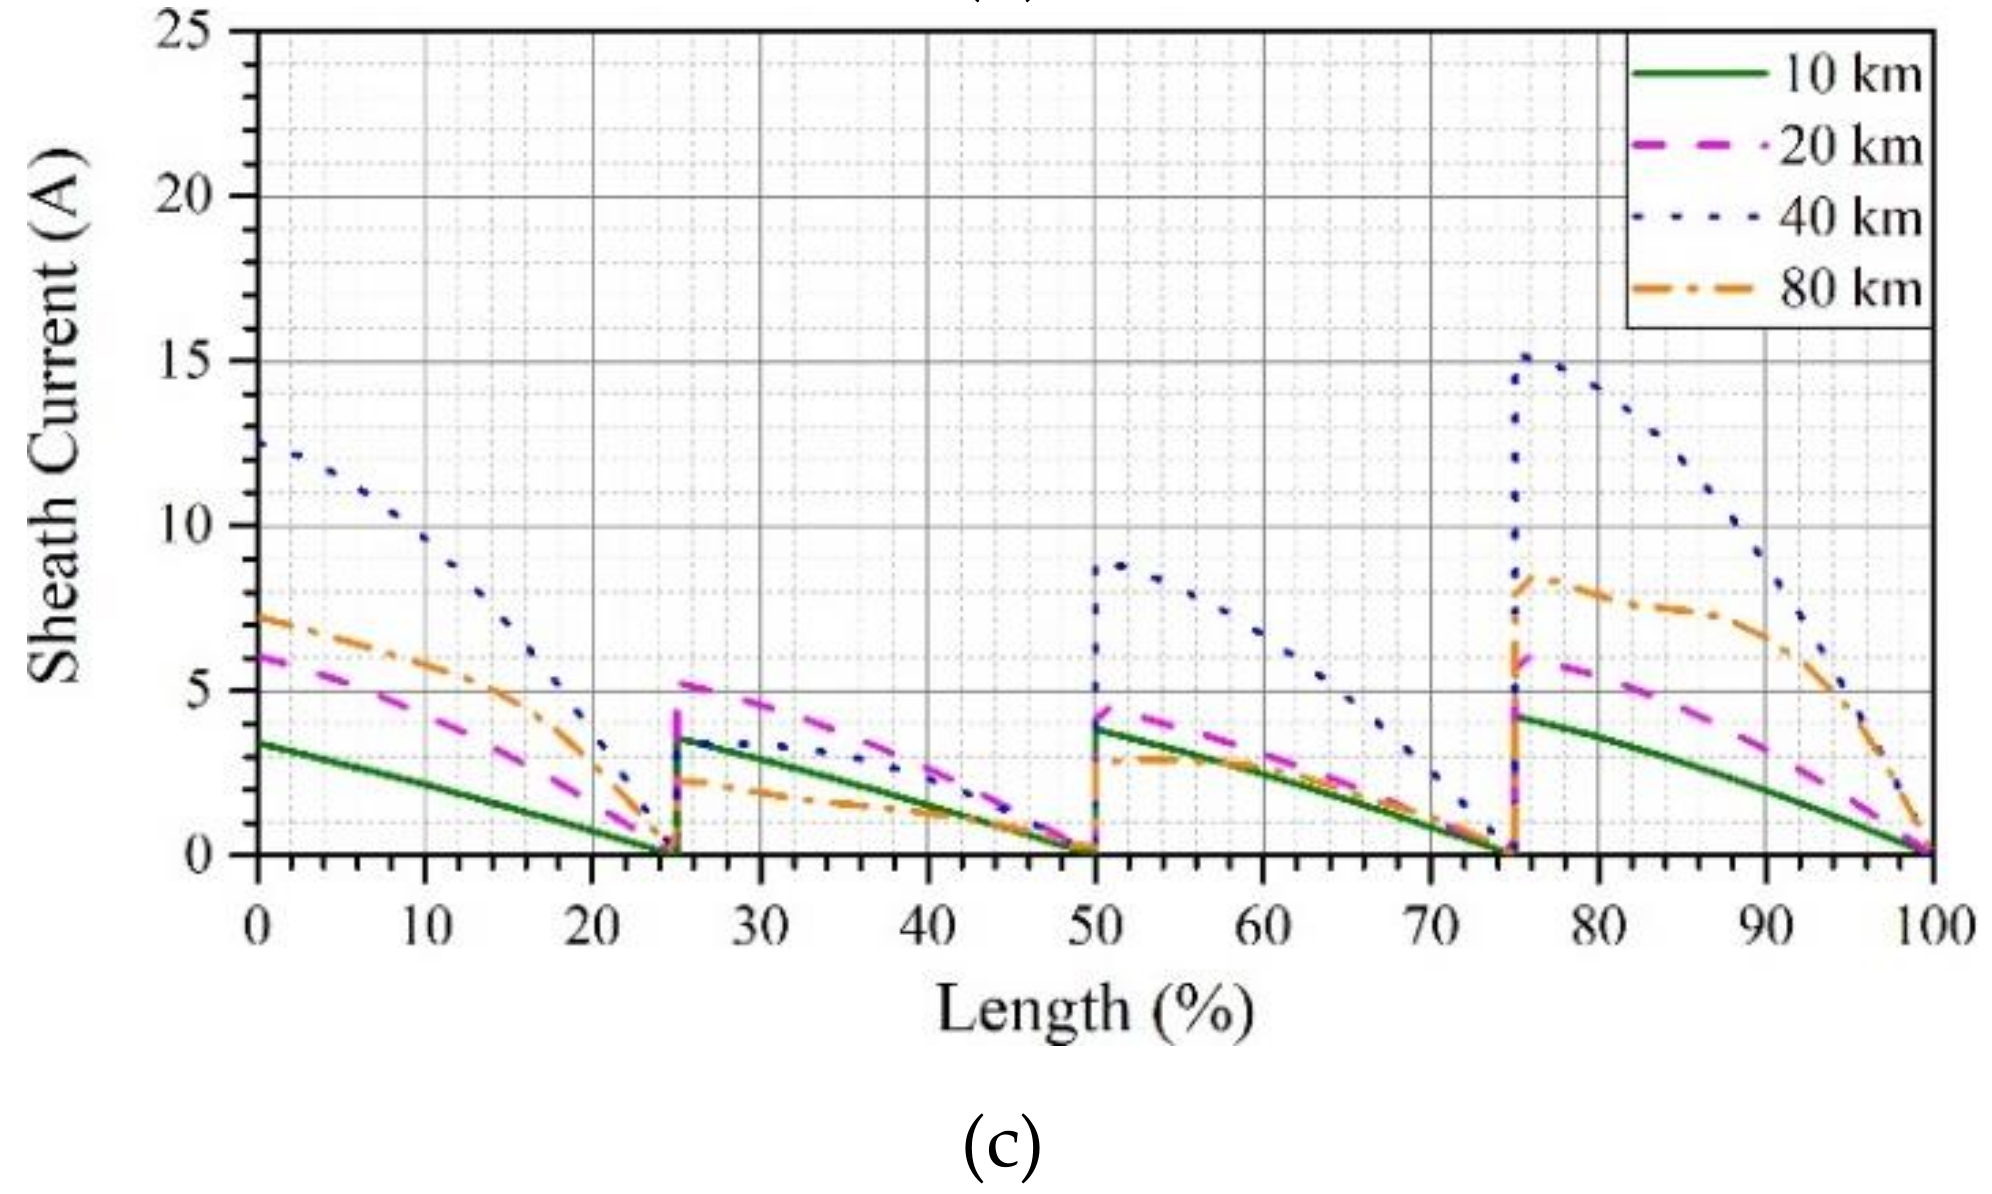
5.1. TG/MPG Scheme
5.2. SPG/MSPG Scheme
6. Discussion
- The magnitudes of dominant harmonic component of current in DC line changes with the changing length of line. This is because the harmonic components face the series reactance and shunt admittance as opposed to the DC component.
- As per faradays law the voltage is induced in the sheath due to changing current and depends upon the rate of change of current. Therefore, 24th harmonic current component can induce the same amount of voltage in sheath as 12th harmonic component which is twice its magnitude.
- The relative phase angle of harmonic component keeps on changing along the length of cable. Therefore, along the length of cable, the two harmonic currents for instance 12th and 24th may be additive in certain regions and subtractive in others.
- Shunt admittance between core conductor and sheath and between sheath and ground will be higher for the higher frequency harmonic components. Therefore, the charging current flow caused by different harmonic components will be different.
- Despite the open circuit sheath in SPG/MSPG, the current flow does not stop. It is contradictory to the concept of single point grounding in AC cable where the sheath current flow is assumed to be limited to zero by open circuiting the sheath. This behavior in DC cable can be attributed to the very high admittance offered to the high frequency harmonic components, resulting in high charging currents from sheath to ground.
7. Conclusions
- The simulation results using ULM with DC error correction by functional form (integrated in PSCAD software) show significant values of steady state voltage and current in sheath even upon application of pure DC voltage to the cable. This contradicts with the physical nature of the HVDC cable, where pure DC voltage should not cause any sheath voltage or currents.
- Removal of DC component from the evaluated values of sheath voltage and current as per method suggested in this paper can provide accurate values of sheath voltage and currents.
- The steady state sheath voltage and losses in TG/MPG are generally lower than SPG/MSPG.
- The sheath grounding at the terminals of cable i.e., TG may generally be adequate to limit the maximum sheath voltage to allowable levels without causing substantial joule loss.
Author Contributions
Funding
Conflicts of Interest
References
- EPRI Report No. 1008720: DC Cable Systems with Extruded Dielectrics; EPRI: Palo Alto, CA, USA, 2004.
- Ildstad, E.; Sletbak, J.; Nyberg, B.R.; Larsen, J.E. Factors affecting the choice of insulation system for extruded HVDC Power Cables. CIGRE Sess. 2004, D1-203, 1–8. [Google Scholar]
- Salah Khalil, M. International research and development trends and problems of HVDC cables with polymeric insulation. IEEE Electr. Insul. Mag. 1997, 13, 35–47. [Google Scholar] [CrossRef]
- Hampton, R.N. Feature article—Some of the considerations for materials operating under high-voltage, direct- current stresses. IEEE Electr. Insul. Mag. 2008, 24, 5–13. [Google Scholar] [CrossRef]
- Maekawa, Y.; Watanabe, K.; Maruyama, S.; Murata, Y.; Hirota, H. Research and development of dc +/− 500kV extruded cables. CIGRÉ 2002, 21, 203. [Google Scholar]
- Hanley, T.L.; Burford, R.P.; Fleming, R.J.; Barber, K.W. A general review of polymeric insulation for use in HVDC cables. IEEE Electr. Insul. Mag. 2003, 19, 13–24. [Google Scholar] [CrossRef]
- Mazzanti, G.; Marzinotto, M. Improved Design of HVDC Extruded Cable Systems. In Extruded Cables for High-Voltage Direct-Current Transmission: Advances in Research and Development, 1st ed.; Wiley: Hoboken, NJ, USA, 2013; p. 45. [Google Scholar]
- Faruque, M.O.; Zhang, Y.; Dinavahi, V. Detailed Modeling of CIGRÉ HVDC Benchmark System Using PSCAD/EMTDC and PSB/SIMULINK. IEEE Trans. Power Deliv. 2006, 21, 378–387. [Google Scholar] [CrossRef]
- Calculation of the Continuous Current Rating of Cables (100% Load Factor), Parts 1 and 2; IEC-Publ. 60287; IEC: Geneva, Switzerland, 2012–2016.
- Shaban, M.; Salam, M.A.; Ang, S.P.; Voon, W. Induced sheath voltage in power cables: A review. Renew. Sustain. Energy Rev. 2016, 62, 1236–1251. [Google Scholar] [CrossRef]
- 575-2014-IEEE Guide for Bonding Shields and Sheaths of Single-Conductor Power Cables Rated 5 kV through 500 kV; IEEE: New York, NY, USA, 2014; pp. 1–83.
- Andreas, C.; Konstantinos, A.; Dimitrios, C.; Dimitrios, K.; Konstantinos, P.; Konstantinos, T.; Georgios, G. Capacitive and Inductive Coupling in Cable Systems—Comparative Study between Calculation Methods. In Proceedings of the JICABLE, Versailles, France, 23–27 June 2019; pp. 1–6. [Google Scholar]
- Santos, M.; Calafat, M.A. Dynamic simulation of induced voltages in high voltage cable sheaths: Steady state approach. Int. J. Electr. Power Energy Syst. 2019, 105, 1–16. [Google Scholar] [CrossRef]
- Bates, C.P.; Hawley, G.T. A model for currents and voltages induced within long transmission cables by an EM wave. IEEE Trans. Electromagn. Compat. 1971, 13, 18–31. [Google Scholar] [CrossRef]
- Alexandrou, K.; Tastavridis, K.; Georagallis, G. Sheath circulating currents calculation in asymmetrical schemes for power frequency models. In Proceedings of the JICABLE, Versailles, France, 23–27 June 2019; pp. 1–6. [Google Scholar]
- Noufal, S.; Andres, G. Induced sheath voltage and currents in cross-bonded power cables with consideration of improper connection of bonding leads. In Proceedings of the JICABLE, Versailles, France, 23–27 June 2019; pp. 1–6. [Google Scholar]
- Chmouri, M. A practical method to compute the metallic sheath circulating current for nonstandard cases. In Proceedings of the JICABLE, Versailles, France, 23–27 June 2019; pp. 1–6. [Google Scholar]
- De Silva, H.M.J.; Gole, A.M.; Wedepohl, L.M. Accurate Electromagnetic Transient Simulations of HVDC Cables and Overhead Transmission Lines. In Proceedings of the International Conference on Power System Transients, Lyon, France, 4–7 June 2007; pp. 1–6. [Google Scholar]
- Cervantes, M.; Kocar, I.; Mahseredjian, J.; Ramirez, A. Partitioned Fitting and DC Correction for the Simulation of Electromagnetic Transients in Transmission Lines/Cables. IEEE Trans. Power Deliv. 2018, 33, 3246–3248. [Google Scholar] [CrossRef]
- Cervantes, M.; Kocar, I.; Mahseredjian, J.; Ramirez, A. Partitioned Fitting and DC Correction in Transmission Line/Cable Models. In Proceedings of the International Conference on Power System Transients, Perpignan, France, 16–20 June 2019; pp. 1–6. [Google Scholar]
- Kuwahara, K.; Doench, C. Evaluation of power frequency sheath currents and voltages in single-conductor cables for various sheath-bonding methods. IEEE Trans. Power Appar. Syst. 1963, 82, 206–235. [Google Scholar]
- Lin, Y.; Xu, Z. Cable Sheath Loss Reduction Strategy Research Based on the Coupled Line Model. IEEE Trans. Power Deliv. 2015, 30, 2303–2311. [Google Scholar] [CrossRef]
- Mahdipour, M.; Akbari, A.; Khalilzadeh, M.; Werle, P. Impact of Different Bonding Methods on High Voltage Cable Shield Induced Voltage and Current in Normal and Fault Conditions. In Proceedings of the 2017 Iranian Conference on Electrical Engineering (ICEE), Tehran, Iran, 2–4 May 2017; pp. 1308–1312. [Google Scholar]
- Brakelmann, H.; Anders, G.J. Current Rating Considerations in Designing HVDC Cable Installations. IEEE Trans. Power Deliv. 2018, 33, 2315–2323. [Google Scholar] [CrossRef]
- Bui-Van, Q.; Beaulieu, G.; Huynh, H.; Rosenqvist, R. Overvoltage studies for the St. Lawrence river 500-kV DC cable crossing. IEEE Trans. Power Deliv. 1991, 6, 1205–1215. [Google Scholar] [CrossRef]
- Asif, M.; Lee, H.-Y.; Khan, U.A.; Park, K.-H.; Lee, B.W. Analysis of Transient Behavior of Mixed High Voltage DC Transmission Line Under Lightning Strikes. IEEE Access 2019, 7, 7194–7205. [Google Scholar] [CrossRef]
- Goertz, M.; Wenig, S.; Hirsching, C.; Kahl, M.; Suriyah, M.; Leibfried, T. Analysis of Extruded HVDC Cable Systems Exposed to Lightning Strokes. IEEE Trans. Power Deliv. 2018, 33, 3009–3018. [Google Scholar] [CrossRef]
- Szechtman, M.; Wess, T.; Thio, C.V. First benchmark model for HVDC control studies. Electra 1991, 135, 54–73. [Google Scholar]
- Morched, A.; Gustavsen, B.; Tartibi, M. A universal model for accurate calculation of electromagnetic transients on overhead lines and underground cables. IEEE Trans. Power Deliv. 1999, 14, 1032–1038. [Google Scholar] [CrossRef]
- Manitoba Hydro International. EMTDC Transient Analysis for PSCAD Power System Simulation; Manitoba Hydro International: Winnipeg, MB, Canada, 2018. [Google Scholar]
- De Siqueira, J.C.G.; Bonatto, B.D.; Marti, J.R.; Hollman, J.A.; Dommel, H.W. Optimum Time Step Size and Maximum Simulation Time in EMTP-Based Programs. In Proceedings of the 2014 Power Systems Computation Conference, Wrocław, Poland, 18–22 August 2014; pp. 1–7. [Google Scholar]


| Cable Length (km) | Section Length (km) | Simulation Time Step (µs) |
|---|---|---|
| 10 | 0.25 | 0.25 |
| 20 | 0.5 | 0.5 |
| 40 | 1 | 1 |
| 80 | 2 | 2 |
| Component | Voltage (kV) | Phase Angle (degrees) |
|---|---|---|
| VDC | 482.5609 | - |
| V12 | 1.765784 (rms) | 351.4925 |
| V24 | 0.131087 (rms) | 31.40078 |
| V36 | 0.080736 (rms) | 348.2392 |
| Length (km) | TG | MPG (2 segs) | MPG (4 segs) (kV) | SPG | MSPG (2 segs) | MSPG (4 segs) |
|---|---|---|---|---|---|---|
| 10 | 0.09 | 0.07 | 0.06 | 1.16 | 0.39 | 0.20 |
| 20 | 0.20 | 0.07 | 0.06 | 0.48 | 1.06 | 0.35 |
| 40 | 0.08 | 0.09 | 0.06 | 0.47 | 0.39 | 0.87 |
| 80 | 0.05 | 0.05 | 0.07 | 0.29 | 0.39 | 0.32 |
| Length (km) | TG | MPG (2 segs) | MPG (4 segs) (joule/km) | SPG | MSPG (2 segs) | MSPG (4 segs) |
|---|---|---|---|---|---|---|
| 10 | 10.37 | 8.83 | 8.35 | 83.18 | 9.15 | 2.03 |
| 20 | 7.81 | 9.08 | 8.76 | 11.19 | 38.53 | 4.86 |
| 40 | 8.76 | 8.18 | 8.77 | 26.48 | 11.29 | 21.68 |
| 80 | 5.38 | 6.31 | 6.29 | 11.22 | 11.90 | 7.26 |
© 2019 by the authors. Licensee MDPI, Basel, Switzerland. This article is an open access article distributed under the terms and conditions of the Creative Commons Attribution (CC BY) license (http://creativecommons.org/licenses/by/4.0/).
Share and Cite
Asif, M.; Lee, H.-Y.; Park, K.-H.; Lee, B.-W. Accurate Evaluation of Steady-State Sheath Voltage and Current in HVDC Cable Using Electromagnetic Transient Simulation. Energies 2019, 12, 4161. https://doi.org/10.3390/en12214161
Asif M, Lee H-Y, Park K-H, Lee B-W. Accurate Evaluation of Steady-State Sheath Voltage and Current in HVDC Cable Using Electromagnetic Transient Simulation. Energies. 2019; 12(21):4161. https://doi.org/10.3390/en12214161
Chicago/Turabian StyleAsif, Mansoor, Ho-Yun Lee, Kyu-Hoon Park, and Bang-Wook Lee. 2019. "Accurate Evaluation of Steady-State Sheath Voltage and Current in HVDC Cable Using Electromagnetic Transient Simulation" Energies 12, no. 21: 4161. https://doi.org/10.3390/en12214161
APA StyleAsif, M., Lee, H.-Y., Park, K.-H., & Lee, B.-W. (2019). Accurate Evaluation of Steady-State Sheath Voltage and Current in HVDC Cable Using Electromagnetic Transient Simulation. Energies, 12(21), 4161. https://doi.org/10.3390/en12214161