An Adiabatic Coaxial Line for Microcalorimeter Power Measurements in Wireless Communication for Smart Grid †


1
Valine Consulting, Zagreb 10000, Croatia
2
Department of Electrical Engineering and Fundamentals, Faculty of Electrical Engineering and Computing, University of Zagreb, Zagreb 10000, Croatia
3
Radio Development Unit, Research and Development Centre, Ericsson Nikola Tesla, Zagreb 10000, Croatia
*
Author to whom correspondence should be addressed.
†
This paper is an extended version of our paper published in 2019, 2nd International Colloquium on Smart Grid Metrology (SMAGRIMET), Split, 9–12 April 2019, pp. 131–134.
Energies 2019, 12(21), 4194; https://doi.org/10.3390/en12214194
Submission received: 16 September 2019
/
Revised: 24 October 2019
/
Accepted: 1 November 2019
/
Published: 3 November 2019
(This article belongs to the Special Issue 2nd International Colloquium on Smart Grid Metrology (SmaGriMet 2019))
Abstract
:This paper presents the extended results and prototype of the adiabatic copper conductor constructed with two interruption points in the external conductor layer, for use as a microcalorimeter power standard in wireless communication for a smart grid frequency range. Gaps are intended to drive down the thermal transfer from the outer environment into microcalorimeter and to reduce measurement inaccuracies in the microcalorimeter. The proposed design method is based on the combination of thermal and electromagnetic finite-element method simulations by which the desired line performance has been tailored. A prototype of the proposed adiabatic line has been manufactured and measurements on the prototype are presented along with the design procedure. Measured results are in line with the ones predicted by numerical calculations.
1. Introduction
Proper calibration of the radio-frequency (RF) sources applied in wireless communication for the smart grid is crucial for reliable and safe operation of the whole system [1]. For calibration factor determination of the commercial thermistor mounts, as well as for the primary power standards, devices named microcalorimeters are nowadays most commonly used due to their high stability in terms of parameters that determine detector efficiency. The thermistor mounts present common transfer power standards in the power range of mW, where most personal communication systems operate [2,3,4,5,6,7].
The principle of a microcalorimeter power standard is to measure the temperature change on a bolometer load when a RF signal is on or off, by which the RF incident power appended to the bolometer can be measured. The structure of dry microcalorimeter [4] is shown in Figure 1. It consists of twin-line and bolometer load [2] encompassed into double-shielded housing. The first adiabatic line is being used as an active reference (“RF ON”) and the second one as a passive reference (“RF OFF”). By knowing the dissipated power in bolometer load and the input reflection coefficient of the bolometer, one can obtain a calibration factor that connects measured and actual incident power (note that the calibration factor depends on frequency [2,8]). The waveguide structures have been generally preferred over the coaxial ones for a long time, due to difficulties of correcting heat losses in the inner coaxial line conductor [9]. The advantage gained by using a twin-line structure [10,11] is that it led to interruption of external coaxial conductor in order to isolate the environmental temperature influence into an isolated calorimeter structure, while at the same time enabled microwave power flow. The power standard using adiabatic lines is shown in [11]. It is compact and possible to calibrate with high accuracy, thereby exhibiting potential for further development.
Although the flange gaps in the adiabatic lines cause an increase in the reflection coefficient (especially in certain frequency bands), their introduction is justified by the improvements in thermal flow. Moreover, careful choice of flange dimensions and construction keeps the reflection coefficient satisfied within the frequency band of operation, while the precise measurement of the reflection coefficient allows measurement results correction. The final overall uncertainties for the whole system are evaluated in [12,13,14,15].
Within our previous research [16] we have performed an additional parametric analysis of the coaxial line with air gap in order to optimize its dimensions for the best microwave signal transmission and for the most feasible manufacturing process. In this paper we propose a modified design of the adiabatic coaxial line which, instead of one, has two air gaps for better thermal isolation. Unlike [10,11,16], the gaps are filled with plastic for robustness and stability (the proposed use in the microcalorimeter is illustrated in Figure 1). The prototype will be used for bolometric detectors calibration. The power standard is focussed on adiabatic line design for operation in the WLAN range (i.e. 2,5 GHz and 5 GHz bands), as this is the frequency range where most communication systems operate today. This user domain [17] in smart grids plays a key role, which is supported by a WLAN 802.11 protocol. This power standard can also be applied in the 5G mid band (1–6 GHz). The 5G system evolution already provides a high quality of service and scalability [18].
Within this paper, we first summarize the principle of bolometric measurements to illustrate the issue of obtaining the microcalorimeter calibration factor. We then present the optimization of the plastic flange-type gap for best signal transmission (using the methodology from [16]), as well as calculations of thermal flow through the proposed coaxial structure with two gaps. Based on calculated theoretical results, in the final part of the paper we present the manufactured coaxial adiabatic line prototype and its characterization.
2. The Microcalorimeter Power Measurement
Figure 1 describes the operation principle of the whole microcalorimeter system to be considered. Two equal bolometric detectors, i.e. thermistor coaxial mounts Agilent 478A, are placed within a highly stable, sealed thermostat (air bath). The thermistor mounts are equipped with type-N 50 Ω male connectors and they can measure microwave power spanning from 1 µW to 10 mW. Both thermistors are fed by the equal adiabatic coaxial lines. The massive metallic thermostat averages room temperature changes and our previous design of the thermostat achieved a thermal time-constant of the thermostat equal to 9.92 hours, with the differences between internal air temperature and the temperature of the thermostat walls within 35 mK [19]. We have already achieved the temperature regulation of air baths equal to 23 °C ± 30 mK [20] as well. The sealed thermostat also prevents variation in the internal air humidity. The radio-frequency (RF) power is applied only to one of the thermistors, while the other one serves as a “dummy” detector. This allows precise RF losses determination in the wall of active thermistor mount, which is a crucial part in the correction factor determination. Due to losses in the active detector wall, the temperature difference occurs between the active and dummy detectors. This temperature difference is measured by the thermopile element. Due to the identical adiabatic lines design, the measured temperature difference can be attributed to the active thermistor mount heating created by the RF power losses in its wall. These losses in the mount walls decrease RF power measured by the RF power meter connected to the active thermistor. Using the presented approach, typical total uncertainties of the system’s effective efficiency are about 0.1%–0.8% for described coaxial systems [12,13,14,15,21].
The microcalorimeter method was primarily developed for the bolometric type of detectors, although it can be used for other detectors at least in principle. The bolometric detectors are, however, inherently most accurate [2], hence its use in metrology-grade measurements. The most common form of bolometric detector is the thermistor detector. When microwave power is applied to a thermistor (which is an element with negative temperature coefficient for the targeted application), it heats up and as a result changes its resistance. By measuring the change in resistance, one can determine the amount of microwave power that had been applied. The change in resistance is usually measured by putting the thermistor within the self-balancing bridge [3,4], as shown in Figure 2. The thermistor is first biased by an external source of direct current (DC, from the power meter) to an operating resistance R0 that matches it to the transmission line and balances the bridge. When microwave energy is applied to the mount, the DC bias is reduced via a feedback loop to rebalance the bridge (i.e. to compensate for the additional power). By reduction in DC power, the microwave power (i.e. the so-called substituted DC power can be measured as:
where VOFF (POFF) and VON (PON) are DC bias voltages (DC powers dissipated at thermistor) for the cases when the RF signal is disconnected from the test line and when connected, respectively.
The substituted power Psub is, however, only a portion of the power applied to the detector due to the losses in the thermistor mount and line section. According to that, we define effective power efficiency as:
where Pnet is the total microwave power applied to the detector structure [2]. Furthermore, the power applied to the detector is eventually related to the actual incident power via mismatch factor as:
where S11 is the detector input reflection coefficient and Pinc is the incident power. Thus the measured and incident powers are related as:
where is also called the calibration factor of detector [2]. To obtain the calibration factor, therefore, one needs to measure the reflection coefficient and the effective efficiency. The latter is found by placing detector into microcalorimeter. The thermopile voltages and for the cases when RF signal is connected and disconnected, respectively, are obtained as [2,4]:
where k is the thermopile sensitivity in volts per watt (note that thermopiles consider dissipated DC power as well). The g factor in (6) is an additional correction factor (since only a portion of applied microwave power is actually measured with the thermopile) and the accuracy of its determination is eventually related to measurement uncertainty of some power standard (it is, thus, the critical part in microcalorimeter design [2]). The effective efficiency is finally calculated from Equation (1) to (6) as:
3. Flange-Type Gaps Design in Coaxial Line
In microwave communications, the use of coaxial structures for transmitting the signal is popular and common, due to its inherent outer environment shielding and capability of single (TEM) mode propagation with low dispersion from DC to frequencies of a few GHz [2]. Therefore, it is also of interest to use coaxial technology for microcalorimeter measurements because of its compactness. Thus, we first proceed to design of the adiabatic coaxial line. The characteristic impedance of the coaxial line Z0 is given as:
where εr is the relative permittivity of the dielectric filling, while r and R are radii of inner and outer conductor, respectively. We chose to adjust the characteristic line impedance to 50 Ω by using an inner diameter of 3 mm and an outer of 6.9 mm according to Equation (8). We have chosen line length of 100 mm, according to the dimensions of the thermostat. The isolation between conductors is filled with air with relative permittivity 1. At the end of the lines we have set up a RPC-N connector head jack [22]. To reduce the heat flow from the environment into an envisaged isolated microcalorimeter structure we have set up two interrupts in external conductors filled with plastic. Of course, by using two gaps (Figure 1), thermal isolation is supposed to be improved—compared to the case with only one gap [10,11]. The outline of a single gap used for simulation is given in Figure 3.
Instead of using air gaps as the interrupts in the external conductor, we further studied the use of plastic spacer rings which allow for easier fabrication of the line. Two different plastic materials were applied in Finite Element Method (FEM) calculations: polyethylene ( = 2.25, tan δ = 0.001 at 9.4 GHz, from the High Frequency Structure Simulator (HFSS) material library) and acetal homopolymer ( = 2.74, tanδ = 0.006 at 11 GHz; material properties created according to [23]). The plastic spacers also enhance mechanical stability and robustness of the structure. To optimize the gap dimensions for the best microwave signal transmission, we perform parametric analysis of the gap performance using a commercial software Ansys HFSS [24] to choose the flange radius which enables optimal signal transfer (other dimensions are optimized in [16]).
The solution error is determined by the size of the finite-element mesh, i.e. by the number of tetrahedra. Adaptive criteria for the mesh refinement were as follows: percentage of refinement was set to 30, which caused the mesh to grow 30% for each pass. The Max Delta S parameter was set to 0.02, which was the stopping criterion for an adaptive solution. This means that the mesh refinement is continued until the complex delta magnitude of all S-parameters changes by less than 0.02, or until the number of requested passes is completed. The number of requested passes was set to 6.
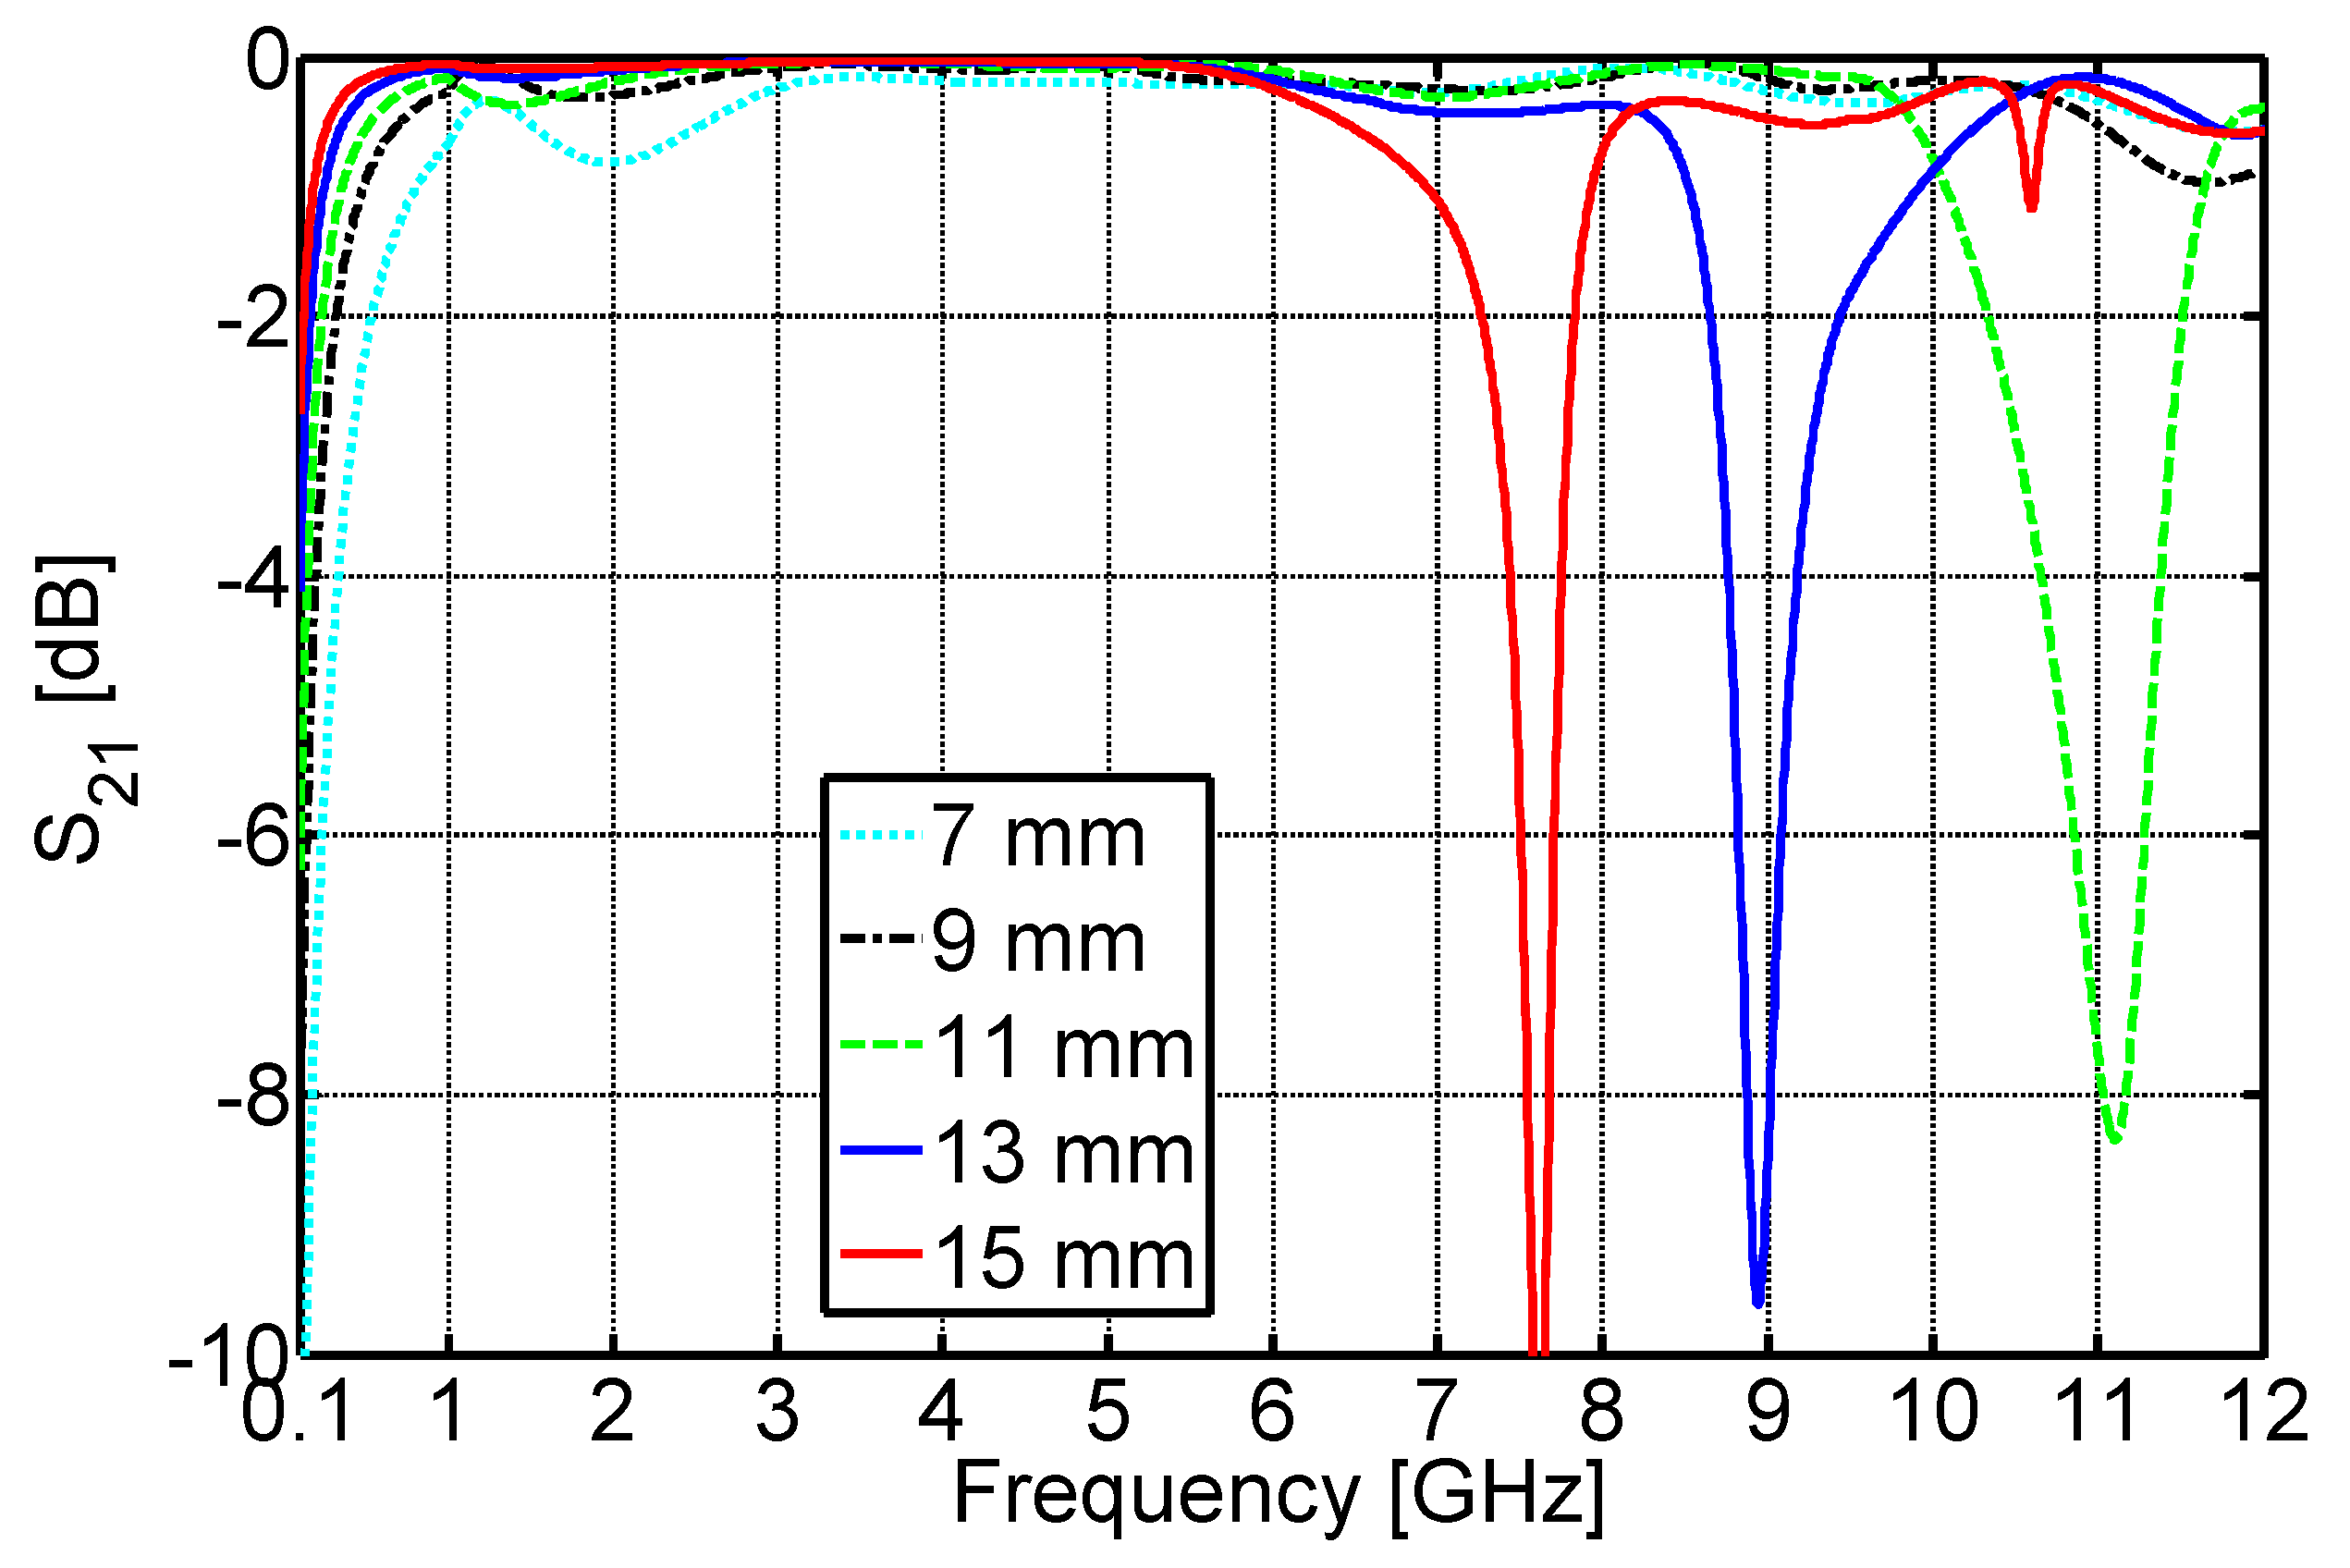
The criterion for optimal signal transfer was set to the level of 95% of power transmission from around 400 MHz to around 6 GHz, which is the desired operating range of the smart grid networks. This approximately corresponds to the condition of transmission parameter magnitude S21 larger than –0.5 dB. The analysis was also performed across a larger frequency range to get an insight into flange behaviour (Figure 4 and Figure 5) where gap resonances are clearly visible for larger gap radii (note that the resonances are limiting the upper operating frequency). The more detailed results around desired frequency and magnitude ranges are shown in Figure 6 and Figure 7.
Although desired properties are satisfied with flange radii 13 and 15 mm, we finally adopted the flange radius equal to 15 mm in our final design, due to possible simulation tolerances and imperfections in the model. It should be noted that the electromagnetic simulations were run only for the line, without connectors and interconnections which cause additional transmission losses, because the goal of this part of the research was the analysis of flange dimensions and design influence on the overall transmission coefficient.
4. Thermal Considerations on the Adiabatic Line
Difference between environmental and housing temperature causes thermal flow through conductors and connectors. For determination of loss in the wall of the mount it is crucial to prevent the heat exchange through the outer conductor of the line. Nevertheless, the analytical calculations for the gapless line reveal that heat flow through the inner conductor is an order of magnitude lower than the overall heat flow. This indicates that most of the heat flow occurs via the outer conductor [5].
As already mentioned in the introduction, the twin line structure with dummy thermistor mount is applied as a tool to measure the additional heating of the active thermistor walls. Therefore, precise determination of the net ambient heat transmission through the line is not crucial, since the temperature appears only as the difference in the temperature between two thermistors. Thus the uncertainty analysis of the whole system is based on losses determination in the wall of the mount, RF losses in the thermal isolation section (only active line), as well as non-linear thermopile response with addition of instrumentation uncertainty [21]. As a consequence, the limits or the methods for evaluation of the heat-transfer limits through the line are not generally known or accepted [21]. The gaps in the external conductor will, therefore, reduce thermal transfer from the outer environment into microcalorimeter and bolometer. That way we may improve the standard accuracy, as described in Section 2. Namely, by adding the gaps and flanges into the coaxial line we reduce the thermal flow through the outer coaxial conductor without affecting the signal transfer within the operating range. To further reduce conductive thermal transfer through the inner conductor, we chose to manufacture it with the shell-type of cross-section with respective radii of 0.75 mm and 1.5 mm. This increases thermal resistance [25] while the signal transfer is again not affected due to the skin effect [2]. Here, the main interest is, nevertheless, to assess the quality of thermal isolation of the gaps, i.e. to quantify how the heat flow through the outer coaxial conductor is reduced by using the gaps. Therefore, we performed additional calculations and thermal simulation using Ansys Mechanical [26]. In the next stage, we ran thermal simulations in Ansys for the coaxial line with one gap in the middle of the line and two gaps evenly spaced 3 cm apart through the line (only the outer conductor is considered). The gaps are filled with plastic in a way described in the previous section. Simulations were run for two different plastic materials which were considered in the electromagnetic calculation: polyethylene (isotropic thermal conductivity 0.4 W/m·K, specific heat 2300 J/kg·K, from the ANSYS database [26]) and acetal homopolymer. The thermal properties of acetal homopolymer are [27]: isotropic thermal conductivity 0.29 W/m·K and specific heat 1460 J/kg·K. The gap width was w = 1 mm for the line with a single gap. For the line with two gaps, the gap width at the input side was set to 1 mm, while the one near the output side was set to 2 mm. Calculated heat flows for the lines with one and two gaps are given in Table 1. The table presents heat flows for spacer rings with two different materials and for the line with one and two gaps. While Table 1 summarizes the overall heat flow (in watts) that is relevant to overall thermal characterization of the device, Figure 8 and Figure 9 show the heat flow density distribution along the line. This reveals portions of the line where the majority of the heat transfer occurs, providing a better understanding of the heat transfer mechanisms. Reference value for the heat flow reduction is defined as heat flow through the gapless coaxial outer conductor of 10 cm length. At the ends of the conductor, the isothermal surfaces with temperatures T1 = 23 °C and T2 = 22 °C were set. In this case, an analytical solution can be calculated applying the Fourier's law of heat conduction [25]. This analytically calculated reference value is 0.2300 W [5]. In addition, it can also be seen that heat flow densities through the gap are several orders of magnitudes lower than through the line, which justifies the use of gaps in reducing the spurious thermal flow throughout the coaxial line.
5. Manufactured Adiabatic Line Prototype
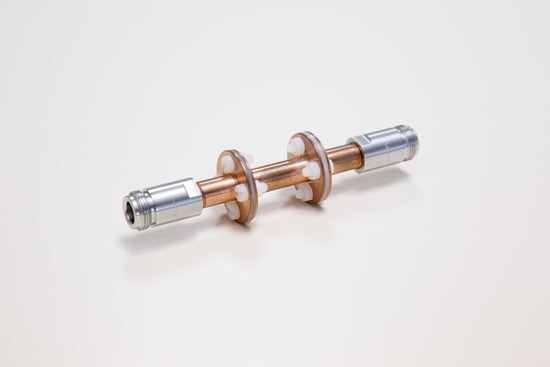
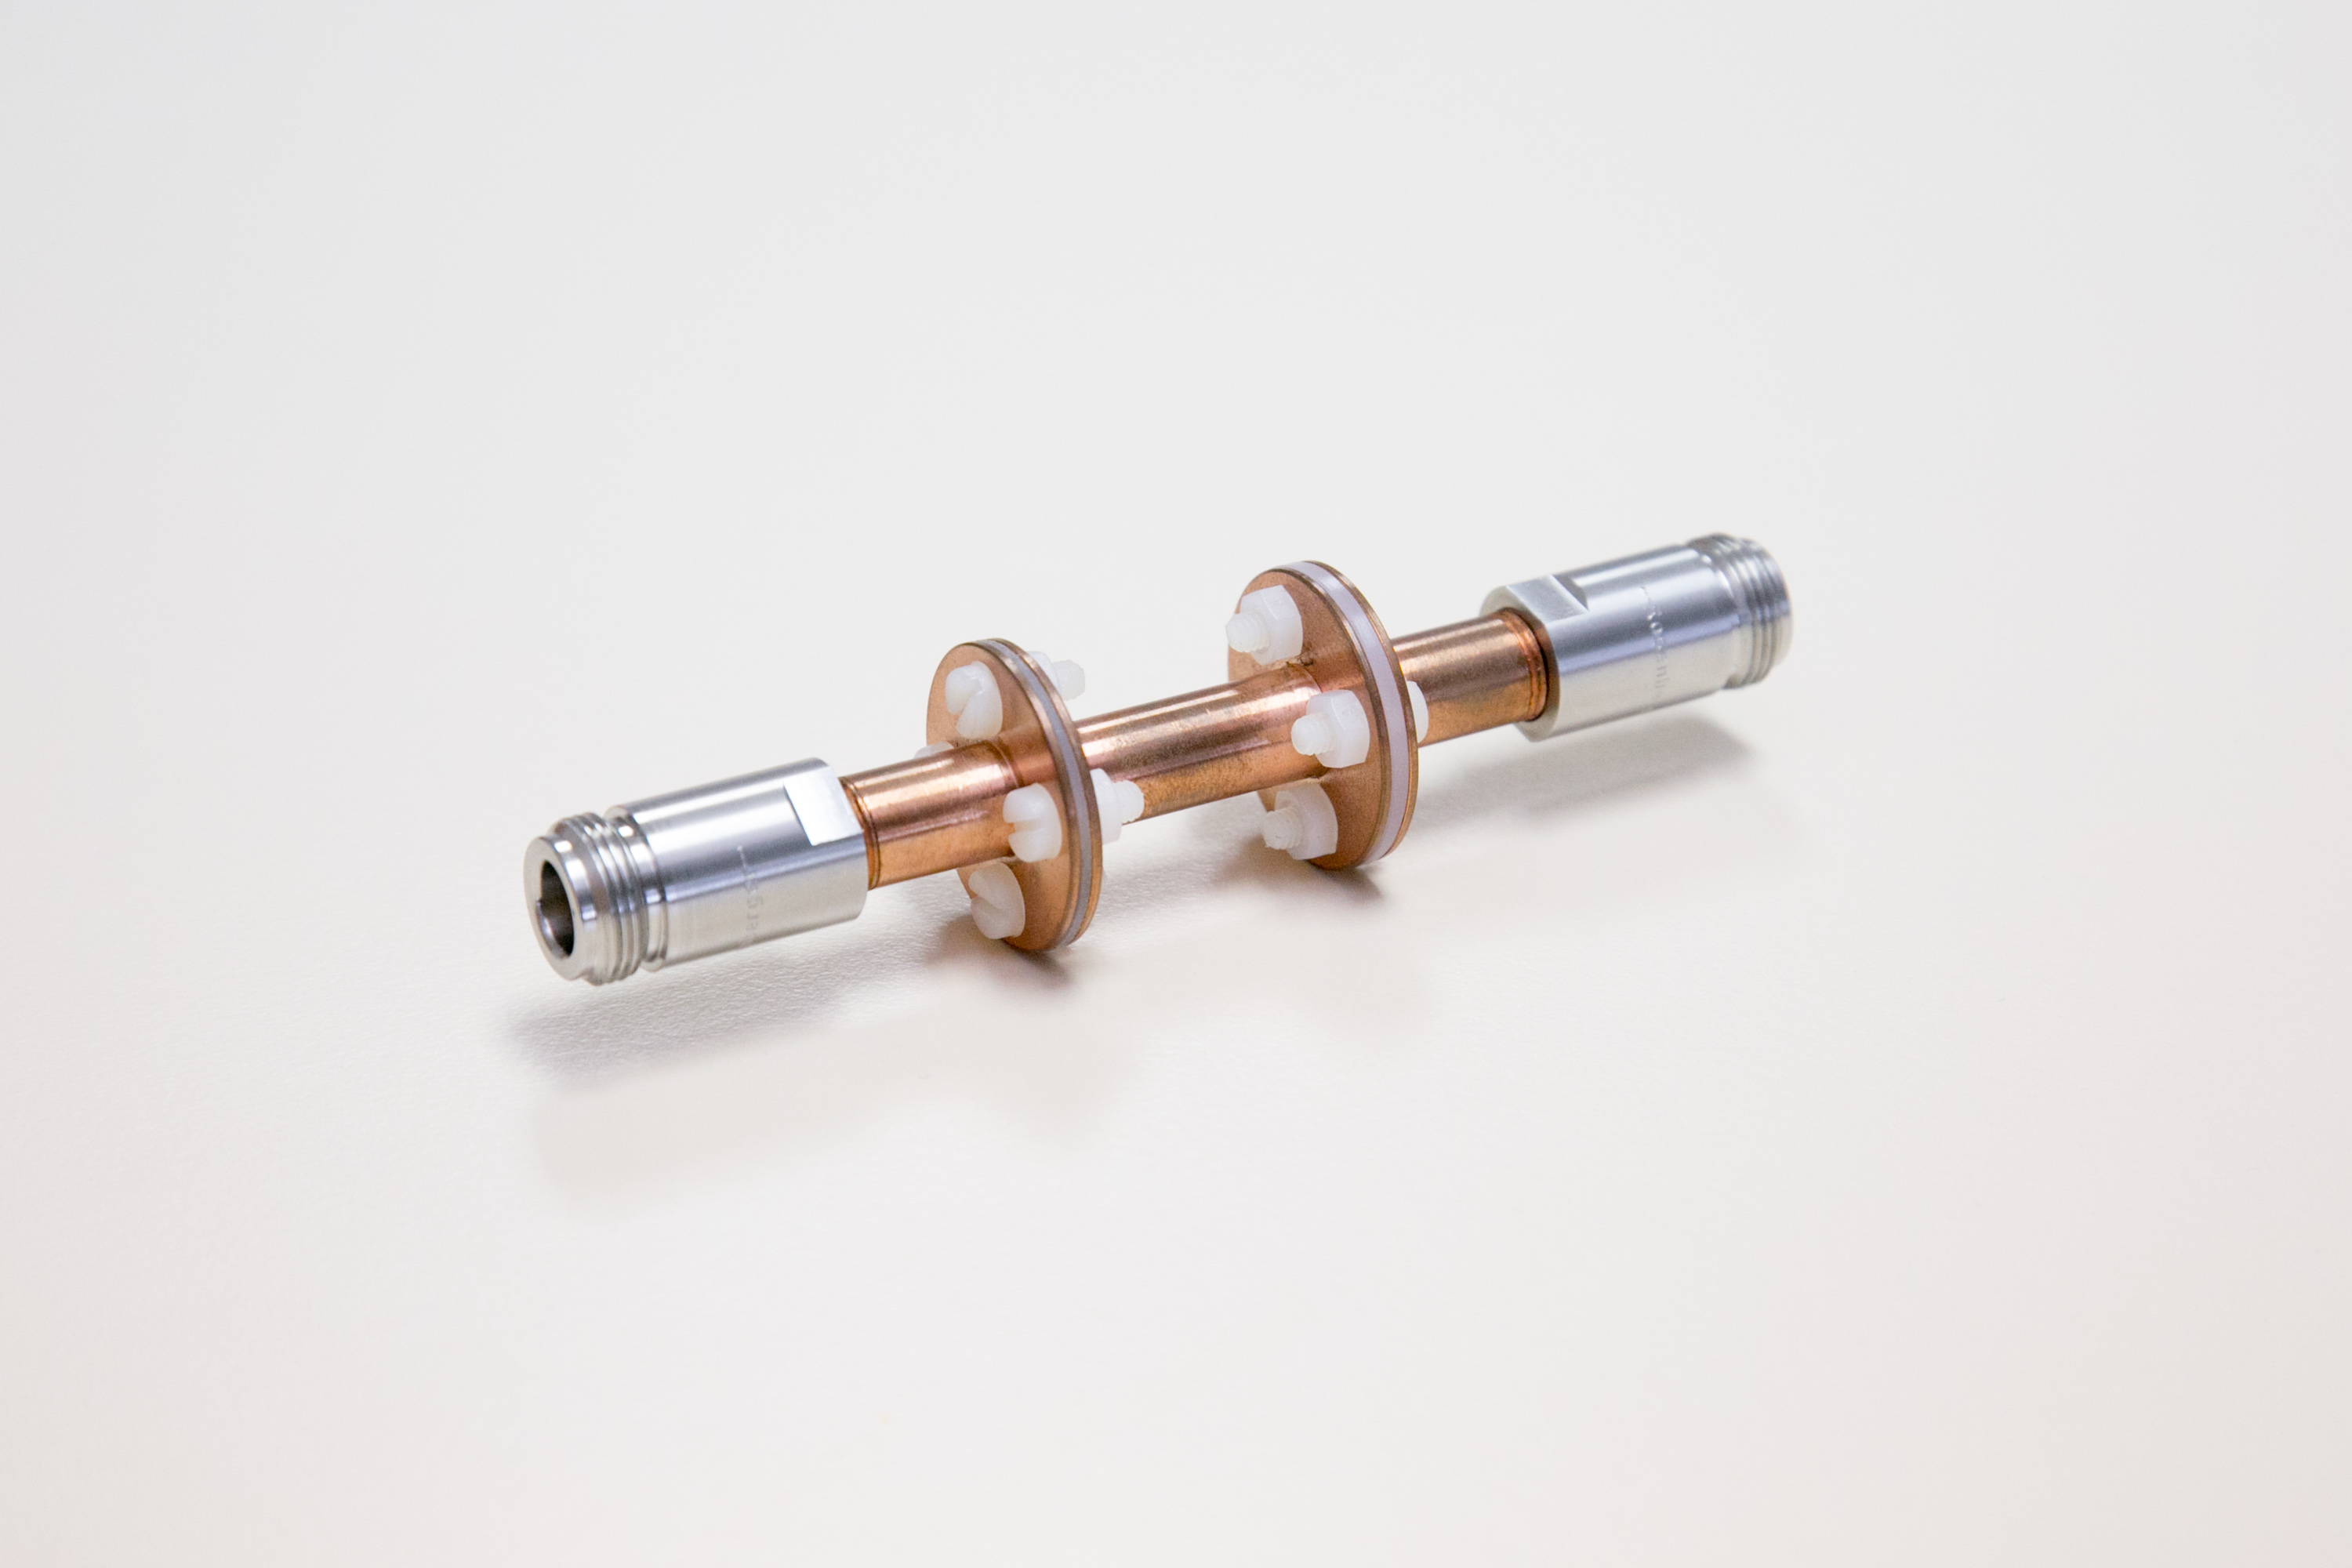
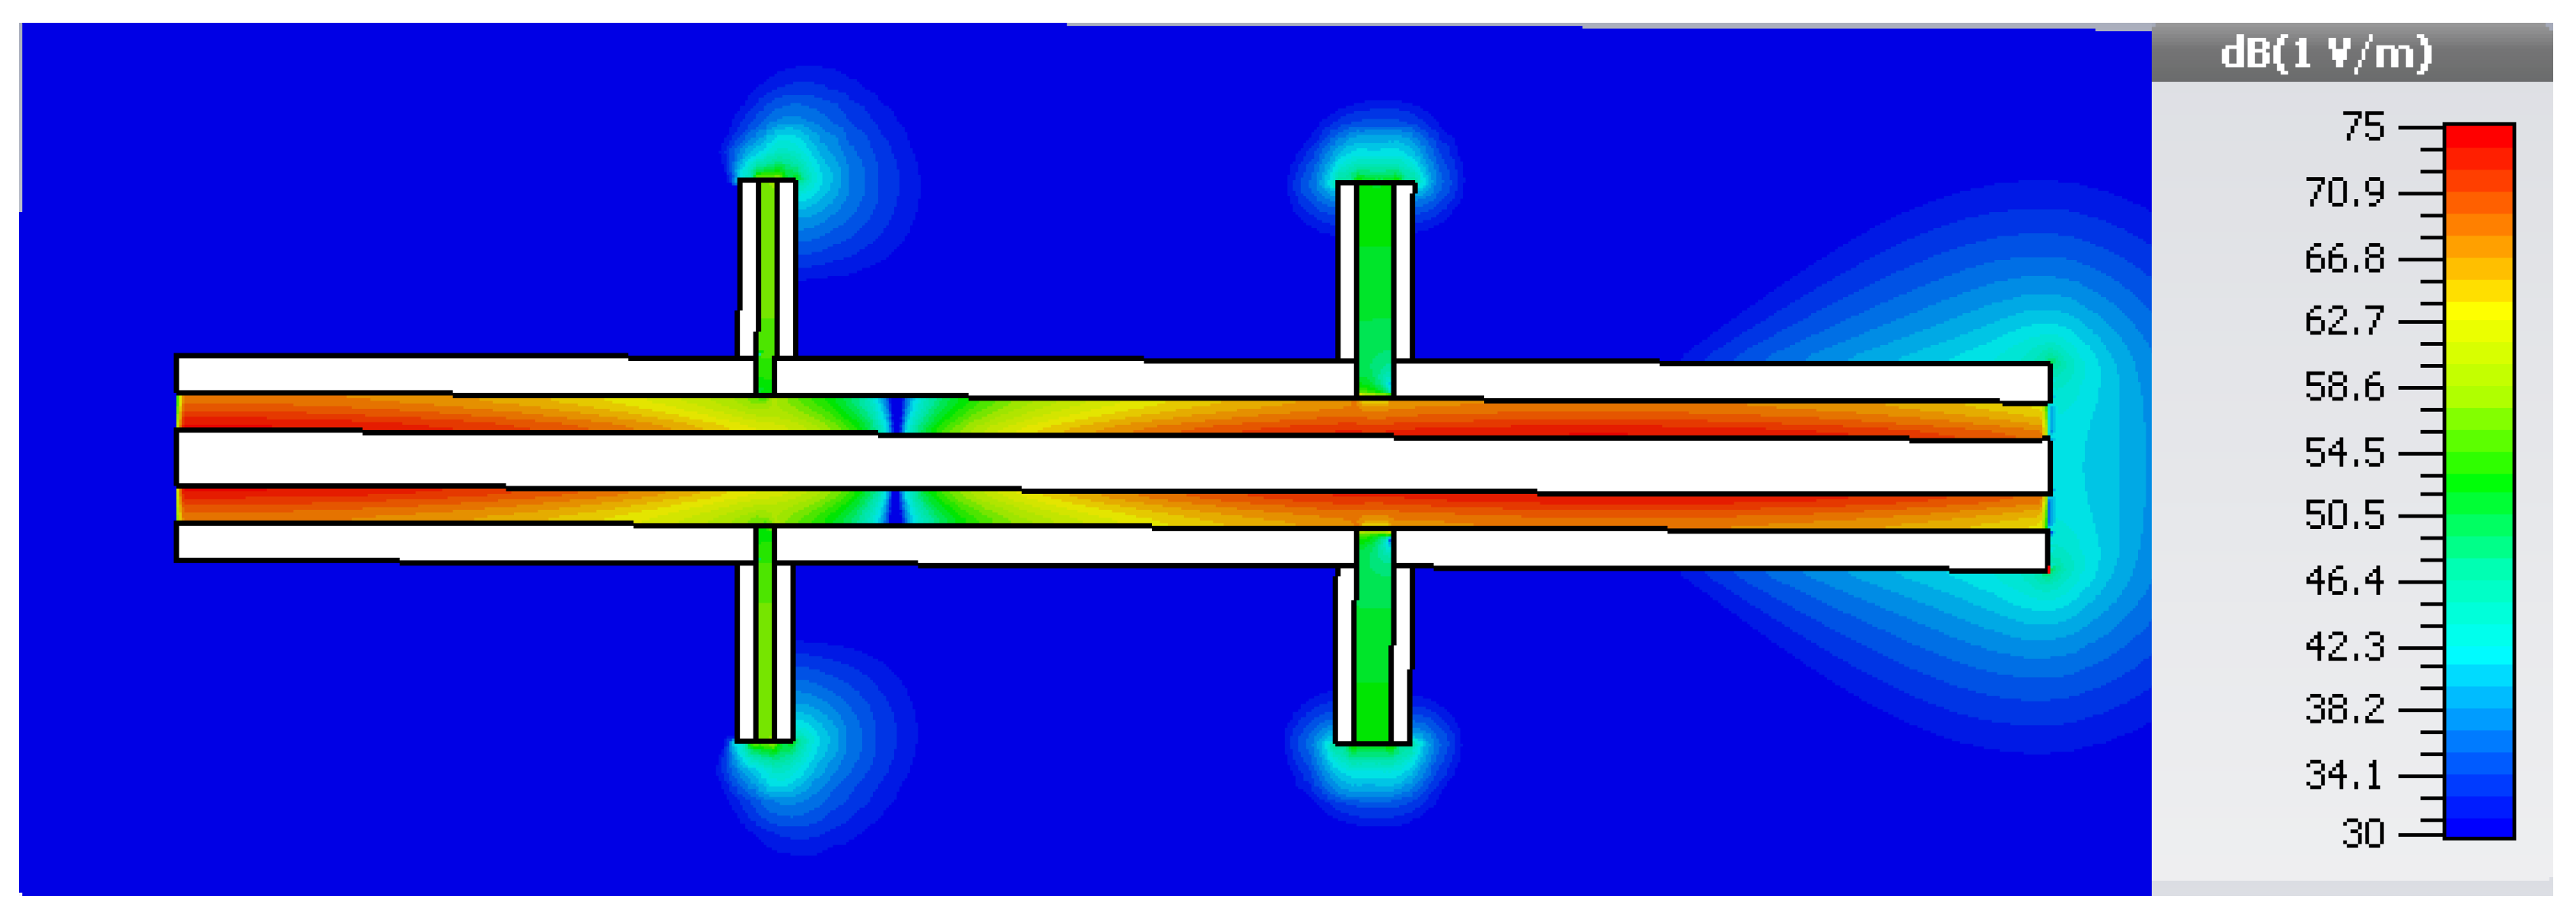
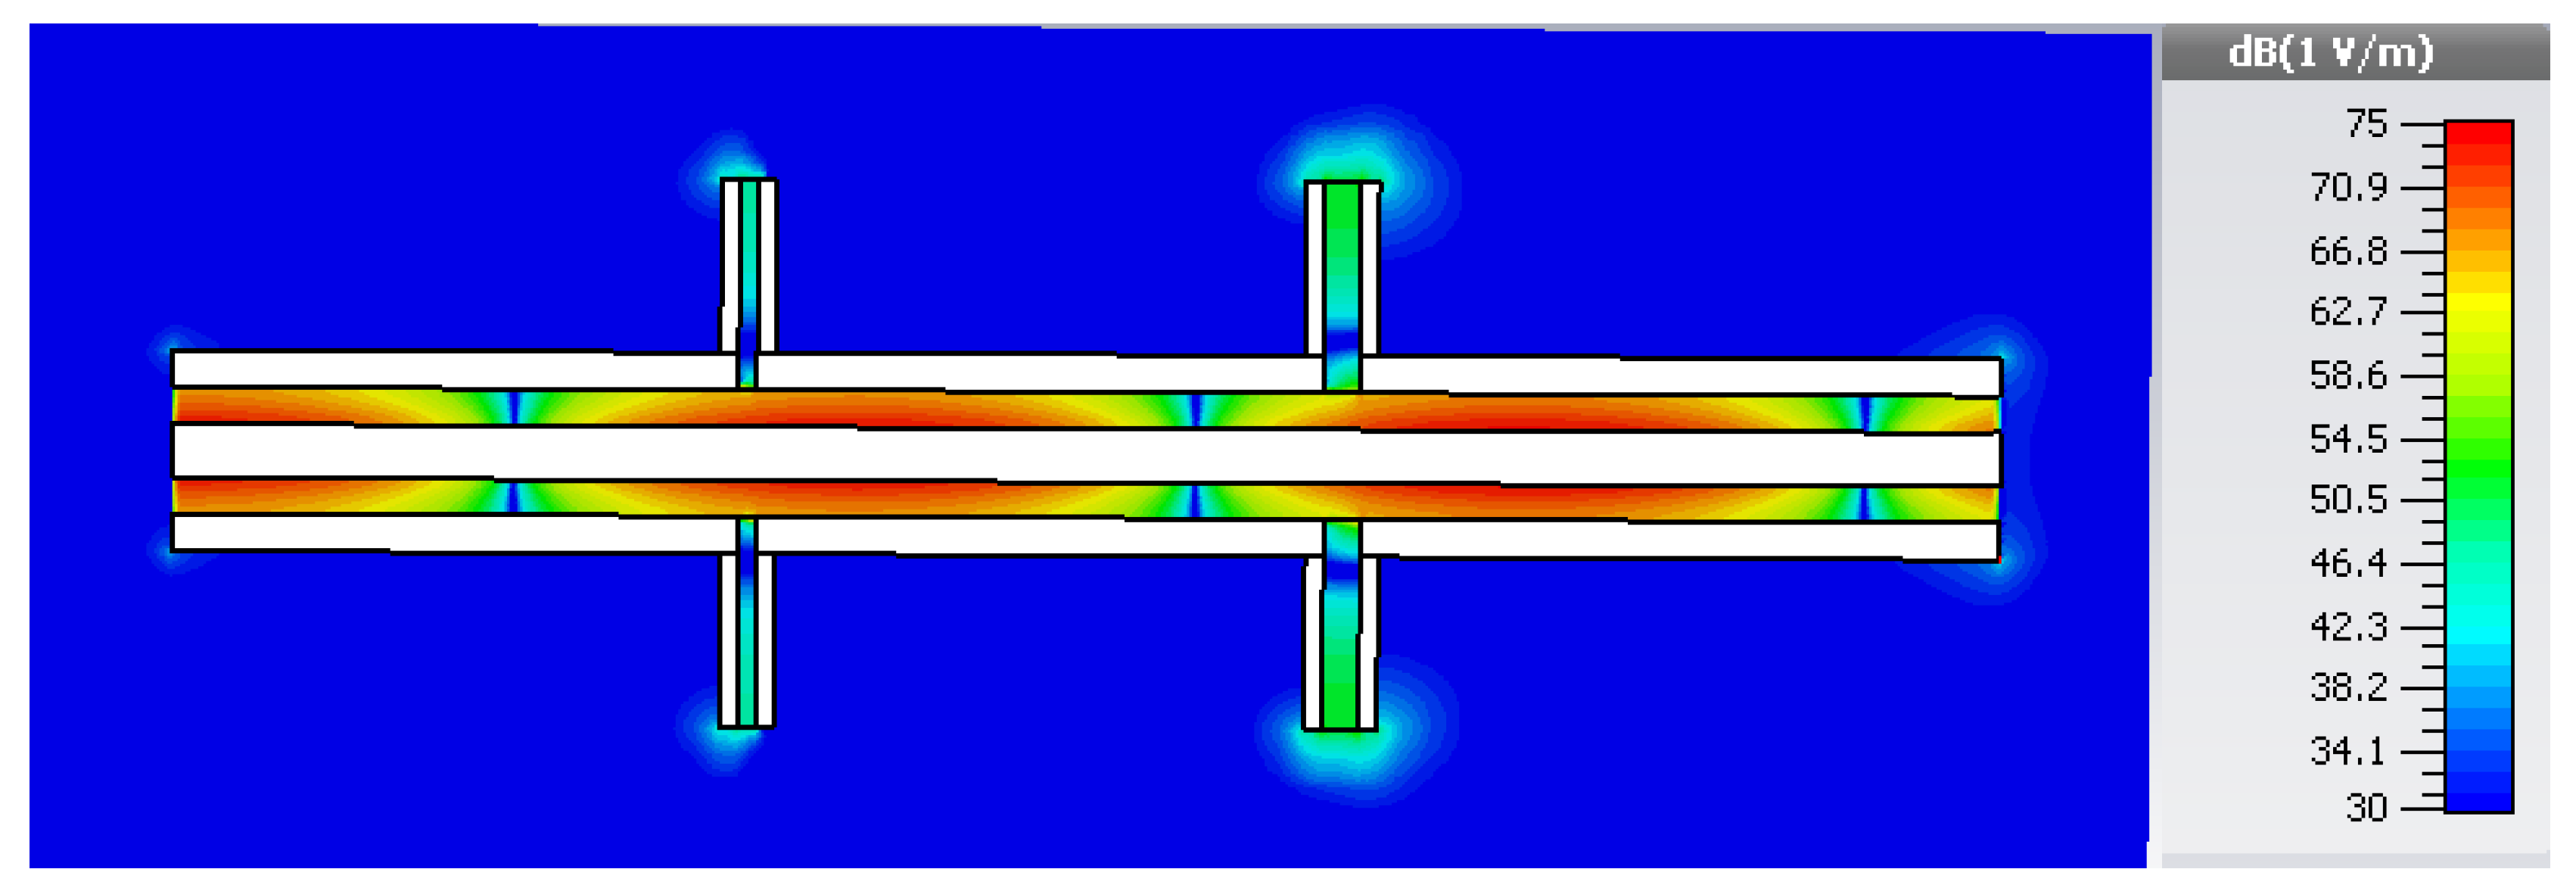
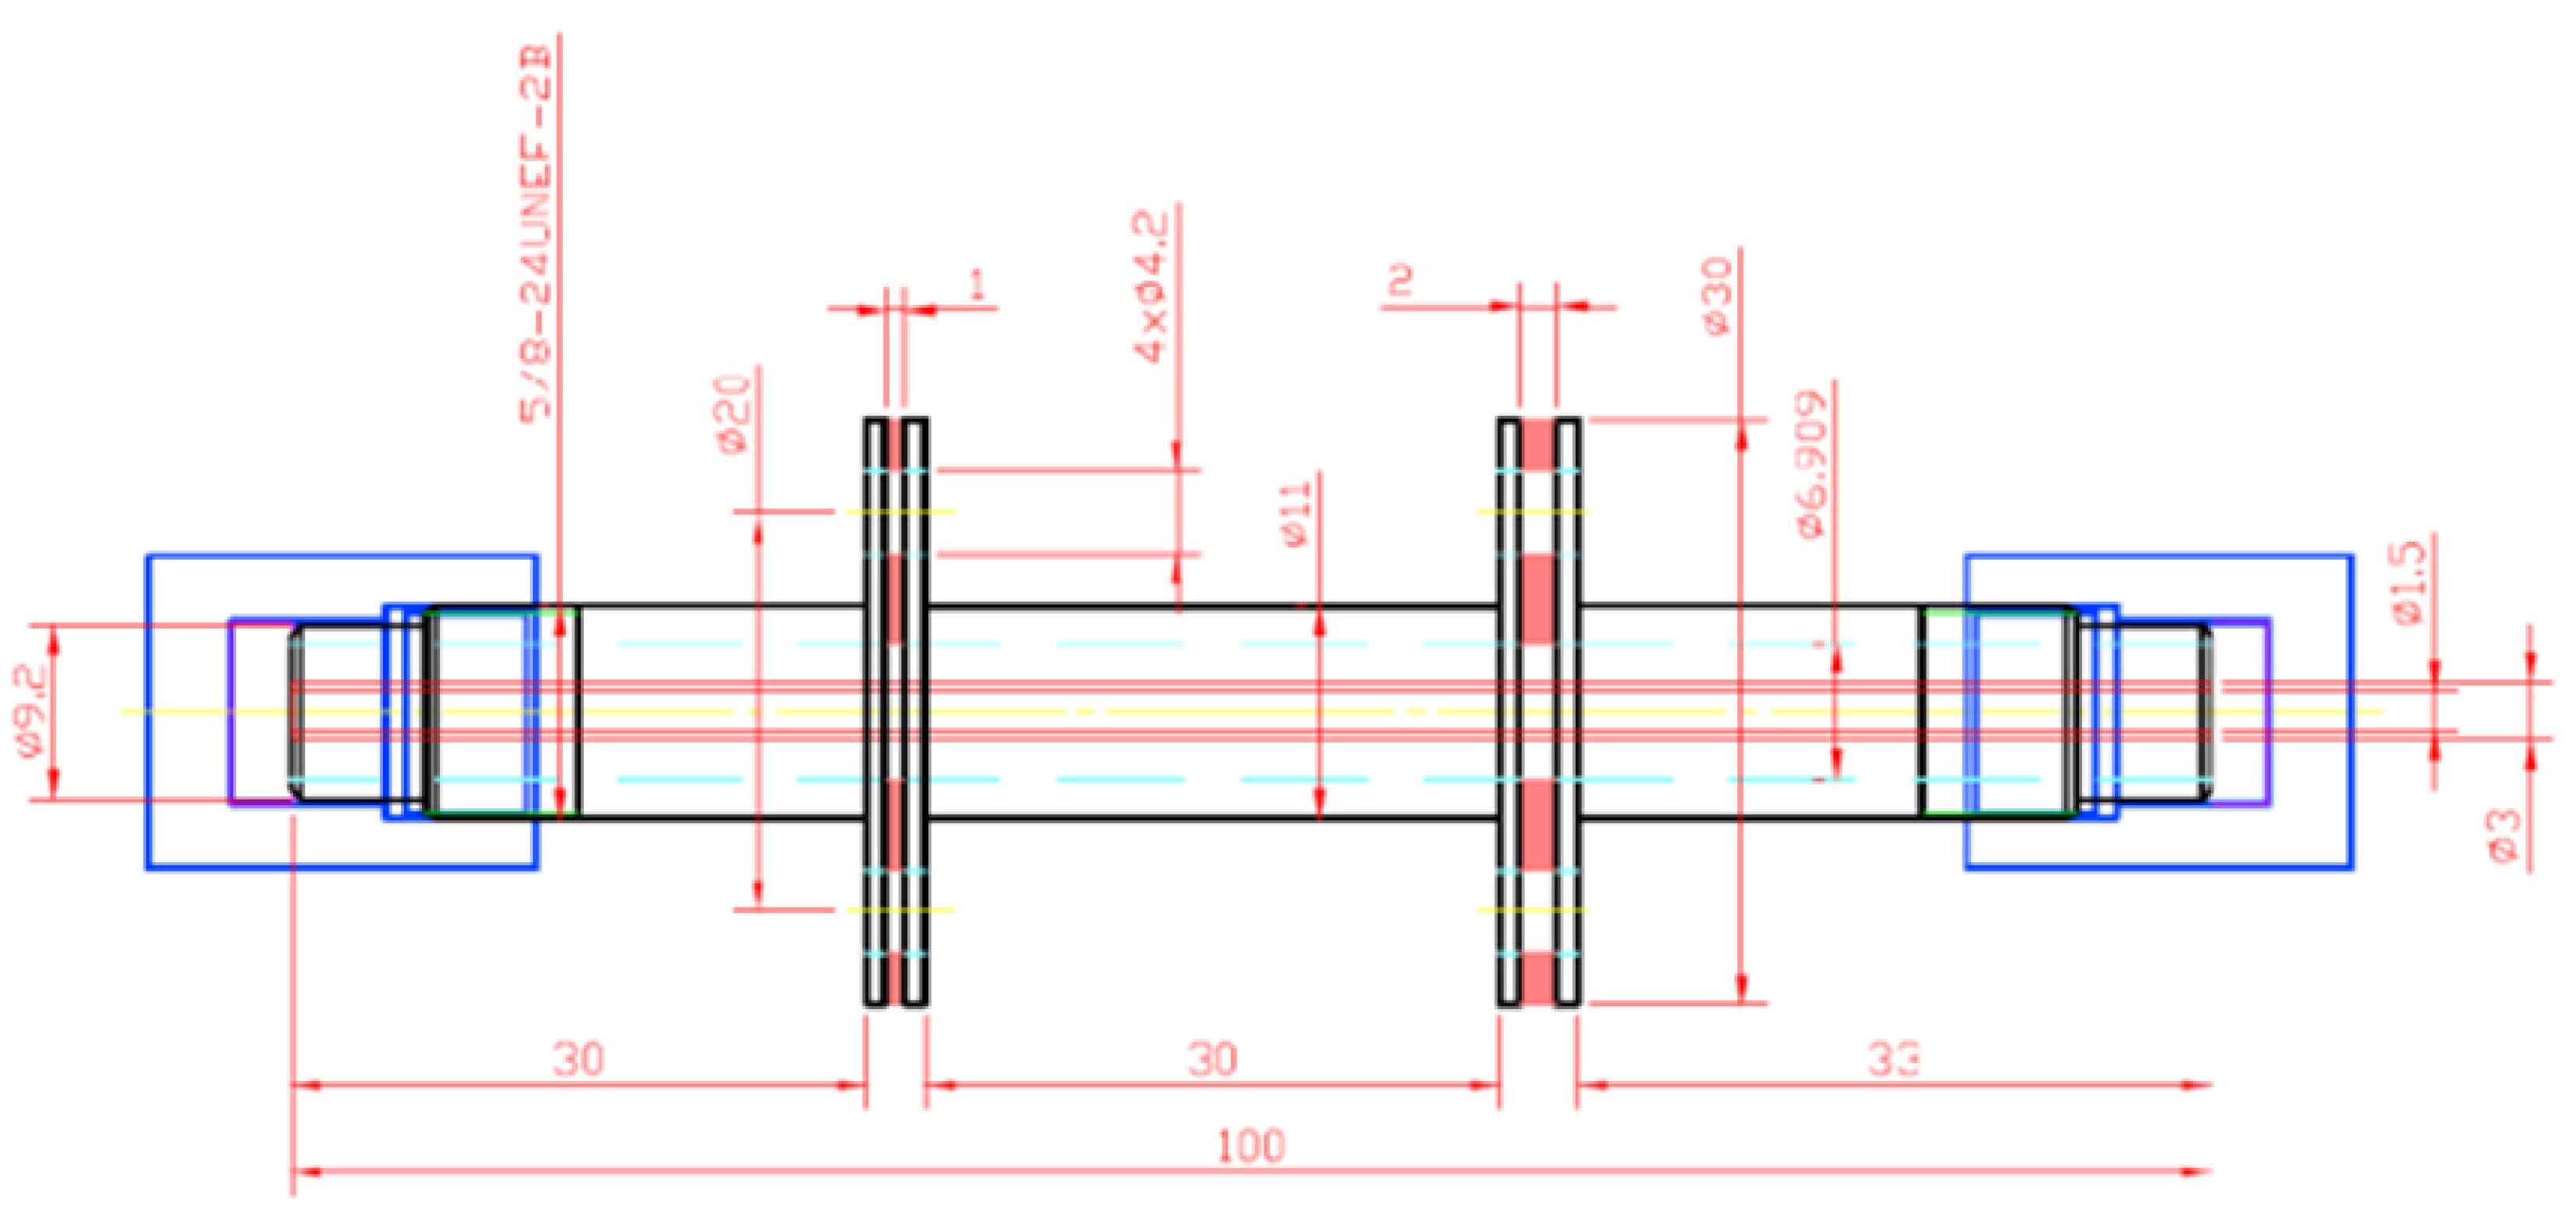
Taking into account the presented electric and heat simulations for desired frequency bandwidth (up to 6 GHz), we have manufactured a prototype line with two gaps and flange radius of 15 mm, with spacers made from acetal homopolymer). The final choice of spacers’ material was made because of the better simulated transmission parameters, and better simulated thermal properties (as can be seen from Table 1 and Figure 6 and Figure 7). In Figure 10 architecture and dimensions of the prototype are given. The width of the second gap is 1 mm larger since it is supposed to encompass the thermopile element in the final microcalorimeter structure. The gaps are placed 3 cm apart (Figure 10.), which can be considered far enough in terms of operating wavelength to avoid any significant local intermodal interactions due to gap discontinuities and possible field disturbances. This point is briefly illustrated in Figure 10 and Figure 11 where snapshots of field distribution from the accompanying time-domain simulation in CST Microwave Studio are shown. From this analysis can be seen that the field energy in the line is confined in propagating Transverse Electromagnetic (TEM) modes meaning that the gap effect on propagation is negligible. In line with the time-domain simulations, frequency domain simulations were run in HFSS. Those results are compared with the measurements results in the sequel.
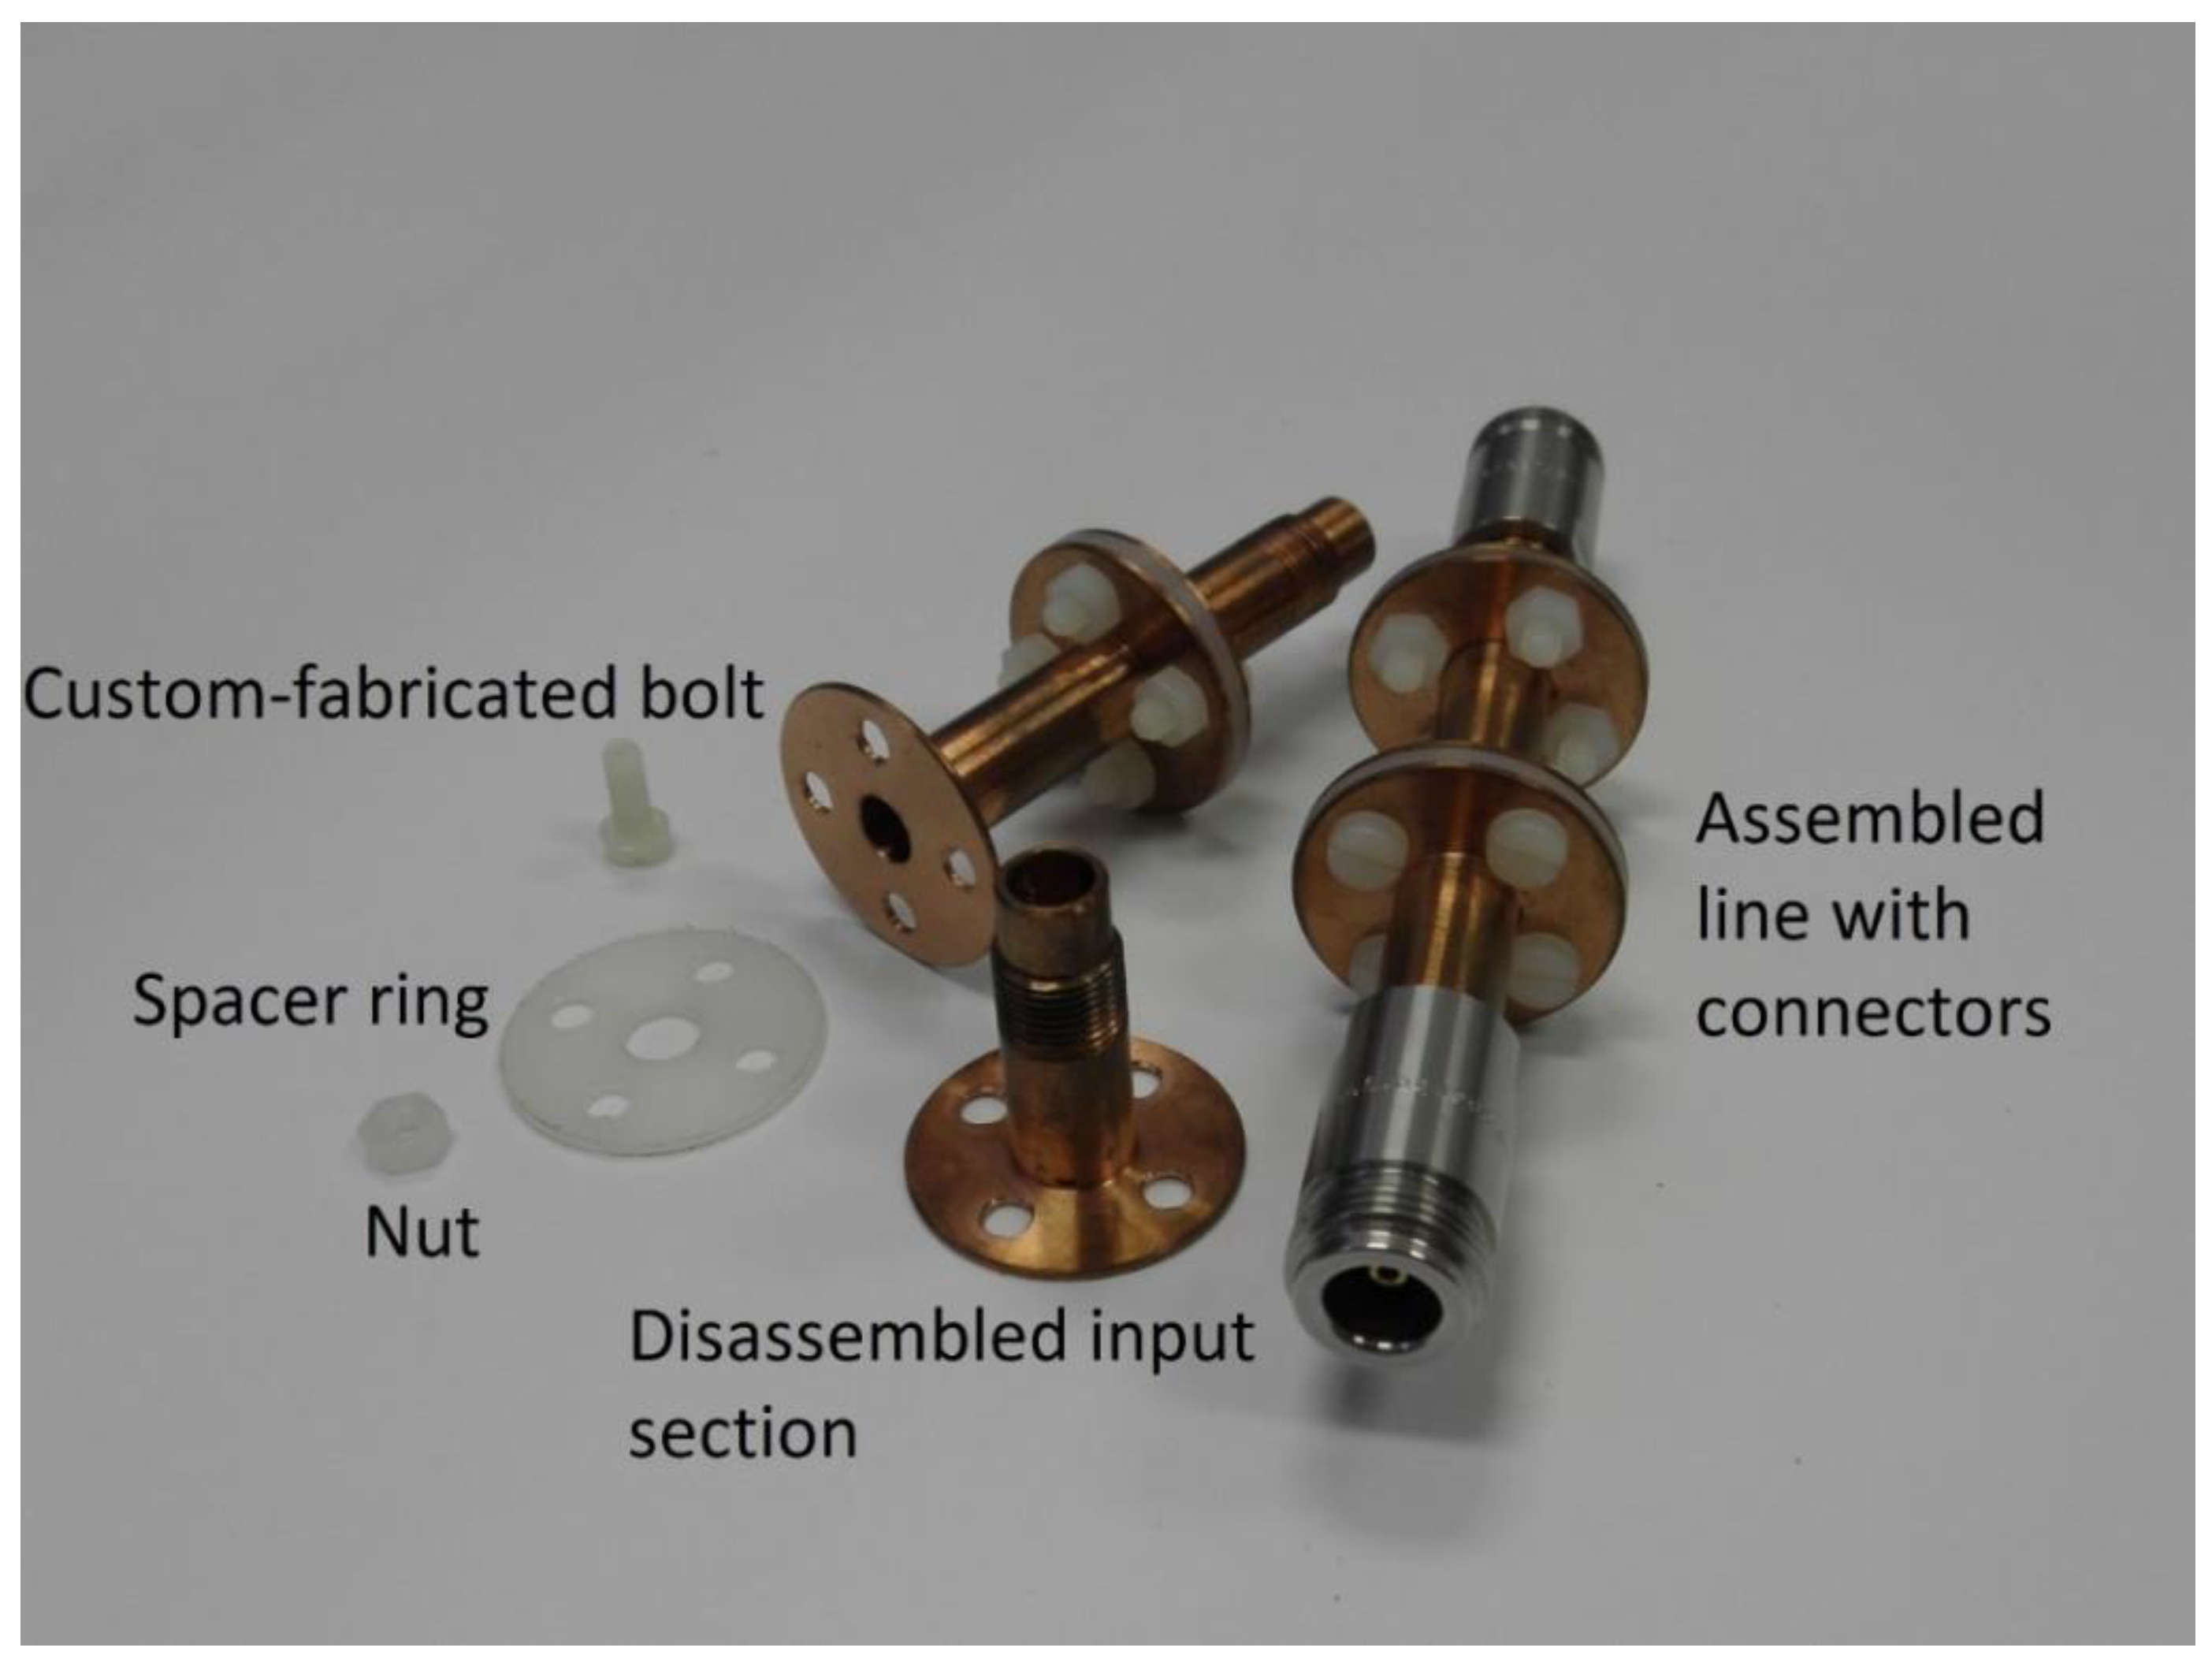
The inner and external conductors in a manufactured line are made of copper, which is electrically and thermally conductive material (the copper purity is 97%). The connectors and the hollow internal conductors are connected by a conductive paste (carbon-based Anders product wire glue). The originally intended use of silver (better electrical conductivity) for an internal conductor of line connection to the connector was not applied in the final product. Namely, the melting points of silver and copper (960.5 °C and 1083 °C, respectively [28]) are too close to each other, which has made impossible to solder two materials without deforming the copper conductor. Several experiments ended in deformation of the copper rod, thus eventually the carbon-based conductive paste has been applied instead.
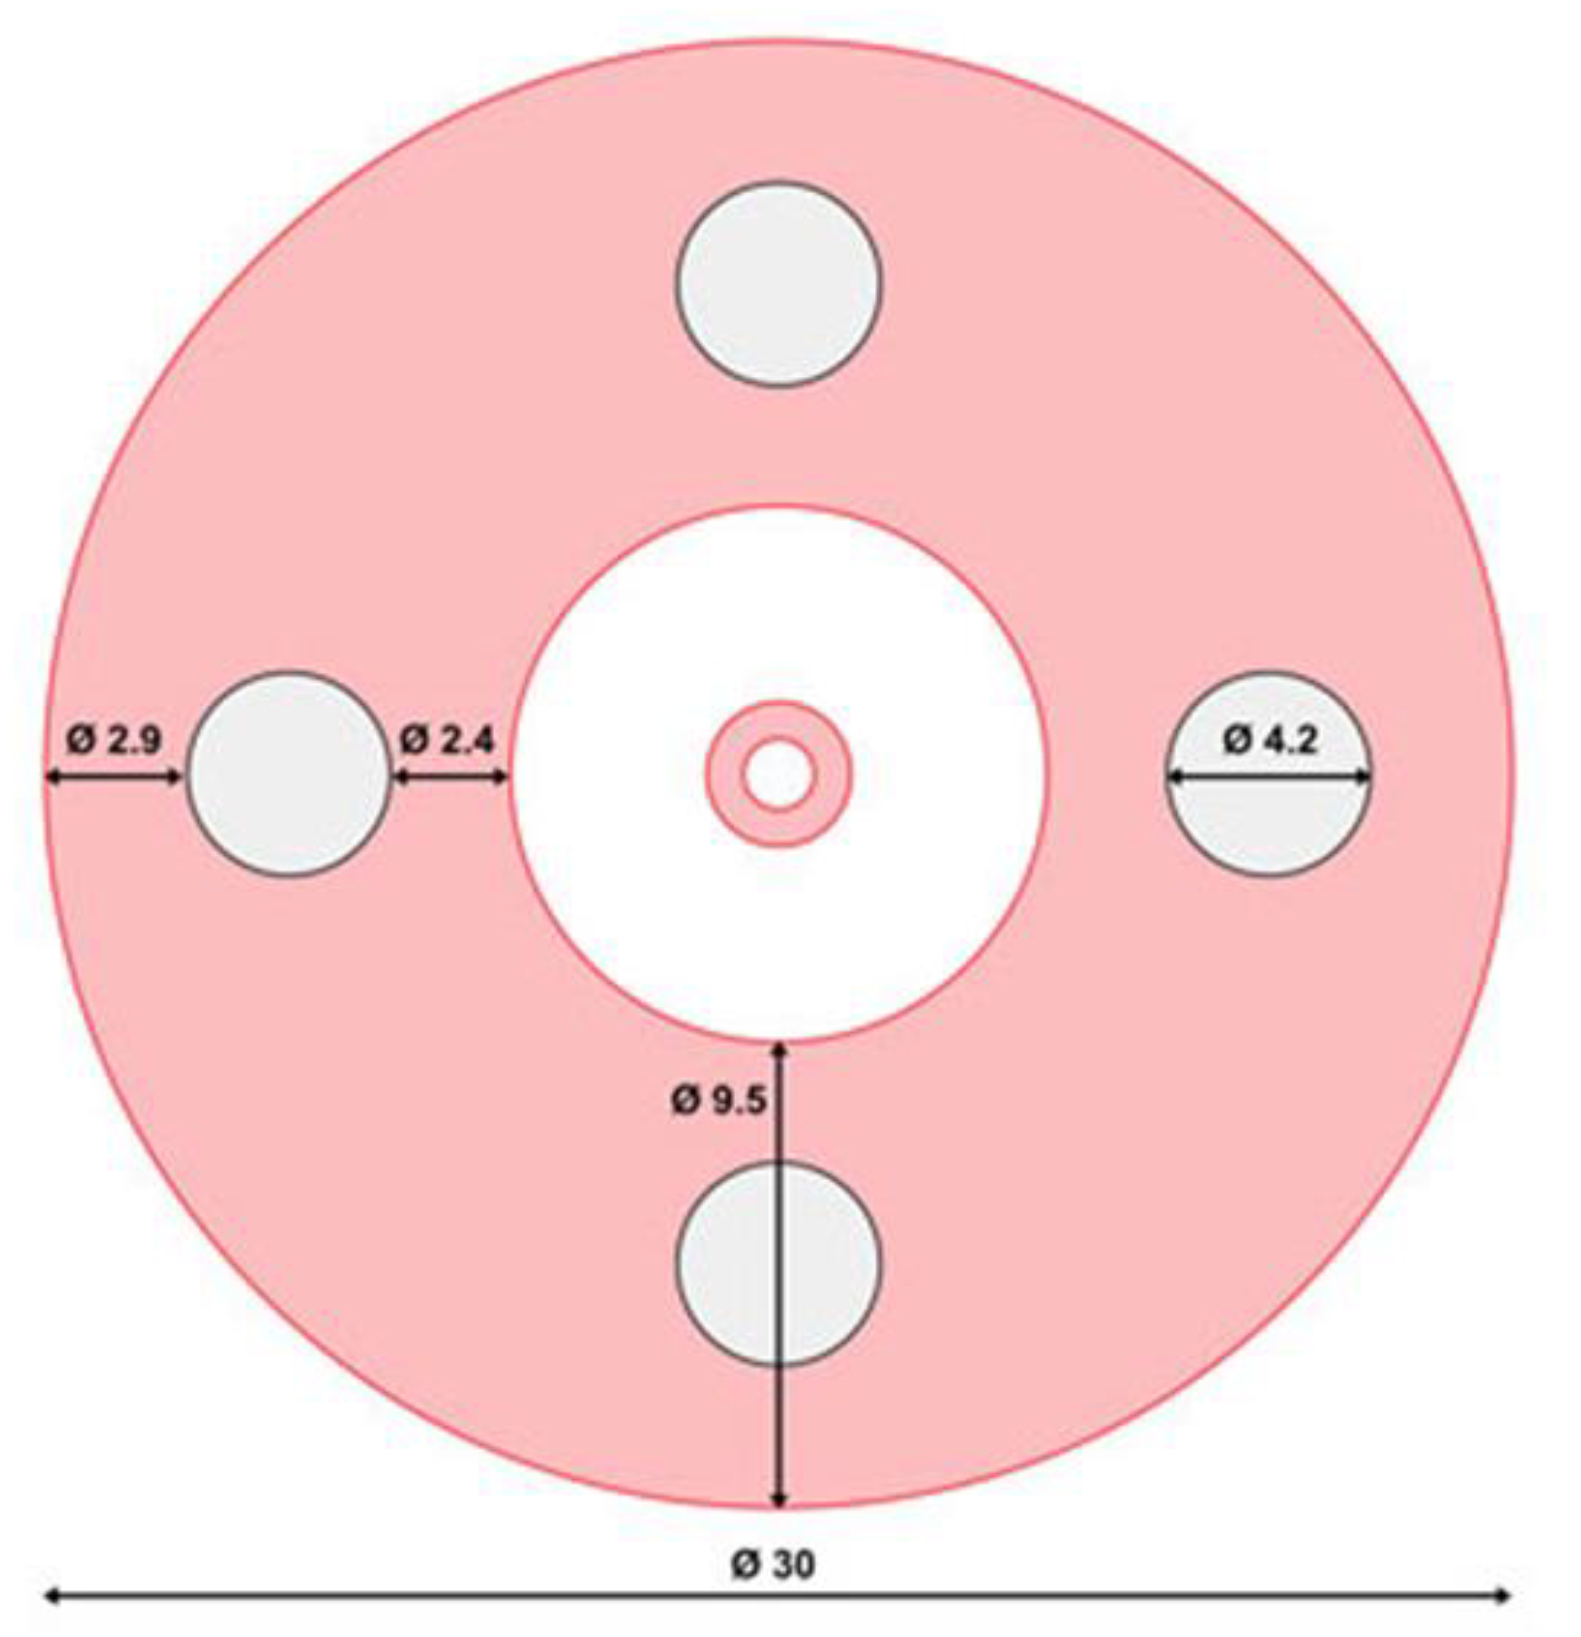
The plastic gap filling has been put between copper portions of the flanges by using four nuts and bolts (Figure 12 and Figure 13) to ensure the robustness and mechanical stability of the gaps. All parts of the line, including metal parts, spacer rings, nuts and bolts were custom-fabricated using the metalworking lathe and precision drilling machine. The plastic parts were fabricated from acetal homopolymer supplied by Resinex (Croatia).
The components of manufactured adiabatic line prototype and the measurement setup for characterization are shown in Figure 14 and Figure 15, respectively.
Measurements were performed using a Keysight N9915A FF vector network analyser and the calibration kit Keysight 85515A. The laboratory room temperature was controlled at 24 °C (the room temperature can be set between 21 °C and 27 °C in steps of 0.5 °C), while the relative humidity could not have been controlled (here it should be noted that relative humidity nevertheless does not influence the uncertainty of measurements, according to the manufacturer’s data sheet). The warm-up time of the analyser was 60 min. Corrected measurement uncertainty (power level of −15 dBm, 10 Hz IF bandwidth, no averaging, and 60-minute warm-up time) is, according to the Keysight specifications for full 2-port calibration (85518A calibration kit), as follows: transmission magnitude uncertainty (S21) is better than 0.3 dB for the transmission magnitudes larger than –40 dB and frequencies up to 9 GHz. The reflection magnitude uncertainty (S11) is better than 0.4 dB for reflection magnitudes greater than −10 dB and it is better than 0.7 dB for reflection magnitude of greater spanning—from −40 dB to −10 dB. It should be noted that the main difference between applied calibration kit 85515A and 85518A is larger frequency bandwidth of the latter (i.e. 18 GHz instead of 9 GHz).
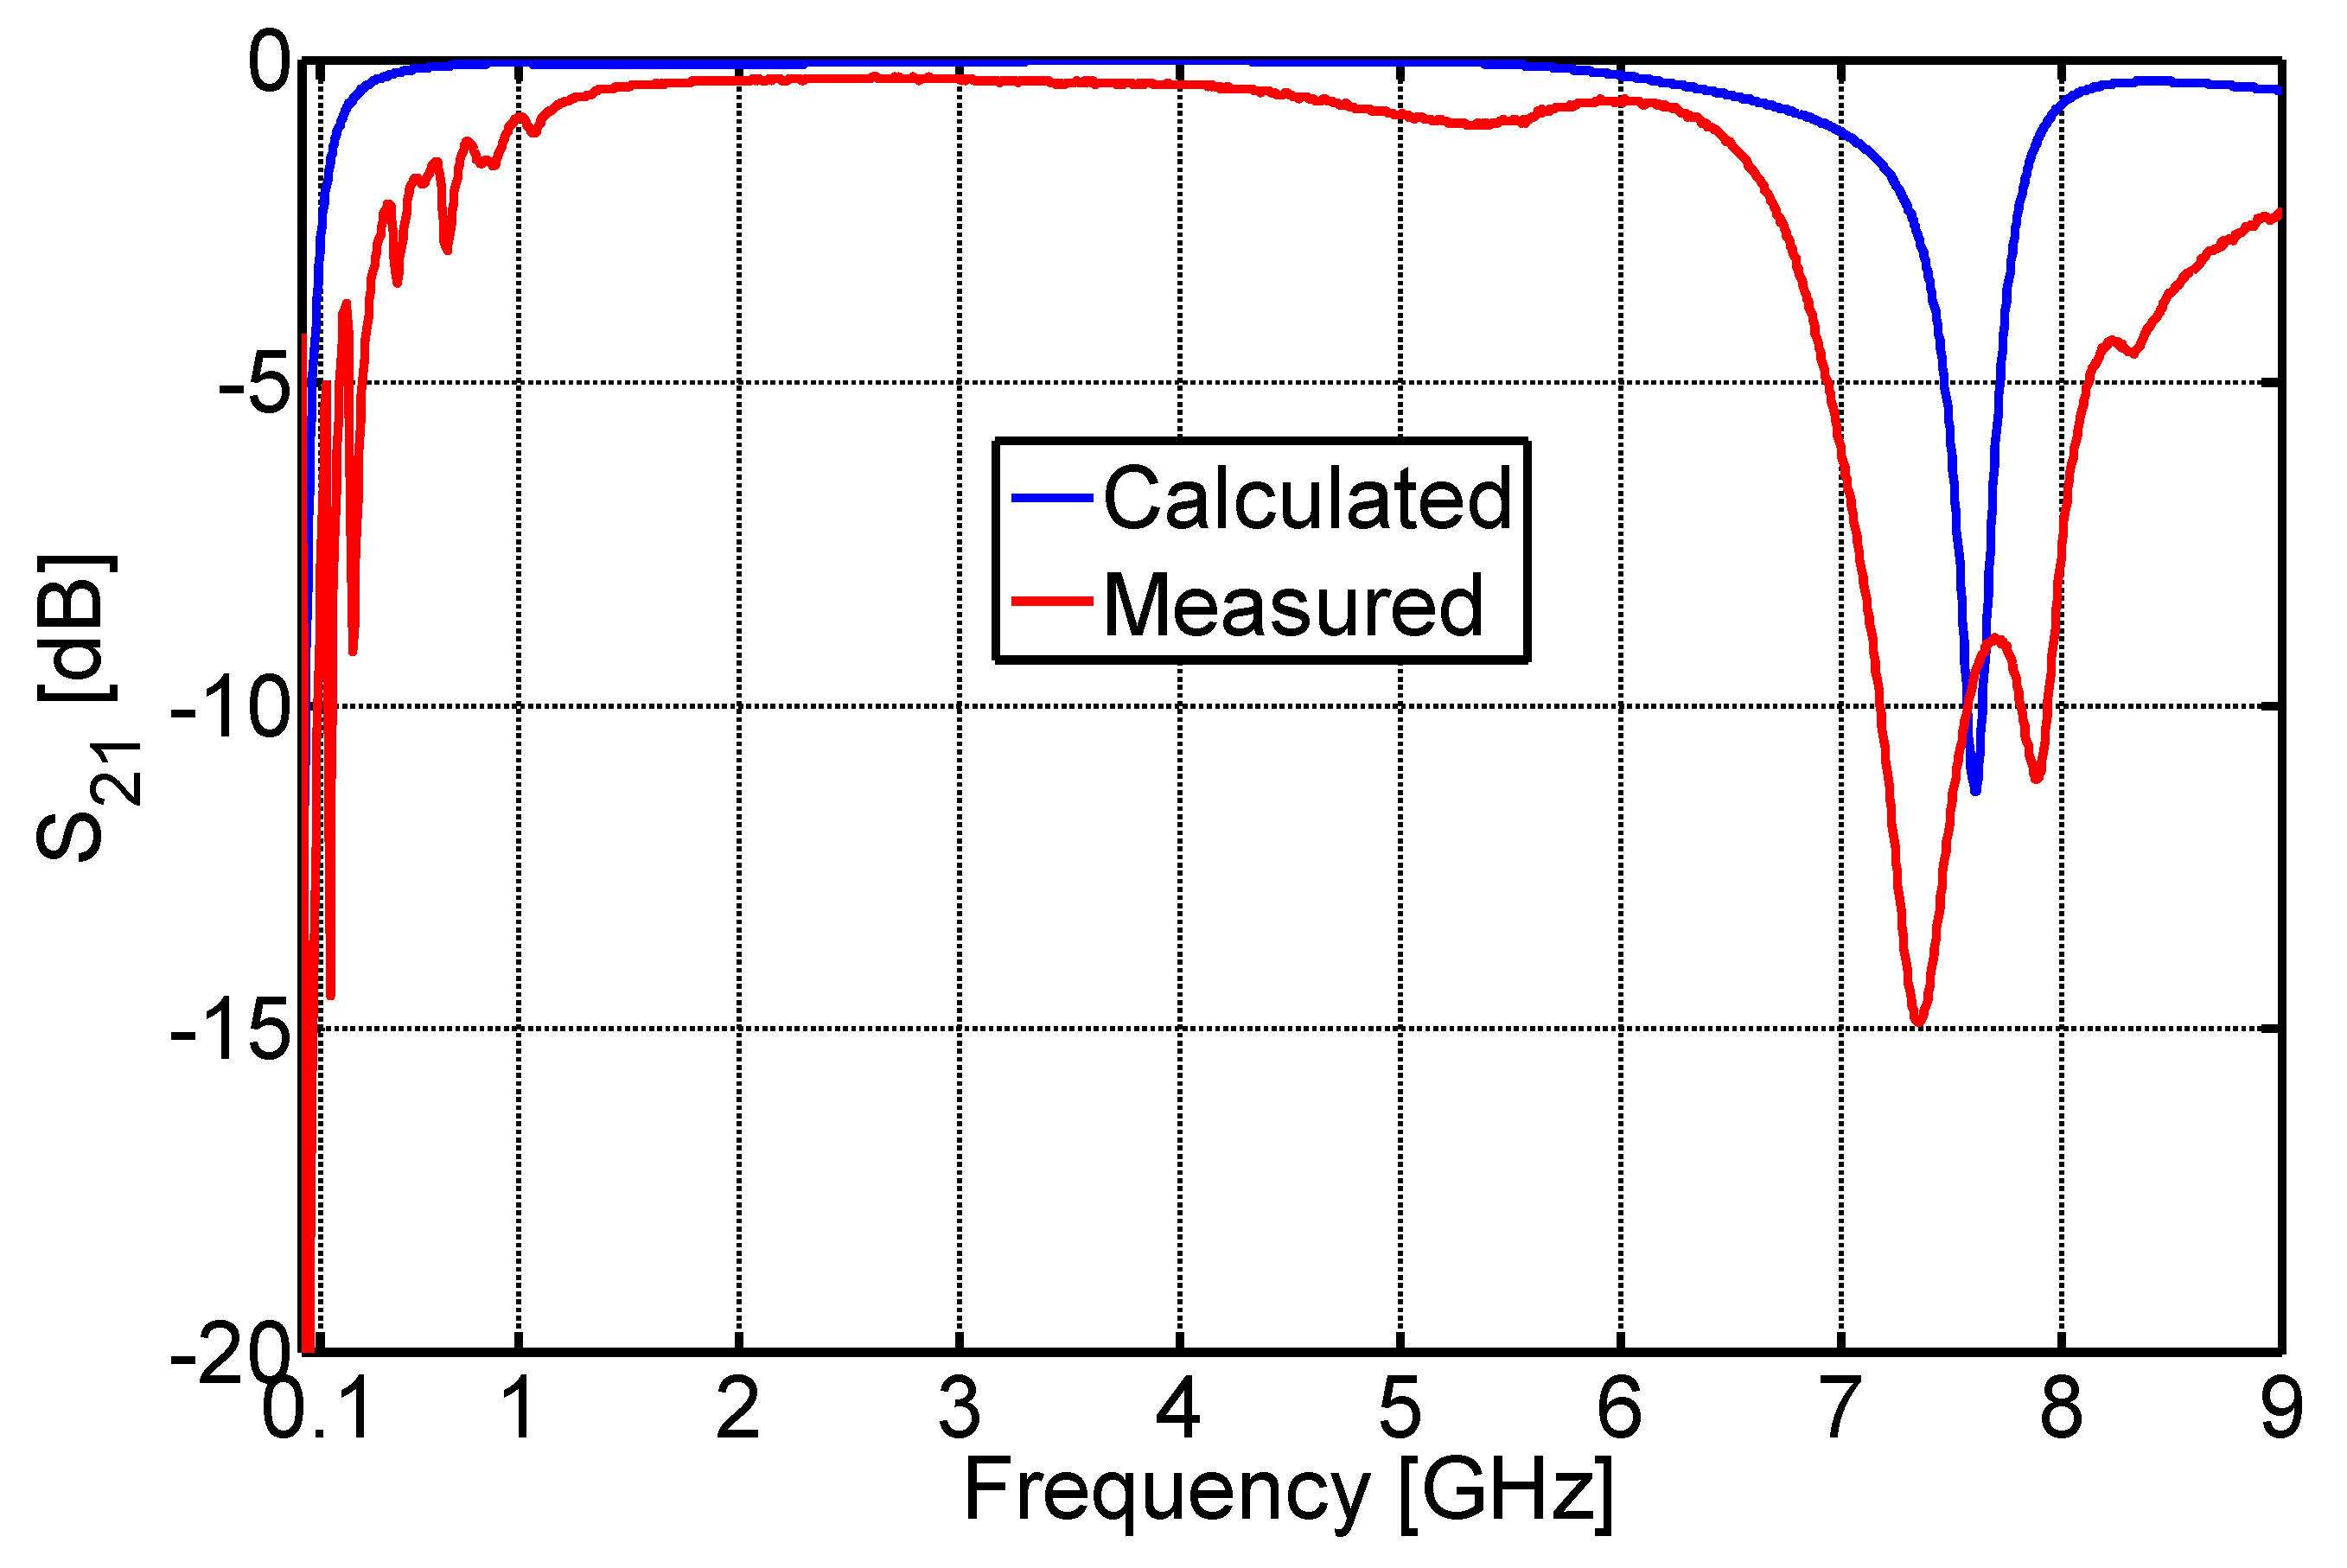
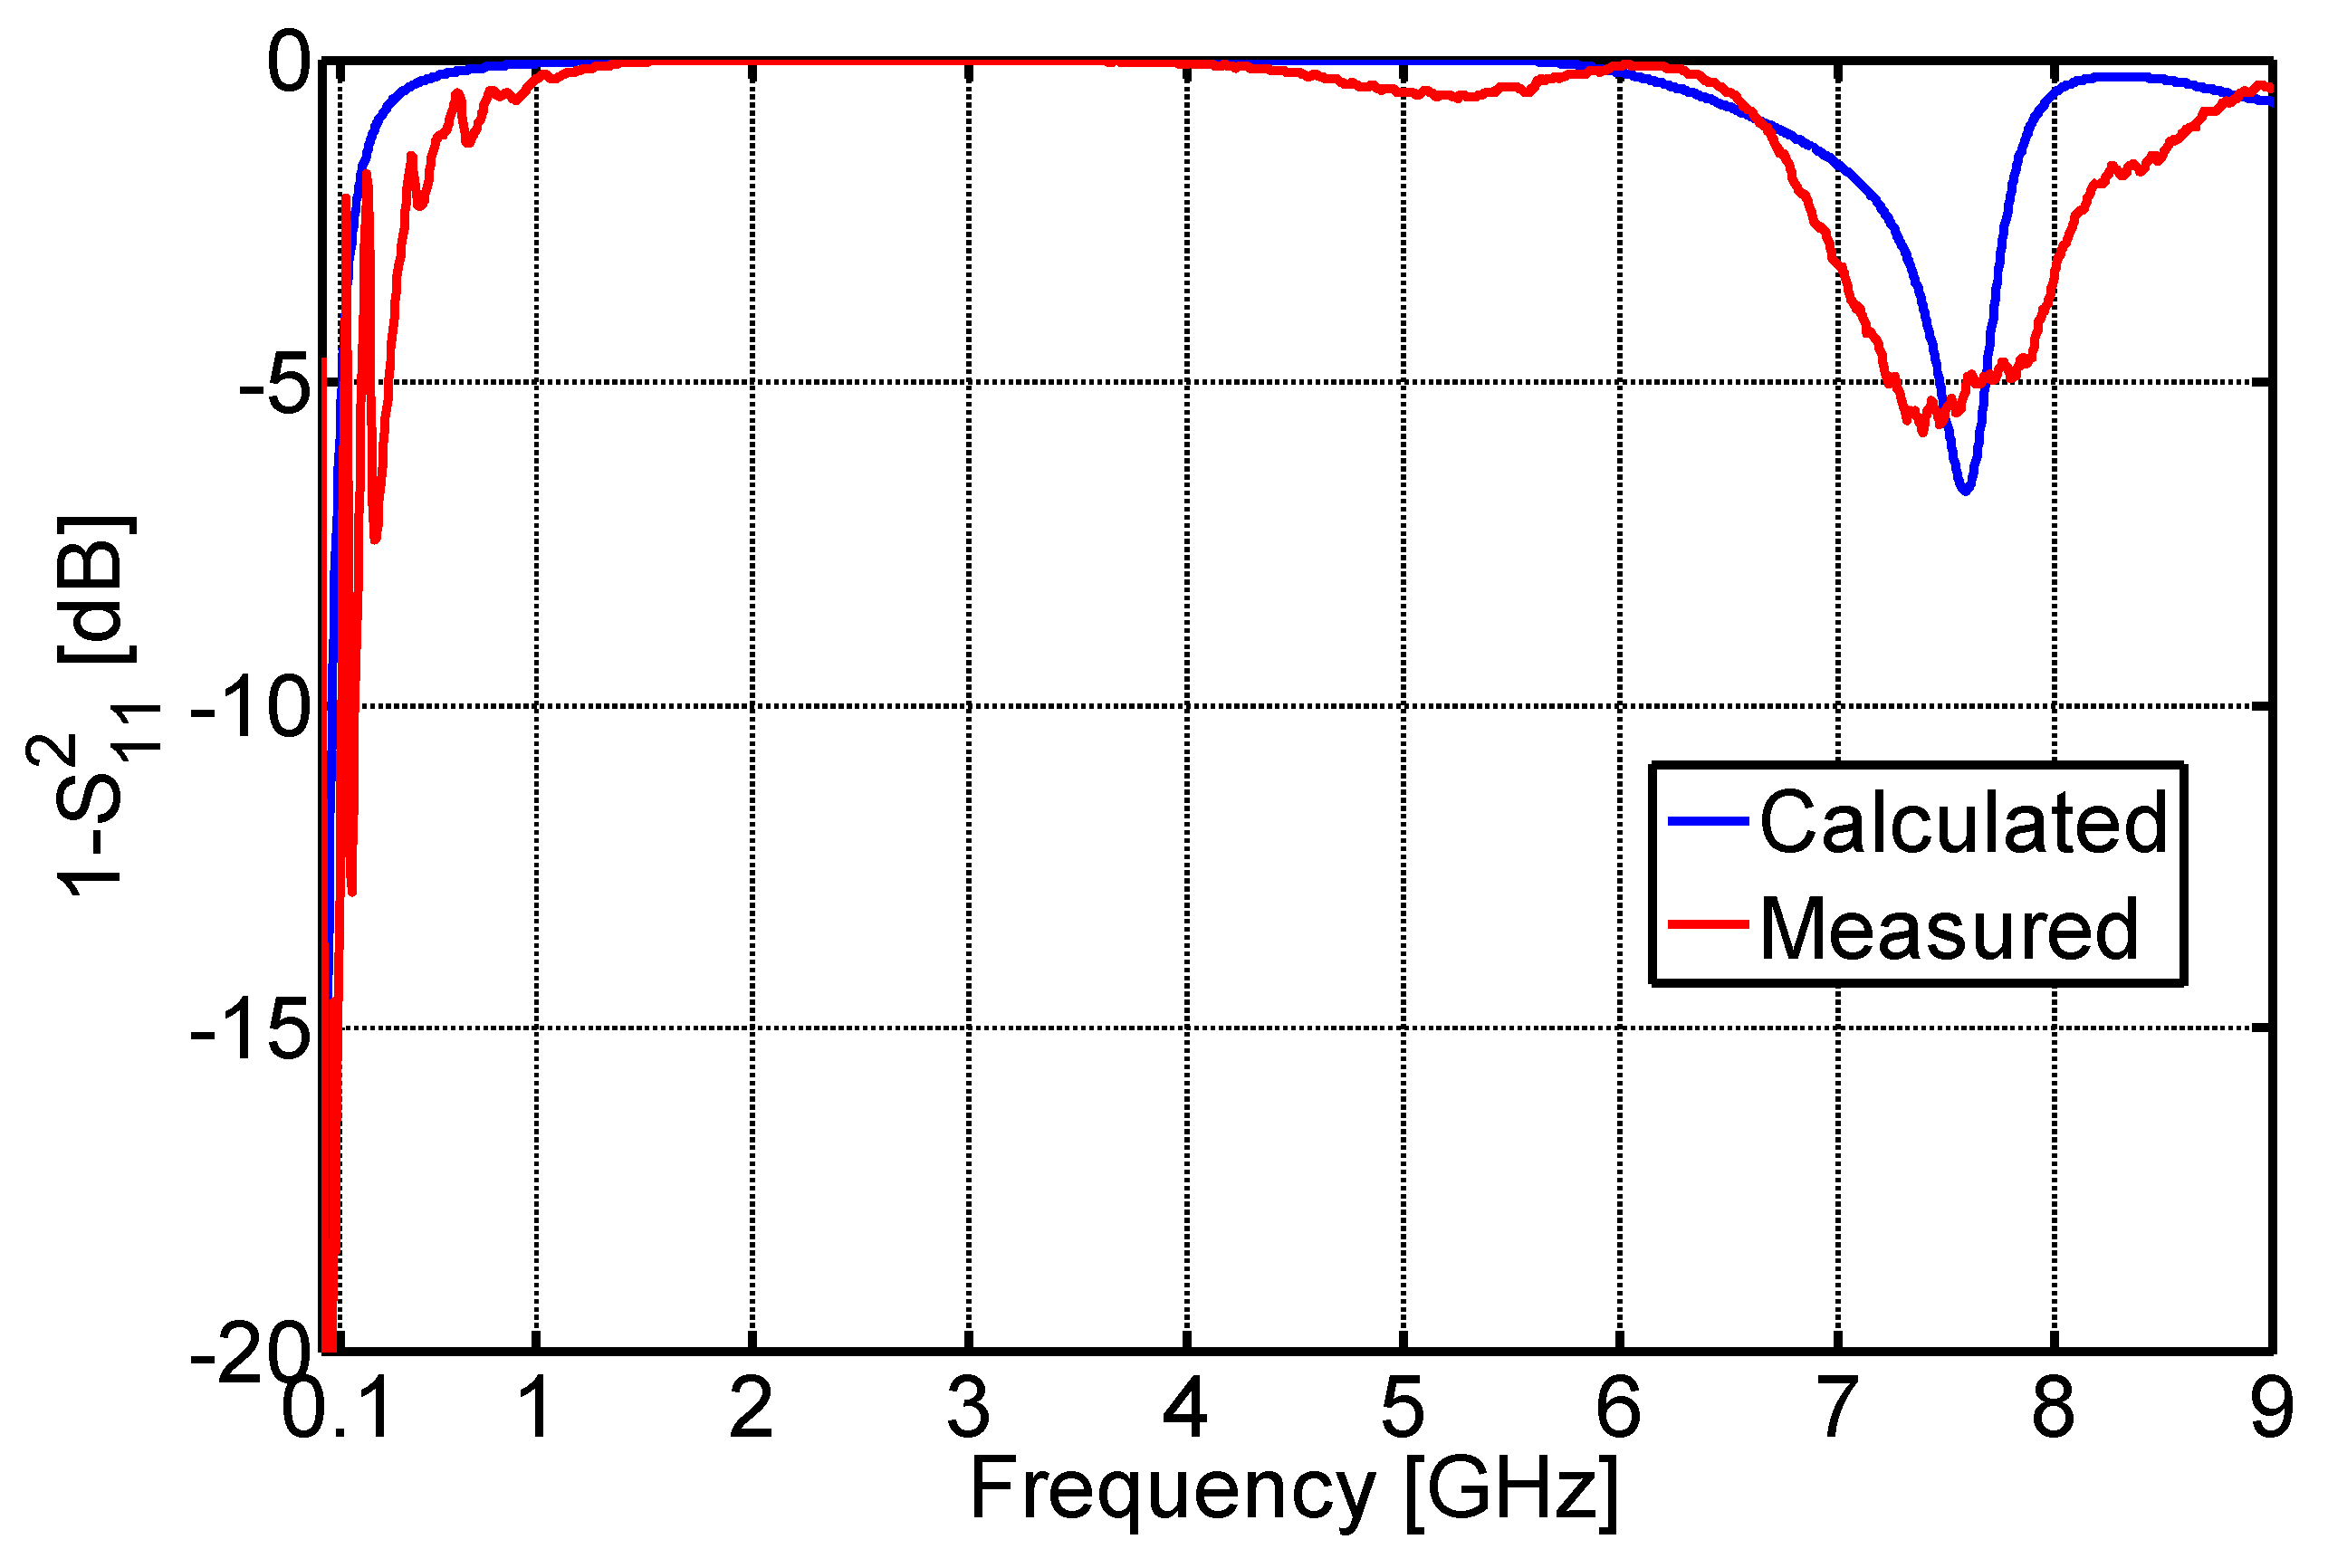
The measured S-parameters are shown in Figure 16 and Figure 17. For convenience, the comparison with corresponding simulated results for the case of 15 mm gaps filled with acetal homopolymer is given. The line is properly matched (S11 < −10 dB) at frequencies from 500 MHz to around 6.5 GHz (Figure 16), which roughly corresponds to the desired operating range. By observing measured transmission coefficient magnitude (Figure 17) it can be seen that the resonance frequency occurs around 7.5 GHz bounding the upper frequency limit of the device (as already predicted in Figure 5). This is satisfactory for the intended use in smart grid measurements and wireless communications. The discrepancy between simulated and measured results occurs due to additional losses in copper and conductive paste (note that the measured resonance bandwidth has smaller Q-factor than predicted), however it is not expected to exhibit a major effect in final application. From detailed view of measured transmission parameter magnitude (Figure 18) it can also be seen that the desired criterion of 95% of power transmission (S21 > −0.5 dB) is met in a narrower frequency range than predicted (Figure 6 and Figure 7), both due to losses and mismatch. The calculated and measured mismatch factors (1 − S112) for the case of acetal homopolymer are shown in Figure 19. Mismatch factor can also be used for visualising the introduced losses by observing differences from measured transmission parameter magnitude (i.e. by comparing Figure 17 and Figure 19) [2]. We can see that the losses in the observed frequency range are rather small so the line mismatch (although also small) plays a significant role in reducing the power transmission below the desired criterion. Nevertheless, once all the parameters are known, this notion is controllable for final microcalorimeter calibration factor calculations, since from expression (3), the mismatch factor is of major interest for calculations. The context of use of the proposed adiabatic line in power measurements is illustrated in Figure 20, where the line is put between RF generator and thermistor mount as an “active” detector in a manner already described in Figure 1.
Compared to the results published in the literature (e.g. [7,11]), we obtained a slightly better transmission coefficient in the mid-range of frequencies spanning from approximately 1.5 GHz to 4 GHz, where line is very well matched (S11 < −20 dB). In particular, compared to results in [7], in the frequency range 4–6 GHz our results are similar or even slightly better. On the other hand, comparing our results with [11], we noted across the vast portion of range of interest that we have measured transmission parameter magnitude (S21) larger than −0.5 dB (Figure 18), while in [11] the S21 parameter magnitude is lower than −1 dB for all observed frequencies. Also, in [11], the results for two flange radii (7 mm and 10.5 mm, respectively) are given which makes it rather difficult to directly compare low-frequency line behaviour with our 15-mm flange radius design. Moreover, in [11], a different design is adopted for a 7 mm flange with a thin ground wire. This ground wire electrically connects isolated parts of the line, which improves the electromagnetic performances at low frequencies. However, it worsens its thermal properties as it provides a direct conductive heat path. For electromagnetic and thermal analysis of the ground wire see the Appendix. All types of lines analysed in [11] possess similar transmission characteristic (S21) as ours (the exact value cannot be clearly read from the graphs) for frequencies around 400 MHz. Here, we also noted that our design is primarily optimised for frequencies below 6 GHz, while [11] deals with the operating range up to 18 GHz. This eventually means that our design, although with narrower operation bandwidth, is eventually more suitable for the desired particular application (i.e. in the microwave power standards for smart grids) due to somewhat better transmission in the frequency range of interest.
6. Conclusion
In this paper, a new design of a gapped adiabatic coaxial line is proposed. Due to the complex geometry of the adiabatic line, analytical calculations cannot be applied in order to predict the device characteristics and adequately set the line parameters. The method for optimization of electrical and thermal line properties is presented, based on numerical calculations using the finite element method. Using the proposed methods of analysis, the physical effects that determine signal propagation and distance between the gaps are revealed. The thermal simulation gave insight in overall thermal properties of the line and areas which mostly contribute to the heat transfer between electrically and thermally isolated parts of the line. The new design that is proposed has been shown to be easily manufactured, mechanically robust and stable. Measurements confirm adequacy of the proposed design and the measured transmission coefficient exhibits slightly superior results to comparable devices in the frequency band of operation. The electrical simulations have shown that setting the radius of the flanges in the outer conductor at 15 mm minimally affects the signal transfer within the observed frequency range. On the other hand, by adding the gaps, thermal transfer through the outer conductor is reduced by more than 70%, which qualifies the proposed line as adequate for microcalorimeter application. The presented method of combined electrical and thermal design is rather general and can be applied in the design of other types of adiabatic line. The measurements of S-parameters on the manufactured adiabatic line prototype have shown that the theoretical predictions are confirmed with measured results.
Author Contributions
This work is part of Z.M. PhD research work, for which M.D. provided scientific supervision and guidance. B.I. contributed to the development of the ideas and with an article review. R.M. was involved in evaluation of developed prototype. All authors were involved in the preparation of the manuscript.
Funding
This research had been supported by Croatian Science Foundation under the project IP-2014-09-8826 Smart Grid Metrology Infrastructure.
Conflicts of Interest
The authors declare no conflict of interest.
Appendix A
To analyze the impact of possible ground wire [11] to the proposed adiabatic line design, additional electromagnetic and thermal simulations were run. A thin conductor with diameter 0.4049 mm (26 AWG) was set cross flange (Figure A1) in a line model with one gap. This model parallels the simulations from Section 3 and Section 4 where the optimal gap transmission and thermal performance was sought. The chosen position of the cross conductor is in fact the only possible one due to the design of the thermopile. The flange radius (R’) was set to 15 mm, and the spacer ring was modeled as the acetal homopolymer as this case has been shown to have optimal performance. Calculated transmission parameters for the cases with and without cross wire are compared in Figure A2 and Figure A3. While the resonance frequency due to the gap itself is for both cases around 7.6 GHz, we can note that the presence of the wire gives rise to another resonance at 1.2 GHz (together with higher order modes). Namely, the portion of the impinging wave “sees” the wire as a short circuit, thereby creating another resonance path alongside the original. The added wire nevertheless improves transmission at the lower frequencies which can be seen from the detailed view in Figure A3 (this was the primary reason for considering introduction of the wire in [11]). From calculated heat flow using Ansys Mechanical we can see (Table A1) that the reduction in heat flow compared to reference (coaxial line with no gaps) is about 10% worse for the case with cross wire. For the comparison see also Table 1 in the main part of the paper. This means that the introduction of the cross wire degrades the adiabatic line performance in the frequency range of interest (primarily range from 0.4 to 6 GHz). This degradation is observed both in signal and thermal transfer. As such, introducing a cross wire is not feasible for the envisaged use of the proposed adiabatic line.
Figure A1.
The sketch of the adiabatic line with cross wire across the flange.

Figure A2.
Comparison of gap-transmission characteristics for the cases with and without cross wire (R’ = 15 mm; acetal homopolymer).
Figure A2.
Comparison of gap-transmission characteristics for the cases with and without cross wire (R’ = 15 mm; acetal homopolymer).

Figure A3.
Detailed comparison of gap-transmission characteristics for the cases with and without cross wire in the lower portion of the spectrum (R’ = 15 mm; acetal homopolymer).
Figure A3.
Detailed comparison of gap-transmission characteristics for the cases with and without cross wire in the lower portion of the spectrum (R’ = 15 mm; acetal homopolymer).


Table A1.
Calculated heat flow and heat flow reduction compared to case of coaxial line with no gaps (R’ = 15 mm; acetal homopolymer).
Table A1.
Calculated heat flow and heat flow reduction compared to case of coaxial line with no gaps (R’ = 15 mm; acetal homopolymer).
| Heat Flow (W)—One Gap | Heat Flow Reduction—One Gap | Heat Flow (W)—One Gap + Wire | Heat Flow Reduction—One Gap + Wire |
|---|---|---|---|
| 0.0992 | 56.86% | 0.1244 | 45.91% |
References
- Lai, H.W.; Tsui, C.M.; Li, H.W.; Ma, C.K.; Chan, K.Y. Provision of Traceable Calibration Services at SCL to Underpin Development of Smart City Initiatives. In Proceedings of the 2018 IEEE Symposium on Product Compliance Engineering—Asia (ISPCE-CN), Shenzhen, China, 5–7 December 2018. [Google Scholar]
- Tepati, V.; Ferrero, A.; Sayed, M. (Eds.) Modern RF and Microwave Measurement Techniques; Cambridge University Press: New York, NY, USA, 2013. [Google Scholar]
- Rohde&Schwarz. RF Voltage and Power Measurements Brochure [Online]. 2018. Available online: https://cdn.rohde-schwarz.com/pws/dl_downloads/dl_common_library/dl_brochures_and_datasheets/pdf_1/SLMESS_E.PDF (accessed on 3 April 2019).
- Clark, R.F. The Microcalorimeter as a National Microwave Power Standard. Proc. IEEE 1986, 74, 102–104. [Google Scholar] [CrossRef]
- Ivsic, B.; Dadic, M.; Malaric, R.; Martinovic, Z. Thermal Considerations on Adiabatic Coaxial Line for Microcalorimeter Measurements. In Proceedings of the 2019 2nd International Colloquium on Smart Grid Metrology (SMAGRIMET), Split, Croatia, 9–12 April 2019; pp. 131–134. [Google Scholar]
- Huang, Y.; Yuan, W.; Cui, X.; Meng, Y.S.; Li, Y. WR-42 Waveguide Microcalorimeter for Thermistor Mount Calibration. In Proceedings of the 2018 Conference on Precision Electromagnetic Measurements (CPEM 2018), Paris, France, 8–13 July 2018. [Google Scholar]
- Ahmad, S.; Rustagi, V.K.; Govil, A.K.; Aggarwal, R.; Pal, B.; Kothari, P.C. Automation of Direct Comparison Technique and Study of long term Performance on the Calibration factor of the Thermistor Mounts in N-type Coaxial line up to 18 GHz. In Proceedings of the 2007 Asia-Pacific Microwave Conference, Bangkok, Thailand, 11–14 December 2007. [Google Scholar]
- Allen, J.W.; Clague, F.R.; Larsen, N.T.; Weidman, M.P. NIST Microwave Power Standards in Waveguide; U.S. Department of Commerce, National Institute of Standard and Technology: Boulder, CO, USA, 1999; Volume 1511, pp. 1–56.
- Chung, N.S.; Shin, J.; Bayer, H.; Honigbaum, R. Coaxial and Waveguide Microcalorimeters for RF and Microwave Power Standards. IEEE Trans. Instrum. Meas. 1989, 38, 460–464. [Google Scholar] [CrossRef]
- Kwon, J.Y.; Kang, T.W.; Kim, H.J. A design and implementation of 3.5 mm coaxial microcalorimeter for RF and microwave power standards at KRISS. In Proceedings of the 2008 Conference on Precision Electromagnetic Measurements Digest, Broomfield, CO, USA, 8–13 June 2008; pp. 422–423. [Google Scholar]
- Kwon, J.Y.; Lee, D.J. Adiabatic Design for a Coaxial Transmission Line. IEEE Trans. Instrum. Meas. 2014, 63, 1760–1768. [Google Scholar] [CrossRef]
- Botello-Perez, M.; Crowley, T.P.; Garcia-Ruiz, I.; Jardon-Aguilar, H. CENAM's primary standard for microwave power up to 18 GHz. In Proceedings of the 2016 Conference on Precision Electromagnetic Measurements (CPEM 2016), Ottawa, ON, Canada, 10–15 July 2016. [Google Scholar]
- Botello-Perez, M.; Crowley, T.P.; Garcia-Ruiz, I.; Jardon-Aguilar, H. Characterization of a Type-N Coaxial Microcalorimeter for Use as Microwave Power Standard at CENAM. IEEE Trans. Instrum. Meas. 2019, 68, 558–565. [Google Scholar] [CrossRef]
- Yuan, W.; Cui, X.; Li, Y.; Ma, C.; Meng, Y.S. Uncertainty analysis and evaluation of a WR-28 (26.5 to 40 GHz) millimeter-wave power standard. In Proceedings of the 2016 Conference on Precision Electromagnetic Measurements (CPEM 2016), Ottawa, ON, Canada, 10–15 July 2016. [Google Scholar]
- Cox, M.; Harris, P.; Iuculano, G.; Pellegrini, G. The evaluation of the uncertainty associated with comparison loss in microwave power meter calibration. In Proceedings of the 2006 IEEE International Workshop on Advanced Methods for Uncertainty Estimation in Measurement (AMUEM 2006), Sardagna, Italy, 20–21 April 2006; pp. 34–39. [Google Scholar]
- Martinovic, Z.; Dadic, M.; Malaric, R.; Martinovic, Z. Electromagnetic analysis of adiabatic coaxial line with applied air gap. In Proceedings of the 25th International Conference on Software, Telecommunications and Computer Networks (SoftCOM), Split, Croatia, 21–23 September 2017; pp. 101–105. [Google Scholar]
- López, G.; Moura, P.; Moreno, J.I.; Camacho, J.M. Multi-Faceted Assessment of a Wireless Communications Infrastructure for the Green Neighborhoods of the Smart Grid. Energies 2014, 7, 3453–3483. [Google Scholar] [CrossRef] [Green Version]
- Reka, S.; Dragicevic, T.; Siano, P.; Prabaharan, S.R.S. Future Generation 5G Wireless Networks for Smart Grid: A Comprehensive Review. Energies 2019, 12, 2140–2157. [Google Scholar]
- Dadić, M.; Sandelić, M.; Hegeduš, H.; Petrović, G. A circular loop time constant standard. J. Energy Energ. 2018, 67, 103–107. [Google Scholar]
- Konjevod, J.; Malarić, R.; Dadić, M.; Mostarac, P.; Hegeduš, H. Measurement of DC properties and relative humidity (RH) dependence of wideband AC current shunts. Measurement 2019, 131, 1–6. [Google Scholar] [CrossRef]
- Chung, N.S.; Shin, J.; Bayer, H.; Honigbaum, R. Precision Coaxial and Waveguide Microcalorimeters for RF and Microwave Power Standards. In Proceedings of the 1988 Conference on Precision Electromagnetic Measurements, Ibaraki, Japan, 7–10 June 1988; pp. 182–183. [Google Scholar]
- Rosenberger Technical Data Sheet [Online]. 2018. Available online: https://catalog.rosenberger.com/images/documents/db/05CK001-150_DB.pdf (accessed on 14 March 2019).
- Riddle, B.; Baker-Jarvis, J.; Krupka, J. Complex permittivity measurements of common plastics over variable temperatures. IEEE Trans Microw. Theory Tech. 2003, 51, 727–733. [Google Scholar] [CrossRef]
- Ansys HFSS Website 2018. Available online: https://www.ansys.com/products/electronics/ansys-hfss (accessed on 12 February 2019).
- Holman, J.P. Heat Transfer, 10th ed.; McGraw-Hill: New York, NY, USA, 2010. [Google Scholar]
- Ansys Mechanical Website 2018. Available online: https://www.ansys.com/products/structures/ansys-mechanical-enterprise (accessed on 3 February 2018).
- Čatić, I. Knowledge of Thermal Properties, a Key to the Successful Polymer processing. Polimeri 1983, 4, 67–79. [Google Scholar]
- Pauling, L. General Chemistry, 2nd ed.; Freeman: San Francisco, CA, USA, 1953. [Google Scholar]
Figure 1.
Proposed use of the adiabatic coaxial line with two gaps in microcalorimeter.

Figure 2.
Principle of bolometric (thermistor) power detection [1].
Figure 2.
Principle of bolometric (thermistor) power detection [1].

Figure 3.
Proposed adiabatic gap scheme in transmission line.
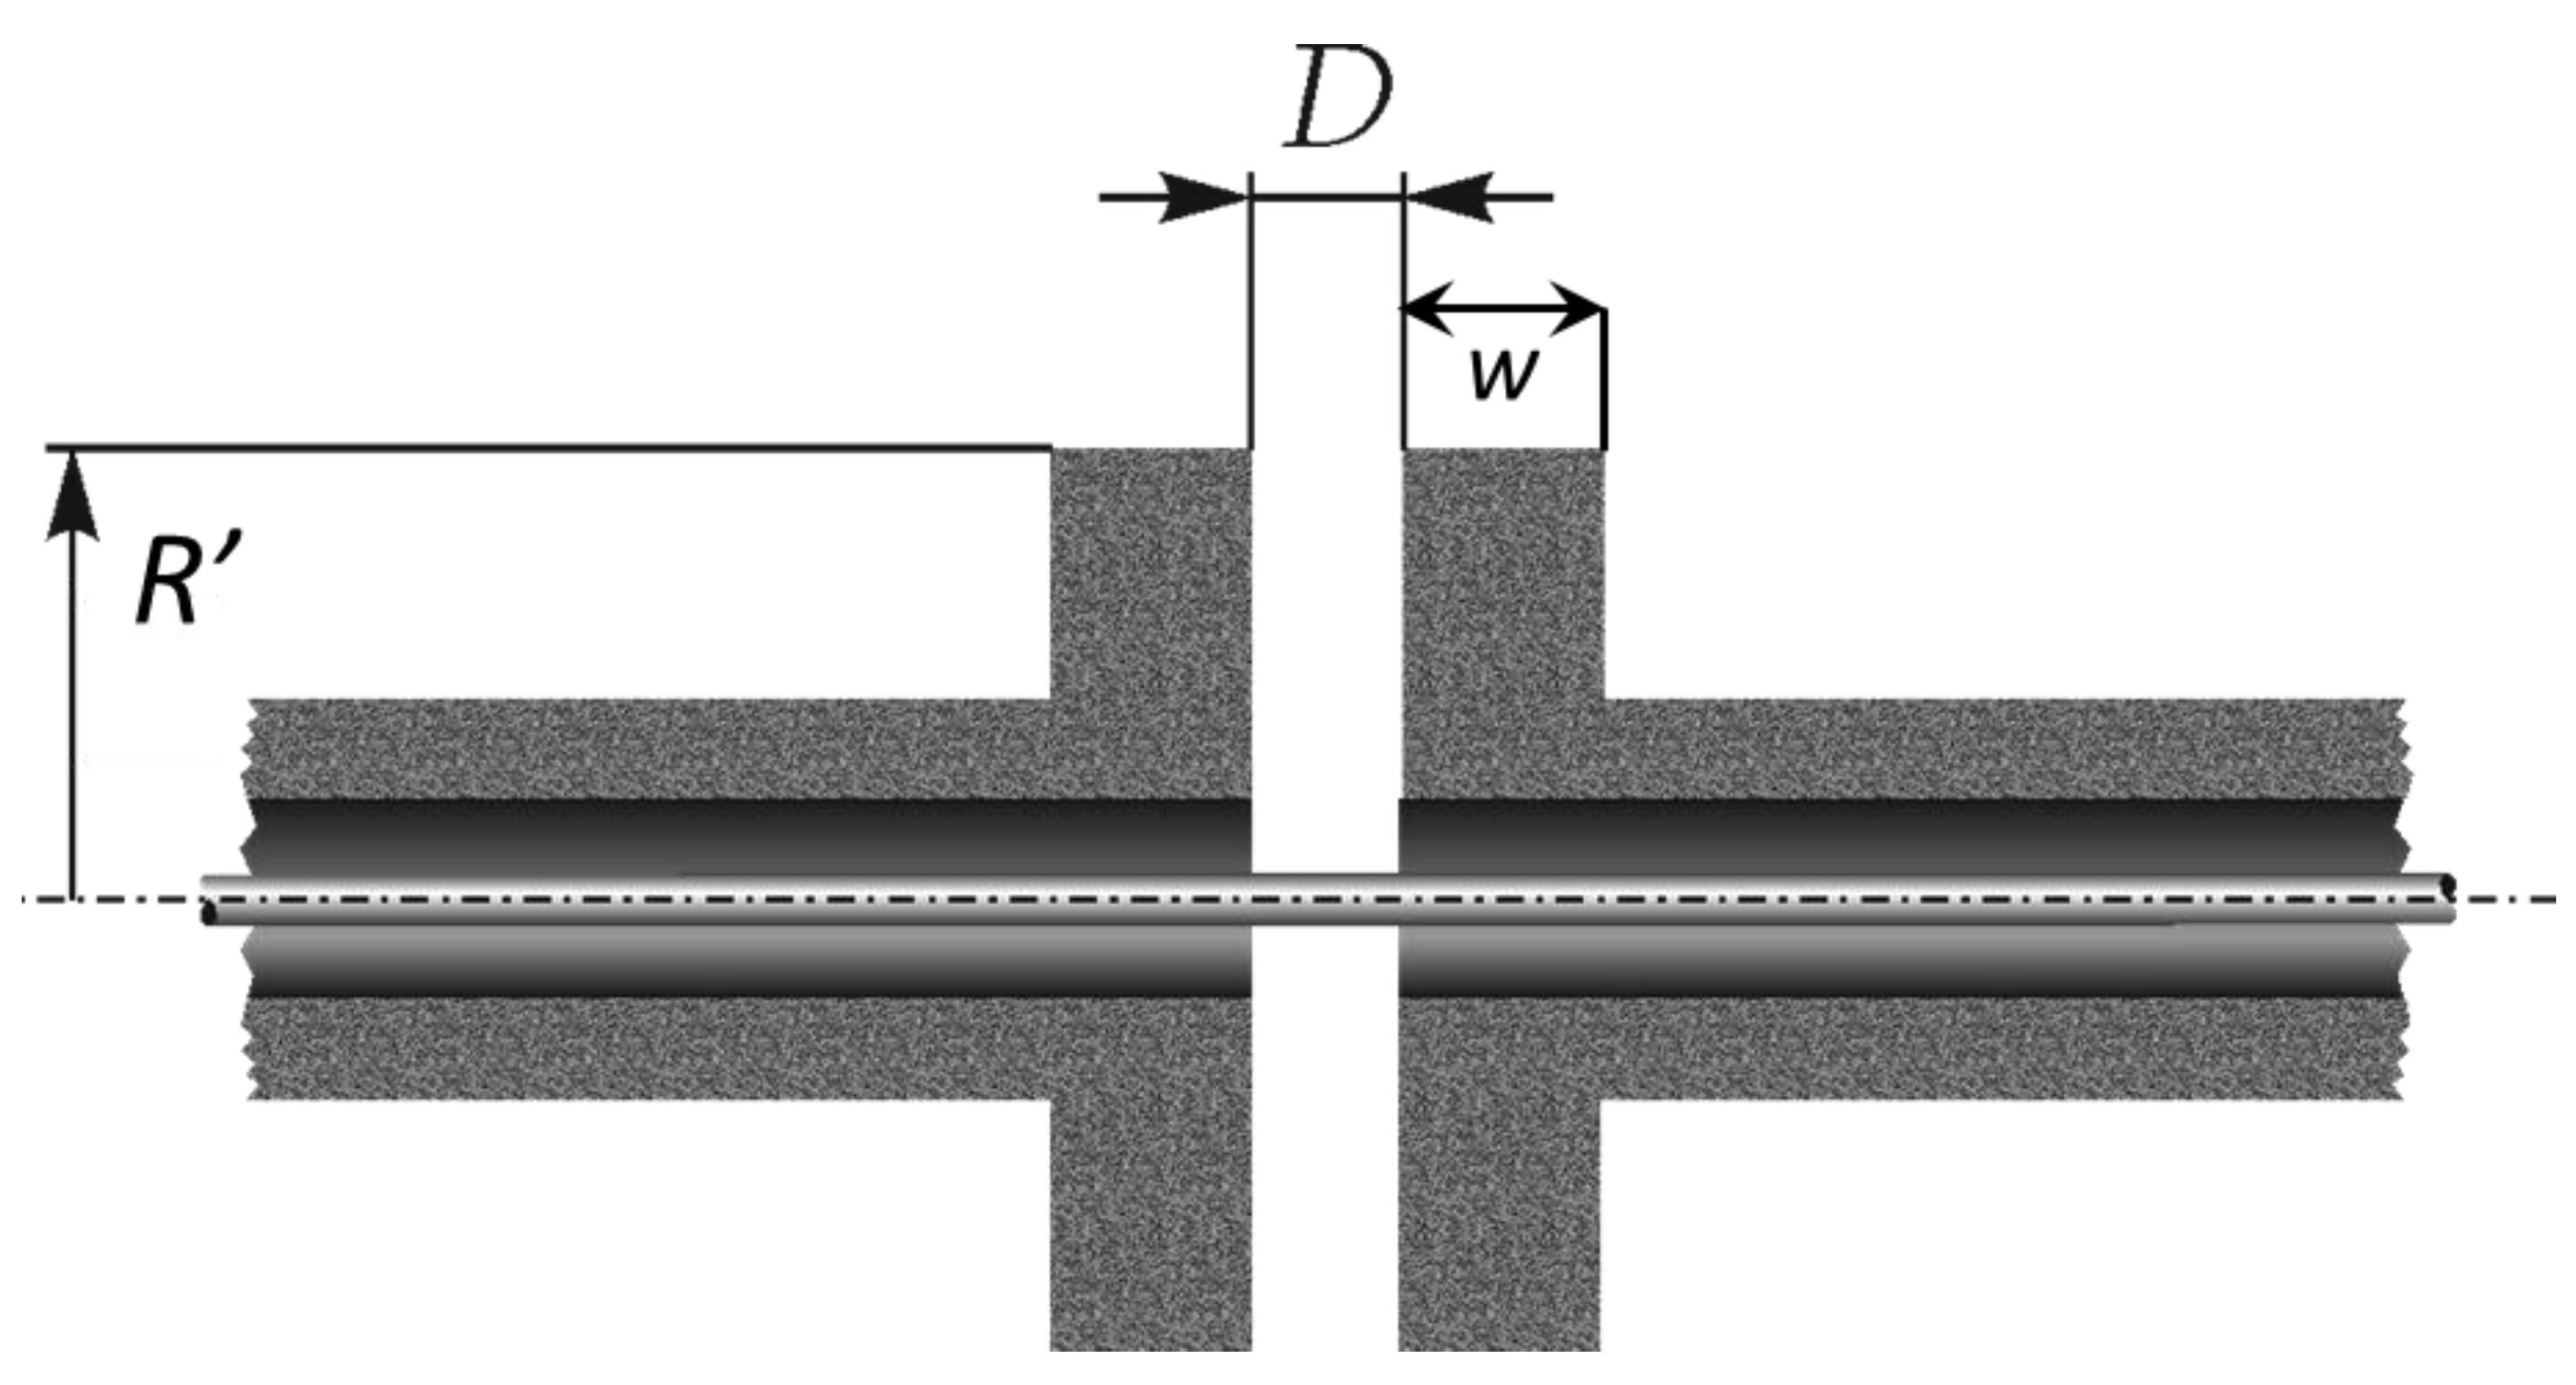
Figure 4.
Gap transmission characteristics depending on the flange radius R’ (gaps filled with polyethylene).
Figure 4.
Gap transmission characteristics depending on the flange radius R’ (gaps filled with polyethylene).

Figure 5.
Gap transmission characteristics depending on the flange radius R’ (gaps filled with acetal homopolymer).
Figure 5.
Gap transmission characteristics depending on the flange radius R’ (gaps filled with acetal homopolymer).

Figure 6.
Detailed simulation of gap transmission characteristics (depending on flange radius R’) in frequency and amplitude values of interest (gaps filled with polyethylene).
Figure 6.
Detailed simulation of gap transmission characteristics (depending on flange radius R’) in frequency and amplitude values of interest (gaps filled with polyethylene).

Figure 7.
Detailed simulation of gap transmission characteristics (depending on flange radius R’) in frequency and amplitude values of interest (gaps filled with acetal homopolymer).
Figure 7.
Detailed simulation of gap transmission characteristics (depending on flange radius R’) in frequency and amplitude values of interest (gaps filled with acetal homopolymer).
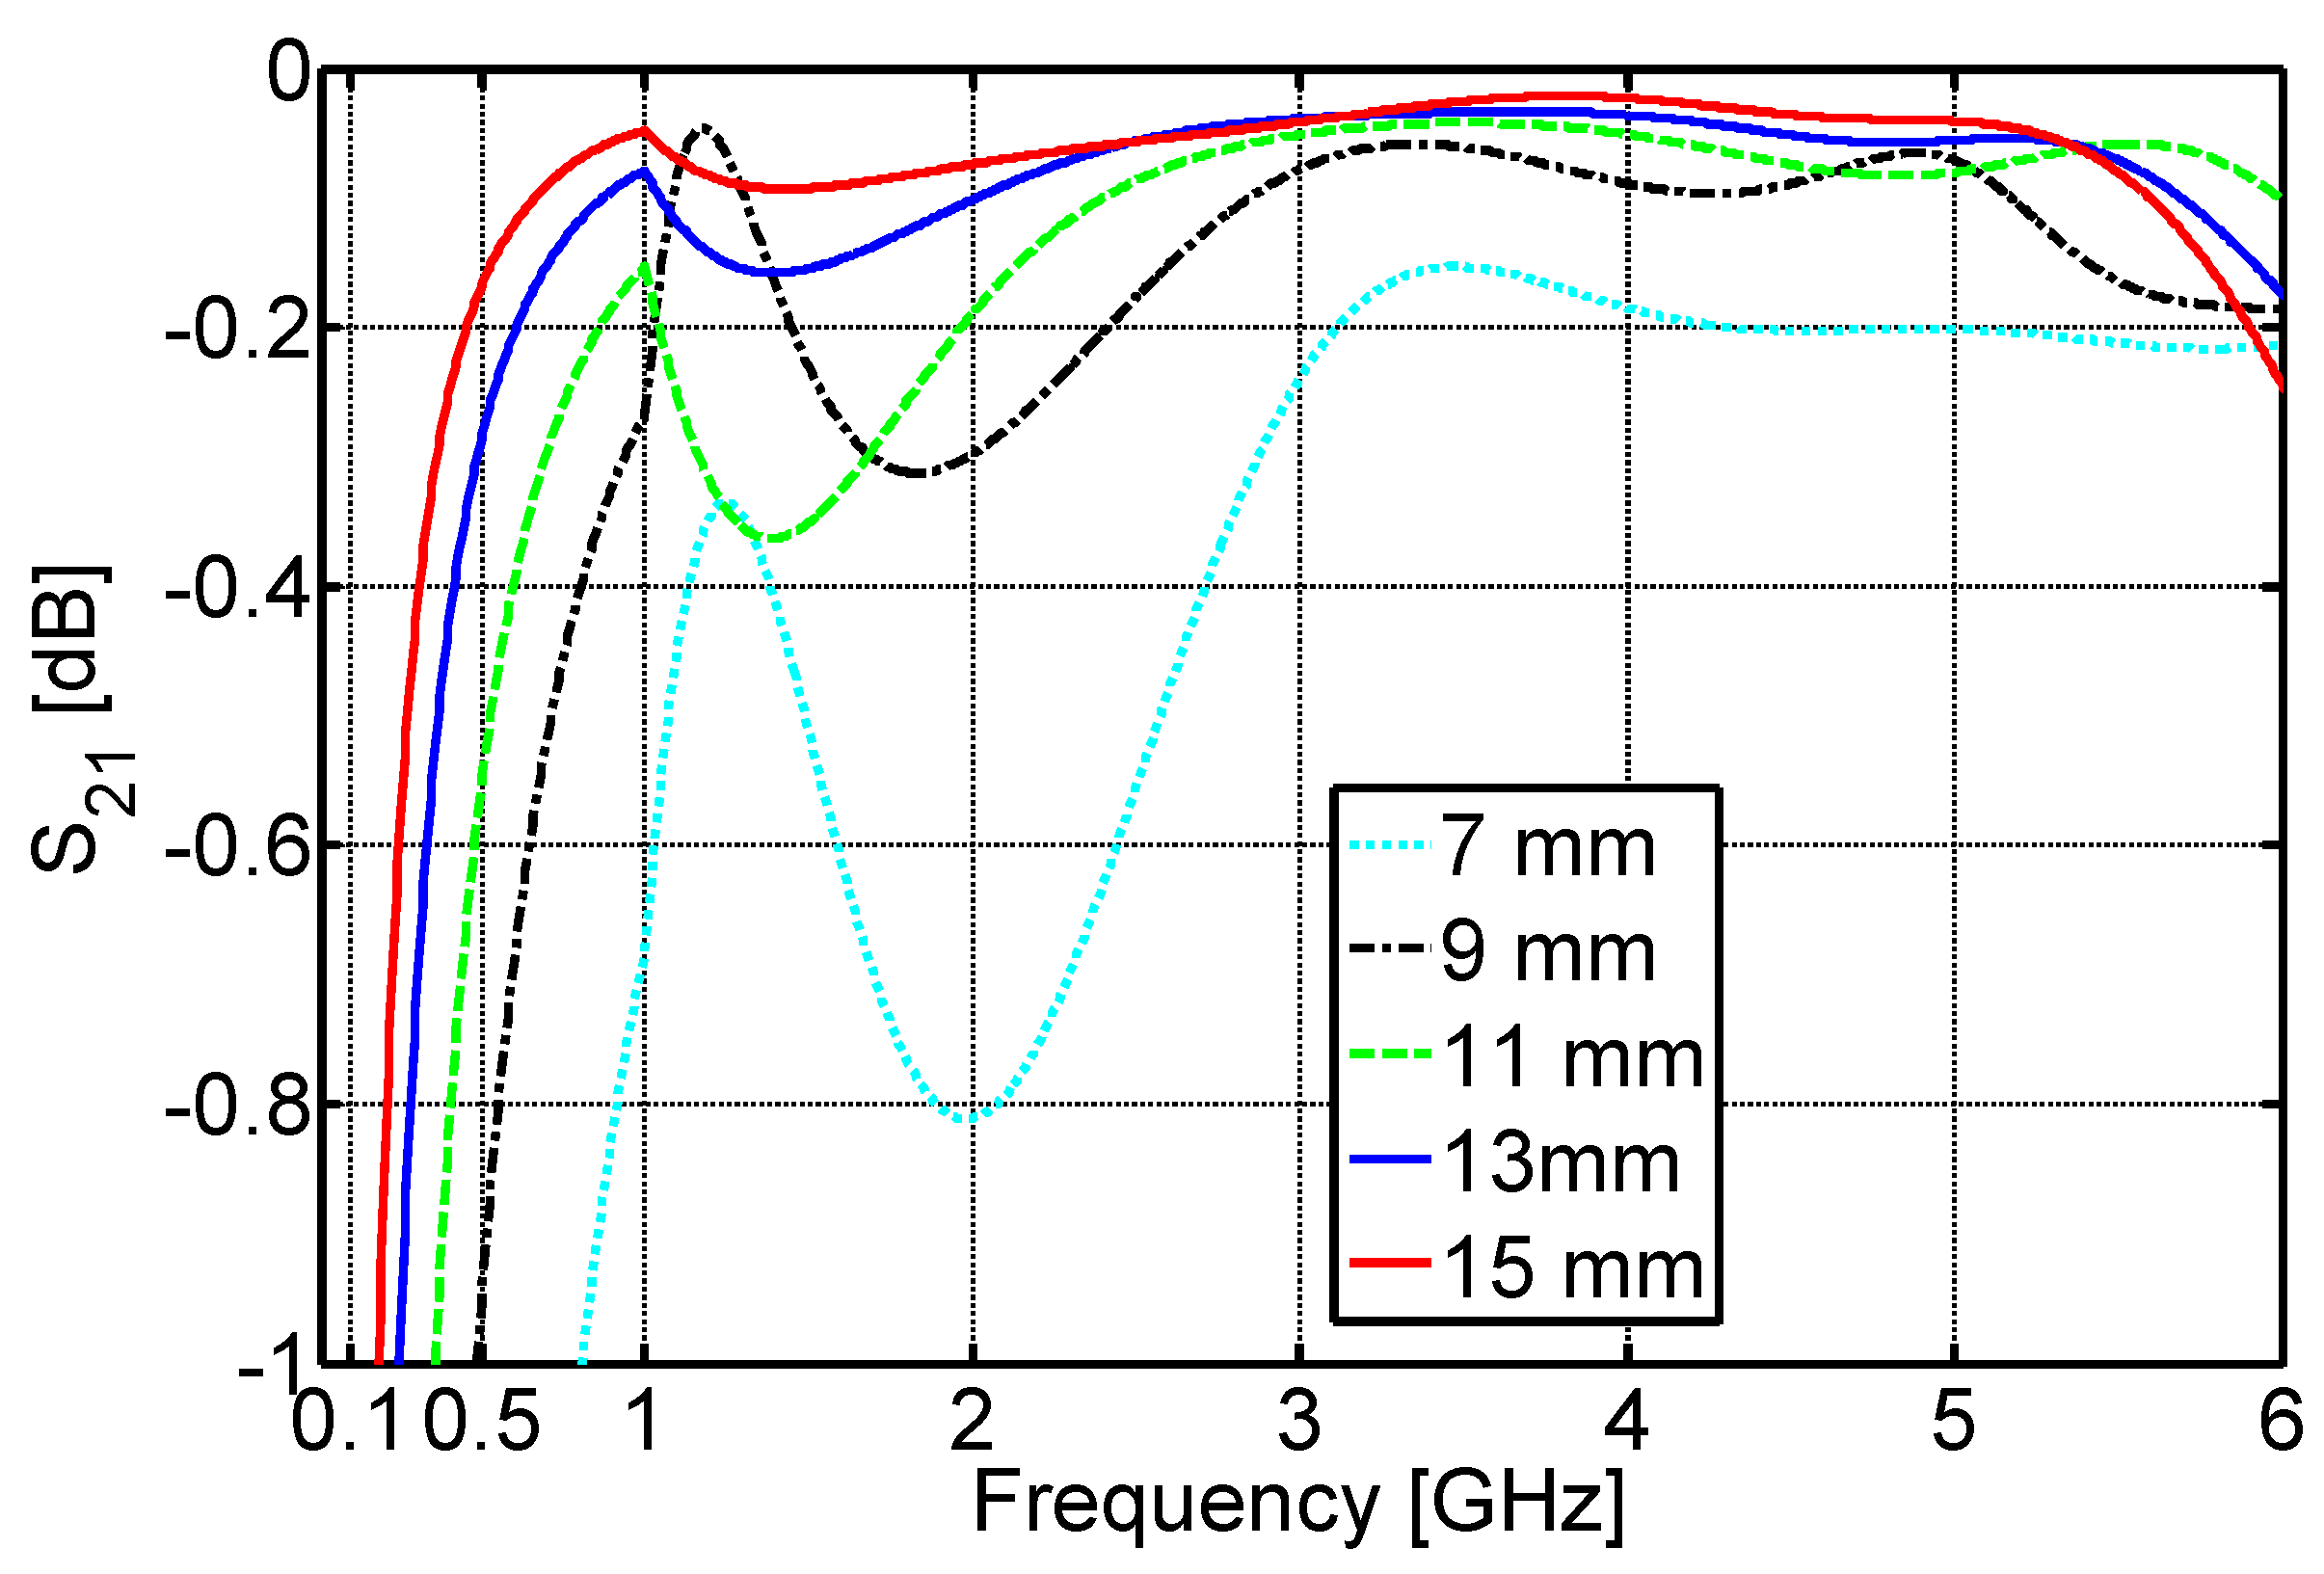
Figure 8.
Calculated distribution of heat-flow density for adiabatic line with one gap.

Figure 9.
Calculated distribution of heat flow density for adiabatic line with two gaps.

Figure 10.
Field snapshot across the line with gaps at a frequency of 2 GHz (spacers made from acetal homopolymer).
Figure 10.
Field snapshot across the line with gaps at a frequency of 2 GHz (spacers made from acetal homopolymer).

Figure 11.
Field snapshot across the line with gaps at a frequency of 4 GHz (spacers made from acetal homopolymer).
Figure 11.
Field snapshot across the line with gaps at a frequency of 4 GHz (spacers made from acetal homopolymer).

Figure 12.
Schematic representation of the proposed adiabatic line prototype (dimensions in mm).

Figure 13.
Schematic representation of vertical rings (dimensions in mm).

Figure 14.
Manufactured adiabatic line prototype.

Figure 15.
Measurement setup for characterization of adiabatic line-scattering parameters.

Figure 16.
Calculated and measured input reflection coefficient (S11) of the adiabatic transmission line.
Figure 16.
Calculated and measured input reflection coefficient (S11) of the adiabatic transmission line.

Figure 17.
Calculated and measured transmission coefficient (S21) of the adiabatic transmission line.
Figure 17.
Calculated and measured transmission coefficient (S21) of the adiabatic transmission line.

Figure 18.
Detailed view of the measured transmission coefficient within operating frequency range.

Figure 19.
Calculated and measured mismatch factor—Equation (3).

Figure 20.
Measurement setup for verifying adiabatic line performance with thermistor.

Table 1.
Calculated heat flow and heat flow reduction of polyethylene and acetal homopolymer compared to case of coaxial line with no gaps.
Table 1.
Calculated heat flow and heat flow reduction of polyethylene and acetal homopolymer compared to case of coaxial line with no gaps.
| Plastic Material | Flange Radius (mm) | Heat Flow (W)—One Gap | Heat Flow Reduction—One Gap | Heat Flow (W)—Two Gaps | Heat Flow Reduction—Two Gaps |
|---|---|---|---|---|---|
| Polyethylene | 11 | 0.0820 | 64.33% | 0.0361 | 84.27% |
| 13 | 0.1063 | 53.78% | 0.0482 | 79.03% | |
| 15 | 0.1164 | 49.36% | 0.0622 | 72.95% | |
| 17 | 0.1296 | 43.64% | 0.0715 | 68.87% | |
| Acetal homopolymer | 11 | 0.0662 | 71.21% | 0.0275 | 88.04% |
| 13 | 0.0835 | 63.69% | 0.0373 | 83.78% | |
| 15 | 0.0992 | 56.86% | 0.0475 | 79.34% | |
| 17 | 0.1131 | 50.86% | 0.0576 | 74.96% |
© 2019 by the authors. Licensee MDPI, Basel, Switzerland. This article is an open access article distributed under the terms and conditions of the Creative Commons Attribution (CC BY) license (http://creativecommons.org/licenses/by/4.0/).
Share and Cite
MDPI and ACS Style
Martinovic, Z.; Dadic, M.; Ivsic, B.; Malaric, R. An Adiabatic Coaxial Line for Microcalorimeter Power Measurements in Wireless Communication for Smart Grid. Energies 2019, 12, 4194. https://doi.org/10.3390/en12214194
AMA Style
Martinovic Z, Dadic M, Ivsic B, Malaric R. An Adiabatic Coaxial Line for Microcalorimeter Power Measurements in Wireless Communication for Smart Grid. Energies. 2019; 12(21):4194. https://doi.org/10.3390/en12214194
Chicago/Turabian StyleMartinovic, Zeljko, Martin Dadic, Branimir Ivsic, and Roman Malaric. 2019. "An Adiabatic Coaxial Line for Microcalorimeter Power Measurements in Wireless Communication for Smart Grid" Energies 12, no. 21: 4194. https://doi.org/10.3390/en12214194
Note that from the first issue of 2016, this journal uses article numbers instead of page numbers. See further details here.