Clean Poultry Energy System Design Based on Biomass Gasification Technology: Thermodynamic and Economic Analysis


1
Department of Mechanical Engineering, The University of Iowa, Iowa City, IA 52242, USA
2
College of Power and Energy Engineering, Harbin Engineering University, Harbin 150001, China
*
Author to whom correspondence should be addressed.
Energies 2019, 12(22), 4235; https://doi.org/10.3390/en12224235
Submission received: 1 October 2019
/
Revised: 31 October 2019
/
Accepted: 4 November 2019
/
Published: 6 November 2019
Abstract
:Despite growing attention has been paid to waste material gasification for high-efficiency energy conversion, the application of gasification technology in meat waste management is still limited. To fill this gap, this study designed two systems which evaluated the potential of using gasification technology to manage the poultry waste that has been exposed to highly pathogenic avian influenza (HPAI). Two systems are simulated by using Aspen plus combined with a one-dimensional kinetics control gasification model, and wood or dried poultry is selected as the feedstock for the gasifier. The results show that the energy efficiency of the poultry drying system (wood gasification) is 14.5%, which is 12% lower than that of the poultry gasification system when the poultry energy is accounted as energy input. Even though the economic analysis indicates the poultry elimination cost of the poultry gasification system is only 30 $/tonne lower than the poultry drying system, taking the absence of dried poultry burial into consideration, the poultry gasification system has development potentials. The sensitivity analysis shows that labor fee and variable factor has larger effects on the poultry elimination cost, while the uncertainty analysis determines the uncertainty level of the economic analysis results.
1. Introduction
Due to the cost and environmental problem of waste disposal and the need for more energy, growing attention has been paid to biomass gasification of converting the energy in waste material into electricity with high efficiency [1]. Even though the gasification technology of solid waste such as municipal solid waste (MSW) [2], waste tire [3], and plant waste [4,5] has been widely studied, its application in meat waste management is still limited. The meat waste of animal carcasses that have been exposed to highly pathogenic avian influenza (HPAI) is dangerous for human health and environment compared with other solid waste as a result of its potential of spread diseases, low decomposition, and appeal to scavenging animals [6].
As reported by the United States Department of Agriculture (USDA), the HPAI outbreak during 2014 and 2015 resulted in the loss of 50.5 million poultry with close to a 3.3 billion ($) economic impact [7]. Composting, landfilling, incinerating, and burning are options for influenza-exposed poultry disposal [8,9,10]. However, because of the inactivating temperature of HPAI virus is higher than 70 °C and the poultry burning has aerosol and gas-phase emissions, none of these options has the potential to mitigate virus spread while also minimizing environmental impacts [11]. Therefore, finding a reliable disposable technology is critical for future HPAI influenza poultry waste management [12].
Supported by the U.S. Poultry Association, our group proposed to use downdraft fixed bed gasifiers to dry and gasify the HPAI poultry. The downdraft fixed bed gasifier has been proposed as a solution because of its syngas temperature from the gasifier is above 600 °C, which has the potential to inactivate HPAI virus when combining with the drying process [13,14]. Moreover, downdraft fixed bed gasification technology works under atmosphere pressure and has the lowest tar emissions compared with other types of fixed bed gasifiers. It is set up easily and can reduce the poultry burning emissions [15]. However, as a new application of gasification technology, the poultry management project has two challenges: (1) fresh poultry carcass moisture content is too high to be gasified, and (2) poultry gasification is a new research idea, there is limit evaluation of this technology.
Gianluca Cavalaglio et al. (2018) have simulated the thermo-chemical processes of poultry waste gasification by using Aspen Plus, which shows the optimization of the moisture content of the poultry waste is a critical aspect for poultry waste gasification [10]. This conclusion is consistent with the research of P McKendry (2002) which indicates that the fuel moisture of the gasifier should be controlled below 15% to avoid the ignition difficult and additional moisture evaporate energy consumption [16]. These studies have demonstrated the importance of controlling waste moisture, making the drier design is essential when applying poultry waste gasification. Nevertheless, the drier design information for the HPAI influenza poultry that has a moisture content of 47.5% is scarce in public sources. Therefore, a key element of the present study is the poultry drier design that uses gasification syngas as the heat resource.
The dried poultry (with 10% moisture content) has comparable proximate and ultimate analysis results to wood as shown in Table 1, indicating its gasification potential. Previous work tested the performance of a 30 kW micro-turbine using gasification syngas products shows biomass gasification is an attractive technology for high-efficiency biomass conversion with lower NOx emissions [17]. Moreover, gasification of wood, rice husk, and sewage sludge have been carried out in fixed bed gasifier both experimentally and numerically to demonstrate its fuel flexibility and low tar emission [18,19]. However, the gasification technology application on poultry treatment is a novel idea and its efficiency and economic characters are absent. Thus, another objective of this study is to design a poultry gasification system and compare it with a reference wood gasification system based on energy and economic analysis to evaluate its development potential.
The aim of this study is to discuss the potential of using gasification technology to deal with the HPAI influenza poultry. The research is conducted by the following processes: (1) a poultry drying experiment is conducted to generate a poultry drying curve, and then this drying curve is used for a drier design; (2) using the designed drier as a major unit, two gasification systems of poultry drying (wood gasification) and poultry gasification are simulated in Aspen Plus software to show their performance indicators; (3) according to the performance results, the poultry elimination cost is evaluated by discounted cash flow analysis method. In summary, two gasification applied poultry management systems with drier design have been proposed in this paper, and their performance and economic indicators have been compared to evaluate the potential development of poultry gasification technology. The novelty of this study is that the potential of using gasification technology to deal with poultry affected by avian influenza is discussed for the first time.
2. Materials and Methods
2.1. System Design
To evaluate the energy efficiency and the economic indicator of HPAI influenza poultry treatment based on gasification technology, two gasification systems have been designed in this work. The first system uses wood chips as feedstock for the gasification process with the flowchart shown in Figure 1a. Four downdraft fixed bed gasifiers are used in one trailer for syngas production. The syngas from the gasifier flows through a heat exchanger to reduce its temperature from 712 °C to 145 °C, whereas atmosphere air absorbs the heat from syngas in the heat exchanger to produce warmed air with a temperature of 176 °C. Then the cooled syngas is cleaned and combusted in the boiler to generate power via a Rankine cycle, whereas the warmed air is used as the heat resource for the poultry dryer to inactivate HPAI virus and reduce the moisture content of the poultry input. Figure 1a also shows the system boundary for the energy and economic analysis, in which air, water, wood chips, and fresh poultry are the input materials, whereas drier air, char, boiler flue gas and dried poultry are the output emissions and products. The system in Figure 1a is named as the poultry drying system because the dried poultry is produced only for further burial.
According to Table 1, the components of the dried poultry are similar to the wood material, and therefore, it can assumed to be used as feedstock for the gasification process. To reduce the dried poultry output and generate electricity from waste poultry, a poultry gasification system shown in Figure 1b is also designed in this research. In the poultry gasification system, dried poultry from the poultry dryer reacts with air in the fixed bed gasifiers to produce hot syngas, and then the hot syngas heats the air for future dryer application. The heat exchanger and the poultry drier design of the poultry gasification system are the same as that of the poultry drying system. The major differences between these two systems are: (1) the poultry gasification system uses dried poultry as gasification feedstock, wood is only used for the startup process that is ignored in the static state system simulation, and (2) the poultry gasification system does not produce any dried poultry for further burial. Therefore, in the poultry gasification system, air, water, and fresh poultry are the primary input materials, while the outputs are drier air, char, and boiler flue gas. As the result of the dried poultry gasification, the waste poultry input is consumed in the poultry gasification system, which does not need any further burial for dried poultry management.
2.2. Methods
2.2.1. Drying Experiment and Dryer Design
Traditionally, poultry waste is dried in a convective dryer using dry air as the moisture absorbent. However, the conventional belt drier’s operating temperature is lower than 100 °C, which is too low to dry poultry and inactivate HPAI virus efficiently. To solve the problem, one convective dryer with a higher working temperature is designed by using Aspen Plus simulation [20,21] based on experimentally derived drying curve. During the experimental process, fresh whole chicken is used as the test material to represent the HPAI influenza poultry. The poultry drying experiment was conducted in an electric oven with each test repeated three times to control errors. Fresh chicken was cut into 20 mm3 cubes according to the feedstock size limit of the fixed bed gasifier. All poultry pieces had similar components of bones, meat, and fat to avoid significant experimental errors. During the test, each poultry piece was weighed in 30-min increments up to 240 min to determine the drying rate. Then the drying rate was normalized into mass ratio according to the initial poultry weight to derive the drying curve, which was used in the Aspen Plus simulation as the major simulation assumptions [22].
2.2.2. Fixed Bed Gasification Simulation
A RGibbs reactor has been widely used for the simulation of the gasification process based on equilibrium assumptions [23,24]. However, different from fluidized and entrained flow gasifiers, the downdraft fixed bed gasifier has undesired mixing characters that results in the nonuniform reaction [25,26]. Thus, using a chemical equilibrium model to simulate the downdraft fixed bed gasification process will produce large errors [17]. To control the simulation errors, a combined model of the chemical equilibrium and the kinetics control reactions is widely used for the fixed bed gasification process simulation [3,27,28]. Although the combined model has been successfully used for wood and animal manure gasification simulation, no study has used it for poultry gasification simulation to date [15].
Figure 2a shows the structure of the downdraft fixed bed gasifier located at the Oakdale renewable energy plant of the University of Iowa [29]. The total pilot-scale plant includes two fuel storage bins, one fixed bed gasifier, one movable test probe, and auxiliary devices such as burner, pump, flowmeters, control panel, and valves [30]. The downdraft gasifier has an outer diameter of 1.15 m and a height of 2.58 m. During the operation of the fixed bed gasifier, the turntable fingers as seen in the bottom of the gasifier rotate to improve the mixture characters of the gasifier. Because the fuel and air inputs to the gasifier are from the top, the gasifier can be separated into four zones of drying, pyrolysis, combustion, and reduction from the top to the bottom (shown in Figure 2b).
According to the research of Roy et al. (2009 and 2015), the combustion and reduction zones include the major reactions of gasification process [27,31]. Therefore, in the simulation process, the total gasifier was re-grouped into two reaction zones: a pyro-oxidation zone and a reduction zone. In the pyro-oxidation zone, all the reactions of drying, pyrolysis, and combustion happen to convert the solid fuel and air into syngas and char. Because of the high reaction rate of the combustion process, the main assumption of this zone is that the gaseous species reach chemical equilibrium at its end. The global reaction of the pyro-oxidation zone is
where , x, and y are derived from the material ultimate analysis, moisture content, and air input by assuming 1 molar of carbon of wood or poultry takes part in the gasification reaction. through denote the number of moles of products. Seven equations are required to solve these seven unknowns as shown in Equation (2) to Equation (8). The Equations (2)–(5) are from the mass balance of H, C, N, and O. Equation (6) is set from the chemical equilibrium of water gas shift reaction R1 in Table 2, in which is the equilibrium constant of the water gas shift reaction, R is 8.314 kJ/mol·K, T is the combustion temperature derived from energy balance as shown in Equation (9) [27]. Meanwhile, Equation (7) assumes that methane is formed through R2 in Table 2 with an equilibrium constant of . Finally, Equation (8) assumes that the fixed carbon of the feedstock is translated into carbon and methane.
in Equation (9), , m, and are the formation enthalpy, mass flow rate and specific heat, respectively. The subscripts f, , ash, and i represent fuel, water, ash, and syngas, respectively. is the heat loss derived from test result and is the temperature of standard state that is 25 °C. During the calculation process, the specific heat of syngas changed with reaction temperature, while the specific heat of ash and char were fixed at 0.84 kJ/kg·K and 1.82 kJ/kg·K [32].
In the reduction zone, the reactions take place and reform the syngas and char from the pyro-oxidation zone. The main assumption is that the total reduction zone can be been divided into 400 reaction volumes with zero heat loss, as shown in Figure 3: r and ∆H are the inside semi-diameter and height of the gasifier, respectively, which are used to calculate the volume of the small control volume by ; and are the initial and product mole flowrate of syngas, respectively. Four reactions from R2 to R5 are considered in this zone with the reaction equilibrium constant K, activation energy E, and pre-exponential factor A as shown in Table 2 gained from the model of Wang et al. [33]. Moreover, C2 to C5 are constant value of 100 and is the molar concentration of syngas species.
Equation (17) shows the energy balance of the kth control volume, which is used to calculate the reaction temperature in it [32]. More details of the one-dimensional model are provided in references [27,31]. Figure 4 shows the validation of the one-dimensional model compared with the work of Jayah et al. [34], the percent error of the simulation is no more than 3.6%. As the result of the root-mean-square error of the simulation is 2.2%, the simulation model has a good agreement with the experimental results.
2.2.3. Models of Other Units
Except for the fixed bed gasification process was simulated by using MATLAB, all the other reaction units in the poultry drying and gasification systems were simulated with Aspen Plus software. The blower from Eminent Blowers (Pune, Maharashtra, India) model no. r-1-0010 blows air into the fixed bed gasifier and the poultry drier with the power consumption according to its operation menus. The heat exchanger is designed to cool the hot syngas from the gasifier to produce warm air using a MHeatX unit in the Aspen Plus [35]. Moreover, the boiler has an energy efficiency of 90%, which is simulated by a RGibbs reactor [36], works under 900 °C with 20% excess air according to a typical fluidized bed boiler design [37]. Rankine cycle is used to generate power in both systems, with an initial temperature of 566 °C and an initial pressure of 16.5 MPa [38]. To include the unconvertible energy loss, the isentropic efficiency of the steam turbine and the pump is assumed to be 88% and 78%, respectively, based on industry technology [35]. A convective dryer is designed in Aspen Plus [21,39] with a cross-flow direction according to the normalized drying curve derived from the poultry drying test result.
2.3. Economic and Uncertainty Analysis
The economic analysis is based on the methodology employed by National Energy Technology Laboratories (NETL) and National Renewable Energy Laboratory (NREL) [40,41], which includes total investment cost and operating cost assessment according to NETL model, and discounted cash flow analysis based on the assumption from NREL. The total investment cost is calculated based on the total plant cost (TPC), which is scaled by Equation (18).
where C and S are the cost and scale of the calculated equipment, respectively. C0 and S0 are the cost and scale of the reference equipment, respectively. f is the scaling exponent with the data resources shown in Table 3 [42,43,44]. The reference cost of the dried poultry prepare equipment is the same as that of wood prepare, which is 5.23 k$, while the reference cost of fixed bed gasifier and cleaning equipment is 19.07 k$ according to our previous publication [3]. The reference costs of the heat exchanger, syngas boiler, steam turbine, and dryer are from our market survey from Good Land Industrial Co. (Milwaukee, Wisconsin, U.S.), ZhengZhou Boiler Co.(Zhenzhou, Henan, China), and SHIVVERS Co. (Corydon, IA, USA).
Total overnight cost (TOC) is expressed in 2017 dollars that does not include escalation or interest during construction. TOC is the summation of TPC and owner’s cost during the economic analysis processes. The owner’s cost comprises pre-production cost, inventory capital, land, financing cost, and other owner’s costs. The pre-production cost involves 6 months of operating labor, 1 month of maintenance, none-fuel consumables, waste disposal, a quarter month of fuel cost, and 2% of TPC; the inventory capital is the summation of 0.5% of TPC and 2 months’ supply of fuel and non-fuel consumables at full capacity; and land, financing cost, and other owner’s cost are 0.74 $/m2, 2.7% and 15% of TPC, respectively.
The operating cost includes the variable operating cost that is a corporate expense that changes in proportion to production output and the fixed operating cost that does not change with production output. In this study, the variable operating cost comprises maintenance material cost, fuel consumable cost, and electricity selling credit by assuming that the wood chip cost is 50 $/tonne [45] and the electricity selling price is 0.12 $/kWh [46]. While the fixed operating cost involves annual operating labor cost, maintenance labor cost, administrative and support labor, and property taxes and insurance, by using an operating labor rate of 34.65 $/h, with an operating labor burden of 30%.
The discounted cash flow analysis is according to NREL economic analysis model, which has construction and operation periods of 3 and 20 years [41]. The capital depreciation is 8 years with 150% declining, and the debt period and interest are 10 years and 8%, respectively. To calculate the poultry management cost, the poultry elimination cost is selected as the major indicator to compare the two designed systems. The discounted cash flow analysis is calculated by iterating the poultry elimination cost until the net present value of the project is zero [41]. Despite the discount rate of 10% is recommended by the NREL economic model, a higher discount rate of 15% is used in this research to consider the uncertainty of the novel technology of poultry gasification. Besides the above parameters, a federal tax rate of 38%, equity financed of 0%, start time of 3 months with 50% production, 75% of variable expenses, and 100% of fixed expenses are used for the discounted cash flow analysis.
3. Results and Discussion
3.1. Drying Experiment and Dryer Simulation Results
Because of the dryer is designed by using hot air or syngas as the heat resources with a temperature no more than 200 °C, the poultry drying test is conducted in a temperature range from 93 °C to 176 °C, and the reaction temperature is from 0 min to 240 min (4 h). Each test is repeated by three times. The data from the oven testing was compiled into Figure 5, which shows the normalized mass ratio as a function of time and temperature. In Figure 5, the mass of the poultry decreases faster with higher temperatures. To minimize the size of the dryer, the drying curve at 176 °C was selected for the dryer design. A drier with a length of 5 m is designed in Aspen Plus software for the further length reduction. Figure 6 shows the solid moisture content as a function of the dryer length, in which the moisture constant of the poultry decreased to 10% at 2.28 m. Thus, a dryer with a length of 2.28 m was used in the poultry drying and poultry gasification systems.
3.2. System Mass and Energy Analysis Results
The major stream simulation results of the poultry drying system are shown in Table 4 and Figure 7 according to the stream numbers in Figure 1. The two systems are designed to treat 152 kg fresh poultry per hour with four fixed bed gasifiers working in one trail. The poultry drying system selects wood as the feedstock for the gasifiers, which is based on currently available wood gasification technology as a short-term solution for the HPAI influenza poultry management. In Figure 7a, wood with a mass flow rate of 108 kg/h (Stream 2) is gasified to produce 331 kg/h of syngas (Stream 3); 6 kg/h of char is disposed of as waste (Stream 4). Then, Stream 3 flows through the heat exchanger as hot input to produce the warm air flow of Stream 6 for the poultry dryer. In the dryer, 152 kg/h of fresh poultry (Stream 7) with 47.5% moisture is dried by the warm air flow and produces 86 kg/h of dried poultry with 10% moisture (Stream 9) for future burial. Because the dried poultry output temperature is around 120 °C, which is higher than the avian inactivity temperature of 60–70 °C, the poultry drying system has the potential to inactivate all the avian virus in infected poultry.
Despite the poultry trying system has the potential to inactivate the virus in the infected poultry efficiently, the major solid components of the poultry that contain large amount of energy still need further burial. To use the energy from the dried poultry, the poultry gasification system is proposed to use the dried poultry as the gasifiers’ feedstock to supersede the wood consumption of the poultry drying system. Table 4b and Figure 7b present the major stream simulation results of the poultry gasification system. In this system, 275 kg/h of air (Stream 1) reacts with 86 kg/h of dried poultry (Stream 2) in gasifiers to produce 348 kg/h of syngas and 13 kg/h of solid char waste (Streams 3 and 4). After the gasification process, Stream 3 warms up Stream 5 for the dryer. In the dryer, 152 kg/h of fresh poultry is dried to reduce the moisture.
In Table 4, there are two major differences between the poultry drying and gasification systems: (1) The syngas production from dried poultry gasification system has a higher CO mole fraction, which results in the dried poultry gasifier has a higher energy efficiency than the wood gasifier. (2) In the poultry gasification system, the dried poultry is gasified in the gasifier and no further burial in needed, which reduce the solid emission from the poultry drying system largely.
Table 5 shows the energy balance of two gasification basis systems. For the poultry drying system, wood energy input is 494kW and the energy in the fresh poultry is 444 kW. The system’s energy efficiency based on wood energy input (poultry is not considered as energy input) is 26.2%, which is similar to the other biomass-based power plant [47]. Nevertheless, when considering the fresh poultry energy as another energy resource, the total system efficiency is only 14.5% because dried poultry is disposed as a waste material for further burial. However, for the poultry gasification system, fresh poultry is the only energy input with a higher total energy efficiency of 26.5%. Table 5 lists all the power generation, power consumptions, and energy consumptions of these systems, where gasification and boilers have the largest energy consumption among all the equipment.
The above analysis results show two advantages of the poultry gasification system compared with the poultry drying system: (a) the poultry gasification system used dried poultry as the feedstock which reduces wood consumption and controls the dried poultry product, which is much cleaner than the poultry drying system; and (b) the total energy efficiency of the poultry gasification system is 12% higher than the poultry drying system as the results of using dried poultry as a feedstock. Despite the emission and the efficiency benefits of the poultry gasification system, the poultry gasification technology is not as mature as wood gasification, therefore based on the technology availability, the poultry drying system is a short-term solution for the management of HPAI effected poultries.
3.3. Techno-Economic Analysis Results
Economic analysis was conducted on the currently designed systems to further evaluate the potential of using biomass gasification, which is a clean and efficient technology for waste treatment [48], in HPAI poultry treatment. Table 6 shows the total investment cost result of the two-gasification basis systems designed in the current work, in which the fixed bed gasifier, the syngas boiler, and steam turbine share the largest equipment cost. Figure 8 indicates the cost components of poultry drying and poultry gasification systems. By assuming one labor needed per shift, the fixed operating costs of these two systems are similar. However, because the wood price is 50 $/ton, and the fresh poultry is 0 $/ton, the variable operating cost of the poultry gasification system is much lower than that of the poultry drying system. The last group of columns shows the poultry elimination cost. The poultry drying system’s poultry elimination cost is 477 $/ton, while that of the poultry gasification system is 447 $/ton. Considering that the poultry drying system requires a further burial process, the poultry gasification system is economically preferable.
3.4. Sensitivity and Uncertainty Analysis
Figure 9 indicates the sensitivity analysis result of the poultry drying system and the poultry gasification system. Labor fee and available factor have larger effects on poultry elimination cost than other parameters, indicating that both decreasing the labor fee and increasing available factor can enhance the current system’s economic indicator.
Moreover, when the operation periods increase from 10 years to 20 years, the poultry elimination cost of both cases decreases by around 50 $/ton; while when the operation periods grow from 20 years to 30 years, their poultry elimination cost only decreases 10 $/ton. These results show that the poultry elimination cost does not have a linear relationship with operation periods, for these systems, 20 years lifetime is long enough for the economical operation of these systems. Finally, the poultry price has impacts on the poultry elimination cost of both the poultry drying and gasification systems. While the wood price does not have impacts on that of the poultry gasification system, as a result of that, the poultry gasification system runs without wood feedstock supply.
Figure 10 shows the uncertainty analysis result of the poultry drying system and the poultry gasification system. The uncertainty analysis was conducted using a Monte-Carlo analysis method.
Uncertainty analysis includes all the variations of the parameters shown in Figure 9, which have the same changing range as the sensitivity analysis. In the analysis process, the variations follow the triangular distributions, and 10,000 trials of 100 columns are used. The 80% certainty range of the poultry elimination cost for the poultry drying system is 416–543 $/ton, while that for the poultry gasification system is 382–514 $/ton. The resulting distribution shows a large standard deviation, which is caused by the large effects of the labor fee and available factor. The Monte-Carlo analysis demonstrates that the economic performance of the poultry gasification system is better than the poultry drying system, and they have similar uncertainty distribution, due to their similar system design.
4. Conclusions and Discussion
This study discusses the potential of using gasification technology to dry the avian influenza poultry and generate electricity using dried poultry as feedstock. There are four major conclusions:
- (a)
- A lab-scale poultry drying test has been conducted to derive the poultry drying curve at 176 °C. This drying curve is used for dryer design in Aspen plus, which indicates a dryer of 2.28 m has the potential to reduce the poultry moisture to 10%.
- (b)
- For the poultry drying system, wood energy input is 494 kW and the energy in the fresh poultry is 444 kW. The system’s energy efficiency based on wood energy input (poultry is not considered as energy input) is 26.2%, Nevertheless, when considering the fresh poultry energy as another energy resource, the total system efficiency is only 14.5%. Compared with the poultry drying system, the poultry gasification system has a total energy efficiency of 26.5% with lower solid waste emissions. These results indicate the advantage of the poultry gasification system.
- (c)
- Economic analysis results show that the poultry elimination cost of the poultry gasification system is 447 $/ton, which is 30 $/ton lower than the poultry drying system. Considering that the poultry drying system requires a further burial process, the poultry gasification system is economically preferable.
- (d)
- The sensitivity and uncertainty analysis results show that the labor fee and the variable factor are two key parameters that have large effects on the poultry elimination cost of both systems. Even though the economic performance of the poultry gasification system is better than the poultry drying system, they have similar uncertainty distribution, due to their similar system design.
As reported by USDA, the 2014–2015 HPAI outbreak resulted in the loss of 50.5 million commercial birds [7], which has the potential to generate 27,296 MJ electricity by gasification and reduce the landfill emissions at the same time. Because of the poultry waste that has been exposed to HPAI has the potential to spread, the poultry waste is assumed as a hazardous waste. Currently, hazardous solid waste removal cost is more than 4 $/kg [49]. If the gasification technology can be used for poultry waste treatment, the solid waste removal cost can be reduced to 0.5 $/kg, which will be an attractive waste management plan.
Author Contributions
Conceptualization, A.R. and G.Z.; Methodology, G.Z. and N.W.; Software, G.Z. and N.W.; Test, N.W.; Validation, J.J., J.Z., and A.R.; Resources, J.J.; Data curation, G.Z.; Writing—original draft preparation, G.Z. and J.Z.; Writing—review and editing, G.Z. and J.Z.; Visualization, G.Z.; Supervision, A.R.; Project administration, A.R.; funding acquisition, A.R.
Funding
This research was funded by U.S. Poultry Association and the University of IOWA.
Acknowledgments
The authors would like to thank the U.S. Poultry Association for financial support and the University of Iowa for their support of this work. The authors also thank Editor Melanie Laverman for all of the help in editing the paper.
Conflicts of Interest
The authors declare no conflict of interest.
Abbreviations
| HPAI | Highly pathogenic avian influenza |
| MSW | Municipal solid waste |
| NETL | National Energy Technology Laboratories |
| NREL | National Renewable Energy Laboratory |
| TOC | Total overnight cost |
| TPC | Total plant cost |
| USDA | United States Department of Agriculture |
References
- Hsiao, M.C.; Chang, L.W.; Hou, S.S. Study of Solid Calcium Diglyceroxide for Biodiesel Production from Waste Cooking Oil Using a High Speed Homogenizer. Energies 2019, 12, 3205. [Google Scholar] [CrossRef]
- Chen, S.; Meng, A.; Long, Y.; Zhou, H.; Li, Q.; Zhang, Y. TGA pyrolysis and gasification of combustible municipal solid waste. J. Energy Inst. 2015, 88, 332–343. [Google Scholar] [CrossRef]
- Zang, G.; Jia, J.; Shi, Y.; Sharma, T.; Ratner, A. Modeling and economic analysis of waste tire gasification in fluidized and fixed bed gasifiers. Waste Manag. 2019, 89, 201–211. [Google Scholar] [CrossRef]
- Upadhyay, D.S.; Makwana, H.V.; Patel, R.N. Performance evaluation of 10 kWe pilot scale downdraft gasifier with different feedstock. J. Energy Inst. 2019, 92, 913–922. [Google Scholar] [CrossRef]
- Sulaiman, S.A.; Roslan, R.; Inayat, M.; Naz, M.Y. Effect of blending ratio and catalyst loading on co-gasification of wood chips and coconut waste. J. Energy Inst. 2018, 91, 779–785. [Google Scholar] [CrossRef]
- Adlhoch, C.; Dabrera, G.; Penttinen, P.; Pebody, R. Protective Measures for Humans against Avian Influenza A (H5N8) Outbreaks in 22 European Union/European Economic Area Countries and Israel, 2016–2017. Emerg. Infect. Dis. 2018, 24, e180269. [Google Scholar] [CrossRef] [PubMed]
- United States Department of Agriculture. Highly Pothogenic Avian Influenza Response Plan: The Red Book; National Preparedness and Incident Coordination Center: Road Riverdale, MD, USA, 2017.
- Mustafa, E.A.; Hamad, E.M.; Elhassan, M.; Salman, A.M.; Elsiddig, M.; Lamyia, M. Disposal of Dead Birds and Manure in Poultry Farms Under Different Production and Management Systems in Khartoum State, Sudan. World J. Pharm. Pharm. Sci. 2018, 7, 61–70. [Google Scholar]
- Kantarli, I.C.; Kabadayi, A.; Ucar, S.; Yanik, J. Conversion of poultry wastes into energy feedstocks. Waste Manag. 2016, 56, 530–539. [Google Scholar] [CrossRef] [PubMed]
- Cavalaglio, G.; Coccia, V.; Cotana, F.; Gelosia, M.; Nicolini, A.; Petrozzi, A. Energy from poultry waste: An Aspen Plus-based approach to the thermo-chemical processes. Waste Manag. 2018, 73, 496–503. [Google Scholar] [CrossRef]
- United States Department of Agriculture. Standard Operating Procedures: 14. Disposal; National Preparedness and Incident Coordination Center: Road Riverdale, MD, USA, 2014.
- Kim, M.H.; Kim, G. Analysis of environmental impacts of burial sites. J. Mater. Cycles Waste Manag. 2017, 19, 432–442. [Google Scholar] [CrossRef]
- Diyoke, C.; Gao, N.; Aneke, M.; Wang, M.; Wu, C. Modelling of down-draft gasification of biomass—An integrated pyrolysis, combustion and reduction process. Appl. Therm. Eng. 2018, 142, 444–456. [Google Scholar] [CrossRef]
- Huang, Y.; Wan, Y.; Liu, S.; Zhang, Y.; Ma, H.; Zhang, S.; Zhou, J. A Downdraft Fixed-Bed Biomass Gasification System with Integrated Products of Electricity, Heat, and Biochar: The Key Features and Initial Commercial Performance. Energies 2019, 12, 2979. [Google Scholar] [CrossRef]
- Jia, J.; Shu, L.; Zang, G.; Xu, L.; Abudula, A.; Ge, K. Energy analysis and techno-economic assessment of a co-gasification of woody biomass and animal manure, solid oxide fuel cells and micro gas turbine hybrid system. Energy 2018, 149, 750–761. [Google Scholar] [CrossRef]
- McKendry, P. Energy production from biomass (part 3): Gasification technologies. Bioresour. Technol. 2002, 83, 55–63. [Google Scholar] [CrossRef]
- Corrêa, P.S.P., Jr.; Zhang, J.; Lora, E.E.S.; Andrade, R.V.; Pinto, L.R.D.M.E.; Ratner, A. Experimental study on applying biomass-derived syngas in a microturbine. Appl. Therm. Eng. 2019, 146, 328–337. [Google Scholar] [CrossRef]
- Khonde, R.; Chaurasia, A. Rice husk gasification in a two-stage fixed-bed gasifier: Production of hydrogen rich syngas and kinetics. Int. J. Hydrogen Energy 2016, 41, 8793–8802. [Google Scholar] [CrossRef]
- Ong, Z.; Cheng, Y.; Maneerung, T.; Yao, Z.; Tong, Y.W.; Wang, C.H.; Dai, Y. Co-gasification of woody biomass and sewage sludge in a fixed-bed downdraft gasifier. AIChE J. 2015, 61, 2508–2521. [Google Scholar] [CrossRef]
- Di Fraia, S.; Massarotti, N.; Vanoli, L.; Costa, M. Thermo-economic analysis of a novel cogeneration system for sewage sludge treatment. Energy 2016, 115, 1560–1571. [Google Scholar] [CrossRef]
- Alamia, A.; Ström, H.; Thunman, H. Design of an integrated dryer and conveyor belt for woody biofuels. Biomass Bioenergy 2015, 77, 92–109. [Google Scholar] [CrossRef]
- Peregrina, C.; Rudolph, V.; Lecomte, D.; Arlabosse, P. Immersion frying for the thermal drying of sewage sludge: An economic assessment. J. Environ. Manag. 2008, 86, 246–261. [Google Scholar] [CrossRef] [Green Version]
- Xu, Y.; Zang, G.; Chen, H.; Dou, B.; Tan, C. Co-production system of hydrogen and electricity based on coal partial gasification with CO2 capture. Int. J. Hydrogen Energy 2012, 37, 11805–11814. [Google Scholar] [CrossRef]
- Ramzan, N.; Ashraf, A.; Naveed, S.; Malik, A. Simulation of hybrid biomass gasification using Aspen plus: A comparative performance analysis for food, municipal solid and poultry waste. Biomass Bioenergy 2011, 35, 3962–3969. [Google Scholar] [CrossRef]
- Ma, Z.; Zhang, Y.; Zhang, Q.; Qu, Y.; Zhou, J.; Qin, H. Design and experimental investigation of a 190 kWe biomass fixed bed gasification and polygeneration pilot plant using a double air stage downdraft approach. Energy 2012, 46, 140–147. [Google Scholar] [CrossRef]
- Patra, T.K.; Sheth, P.N. Biomass gasification models for downdraft gasifier: A state-of-the-art review. Renew. Sustain. Energy Rev. 2015, 50, 583–593. [Google Scholar] [CrossRef]
- Roy, P.C.; Datta, A.; Chakraborty, N. Modelling of a downdraft biomass gasifier with finite rate kinetics in the reduction zone. Int. J. Energy Res. 2009, 33, 833–851. [Google Scholar] [CrossRef]
- Jia, J.; Abudula, A.; Wei, L.; Sun, B.; Shi, Y. Thermodynamic modeling of an integrated biomass gasification and solid oxide fuel cell system. Renew. Energy 2015, 81, 400–410. [Google Scholar] [CrossRef]
- Shi, Y.; Sharma, T.; Zang, G.; Ratner, A. Biomass Gasification in a Pilot-Scale Gasifier. In ASME 2014 International Mechanical Engineering Congress and Exposition; American Society of Mechanical Engineers: New York, NY, USA, 2014; p. V06AT07A073. [Google Scholar]
- Sharma, T. Gasification and Combustion of Corn Kernels in a Pilot Scale System. Master’s Thesis, University of Iowa, Lowa City, IA, USA, 2015. [Google Scholar]
- Roy, P.C.; Datta, A.; Chakraborty, N. Assessment of cow dung as a supplementary fuel in a downdraft biomass gasifier. Renew. Energy 2010, 35, 379–386. [Google Scholar] [CrossRef]
- Sharma, S.; Sheth, P.N. Air–steam biomass gasification: Experiments, modeling and simulation. Energy Convers. Manag. 2016, 110, 307–318. [Google Scholar] [CrossRef]
- Wang, Y.; Kinoshita, C. Kinetic model of biomass gasification. Sol. Energy 1993, 51, 19–25. [Google Scholar] [CrossRef]
- Jayah, T.; Aye, L.; Fuller, R.; Stewart, D. Computer simulation of a downdraft wood gasifier for tea drying. Biomass Bioenergy 2003, 25, 459–469. [Google Scholar] [CrossRef]
- Zang, G.; Tejasvi, S.; Ratner, A.; Lora, E.S. A comparative study of biomass integrated gasification combined cycle power systems: Performance analysis. Bioresour. Technol. 2018, 255, 246–256. [Google Scholar] [CrossRef] [PubMed]
- Duan, W.; Yu, Q.; Wang, K.; Qin, Q.; Hou, L.; Yao, X.; Wu, T. ASPEN Plus simulation of coal integrated gasification combined blast furnace slag waste heat recovery system. Energy Convers. Manag. 2015, 100, 30–36. [Google Scholar] [CrossRef]
- Sandberg, J.; Karlsson, C.; Fdhila, R.B. A 7 year long measurement period investigating the correlation of corrosion, deposit and fuel in a biomass fired circulated fluidized bed boiler. Appl. Energy 2011, 88, 99–110. [Google Scholar] [CrossRef]
- Safdarnejad, S.M.; Hedengren, J.D.; Baxter, L.L. Dynamic optimization of a hybrid system of energy-storing cryogenic carbon capture and a baseline power generation unit. Appl. Energy 2016, 172, 66–79. [Google Scholar] [CrossRef] [Green Version]
- Haydary, J. Chemical Process Design and Simulation: Aspen Plus and Aspen Hysys Applications; John Wiley & Sons: Hoboken, NJ, USA, 2019. [Google Scholar]
- Gerdes, K.; Summers, W.M.; Wimer, J. Cost Estimation Methodology for NETL Assessments of Power Plant Performance; Report No. DOE/NETL-2011/1455; US Department of Energy, National Energy Technology Laboratories: Pittsburgh, PA, USA, 2011.
- Humbird, D.; Davis, R.; Tao, L.; Kinchin, C.; Hsu, D.; Aden, A.; Schoen, P.; Lukas, J.; Olthof, B.; Worley, M. Process Design and Economics for Biochemical Conversion of Lignocellulosic Biomass to Ethanol: Dilute-Acid Pretreatment and Enzymatic Hydrolysis of Corn Stover; National Renewable Energy Laboratory (NREL): Golden, CO, USA, 2011.
- Khorshidi, Z.; Florin, N.H.; Ho, M.T.; Wiley, D.E. Techno-economic evaluation of co-firing biomass gas with natural gas in existing NGCC plants with and without CO2 capture. Int. J. Greenh. Gas Control 2016, 49, 343–363. [Google Scholar] [CrossRef]
- Kazi, F.K.; Fortman, J.; Anex, R.; Kothandaraman, G.; Hsu, D.; Aden, A.; Dutta, A. Techno-Economic Analysis of Biochemical Scenarios for Production of Cellulosic Ethanol; National Renewable Energy Laboratory (NREL): Golden, CO, USA, 2010.
- Davis, R.; Tao, L.; Tan, E.; Biddy, M.; Beckham, G.; Scarlata, C.; Jacobson, J.; Cafferty, K.; Ross, J.; Lukas, J. Process Design and Economics for the Conversion of Lignocellulosic Biomass to Hydrocarbons: Dilute-Acid and Enzymatic Deconstruction of Biomass to Sugars and Biological Conversion of Sugars to Hydrocarbons; National Renewable Energy Laboratory (NREL): Golden, CO, USA, 2013.
- Fernand, F.; Israel, A.; Skjermo, J.; Wichard, T.; Timmermans, K.R.; Golberg, A. Offshore macroalgae biomass for bioenergy production: Environmental aspects, technological achievements and challenges. Renew. Sustain. Energy Rev. 2017, 75, 35–45. [Google Scholar] [CrossRef]
- Romanchenko, D.; Odenberger, M.; Göransson, L.; Johnsson, F. Impact of electricity price fluctuations on the operation of district heating systems: A case study of district heating in Göteborg, Sweden. Appl. Energy 2017, 204, 16–30. [Google Scholar] [CrossRef]
- Nunes, L.; Matias, J.; Catalão, J. Biomass combustion systems: A review on the physical and chemical properties of the ashes. Renew. Sustain. Energy Rev. 2016, 53, 235–242. [Google Scholar] [CrossRef]
- Gu, H.; Tang, Y.; Yao, J.; Chen, F. Study on biomass gasification under various operating conditions. J. Energy Inst. 2019, 92, 1329–1336. [Google Scholar] [CrossRef]
- Boulder County Co. Hazardous Waste Disposal Costs for Businesses. 2019. Available online: https://www.bouldercounty.org/environment/hazardous-waste/disposal-costs-for-businesses/ (accessed on 5 November 2019).
Figure 1.
Flowchart and boundary of (a) the poultry drying system and (b) the poultry gasification system.
Figure 1.
Flowchart and boundary of (a) the poultry drying system and (b) the poultry gasification system.

Figure 2.
Structure and the simulation process of the downdraft gasifier (a) photo of pilot-scale gasifier, (b) four reaction zones distribution, and (c) two reaction zones for modeling.
Figure 2.
Structure and the simulation process of the downdraft gasifier (a) photo of pilot-scale gasifier, (b) four reaction zones distribution, and (c) two reaction zones for modeling.
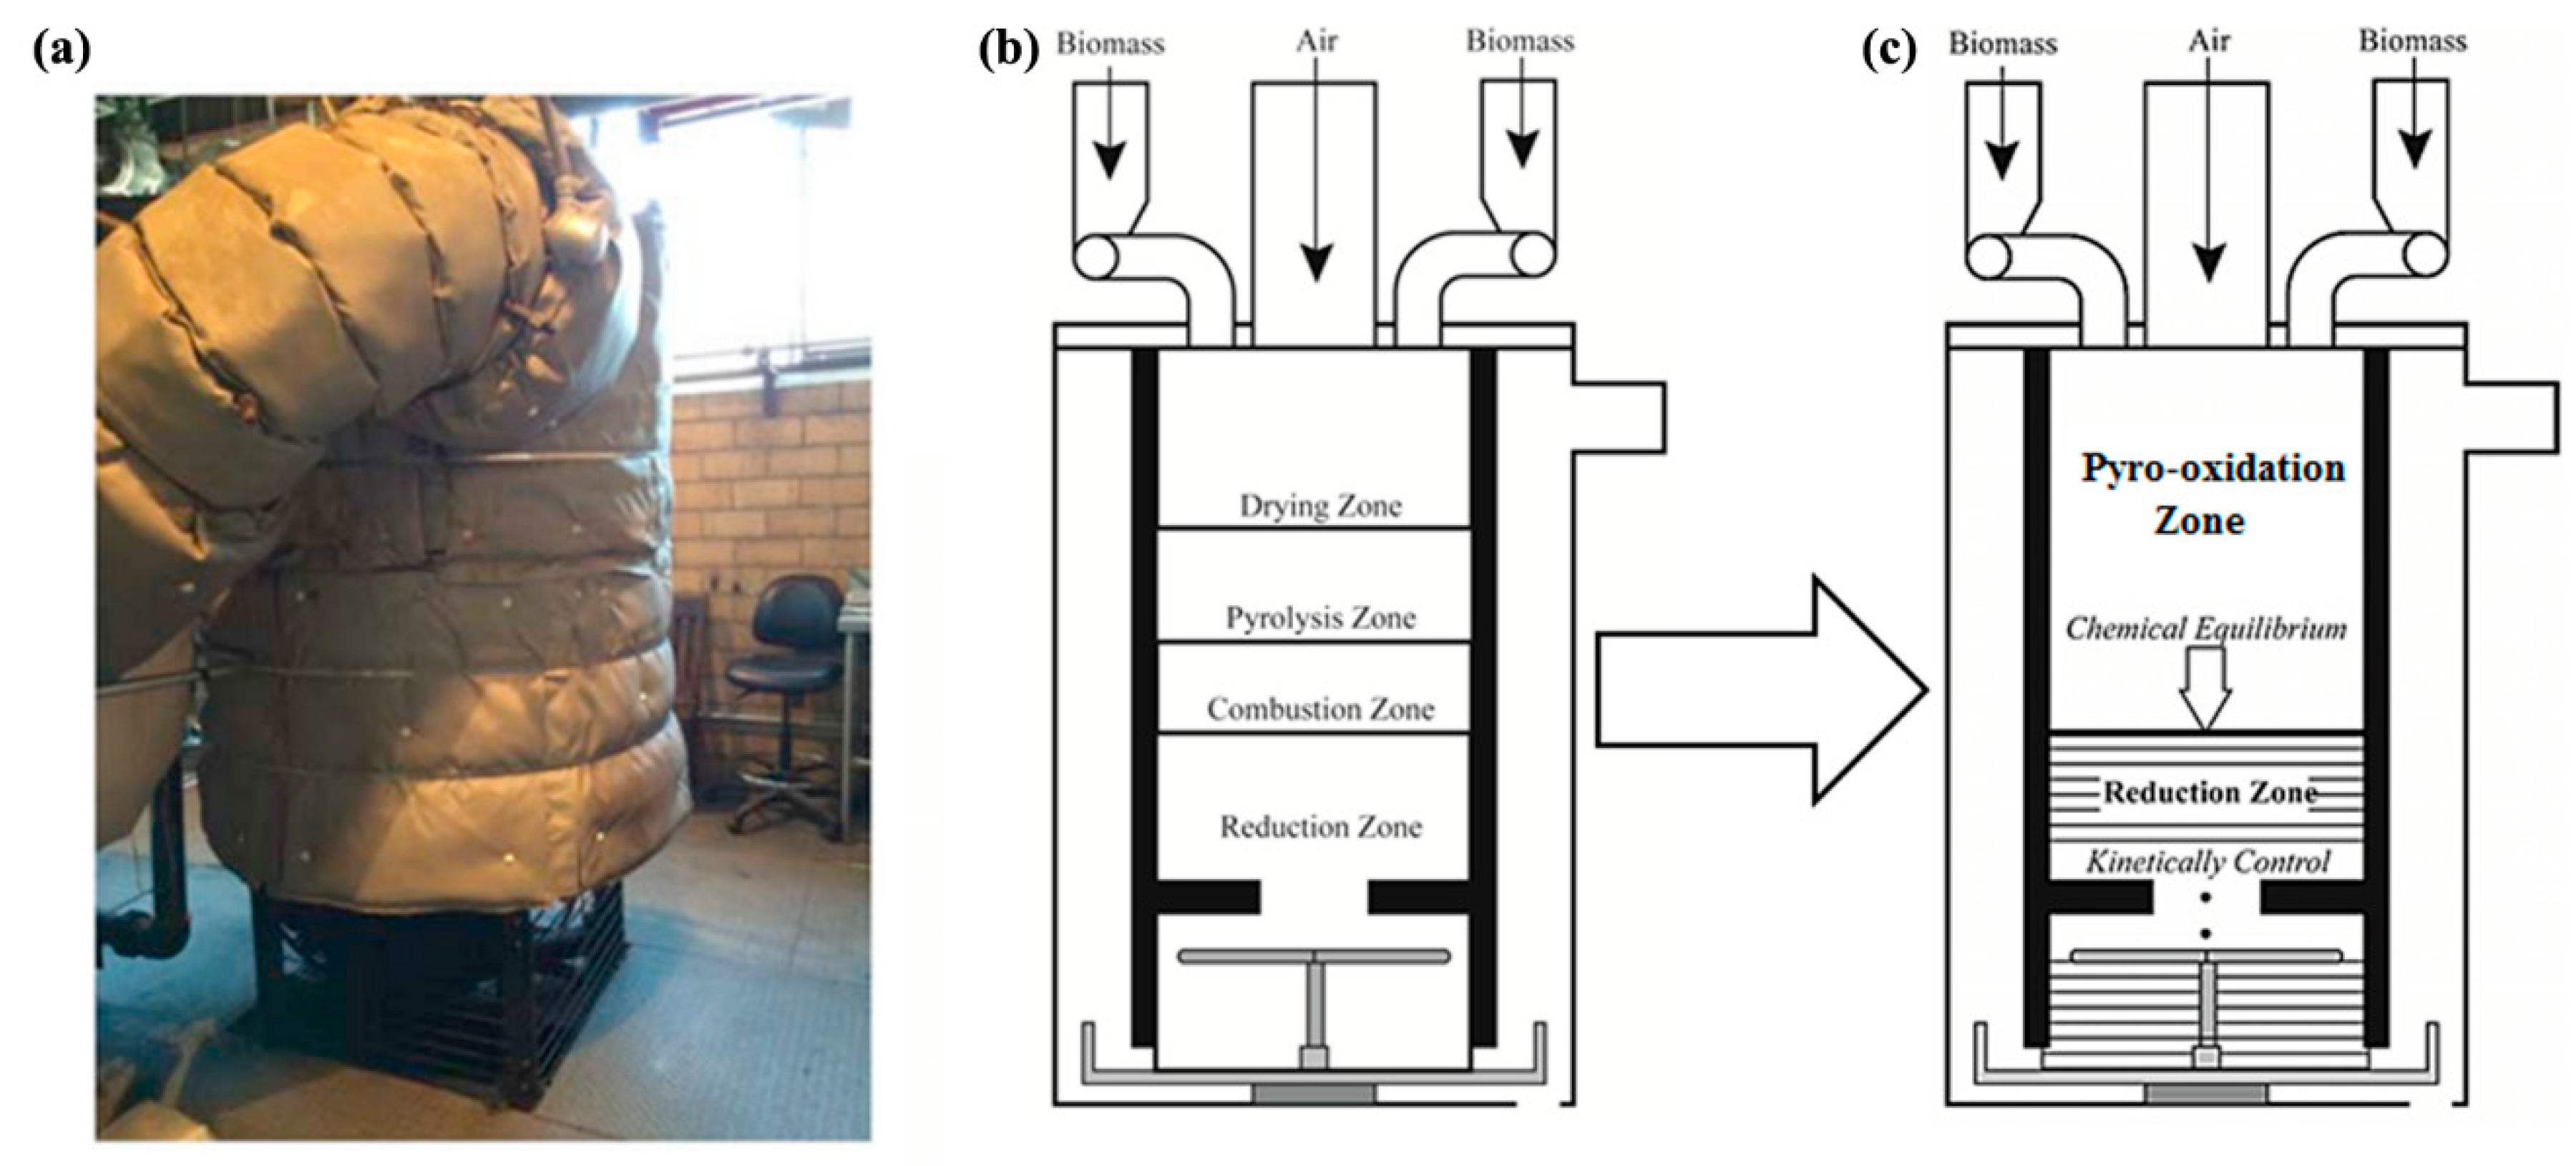
Figure 3.
Reduction zone structure and the detail of each control volume.

Figure 4.
Validation of the one-dimensional mathematical model.

Figure 5.
Normalized mass ratio changes with the drying temperature and drying time.

Figure 6.
Solid moisture content changes with the dryer length.
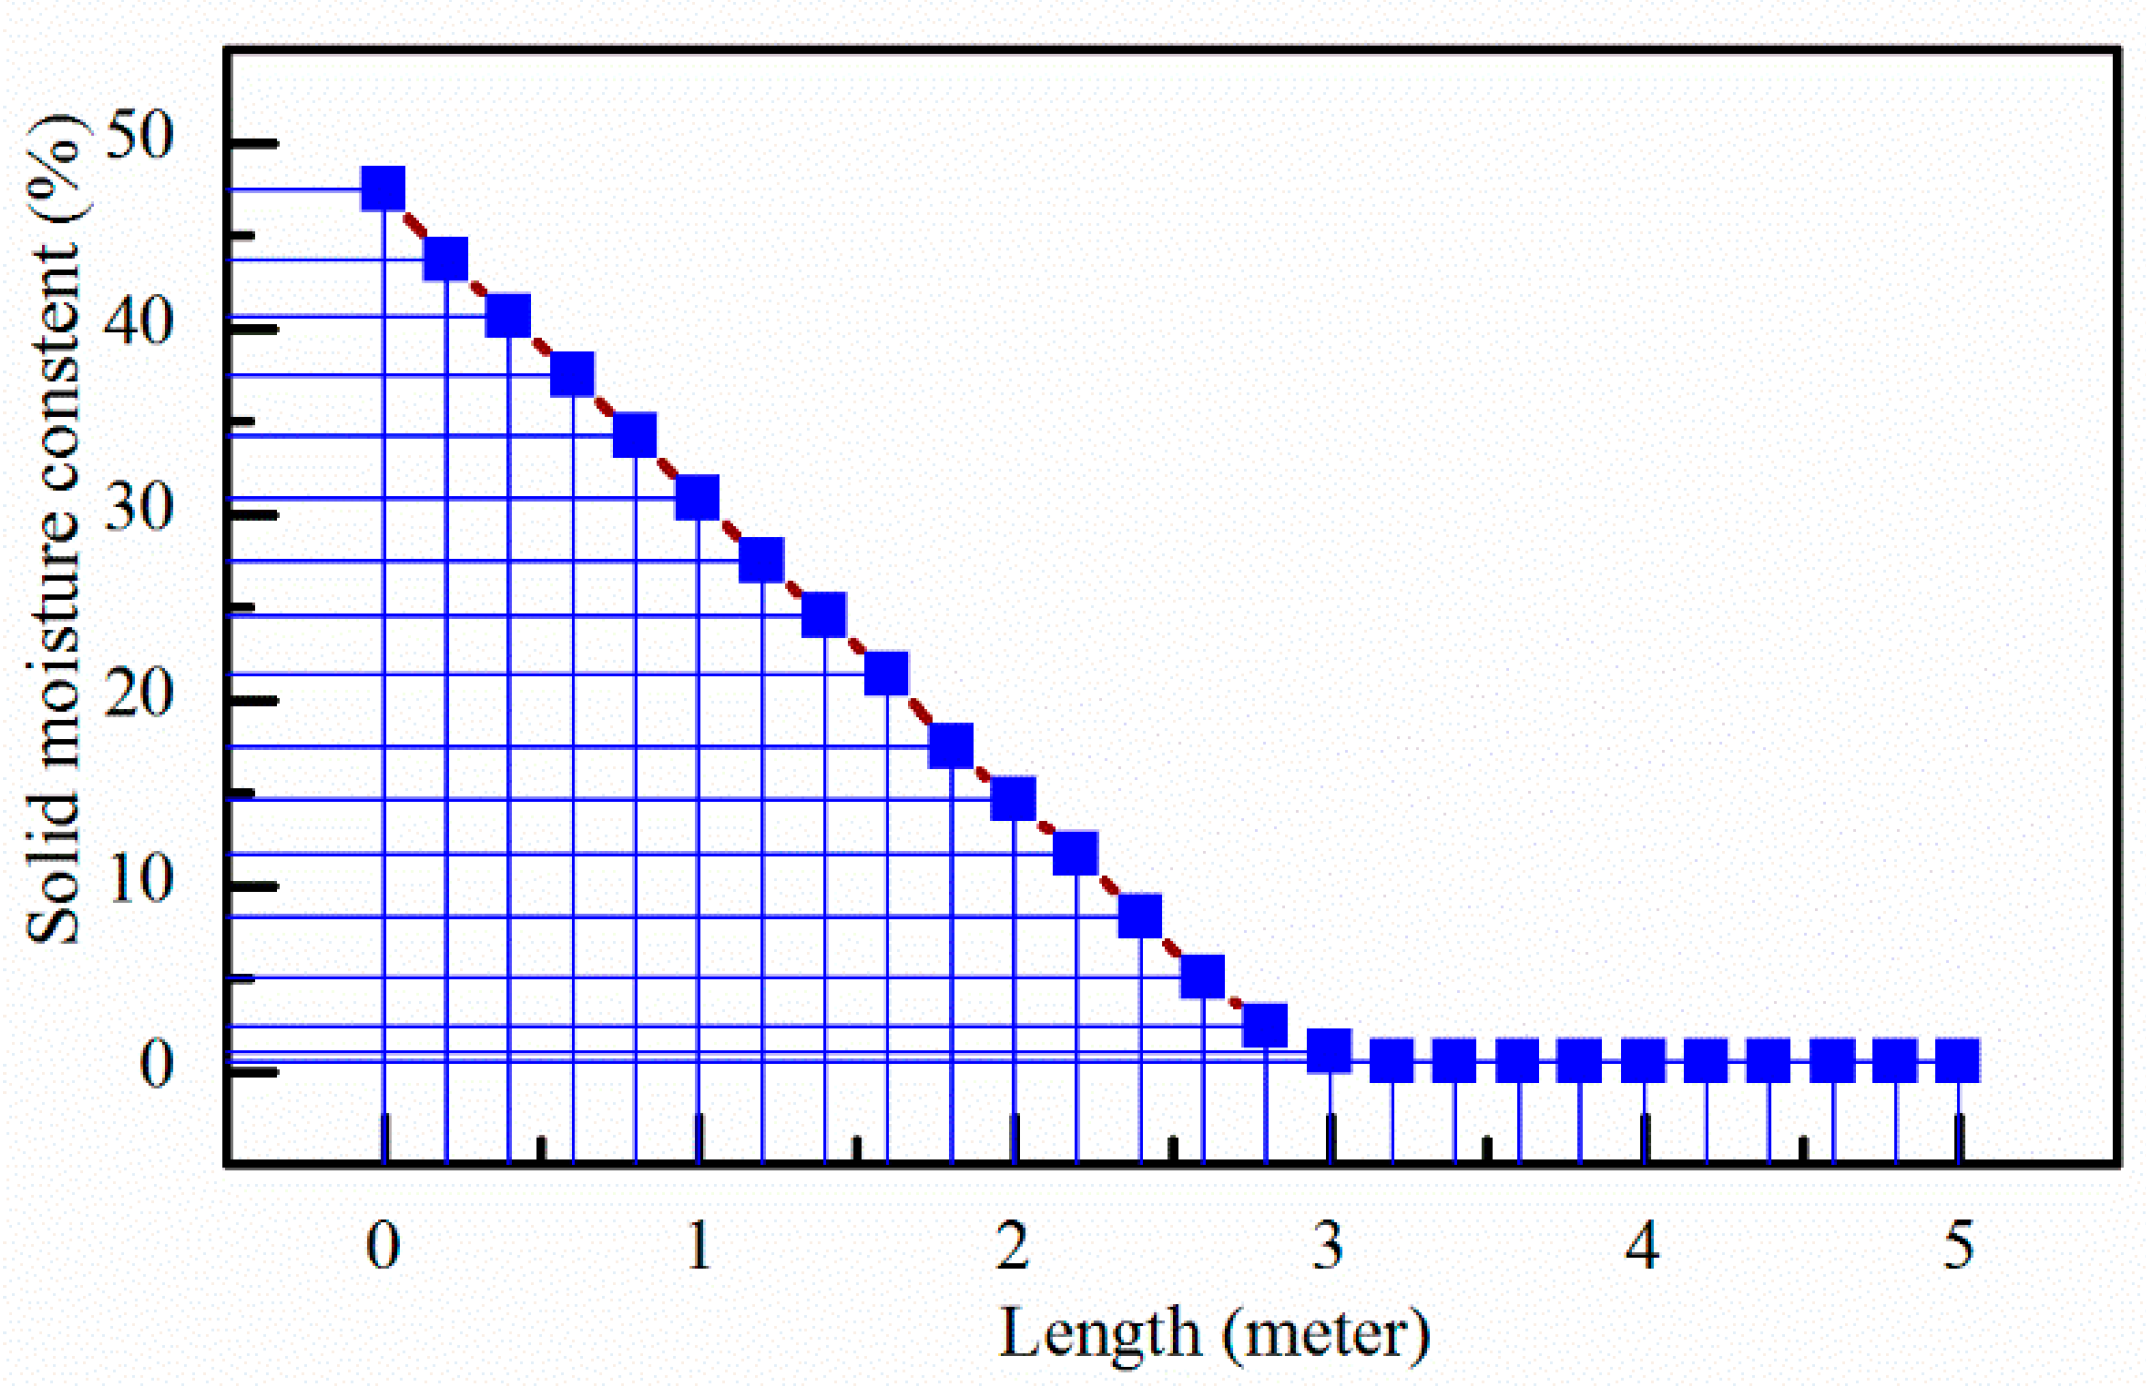
Figure 7.
Mass balance of (a) the poultry drying system and (b) the poultry gasification system.


Figure 8.
Cost components and fresh poultry elimination cost comparison.

Figure 9.
Sensitivity analysis results of (a) the poultry drying system and (b) the poultry gasification system.
Figure 9.
Sensitivity analysis results of (a) the poultry drying system and (b) the poultry gasification system.

Figure 10.
Uncertainty analysis results of (a) the poultry drying system and (b) the poultry gasification system.
Figure 10.
Uncertainty analysis results of (a) the poultry drying system and (b) the poultry gasification system.


Table 1.
Proximate and ultimate analysis of wood chip and dried poultry.
| Proximate Analysis (by Mass of Dry Basis, %) | Wood | Dried Poultry |
|---|---|---|
| Fixed carbon | 16.8 | 20 |
| Volatile matter | 83.12 | 78.7 |
| Ash | 0.08 | 1.3 |
| Ultimate Analysis (by Mass of Dry Basis, %) | ||
| Carbon | 51.12 | 61.3 |
| Hydrogen | 6 | 10.1 |
| Oxygen | 42.8 | 27.3 |
| Moisture Content (by Mass, %) | 16 | 10 |
Table 2.
Equilibrium parameters of part of gasification reactions.
| Equilibrium Constants | Equilibrium Constants | A (1/s) | E kJ/mol |
|---|---|---|---|
| 0.0042 | 19.21 | ||
| 36.16 | 77.39 | ||
| 15,170 | 121.62 | ||
| 0.073 | 36.15 |
Table 3.
Equipment scale data resources.
| Plant Component | Scaling Parameter | Reference Cost C0 (k$) | Reference Size, S0 | Scale Factor, f |
|---|---|---|---|---|
| Wood and poultry prepare to 20 mm | Biomass input, kg/h | 5.23 | 20 | 0.90 |
| Fixed bed gasifier and cleaning | Biomass input, kg/h | 19.07 | 20 | 0.75 |
| Heat exchanger | Heat transfer, kW | 10.10 | 76 | 1.00 |
| Syngas boiler and steam turbine | Power generation, kW | 130.61 | 276 | 0.90 |
| Dryer | Poultry input, kg/h | 35.00 | 152 | 1.00 |
Table 4.
Major stream simulation results of the poultry drying system.
| (a) Poultry Drying System | ||||||||||||
| Stream name | 1 | 2 | 3 | 4 | 5 | 6 | 7 | 8 | 9 | 10 | 11 | 12 |
| Temperature (°C) | 25 | 25 | 712 | 90 | 25 | 176 | 25 | 120 | 120 | 145 | 25 | 90 |
| Gas mole fraction | ||||||||||||
| H2 | 0 | 0 | 0.14 | 0 | 0 | 0 | 0 | 0 | 0 | 0.14 | 0 | 0 |
| CO | 0 | 0 | 0.16 | 0 | 0 | 0 | 0 | 0 | 0 | 0.16 | 0 | 0 |
| CO2 | 0 | 0 | 0.1 | 0 | 0 | 0 | 0 | 0 | 0 | 0.1 | 0 | 0.12 |
| H2O | 0 | 0 | 0.12 | 0 | 0 | 0 | 0 | 0.06 | 0 | 0.12 | 0 | 0.12 |
| CH4 | 0 | 0 | 0.01 | 0 | 0 | 0 | 0 | 0 | 0 | 0.01 | 0 | 0 |
| N2 | 0.79 | 0 | 0.47 | 0 | 0.79 | 0.79 | 0 | 0.74 | 0 | 0.47 | 0.79 | 0.74 |
| O2 | 0.21 | 0 | 0 | 0 | 0.21 | 0.21 | 0 | 0.2 | 0 | 0 | 0.21 | 0.02 |
| Total | 1 | 0 | 1 | 0 | 1 | 1 | 0 | 1 | 0 | 1 | 1 | 1 |
| Gas (kmol/h) | 8 | 0 | 13.6 | 0 | 62.2 | 62.2 | 0 | 66.2 | 0 | 13.6 | 33.4 | 44.9 |
| Gas (kg/h) | 230 | 0 | 331 | 0 | 1800 | 1800 | 0 | 1866 | 0 | 331 | 962 | 1293 |
| Solid (kg/h) | 0 | 108 | 0 | 6 | 0 | 0 | 152 | 0 | 86 | 0 | 0 | 0 |
| (b) Poultry Gasification System | ||||||||||||
| Stream name | 1 | 2 | 3 | 4 | 5 | 6 | 7 | 8 | 9 | 10 | 11 | |
| Temperature (°C) | 25 | 95 | 712 | 90 | 25 | 176 | 25 | 120 | 159 | 25 | 90 | |
| Gas mole fraction | ||||||||||||
| H2 | 0 | 0 | 0.14 | 0 | 0 | 0 | 0 | 0 | 0.14 | 0 | 0 | |
| CO | 0 | 0 | 0.14 | 0 | 0 | 0 | 0 | 0 | 0.14 | 0 | 0 | |
| CO2 | 0 | 0 | 0.08 | 0 | 0 | 0 | 0 | 0 | 0.08 | 0 | 0.11 | |
| H2O | 0 | 0 | 0.1 | 0 | 0 | 0 | 0 | 0.06 | 0.1 | 0 | 0.12 | |
| CH4 | 0 | 0 | 0.01 | 0 | 0 | 0 | 0 | 0 | 0.01 | 0 | 0 | |
| N2 | 0.79 | 0 | 0.53 | 0 | 0.79 | 0.79 | 0 | 0.74 | 0.53 | 0.79 | 0.76 | |
| O2 | 0.21 | 0 | 0 | 0 | 0.21 | 0.21 | 0 | 0.2 | 0 | 0.21 | 0.02 | |
| Total | 1 | 0 | 1 | 0 | 1 | 1 | 0 | 1 | 1 | 1 | 1 | |
| Gas (kmol/h) | 9.5 | 0 | 14.2 | 0 | 62.2 | 62.2 | 0 | 66.2 | 0.1 | 30.2 | 42.5 | |
| Gas (kg/h) | 275 | 0 | 348 | 0 | 1800 | 1800 | 0 | 1866 | 348 | 870 | 1218 | |
| Solid (kg/h) | 0 | 86 | 0 | 13 | 0 | 0 | 152 | 0 | 0 | 0 | 0 | |
Table 5.
Energy balance of poultry drying system and poultry gasification system.
| Unit Name | Poultry Drying System | Poultry Gasification System |
|---|---|---|
| Fresh chicken energy (kw) | 444.44 | 444.44 |
| Wood energy | 493.92 | 0.00 |
| Blower consumption (kw) | 1.12 | 1.12 |
| Pump consumption (kw) | 3.80 | 3.46 |
| Steam turbine generated (kw) | 134.13 | 122.33 |
| Other energy consumption (kw) | 359.79 | 322.12 |
| Wood basic efficiency (%) | 26.2 | |
| Total Efficiency (%) | 14.5 | 26.5 |
Table 6.
Total investment cost result.
| Unit (k$ 2017) | Poultry Drying System | Poultry Gasification System |
|---|---|---|
| Feedstock preparation | 15.1 | 12.0 |
| Fixed bed gasifier | 76.3 | 76.3 |
| Heat exchanger | 10.1 | 10.1 |
| Syngas boiler and steam turbine | 68.2 | 62.7 |
| Dryer | 35.0 | 35.0 |
| Total plant cost | 204.7 | 196.2 |
| Owner’s cost | ||
| Preproduction Costs | 222.6 | 221.8 |
| Inventory Capital | 7.9 | 1.0 |
| Land | 3.8 | 3.8 |
| Financing Cost | 5.5 | 5.3 |
| Other owner’s cost | 30.7 | 29.4 |
| Total investment cost | 475.2 | 457.5 |
© 2019 by the authors. Licensee MDPI, Basel, Switzerland. This article is an open access article distributed under the terms and conditions of the Creative Commons Attribution (CC BY) license (http://creativecommons.org/licenses/by/4.0/).
Share and Cite
MDPI and ACS Style
Zang, G.; Zhang, J.; Jia, J.; Weger, N.; Ratner, A. Clean Poultry Energy System Design Based on Biomass Gasification Technology: Thermodynamic and Economic Analysis. Energies 2019, 12, 4235. https://doi.org/10.3390/en12224235
AMA Style
Zang G, Zhang J, Jia J, Weger N, Ratner A. Clean Poultry Energy System Design Based on Biomass Gasification Technology: Thermodynamic and Economic Analysis. Energies. 2019; 12(22):4235. https://doi.org/10.3390/en12224235
Chicago/Turabian StyleZang, Guiyan, Jianan Zhang, Junxi Jia, Nathaniel Weger, and Albert Ratner. 2019. "Clean Poultry Energy System Design Based on Biomass Gasification Technology: Thermodynamic and Economic Analysis" Energies 12, no. 22: 4235. https://doi.org/10.3390/en12224235
Note that from the first issue of 2016, this journal uses article numbers instead of page numbers. See further details here.