Households’ Willingness to Adopt Technological and Behavioral Energy Savings Measures: An Empirical Study in The Netherlands †

1
International Centre for Integrated assessment and Sustainable development, University Maastricht, P.O. Box 616, 6200 MD Maastricht, The Netherlands
2
Local Environnent: Management & Analysis, ArGenCo department, University of Liège, 4000 Liège, Belgium
*
Author to whom correspondence should be addressed.
†
The present work is an extension of the conference proceeding “An empirical analysis of energy saving measures from a household perspective” presented to BEHAVE, 5–7 September 2018, Zurich University of Applied Sciences in Zurich, and published in Publications Applied Science.
Energies 2019, 12(22), 4294; https://doi.org/10.3390/en12224294
Submission received: 4 October 2019
/
Revised: 28 October 2019
/
Accepted: 5 November 2019
/
Published: 11 November 2019
(This article belongs to the Special Issue High-Efficiency Energy Harvesting and Saving)
Abstract
:The aim of this paper is to investigate households’ willingness to adopt technological and behavioral energy savings measures, in their dwellings and for daily mobility. Based on the evidence that occupants’ behavior has a major impact on energy uses at home and on the road, this paper aims at investigating which determinants influence household preferences for energy-saving measures, both technical as well as behavioral ones, as well as highlighting the key determinants for adopting energy-savings measures, at the household scale. This paper will attempt to shed more light on the factors that may bridge the intention–behavior gap. The analysis is based on an empirical survey carried out in the Netherlands. Main results show that (1) behavioral energy saving measures are more acceptable than technical ones; (2) the adoption of energy savings measures at home is more likely than on the road; (3) there is a relatively small market for technical energy measures, especially through the initial investment and the low return on investment; (4) environmental aspects seem to be more important for relatively expensive technical energy measures; (5) the reason for taking technological energy measures is rather to be found in differences among socio-demographic background than in environmental concerns; and (6) comfort at home and on the road is an important explanatory variable that many respondents used to justify not implementing energy savings measures and should be investigated in further research.
1. Introduction
Building operations and maintenance, occupants’ activities and indoor environmental quality, which are all related to human behavior, are known to have an influence as great as or even greater than climate, building envelope and energy systems on the energy consumption of a dwelling [1]. Impact of household’s behaviors on energy consumption in the residential sector has thus been the focus of a large body of scientific literature. Despite the links previously highlighted between occupants’ behavior and energy consumption, understanding household behavior is also a prerequisite for understanding how to motivate or encourage pro-environmental behavior. For the majority of the time, energy use of households is invisible and energy consuming behavior is mainly based on habits and routines (turning the lights on, leaving appliances on standby, etc.). This behavior is formed by the characteristics of the building and the energy-using appliances, but more importantly because they are influenced by a range of internal and external factors, such as personal characteristics, values and attitudes, behavior of friends and family, and various economic incentives. Many studies have focused on social or psychological factors related to energy saving behavior, however, little is known about the effects of these as well as other characteristics on the success of adopting energy-savings measures at the household scale, which are the focus on this paper. In this context, this paper especially aims at studying in a detailed manner why and when households behave in a certain (pro-environmental or a prosocial) way and how more sustainable behavior can be motivated or encouraged. Such an analysis should allow us to pinpoint key determinants that block or induce their pro-environmental behavior. This paper focuses not only on energy saving measures at home but also includes daily mobility in the analysis of energy uses as previous research have highlighted the importance of the latter on the total energy balance of households [2,3,4,5].
Energy saving measures can be categorized in various ways. In this paper we made a distinction between technical and behavioral energy saving measures [6,7]. With technical energy saving measures less energy is used for a constant service. These measures can significantly reduce household and transportation energy use and save energy and costs over long periods of time. However, it is an expensive way to reduce energy use because they often require an initial investment, time, and effort. Behavior energy saving measures refers to the reduction of energy consumption through using less of an energy service, actions that must be performed as part of people’s lifestyles. However, it should be noted that technical energy saving measures do not necessarily result in a reduction of overall energy use when people use these appliances more often, this is also called the rebound effect [8]. Thus, the interplay between macro-level (e.g., technological innovations) and micro-level factors (e.g., use of technological innovations) should be studied in detail. In this context, the aim of this paper is to examine which determinants influence household preferences for energy-saving measures, both technical as well as behavioral ones, as well as the considerations for change to reduce energy consumption.
Section 2 summarizes the theoretical and empirical background on energy saving measures. Section 3 deals with the presentation of the methodology, assumptions, and data used in this paper. Section 4 presents and discusses the empirical evidence. Finally, in Section 5, the conclusions of the analysis are summarized.
2. Theoretical and Empirical Background
Understanding and explaining how energy efficient technologies are diffused among households has been studied in many fields. Several behavioral models have been developed in literature to explain the influences of factors on the acceptance of a technology, such as the technology acceptance model (TAM) [9], theory of planned behavior [10], unified theory of acceptance and use of technology (UTAUT) [11], and the lazy user model [12]. The leading and most influential model of technology adoption research is Everett Rogers’s diffusion of innovations model. In his work, he takes a social constructivist ontological view by claiming that the adoption or rejection can be explained by the perception of actors. He focuses on the human actors participating in the process through examining them as categories of individuals who perceive technologies in different ways instead of seeing them as “key players” for observed outcomes.
Rogers’ theory provides a useful tool that consists of five stages, and each stage consists of different behaviors that are subject to different influences. The first stage, “the persuasion stage”, is crucial for an individual to be committed to adopt or reject an innovation as here an individual forms an attitude (positive or negative) towards the innovation. He used five perceived components of an innovation to judge, namely innovations that are perceived as having greater relative advantage, compatibility, trialability, observability, and less complexity will be adopted more quickly and easily than other innovations [13]. Others studies and models also views individuals’ attitudes, values, and norms as the determinants of behavioral intention. These models often share the assumption that intentions are directly linked to behavior. Hence changing people’s behavior fundamentally becomes a question of how certain behavior can be ’triggered’ through a change in people’s attitudes, values, or norms.
To this end the work of Bamberg [14] is introduced, which draws on Gollwitzer’s model of action phases. His work has many parallels to the model but proposes clearly defined transition points between the stages and extends the model by variables from the theory of planned behavior [10] and the norm activation theory [15] to explain how the specific intentions which mark the transition points are formed [16,17]. Bamberg’ stage model of self-regulated behavioral change (SSBC) assumes that the temporal path of behavioral change can be broken down into four independent, qualitatively different stages. In each of these four stages, a person is confronted with solving a specific task in order to successfully change her or his behavior. The model includes three intention types: goal intention, behavioral intention, and implementation intention [17]. Table 1 describes the different stages of the model.
Although some people may develop an intention to change their energy related behavior, they might not take any action. This discrepancy has been labeled the intention–behavior gap which reflects to the ‘black-box’ nature of the underlying process that leads from intention to action. In fact, there are factors that represent difficulties or costs to perform certain behaviors.
More generally, the interest of research in the fields of energy consumption and behavior change started in the seventies due to the oil crisis. Policymakers became aware that the economy is too dependent on fossil fuels and that a diversification strategy is necessary. Researchers have increasingly discussed pro-environmental behaviors and the promotion of sustainable consumption in areas such as waste recycling, energy efficient measures, and mobility [18,19]. Some of the studies in the 1990s also found that monetary savings and making energy consumption visible were better motivators than environmental beliefs and attitudes, which did not have any significant influence on energy consumption [20]. Brennan [21] also found that there is a general lack of knowledge about energy consumption and their impact despite people’s awareness of environmental issues. In his survey around 40% of respondents indicated that they have concerns on more important things than their energy consumption.
More recent research in energy saving has highlighted that people think that they can not do things by themselves to address perceive issues, they belief that climate change to be too complicated and too far in the future [22]. Goldblatt [23] also concluded that household energy use lacks a link to climate change. He found that people tend to be concerned about climate change, however, they do not always link their lifestyle as contributing to the climate change problem [23]. The IPCC (Intergovernmental Panel on Climate Change) report [24] also emphasized the need for a change in lifestyle and pointed out that behavioral change can make a significant difference. It is not surprising that people may often choose a more sustainable lifestyle in some cases, for example when they buy organic food, but they will not link their energy use at home to the climate change problem.
There has also been a clear interest in identifying underlying determinants of energy use, such as attitudes and demographics. The impact of consumer behavior on house energy demand for space heating in particular has been examined in numerous empirical studies. One of the most relevant publications on residential energy behaviors is due to Steg and Vlek [25]. It consists on a comprehensive review that systematizes the determinants underlying pro-environmental behavior in the residential sector including the type of interventions to motivate this type of behavior. The authors begin by identifying motivational factors, contextual factors, and habitual behavior as the most important factors in environmental behavior [26]. Some studies also indicated that demographic variables influence energy-saving behavior. For example, the seniority effect on energy saving behavior, some studies indicated a positive effect [27,28], while others indicate a negative effect [29,30]. Another influential variable shown by several researchers is the positive effect of income of people on the adoption of energy-saving actions [30]. Furthermore, some researchers also emphasized the effect of social interaction on energy-saving behavior. They have studied different expressions of a wide range of social interactions (such as civic cooperation, meaning a willingness to contribute) to society [31,32]. However, many of the studies examined the effect of only one energy saving measure, making it difficult to draw conclusions on which measure or a combination of measures would be the most effective in encouraging energy saving behaviors.
Recent research in energy saving behavior has also highlighted the need for a more practical combination of energy saving measures with social marketing measures to ensure that people sustain their changed behavior to more pro-environmental habits for the long-term [18]. Dwyer [33] concluded in his research that for long-term changes ‘intrinsic’ behavioral controls are needed (the energy user must have formed new habits), while extrinsic controls (such as economic rewards) are more likely to have a short-term impact. Some studies are focusing on the combination of the underlying determinants with the effectiveness of the energy saving measures through monitoring, which gives insights into the reasons why (not) specific measures were successful and form the starting point for the further enhancement of the effectiveness of certain energy saving measures [34].
However, most studies about attitudes and behavior in energy uses analyze individual situations. A household is a much more complex variable in analyzing energy use, due to two basic factors. The first cluster of factors includes cultural, social and demographic variables and the second cluster of factors includes housing variables. Gram-Hansen [35] studied Danish households and their energy use, he showed that due to social background of the households a huge differences arise in energy use between households of the same size, age, income, and type of apartment.
At the household level, various studies have highlighted various factors related to occupation modes and behaviors that influence building energy use. However, these studies show that there are some difficulties of assessing the specific contribution of each factor on the building energy use. Verhallen and Van Raaij [36] have studied 145 semi-detached and terraced homes over a year-long period in the Netherlands. They have found that 26% of the variance in household energy use could be attributed to household behavior and highlighted the importance of specific parameters. Two observed parameters of households’ behavioral profiles for space heating are the set-point temperature management and the choices for ventilation. Space heating is also studied through Haas et al. [37] who showed that the prevailing feature of consumer behavior for heating residential dwellings is dependent on the choice of indoor temperature. They conclude that consumer behavior may be described sufficiently by the chosen level of indoor temperature. Santin et al. [38] developed a regression model that determines the parameters that have the highest weightage for predicting the heating loads of residential Dutch dwellings, using 15,000 surveys across the Netherlands. (1) The type of dwelling (detached house, row house, and flat) and the heated area, (2) the insulation of the house, (3) the temperature during day and night, and (4) the presence of occupants during weekdays and during weekends have an influence of building characteristics and occupant behavior on energy use. This indoor temperature and heating duration at the highest temperature are also indicated as key energy factors by other researchers [29,38,39,40,41].
According to several authors, age is an important characteristic determining residential heating energy use, particularly on the occupancy rate and the comfort temperature. Remarkably, elderly people choose often higher indoor temperature levels [30,38,39,40,42,43,44,45]. These elderly people were less willing to apply energy-saving measures at home than couples and families (<60 year), as well as low-income households less than high-income households [46].
Finally, it is also worth mentioning that besides energy uses in dwellings, transportation energy uses also represents a significant part of a household energy balance (home-to-work commuting, shopping, leisure, etc.) and that this type of energy consumption is also strongly related to behavior [47].
In conclusion, a lot of research is already done and have already proposed best practices for significantly reducing the energy used by housing, at home (building energy uses for heating, appliances, lighting, etc.) and, to a lesser extent, for daily mobility (transportation energy uses for home-to-work, to school, travel, etc.). The strong impact of behavior on the variation of energy uses has been widely highlighted, both from a theoretical and from an empirical point of view. However, much of the earlier research concentrated on how much household’s conserved energy, but did not necessarily identify the reasons why people do not use less energy or take advantage of existing energy efficiency measures. The key question we proposed to investigate in this paper is why energy consumption in the domestic sector keeps rising and which determinants can efficiently encourage household to significantly reduce energy uses at home and on the road.
3. Methodology, Case Study, and Assumptions
This paper focused on the Netherlands as a case study. As in many other European countries, energy use of households in the Netherlands has significantly increased during the last decades [48]. In 2015, households in the Netherlands were responsible for 17,070 mln kg CO2 and road traffic for 29,370 mln kg CO2 [49]. The energy use of households is about 3300 kWh/y (average household size 2.2 people). A closer look at in-home energy use of Dutch households reveals that it is used first and foremost for home heating and heating water, 67% of the total energy use, followed by refrigeration and freezing, lightening, washing machine, and dryer. Transport was also shown to be an energy-consuming sector [50]. Despite the efforts that have been done the last decades, more than 64% of the residential housing stock in the Netherlands have energy label C or lower and needs retrofitting to meet up with the goals on energy and CO2 emissions [51].
A survey consisting of a quantitative questionnaire was carried out to determine the households’ willingness to accept different technological and behavioral energy saving measures. The analysis was conducted via an internet questionnaire regarding the Dutch households. The questions were first tested on a small sample to make sure they could be interpreted correctly. This resulted in some minor modifications of the questions. Then, the data gathering took place in May 2016. The time needed to complete the survey was estimated to be around 20 min. The questionnaire was send online to 795 households, by an independent panel institute. Four hundred and forty-eight people out of 795 have responded to the questionnaire, which represent a response rate of 56.3%. The overall target group for the survey, and hence the panels contacted, consisted of people living in the Netherlands with a minimum age of 18 years. Since it was a web-based survey, only potential respondents with access to the Internet were contacted. The sample was stratified and is, hence, (almost) representative of the general Dutch population (>18 year) regarding gender, age distribution, level of education, and spatial distribution in the Netherlands (see Appendix A).
The majority of the questions were multiple choice questions with a few open questions. The questionnaire consists of (1) economic variables: private monthly income and electricity expenditures; (2) demographic variable: age, sex, educational level of the respondent, and family size; (3) environmental concerns; and (4) energy saving questions: which reduction options taken/intend to take and barriers and motivations for this action. Regarding the latter, respondents were asked a series of questions about their own energy efficiency and energy saving behavior. In Table 2 a list of technological and behavioral energy saving measures are given.
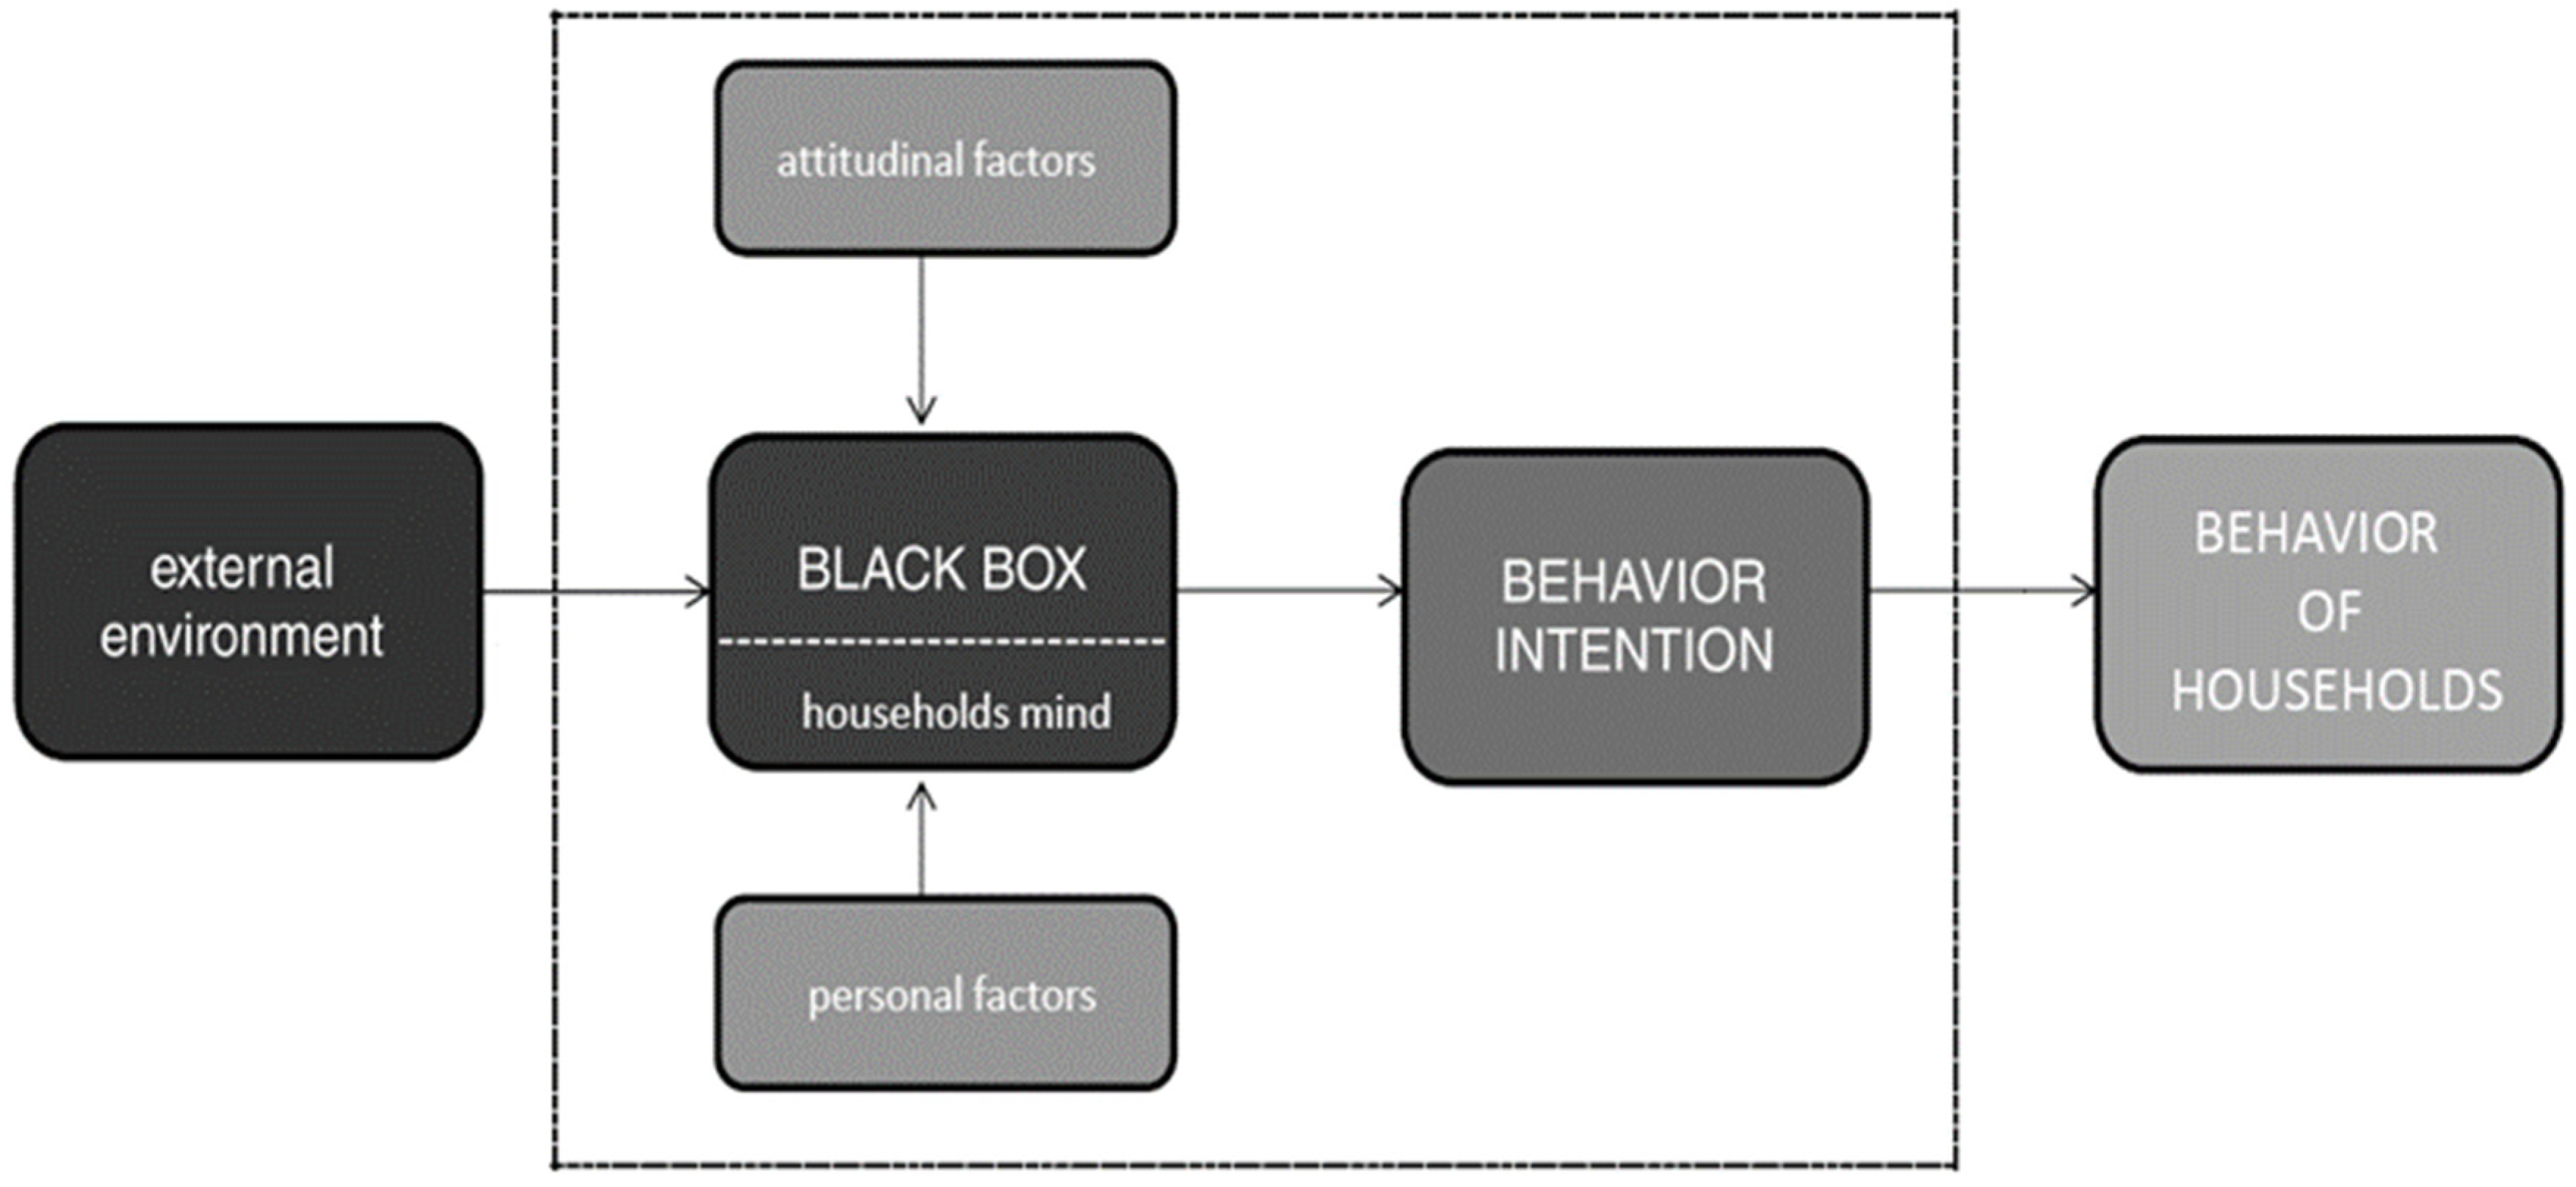
For each of the energy saving measures, respondents were asked what actions they had already taken and what action they intend to take in the coming year. Respondents that already have taken an action were asked for the reason behind, respondents that did not intend to do an action were asked about the barriers. Respondents who were likely to do were asked for both (motivation and barrier) as we wanted to understand the contingencies between one’s intention and the subsequent outcomes. Outcome expectancies are beliefs about the positive and negative outcomes of alternative behaviors. If the positive outcome expectancies (pros) outweigh the negative ones (cons), the likelihood of developing an intention to change the behavior increases. Thus the survey helped to create insight into the intention-behavior gap (see left-hand side of Figure 1) through including questions related to people’s current behavior and intentions and the reasons for considering a behavior change. The decisions of people do not take place in a vacuum, but are influenced by the context in which these decisions are made. To understand why some people decide to act whereas others do not, it is necessary to extend the conceptual model by identifying the determining factors in the internal (attitudinal factors and personal factors) and external environment. Both affect the perceived uncertainties or motivation of households, namely the black box (see right-hand side of Figure 1). This study specifically focused on the link between the internal environment and behavioral intention, which allowed us to gain insight and understanding of the determinants (black box) that influence households’ behavioral intention (see inner core of Figure 1). The list of attitudinal and personal factors is available on Appendix B.
Descriptive analyses were conducted to analyze which determinants influence household preference for energy saving measures of a representative sample of the Dutch population, e.g., motives behind their behavior. Although there are many ways to analyze the perception of people, in this paper we used an indicator-based approach. These respondents were provided with a questionnaire with different items, these items were indicators for analyzing the adoption process of energy saving measures. To compare the differences between a rented house and a property, we used binary logistic regression analysis and ordinal logistic regression analysis to determine the predicting factors for adoption or not. Binary logistic regression analysis was used in this research to analyze the influence of socio-demographic factors, building/car details, and environmental concerns on the selected technical energy saving measures. These regressions were tested for their model fit, using the Hosmer and Lemeshow (not significant means model fit) and Nagelkerke. For the behavioral energy saving measures, ordinal regression analysis was used in order to analyze the influence of socio-demographic factors, building/car details, and environmental concerns. In contrast to binary regression analysis, a different link function between the independent and dependent variables was assumed. Since it is often difficult to identify whether the distribution is rather equal or skewed and there are no statistical tests this choice can be based on, the link associated with a better model fit and consistent with the assumption of proportional odds was chosen. For this analysis the logit link function has a better model fit than the negative log-log link function. These ordinal regressions were tested for their model fit, using the Nagelkerke, and the parallelity of lines.
Finally, we also categorized and quantified responses to the open-ended questions on positive and negative expectations and experiences.
4. Results and Discussion
In the Netherlands, the domestic sector was divided over three types of ownership. The assumption made was that each type of ownership represents a different type of decision maker with respect to the purchase of energy measures: (1) private rental sector in which private landlords make the investment decision; (2) public rental sector in which housing associations make the investment decision; and (3) owner-occupied sector in which the residents themselves are the decision makers.
As mentioned before, for each of the energy saving measure, respondents were asked what actions they had already taken and what action they intend to take in the coming year. Respondents that already had taken an action were asked for the reason behind it, respondents that did not intend to do an action were asked about the barriers. Respondents who were likely to do were asked for both (motivation and barrier). We asked them to indicate the possible motives and/or barriers by importance, maximum three answers were possible. The results include measures for both domains we analyzed in this study, at home (owned (O) or rented (R)) and on the road.
4.1. Technical Energy Saving Measures
Table 3 shows the outcomes from descriptive statistics regarding technical energy saving measures in home and on the road. Majority of respondents said that they had already taken action in order to made energy efficiency improvements to their homes, most of them had replaced their light bulbs with compact fluorescent lights (CFL) or LED light bulbs (71.1%). For the other “at home” measures, it can be highlighted that there was a huge difference between the group of owners and renters, related to the initial cost of investments. Only a few of the renters had taken “expensive” actions so far. Regarding transport measures, 21% of the respondents indicated that they had already bought a fuel-efficient car, and only 1.6% had bought an electric car.
Of those Dutch households who had not already taken action, around 80% said that over the next 12 months they did not intend to install insulation, adopt solar panels or an energy efficient boiler, or buy a fuel-efficient/electric car (mostly due to the expense, see section below). These results demonstrated that there was a very small market for technical energy measures, probably through the initial investment they require, which may be a burden for respondents with a low income and a too long “return on investment”. This finding confirms a lack of quantitative evidence regarding the intention–behavior gap as it was explained above.
The profile of the questioned adopters of technical energy saving measures was similar in that they were either owner or renter of the house. Their primary motivation for adoption the saving measures were focused on financial aspects: “it saves me money” and “it reduces energy/fuel consumption”. With regard to the latter, it is important to consider possible side effects as rebound-effects may occur, which happens when households use these efficient appliances more often because they are energy efficient. An interesting result was that, except for respondents who adopted solar panels, motivations for the adoption of transport measures appeared to be more environmental related compared to home measures. The green image people have with driving a fuel efficient or electric car was also mentioned as an important motivation. From this we could conclude that environmental aspects were more important for relatively expensive technical energy measures. Remarkable in this table, we see the reason “someone asked me to” was mentioned often by the group of people who rented a house or apartment.
Anecdotally, the primary reason why most of the respondents did not take action for the different technical energy measures focused on financial aspects, namely “I cannot afford the investment costs”. This is in line with other research summarized above. Other indicated reasons depend on the measure in questions: the effort and time required to undertake this renovation measure in existing buildings is indicated in the case of insulation; for solar panels the relatively long payback times; and an energy-efficient boiler is not necessary since the boiler is still working. Interestingly, respondents indicate that an important barrier to the purchase of CFL-LED bulbs is that “they don’t like them”, together with their expense the most cited barrier for this action. Nonetheless, manufacturers try to either make these lights more appealing or to dispel current concerns or misperceptions. A possible explanation for the high number of the option “I already have this” might be that the question is asked to the respondents who have indicated that they are not planning to do the action more often because they have already done this. Thus, people are less likely to reduce their energy use when technical energy saving measures involves high costs in terms of money, effort, or convenience.
Different barriers are indicated for mobility measures, besides that the majority of the respondents do not need a new car, there are question marks whether these cars are powerful enough and the recharging infrastructure (availability of charging stations). Finally, the option “not applicable”, as reported in the last line of the table, is indeed straightforward as for most of people who rent a house these technical measures were too expensive.
The influence of socio-demographic factors, building/car details, and environmental concerns on the specific measures was based on the results obtained from binary logistic regressions (see Appendix C, Appendix D, Appendix E and Appendix F for an overview of regression outcomes).
With respect to insulation of the building, the ownership of the house was found to be a strong predictor of people’s responses (OR = 3.52, B = 1.259, p < 0.05). In terms of gender differences, men undertook relatively more insulation measures, and significantly more than woman (OR = 2.97, B = 1.089, p < 0.01), which might be due to differing roles of men and women in households where maintenance of the house is often/traditionally overseen by men. For the other in home technical energy measure, we did not see significant differences in our survey. A possible explanation for the lack of any explanatory value of the CFL-LED might be that they are not connected to a specific income group or type of dwelling for example, as the normal light bulbs are not always available in shops. In the same vein, the adoption of solar panels could not be explained by explanatory variables in this case study, while, many studies find significant income and ownership effects in solar panels adoption behavior [52,53,54]. Several studies well documented difference large and significant gender differences for transportation measures [55]. However, this was not confirmed in our study. Owning a fuel efficient car or an electric car would intuitively be explained by income: higher income groups buy newer and more expensive vehicles. This was only confirmed for the fuel efficient car in our survey (OR = 0.81, B = −0.210, p < 0.1). A possible explanation could be that households with a certain budget for a car might prefer a larger/second-hand vehicle above a smaller more sustainable vehicle of the same price. Age and occupation did offer a small significant explanation for the adoption of an electric car: older people were more likely to consider an electric car (OR = 1.77, B = 0.568, p < 0.1).
Environmental concerns (values and attitudes) offer little explanation in the adoption of technical energy saving measures in home. We found a significant relationship for the adoption of CFL-LED with regard to three statements, i.e., to be an “environmental conscious person” (OR = 1.79, B = 0.581, p < 0.1), “internet as an important information source” (OR = 1.69, B = 0.524, p < 0.1), and even stronger significant “energy reduction measures even if they cost extra” (OR = 2.64, B = 0.971, p < 0.01). The last statement was also found to be reason for the adoption of home insulation (OR = 2.18, B = 0.780, p < 0.01). Of all the values and attitudes tested on mobility measures, only two statements were found to have a statistically significant effect on respondents’ adoption process for the fuel efficient car, i.e., people who agreed that that they “inform and discuss environmental problems” (OR = 2.13, B = 0.758, p < 0.01) and who found that environmental problems were overstated (OR = 1.77, B = 0.573, p < 0.1).
In conclusion, the regression analysis revealed that the reason for taking technological energy measures was rather to be found in differences among socio-demographic background than in environmental concerns.
4.2. Behavioral Energy Saving Measures
In Table 4, the outcomes from descriptive statistics are given for behavioral energy saving measures in home and in the road. A huge difference is highlighted between the heating (turn down the thermostat in winter/at night and close windows when the heating is running) and electricity (turn off the lights when you are not there and turn off appliances) category. The two heat measures were often done compared to the measures related to electricity reduction. Especially turning of the lights when you are not in the room is something what most people were not doing at the moment (87.7%). Over half were conserving on home heating, with 83.6% saying they always or often close the window when the heating is running, and 59.3% saying they always or often lower their thermostats in winter or at night. These were high rates of reported conservation (heat) behavior, yet since roughly four out of 10 people performed this latter behavior only sometimes or often. Thus there still appeared to be much room to encourage Dutch people to adjust their thermostats as a means to save their energy consumption. By contrast, our results show that energy conservation in transportation was less common than in homes. A quarter of respondents only said that they often or always use public transportation or carpools, while more than half of them said that they rarely or never use these forms of alternate transportation. The majority of the respondents (69%) said that they always or often walk or cycle short distances instead of driving (represented as SD in the table). Around 90% of the respondents indicated that they planned to remain conserving energy at the same rate over the next twelve months.
The home owners and renters answered quite similar the questions regarding the behavioral energy saving measures. Of those respondents who said that they always or often take energy conservation measures, very large majorities said that saving money and energy are their primary motivations (see Table 4). Apart from financial interest, non-financial motives were not described as very important motive to change behavior. However, a surprising result was that over a third of these respondents cite global warming as a motivation. A smaller proportion indicated that helping to reduce global warming is an important motivation for taking public transportation or car pooling more often (21.7%) or walking or bicycling more instead of driving (25.6%). There were some other notable findings about people’s motivations to save energy. Significant numbers of the Dutch households (between 5% and 35% depending on the action) also indicated that conserving energy makes them feel good about themselves. The single most cited motivation (55.8%) for walking or bicycling more instead of driving was that it helps to get more exercise (thus good for their own). In sharp contrast, less than expected respondents, only a few, said that social pressures (someone asked me to do and people I care about are doing) were important motivators for the broad range of behavioral energy saving measures. Interestingly, roughly 20% of the respondents cite “people approve when I do” as a motivation to take public transportation or car pool, conceivable the management team where people work.
The most commonly cited barrier to adopt behavior energy savings measures was “I am already doing this as much as I can”, however, this option made sense. People who indicated that they would do this action about the same as now get also this question and they were not planning to do this action more often because they do this already as much as they can. Regarding to turn down the thermostat in winter/at night more frequently, the primary barrier most Dutch household face was that they “would not reduce they comfort” or “they prefer a warm house”. Surprisingly, for the action not turning off the light when you are not in the room people indicated that it was for security reasons, people think that there is somebody at home. Timers and sensors can reduce light usage to the necessary level, these options use technology (with very minimal investment) to mimic the behavior described above. For example, occupancy sensors help ensure that lights are only on when they are being actively used, some estimates suggest that occupancy sensors can reduce energy use by 45% or photosensors might be used to turn lights off during daylight hours [56]. Furthermore, a commonly cited barrier for not turning off appliances instead of the standby function has to do with a habitual factor, people indicated that it was hard to remember, it was not convenient, and it was too much effort. While appliances left in standby mode constitute approximately 10% of residential electricity consumption in many OECD countries (IEA, 2009, p346). An interesting example of such an appliance, which is frequently used during a day in the house, is a desktop computer. Issi and Kaplan have analyzed the energy utilization of a desktop computer and concluded that about 22% of the used power was depleted while the computer was in standby [57].
There are some remarkable findings about people’s barriers to the use of alternative forms of transportation. The most cited reasons why people did not use the public transport had to do with comfort: it is not convenient, weather makes it not comfortable, travel time will be too long, and no stop close to my home. Yet a substantial proportion of Dutch households’ energy use and carbon emissions was caused by transportation. Thus, encouraging this group to adjust their choices could potentially save a lot of energy and reduce carbon emissions [58,59].
In order to analyze the influence of socio-demographic factors, building/car details, and environmental concerns on the specific measures, an ordinal regression analysis was used (see ANNEX for an overview of regression outcomes). As for technical measures, the regression analysis revealed that the reason for taking actions was rather to be found in differences among socio-demographic background rather than in environmental concerns. Of all the environmental concerns tested, only one statement was found to have a statistically significant effect at the 95% confidence interval level, i.e., people who agreed that internet, an important source of information, is on an environmental progress noted that they turn down the heat always or often do (OR = 1.87, B = 0.627, p < 0.05). While with respect to this measure several socio-demographic factors were found to be of significance, i.e., all age categories; occupation—retired people (OR = 7.99, B = 0.833, p < 0.05); and energy label C (OR = 9.57, B = 1.064, p < 0.05). There were some other notable findings based on the regression analysis. Retired people were found to have a consistent and statistically significant impact on the adoption of environmentally friendly behavior, with the exception of turning off the lights when nobody is in the room and the use of public transport/carpool (see ANNEX for an overview of regression outcomes). Respondents’ income was not found to have a strong statistically significant impact on the adoption of behavioral measures, except for closing the window when the heating is running (OR = 2.99, B = 0.446, p < 0.05). Furthermore, gender did not have a statistically significant effect at the 95% confidence interval. This is in line with the previous literature on energy consumption, there was little evidence of gender differences, either because gender was not an issue or because no gender effects on behavior were found [55]. However, it was not in line with the well documented gender differences in the transportation area. Several studies showed that men use public transportation less than women [55]. Actually, we found hardly any socio-demographic variable that clearly explained why respondents use public transportation or carpool. Only retired people were four times more likely to use public transport or carpool than the other occupation categories (OR = 4.26, B = 0.666, p < 0.01). The lowest age group (probably students or the people without a driving license or car) were also more likely to use public transport or carpool, and the group of people with the age of 35–39.
5. Conclusions
This paper described that saving energy at home and on the road requires more than simply interpreting its characteristics, therefore, people’s actual behavior and intentions they have rather than objective data could significantly increase the insight in and the understanding of this field. A clear distinction was made between technical and behavioral energy saving measures. By doing so, this paper aimed at investigating which determinants influence household preferences for energy-saving measures as well as highlighting the key determinants for adopting energy-savings measures, at the household scale. This paper also attempted to shed more light on the factors that may bridge the intention–behavior gap. The main conclusions from our empirical analysis were as follow:
First, behavioral energy saving measures were more acceptable than technical ones. Within the technical energy saving measures, home energy saving measures seemed to be more acceptable than transport measures. Here it should be noted that all energy saving measures were described as being of decisive importance by some of the respondents and of no importance at all by others, which shows the heterogeneity of the results. The acceptability of these measures might be increased by implementing complementary policy measures. For example, a subsidy for retrofitting to encourage technical improvements. From a policy point of view, this might be an interesting route to follow, which is an interesting starting point for further research.
Second, technical energy saving measures, which require a considerable financial investment, were more dependent on personal circumstances, while behavior measurers, which are easier to perform, were more driven by attitudinal factors. Especially environmental motivations behind energy saving activities might be interesting from a policy perspective. They could also reduce the unintended negative consequences of improved energy efficiency, such as the rebound effect in case of technical measures.
Third, energy conservation behaviors were more variable. This finding demonstrated that while saving money remained the most common motivator together with the reduction of energy consumption in the survey presented in this paper, many were also motivated to save energy by other values, including environmental protection, morality, and health, all of which might provide useful frames for promotional campaign messages.
Fourth, technical energy saving measures were largely acceptable if one could afford it (link with personal factors—socio-demographic characteristics). Lack of know-how and time to adopt to the issue were not indicated as remarkable barriers. Although respondents most often cited the desire to save money and energy as their primary motivations for adoption, significant proportions also said that reducing global warming, acting morally, and feeling good about themselves were also important motivators. These technical measures might be more acceptable if it seems apparent that they are beneficial. Three broad categories of benefits should be distinguished in order to clarify why households adopt technical measures: (1) functional benefits: what the product or behavior will do for me, (2) self-expressive benefits: what the product or behavior says about me, and (3) self-evaluative benefits: how the product or behavior makes me feel about me.
Fifth, the analyses provided in this paper showed a variation in the intention–behavior gap reported for the context of technical and behavioral energy saving measures. Both the literature review and the empirical case highlighted the lack of understanding of how intentions may, or may not, convert into actions. However, different stages should be distinguished in order to clarify why households are motivated to change their behaviors. First, households need to be aware of the need for and possible ways to reduce household energy use. Second, households need to be motivated to save their energy, and third households should be able to adopt the relevant behavior. Segmentation analysis should be considered in further research as a means of understanding how household characteristics might influence the size of the intention–behavior gap.
Finally, we concluded that this type of research was not only relevant for the academic community but also for the government and businesses (e.g., energy engineers). For policymakers (on the local and national level) in the area of energy provision for households these results were interesting for gaining insights into the reasons for non-adoption by households, which would provide handholds to formulate an appropriate policy or service view that could help to transform the current energy system into a more sustainable one. However, also for the energy industry (engineers and developers), which might learn how to react and act on user (households) needs in energy innovation processes. For providers in the field of renewable energy, insights and lessons are highly relevant to further tighten their own strategy.
Author Contributions
Conceptualization, V.V. and A.-F.M.; methodology, V.V. and A.-F.M.; validation, V.V. and A.-F.M.; formal analysis, V.V.; investigation, V.V.; resources, V.V.; data curation, V.V.; writing—original draft preparation, V.V.; writing—review and editing, A.-F.M.; visualization, V.V.; funding acquisition, V.V.
Funding
This research is part of the research program JSTP—Joint Research Projects: Smart Energy in Smart Cities, titled ‘Energy efficiency of households in cities. A multimethod analysis’ funded by the Netherlands Organization for Scientific Research (NWO), grant number 467-14-023. Furthermore, the research presented in this paper also received funding from the European Union’s H2020 Research and Innovation program under grant agreement number 727642. The sole responsibility for the content of this paper lies with the authors.
Conflicts of Interest
The authors declare no conflict of interest.
Appendix A. Representative Sample of the Dutch Population
| Gender | Response | CBS * |
| Men | 53% | 49% |
| Women | 47% | 51% |
| Age distribution | Response | CBS |
| 18–24 | 7% | 11% |
| 25–34 | 15% | 16% |
| 35–49 | 27% | 27% |
| 50–64 | 25% | 26% |
| 65+ | 26% | 21% |
| Level of education | Response | CBS |
| Low (primary, vmbo, lbo) | 33% | 32% |
| Middle (havo, vwo, mbo) | 38% | 44% |
| High (hbo, university) | 29% | 25% |
| Gross yearly income | Response | CBS |
| Less than 12.6000 EUR | 4% | 5% |
| 12.600–27.000 EUR | 20% | 19% |
| 27.000–40.000 EUR | 19% | 17% |
| 40.000–67.000 EUR | 28% | 29% |
| 67.000 or more EUR | 28% | 29% |
| Do not know | 0.3% | 0.3% |
| Geographical region | Response | CBS |
| Drenthe | 2% | 3% |
| Flevoland | 2% | 2% |
| Friesland | 5% | 4% |
| Gelderland | 12% | 12% |
| Groningen | 3% | 4% |
| Limburg | 11% | 7% |
| Noord-Brabant | 17% | 15% |
| Noord-Holland | 13% | 16% |
| Overijssel | 6% | 7% |
| Utrecht | 9% | 7% |
| Zeeland | 3% | 2% |
| Zuid-Holland | 18% | 21% |
| * CBS is a Dutch abbreviation for ‘Centraal Bureau voor de Statistiek’, in English Statistics Netherlands. | ||
Appendix B. List of Attitudinal and Personal Factors
| Attitudinal Factors | Personal Factors |
Motives:
| Socio-demographic background:
|
Barriers:
| In home:
|
Environmental concerns:
| On the road:
|
Appendix C. Binary Logistic Regression Outcomes for Technical Energy Saving Measures—Socio-Demographic Background and Building/Car Details
| Insulation | Solar Panels | Energy Efficient Boiler | CFl-LED | Fuel Efficient Car | Electric Car | |
| 1 = yes 2 = no | 1 = yes 2 = no | 1 = yes 2 = no | 1 = yes 2 = no | 1 = yes 2 = no | 1 = yes 2 = no | |
| B (SE) OR | B (SE) OR | B (SE) OR | B (SE) OR | B (SE) OR | B (SE) OR | |
| Constant | −3.937 (2.249) *** 0.02 | - | - | - | - | 10.495 (5.120) ** >105 |
| Socio-demographic background | ||||||
| Gender | 1.089 (0.303) * 2.97 | - | - | - | - | - |
| Age | 0.201 (0.064) * 1.22 | - | - | - | - | 0.568 (0.328) *** 1.77 |
| Education | - | - | - | - | - | - |
| Income | - | - | - | - | −0.210 (0.111) *** 0.81 | - |
| Occupation | −0.151 (0.065) ** 0.86 | - | - | - | - | −0.511 (0.274) *** 0.60 |
| Building details | ||||||
| Ownership of the house | 1.259 (0.500) ** 3.52 | - | - | - | ||
| Type of dwelling | - | - | - | - | ||
| Energy efficiency label | - | - | - | - | ||
| City size | - | - | - | - | ||
| Building year | - | - | - | - | ||
| Car details | ||||||
| Number of cars | - | - | ||||
| Energy label | - | - | ||||
| Type of fuel | −0.506 (0.241) ** 0.60 | −2.888 (1.052) ** 0.06 | ||||
| Frequency of driving | - | - | ||||
| Model of fit | ||||||
| −2 log likelihood | ||||||
| Final | 334.360 | 276.486 | 279.448 | 391.207 | 385.816 | 30.111 |
| R2 Cox and Snell | 0.098 | 0.023 | 0.019 | 0.011 | 0.045 | 0.085 |
| R2 Nagelkerke | 0.139 | 0.038 | 0.031 | 0.017 | 0.065 | 0.523 |
| Hosmer and Lemeshow | χ2 = 7.682 p > 0.05 | χ2 = 8.944 p > 0.05 | χ2 = 11.356 p > 0.05 | χ2 = 5.499 p > 0.05 | χ2 = 11.190 p > 0.05 | χ2 = 0.859 p > 0.05 |
| * p < 0.10; ** p < 0.05;*** p < 0.01 | ||||||
Only the results that are significant are visualized, questions that are not taken into account in the analysis are empty and the ones included but not significant are visualized with a small vertical line.
Appendix D. Binary Logistic Regression Outcomes for Technical Energy Saving Measures—Values and Attitudes
| Insulation | Solar Panels | Energy Efficient Boiler | CFL-LED | Fuel Efficient Car | Electric Car | |
| 1 = yes 2 = no | 1 = yes 2 = no | 1 = yes 2 = no | 1 = yes 2 = no | 1 = yes 2 = no | 1 = yes 2 = no | |
| B (SE) OR | B (SE) OR | B (SE) OR | B (SE) OR | B (SE) OR | B (SE) OR | |
| Constant | - | - | - | −4.016 (1.055) * 0.02 | - | - |
| Values and attitudes | ||||||
| Moral obligation | - | - | - | - | - | - |
| Environmental conscious person | - | - | - | 0.581 (0.309) *** 1.79 | - | - |
| Inform and discuss environmental problem | - | 0.876 (0.351) ** 2.40 | - | - | 0.758 (0.275) * 2.13 | - |
| Environmental problems are overstated | - | - | - | - | 0.573 (0.297) *** 1.77 | - |
| Health is impaired by pollution | - | - | - | - | - | - |
| Internet as an important information source | - | - | - | 0.524 (0.307) *** 1.69 | - | - |
| Next generation—reduction in well-being | - | - | −0.716 (0.317) ** 0.49 | - | - | - |
| Energy reduction measures even if they cost extra | 0.780 (0.297) * 2.18 | - | - | 0.971 (0.302) * 2.64 | - | - |
| Model of fit | ||||||
| −2 log likelihood | ||||||
| Final | 353.839 | 263.933 | 275.334 | 374.655 | 402.915 | 64.971 |
| R2 Cox and Snell | 0.044 | 0.066 | 0.045 | 0.078 | 0.052 | 0.012 |
| R2 Nagelkerke | 0.062 | 0.109 | 0.073 | 0.125 | 0.076 | 0.068 |
| Hosmer and Lemeshow | χ2 = 8.596 p > 0.05 | χ2 = 1.530 p > 0.05 | χ2 = 11.165 p > 0.05 | χ2 = 5.099 p > 0.05 | χ2 = 7.883 p > 0.05 | χ2 = 7.647 p > 0.05 |
| * p < 0.10; ** p < 0.05; *** p < 0.01 | ||||||
Only the results that are significant are visualized, questions that are not taken into account in the analysis are empty and the ones included but not significant are visualized with a small vertical line.
Appendix E. Ordinal Regression Outcomes for Behavioral Energy Saving Measures—Socio-Demographic Background and Building/Car Details
| Turn the Heat Down | Close the Window When the Heating System is Running | Turn of the Lights When You are not There | Turn off the Appliances Instead of Stand by | Walking or Cycling Short Distances Instead of Driving | Use Public Transport of Carpool | |
| 1 = never 2 = sometimes 3 = neutral 4 = usually 5 = always | 1 = never 2 = sometimes 3 = neutral 4 = usually 5 = always | 1 = never 2 = sometimes 3 = neutral 4 = usually 5 = always | 1 = never 2 = sometimes 3 = neutral 4 = usually 5 = always | 1 = never 2 = sometimes 3 = neutral 4 = usually 5 = always | 1 = never 2 = sometimes 3 = neutral 4 = usually 5 = always | |
| Link function | Logit B (SE) OR | Logit B (SE) OR | Logit B (SE) OR | Logit B (SE) | Logit B (SE) OR | Logit B (SE) OR |
| Threshold | ||||||
| 1 | −11.267 (6.724) *** 0.01 | −6.991 (2.890) ** 0.01 | −3.782 (2.050) ** 0.02 | 15.801 (1.743) * >106 | ||
| 2 | −5.057 (2.853) *** 0.01 | 16.981 (1.741) * >106 | ||||
| 3 | 1.594 (0.645) ** 4.92 | 17.900 (1.738) * >106 | ||||
| 4 | 2.741 (0.652) * 15.50 | 19.454 (1.735) * >106 | ||||
| Socio-demographic background | ||||||
| Gender Men Women | −0.422 (0.254) *** 0.66 | −0.461 (0.200) ** 0.63 | ||||
| Age 18–19 20–24 25–29 30–34 35–39 40–44 45–49 50–54 55–59 60–64 >65 | - - 1.427 (0.751) *** 4.17 2.129 (0,784) * 8.41 2.953 (0.910) * 19.16 1.764 (0.736) ** 5.84 2.112 (0.725) * 8.27 2.293 (0.768) * 9.90 2.403 (0.741) * 11.06 1.947 (0.726) * 7.01 | - - - - - 1.411 (0.678) ** 4.10 1.148 (0.648) *** 3.15 - - 1.1216 (0.655) *** 3.37 | - - - - - - - - - - | 2.496 (1.127) ** 12.13 1.622 (0.670) ** 5.06 - 1.072 (0.562) *** 2.92 1.345 (0.579) ** 3.84 0.982 (0.538) *** 2.67 1.260 (0.522) ** 3.53 1.271 (0.546) ** 3.56 1.349 (0.524) ** 3.85 1.806 (0.523) * 6.09 | - - - - 1.237 (0.650) *** 3.45 1.392 (0.597) ** 4.02 1.387 (0.565) ** 4.00 2.110 (0.604) * 8.25 1.840 (0.578) * 6.30 1.700 (0.547) * 5.47 | - 1.430 (0.781) ** 4.17 - - 1.088 (0.647) ** 2.97 - - - - - |
| Education Secondary school A Levels/Abitur/baccalaureate University degree or higher | −0.729 (0.0423) *** 0.48 | −0.738 (0.353) ** 0.48 - | −0.702 (0.362) *** 0.50 −0.685 (0.311) ** 0.50 | - - | - - | - - |
| Income below 900 EUR/month 900–1250 EUR/month 1250–1850 EUR/month 1850–3000 EUR/month 3000–5000 EUR/month >5000 EUR/month I do not known | - - - - - - | - - - 1.078 (0.446) ** 2.99 - - | - - - 0.735 (0.447) *** 2.09 - - | - - - - - - | - - - - - - | - - - −0.695 (0.393) *** 0.50 - - |
| Occupation Student Employee (regular) Employee (manager) Employer Self-employed Unemployed Stay-at-home parent Retired Other | - - - −2.115 (1.124) *** 0.12 - - - 2.078 (0.833) ** 7.99 | - −1.226 (0.633) *** 0.29 −1.660 (0.859) *** 0.19 - −1.758 (0.725) ** 0.17 - −1.414 (0.763) *** 0.24 - | - - - - - - - 1.300 (0.666) *** 3.67 | - 1.012 (0.454) ** 2.75 - - - - - 2.111 (0.580) * 8.26 | 2.030 (1.105) *** 7.61 1.150 (0.521) ** 3.16 - 2.256 (1.129) ** 9.54 - - - 2.013 (0.628) * 7.49 | 1.873 (1.089) *** 6.51 1.235 (0.559) ** 3.44 - - 1.176 (0.667) ** 3.24 - - 1.449 (0.666) * 4.26 |
| Building details | ||||||
| Do you own the house or is it rented? Property Rented | 0.633 (0.360) *** 1.88 - | 0.563 (0.288) *** 1.76 | 0.676 (0.294) ** 1.97 | |||
| In which type of dwelling do you live? Detached Mid-terrace Semi-detached Apartment Maisonette/duplex Studio Others | - - - - - - | - 0.701 (0.389) *** 2.02 1.004 (0.460) ** 2.73 - - - | - 1.283 (0.374) * 3.61 0.871 (0.421) ** 2.39 1.216 (0.402) * 3.37 1.560 (0.942) *** 4.75 - | |||
| What is the current energy efficiency label of your dwelling? Do not know A B C D E F G | - - 2.259 (1.064) ** 9.57 - - - - | −1.306 (0.739) *** 3.69 1.997 (0.832) ** 7.37 1.915 (0.830) ** 6.79 - 2.684 (1.025) * 14.64 - 1.795 (1.032) *** 6.02 | ||||
| Is the electricity you buy renewable? Yes, 100% Yes, partly No Do not know | - - - | - - - | - - - | 0.521 (0.232) ** 1.68 - - | ||
| When was your dwelling built? | - | - | - | |||
| Car details | ||||||
| How many cars are available in your household? 0 1 2 3 or more | ||||||
| What is the energy label of your car? Do not know A B C D E F | - - - −2.967 (1.197) ** 0.05 - | |||||
| What type of fuel does your car require? Gasoline Diesel LPG Electricity | ||||||
| 18.788 (0.646) * >106 | ||||||
| 18.996 (0.686) * >106 | ||||||
| How often do you drive your car? Every day 4–5 times per week 2–3 times per week Once a weekDo not know | ||||||
| −2.962 (1.018) * 0.05 | −2.693 (0.912) * 0.07 | |||||
| −2.173 (1.010) ** 0.11 | −2.238 (0.903) ** 0.11 | |||||
| 1.968 (0.896) ** 0.14 | ||||||
| Model of fit | ||||||
| −2 log likelihood | ||||||
| Intercept only | 6682.994 | 898.262 | 806.338 | 1205.437 | 1048.528 | 1081.318 |
| Final | 593.145 | 807.226 | 755.477 | 1163.753 | 918.734 | 973.640 |
| R2 Cox and Snell | 0.185 | 0.187 | 0.109 | 0.089 | 0.287 | 0.245 |
| R2 Nagelkerke | 0.234 | 0.215 | 0.130 | 0.093 | 0.304 | 0.258 |
| R2 McFadden | 0.132 | 0.101 | 0.063 | 0.030 | 0.118 | 0.095 |
| Test of parallel lines | χ2 = 131.555 p > 0.05 | χ2 = 161.980 p > 0.05 | χ2 = 126.687 p > 0.05 | χ2 = 112.396 p > 0.05 | - - | χ2 = 47.343 p > 0.05 |
| * p < 0.10; ** p < 0.05; *** p < 0.01 | ||||||
Only the results that are significant are visualized, questions that are not taken into account in the analysis are empty and the ones included but not significant are visualized with a small vertical line.
Appendix F. Binary Logistic Regression Outcomes for Technical Energy Saving Measures—Values and Attitudes
| Turn the Heat Down | Close the Window When the Heating System is Running | Turn of the Lights When You are not There | Turn off the Appliances Instead of Stand by | Walking or Cycling Short Distances Instead of Driving | Use Public Transport of Carpool | |
| 1 = never 2 = sometimes 3 = neutral 4 = usually 5 = always | 1 = never 2 = sometimes 3 = neutral 4 = usually 5 = always | 1 = never 2 = sometimes 3 = neutral 4 = usually 5 = always | 1 = never 2 = sometimes 3 = neutral 4 = usually 5 = always | 1 = never 2 = sometimes 3 = neutral 4 = usually 5 = always | 1 = never 2 = sometimes 3 = neutral 4 = usually 5 = always | |
| Link function | Logit B (SE) OR | Logit B (SE) OR | Logit B (SE) OR | Logit B (SE) OR | Logit B (SE) OR | Logit B (SE) OR |
| Threshold | ||||||
| 1 | −3.158 (0.698) * 0.04 | −4.013 (0.729) * 0.02 | −1.442 (0.519) * 0.24 | −1.894 (0.536) * 0.15 | ||
| 2 | −2.272 (0.666) * 0.10 | −1.755 (0.558) * 0.17 | ||||
| 3 | −1.650 (0.656) ** 0.19 | −0.989 (0.547) *** 0.37 | 0.995 (0.516) *** 2.70 | |||
| 4 | 1.539 (0.514) * 4.66 | 1.782 (0.519) * 5.94 | 2.098 (0.527) * 8.15 | |||
| Values and attitudes | ||||||
| Do you feel a moral obligation to reduce energy consumption? Yes Not really Not at all | ||||||
| Would you say you are an environmental conscious person (if you compare yourself to others in your neighborhood)? Yes No | 0.372 (0.215) *** 1.45 | 0.611 (0.219) *** 1.84 | ||||
| Do you inform yourself about environmental problems and discuss such problems with others? Yes No | 0.332 (0.196) *** 1.39 | 0.341 (0.195) *** 1.41 | ||||
| Do you feel that environmental problems are overstated? Yes No | 0.344 (0.208) *** 1.41 | |||||
| Do you think your health is impaired by pollution? Yes No | −0.467 (0.251) *** 0.63 | 0.322 (0.189) *** 1.38 | ||||
| Do you consider the internet as an important source of information on environmental progress in your country? Yes No | 0.627 (0.276) ** 1.87 | 0.395 (0.240) *** 1.48 | ||||
| Do you opt for energy reduction measures even if they cause extra cost? Yes No | ||||||
| Model of fit | ||||||
| −2 log likelihood | ||||||
| Intercept only | 462.338 | 537.491 | 805.153 | 737.622 | 796.892 | |
| Final | 444.211 | 521.272 | 781.265 | 712.834 | 778.194 | |
| R2 Cox and Snell | 0.040 | 0.036 | 0.052 | 0.054 | 0.041 | |
| R2 Nagelkerke | 0.050 | 0.041 | 0.054 | 0.057 | 0.043 | |
| R2 McFadden | 0.026 | 0.018 | 0.017 | 0.020 | 0.014 | |
| Test of parallel lines | χ2 = 33.493 p > 0.05 | χ2 = 24.804 p > 0.05 | χ2 = 35.308 p > 0.05 | |||
| * p < 0.10; ** p < 0.05; *** p < 0.01 | ||||||
Only the results that are significant are visualized, questions that are not taken into account in the analysis are empty and the ones included but not significant are visualized with a small vertical line.
References
- Hilderson, W.; Mlecnik, E.; Cré, J. Potential of Low Energy Housing Retrofit: Insights from Building Stock Analysis; Belgian Science Policy: Brussels, Belgium.
- Codoban, N.; Kennedy, C.A. Metabolism of neighbourhoods. J. Urban Plan. Dev. 2008, 134, 21–31. [Google Scholar] [CrossRef]
- Marique, A.-F.; Reiter, S. A simplified framework to assess the feasibility of zero-energy at the neighbourhood/community scale. Energy Build. 2014, 82, 114–122. [Google Scholar] [CrossRef]
- Lee, J.B.; Park, J.W.; Yoon, J.H.; Baek, N.C.; Shin, U.C. An empirical study of performance characteristics of BIPV (Building Integrated Photovoltaic) system for the realization of zero energy building. Energy 2014, 66, 25–34. [Google Scholar] [CrossRef]
- Kassai, M. Experimental investigation on the effectiveness of sorption energy recovery wheel in ventilation system. Exp. Heat Trans. 2018, 31, 106–120. [Google Scholar] [CrossRef]
- Samuelson, C.D. Energy conservation. A social dilemma approach. Soc. Behav. 1990, 5, 207–230. [Google Scholar]
- Stern, P.C.; Gardner, G. Psychological research and energy policy. Am. Psychol. 1981, 36, 329–342. [Google Scholar] [CrossRef]
- Haas, R.; Biermayr, P. The rebound effect for space heating. Empirical evidence from Austria. Energy Policy 2000, 28, 403–410. [Google Scholar] [CrossRef]
- Davis, F.D. Perceived usefulness, perceived ease of use, and user acceptance of information technology. MIS Q. 1989, 13, 319–340. [Google Scholar] [CrossRef]
- Ajzen, I. The theory of planned behavior. Organ. Behav. Hum. Decis. Process. 1991, 50, 179–211. [Google Scholar] [CrossRef]
- Venkatesh, V.; Morris, M.G.; Davis, G.B.; Davis, F.D. User Acceptance of Information Technology: Toward a Unified View. MIS Q. 2003, 27, 425–478. [Google Scholar] [CrossRef]
- Collan, M.; Tetard, F. Lazy User Theory of Solution Selection. In Proceedings of the CELDA 2007 Conference, Lgarve, Portugal, 7–9 December 2007; pp. 273–278. [Google Scholar]
- Rogers, E.M. Diffusion of Innovations, 5th ed.; The Free Press: New York, NY, USA, 2003. [Google Scholar]
- Bamberg, S. Is a Stage Model a Useful Approach to Explain Car Drivers’ Willingness to Use Public Transportation. J. Appl. Soc. Psychol. 2007, 37, 1757–1783. [Google Scholar] [CrossRef]
- Schwartz, S. The Justice of Need and the Activation of Humanitarian Norms. J. Soc. Issues 1975, 31, 111–136. [Google Scholar] [CrossRef]
- Bamberg, S. Changing environmentally harmful behaviors: A stage model of self-regulated behavioral change. J. Environ. Psychol. 2013, 34, 151–159. [Google Scholar] [CrossRef]
- Bamberg, S. Applying the stage model of self-regulated behavioral change in a car use reduction intervention. J. Environ. Psychol. 2013, 33, 68–75. [Google Scholar] [CrossRef]
- Geller, E.S. The Challenge of Increasing Proenvironment Behavior. In Handbook of Environmental Psychology; Bechtel, R.G., Churchman, A., Eds.; Wiley: New York, NY, USA, 2002; pp. 525–540. [Google Scholar]
- Jackson, T. Motivating Sustainable Consumption, a review of evidence on consumer behavior and behavioral change. In Sustainable Development Research Network; University of Surrey: Guildford, UK, 2005. [Google Scholar]
- Martiskainen, M. Affecting Consumer Behavior on Energy Demand; Sussex Energy Group-University of Sussex: Brighton, UK, 2007. [Google Scholar]
- Brennan, K. Energy Efficiency-Public Attitude, Private Action; Future Foundation; LogicaCMG: Reading, UK, 2006. [Google Scholar]
- Moser, S.C.; Dilling, L. Making Climate Hot: Communicating the Urgency and Challence of Global Climate Change. Environment 2004, 46, 32–46. [Google Scholar]
- Goldblatt, D. Sustainable Energy Consumption and Society: Personal, Technological, or Social Change; Springer: Dordrecht, The Netherlands, 2005. [Google Scholar]
- IPCC. Summary for Policymakers. 2007. Available online: http://www.ipcc-wg2.org/index.html (accessed on 9 June 2007).
- Steg, L.; Vlek, C. Encouraging pro-environmental behavior: An integrative review and research agenda. J. Environ. Psychol. 2009, 29, 309–317. [Google Scholar] [CrossRef]
- Lopes, M.A.R.; Antunes, C.H.; Martins, N. Energy behaviors as promoters of energy efficiency: A 21st century review. Renew. Sustain. Energy Rev. 2012, 16, 4095–4104. [Google Scholar] [CrossRef]
- Samuelsom, C.; Biek, M. Attitudes toward energy conservation: A confirmatory factor analysis 1. J. Appl. Soc. Psychol. 1991, 21, 549–569. [Google Scholar] [CrossRef]
- Wang, Z.; Zhang, B.; Yin, J.; Zhang, Y. Determinants and policy implications for household electricity-saving behavior: Evidence from Beijing, China. Energy Policy 2011, 39, 3550–3557. [Google Scholar] [CrossRef]
- Linden, A.L.; Carlsson-Kanyama, A.; Eriksson, B. Efficient and inefficient aspects of residential energy behavior: What are the policy instruments for change. Energy Policy 2006, 34, 1918–1927. [Google Scholar] [CrossRef]
- Sardianou, E. Estimating energy conservation patterns of Greek households. Energy Build. 2008, 40, 1084–1093. [Google Scholar] [CrossRef]
- Ek, K.; Soderholm, P. The devil is in the details: Household electricity saving behavior and the role of information. Energy Policy 2010, 38, 1578–1587. [Google Scholar] [CrossRef]
- Owen, A.L.; Videras, J. Civic cooperation, pro-environment attitudes, and behavioral intentions. Ecol. Econ. 2006, 58, 814–829. [Google Scholar] [CrossRef]
- Dwyer, W.O.; Leeming, F.C.; Cobern, M.K.; Porter, B.E.; Jackson, J.M. Critical Review of Behavioral Interventions to Preserve the Environment-Research Since 1980. Environ. Behav. 1993, 25, 275–321. [Google Scholar] [CrossRef]
- Staats, H.J.; Wit, A.P.; Iddenidden, C.Y.H. Communicating the greenhouse effect to the public: Evaluation of a mass media campaign from a social dilemma perspective. J. Environ. Manag. 1996, 46, 189–203. [Google Scholar] [CrossRef]
- Gram-Hansen, K. Boligers Energiforbrug-Sociale Og Tekniske Forklaringer Pa Forskelle; og BYG., Ed.; Statens Byggeforskningsinstitut: Ho¨rsholm, Danmark, 2003. [Google Scholar]
- Verhallen, T.; Van Raaij, W. Household behavior and the use of natural gas for home heating. J. Consum. Res. 1981, 8, 253–257. [Google Scholar] [CrossRef]
- Haas, R.; Auer, H.; Biermayr, P. The impact of consumer behavior on residential energy demand for space heating. Energy Build. 1998, 27, 195–205. [Google Scholar] [CrossRef]
- Santin, O.G.; Itard, L.; Visscher, H. The effect of occupancy and building characteristics on energy consumption for space and water heating in Dutch residential stock. Energy Build. 2009, 41, 1223–1232. [Google Scholar] [CrossRef]
- De Groot, E.; Spiekman, M.; Opstelten, I. Dutch research into user behaviour in relation to energy use of residences. In Proceedings of the PLEA 2008, Dublin, Ireland, 22–24 October 2008; pp. 1–6. [Google Scholar]
- Santin, O.G. Behavioral patterns and user profiles related to energy consumption for heating. Energy Build. 2011, 43, 2662–2672. [Google Scholar] [CrossRef]
- Tommerup, H.; Rise, J.; Svendsen, S. Energy efficient houses built according to the energy performance requirements introduced in Denmark in 2006. Energy Build. 2007, 39, 1123–1130. [Google Scholar] [CrossRef]
- Lenzen, W.; Cohen, H.; Pachauri, S. A comparative multivariate analysis of household energy requirements in Australia, Brazil, Demark, India and Japan. Energy 2006, 31, 181–207. [Google Scholar] [CrossRef]
- Liao, H.C.; Chang, T.F. Space-heating and water-heating energy demand of the aged in the U.S. Energy Econ. 2002, 24, 267–284. [Google Scholar] [CrossRef]
- Sardianou, E. Barriers to industrial energy efficiency investments in Greece. J. Clean. Prod. 2008, 16, 1416–1423. [Google Scholar] [CrossRef]
- Van Raaij, W.F.; Verhallen, T.M.M. Patterns of residential energy behavior. J. Econ. Psychol. Mark. 1983, 4, 85–106. [Google Scholar] [CrossRef] [Green Version]
- Poortinga, W.; Steg, L.; Vlek, C.; Wiersma, G. Household preferences for energy-saving measures. A Conjoint Analysis. J. Econ. Psychol. 2003, 24, 49–64. [Google Scholar] [CrossRef]
- Marique, A.F.; Reiter, S. A method for evaluating transport energy consumption in suburban areas. Environ. Impact Assess. Rev. 2012, 33, 1–6. [Google Scholar] [CrossRef] [Green Version]
- CBS. Energieverbuik; Kerncijfers; CBS: Columbia, MO, USA, 2016. [Google Scholar]
- CBS. Emissies Van Broeikasgassen Berekend Volgens IPCC-Voorschriften; CBS: Columbia, MO, USA, 2016. [Google Scholar]
- Milieucentraal. 2017. Available online: https://www.milieucentraal.nl/energie-besparen/snel-besparen/bespaartips-apparaten-en-verlichting/ (accessed on 25 August 2007).
- CBS-PBL. Energielabels Van Woningen, 2007–2015 (Indicator 0556, Versie 05, 17 Maart 2016); CBS: Columbia, MO, USA, 2016. [Google Scholar]
- Faiers, A.; Neame, C. Consumer attitudes towards domestic solar power systems. Energy Policy 2006, 34, 1797–1806. [Google Scholar] [CrossRef] [Green Version]
- Vasseur, V.; Kemp, R. The adoption of PV in the Netherlands: A statistical analysis of adoption factors. Renew. Sustain. Energy Rev. 2015, 41, 483–494. [Google Scholar] [CrossRef]
- Vasseur, V.; Kemp, R. A segmentation analysis: The case of photovoltaic in the Netherlands. Energy Effic. 2015, 8, 1105–1123. [Google Scholar] [CrossRef] [Green Version]
- Dalen, H.M.; Halvorsen, B. Gender Differences in Environmental Related Behavior; Statistics Norway: Oslo, Norway, 2011. [Google Scholar]
- Lighting Efficiency. Climate Techbook. 2011. Available online: http://www.businessperformance.org/sites/default/files/LightingEfficiency.pdf (accessed on 28 October 2019).
- Issi, F.; Kaplan, O. The determination of load profiles and power consumptions of home appliances. Energies 2018, 11, 607. [Google Scholar] [CrossRef] [Green Version]
- Kassai, M.E. Effectiveness and humidification capacity investigation of liquid-to-air membrane energy exchanger under low heat capacity ratios at winter air conditions. J. Therm. Sci. 2015, 24, 391–397. [Google Scholar] [CrossRef]
- Wong, P.S.P.; Lindsay, A.; Crameri, L.; Holdsworth, S. Can energy efficiency rating and carbon accounting foster greener building design decision? An empirical study. Build. Environ. 2018, 87, 255–264. [Google Scholar] [CrossRef]
Figure 1.
Conceptual model relating various internal and external factors to behavior of households.
Figure 1.
Conceptual model relating various internal and external factors to behavior of households.


Table 1.
Bamberg’s stage model of self-regulated behavioral change [17].
Table 1.
Bamberg’s stage model of self-regulated behavioral change [17].
| Stage of Change | Description |
|---|---|
| Predecisional | Perform the problem behavior on a regular, habitual basis. In this stage people are not fully aware of the negative consequences associated with this behavior, and thus see no reasons for behavioral change. In order to run the risk of triggering reactance, confront people with a direct request to change their behavior. |
| Preactional | People already have the general goal of changing their current behavior (high goal intention). However, because several actions (e.g., cycling, walking, and public transport) could normally be used as a means to achieve this goal (e.g., car reduction), the task confronting them is to select the personally most suitable behavioral strategy. |
| Actional | People have formed a strong goal and behavioral intention. They have made a decision on which new behavioral strategy they want to test instead of the old one. However, the translation from their “good” behavioral intentions into real action is often difficult. |
| Postactional | Persons actually perform the selected new behavior for some time. In this stage they reflect on the experiences they have made with the new behavior and compare it critically with the old behavior. |
Table 2.
List of technological and behavioral energy saving measures.
| Technology (Energy Efficiency) | Behavior (Energy Savings) | |
|---|---|---|
| Heat | Home insulation | Turn down the thermostat in winter/at night |
| Close window when the heating is running | ||
| Electricity | Solar PV Panels | Turn off the lights when you are not there |
| Energy efficient boiler (heating system) | Turn off appliances | |
| Compact fluorescent light (CFL) or LED light bulbs | ||
| Car use | Fuel-efficient car | Use car less |
| Electric car | More use of public transport or car pool |
Table 3.
Technical energy saving measures.
| Reason | Insulation | Solar Panels | EE-Boiler | CFL-LED | FE-Car | E-Car | ||||
|---|---|---|---|---|---|---|---|---|---|---|
| O | R | O | R | O | R | O | R | |||
| Yes | 28.3 | 4.0 | 16.5 | 3.3 | 15.8 | 5.3 | 78.5 | 63.6 | 21.2 | 1.6 |
| It saves me money | 69.2 | 45.5 | 73.3 | 38.5 | 71.4 | 33.3 | 72.6 | 59.2 | 60.4 | 50.0 |
| It improves my comfort/living conditions | 50.0 | 9.1 | 5.6 | 0.0 | 39.0 | 25.0 | 10.1 | 2.9 | 20.1 | 26.1 |
| It improves the value of my dwelling | 29.8 | 27.3 | 31.1 | 7.7 | 16.9 | 25.0 | 1.6 | 1.0 | ||
| I had interesting financial incentives | 3.8 | 0.0 | 17.8 | 7.7 | 1.3 | 0.0 | 0.8 | 0.0 | 3.2 | 10.9 |
| It helps reduce global warming/avoid negative environmental impact | 13.5 | 9.1 | 41.1 | 23.1 | 15.6 | 0.0 | 27.0 | 20.4 | 25.3 | 30.4 |
| Someone asked me to | 1.0 | 18.2 | 0.0 | 7.7 | 0.0 | 33.3 | 0.4 | 1.0 | 1.9 | 8.7 |
| It is the moral thing to do | 4.8 | 0.0 | 10.0 | 7.7 | 5.2 | 8.3 | 10.5 | 8.7 | 9.7 | 13.0 |
| People I care about are doing it | 1.1 | 0.0 | 1.2 | 1.0 | 1.9 | 2.2 | ||||
| It makes me feel good about myself | 5.8 | 9.1 | 10.0 | 7.7 | 2.6 | 25.0 | 10.1 | 6.8 | 11.7 | 10.9 |
| Green image | 2.9 | 0.0 | 8.9 | 7.7 | 1.3 | 0.0 | 14.1 | 9.7 | 14.9 | 19.6 |
| It reduces energy consumption | 51.9 | 36.4 | 42.2 | 23.1 | 49.4 | 16.7 | 59.3 | 59.2 | 53.9 | 45.7 |
| It improves my house | 26.9 | 9.1 | 15.6 | 7.7 | 23.4 | 0.0 | 6.0 | 3.9 | ||
| Landlord has decided | 9.1 | 30.8 | 38.8 | |||||||
| Other people approve when I do | 0.0 | 7.7 | 1.0 | 0.0 | 0.6 | |||||
| It had to be replaced (old/renovation) | 39.0 | 2.4 | 29.1 | 3.9 | ||||||
| Not available anymore | 2.8 | 1.9 | ||||||||
| It reduces fuel consumption | 53.9 | 45.7 | ||||||||
| Lease | 1.3 | |||||||||
| Oil is exhaustible | 2.2 | |||||||||
| No | 57.2 | 27.2 | 70.0 | 28.5 | 71.0 | 28.5 | 17.8 | 16.6 | 61.8 | 80.4 |
| Considering over the next 12 months | 7.7 | 4.6 | 4.7 | 2.0 | 5.4 | 1.3 | 35.7 | 25.2 | 8.3 | 2.9 |
| Considering, but probably will not | 7.4 | 4.6 | 11.8 | 4.0 | 6.4 | 3.3 | 5.4 | 4.6 | 8.9 | 6.5 |
| Not considering | 80.1 | 80.1 | 78.1 | 80.8 | 83.2 | 82.8 | 54.9 | 57.6 | 76.1 | 84.6 |
| Do not know | 4.7 | 15.2 | 5.4 | 13.2 | 5.1 | 12.6 | 4.0 | 12.6 | 6.7 | 6.0 |
| I do not know how | 5.7 | 9.3 | 3.9 | 7.2 | 8.2 | 10.8 | 6.1 | 16.7 | 4.1 | 3.3 |
| It is too much effort | 13.0 | 2.9 | 7.7 | 6.5 | 6.8 | 5.8 | 10.2 | 8.3 | 2.4 | 2.7 |
| I am too busy | 13.5 | 2.1 | 4.3 | 1.4 | 5.5 | 4.3 | 6.1 | 6.3 | 1.7 | 2.5 |
| I cannot afford the investment costs | 29.0 | 19.3 | 26.1 | 22.5 | 20.5 | 22.3 | 6.1 | 20.8 | 36.7 | 39.6 |
| I could afford it, but do not want to spend the money | 17.1 | 0.7 | 17.4 | 3.6 | 15.9 | 2.2 | 10.2 | 10.4 | 8.8 | 7.0 |
| Someone else in my home would object | 1.6 | 0.7 | 1.9 | 2.2 | 2.3 | 2.9 | 10.2 | 0.0 | 1.4 | 1.5 |
| I do not care about my energy consumption | 3.1 | 2.1 | 1.4 | 2.9 | 5.5 | 2.9 | 2.0 | 6.3 | 2.7 | 1.5 |
| I do not care about the environment | 4.7 | 0.7 | 2.4 | 1.4 | 2.7 | 1.4 | 8.2 | 8.3 | 1.4 | 1.2 |
| I already have this | 26.4 | 9.3 | 1.0 | 0.7 | 15.5 | 3.6 | 30.6 | 10.4 | 0.5 | |
| Energy yield is too low | 17.4 | 1.4 | 0.9 | |||||||
| Fear of gained promised efficiency | 19.3 | 1.4 | ||||||||
| Visual representation | 0.5 | 10.6 | ||||||||
| It takes too long to recoup the expenditure | 30.4 | 6.5 | 0.5 | 7.1 | 9.2 | |||||
| Collectively (apartment)/Rented house | 6.7 | 55.7 | 12.1 | 37.7 | 35.3 | 12.5 | ||||
| Not necessary (health/still working) | 6.2 | 0.7 | 18.6 | 4.1 | ||||||
| Not suitable (roof/district heating) | 6.3 | 7.3 | 2.2 | |||||||
| Plans to move | 2.1 | 2.1 | 3.4 | 0.7 | 1.8 | 2.2 | 4.2 | |||
| I do not like them | 12.2 | 14.6 | 5.2 | |||||||
| Too expensive | 10.2 | 12.5 | ||||||||
| I do not need a new car | 50.0 | 50.5 | ||||||||
| They are too small | 1.7 | |||||||||
| I am worried about the availability of charging systems | 13.9 | |||||||||
| I am worried about the perceived maintenance costs | 3.2 | |||||||||
| I am worried about the resale value | 1.7 | |||||||||
| The noise | 0.3 | 0.5 | ||||||||
| No car/No driving license | 5.4 | 2.5 | ||||||||
| I have a lease car | 4.8 | 1.0 | ||||||||
| Do not know | 2.7 | 3.3 | 2.4 | 5.3 | 4.0 | 4.0 | 1.7 | 5.3 | 4.7 | 4.2 |
| Not applicable (because it is not something for me to decide) | 11.8 | 65.6 | 11.1 | 62.9 | 9.1 | 62.3 | 2.0 | 14.6 | 12.3 | 13.8 |
O = owned; R = rented; SD = short distances; OV = public transport.
Table 4.
Behavioral energy saving measures.
| Reason | Lower T | T-Window | Off Light | Off Appl | SD | OV/Carpool | ||||
|---|---|---|---|---|---|---|---|---|---|---|
| O | R | O | R | O | R | O | R | |||
| Always–Often | 64.3 | 54.3 | 87.6 | 79.5 | 4.7 | 8.0 | 26.3 | 25.9 | 69.0 | 28.8 |
| It saves me money | 70.0 | 81.8 | 64.7 | 72.7 | 64.3 | 88.9 | 58.3 | 73.7 | 51.2 | 47.8 |
| It helps reduce global warming/avoid negative environmental impact | 35.0 | 36.4 | 29.4 | 36.4 | 35.7 | 11.1 | 30.6 | 15.8 | 25.6 | 21.7 |
| It reduces energy consumption | 60.0 | 63.6 | 41.2 | 63.6 | 42.9 | 55.6 | 66.7 | 63.2 | 34.9 | 21.7 |
| Someone asked me to | 5.0 | 9.1 | 5.9 | 0.0 | 14.3 | 0.0 | 0.0 | 5.3 | 2.3 | 8.7 |
| It is the moral thing to do | 10.0 | 9.1 | 17.6 | 0.0 | 21.4 | 11.1 | 19.4 | 10.5 | 9.3 | 8.7 |
| People I care about are doing it | 0.0 | 9.1 | 11.8 | 9.1 | 0.0 | 0.0 | 2.8 | 5.3 | 2.3 | 8.7 |
| It makes me feel good about myself | 20.0 | 9.1 | 5.9 | 9.1 | 14.3 | 22.2 | 11.1 | 15.8 | 34.9 | 30.4 |
| Green image | ||||||||||
| I use a pillow/sweater to feel comfortable | 5.0 | |||||||||
| Other people approve when I do | 0.0 | 0.0 | 8.3 | 5.3 | 4.7 | 17.4 | ||||
| I prefer my comfort | 5.9 | |||||||||
| Shorter ventilation time | 5.9 | |||||||||
| Security | 2.8 | |||||||||
| It saves time | 4.7 | 8.7 | ||||||||
| It helps to get more exercise | 55.8 | |||||||||
| Easier with kids | 4.7 | |||||||||
| Never–Sometimes | 30.7 | 34.5 | 6.4 | 10.6 | 89.9 | 85.4 | 58.9 | 57.6 | 17.7 | 56.0 |
| Considering more frequently than now | 6.7 | 7.3 | 5.7 | 7.3 | 4.7 | 6.0 | 12.1 | 12.6 | 9.6 | 5.1 |
| Considering less frequently than now | 3.0 | 4.0 | 3.4 | 1.3 | 3.7 | 2.6 | 3.7 | 2.6 | 4.5 | 7.4 |
| About the same as now | 90.2 | 88.7 | 90.9 | 91.4 | 91.6 | 91.4 | 84.2 | 84.8 | 85.9 | 87.5 |
| I am too busy | 0.7 | 0.7 | 0.7 | 1.4 | 1.1 | 1.4 | 0.8 | 2.3 | 2.0 | 1.4 |
| It is hard to remember | 3.2 | 2.9 | 2.5 | 2.9 | 1.8 | 4.9 | 8.0 | 7.6 | 3.7 | 0.9 |
| It is not convenient | 4.7 | 6.4 | 4.3 | 5.0 | 4.2 | 9.2 | 18.4 | 15.2 | 8.6 | 20.5 |
| It is too much effort | 1.1 | 1.4 | 1.4 | 0.7 | 1.4 | 2.8 | 6.9 | 5.3 | 4.7 | 7.8 |
| I do not think it is important | 1.4 | 2.9 | 5.0 | 8.6 | 1.4 | 4.2 | 4.2 | 6.1 | 2.2 | 2.6 |
| Someone else in my home would object | 5.4 | 7.9 | 2.1 | 6.4 | 1.4 | 2.1 | 1.1 | 3.8 | 1.2 | 0.7 |
| I do not care about my energy consumption | 0.7 | 5.0 | 0.7 | 2.1 | 0.4 | 0.7 | 2.7 | 2.3 | 0.7 | 0.2 |
| I do not care about the environment | 1.1 | 0.7 | 1.1 | 3.6 | 1.4 | 2.1 | 1.5 | 2.3 | 2.0 | 1.6 |
| I am already doing this as much as I can | 78.3 | 69.3 | 83.6 | 77.9 | 88.7 | 84.5 | 74.3 | 75.0 | 66.4 | 40.5 |
| It would reduce my comfort | 16.6 | 16.5 | 6.4 | 9.3 | 6.0 | 2.8 | 7.3 | 3.0 | 5.2 | 7.5 |
| I prefer some ventilation in my house (moisture) | 0.3 | 5.3 | 6.5 | |||||||
| I prefer a warm house | 10.8 | 16.4 | ||||||||
| I cannot control the thermostat | 0.7 | 2.9 | ||||||||
| I do not have a thermostat | 0.4 | 2.9 | ||||||||
| Constant temperature is cheaper | 2.9 | 2.9 | ||||||||
| For my pets | 0.4 | |||||||||
| No heater in my house | 0.4 | |||||||||
| Not necessary | 0.7 | 0.4 | ||||||||
| I am more comfortable with many lights on | 2.8 | 0.7 | ||||||||
| Other people think there is somebody at home (security) | 6.0 | 2.8 | ||||||||
| It is more a habit | 1.1 | |||||||||
| Not possible | 1.5 | |||||||||
| The weather makes it often not comfortable | 10.9 | 2.8 | ||||||||
| The road is too difficult (height differences) | 1.2 | |||||||||
| Travel time will be too long/the distance I travel are too far | 9.4 | 23.5 | ||||||||
| It is not comfortable due to my health and physical condition | 10.9 | 7.3 | ||||||||
| I prefer driving by car | 8.1 | |||||||||
| Others would think it is strange if I did not use the car | 0.2 | |||||||||
| It is too expensive | 15.1 | |||||||||
| There is no stop close to my home/destination | 0.7 | 11.1 | ||||||||
| Problem with public transport | 1.4 | |||||||||
| I consider public transportation is for poor people | 0.7 | |||||||||
| I would not feel safe | 0.9 | |||||||||
| No car/No driving license | 2.5 | |||||||||
| Neutral | 5.1 | 6.1 | 9.9 | 5.4 | 6.6 | 14.8 | 16.6 | 13.4 | 15.2 | |
© 2019 by the authors. Licensee MDPI, Basel, Switzerland. This article is an open access article distributed under the terms and conditions of the Creative Commons Attribution (CC BY) license (http://creativecommons.org/licenses/by/4.0/).
Share and Cite
MDPI and ACS Style
Vasseur, V.; Marique, A.-F. Households’ Willingness to Adopt Technological and Behavioral Energy Savings Measures: An Empirical Study in The Netherlands. Energies 2019, 12, 4294. https://doi.org/10.3390/en12224294
AMA Style
Vasseur V, Marique A-F. Households’ Willingness to Adopt Technological and Behavioral Energy Savings Measures: An Empirical Study in The Netherlands. Energies. 2019; 12(22):4294. https://doi.org/10.3390/en12224294
Chicago/Turabian StyleVasseur, Véronique, and Anne-Francoise Marique. 2019. "Households’ Willingness to Adopt Technological and Behavioral Energy Savings Measures: An Empirical Study in The Netherlands" Energies 12, no. 22: 4294. https://doi.org/10.3390/en12224294
Note that from the first issue of 2016, this journal uses article numbers instead of page numbers. See further details here.