Article

Enhanced Degradation of Pharmaceutical Compounds by a Microbubble Ozonation Process: Effects of Temperature, pH, and Humic Acids

1
Department of Environmental Engineering, College of Engineering, Kangwon National University, 1 Kangwondaehak-gil, Chuncheon-si, Gangwon-do 24341, Korea
2
School of Civil and Environmental Engineering, Konkuk University, 120 Neungdong-ro, Gwangjin-gu, Seoul 05029, Korea
3
Haesung Engineering Inc., Heungdeok IT Valley B-709, 13, Heungdeok 1-ro, Giheung-gu, Yongin-si, Gyeonggi-do 16954, Korea
*
Author to whom correspondence should be addressed.
Energies 2019, 12(22), 4373; https://doi.org/10.3390/en12224373
Submission received: 2 November 2019 / Revised: 13 November 2019 / Accepted: 15 November 2019 / Published: 17 November 2019
(This article belongs to the Special Issue Wastewater Treatment and Resource Recovery)

Abstract

:
This study systematically investigated the feasibility of the microbubble ozonation process to degrade the 17α-ethinylestradiol, ibuprofen, and atenolol through the comparison with the millibubble ozonation process for elucidating the degradation behavior and mechanisms during the microbubble ozonation processes. The proportions of small microbubbles (diameter 1–25 μm) were increased with increasing the cavity pump frequency (40 Hz: 51.4%; 50 Hz: 57.5%; 60 Hz: 59.9%). The increased concentrations of O3 and OH radicals due to the higher specific area of O3 microbubbles compared to O3 millibubbles could facilitate their mass transfer at the gas–water interface. Furthermore, the elevated reactivity of O3 by increasing the temperature might improve the degradation of the pharmaceutical compounds, which was more pronounced for the microbubble ozonated waters than the millibubble ozonated waters. Although the degradation efficiency of the pharmaceutical compounds during the microbubble ozonation processes was significantly influenced by the existence of humic acids compared to the millibubble ozonation process, the increased solubilization rate of O3 and OH radicals by collapsing O3 microbubbles enhanced the degradation of the pharmaceutical compounds. Overall, these results clearly showed that the microbubble ozonation process could be an alternative option to conventional ozonation processes for the abatement of the pharmaceutical compounds.

Graphical Abstract

1. Introduction

In recent years, the occurrence and fate of trace organic compounds, including pharmaceutical compounds, personal care products, and endocrine-disrupting chemicals in surface water (i.e., lake water and river water), wastewater, and groundwater have become an emerging concern over the world since a considerable amount of used and/or metabolized organic compounds are discharged from municipal wastewater treatment plants (WWTPs) to the receiving surface water bodies in highly urbanized areas [1,2,3]. Most of trace organic compounds can be efficiently removed by biological wastewater treatment processes (conventional activated sludge, anoxic-oxic, and anaerobic–anoxic–oxic processes) generally applied in WWTPs, whereas hydrophilic chemical compounds (i.e., pharmaceutical compounds) tend to be recalcitrant to microbial activities, which may increase the concentrations of the used pharmaceutical compounds in lake water and surface water [4,5]. Even though used and/or metabolized pharmaceutical compounds present at a very low concentration in secondary effluents (i.e., ng L−1 range), the long-term exposure to them can provide adverse and/or harmful effects on human health and aquatic ecosystems [6,7]. Therefore, the application of advanced water treatment techniques and the assessment of their efficiencies have gained considerable attention for reducing the discharge of pharmaceutical compounds from municipal WWTPs to the receiving surface water bodies (e.g., lake water, river water, and groundwater) [8]
A few treatment methods, including coagulation-flocculation, activated carbon adsorption (powdered activated carbon and granular activated carbon), oxidative processes, and membrane processes, are available for the removal of pharmaceutical compounds from surface water and wastewater [9]. Among them, ozonation is considered to be a promising option as a tertiary wastewater treatment step in WWTPs for reducing the discharge of pharmaceutical compounds to river water and lake water, as ozone (O3) has a high reactivity towards most of trace organic compounds and self-decomposition characteristics to oxygen compared to other oxidizing agents (e.g., chlorine, hydrogen peroxide) [10]. Many researchers found that ozonation is efficient for disinfection, deodorization, and decoloration, and can effectively eliminate pharmaceutical compounds, personal care products, and endocrine-disrupting chemicals in surface water and wastewater [11,12]. However, O3 gases injected into the aqueous phase generally remains in the gaseous phase because of its low solubility in water (1.0 × 10⁻⁶ mol m−3∙Pa–1.3 × 10⁻⁴ mol m−3∙Pa), which may allow O3 gases existing in surface water and wastewater to pass through the reacting zone of the O3 reactors without the chemical reactions with trace organic compounds [13]. Based on these reasons, it is required to develop a novel method for improving the solubilization rate of O3 gases injected in surface water and wastewater closely associated with the removal of pharmaceutical compounds [14].
During the last decades, conventional ozonation (i.e., millibubble ozonation) processes, in which sizes ranged from 2 to 5 mm varies significantly depending on the type of gas spargers, have been used in conventional ozonation processes for drinking water and wastewater treatments [15]. Consequently, a great amount of O3 gases are necessary for conventional ozonation processes, which can lead to a high level of energy consumption [16]. Some studies recently reported that the use of the microbubble, which is defined as a bubble with a volume equivalent diameter in the range of 1 μm to 100 μm by the International Organization for Standardization (ISO; ISO 20480-1:2017) for ozonation processes is efficient to increase the degradation of trace organic compounds by enhancing the solubilization rate of O3 in the aqueous phase [15,17,18]. Compared to the millibubble ozonation process, the microbubble ozonation processes can transfer the gaseous phase to the aqueous phase more effectively due to their much lower rising velocity, higher surface area, and greater curvature [19]. Furthermore, the increased concentrations of OH radicals in the aqueous phase by collapsing the O3 microbubbles may additionally contribute to the decrease of trace organic compounds through the hydrogen abstraction, electron transfer, electrophilic addition, and radical-radical reactions [10,20]. In spite of the several benefits, microbubble ozonation technologies have been rarely applied to enhance sludge solubilization, treat textiles wastewater, and remove pesticides from vegetables in the food industries [18,21,22]. Moreover, a comprehensive study has not been performed yet to assess the feasibility of the microbubble ozonation processes for the reduction of the pharmaceutical compounds. Therefore, the fundamental knowledge of the microbubble ozonation process still remained incomplete, including the degradation behavior and mechanisms of the pharmaceutical compounds.
The main purpose of this study was to provide valuable insights into the degradation behavior of the pharmaceutical compounds during the microbubble ozonation processes. Hence, the bubble size effects on the solubilization rate of O3 and OH radicals were identified and directly correlated to the decrease of the pharmaceutical compounds to evaluate the efficiency of the microbubble ozonation process. Furthermore, the effects on temperature, pH, and humic acids on the degradation efficiency of the pharmaceutical compounds were systematically investigated to elucidate their degradation mechanisms in the microbubble ozonation processes.

2. Materials and Methods

2.1. Pharmaceutical Compounds and Reagents

Three different types of the pharmaceutical compounds, including 17α-ethinylestradiol (EE2), ibuprofen (IBU), atenolol (ATE), were selected as the representative compounds with various functional groups closely related to the ozone reactivity, and para-chlorobenzoic acid (pCBA) was used as a probe chemical for OH radicals (Table 1). Ultrapure water (resistivity > 18 MΩ cm−1) produced by a water purification system (NANOpure Diamond, Barnstead, Dubuque, IA, USA) was utilized to make stock solutions of these trace organic compounds (concentration of each trace organic compound = 1 mM). The buffer solutions were prepared using disodium hydrogen phosphate, potassium dihydrogen phosphate, sodium dihydrogen phosphate, boric acid, sodium hydroxide purchased from Sigma-Aldrich (St. Louis, Missouri, USA) for maintaining the pH of water samples during ozonation experiments (purity > 98%).

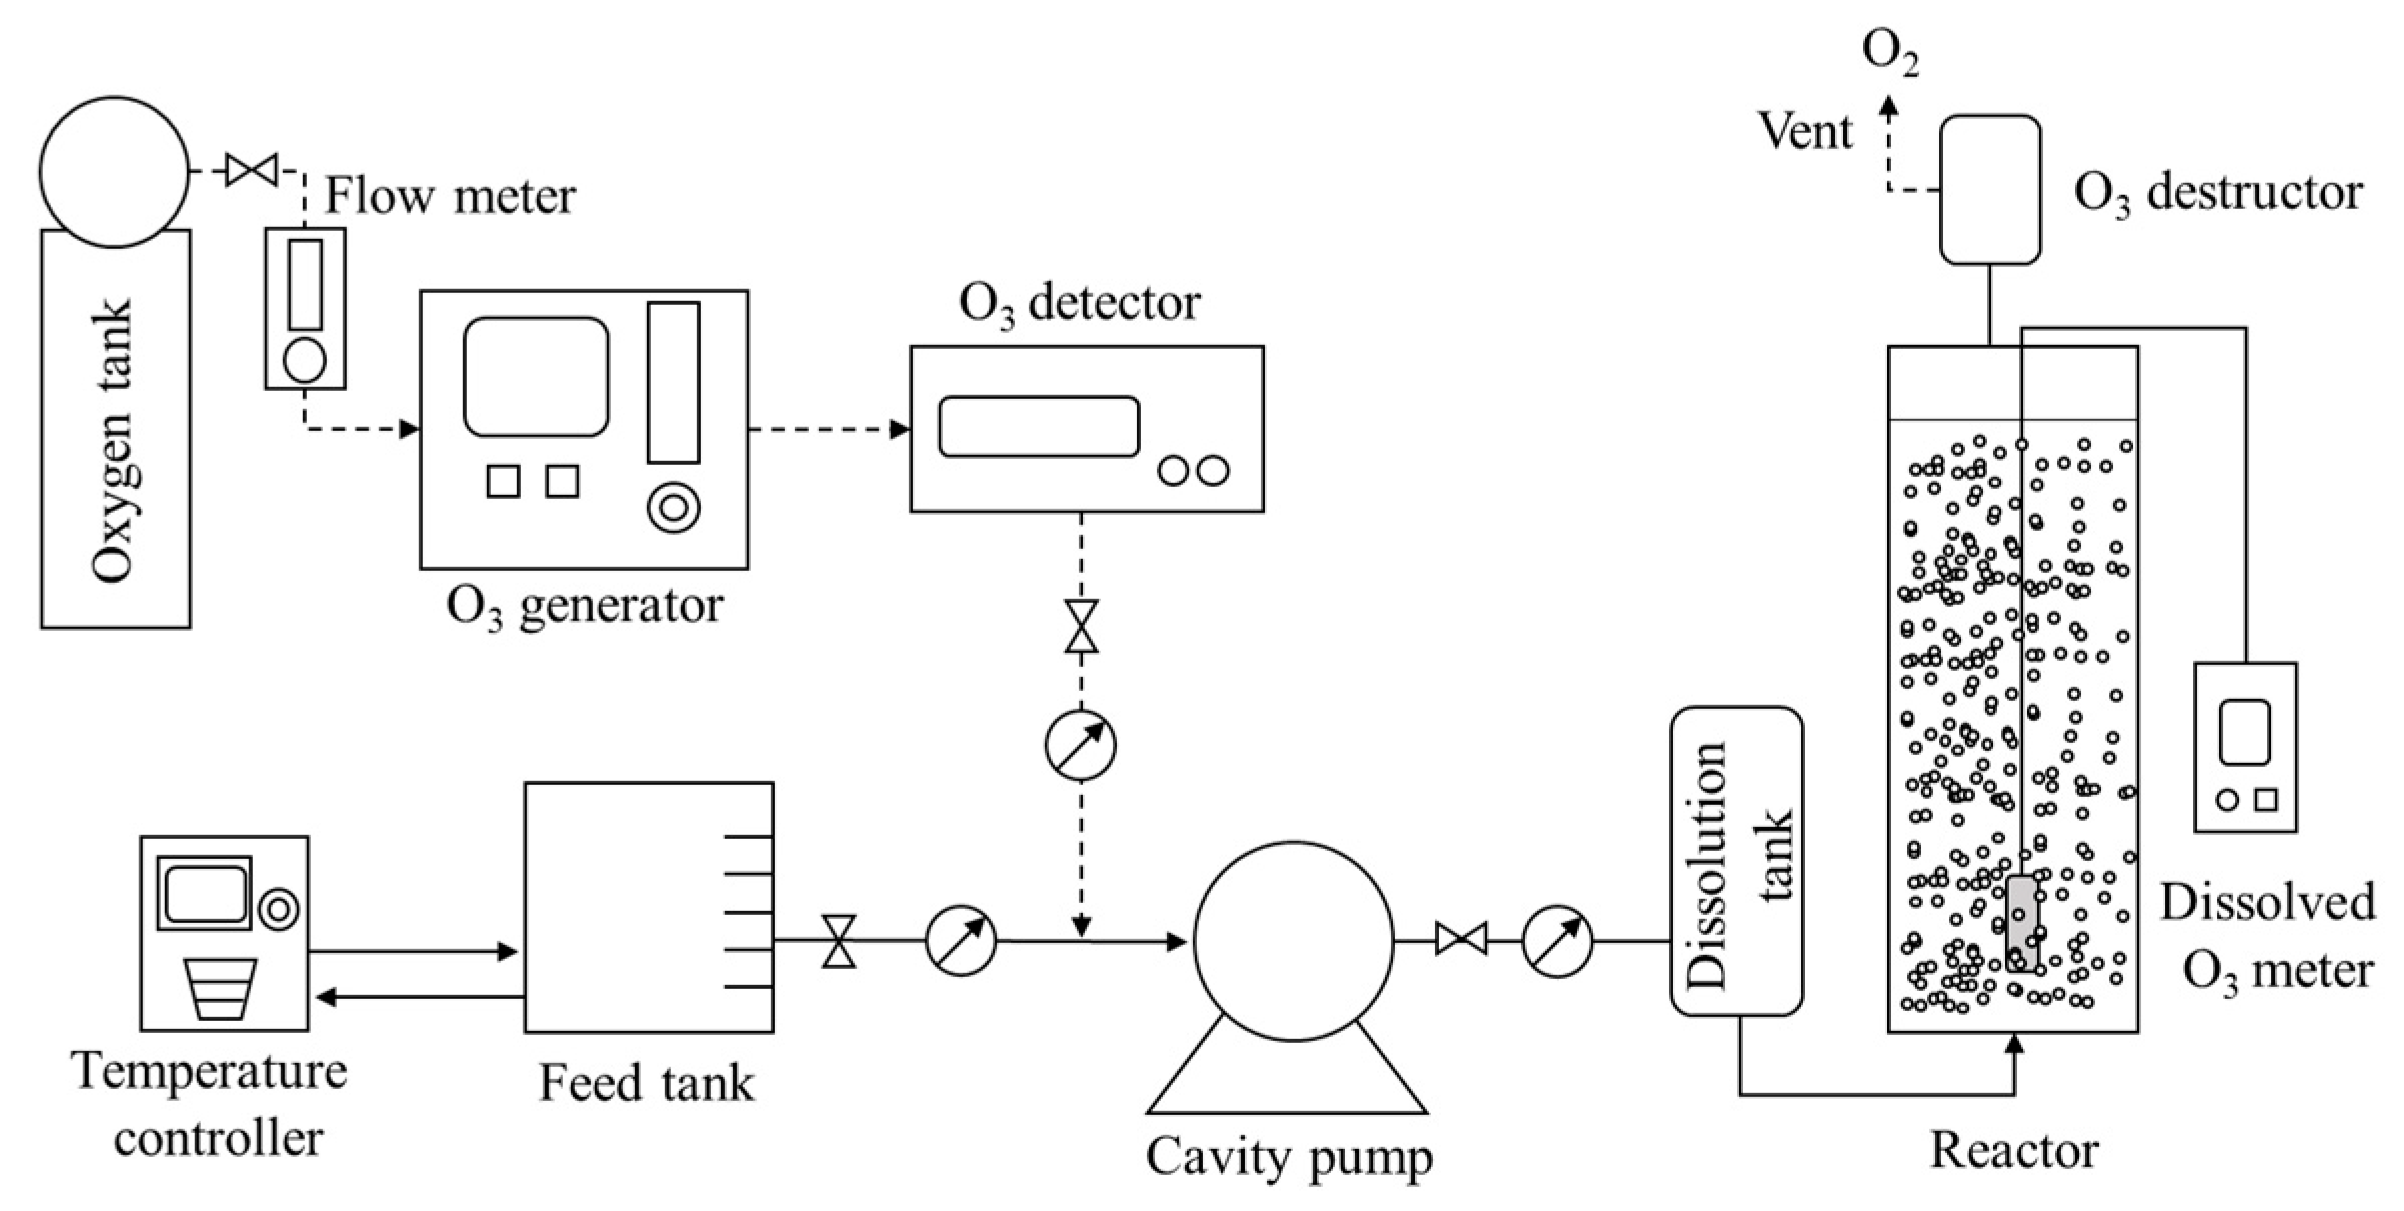
2.2. System Description

Figure 1 exhibits the schematic diagram of a lab-scale microbubble ozonation process consisting of a cavity pump (KTM20ND, Nikuni, Kawasaki, Japan), an O3 generator (the range of 0.17–0.20 mg/s; LAB-01, Ozone Tech, Daejeon, Republic of Korea), an O3 gas detector (OM 2021, Ozone Tech, Daejeon, Republic of Korea), and three reservoirs made of stainless steel for the feed water (effective volume = 20 L), O3 dissolution (effective volume = 4 L), and O3 reaction (effective volume = 10 L). The temperature of feed waters was kept constantly using a temperature controller (Maxircu CR-30, Daihan Scientific, Wonju-si, Gangwon-do, Republic of Korea). The feed water flowed into the cavity pump with O3 gases produced using pure oxygen when the pressure of the cavity pump was lower than –0.04 MPA by a self-suction effect to produce O3 microbubbles. The feed water containing O3 microbubbles was pressurized in the dissolution tank by applying high pressure (Maximum pressure = 0.3 MPa) for increasing the solubilization rate of O3 gases into the feed water, and then O3 microbubbles in the feed water were destructed in the reactor under atmospheric pressure conditions.

2.3. Microbubble Ozonation

The feed water samples spiked with trace organic compounds, including pCBA, EE2, IBU, and ATE (final concentration of each compound = 2.0 μM; reaction volume = 20 L) were fed to the microbubble ozonation process. During the microbubble ozonation process, the size distributions of O3 microbubbles in the aqueous phase were controlled by changing the frequencies of the cavity pump (30–60 Hz). The reduction of the pharmaceutical compounds was investigated under various experimental conditions (temperature: 10–30 °C; pH: 4–10; the concentration of humic acids: 5 mg/L) to compare the efficiencies of the millibubble and microbubble ozonation processes. The feed and ozonated water samples were collected at 0, 60, 120, 180, 240, and 300 s, and all the samples were stored in the refrigerator at 4 °C prior to analyses.

2.4. Analytical Methods

The size distribution and numbers of microbubbles in the aqueous phase were measured by a liquid particle counter (PC3400, Chemtrac, Norcross, GA, USA). The concentration of O3 gas and dissolved O3 in the water samples were determined using the O3 detector and the indigo method (2518025 Ozone Accuvac® Ampules, Hach, Loveland, CO, USA), respectively [27]. The pH of the solutions was measured by a pH meter (OrionTM star A320, Thermo Fisher Scientific, San Jose, CA, USA). The concentrations of pCBA, EE2, IBU, and ATE in the feed and ozonated water samples were analyzed using a UV/Vis spectrophotometer (UV-1280, Shimadzu, Kyoto, Japan) with a 1 cm quartz cuvette (Hellma, Müllheim, Germany) 1 hour after the millibubble and microbubble ozonation processes [8]. To avoid the interferences of the residual O3 in the aqueous phase on the measurements of the pharmaceutical compounds, sodium thiosulphate pentahydrate (Na2S2O3·5H2O; Sigma-Aldrich, St. Louis, Missouri, USA) was used as an O3 quenching reagent. The corresponding calibration plots of the trace organic compounds were linear over the range of 0.1 Μm–2.0 μM (R2 values at pH 7 and 20 °C: pCBA = 0.9994, EE2 = 0.9992, IBU = 0.9991; ATE = 0.9993), as shown in Figure 2.

3. Results and Discussion

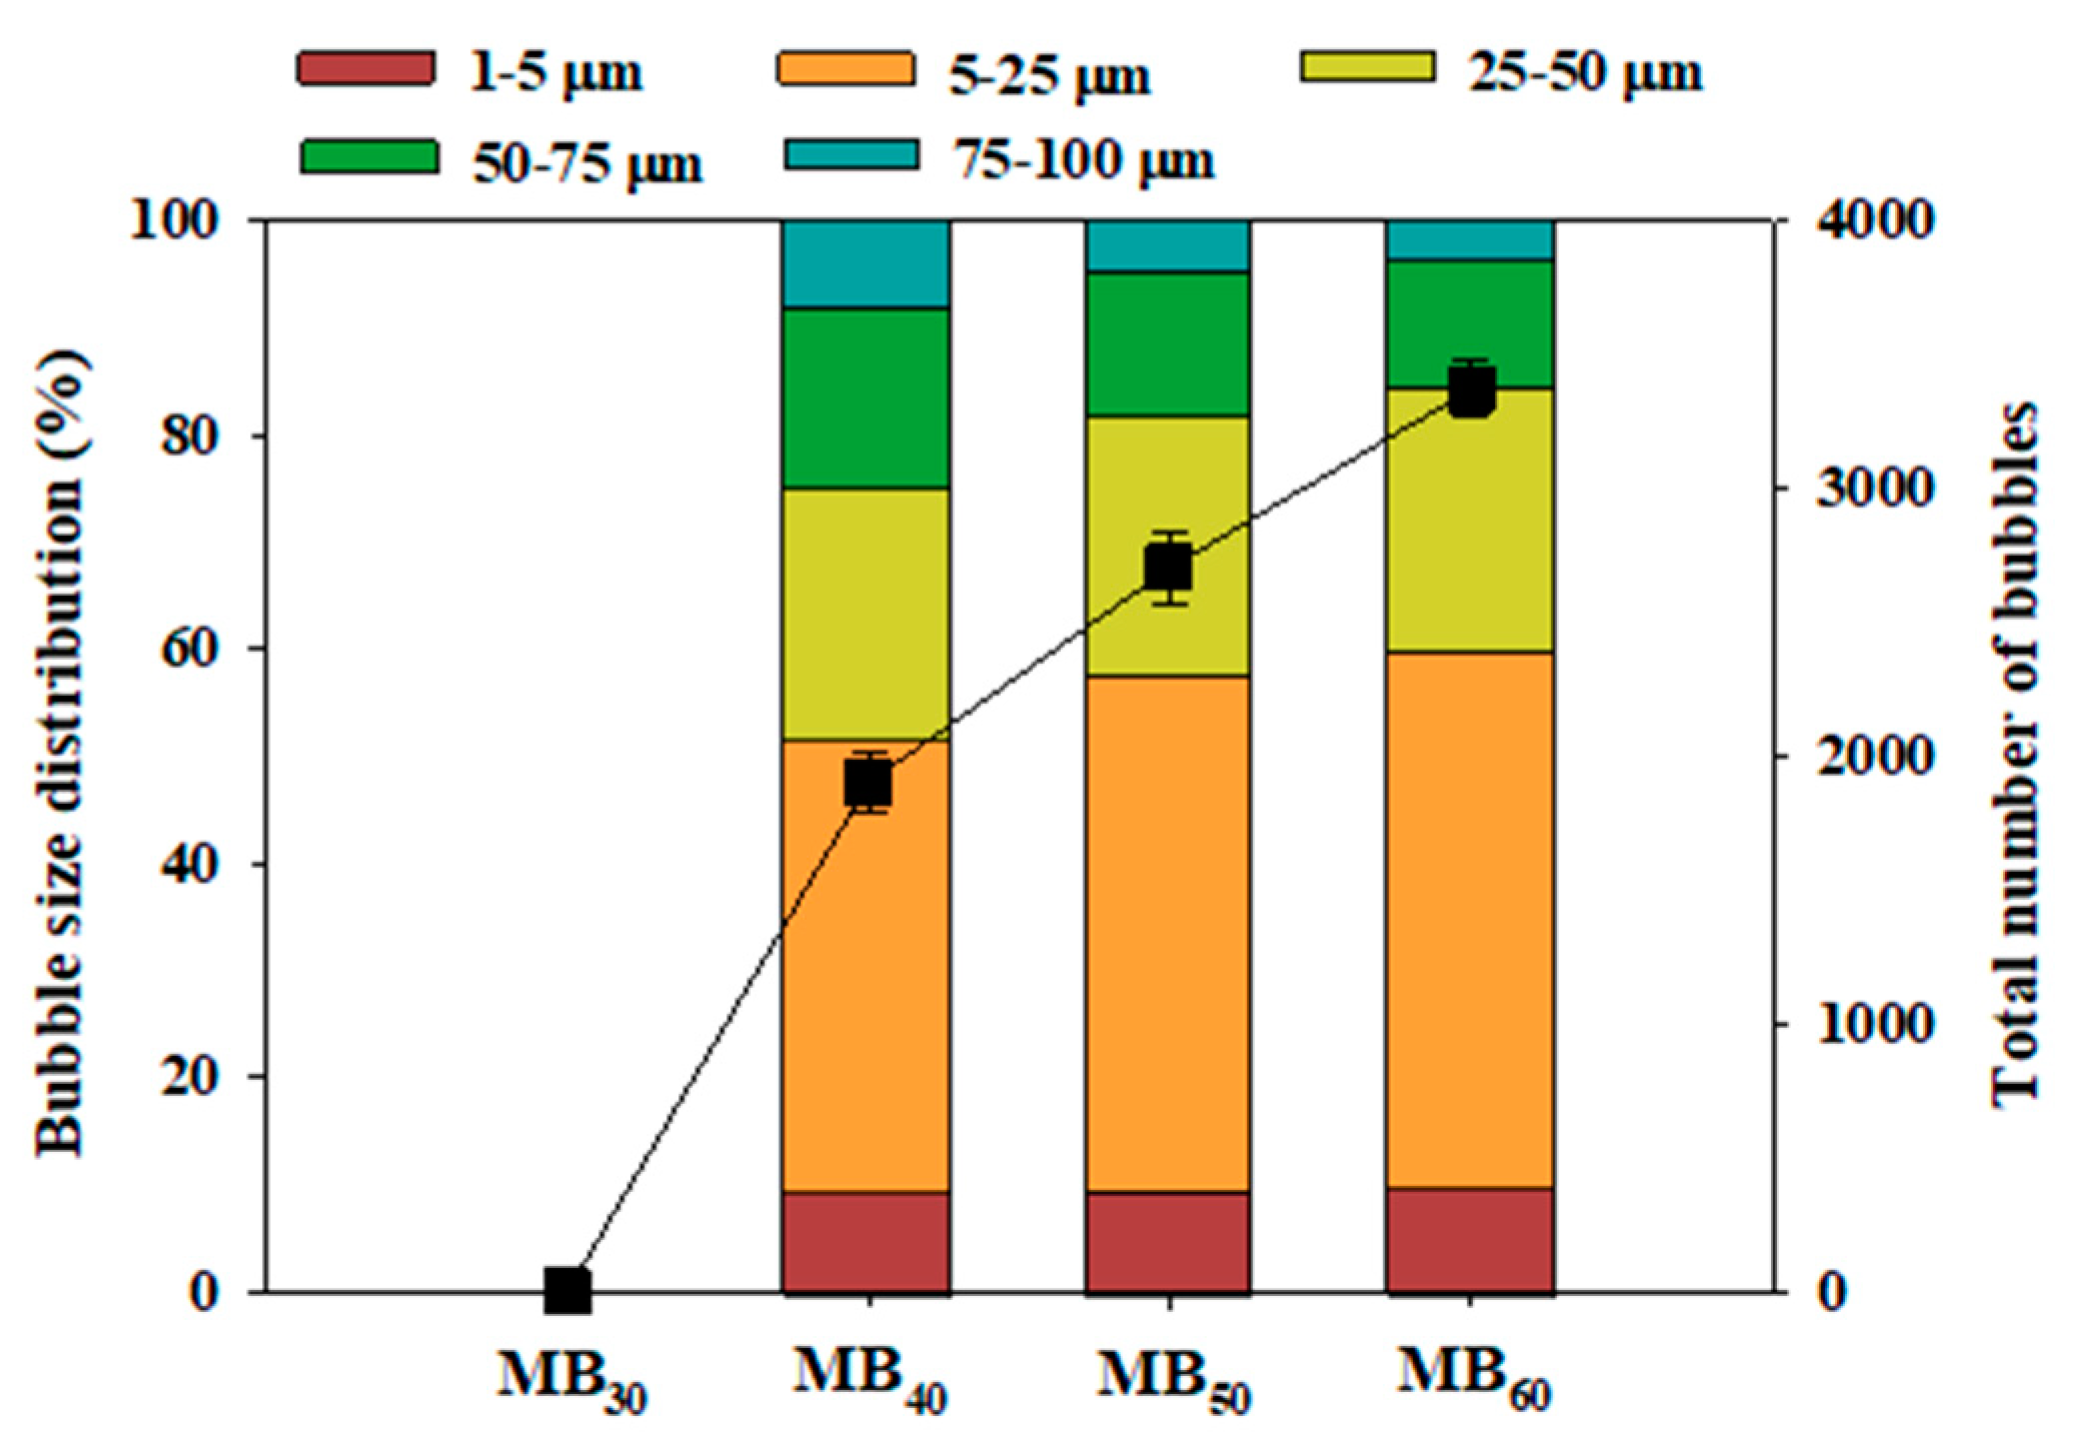
3.1. Size Distribution of Microbubbles

The size distribution and the total numbers of microbubbles as a function of the cavity pump frequency (30–60 Hz) are illustrated in Figure 3. In the tested microbubble ozonation process, the generation of microbubbles was not detected at the cavity pump frequency of 30 Hz, whereas microbubbles seemed to generated stably when the cavity pump frequency was higher than 40 Hz (the total numbers of microbubbles at 40 Hz = 1901; the total numbers of microbubbles at 50 Hz = 2702; the total numbers of microbubbles at 60 Hz = 3368). For the tested frequency range of 40–60 Hz, the size of the microbubbles ranged commonly from 5 to 25 μm. The proportions of microbubbles having diameters of less than 25 μm were significantly increased when the cavity pump frequency was increased: (a) 40 Hz: 1–5 μm = 9.6%, 5–25 μm = 41.8%, 25–50 μm = 23.5%, 50–75 μm = 16.8%, 75–100 μm = 8.3%, (b) 50 Hz: 1–5 μm = 9.8%, 5–25 μm = 47.7%, 25–50 μm = 24.0%, 50–75 μm = 13.5%, 75–100 μm = 5.0%, and (c) 60 Hz: 1–5 μm = 9.9%, 5–25 μm = 50.0%, 25–50 μm = 24.3%, 50–75 μm = 11.8%, 75–100 μm = 4.0%). These results indicated that the size distribution of microbubbles is highly dependent on the swirl speed of the cavity pump [28].

3.2. Bubble Size Effects on Solubilization Rate of O3 and OH Radicals

Figure 4 represents the changes in the solubilization rate of O3 and OH radicals in the aqueous phase depending on the size distribution of O3 microbubbles. As shown in Figure 4a, dissolved O3 was not detected for only the microbubble treated water at the cavity pump frequency of 60 Hz (MB60) and the concentration of dissolved O3 in the ozonated waters was gradually increased with increasing the the cavity pump frequency (millibubble ozonation at 30 Hz (O3) = 0.50 mg L−1; microbubble ozonation at 40 Hz (O3-MB40) = 0.64 mg L−1; microbubble ozonation at 50 Hz (O3-MB50) = 0.88 mg L−1; microbubble ozonation at 60 Hz (O3-MB60) = 1.67 mg L−1). The possible explanation for this observation is that the higher specific area (surface area per volume) of O3 microbubbles with smaller diameters (1–25 μm) compared to O3 millibubbles can enhance the dissolution of gaseous O3 molecules into the aqueous phase [29]. The size effects of O3 microbubbles on the solubilization rate of OH radicals were examined using pCBA (Figure 4b). Similarly to the trends in the solubilization rate of O3, the relative residual concentrations (C/C0) of pCBA were rapidly decreased with increasing the cavity pump frequency (MB60 = 1.00; O3 = 0.93; O3-MB40 = 0.89; O3-MB50 = 0.85; O3-MB60 = 0.60). Based on these observations, it can be concluded that the increased specific area of O3 microbubbles plays a critical role in the mass transfer of OH radicals at the gas–water interface [30,31]. As there were no noticeable changes in the relative residual concentration (C/C0) of pCBA for the microbubble treated water, it is evident that OH radicals cannot be produced by collapsing microbubbles without O3 at the neutral condition (pH 7). In contrast to the current study, it has been previously reported that OH radicals can be generated during the destruction of microbubbles without O3 at the acidic condition [30].

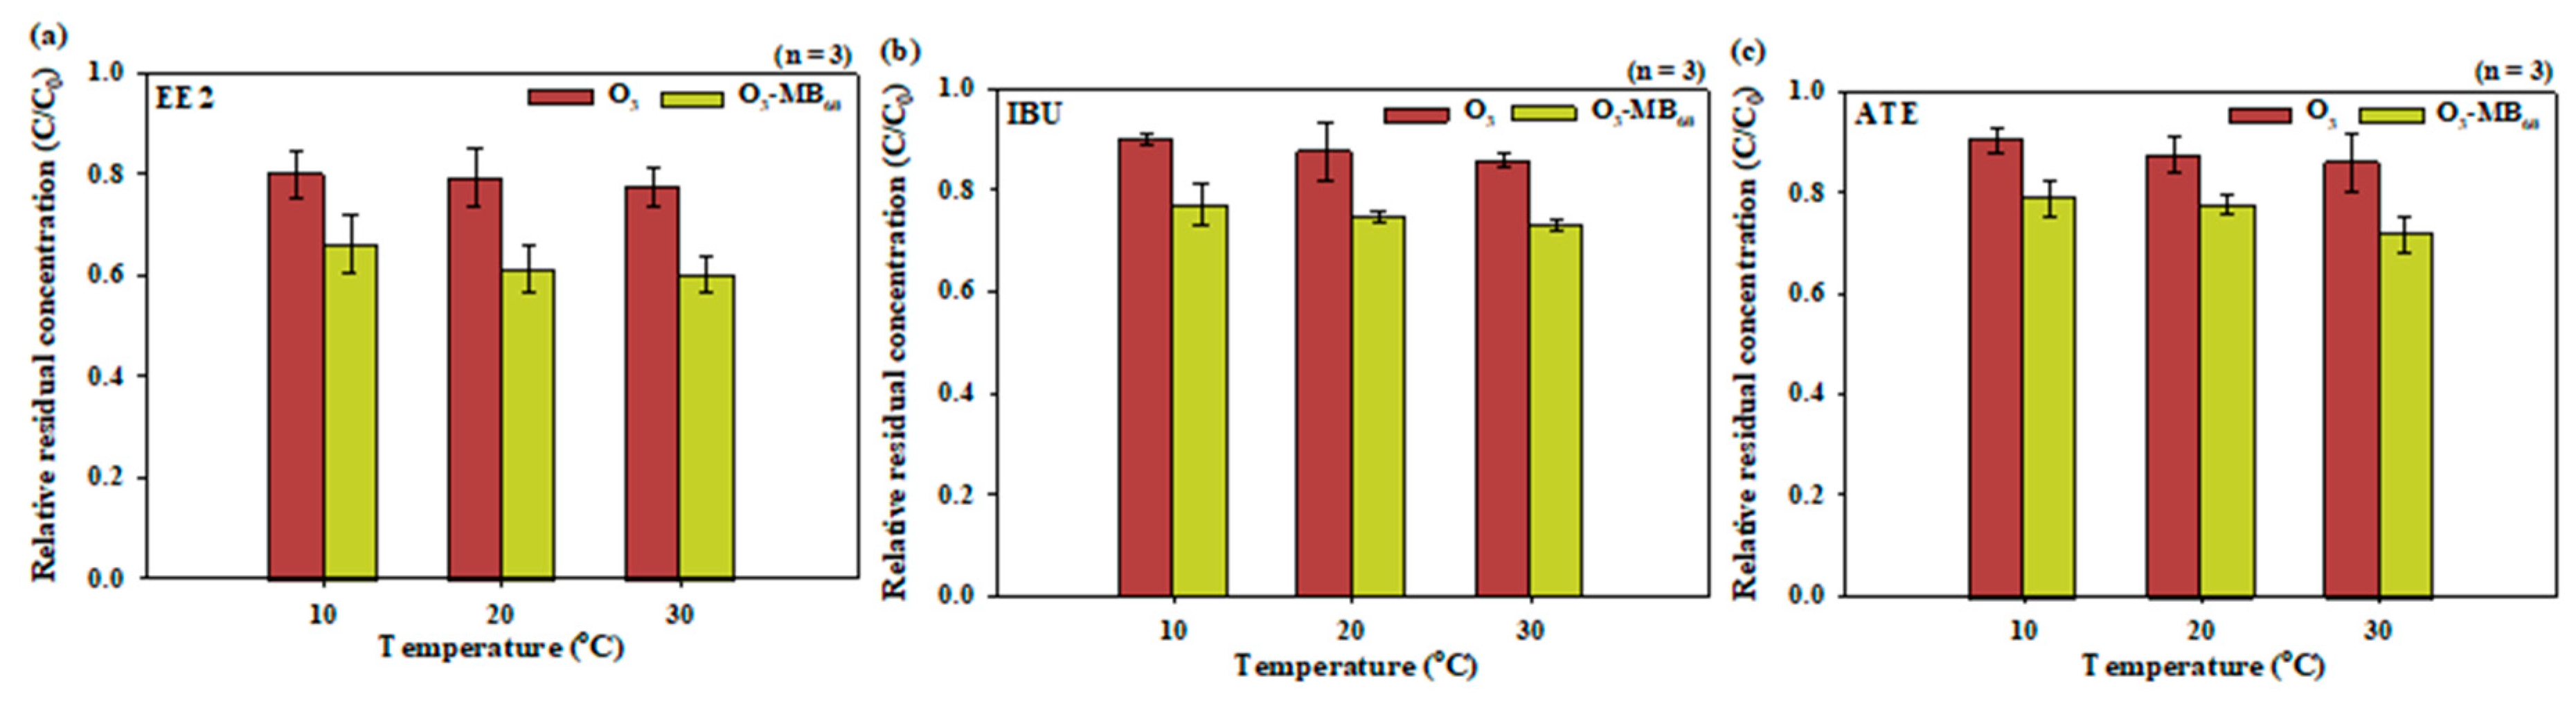
3.3. Effects of Temperature on Degradation of the Pharmaceutical Compounds

The relative residual concentrations (C/C0) of the selected pharmaceutical compounds, including EE2 (phenol), IBU (alkyl aromatic), and ATE (secondary amine), in the millibubble and microbubble ozonated waters under different temperature conditions (10–30 °C) are illustrated in Figure 5. Although the solubilization rate of O3 and OH radicals in the aqueous phase was decreased with increasing the temperature of the solutions (the concentration of dissolved O3 during millibubble ozonation: 0.65 mg/L at 10 °C, 0.50 mg/L at 20 °C, 0.40 mg/L at 30 °C; the concentration of dissolved O3 during microbubble ozonation: 2.16 mg/L at 10 °C, 1.67 mg/L at 20 °C, 1.32 mg/L at 30 °C), the relative residual concentrations (C/C0) of EE2, IBU, and ATE were gradually reduced during both millibubble (C/C0 at 10 °C: EE2 = 0.80, IBU = 0.90; ATE = 0.90; C/C0 at 20 °C: EE2 = 0.79, IBU = 0.88; ATE = 0.87; C/C0 at 30 °C: EE2 = 0.78, IBU = 0.86; ATE = 0.86) and microbubble ozonation processes (C/C0 at 10 °C: EE2 = 0.66, IBU = 0.77; ATE = 0.79; C/C0 at 20 °C: EE2 = 0.61, IBU = 0.75, ATE = 0.77; C/C0 at 30 °C: EE2 = 0.60, IBU = 0.73, ATE = 0.71) as the increase of the temperature could elevate the reactivity of O3 with the pharmaceutical compounds [32]. This phenomenon was much more significant for the microbubble ozonated waters than the millibubble ozonated waters, which was probably due to the fact that the increased concentrations of O3 and OH radicals in the microbubble ozonated waters might strongly enhance the ozonation efficiency of the pharmaceutical compounds [29,30,31]. In the tested temperature range of 10–30 °C, EE2 was found to be most reactive with O3 because it included a phenolic moiety. Furthermore, an intermediate reactivity with O3 was found for ATE containing a secondary amine moiety, and IBU showed the highest relative residual concentration because of its alkyl aromatic moiety, which is less reactive with O3 [8]. These observations implied that the degradation of the pharmaceutical compounds during the millibubble and microbubble ozonation processes were strongly influenced by both the solubilization rate and the reactivity of O3 and OH radicals with the pharmaceuticals.

3.4. Effects of pH on the Degradation of Pharmaceutical Compounds

The variations in the relative residual concentrations (C/C0) of the pharmaceutical compounds during the millibubble and microbubble ozonation processes as a function of the pH of the solutions are depicted in Figure 6. In general, the reactivity of the pharmaceutical compounds with O3 strongly depended on their pKa values (EE2 = 10.4; IBU = 4.9; ATE = 9.6) [23,24,25,26]. Therefore, the relative residual concentrations of EE2 and ATE were proportionally reduced with increasing the pH of the solutions during the millibubble (C/C0 at pH 4: EE2 = 0.80; ATE = 0.89; C/C0 at pH 7: EE2 = 0.79; ATE = 0.87; C/C0 at pH 10: EE2 = 0.73; ATE = 0.79) and microbubble ozonation processes (C/C0 at pH 4: EE2 = 0.64, ATE = 0.79; C/C0 at pH 7: EE2 = 0.61, ATE = 0.77; C/C0 at pH 10: EE2 = 0.55, ATE = 0.63). These observations could be explained by the higher reactivity of the deprotonated phenolic and secondary amine moieties with O3 compared to the non-deprotonated phenolic and secondary amine moieties [33]. In the case of IBU, its relative residual concentration in the millibubble ozonated and microbubble ozonated waters was gradually increased with increasing the pH of the solutions (C/C0 of IBU in the millibubble ozonated water: pH 4 = 0.85, pH 7 = 0.88, pH 10 = 0.92; C/C0 of IBU in the microbubble ozonated water: pH 4 = 0.72, pH 7 = 0.74, pH 10 = 0.80). These results might be attributed to the accelerated decomposition of O3 in the aqueous phase at a higher pH value, which was intimately associated with the reduction of IBU [33]. The increased degradation of IBU containing an alkyl aromatic moiety, which is not reactive with O3 over the tested pH range of 4–10 in the microbubble ozonated waters (C/C0 of IBU = 0.72–0.80) compared to other millibubble ozonated waters (C/C0 of IBU = 0.85–0.92), supported the assumption that the increased concentrations of O3 and OH radicals by collapsing O3 microbubbles greatly facilitated the abatement of the pharmaceutical compounds [15,29,31].

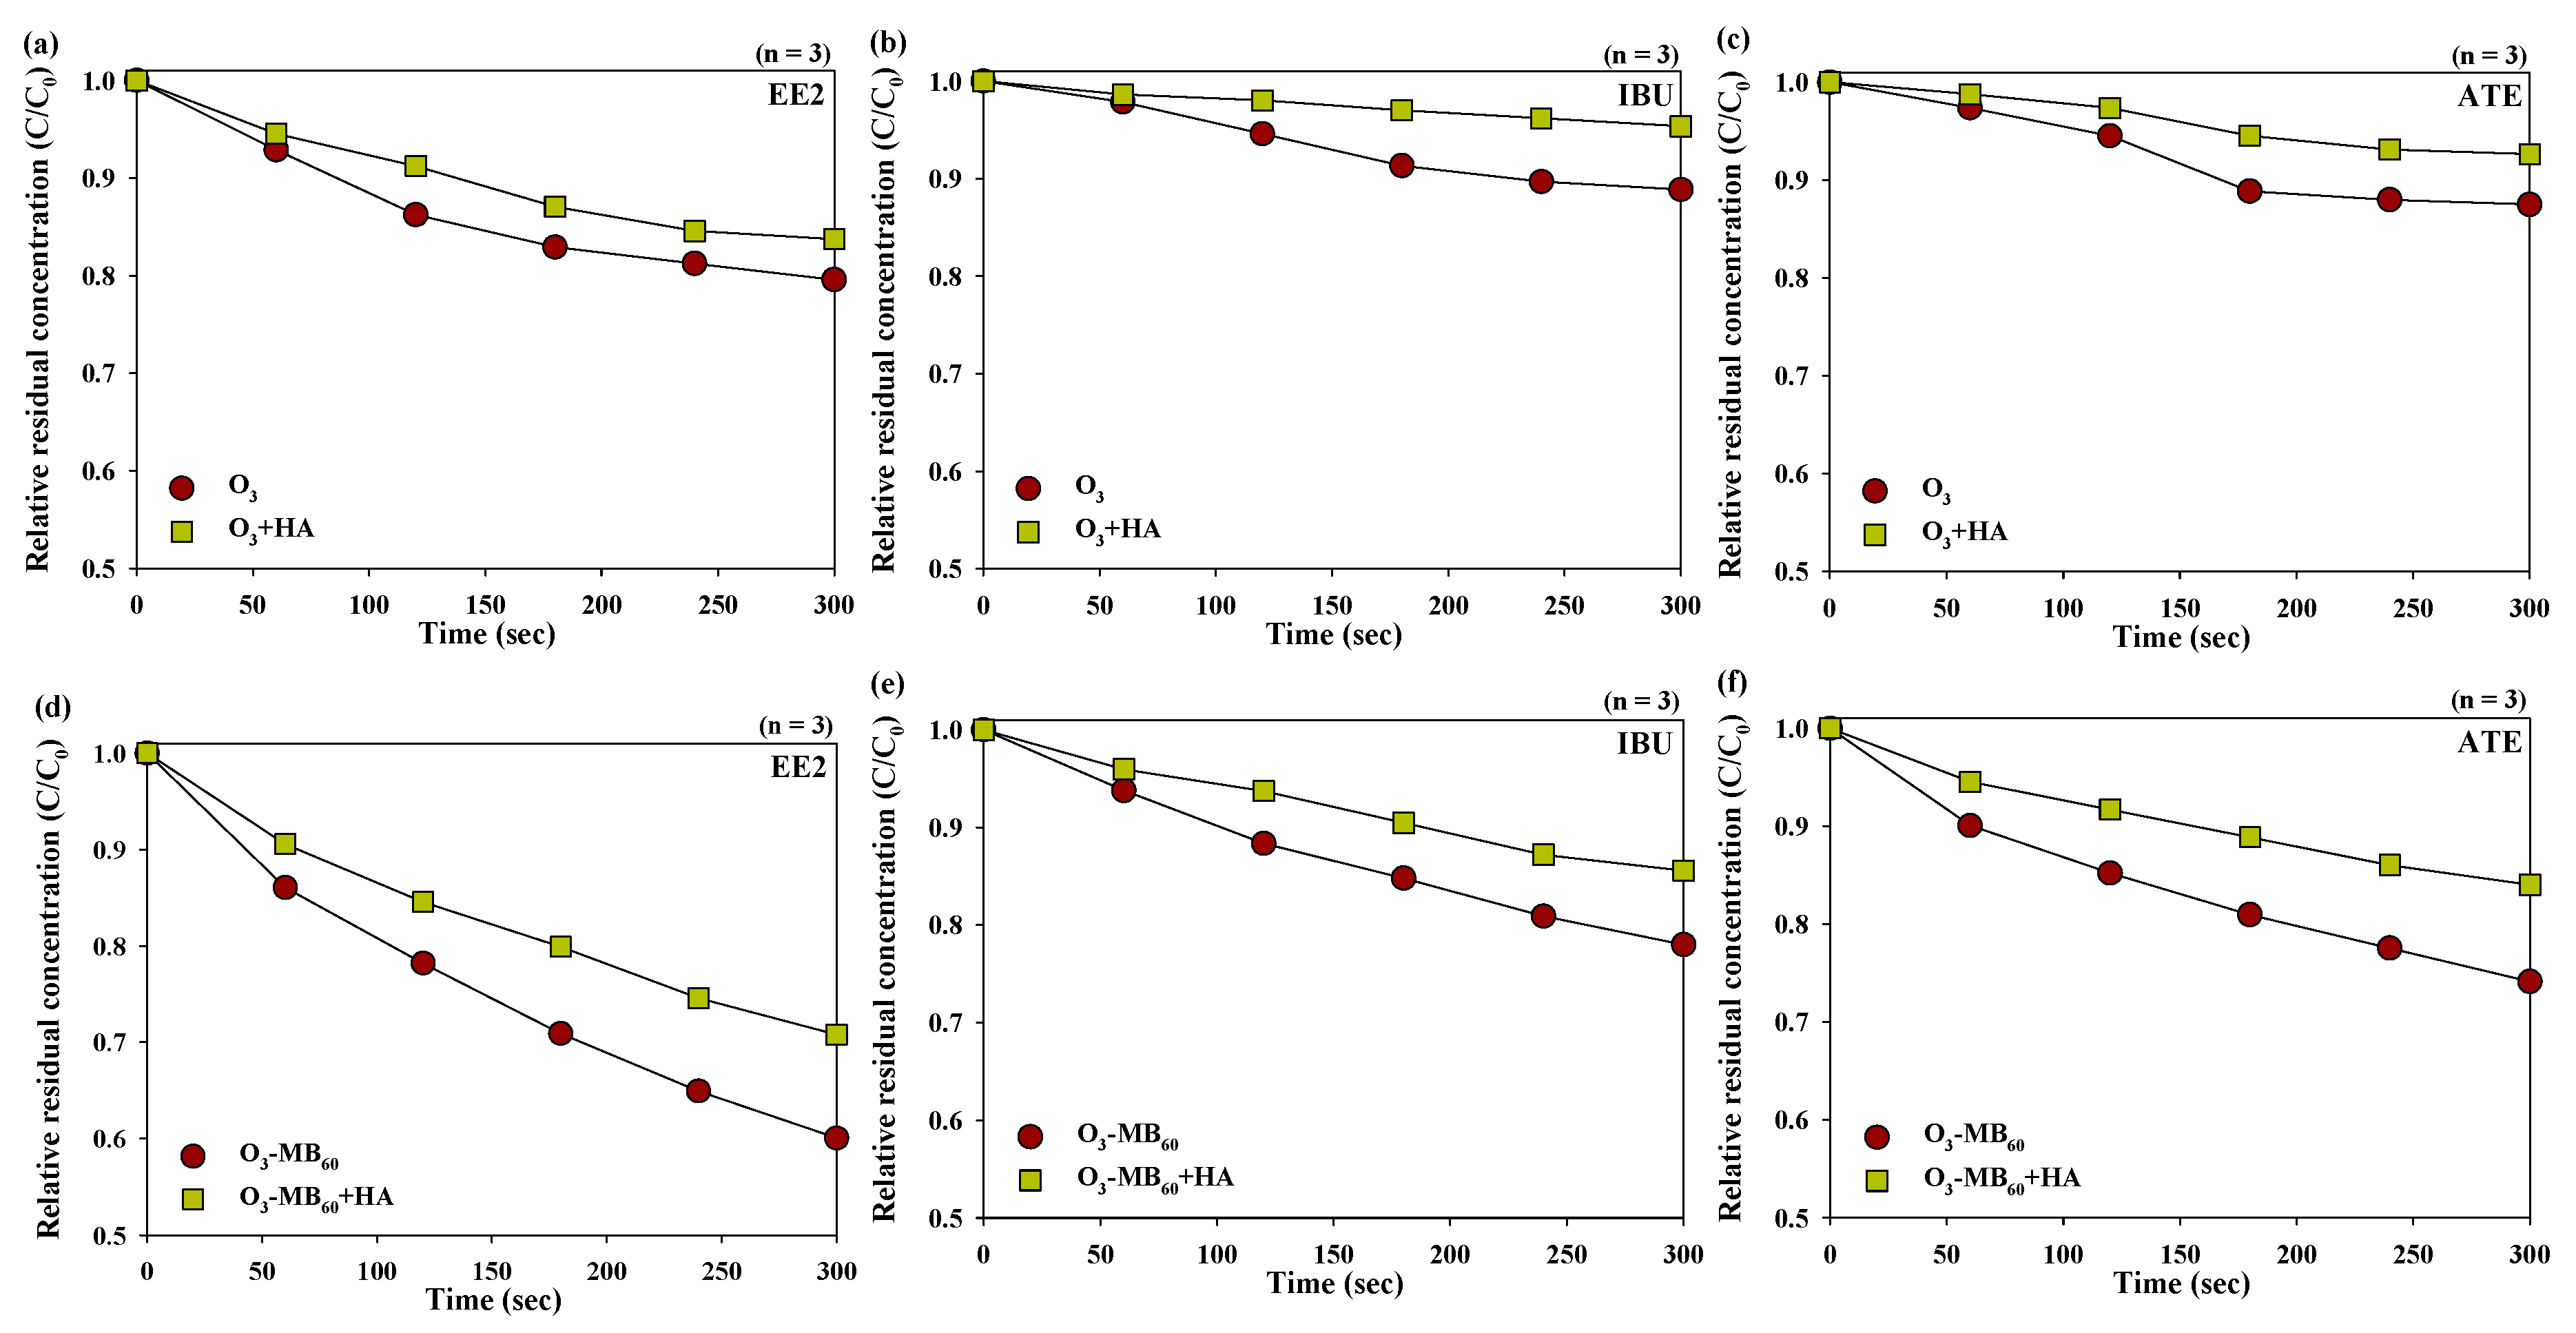
3.5. Effects of Humic Acids on the Degradation of Pharmaceutical Compounds

The inferences on humic acids on the abatement of the pharmaceutical compounds during the millibubble and microbubble ozonation processes are compared in Figure 7. The relative residual concentrations of (C/C0) of EE2, IBU, and ATE in the millibubble and microbubble ozonated waters were gradually decreased with increasing the exposure time to O3 neither without nor with humic acids since the reduction of organic compounds was directly proportional to the oxidant exposure (the time-dependent oxidant concentrations integrated over the reaction time) [34]. In the presence of humic acids, a considerable decrease in the degradation of the pharmaceutical compounds was found for either the millibubble (C/C0 without humic acids after 300 seconds: EE2 = 0.80, IBU = 0.89, ATE = 0.88; C/C0 with humic acids after 300 seconds: EE2 = 0.84, IBU = 0.95, ATE = 0.93) or microbubble ozonated waters (C/C0 without humic acids after 300 seconds: EE2 = 0.60, IBU = 0.78, ATE = 0.74; C/C0 with humic acids after 300 seconds: EE2 = 0.71, IBU = 0.86, ATE = 0.84). Despite of the higher degradation efficiency of EE2 and ATE during the microbubble ozonation process, the disturbance of humic acids on the decrease of the pharmaceutical compounds was more pronounced for the microbubble ozonated waters (the difference between the relative residual concentrations (∆C/C0) of EE2 without and with humic acids after 300 seconds = 0.11; ∆C/C0 of ATE without and with humic acids after 300 seconds = 0.10) than the millibubble ozonated waters (∆C/C0 of EE2 without and with humic acids after 300 seconds = 0.04; ∆C/C0 of ATE without and with humic acids after 300 seconds = 0.05) because of the phenolic moieties ubiquitous in humic acids, which might react readily with dissolved O3 and OH radicals during the microbubble ozonation processes [35,36]. A similar behavior has been previously found for the oxidative treatment of dissolved organic matter with Cl2, and ClO2 [27,37]. Compared to EE2 and ATE, the interference effects of humic acids on the degradation of IBU during the microbubble ozonation process (∆C/C0 of IBU without and with humic acids after 300 seconds = 0.07) were not significantly different from those on the abatement of IBU during the millibubble ozonation process (∆C/C0 of IBU without and with humic acids after 300 seconds = 0.05) since the reaction of the phenolic moiety in humic acids with O3 could produce O3, which was readily decomposed to OH radicals in association with the decrease of IBU [33,38]. The enhanced degradation efficiency of the pharmaceutical compounds in the microbubble ozonated waters is evidence that the microbubble ozonation process is considered to be a promising option as an alternative to the conventional ozonation processes for the reduction of the pharmaceutical compounds.

4. Conclusions

In this study, the potential of the microbubble ozonation process for the abatement of the pharmaceutical compounds was evaluated and compared to the conventional ozonation process (i.e., millibubble ozonation) to provide deeper insights into the degradation behavior of the pharmaceutical compounds during the microbubble ozonation processes. The major outcomes are:
  • The fractions of microbubbles whose diameters ranged from 1–25 μm gradually increased with increasing the cavity pump frequency (40 Hz: 51.4%; 50 Hz: 57.5%; 60 Hz: 59.9%).
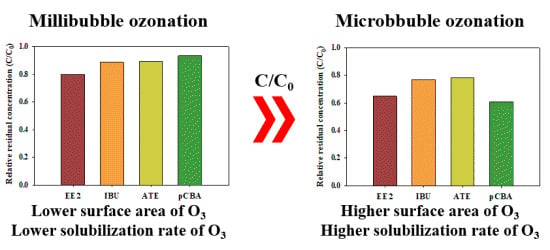
  • The increase of the solubilization rate of O3 and OH radicals induced by their elevated mass transfer at the gas–water interface through the destruction of O3 microbubbles with the higher specific area than O3 millibubbles might substantially improve the degradation of the pharmaceutical compounds.
  • Both the solubilization rate and the reactivity of O3 and OH radicals provided strong effects on the degradation of the pharmaceutical compounds during the millibubble and microbubble ozonation processes over the temperature range of 10–30 °C.
  • The changes in the degradation of pharmaceutical compounds depending on the pH of the solution and the presence of humic acids were much more pronounced for the microbubble ozonated waters than the millibubble ozonated waters.
  • The facilitatory and inhibitory effects of humic acids on the degradation of the pharmaceutical compounds were more significant in the microbubble ozonated waters compared to the millibubble ozonated waters.

Author Contributions

Conceptualization, Y.-G.L., K.C.; methodology, Y.-G.L., K.C.; validation, Y.-G.L., Y.K., Y.P., K.C.; formal analysis, Y.-G.L.; investigation, Y.-G.L.; resources, Y.-G.L.; data curation, Y.-G.L., K.C.; writing—original draft preparation, Y.-G.L.; writing—review and editing, K.C.; supervision, K.C.; funding acquisition, G.L.

Funding

This research was funded by the Korea Ministry of Environment as “Global Top Project” ((Project (R&D Center for Advanced Technology of wastewater Treatment and Reuse) No.: 2016002210002)).

Acknowledgments

This subject was supported by the Korea Ministry of Environment as “Global Top Project” ((Project (R&D Center for Advanced Technology of wastewater Treatment and Reuse) No.: 2016002210002)).

Conflicts of Interest

The authors declare no conflict of interest.

References

  1. Bolong, N.; Ismail, A.F.; Salim, M.R.; Matsuura, T. A review of the effects of emerging contaminants in wastewater and options for their removal. Desalination 2009, 239, 229–246. [Google Scholar] [CrossRef]
  2. Luo, Y.; Guo, W.; Ngo, H.H.; Nghiem, L.D.; Hai, F.I.; Zhang, J.; Liang, S.; Wang, X.C. A review on the occurrence of micropollutants in the aquatic environment and their fate and removal during wastewater treatment. Sci. Total Environ. 2014, 473, 619–641. [Google Scholar] [CrossRef] [PubMed]
  3. Kim, M.K.; Zoh, K.D. Occurrence and removals of micropollutants in water environment. Environ. Eng. Res. 2016, 21, 319–332. [Google Scholar] [CrossRef]
  4. Onesios, K.M.; Jim, T.Y.; Bouwer, E.J. Biodegradation and removal of pharmaceuticals and personal care products in treatment systems: A review. Biodegradation 2009, 20, 441–466. [Google Scholar] [CrossRef]
  5. Verlicchi, P.; Al Aukidy, M.; Zambello, E. Occurrence of pharmaceutical compounds in urban wastewater: Removal, mass load and environmental risk after a secondary treatment—A review. Sci. Total Environ. 2012, 429, 123–155. [Google Scholar] [CrossRef]
  6. Li, W.C. Occurrence, sources, and fate of pharmaceuticals in aquatic environment and soil. Environ. Pollut. 2014, 187, 193–201. [Google Scholar] [CrossRef]
  7. Barbosa, M.O.; Moreira, N.F.F.; Ribeiro, A.R.; Pereira, M.F.R.; Silva, A.M.T. Occurrence and removal of organic micropollutants: An overview of the watch list of eu decision 2015/495. Water Res. 2016, 94, 257–279. [Google Scholar] [CrossRef]
  8. Chon, K.; Salhi, E.; von Gunten, U. Combination of uv absorbance and electron donating capacity to assess degradation of micropollutants and formation of bromate during ozonation of wastewater effluents. Water Res. 2015, 81, 388–397. [Google Scholar] [CrossRef]
  9. Wang, K.; Liu, S.; Zhang, Q.; He, Y. Pharmaceutical wastewater treatment by internal micro-electrolysis-coagulation, biological treatment and activated carbon adsorption. Environ. Technol. 2009, 30, 1469–1474. [Google Scholar] [CrossRef]
  10. Ikehata, K.; Jodeiri Naghashkar, N.; Gamal El-Din, M. Degradation of aqueous pharmaceuticals by ozonation and advanced oxidation processes: A review. Ozone: Sci. Eng. 2006, 28, 353–414. [Google Scholar] [CrossRef]
  11. Rosal, R.; Rodríguez, A.; Perdigón-Melón, J.A.; Petre, A.; García-Calvo, E.; Gómez, M.J.; Agüera, A.; Fernández-Alba, A.R. Occurrence of emerging pollutants in urban wastewater and their removal through biological treatment followed by ozonation. Water Res. 2010, 44, 578–588. [Google Scholar] [CrossRef] [PubMed]
  12. Von Gunten, U. Ozonation of drinking water: Part ii. Disinfection and by-product formation in presence of bromide, iodide or chlorine. Water Res. 2003, 37, 1469–1487. [Google Scholar] [CrossRef]
  13. Miyamoto, H.; Yampolski, Y.; Young, C.L. Iupac-nist solubility data series. 103. Oxygen and ozone in water, aqueous solutions, and organic liquids (supplement to solubility data series volume 7). J. Phys. Chem. Ref. Data 2014, 43, 033102. [Google Scholar] [CrossRef]
  14. Azuma, T.; Otomo, K.; Kunitou, M.; Shimizu, M.; Hosomaru, K.; Mikata, S.; Mino, Y.; Hayashi, T. Removal of pharmaceuticals in water by introduction of ozonated microbubbles. Sep. Purif. Technol. 2019, 212, 483–489. [Google Scholar] [CrossRef]
  15. ISO 20480–1:2017 Fine Bubble Technology-General principles for usage and measurement of fine bubbles- Part 1: Terminology 2017. Available online: https://www.iso.org/obp/ui/#iso:std:iso:20480:-1:ed-1:v1:en (accessed on 5 November 2019).
  16. Jabesa, A.; Ghosh, P. Removal of diethyl phthalate from water by ozone microbubbles in a pilot plant. J. Environ. Manag. 2016, 180, 476–484. [Google Scholar] [CrossRef] [PubMed]
  17. Katsoyiannis, I.A.; Canonica, S.; von Gunten, U. Efficiency and energy requirements for the transformation of organic micropollutants by ozone, o3/h2o2 and uv/h2o2. Water Res. 2011, 45, 3811–3822. [Google Scholar] [CrossRef]
  18. Chu, L.B.; Xing, X.H.; Yu, A.F.; Sun, X.L.; Jurcik, B. Enhanced treatment of practical textile wastewater by microbubble ozonation. Process. Saf. Environ. Prot. 2008, 86, 389–393. [Google Scholar] [CrossRef]
  19. Li, P.; Takahashi, M.; Chiba, K. Degradation of phenol by the collapse of microbubbles. Chemosphere 2009, 75, 1371–1375. [Google Scholar] [CrossRef]
  20. Oppenländer, T. Photochemical Purification of Water and Air: Advanced Oxidation Processes (Aops)-Principles, Reaction Mechanisms Reactor Concepts; John Wiley & Sons: Hoboken, NJ, USA, 2007. [Google Scholar]
  21. Chu, L.B.; Yan, S.T.; Xing, X.H.; Yu, A.F.; Sun, X.L.; Jurcik, B. Enhanced sludge solubilization by microbubble ozonation. Chemosphere 2008, 72, 205–212. [Google Scholar] [CrossRef]
  22. Ikeura, H.; Kobayashi, F.; Tamaki, M. Removal of residual pesticides in vegetables using ozone microbubbles. J. Hazard. Mater. 2011, 186, 956–959. [Google Scholar] [CrossRef]
  23. Lee, Y.; von Gunten, U. Oxidative transformation of micropollutants during municipal wastewater treatment: Comparison of kinetic aspects of selective (chlorine, chlorine dioxide, ferratevi, and ozone) and non-selective oxidants (hydroxyl radical). Water Res. 2010, 44, 555–566. [Google Scholar] [CrossRef] [PubMed]
  24. Tabei, K.; Haruyama, S.; Yamaguchi, S.; Shirai, H.; Takakusagi, F. Study of micro bubble generation by a swirl jet. J. Environ. Eng. 2007, 2, 172–182. [Google Scholar] [CrossRef]
  25. Ushikubo, F.Y.; Furukawa, T.; Nakagawa, R.; Enari, M.; Makino, Y.; Kawagoe, Y.; Shiina, T.; Oshita, S. Evidence of the existence and the stability of nano-bubbles in water. Colloids Surf. A: Physicochem. Eng. Asp. 2010, 361, 31–37. [Google Scholar] [CrossRef]
  26. Takahashi, M.; Chiba, K.; Li, P. Formation of hydroxyl radicals by collapsing ozone microbubbles under strongly acidic conditions. J. Phys. Chem. B 2007, 111, 11443–11446. [Google Scholar] [CrossRef]
  27. Khuntia, S.; Majumder, S.K.; Ghosh, P. Quantitative prediction of generation of hydroxyl radicals from ozone microbubbles. Chem. Eng. Res. Des. 2015, 98, 231–239. [Google Scholar] [CrossRef]
  28. Ifelebuegu, A.O.; Onubogu, J.; Joyce, E.; Mason, T. Sonochemical degradation of endocrine disrupting chemicals 17β-estradiol and 17α-ethinylestradiol in water and wastewater. Int. J. Environ. Sci. Technol. 2014, 11, 1–8. [Google Scholar] [CrossRef]
  29. Huber, M.M.; Canonica, S.; Park, G.-Y.; von Gunten, U. Oxidation of pharmaceuticals during ozonation and advanced oxidation processes. Environ. Sci. Technol. 2003, 37, 1016–1024. [Google Scholar] [CrossRef]
  30. Huber, M.M.; Ternes, T.A.; von Gunten, U. Removal of estrogenic activity and formation of oxidation products during ozonation of 17α-ethinylestradiol. Environ. Sci. Technol. 2004, 38, 5177–5186. [Google Scholar] [CrossRef]
  31. Benner, J.; Salhi, E.; Ternes, T.; von Gunten, U. Ozonation of reverse osmosis concentrate: Kinetics and efficiency of beta blocker oxidation. Water Res. 2008, 42, 3003–3012. [Google Scholar] [CrossRef]
  32. Bahr, C.; Schumacher, J.; Ernst, M.; Luck, F.; Heinzmann, B.; Jekel, M. Suva as control parameter for the effective ozonation of organic pollutants in secondary effluent. Water Sci. Technol. 2007, 55, 267–274. [Google Scholar] [CrossRef]
  33. Buffle, M.O.; Schumacher, J.; Meylan, S.; Jekel, M.; von Gunten, U. Ozonation and advanced oxidation of wastewater: Effect of o3 dose, ph, dom and ho -scavengers on ozone decomposition and ho generation. Ozone: Sci. Eng. 2006, 28, 247–259. [Google Scholar] [CrossRef]
  34. Elovitz, M.S.; von Gunten, U. Hydroxyl radical/ozone ratios during ozonation processes. I. The rct concept. Ozone: Sci. Eng. 1999, 21, 239–260. [Google Scholar] [CrossRef]
  35. Wang, H.; Wang, Y.; Lou, Z.; Zhu, N.; Yuan, H. The degradation processes of refractory substances in nanofiltration concentrated leachate using micro-ozonation. Waste Manag. 2017, 69, 274–280. [Google Scholar] [CrossRef] [PubMed]
  36. Gao, Y.; Duan, Y.; Fan, W.; Guo, T.; Huo, M.; Yang, W.; Zhu, S.; An, W. Intensifying ozonation treatment of municipal secondary effluent using a combination of microbubbles and ultraviolet irradiation. Environ. Science Pollut. Res. 2019, 26, 21915–21924. [Google Scholar] [CrossRef] [PubMed]
  37. Wenk, J.; Aeschbacher, M.; Salhi, E.; Canonica, S.; von Gunten, U.; Sander, M. Chemical oxidation of dissolved organic matter by chlorine dioxide, chlorine, and ozone: Effects on its optical and antioxidant properties. Environ. Sci. Technol. 2013, 47, 11147–11156. [Google Scholar] [CrossRef] [Green Version]
  38. Buffle, M.O.; von Gunten, U. Phenols and amine induced HO generation during the initial phase of natural water ozonation. Environ. Sci. Technol. 2006, 40, 3057–3063. [Google Scholar] [CrossRef]
Figure 1. The schematic diagram of the lab-scale microbubble ozonation process.
Energies 12 04373 g001
Figure 2. The calibration plots of pCBA, EE2, IBU, and ATE in the range of 0.1 µM to 2.0 µM (pH 7, temperature = 20 °C).
Energies 12 04373 g002
Figure 3. The size distributions and the total number of the microbubbles generated by the cavity pump at the different frequencies (temperature = 20 °C).
Energies 12 04373 g003
Figure 4. The changes in the concentrations of dissolved O3 and the degradation of pCBA in the aqueous phase as a function of the cavity pump frequency (the initial concentration of pCBA = 2.0 μM; pH = 7.0; temperature = 20 °C; reaction time = 300 seconds; MB60 = microbubble at 60 Hz without O3; O3 = millibubble ozonation at 30 Hz; O3-MB40 = microbubble ozonation at 40 Hz; O3-MB50 = microbubble ozonation at 50 Hz; O3-MB60 = microbubble ozonation at 60 Hz): (a) the concentration of dissolved O3 and (b) the relative residual concentration (C/C0) of pCBA.
Energies 12 04373 g004
Figure 5. The effects of the temperature on the degradation of the pharmaceutical compounds during the millibubble and microbubble ozonation processes (the initial concentration of each pharmaceutical compound = 2.0 μM; cavity pump frequency = 60 Hz; pH = 7; O3 = millibubble ozonation at 30 Hz; O3-MB60 = microbubble ozonation at 60 Hz): (a) EE2, (b) IBU, and (c) ATE.
Energies 12 04373 g005
Figure 6. The pH effects on the degradation of the pharmaceutical compounds during the millibubble and microbubble ozonation processes (the initial concentration of each pharmaceutical compound = 2.0 μM; cavity pump frequency = 60 Hz; temperature = 20 °C, reaction time = 300 seconds; O3 = millibubble ozonation at 30 Hz; O3-MB60 = microbubble ozonation at 60 Hz): (a) pH 4, (b) pH 7, and (c) pH 10.
Energies 12 04373 g006
Figure 7. The effects of humic acids on the degradation of the pharmaceutical compounds during the (ac) millibubble ozonation and (df) microbubble ozonation processes (the initial concentration of each pharmaceutical compound = 2.0 μM; the concentration of humic acid = 5 mg/L; cavity pump frequency = 60 Hz; pH = 7.0; temperature = 20 °C).
Energies 12 04373 g007
Table 1. The second order rate constants for the reactions of the target pharmaceutical compounds with O3 at pH 7 and OH radicals.
Compounds (Abbreviation, Molar Mass (g mol−1))UseStructureElectron-Rich Organic MoietypKa k O 3 at pH 7 (M−1 s−1) k · O H at pH 7 (M−1 s−1)UVA Detection (nm)Ref.
17α
-Ethinylestradiol
(EE2, 296.40)
Ovulation inhibitor Energies 12 04373 i001Phenol10.43.0 × 1069.8 × 109230[23,24]
Ibuprofen
(IBU, 206.28)
Analgesic Energies 12 04373 i002Alkyl aromatic4.99.67.4 × 109210[25]
Atenolol
(ATE, 266.34)
β-blocker Energies 12 04373 i003Secondary amine9.61.7 × 1048.0 × 109251[26]
Para-Chlorobenzoic acid
(pCBA, 156.57)
OH radical probe compound Energies 12 04373 i004Chloro-aromatic4.0<0.25.0 × 109240[8]

