Why PV Modules Should Preferably No Longer Be Oriented to the South in the Near Future


Institute for Meteorology and Climatology, Leibniz Universität Hannover, Herrenhäuser Straße 2, 30419 Hannover, Germany
*
Author to whom correspondence should be addressed.
Energies 2019, 12(23), 4528; https://doi.org/10.3390/en12234528
Submission received: 7 October 2019
/
Revised: 20 November 2019
/
Accepted: 25 November 2019
/
Published: 28 November 2019
(This article belongs to the Special Issue Grid-Connected PV Plants)
Abstract
:PV modules tilted and oriented toward east and west directions gain gradually more importance as an alternative to the presently-preferred south (north in the Southern Hemisphere) orientation and it is shown to become economically superior even under the reimbursement of feed-in tariff (FIT). This is a consequence of the increasing spread between the decreasing costs of self-consumed solar power and the costs for power from the grid. One-minute values of irradiance were measured by silicon sensors at different orientations and tilt angles in Hannover (Germany) over three years. We show that south-oriented collectors give the highest electrical power during the day, whereas combinations of east and west orientations (E-W) result in the highest self-consumption rate (SC), and combinations of southeast and southwest (SE-SW) orientations result in the highest degree of autarky (AD), although they reduce the yearly PV Power by 5–6%. Moreover, the economic analysis of PV systems without FIT shows that the SE-SW and E-W combinations have the lowest electricity cost and they are more beneficial in terms of internal rate of return (IRR), compared to the S orientation at the same tilt. For PV systems with FIT, the S orientation presently provides the highest transfer of money from the supplier. However, as a consequence of the continuing decline of FIT, the economic advantage of S orientation is decreasing. E-W and SE-SW orientations are more beneficial for the owner as soon as FIT decreases to 7 Ct/kWh. East and west orientations of PV modules do not only have benefits for the individual owner but avoid high costs for storing energy—regardless who would own the storage facilities—and by avoiding high noon peaks of solar energy production during sunny periods, which would become an increasing problem for the grid if more solar power is installed. Furthermore, two types of commonly used PV software (PVSOL and PVsyst) were used to simulate the system performance. The comparison with measurements showed that both PV software underestimate SC and AD for all studied orientations, leading to the conclusion that improvements are necessary in modelling.
1. Introduction
Decarbonization of our energy supply is an important component to fulfill pledges of the Paris Agreement to keep the global warming below 1.5 °C, because 65% of the world’s current CO2 emissions are due to burning fossil fuels [1]. Renewable energy is one of the most cost-effective options to replace fossil fuels and to reduce electricity-related emissions. In recent years, many countries have begun a transition to more sustainable energy supply based on renewable energies. Solar energy represents the most abundant natural energy resource on the earth and has the potential to replace fossil fuels to satisfy this clean energy demand of our society in future [2]. This exceptional energy source is the most simple and economic renewable energy technology available that can be easily installed, especially on rooftops of houses. The costs for solar modules, measured in $/Wp, have reduced by as much as 90% during the last decade and are expected to fall further in the future [3].
Consequently, the evolution of renewable energy over the past decade has surpassed most expectations. By the end of 2018, global total renewable generation capacity reached 2351 GW. PV solar electricity has developed rapidly in minor private systems, as well as in large-scale installations connected to national grids. Solar energy represented around 20.6% of renewable energy generation in 2018, with capacities of 486 GW [4].
The solar irradiance changes with geographical location, season, and time of the day according to sun position in the sky. In addition, it varies by the influence of clouds, aerosols, and ground reflection. The orientation and tilt angle of PV collectors are among the most important parameters that affect the performance of a PV system, as they determine the amount of solar radiation received by the PV collector [5]. The orientation and inclination of a PV installation has two effects on system output: On the one hand, there is a larger or smaller amount of total annual yield; on the other hand, there is an impact on the seasonal or daily timing of peak energy generation [6]. In general, PV systems are divided into fixed and tracking systems. Fixed systems are often small systems installed on the roof of a building, while tracking systems are often large PV systems installed to maximize the solar radiation that reaches them [7]. Module performance is also affected by local factors for individual locations e.g., cloudiness, temperature, shading, dust, precipitation, and bird droppings [8].
Based on Earth-sun geometry, many studies were carried out to find the optimum tilt angle and orientation of PV systems in certain areas worldwide, e.g., Italy [9], Turkey [10], Australia [11], the United States [12], India [13], China [14], and Ghana [15]. Most previous studies show that the optimal fixed tilt angle of PV collectors depends only on geographical latitude (φ), if local weather and climatic conditions are not considered. However, because of the diffuse solar radiation, the optimal tilt angles may differ from those in reality. Huld et al. [16] showed that climate characteristics have a huge influence on the optimal tilt angle in Europe. Lave and Kleissl [12] showed that the optimal tilt is reduced by up to 10 degrees when cloudiness is taken into consideration, particularly in the northern United States. European studies [17,18] concluded that the optimum tilt must be reduced by 10° to 20° between southern and northern Europe because of the same effect. Beringer et al. [19] showed that solar collectors oriented to the South at a tilt angle of 50°–70° in the winter months (October–March) and 0°–30° in the summer months (April–September) would result in the highest monthly yield for the location of Hannover, Germany.
Rooftop PV systems have gained importance in the last decade, especially from the drop in the cost of solar PV modules and the increase of end-consumer electricity tariff. According to recent studies, up to 25% of EU electricity consumption could be potentially produced in small rooftop PV systems installed in the existing EU building [20]. Other authors estimate that all electricity needs can be produced on rooftops [21]. There is increased interest in the self-consumption (SC), i.e., the part of PV power production that is consumed by the house owner. The savings from self-consumed PV-generated electricity are much higher than the profit from selling excess generation at spot prices. It may also have a positive effect on the distribution grid and make the production profiles of PV systems connected to the grid smoother.
The SC depends mainly on the system size: The more PV power installed, the more often the produced electricity exceeds consumption; i.e., it is non-linear with installed power [22]. SC can also be increased by energy storage and by load management; i.e., the influence of temporal resolution becomes less distinct with added a battery storage [23]. In practice, the SC rate can range from a few percent to a theoretical maximum of 100%, depending on the PV system size and load profile. Moreover, estimation of SC depends also on time resolution; i.e., it is overestimated when using hourly data of PV electricity production and household load profiles. Luthander et al. [24] found that for individual buildings, sub-hourly data are needed to capture the behavior of high peak power. Leicester et al. [25] found that SC is overestimated by 71.3% when using hourly data, compared with 54.8% when using one-minute data. Accordingly, high temporal resolution data are required to quantify SC accurately.
There are very limited studies that described simultaneous direct measurements of PV generation and consumption. However, one method to obtain more data with greater variety is to use PV data and separately-obtained load profile data, and estimate the SC fraction [25]. With the present reimbursement for feed-in tariffs that value just the yearly sum fed into the grid, suitability studies focused for rooftop have just concentrated on the yearly yield. Many studies and online web tools concerning the suitability of the orientation of rooftop implicitly take only the yearly sum into account [26]. Calculations for the diurnal variability are lacking.
In this study, we use one-minute data to compare the outputs of 12 solar collectors at various tilt and azimuth angles in order to propose an alternative concept for increasing SC via non-south-oriented PV systems and investigate its potential. The calculations are based on measurements from silicon sensors with different orientations and tilt angles in Hannover (Germany). The SC of all orientations is calculated by using a set of separately measured load profiles in order to evaluate the best and more-economic orientations for rooftop PV systems. The results are also compared with the simulated values of two widely used PV software packages, PVSOL [27] and PVsyst [28] to validate this software. Detailed information about the simulation parameters are listed in Tables.
2. Methodology
The input dataset used in this study is composed of one-minute output of 12 solar collectors (Figure 1) installed for three years (2016–2018) on the roof of the Institute for Meteorology and Climatology (IMUK) of the Leibniz Universität Hannover (Hannover, Germany; 52.23° N, 9.42° E and 50 m above sea level). Measurements have been made, using crystalline silicon PV devices with individual temperature sensors (Mencke and Tegtmeyer GmbH, Hameln, Germany). The PV devices have been calibrated by the manufacturer in November 2013 and they are cleaned regularly to prevent the accumulation of dirt and dust. In addition, all devices are compared after one year of measurements by placing them side by side horizontally. These comparisons were performed under different weather conditions and have showed an agreement within ±3%.
Two groups of identical devices are considered here: The first group consist of devices with 45° tilt, oriented to S, E, W, SE, and SW; the second group consists of vertical devices, oriented to S, E, W, SE, SW, and N. The tilt angle for the first group (45°) is chosen to represent the large number of roof pitches, where most residential houses in Germany were built with a tilted roof angle between 40° and 45° [29]. According to the initial design of the measurement system, the S measurements are conducted at tilt angles of 40° and 50°, therefore we take the average of both sensors (40° and 50°) to represent the PV outputs at 45° tilt; the uncertainty resulting from this procedure and other orientation uncertainties are less than 1% according to PVGIS calculations. Table 1 shows an overview about the inclination uncertainty, according to a Photovoltaic Geographical Information System (PVGIS) calculation [30] for Hannover.
3. PV System Output Calculation
In general, there are several ways to calculate the power output of PV systems. We used in this study a simple method for calculating it [31]:
where is power output of the PV system, is the rated PV system power (the output power of PV device under standard test conditions), is the measured solar irradiance, = 1000 W/, is the module temperature (in °C), γ is power temperature coefficient, and PLF is the power loss factor.
The equation contains the temperature coefficient to take into account the drop of sensor signal because of the temperature and to correct the testing conditions. The losses because of inverter and the degradation mechanisms of the PV sensors (0.5%/a) are included in Equation (1) as a PLF, which is time dependent because of the degradation of sensors.
3.1. Load Profile
The power generation profiles were calculated by using the Equation (1). A synthesized dataset of actual measured load profiles provided by HTW Berlin [32] is used to simulate a household’s consumption pattern of electricity. The data set consists of 74 load profiles of German single-family houses with a temporal resolution of 1 min for every day of the year. The load profile used for the calculations is the average of six selected profiles which have an annual consumption between 3900 kWh and 4055 kWh. The average profile has an annual electricity consumption of 4006 kWh (Figure 2). It can be assumed that the selected profiles represent a four-person household.
3.2. Economic Parameters
Feed-in tariffs are the most common policy instrument worldwide to support renewable energy. Many PV installations sell their power at local grid, and the majority of feed-in tariff contracts are at a fixed price per kWh for 10–20 years [33]. This results in an optimal orientation that is the same for both maximum economic yield and maximum energy production. The German FIT for solar photovoltaic uses varying rates depending on the size of the project. Countries in which the FIT was eliminated usually replace it by net metering schemes. The net metering is also used in many different countries under different rules, but consists of a system in which the excess electricity injected into the grid can be used at a later time to compensate the consumption when PV generation is not sufficient. The compensation usually covers a specific period (usually 1–3 years) depending on the country’s regulations, and any excess energy after this period is not remunerated. So, the main idea is to configure the system settings in a way its annual production does not exceed the annual consumption, minimizing the deviation between them and increasing SC. Examples of countries using net metering schemes are: the United States (with particular conditions depending on the state), Denmark, Greece, Australia, Brazil, Mexico, and Chile [34,35,36].
The FIT used in the financial model for the calculation is 10.64 Ct/kWh (from July, 2019) and the price is constant for 20 years. The electricity price (30.22 Ct/kWh) considered in the calculations in this study represents the average price level for private households in Germany in 2019, including taxes and levies [37]. The increase of electricity price is expected to slow down to 2% p.a. as an average value during the next 20 years. The levelized cost of PV energy (LC) in northern Germany ranges between 9.89 Ct/kWh and 11.54 Ct/kWh, depending on the annual solar irradiance [38]; a value of 10 Ct/kWh is used in this study.
In the design of PV systems, the self-consumption rate (SC) and the degree of autarky (AD) are two important quantities used to assess the congruence of the PV generation and electricity demand profiles. The self-consumption rate is defined by the ratio of PV directly used () to the total amount of PV power generated (), according to Equation (2).
The degree of autarky is defined as a ratio of PV directly used to the total consumption by the household [39], according to Equation (3).
where L is the energy consumed by the loads.
The electricity price used to evaluate the economic impact of PV system at specific orientation has been calculated according to Equation (4).
where is the grid electricity price, is the FIT, and LC is the levelized cost of PV energy.
Figure 3 shows a workflow diagram used in this study to calculate the SC with the feed-in components. The calculations are always dependent on the consumption of electricity, with the primary objective to fulfil the demand from the PV produced energy, before purchasing from the public grid. If the produced electricity exceeds the consumption of the house, the excess is supplied to the public grid. Moreover, the internal rate of return (IRR) for all available orientations has been calculated over the life cycle of the PV system (20 years) in order to enlighten prospective owners/investors of rooftop PV systems. The IRR, defined as a discount rate that makes the net present value from all cash flows from a project equal to zero, is used to evaluate the attractiveness of a project or investment, and it is probably one of the most meaningful metric for investors [40]. The degradation mechanisms of the PV collectors (0.5%/a) and an annual increase of electricity price (2%/a) were taken into account in the IRR calculations.
3.3. PV Software
PV estimation models are generally used to estimate the expected energy output of a PV system. These models need specific input parameters such as meteorological conditions of the location, system design details, and definitions of the main components used. A variety of software for the simulation of PV systems is available in the market, including PVsyst, PVSOL, and others. PVsyst, developed at the University of Geneva, is one of the most common modeling software tools used in the PV industry to simulate the performance of grid-connected or stand-alone PV systems and calculate their energy yield. PVsyst allows the definition of meteorological databases from many different sources and formats, as well as on-site measured data [41]. On the other hand, PVSOL is a German software developed by Valentine Software [27] for dynamic simulation with 3D visualization and detailed shading analysis of photovoltaic systems. PVSOL gives customers the best return on their investment by visualizing systems, and it can perform economic and performance analysis with comprehensive reports.
4. Results and Discussion
4.1. Production and Consumption under Different Weather Conditions
Figure 4 shows the PV production profiles for the S and E-W orientations during three days of May 2018 with different weather conditions (clear sky, partly cloudy, and fully cloudy) and correspondent customer load profiles for the same days of the year.
The load profiles show different peaks over the day according to consumption patterns, while, the PV power production changes according to the movement of the sun and the weather conditions. The influence of orientation is shown clearly in clear sky days, when the energy production depends mainly on the sun’s position. The E-W orientation covers more the edges of the day and reduces noon peak. On the other hand, the orientation is irrelevant under cloudy conditions, when the solar irradiance dominated by diffuse component. In general, SC rate is higher under cloudy conditions.
4.2. Annual Insolation
The annual total solar energy as function of surface azimuth and tilt angles is depicted in Figure 5. The left side histogram shows that the maximum annual total energy is for a south-facing surface with a tilt angle between 30° and 40°, closer to 40°. The annual total energy is less than the maximum by approximately 0.2% for surface orientation of 30° S, and it decreases gradually with higher or lower tilt angles. The annual produced energy for the surfaces oriented at the same tilt angle (45°) toward E and W are 77.0% and 75.9% of the optimal orientation respectively. For orientations of 45° SE or SW, the annual total energy produced are 94.8% and 93.3% of maximum produced energy. The inequality in total energy for E and W and in SE and SW may denote asymmetric distributions of solar irradiance before and after midday. On the right histogram of Figure 4 we can see that, for a vertical surface with orientation of 90° south, the produced energy is 66.2% of the 40° tilted surface, whereas it is about 50% for E and W surfaces. The annual total energy of the northern vertical surface is reduced by about 74%.
In general, the amount of energy produced by a PV collector is proportional to solar radiation received by a surface in a specific orientation. Table 2 shows the annual produced energy and its percentage from the maximum value (at 45° S) for different orientations and tilt angles. The table also shows the SC rate and AD for each orientation. For 45° tilt surfaces, the lowest SC rate (37.9%) is for the S facing solar installation, while the highest SC rate (51.4%) is for the E-W combination. The high SC rate is because the power output of E-W installation matches the load profile more closely, producing more electric energy at the beginning and at the end of the day, with a lower midday peak (Figure 6). The AD has its maximum at SE-SW combination (40.7%) and its minimum at the E orientation (35.4%). Moreover, the economic efficiency of all studied orientations for the cases with and without FIT is also listed in Table 2. Overall, the E-W and SE-SW combinations have the lowest electricity cost (29.2 Ct/kWh and 29.1 Ct/kWh respectively), while the E orientation has the highest one (30.7 Ct/kWh), both cases for the system without FIT. For PV systems with FIT, the S-facing systems have the lowest electricity price (22.0 Ct/kWh) because of the high PV generation and accordingly the high feed-in amount, while the E-facing systems have the highest price (25.6 Ct/kWh).
The IRR analysis of PV systems without FIT shows that the SE-SW and E-W orientations tilted at 45° is more beneficial with an IRR value of 2.09% and 1.90%, respectively, when compared to the S orientation at the same tilt with 1.59%. For PV systems with FIT, the IRR for the S orientation is higher with a value of 7.05%, compared to the SE-SW and E-W orientations with 6.82% and 5.14%, respectively.
As expected, for the vertical surfaces, the S orientations gives the highest output (66.8% of the maximum), while the lowest energy is produced by N-facing surface (25.8 of the maximum), because of the Earth-sun geometry in the northern hemisphere. In terms of the SC rate, the N surfaces have the highest rate, due to the low energy production in this direction, while the lowest rate (50.0%) is for the SE surface. The AD has its maximum at SW orientation (36.7%) and it is minimum at N orientation (25.4%). Accordingly, the SW orientation has the lowest electricity cost (30.4 Ct/kWh) for the system without FIT, while the S and SW orientations have the lowest electricity cost (27.1 Ct/kWh) for PV systems with FIT. The difference between prices is found to be small and is within ±3%. However, we found that a changing the irradiance of 3% cause only a small change of the price and therefore conclude that the assessed measurement uncertainties do not significantly affect the prices.
Moreover, we examined whether the PV self-consumption will be influenced similarly in all investigated orientations, by changing the system size. For that purpose, we varied the module area by +/−50% in 5% steps (Figure 7). As expected, the SC rate increased by a reduction of the module area (in our specific case the default area was 24.3 m2) for the orientations (S45, E45-W45, SE45-SW45). This increase only slightly depends on the orientation: The E40-W40 increased by 29% while the south orientation increased by 26% with a reduction of the module area of 50%. While it is obvious that the SC rate becomes smaller for larger module areas, an increase in module size will affect all orientations, but the S orientation will be affected slightly less than the other orientations.
4.3. Effects of the Changing Feed-In Tariffs
Feed-in tariffs of renewable energy in Germany are decreasing as each year passes and PV FIT drops faster than any other renewable power source. In the last 15 years, the FIT recorded a decrease of approximately 80% for small rooftop PV installations and 90% for medium-size PV systems [42]. Figure 8 shows the decrease in German FIT from 2000 to 2020.
According to Obane and Okajima [43], the FIT scheme for small PV systems is fast approaching its closure or expiration in many countries. In Germany, the EEG law stipulates that further FIT systems will not be allowed, when the total PV installations reach 52 GW. At the end of April 2018, the country had 43.8 GW PV installed. With the current tenders of PV, this cap is expected to be reached in 2020 [44]. However, the German government presently reconsidering this plan and is considering to allow FIT in future when the 52 GW is exceeded. With decreasing FIT self-consumption is gaining higher importance, especially with increasing cost of delivering PV electricity and rapid decline in the cost of solar PV modules. In addition, after 2020, the FIT will gradually expire for the oldest PV plants [42] and the produced PV power will be mainly used for SC. Thus, E-W and SE-SW orientations will provide the highest SC rate and will be more beneficial for the householders. Our calculation shows that the higher benefit of south orientation is no longer existent if FIT decreases to 7.0 Ct/kWh or lower, where at least the SE-SW orientation will have a higher IRR that the S orientation.
The economic calculations above were done for the conditions of the present FIT in Germany. The major conclusions, however, can used for many countries around the world, which apply FIT or similar PV cost structures. The results are especially relevant for the countries, which offer a very low FIT (e.g., New Zealand and Portugal) or for which eliminated the FIT scheme (e.g., UK, Spain, Czech Republic, Italy).
4.4. Comparison with PV Software
For simulation of the IMUK measurement system, a fixed PV system configuration, consisting of a 4.8 kWp is considered in the calculations, corresponding to the installation of 24 modules. Moreover, the same load profile that is used for the calculation of SC and AD at IMUK is also used in both models. Table 3 shows the important model parameters used in the simulation.
Both simulation programs have been run for each orientation separately. Table 4 shows the simulated annually produced energies for all studied orientations and tilt angles. The programs overestimate the south-tilted irradiance and most of the studied orientations. This may result from the use of an anisotropic model (Perez-Ineichen model) to calculate the tilted irradiance, where we found in a previous study [45] that anisotropic models overestimate the south-tilted irradiance and most vertical-tilted irradiances.
The table also shows the SC and AD fractions for each orientation. For the 45°-tilt surfaces, the lowest SC (PVsyst = 32.9% and PVSOL = 32.3%) are for the S orientation, while the highest SC (PVsyst = 43.1% and PVSOL = 44.5%) is for the E-W combination, which agrees with the measured results. According to PVsyst, the AD has its maximum at E-W combination (37.4%) and at S orientation (34.7%) according to PVSOL calculations, while it is minimum at the W orientation for both models (PVsyst = 34.0%, PVSOL = 31.9).
For the vertical surfaces, the results of both programs show also that the S orientations gives the highest output, while the lowest energy is produced by a N-facing surface. In terms of the SC rate, the N surface has the highest fractions (PVsyst = 85.7% and PVSOL = 89.0%), while the lowest (40.7%) are for the S surfaces. The AD has its maximum for S surfaces (PVsyst = 31.8% and PVSOL = 30.6%) and it is minimum at the N orientation (PVsyst = 24.6% and PVSOL = 24.7). Table 4 also shows that both PV programs overestimate the percentage of energy production at 45° in most orientations versus the southern maximum value.
In order to have comparable results of simulation with the measured results, the generated PV energy of the IMUK system have been controlled by changing the PV area to produce the same annual output as the inverter output of simulation software. Figure 9 shows the results of the comparison: Both PV programs underestimate SC and AD for all studied orientations; SC rate was underestimated by 0.4% to 14%, while AD values were underestimated by 1.3% to 8.1%. These results lead to the conclusion that improvements are necessary in the modelling of SC and AD.
5. Conclusions
Using one-minute measured data of PV energy, the outputs of 12 solar collectors at various tilt and azimuth angles in Hannover (Germany) were analyzed. For validation, the results were also compared with the simulated values of two widely used PV software: PVSOL and PVsyst.
The measurements show that a south-oriented generator at about 40° gives the highest electricity profile. For non-vertical devices, the combinations of E and W orientations result in the highest SC rate and combinations of SE and SW orientations result in the highest AD. E-W and SE-SW combinations have the lowest electricity coast for PV systems without FIT, while the E orientation has the highest one. For PV systems with FIT, S orientation provides the highest transfer of money from the supplier. The economic analysis using IRR of PV systems without FIT shows that the SE-SW and E-W orientations tilted at 45° is slightly more beneficial, while S orientation has higher IRR for PV systems with FIT.
However, in light of the continuing decline of FIT, the advantage of S orientation is decreasing and our results show that E-W and SE-SW orientations will be more beneficial if FIT is to 7 Ct/kWh or lower. East and west orientations of PV modules and not south orientations should be supported because they would also reduce the economic costs for storing renewable energy—regardless who would own the storage facilities—and avoid high noon peaks of solar energy production, which would become a problem for the grid for higher solar power penetrations levels.
Furthermore, the results show that the vertical tilted surfaces represent a high potential for PV energy production and facade PV systems could be an alternative for many people, especially for those who do not have access to a rooftop. So far, combinations of different vertically tilted modules as well as the combinations between vertical and 45°-tilted surfaces have not yet been taken into account because of the problems with the standardization of shadows from nearby building, trees and, other obstacles.
The calculation in this study assumed a constant price for the FIT over the day. However, if we consider the general trend to link the price of electricity with the spot market price, so that the price of selling or feeding electricity to grid changes according to the production and demand, the E-W and SE-SW orientations might become even more beneficial against S-facing PV systems. In addition, the suitability criteria for rooftops carrying solar modules must be questioned [26]. More roofs should be taken into account when diurnal variations are considered. Based on our measurements and analysis we conclude that the yearly sum of produced electricity can no longer be the only criterion for the installation of PV modules. Instead, other orientations may be more beneficial for both the owner and the society that uses solar power.
Regarding the model validation, both of the tested PV software overestimate the energy production at most studied orientations and also overestimate the percentage of these orientations when compared to the south-oriented generator. This result agrees with previous results [45], which showed that anisotropic models overestimate the S-tilted irradiance and most vertical irradiances. The need to improve existing modelling has also been shown in previous studies [46,47]. A major cause for the deviation between models and measurements may be the oversimplified assumptions about the sky radiance, which can be overcome by new measurement techniques [48,49]. Moreover, the study showed that the overestimation increases with increasing deviation from the south direction. In addition, both PV programs underestimate SC rate and AD for all studied orientations. SC rate was underestimated from 0.4% to 14%, while AD values were underestimated from 1.3% to 8.1%. These results lead to the conclusion that improvements are necessary when modelling SC and AD.
The amount of solar irradiance received by the surface of the PV collector is among the most important parameters that affect the performance of a PV system. Therefore, high-resolution tilted solar irradiance data in various orientations and weather conditions are needed to feed the models for better simulation of PV Power.
Author Contributions
R.M. conceived and designed the study and wrote the draft paper; G.S. initiated the investigation on the performance of differently oriented PV modules. G.S. and E.W.L. contributed in the conception and design, analysis and interpretation of the data. All the authors significantly contributed to the final version of the manuscript.
Funding
The publication of this article was funded by the Open Access fund of Leibniz Universität Hannover” This is what we wrote in all our previous papers.
Acknowledgments
The publication of this article was funded by the Open Access fund of Leibniz Universität Hannover. We are also grateful to Holger Schilke for his contribution in collecting the data and supervising the measurements. Thanks also to Martin Hoffmann for his instruction in using PVSOL. Ben Liley from the National Institute of Water and Atmospheric Research (NIWA), New Zealand for improving the English and providing helpful comments on the clarity of the presentation.
Conflicts of Interest
The authors declare no conflict of interest.
Nomenclature
| SC | Self-consumption |
| AD | Degree of autarky |
| Power output of the PV system | |
| Rated PV system power | |
| Measured solar irradiance | |
| Solar irradiance at STC (1000 W/m2) | |
| Sensor temperature | |
| γ | Power temperature coefficient |
| Pdu | PV directly used energy |
| PLF | Power loss factor |
| φ | Geographical latitude φ |
| PVg | Total PV generated energy |
| Pe | Electricity price |
| PG | Grid electricity price |
| Pfi, FIT | Feed-in tariff |
| LC | Levelized coast of PV energy |
References
- Jäger-Waldau, A. Snapshot of Photovoltaics 2018. EPJ Photovolt. 2018, 9, 6. [Google Scholar] [CrossRef]
- Ginley, D.; Green, M.A.; Collins, R. Solar energy conversion toward 1 TW. MRS Bull. 2008, 33, 355–364. [Google Scholar] [CrossRef]
- Vartiainen, E.; Breyer, C.; Moser, D.; Medina, E.R. Impact of weighted average cost of capital, capital expenditure, and other parameters on future utility-scale PV levelised cost of electricity. Prog. Photovolt. Res. Appl. 2019, 1–15. [Google Scholar] [CrossRef]
- IRENA. Renewable Energy Statistics 2018, The International Renewable Energy Agency. Available online: https://www.irena.org//media/Files/IRENA/Agency/Publication/2019/Mar/RE_capacity_highlights_2019 pdf?la=en&hash=BA9D38354390B001DC0CC9BE03EEE559C280013F (accessed on 26 October 2019).
- Khoo, Y.S.; Nobre, A.; Malhotra, R.; Yang, D.; Ruther, R.; Reindl, T.; Aberle, A.G. Optimal orientation and tilt angle for maximizing in-plane solar irradiation for PV applications in Singapore. IEEE J. Photovolt. 2014, 4, 647–653. [Google Scholar] [CrossRef]
- Hartner, M.; Ortner, A.; Heisl, A.; Haas, R. East to west—The optimal tilt angle and orientation of photovoltaic panels from an electricity system perspective. Appl. Energy 2015, 160, 94–107. [Google Scholar] [CrossRef]
- Seme, S.; Krawczyk, A.; Łada, E.; Tondyra, Š.B.; Hadžiselimović, M. The Efficiency of Different Orientations of Photovoltaic Systems. Przegląd Elektrotechniczny 2017, 93, 201–204. [Google Scholar] [CrossRef]
- Ghazi, S.; Ip, K. The effect of weather conditions on the efficiency of PV panels in southeast of UK. Renew. Energy 2014, 69, 50–59. [Google Scholar] [CrossRef]
- Colli, A.; Zaaiman, W.J. Maximum-power-based PV performance validation method: Application to single-axis tracking and Fixed-Tilt c-Si systems in the Italian Alpine region. IEEE J. Photovolt 2012, 2, 555–563. [Google Scholar] [CrossRef]
- Bakirci, K. General models for optimum tilt angles of solar panels: Turkey case study. Renew. Sustain. Energy Rev. 2012, 16, 6149–6159. [Google Scholar] [CrossRef]
- Yan, R.; Saha, T.K.; Meredith, P.; Goodwin, S. Analysis of yearlong performance of differently tilted photovoltaic systems in Brisbane, Australia. Energy Convers. Manag. 2013, 74, 102–108. [Google Scholar] [CrossRef]
- Lave, M.; Kleissl, J. Optimum fixed orientations and benefits of tracking for capturing solar radiation in the continental United States. Renew. Energy 2011, 36, 1145–1152. [Google Scholar] [CrossRef]
- Agarwal, A.; Vashishtha, V.K.; Mishra, S.N. Comparative approach for the optimization of tilt angle to receive maximum radiation. Int. J. Eng. Res. Technol. 2012, 1, 1–9. [Google Scholar]
- Tang, R.; Wu, T. Optim. tilt-angles for solar collectors used in China. Appl. Energy 2004, 79, 239–248. [Google Scholar] [CrossRef]
- Uba, F.A.; Sarsah, E.A. Optimization of tilt angle for solar collectors in WA, Ghana, Pelagia Research Library. Adv. Appl. Sci. Res. 2013, 4, 108–114. [Google Scholar]
- Huld, T.; Šúri, M.; Dunlop, E.D. Comparison of potential solar electricity output from fixed-inclined and two-axis tracking photovoltaic modules in Europe. Prog. Photovolt. Res. Appl. 2008, 16, 47–59, ISSN 1099-159X. [Google Scholar] [CrossRef]
- Huld, T.; Müller, R.; Gambardella, A. A new solar radiation database for estimating PV performance in Europe and Africa. Sol. Energy 2012, 86, 1803–1815. [Google Scholar] [CrossRef]
- Quinn, S.W.; Lehman, B.A. Simple formula for the optimum tilt angles of photovoltaic panels. In Proceedings of the IEEE 14th Workshop on Control and Modeling for Power Electronics (COMPEL), Salt Lake City, UT, USA, 23–26 June 2013; pp. 1–8. [Google Scholar]
- Beringer, S.; Schilke, H.; Lohse, I.; Seckmeyer, G. Case study showing that the tilt angle of photovoltaic plants is nearly irrelevant. Sol. Energy 2011, 85, 470–476. [Google Scholar] [CrossRef]
- Bodis, K.; Kougias, I.; Jäger-Waldau, A.; Taylor, N.; Szabo, S. A high-resolution geospatial assessment of the rooftop solar photovoltaic potential in the European Union. Renew. Sustain. Energy Rev. 2019, 114, 109309. [Google Scholar] [CrossRef]
- Mertens, K. Photovoltaics: Fundamentals, Technology and Practice, 1st ed.; John Wiley & Sons, Ltd. Published: Hoboken, NJ, USA, 2014. [Google Scholar]
- Luthander, R. Photovoltaic System Layout for Optimized Self-Consumption. Uppsala Universitet. 2013. Available online: http://www.diva-portal.org/smash/get/diva2:637625/FULLTEXT01.pdf (accessed on 26 November 2019).
- Beck, T.; Kondziella, H.; Huard, G.; Bruckner, T. Assessing the influence of the temporal resolution of electrical load and PV generation profiles on self-consumption and sizing of PV-battery systems. Appl. Energy 2016, 173, 331–342. [Google Scholar] [CrossRef]
- Luthander, R.; Widen, J.; Nilsson, D.; Palm, J. Photovoltaic self consumprion in buidings: A review. Appl. Energy 2015, 142, 80–94. [Google Scholar] [CrossRef]
- Leicester, P.A.; Rowley, P.N.; Goodier, C.I. Probabilistic analysis of solar photovoltaic self-consumption using Bayesian network models. IET Renew. Power Gener. 2016, 10, 448–455. [Google Scholar] [CrossRef]
- Martín, A.M.; Domínguez, J.; Amador, J. Applying LIDAR datasets and GIS based model to evaluate solar potential over roofs: A review. AIMS Energy 2015, 3, 326–343. [Google Scholar] [CrossRef]
- PVSOL. PV*SOL Online—A Free Tool Forsolar Power (PV) Systems. 2019. Available online: http://pvsol-online.valentin-software.com/#/ (accessed on 6 May 2019).
- PVSyst, Version, 6.79; [Computer Software]; University of Geneva: Geneva, Switzerland, 2019.
- DGS. EnergyMap.info; Deutsche Gesellschaft für Sonnenenergie e.V.: Berlin, Germany, 2015. [Google Scholar]
- PVGIS. Overview of PVGIS data sources and calculation methods. European Commission. Available online: http://re.jrc.ec.europa.eu/pvg_static/methods.html (accessed on 26 November 2019).
- Idoko, L.; Anaya-Lara, O.; McDonald, A. Enhancing PV modules efficiency and power output using multi-concept cooling technique. Energy Rep. 2018, 4, 357–369. [Google Scholar] [CrossRef]
- Tjaden, T.; Bergner, J.; Weniger, J.; Quaschning, V. Repräsentative elektrische Lastprofile für Wohngebäude in Deutschland auf 1-sekündiger Datenbasis. Technical report, Berlin, Germany. Hochschule für Technik und Wirtschaft HTW Berlin. Available online: https://pvspeicher.htw-berlin.de/wp-content/uploads/2017/05/HTW-BERLIN-2015-Repr%C3%A4sentative-elektrische-Lastprofile-f%C3%BCr-Wohngeb%C3%A4ude-in-Deutschland-auf-1-sek%C3%BCndiger-Datenbasis.pdf (accessed on 26 November 2019).
- Haysom, J.E.; Hinzer, K.; Wright, D. Impact of electricity tariffs on optimal orientation of photovoltaic modules. Prog. Photovolt. Res. Appl. 2015, 24, 253–260. [Google Scholar] [CrossRef]
- Jager-Waldau, A.; Bucher, C.; Frederiksen, K.H.B.; Guerro-Lemus, R.; Mason, G.; Mather, B.; Mayr, C.; Moneta, D.; Nikoletatos, J.; Roberts, M.B. Self-consumption of electricity produced from PV systems in apartment buildings—Comparison of the situation in Australia, Austria, Denmark, Germany, Greece, Italy, Spain, Switzerland and the USA. In Proceedings of the 2018 IEEE 7th World Conf. Photovolt. Energy Conversion, WCPEC 2018—A Jt. Conf. 45th IEEE PVSC, 28th PVSEC 34th EU PVSEC 1424–1430, Waikoloa Village, HI, USA, 10–15 June 2018. [Google Scholar] [CrossRef]
- Mojonero, D.H.; Villacorta, A.R.; Kuong, J.L. Impact assessment of net metering for residential photovoltaic distributed generation in Peru. Int. J. Renew. Energy Res. 2018, 8, 1200–1207. [Google Scholar]
- Pereira da Silva, P.; Dantas, G.; Pereira, G.I.; Câmara, L.; De Castro, N.J. Photovoltaic distributed generation—An international review on diffusion, support policies, and electricity sector regulatory adaptation. Renew. Sustain. Energy Rev. 2019, 103, 30–39. [Google Scholar] [CrossRef]
- BDEW. BDEW-Strompreisanalyse (Haushalte und Industrie). Available online: https://www.bdew.de/me-dia/documents/190115_BDEW-Strompreisanalyse_Januar-2019.pdf (accessed on 28 January 2019).
- Fraunhofer Institute for Solar Energy Systems (ISE). Levelized Cost of Electricity Renewable Energy Technologies; Fraunhofer Institute for Solar Energy Systems (ISE): Freiburg, Germany, 2018. [Google Scholar]
- Stenzel, P.; Linssen, J.; Fleer, J.; Busch, F. Impact of temporal resolution of supply and demand profiles on the design of photovoltaic battery systems for increased self-consumption. In Proceedings of the 2016 IEEE International Energy Conference (ENERGYCON), Leuven, Belgium, 4–8 April 2016. [Google Scholar]
- Talavera, D.L.; Nofuentes, G.; Aguilera, J. The Internal Rate of Return of Photovoltaic Grid-Connected Systems: A Comprehensive Sensitivity. Renew. Energy 2010, 35, 101–111. [Google Scholar] [CrossRef]
- Tapia, M. Evaluation of Performance Models against Actual Performance of Grid Connected PV Systems. Master’s Thesis, Carl von Ossietzky Universität, Oldenburg, Germany, 2014. [Google Scholar]
- Fraunhofer ISE. Recent Facts about Photovoltaics in Germany; Fraunhofer Institute for Solar Energy Systems ISE: Freiburg, Gemmary, 2019. [Google Scholar]
- Obane, H.; Okajima, K. Extracting issues significant to valuing electricity from small photovoltaic systems using quantitative content analysis. Electr. J. 2019, 32, 106673. [Google Scholar] [CrossRef]
- Solar Power Europe. Global Market Outlook for Solar Power 2018–2022; Solar Power Europe: Brussels, Belgium, 2018. [Google Scholar]
- Mubarak, R.; Hofmann, M.; Riechelmann, S.; Seckmeyer, G. Comparison of modelled and measured tilted solar irradiance for photovoltaic applications. Energies 2017, 10, 1688. [Google Scholar] [CrossRef]
- Hofmann, M.; Seckmeyer, G. Influence of various irradiance models and their combination on simulation results of photovoltaic systems. Energies 2017, 10, 1495. [Google Scholar] [CrossRef]
- Hofmann, M.; Seckmeyer, G. A New Model for Estimating the Diffuse Fraction of Solar Irradiance for PV System Simulations. Energies 2017, 10, 248. [Google Scholar] [CrossRef]
- Seckmeyer, G.; Lagos Rivas, L.; Gaetani, C.; Heinzel, J.W.; Schrempf, M. Biologische und medizinische Wirkungen solarer Strahlung (Biological and medical effects of solar radiation). In Promet, Heft 100 Strahlungsbilanzen; Chapter 13; Deutscher Wetterdienst (DWD): Offenbach am Main, Germany, 2018. [Google Scholar]
- Riechelmann, S.; Schrempf, M.; Seckmeyer, G. Simultaneous measurement of spectral sky radiance by a non-scanning multidirectional spectroradiometer (MUDIS). Meas. Sci. Technol. 2013, 24, 125501. [Google Scholar] [CrossRef]
Figure 1.
Set of solar PV devices based on silicon sensors mounted in several different tilt angles and orientations, operational at the IMUK (Institute for Meteorology and Climatology) [IMUK, 2017].
Figure 1.
Set of solar PV devices based on silicon sensors mounted in several different tilt angles and orientations, operational at the IMUK (Institute for Meteorology and Climatology) [IMUK, 2017].

Figure 2.
Six private household profiles which have an annual consumption between 3900 kWh and 4055 kWh [32]. The average profile (black curve) has an annual electricity consumption of 4006 kWh.
Figure 2.
Six private household profiles which have an annual consumption between 3900 kWh and 4055 kWh [32]. The average profile (black curve) has an annual electricity consumption of 4006 kWh.
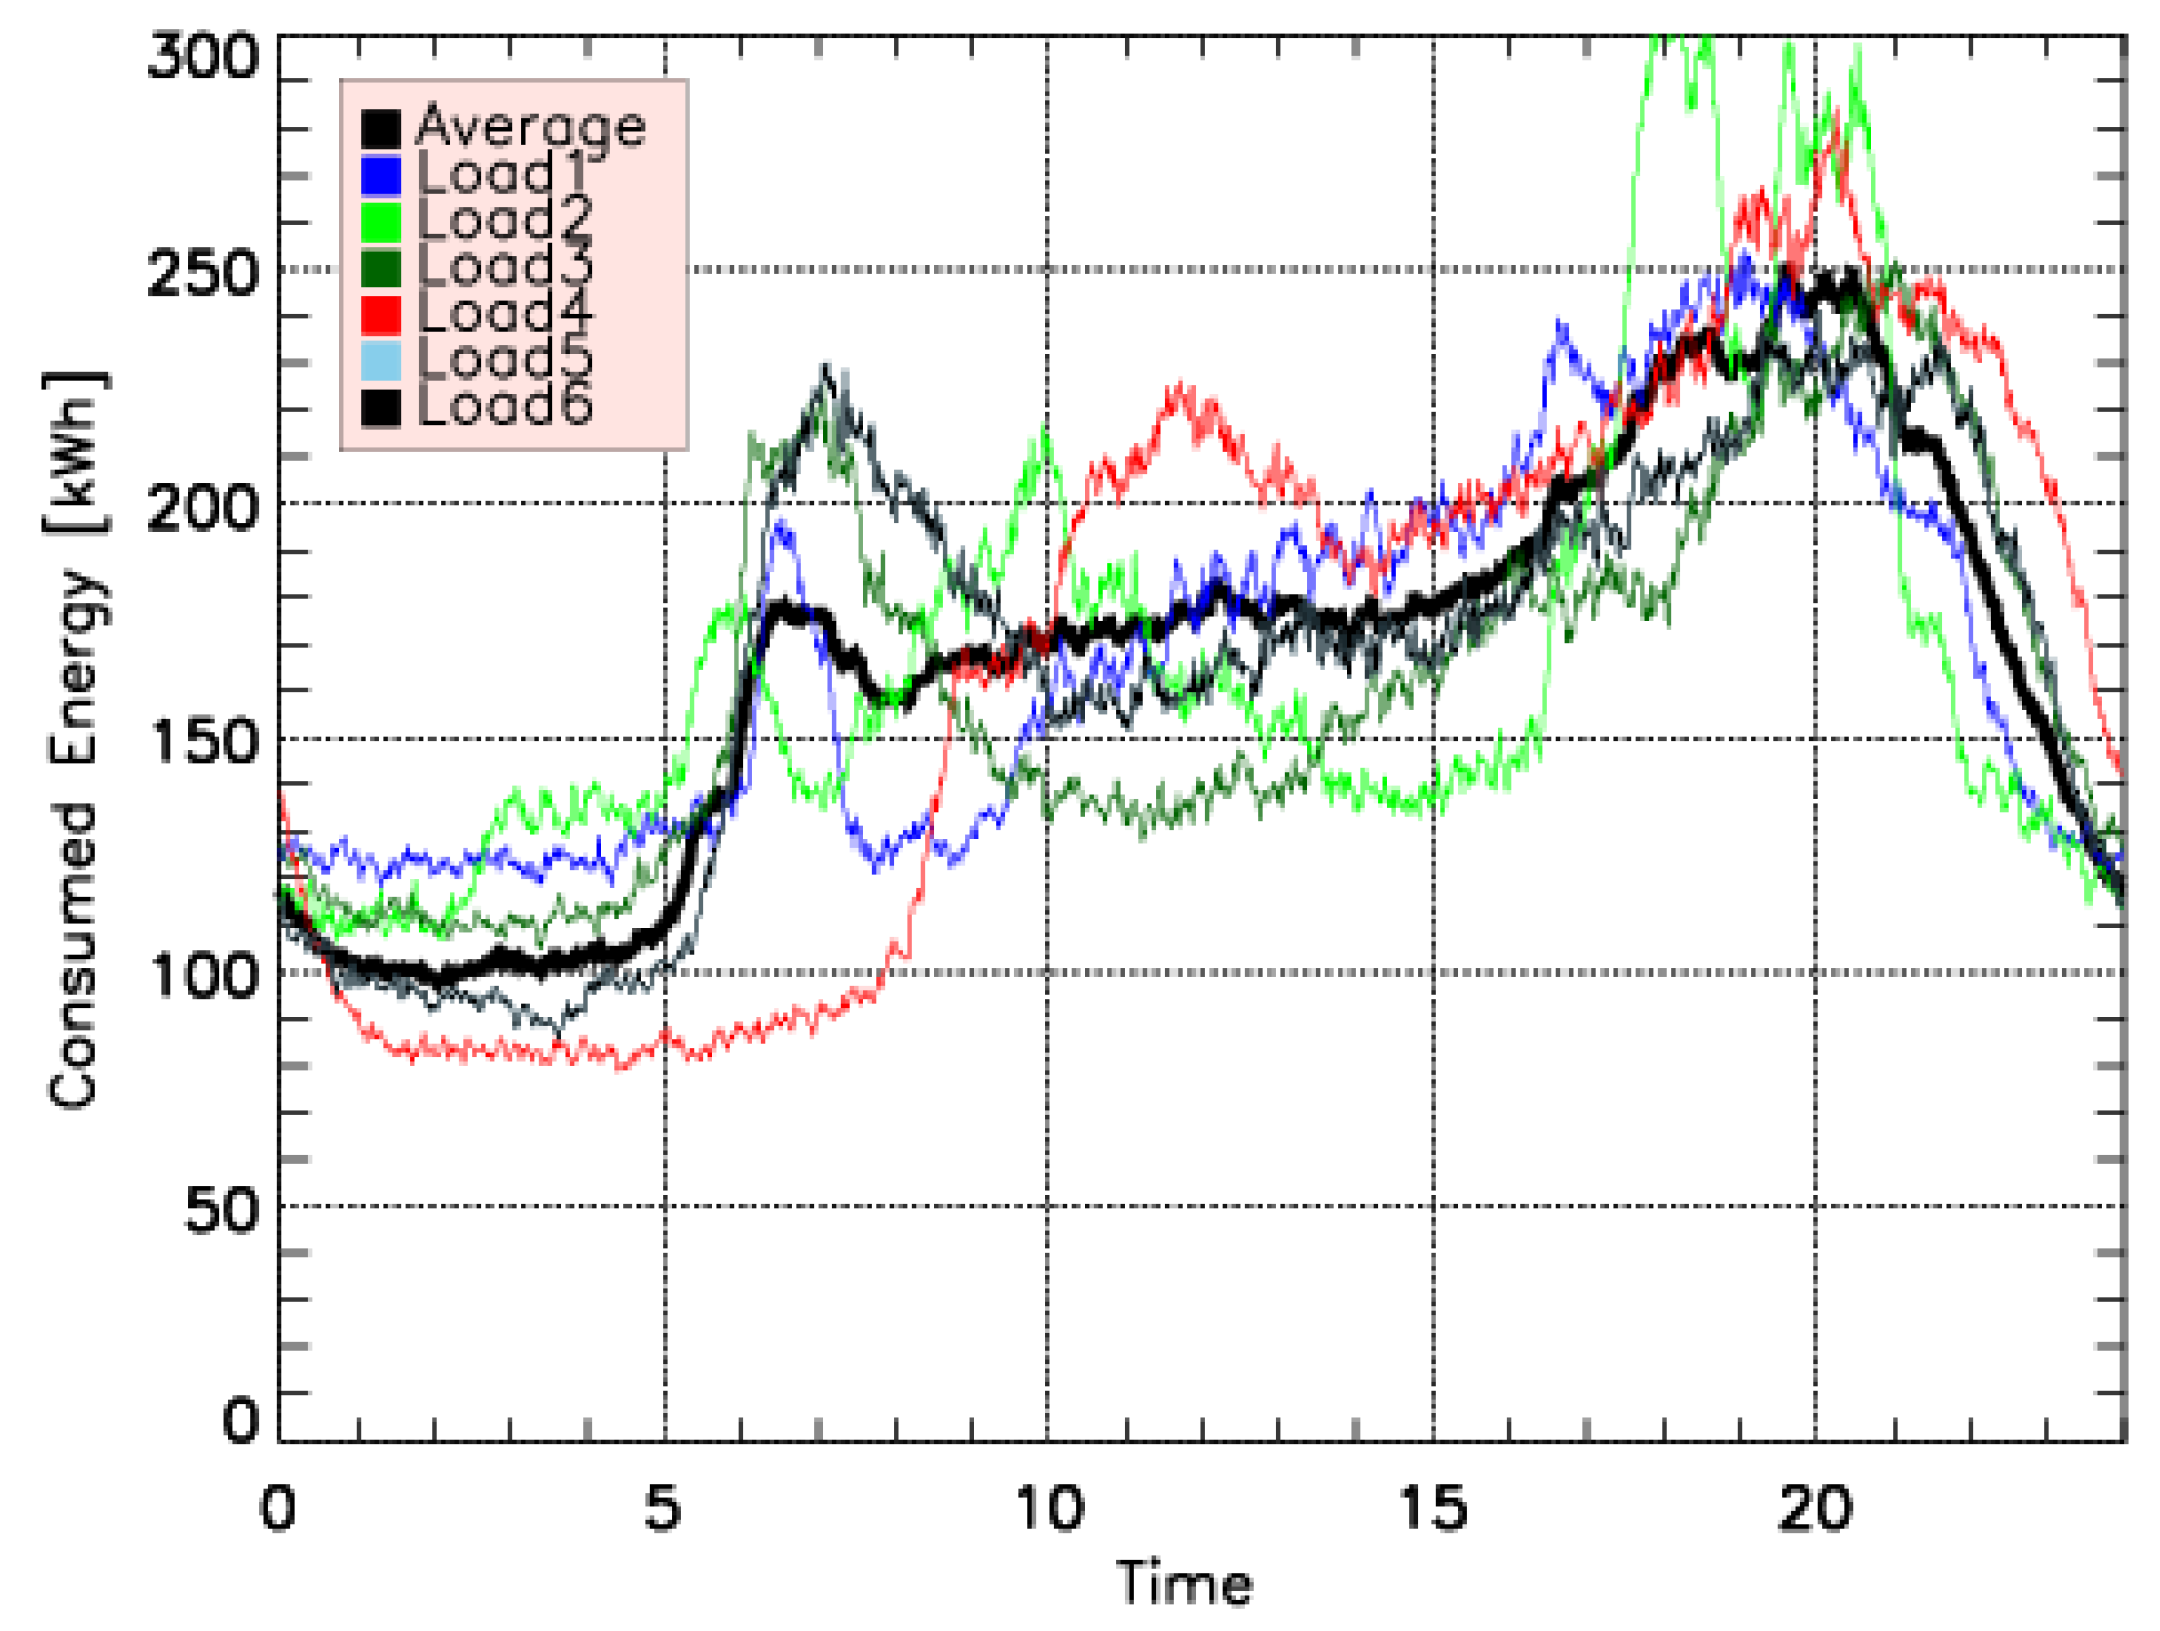
Figure 3.
Schematic view of the calculation of system components. The calculations are always dependent on the load demand, with the primary objective to fulfil it from the PV produced energy, before purchasing electricity from the public grid.
Figure 3.
Schematic view of the calculation of system components. The calculations are always dependent on the load demand, with the primary objective to fulfil it from the PV produced energy, before purchasing electricity from the public grid.

Figure 4.
PV Production profiles for three days of May 2018 and the correspondent customer load profiles for the same days of the year. The thick (gray) curve represents the 10-minte average consumption.
Figure 4.
PV Production profiles for three days of May 2018 and the correspondent customer load profiles for the same days of the year. The thick (gray) curve represents the 10-minte average consumption.

Figure 5.
Produced and consumed PV power averaged over all days of the years 2016–2018 for the S, E-W, and SE-SW orientations at 45° tilt. The area below the gray curve represents the average load profile. The E-W and SE-SW facing installation produce more electricity in the mornings and evenings with a lower midday peak, so they match the load profile more closely.

Figure 6.
Average annual total solar energy (2016–2018) measured at IMUK and normalized values (in %) with respect to the annual total maximum energy at 40° S. The solar energy decreases for higher or lower tilt angles and for other azimuth angles.
Figure 6.
Average annual total solar energy (2016–2018) measured at IMUK and normalized values (in %) with respect to the annual total maximum energy at 40° S. The solar energy decreases for higher or lower tilt angles and for other azimuth angles.
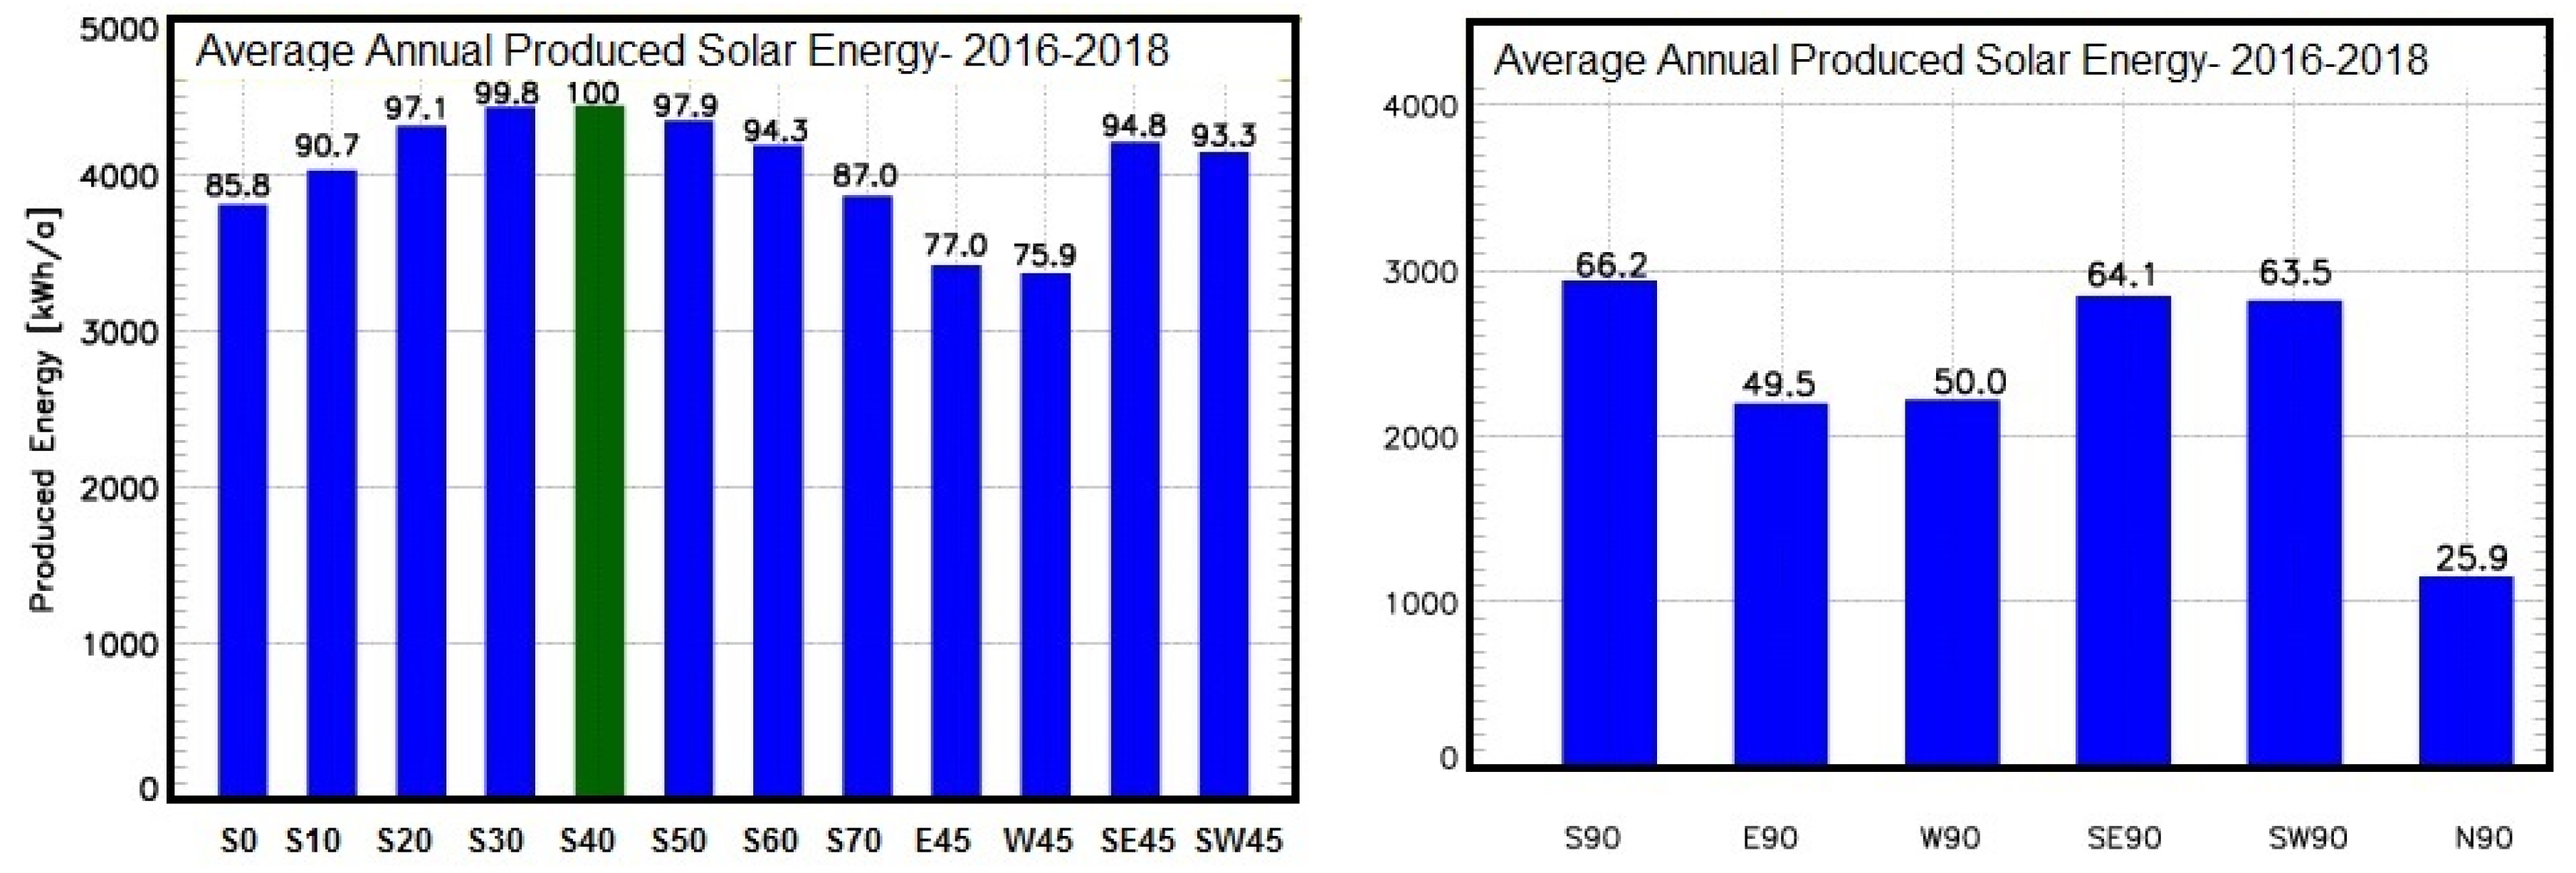
Figure 7.
The change in self-consumption (SC) rate with varying the module area by +/−50% in 5% steps. The change in SC rate depends on the orientations.
Figure 7.
The change in self-consumption (SC) rate with varying the module area by +/−50% in 5% steps. The change in SC rate depends on the orientations.

Figure 8.
The changes of PV FIT and electricity price in Germany (2000 to 2020). The FIT dropped approximately 80% for small rooftop PV installations and 90% for medium-size PV systems [42].
Figure 8.
The changes of PV FIT and electricity price in Germany (2000 to 2020). The FIT dropped approximately 80% for small rooftop PV installations and 90% for medium-size PV systems [42].

Figure 9.
Comparison between IMUK results and simulated values. The used PV simulation software underestimate self-consumption and degree of autarky at all studied orientations and tilt angles.
Figure 9.
Comparison between IMUK results and simulated values. The used PV simulation software underestimate self-consumption and degree of autarky at all studied orientations and tilt angles.


Table 1.
Annual PV energy produced in Hannover with respect to the optimal inclination [%] according to PVGIS.
Table 1.
Annual PV energy produced in Hannover with respect to the optimal inclination [%] according to PVGIS.
| East | ← | Azimuth | → | West | |||||||||||||||
|---|---|---|---|---|---|---|---|---|---|---|---|---|---|---|---|---|---|---|---|
| tilt | 90 | 80 | 70 | 60 | 50 | 40 | 30 | 20 | 10 | 0 | 10 | 20 | 30 | 40 | 50 | 60 | 70 | 80 | 90 |
| 0 | 86 | 86 | 86 | 86 | 86 | 86 | 86 | 86 | 86 | 86 | 86 | 86 | 86 | 86 | 86 | 86 | 86 | 86 | 86 |
| 10 | 86 | 87 | 88 | 89 | 90 | 91 | 92 | 92 | 93 | 93 | 93 | 92 | 92 | 91 | 90 | 89 | 88 | 87 | 86 |
| 20 | 84 | 86 | 88 | 90 | 92 | 94 | 95 | 96 | 97 | 97 | 97 | 96 | 96 | 94 | 93 | 91 | 89 | 87 | 84 |
| 30 | 81 | 84 | 87 | 90 | 93 | 95 | 97 | 98 | 99 | 99 | 99 | 98 | 97 | 96 | 93 | 91 | 88 | 85 | 81 |
| 40 | 78 | 82 | 85 | 89 | 92 | 94 | 96 | 98 | 99 | 100 | 99 | 98 | 97 | 95 | 92 | 89 | 86 | 82 | 78 |
| 50 | 74 | 78 | 82 | 86 | 89 | 92 | 94 | 96 | 97 | 97 | 97 | 96 | 95 | 92 | 90 | 87 | 83 | 79 | 74 |
| 60 | 70 | 74 | 78 | 82 | 85 | 88 | 90 | 92 | 93 | 93 | 93 | 92 | 91 | 89 | 86 | 82 | 79 | 74 | 70 |
| 70 | 65 | 69 | 73 | 76 | 80 | 82 | 84 | 86 | 87 | 87 | 87 | 86 | 85 | 83 | 80 | 77 | 73 | 69 | 65 |
| 80 | 59 | 63 | 67 | 70 | 73 | 75 | 77 | 78 | 79 | 80 | 79 | 79 | 78 | 76 | 73 | 70 | 67 | 64 | 60 |
| 90 | 53 | 57 | 60 | 63 | 65 | 67 | 69 | 69 | 70 | 70 | 70 | 70 | 69 | 68 | 66 | 63 | 60 | 57 | 54 |
Table 2.
Results of measurement for a PV size of 4.8 kWp at different tilt angles in Hannover, Germany.
Table 2.
Results of measurement for a PV size of 4.8 kWp at different tilt angles in Hannover, Germany.
| Orientation | S45 | E45 | W45 | E45+W45 | SE45 | SW45 | SE45 + SW45 | S90 | E90 | W90 | SE90 | SW90 | N90 | |
|---|---|---|---|---|---|---|---|---|---|---|---|---|---|---|
| Percentage of SS45 (%) | 100 | 76.2 | 75.0 | 75.6 | 94.6 | 93.1 | 93.8 | 66.8 | 49.8 | 50.3 | 64.6 | 64.4 | 25.8 | |
| Annual PV Generation (kWh/a) | 4145 | 3157 | 3111 | 3134 | 3921 | 3859 | 3890 | 2769 | 2064 | 2046 | 2678 | 2655 | 1069 | |
| SC rate (%) | 37.9 | 44.9 | 47.9 | 51.4 | 38.6 | 40.7 | 41.9 | 50.9 | 57.4 | 66.2 | 50.0 | 55.4 | 95.1 | |
| Autarky (%) | 39.2 | 35.4 | 37.2 | 40.3 | 37.8 | 39.2 | 40.7 | 35.2 | 29.6 | 34.5 | 33.4 | 36.7 | 25.4 | |
| Cost Ct/kWh | No FIT | 29.5 | 30.7 | 30.1 | 29.2 | 30.5 | 29.5 | 29.1 | 30.9 | 32.7 | 31.1 | 31.4 | 30.4 | 34.0 |
| With FIT | 22.0 | 25.6 | 25.3 | 24.7 | 23.0 | 22.8 | 22.5 | 27.0 | 30.2 | 29.1 | 27.6 | 27.1 | 33.9 | |
| IRR % Over 20 ys | No FIT | 1.59 | 0.20 | 0.84 | 1.90 | 1.10 | 1.57 | 2.09 | 0.13 | −2.15 | −0.19 | −0.53 | 0.70 | −4.23 |
| With FIT | 7.05 | 4.13 | 4.42 | 5.14 | 6.29 | 6.45 | 6.82 | 3.23 | 0.12 | 1.45 | 2.61 | 3.33 | −4.10 | |
Table 3.
Model parameters used in comparison.
| Parameter | Model (PVSol, PVSyst) |
|---|---|
| Modules | 4.8 kWp, mono, 24 modules |
| Inverter | ABB, 4.6 kW |
| Climate data | Meteonorm 7.2 |
| Transposition model | Perez-Ineichen model |
| Diffuse radiation model | Perez model |
Table 4.
Results of PV software PVSPL and PVSyst for a PV size of 4.8 kWp at different orientation and tilt angles.
Table 4.
Results of PV software PVSPL and PVSyst for a PV size of 4.8 kWp at different orientation and tilt angles.
| Orientation | S45 | E45 | W45 | E45 + W45 | SE45 | SW45 | SE45 + SW45 | S90 | E90 | W90 | SE90 | SW90 | NN90 |
|---|---|---|---|---|---|---|---|---|---|---|---|---|---|
| PVsyst | |||||||||||||
| Annual PV (kWh) | 4457 | 3596 | 3531 | 3564 | 4250 | 4174 | 4212 | 3161 | 2439 | 2362 | 3053 | 2938 | 1148 |
| Percentage of the max (%) | 100 | 79.5 | 79.3 | 78.7 | 94.8 | 94.1 | 93.9 | 71.0 | 55.1 | 54.6 | 68.4 | 67.2 | 26.0 |
| SC (%) | 32.9 | 40.7 | 38.9 | 43.1 | 34.9 | 33.9 | 36.1 | 40.7 | 49.5 | 46.6 | 42.3 | 40.9 | 85.7 |
| AD (%) | 36.2 | 35.6 | 34.0 | 37.4 | 36.4 | 35.1 | 37.3 | 31.8 | 30.1 | 28.0 | 31.9 | 30.3 | 24.6 |
| PVSOL | |||||||||||||
| Annual PV (kWh) | 4330 | 3425 | 3046 | 3148 | 4160 | 3857 | 3920 | 3012 | 2289 | 1975 | 2945 | 2629 | 1115 |
| Percentage of the max (%) | 100 | 77.8 | 68.7 | 71.3 | 95.9 | 88.3 | 90.1 | 69.9 | 53.1 | 45.9 | 68.4 | 61.1 | 25.8 |
| SC (%) | 32.3 | 39.9 | 43.1 | 44.5 | 33.4 | 35.6 | 35.6 | 40.7 | 50.4 | 57.0 | 41.5 | 45.6 | 89.0 |
| AD (%) | 34.7 | 33.4 | 31.9 | 34.1 | 34.5 | 33.8 | 34.5 | 30.6 | 28.8 | 28.1 | 30.5 | 29.9 | 24.7 |
© 2019 by the authors. Licensee MDPI, Basel, Switzerland. This article is an open access article distributed under the terms and conditions of the Creative Commons Attribution (CC BY) license (http://creativecommons.org/licenses/by/4.0/).
Share and Cite
MDPI and ACS Style
Mubarak, R.; Weide Luiz, E.; Seckmeyer, G. Why PV Modules Should Preferably No Longer Be Oriented to the South in the Near Future. Energies 2019, 12, 4528. https://doi.org/10.3390/en12234528
AMA Style
Mubarak R, Weide Luiz E, Seckmeyer G. Why PV Modules Should Preferably No Longer Be Oriented to the South in the Near Future. Energies. 2019; 12(23):4528. https://doi.org/10.3390/en12234528
Chicago/Turabian StyleMubarak, Riyad, Eduardo Weide Luiz, and Gunther Seckmeyer. 2019. "Why PV Modules Should Preferably No Longer Be Oriented to the South in the Near Future" Energies 12, no. 23: 4528. https://doi.org/10.3390/en12234528
Note that from the first issue of 2016, this journal uses article numbers instead of page numbers. See further details here.