Ignition of Welding Arc and UV Actinic Hazard Evaluation
by
 , ,
, ,
Andrzej Rybczyński
1,* ,
,
Agnieszka Wolska
2,
Mariusz Wisełka
2,
Jolanta Matusiak
3 and
Tomasz Pfeifer
4 1
GL Optic Polska Sp. z o.o. Sp. k., ul. Poznańska 70, 62-040 Puszczykowo, Poland
2
Central Institute for Labour Protection—National Research Institute, Department of Safety Engineering, Laboratory of Optical Radiation, ul. Czerniakowska 16, 00-701 Warsaw, Poland
3
Instytut Spawalnictwa, Welding Technologies Department, ul. Błogosławionego Czesława 16-18, 44-100 Gliwice, Poland
4
Instytut Spawalnictwa, Department of Resistance and Friction Welding, Adhesive Bonding and Environmental Engineering, ul. Błogosławionego Czesława 16-18, 44-100 Gliwice, Poland
*
Author to whom correspondence should be addressed.
Energies 2019, 12(3), 512; https://doi.org/10.3390/en12030512
Submission received: 15 January 2019
/
Revised: 1 February 2019
/
Accepted: 2 February 2019
/
Published: 6 February 2019
(This article belongs to the Special Issue Selected Papers from EEEIC 2018—18th International Conference on Environment and Electrical Engineering)
Abstract
:Welding arcs emit strong ultraviolet (UV) radiation, which could pose serious health risks for skin and eyes. According to Directive 2006/25/EC, UV hazard evaluation has to be performed in the working environment. The measurement of welding arc ignition radiation is a difficult task. This article describes the effort made to determine actinic radiant exposure levels during welding arc ignition in the controlled environment of a welding laboratory. A new method of UV actinic hazard evaluation from welding arc ignition radiation using a CCD spectroradiometer combined with a photometer is presented. The hazard of UV emitted in pulsed metal active gas welding (MAG-P) of construction steel is described. The duration of ignition peak in the study was in the range of 9–15 ms. The actinic radiant exposure during arc ignition over aversion response time was in the range of 0.26–1.12 J/m2. The daily exposure time can easily exceed the permissible exposure time obtained in our study, i.e., 13–34 s, which means that UV radiation form MAG-P arc welding is hazardous for workers in the vicinity of the welding arc. The measurement method presented in the article enables determination of radiant exposure of arc ignition radiation.
1. Introduction
Welding is an important technological process of joining materials by application of heat and/or pressure. Arc welding is a process used to join metals by using an electric arc to create enough heat to melt metal. Burning the arc between the electrode and metal piece produces a very high temperature, which causes melting of the joint area. Sources of optical radiation in the welding arc include: the arc column, the regions close to the electrode, the liquid metal transported across the welding arc, the molten pool, the heated region of the base material around the molten pool, and the heated end of the electrode wire [1]. This way, the optical radiation from the whole range of ultraviolet (UV), visible (VIS), and infrared (IR) radiation is a byproduct of the welding process. Directive 2006/25/EC [2], which specifies minimal requirements related to the health and safety of workers exposed to artificial optical radiation, is an obligatory document for all European Community countries. It lays down the criteria and scope of risk assessment, as well as exposure limit values (ELVs) to avoid adverse effects to eyes and skin due to exposure to artificial optical radiation. The Directive has its scientific basis in the International Commission of Non-Ionizing Radiation Protection (ICNIRP) guidelines published in 2004 [3]. ELVs for UV radiation stated in the 2004 guidelines have been repeated in the ICNIRP statement on UV protection of workers published in 2010 [4]. Directive statements had to be implemented into the law of each EC country by 2011. Risk assessment is the scientific approach to identify and quantify health hazards due to optical radiation [5] and assessment of such hazard is obligatory for employers, which means that each source of optical radiation in the working environment should be identified, and risk assessment should be performed. However, the determination of exposure level is often not a trivial task, especially in the case of technological sources like a welding arc, which is not stable in time.
A welding arc is one of the strongest technological sources of artificial optical radiation, especially in the ultraviolet and visible range [5,6,7,8,9,10,11,12,13,14,15]. It creates a wide range of risks for the skin and eyes of both welders and workers or people around the welding workstation [13,14,16,17,18,19,20,21]. Strong UV radiation is emitted by the welding arc into the surrounding environment, and a great number of workers at the workplaces, where welding is performed, are exposed to ultraviolet radiation (UVR). Among those workers are not only professional welders, but also non-professional welders, who perform welding occasionally or are engaged in non-welding tasks [14]. The measurements in the vicinity of the welding arc showed that actinic radiant exposure (i.e., an 8-h dose) for non-welding workers could reach about 360 J/m2 (which corresponds to 12×ELV, where ELV = 30 J/m2), and even about 164 J/m2 (5.5×ELV) in the non-welding areas. This poses a significant health risk to all workers present in the vicinity of the welding area [15,20]. Exposure to optical radiation when striking the arc could also pose hazard for the eyes of everybody present in the vicinity [7,9,14,22,23].
The worldwide population of professional welders is estimated at more than three million [21,24]. However, it is estimated that more than 110 million workers across the world are exposed to welding-related radiation [25]. This constitutes a significant number of workers who work in a hazardous welding environment. UV radiation emitted by the welding arc is one of the most important physical agents to consider during risk assessment. Exposure to UVR is a risk factor conducive to the development of: erythema [17,26], sunburn/burn [24,25], actinic keratosis [24,26], skin cancer: basal cell carcinoma (BCC) and squamous cell carcinoma (SCC) [18,24,25], cutaneous malignant melanoma (CMM) [24,26], cataract [21], photokeratoconjunctivitis, often known as “welders flash” [26,27], and ocular malignancy [18]. The International Agency for Research on Cancer (IARC) has identified ocular melanoma in welders as the main adverse health effect due to UV radiation emitted by welding arc [28]. In everyday practice, acute health effects of UV radiation, especially “welders flash”, occur frequently at workplaces where welding is being performed. It affects both welders and workers in the vicinity of the welding workstation [14].
As was mentioned before, the Directive [2] refers to the risks to the health and safety of workers due to adverse effects caused by exposure to artificial optical radiation to the eyes and skin. The requirements included in the Directive apply to workers exposed to optical radiation emitted by the welding arc, both welders and workers who perform their tasks near the welding station. The employer is obligated to perform risk assessment of optical radiation for all employees, not only welders, who are exposed to it. An appropriate exposure assessment must be established; in the case of welding, it is usually determined on the basis of the results of measurements made at workstations. The exposure level has to be evaluated in relation to the exposure limit values (ELVs) [2].
The measurement of optical radiation emitted by the welding arc is not a trivial task, largely because of arc emission, which is unstable in time, especially at the beginning, during arc ignition. The arc ignition process affects the subsequent arc welding process [29] and subsequently a stable welding process, which is essential for good joint quality [1]. For this reason, there are several methods of arc stability determination based on measurements and analysis of welding current intensity and voltage [30], noise emitted, arc light emission [1], or acoustic emission from the material. According to Suban and Tusek, an ideal welding arc could be characterized by at least the following properties: a uniform material transfer, constant arc length, and no spatters. It was proven that some welding parameters could influence the arc stability. For example the analysis of MIG/MAG (metal inert gas/metal active gas) welding process stability showed that the type of shielding gas influences the stability and should be selected according to the material transfer mode [30]. Many studies were carried out to measure optical radiation from the welding arc for the purpose of hazard evaluation, and they proved the strong influence of welding parameters on UV radiation emission [8,10,14,31]. The relative spectrum of arc emission depends mainly on the chemical composition of the welded material, but the absolute intensity of the radiation depends on the wire/electrode diameter, the chemical composition of material from which the electrode is made, current intensity, and arc voltage [5,8,10,13]. For example, the study of Nakashima et al. proved that the UV emission is more hazardous when the welding materials include magnesium and when the electrodes contain oxides [14]. Another study by Garcia-Guinea et al. drew attention to the relationship between ultraviolet emission and consumable electrode coatings’ mineralogy [31]. A strong effective irradiance dependence on the direction of emission from the arc was also proven [10,14]. The study of Okuno et al. for MAG welding with CO2 shielding gas showed that the maximum emission was at 50°–60° from the surface of the base metal. Another study by Nakashima et al. carried out for TIG welding showed the highest effective irradiance at 40° from the base metal, but at the same time, no dependence of effective irradiance versus the angle of inclination with respect to the welding direction was found [14]. The differences between the angles of maximum emission could be the result of different characteristic of the radiation reflected from the welded materials, because at those angles (40°–60°), both direct and indirect UV radiation (reflected from the welding pool, etc.) were measured.
The changes of UV emission during arc ignition are mentioned in many articles [7,8,9,10,12,14,15]. However, a literature overview revealed that only one publication, published in 1985 [7], was focused on the study of optical spectra for arc ignition. At that time, Eriksen made measurements using a diode array rapid scan spectrometer (DARSS), which allowed him to measure the complete spectrum in the UV and visible range in 5 ms [7]. Eriksen’s study was carried out for MIG welding and proved that after only one arc ignition (lasting less than 50 ms, but of emission exceeding more than 10-times the steady state of arc burning), the ELVs were much exceeded [7]. However, in the article from 1991, he wrote that the ignition phase of MIG/MAG welding arcs lasts approximately 25 ms [6]. It seems strange that in the period of about 30, except for one conference paper delivered in 2018 [23], there was no interest in this interesting phenomenon in relation to UV or blue light hazard evaluation (conclusion drawn from the overview of published studies and research reports). A few studies on optical hazard evaluation from arc welding report a high increase of optical radiation emission during arc ignition [8,9,10,12,14,15], but all of them relate to the results of Eriksen’s study [7]. Other studies related to UVR exposure assessment exclude arc ignition emission; measurements (or analysis) were started after the arc ignition [8,9,10,13,14]. Depending on the study and measuring equipment (polysulfone film, radiometer, CCD spectroradiometer), a single (or continuous) measurement duration of arc radiation (after arc ignition) was from 5 s–50 s, for example: 6 s [9], 50 s [12], 10 s [5], 5 s [14], and 15 s [13]. It could be concluded that studies conducted in the past confirmed that:
- UVR emitted by the welding arc is highly hazardous not only for welders, but also for non-welders performing the work in the vicinity, which is reflected in UV exposure-related skin and eye diseases found in this population group,
- ELVs to arc ignition could result in exceeding allowable daily exposure.
In view of the development of measurement techniques, it is now possible to try to determine the actinic radiant exposure from arc ignition and evaluate the actinic UV hazard and compare the results with those reported in the previous study of Eriksen [7]. Previous studies carried out by the present authors [23] indicated that the duration of UV radiation peak of arc ignition could be in the range from 20 ms–220 ms depending on the welding technique, and these results were consistent with the results obtained by Eriksen [7]. The estimated actinic irradiance during the ignition phase was 1.2–5-times bigger than the average actinic irradiance after ignition (maximum 26-times bigger for the worst case). It corresponded to actinic radiant exposure of 30 J/m2 reached from 0.5 s–37.5 s under average conditions and 0.1 s for the worst case [23].
The article presents a new measurement method of UV radiation emitted during the arc ignition phase based both on CCD spectroradiometric measurements of irradiance spectra and on a quick photometer/flicker meter (based on photodiode) for measurements of photocurrent distribution over time. Based on a set of measurements carried out for the MAG-P process for different welding currents, hazard assessment during the welding arc ignition phase was performed using two approaches of actinic radiant exposure determination. Particular attention has been paid to the actinic hazard to the eyes during the aversion response at unintentional exposure of the unprotected eye, which may adversely affect the health of workers in the vicinity of the welding station. The aim of the article is to present a new evaluation method of UV hazard arising from the welding arc ignition phase using a CCD spectroradiometer combined with a photometer/flicker meter.
2. Materials and Methods
Previous studies [23] have focused on the evaluation of UVR hazard during the arc ignition phase in three welding processes: TIG, MAG, and MAG-P. The welding arc ignition phase was recorded with a photometer capable of performing sampling with a frequency of 50 Hz. However, the analysis of the results obtained in that study suggested that improvement of the photocurrent recording quality during the ignition phase is needed, because the shape of photocurrent peak values was not precisely mapped. More accurate determination of actinic radiant exposure during the arc ignition was necessary. Therefore, in the present study, better measuring equipment was used to record the ignition phase photocurrent. Only one welding process, i.e., MAG-P, was investigated in the present study.
2.1. Site
The study was conducted in controlled environment of a welding laboratory of the leading Polish welding research center: the Instytut Spawalnictwa (the Institute of Welding). The laboratory room was a large, ventilated room, 15.5 m long, 5.5 m wide, and 3.6 m high. The walls and ceiling were painted with coating dedicated for welding rooms. The welding workstation was equipped with a dedicated local exhaust ventilation system, which removed fumes, dust, and gases without disturbing the airflow around the arc. The surroundings of the welding workplace were darkened by means of black welding screens, blinds, and curtains to reduce the influence of reflected UV radiation on the measured data. The illuminance of the measurement area was reduced to around 2.5 lx.
2.2. Welding Process Characteristics
The MAG-P process is commonly used in the Polish industry. It can be characterized by the presence of a noticeable period of increased optical radiation at the beginning of welding, which is the subject of this study. Welding arc parameters, such as current, voltage, gas flow, and wire speed, were controlled by a KEMPPI PRO5200 automated welding workstation and helped to reduce arc instability resulting from the limited precision of electrode guidance during manual welding. Measurements were performed for five settings of the welding current: 70 A, 100 A, 120 A, 180 A, and 240 A. The welding electrode was mounted in a constant position, while the welded material was mounted on a motor-driven rotating stand (Figure 1). The welding parameters are presented in Table 1.
2.3. Measuring Equipment
A simultaneous use of two measuring devices, a spectroradiometer based on CCD array detector and a photometer/flicker meter using silicon photodiode, is the distinguishing feature of the new method of the UV hazard evaluation. The recording time with the photometer/flicker meter was about 5.5 s. It started 1–2 s before arc ignition and continued during the arc ignition phase and about 3–4.5 s after arc ignition. The spectroradiometer recording lasted 10 s (10 repeated registrations). It was started 1–2 s after the arc ignition phase and was adjusted to the observation of the welding arc when the arc seemed to burn “smoothly”. The approximate duration of arc ignition was less than 50 ms, which corresponds to Eriksen’s studies [7].
2.3.1. Spectroradiometer System for Spectral Irradiance Recording
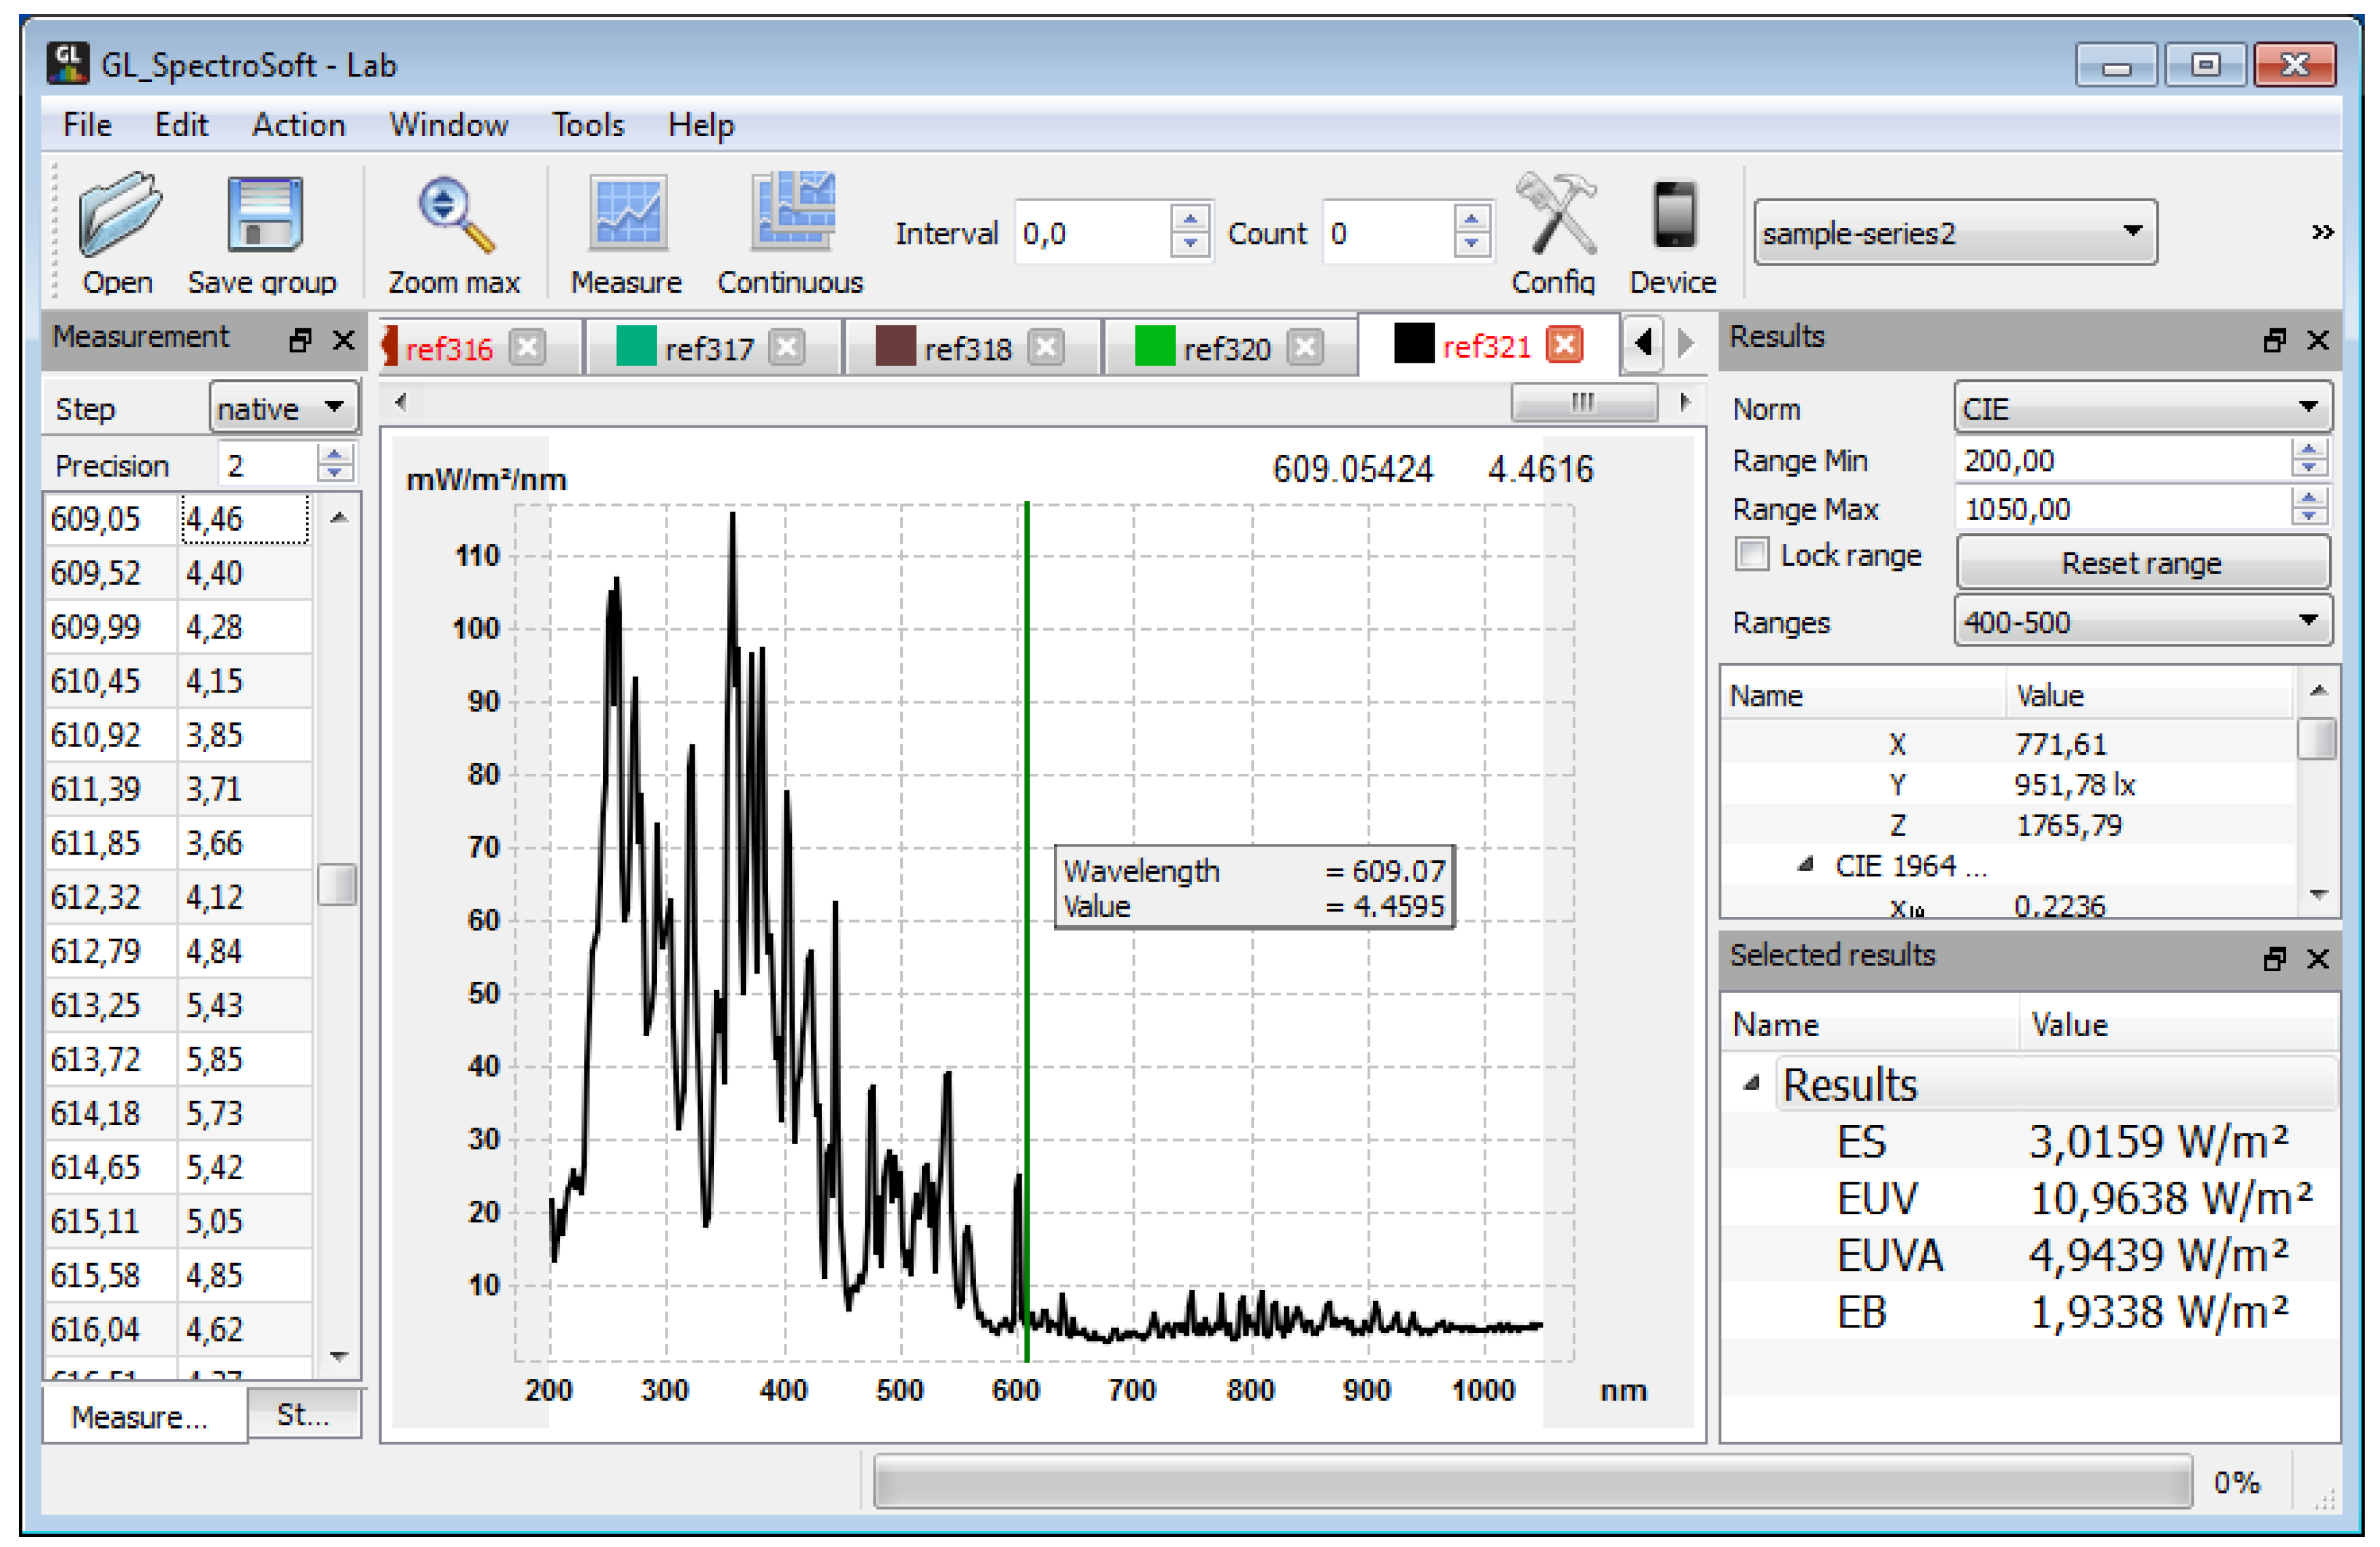
Measurements of average spectral irradiance during arc operation were performed with the GL Spectis 5.0 Touch spectroradiometer system manufactured by GL Optic. The spectroradiometer communicates with a PC via USB connection with spectral analysis software (GL SpectroSoft) for data analysis. This software was used to perform spectroradiometric measurement and read these values in real time. The true irradiances of the spectrum are displayed in the table and on the graph in mW/(m2 nm). Additionally, GL SpectroSoft provides automatic calculation of the whole range of UV parameters needed for photobiological hazard evaluation (Figure 2).
The CCD spectroradiometer is based on a back-thinned-type CCD detector combined with reflective diffraction grating and performs measurements in a wide spectral range, i.e., 200 nm–1050 nm. The device is characterized by a low level of stray light, which is 2 × 10 according to the manufacturer specification presented in Table 2. Considering the stray light level declared by the manufacturer, any possible influence of daylight on measured irradiance in the UV range caused by stray light can be neglected.
The irradiance probe of this instrument allows for extended spectral range measurements and can be used for the assessment of photobiological safety in conformity with EN 14255-1 [32]. The spectroradiometer probe has a 10-mm diffuser made from quartz glass, which guarantees correct transmittance in the UV range and provides cosine-corrected response in Class A (f2 < 1.5%). The probe was connected to the device by means of 1.5-m quartz fiber glass. The calibration of the probe was confirmed with a factory certificate of absolute spectral calibration dated three months before the measurement day. The angle of probe observation was limited to 30° by means of an additional diaphragm.
Factory calibration in the UV and blue light range was carried out with a deuterium lamp, which ensures higher accuracy in this range with respect to the halogen reference light source. Calibration was performed by direct comparison with the use of two standards of spectral irradiance manufactured by The All-Russian Research Institute for Optical and Physical Measurements Federal State Unitary Enterprise (VNIIOFI): tungsten-halogen lamp standard type KGM 24-275 and deuterium lamp standard type DL4 (30 W deuterium filament, type L6308, manufactured by Hamamatsu). Both the deuterium lamp and halogen lamp used for calibration of the spectroradiometer are standards traceable to VNIIOFI. Expanded uncertainty of spectral irradiance measurement with GLSpectis 5.0 Touch (expanded uncertainty of instrument calibration with coverage probability 95% and k = 2) has been determined according to the data provided by the manufacturer [33] and equals 6% for the range of 200 nm–220 nm, 5% for the range of 220 nm–400 nm, and 4% for the range of 400 nm–1050 nm. In the case of welding arc radiation measurement, the main source of error is the instability of arc radiation, which is much higher than the uncertainty of spectroradiometers.
Due to the rapid changes of instantaneous irradiance, automatic adjustment of the spectroradiometer integration time could not be used. The integration time of the spectroradiometer had to be manually adjusted for each measurement according to the maximum level of arc radiation. The adopted welding current range (arc radiation) and distance to the MAG-P process welding arc required an integration time of 1 s.
Regular blind measurement were performed to monitor changes of the dark current. Due to the dedicated algorithm in the firmware of Spectis 5.0 Touch, which reduces the influence of the detector’s temperature changes on the measurement result, the observed changes of dark current were small and quickly stabilized. The spectroradiometer can report the temperature of CCD detector. In case of any noticeable change of dark current or detector temperature, the detector was covered with opaque material showing the non-response of any spectral radiance, and the changes were compensated with the help of the dark current compensation procedure available in the spectroradiometer software. Furthermore, a test of the influence of electromagnetic emissions was performed to ensure the non-response of the spectroradiometer system from electromagnetic frequencies. Welding sessions were preceded with the measurement of ambient light. The results of ambient light measurements were then subtracted from the actual welding arc measurements during the results’ processing stage.
The average irradiance for each measurement session was calculated as the arithmetic mean of 10 recordings, based on the recommendation for good practice in measurements using diode-array detectors [6].
2.3.2. Photometer/Flicker Meter for Photocurrent Recording
Due to the constraints of minimum integration time required by the spectroradiometer, the variability of the arc irradiance in the phase of ignition of the welding arc was recorded using the photometer/flicker meter (GL Photometer03 manufactured by GL Optic).
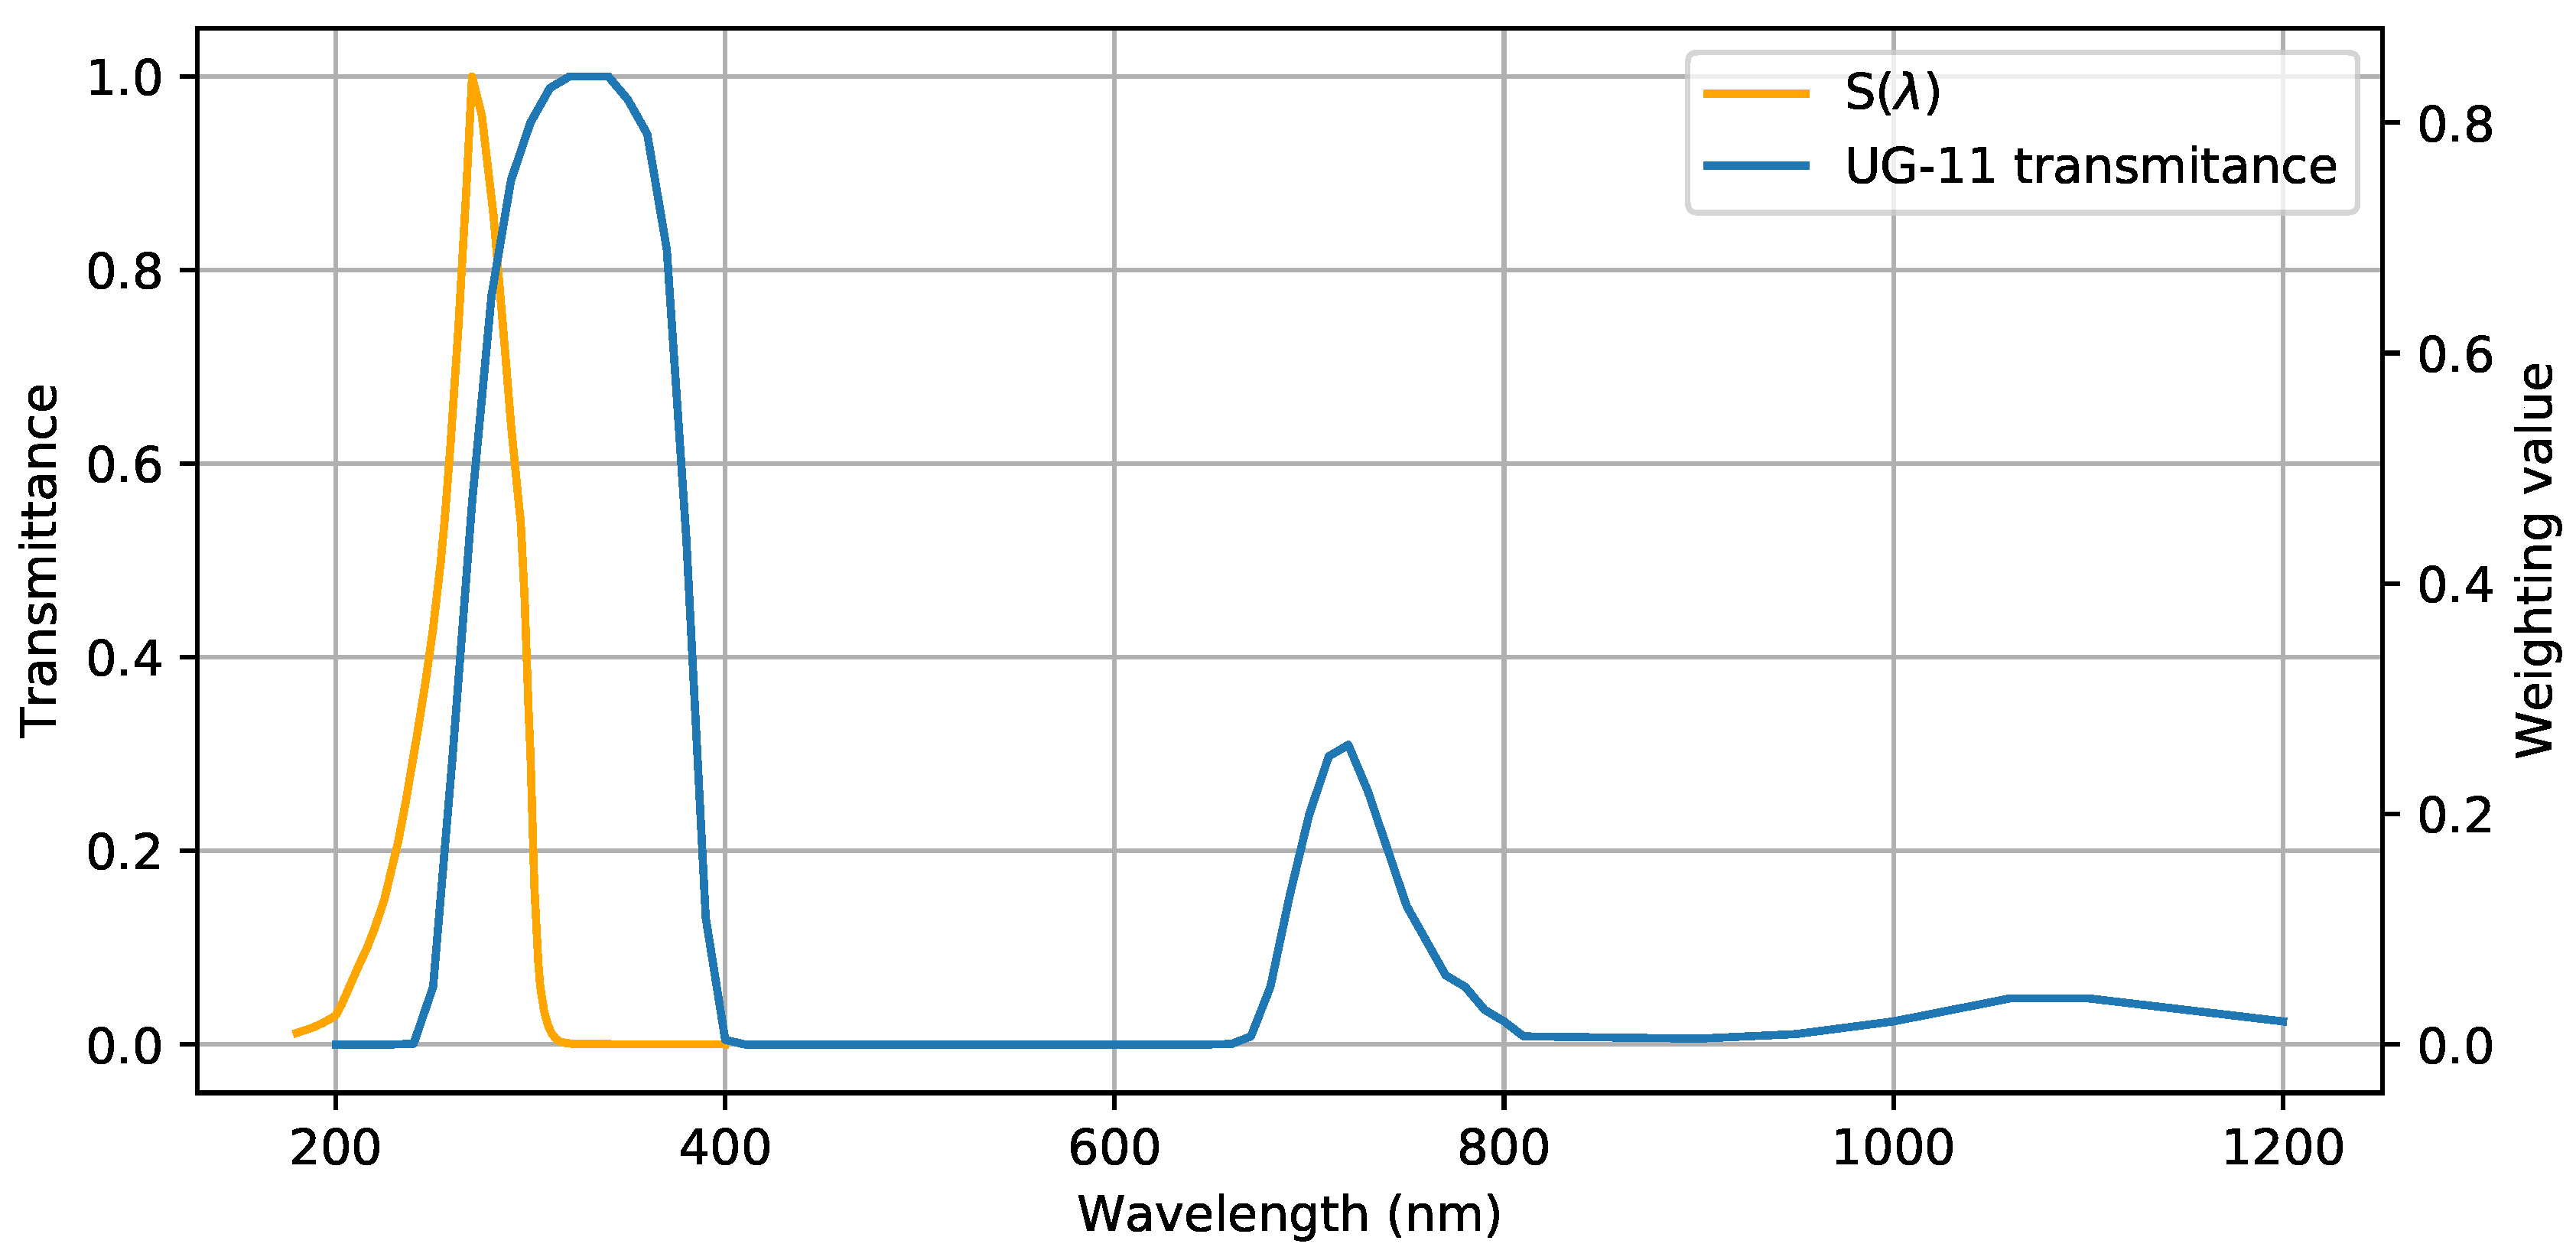
The photometer measures light with a silicon diode (manufactured by Hamamatsu). The device used in the experiment was additionally equipped with a UV transmitting filter UG11 (manufactured by Schott [34]). Transmittance of this filter related to actinic relative spectral effectiveness S() is presented in Figure A1 (Appendix A.1). The purpose of this filter was to limit the impact of visible and partly infrared radiation on the measurement result, especially radiation from welding arc. Considering this fact and also the low level of illuminance from visible light sources observed at the experiment workplace, the assumption was made that a change of a recorded detector photocurrent is proportional to the change of actinic irradiance in UV.
The calibration of photometer/flicker meter was performed in the laboratory conditions with tungsten-halogen lamp standard, type KGM24-275, manufacured by VNIIOFI. The direct readings of the photometer’s detector photocurrent were compared with spectroradiometric irradiance measurements of UV radiation. The linearity of photometer was confirmed (linear approximation , where the coefficient of determination R2 = 0.99).
The selected photometer can perform a series of measurements with adjustable frequency in the range from 31.25 kHz–200 kHz, which corresponds to a sampling time of 32 s–5 s. For the purposes of the experiment, a frequency of 31.25 kHz has been selected, since the use of a higher sampling rate (i.e., about 0.03 ms) does not lead to a significant increase in the accuracy of the recorded distribution of photocurrent over the time of arc ignition. It is worth emphasizing that this is an over 6000-times higher sampling frequency than that used in previous experiments performed by Eriksen [7]. The linearity of the photometer declared by the manufacturer is ± 2%.
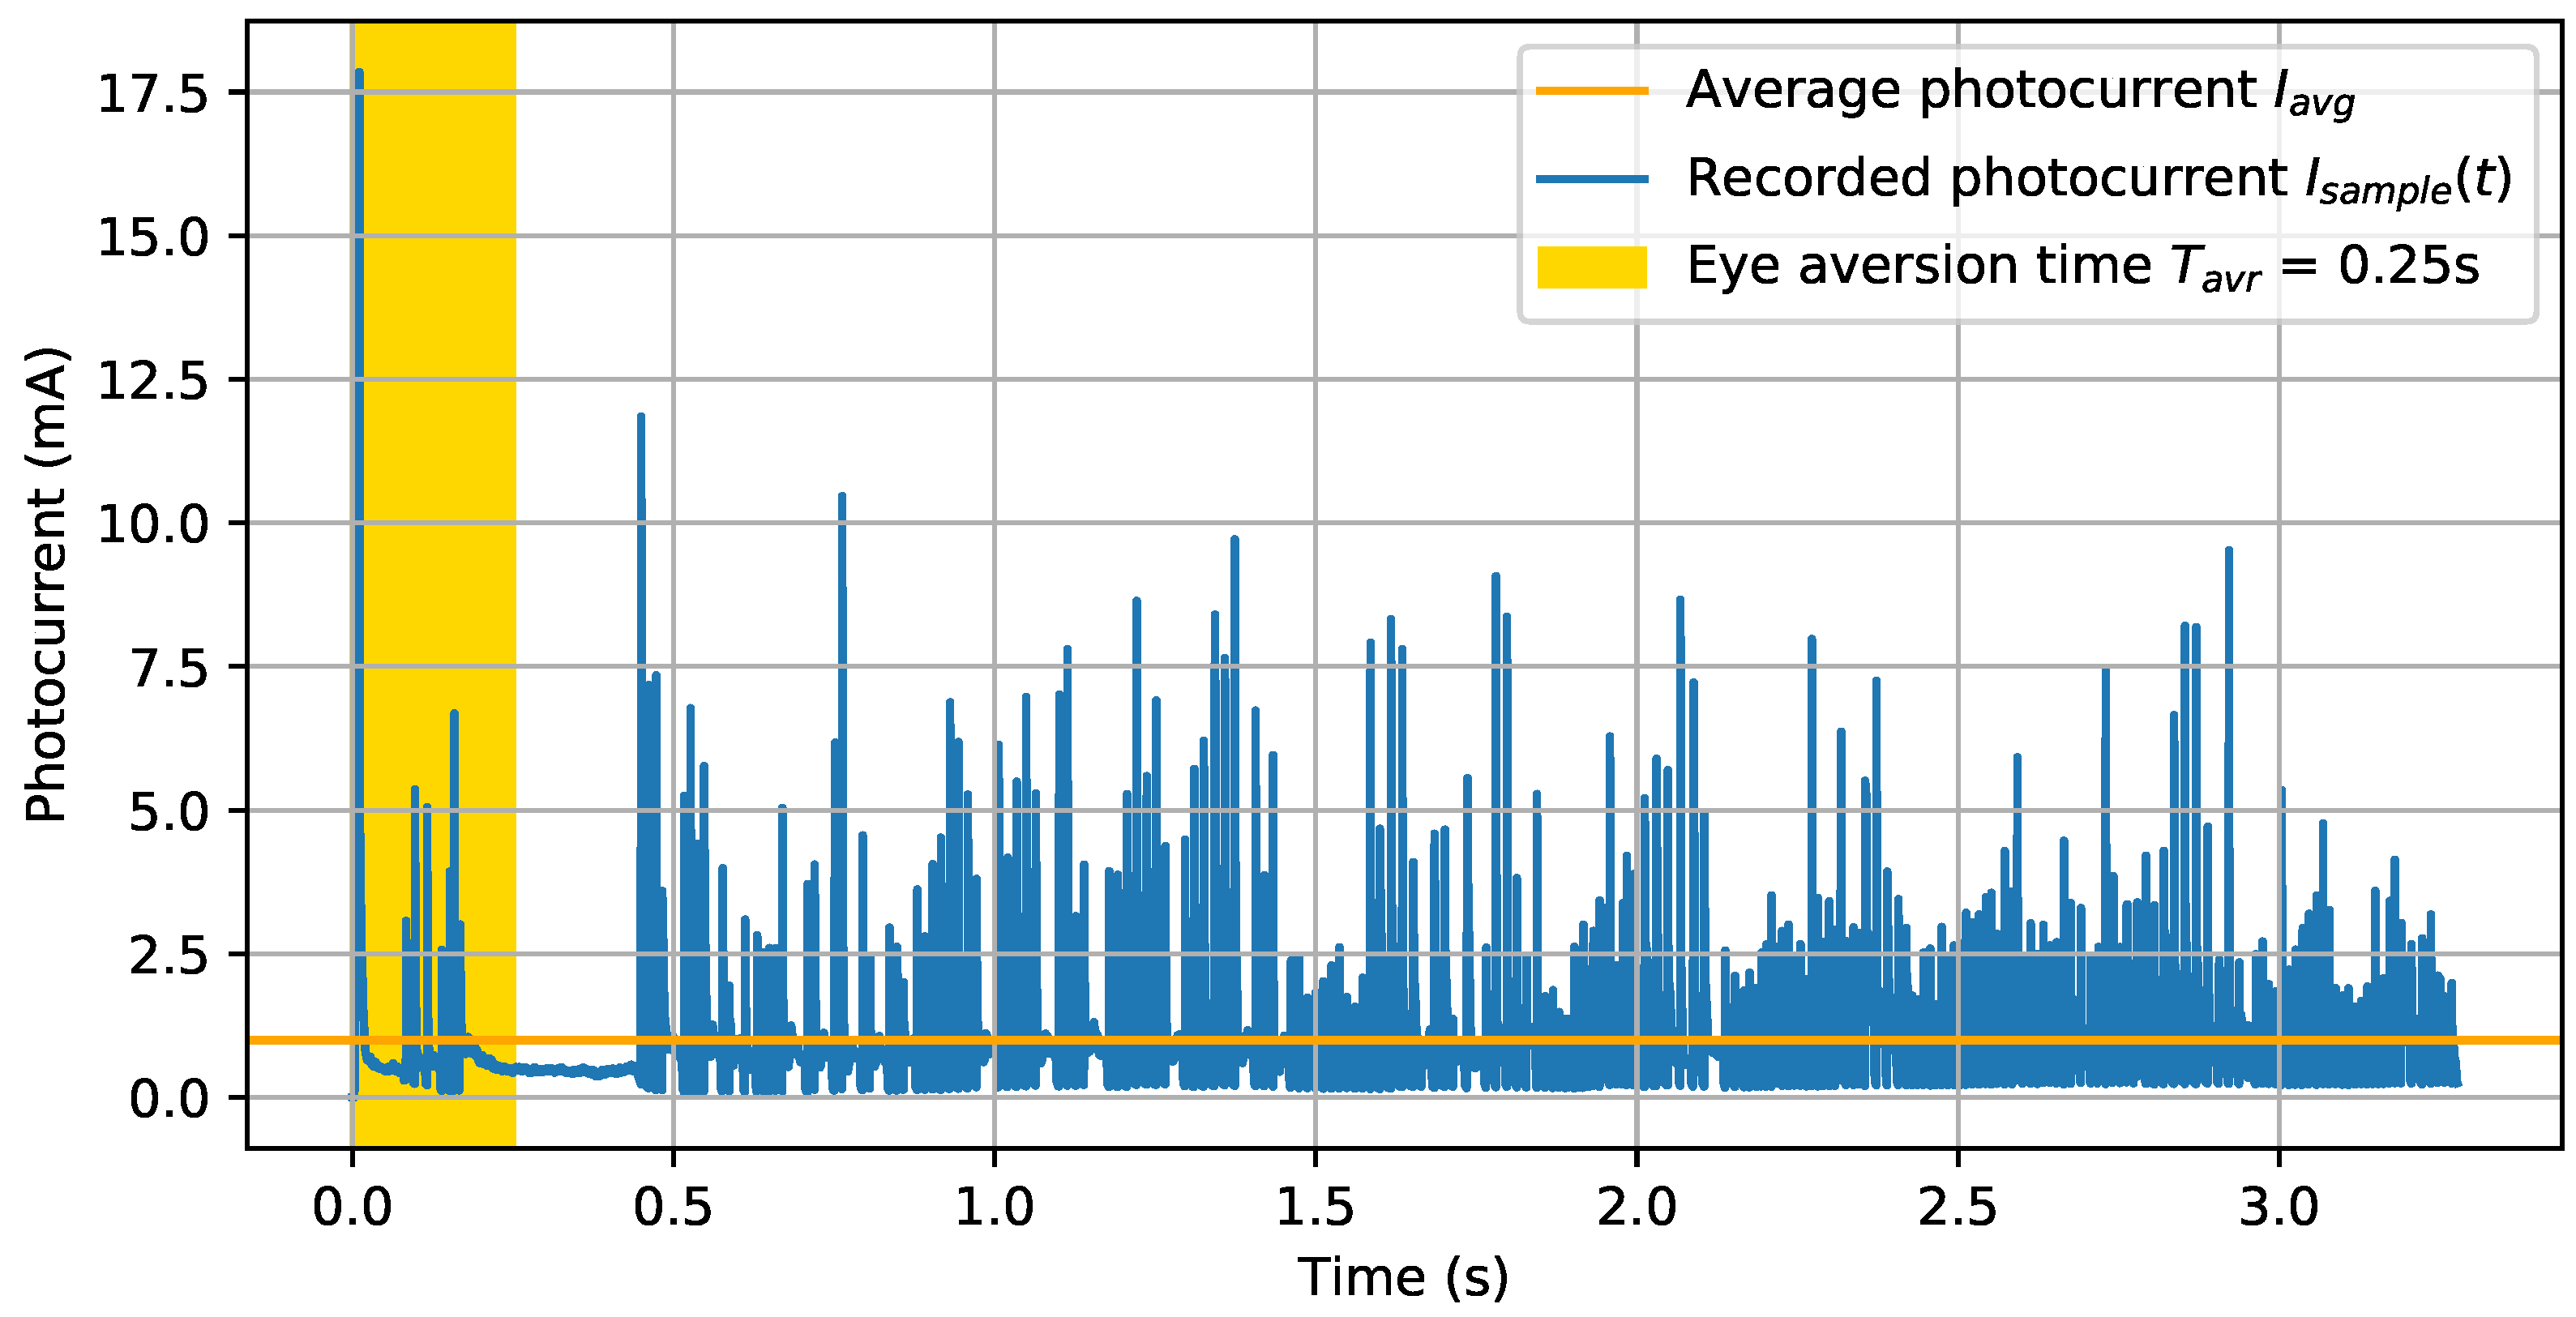
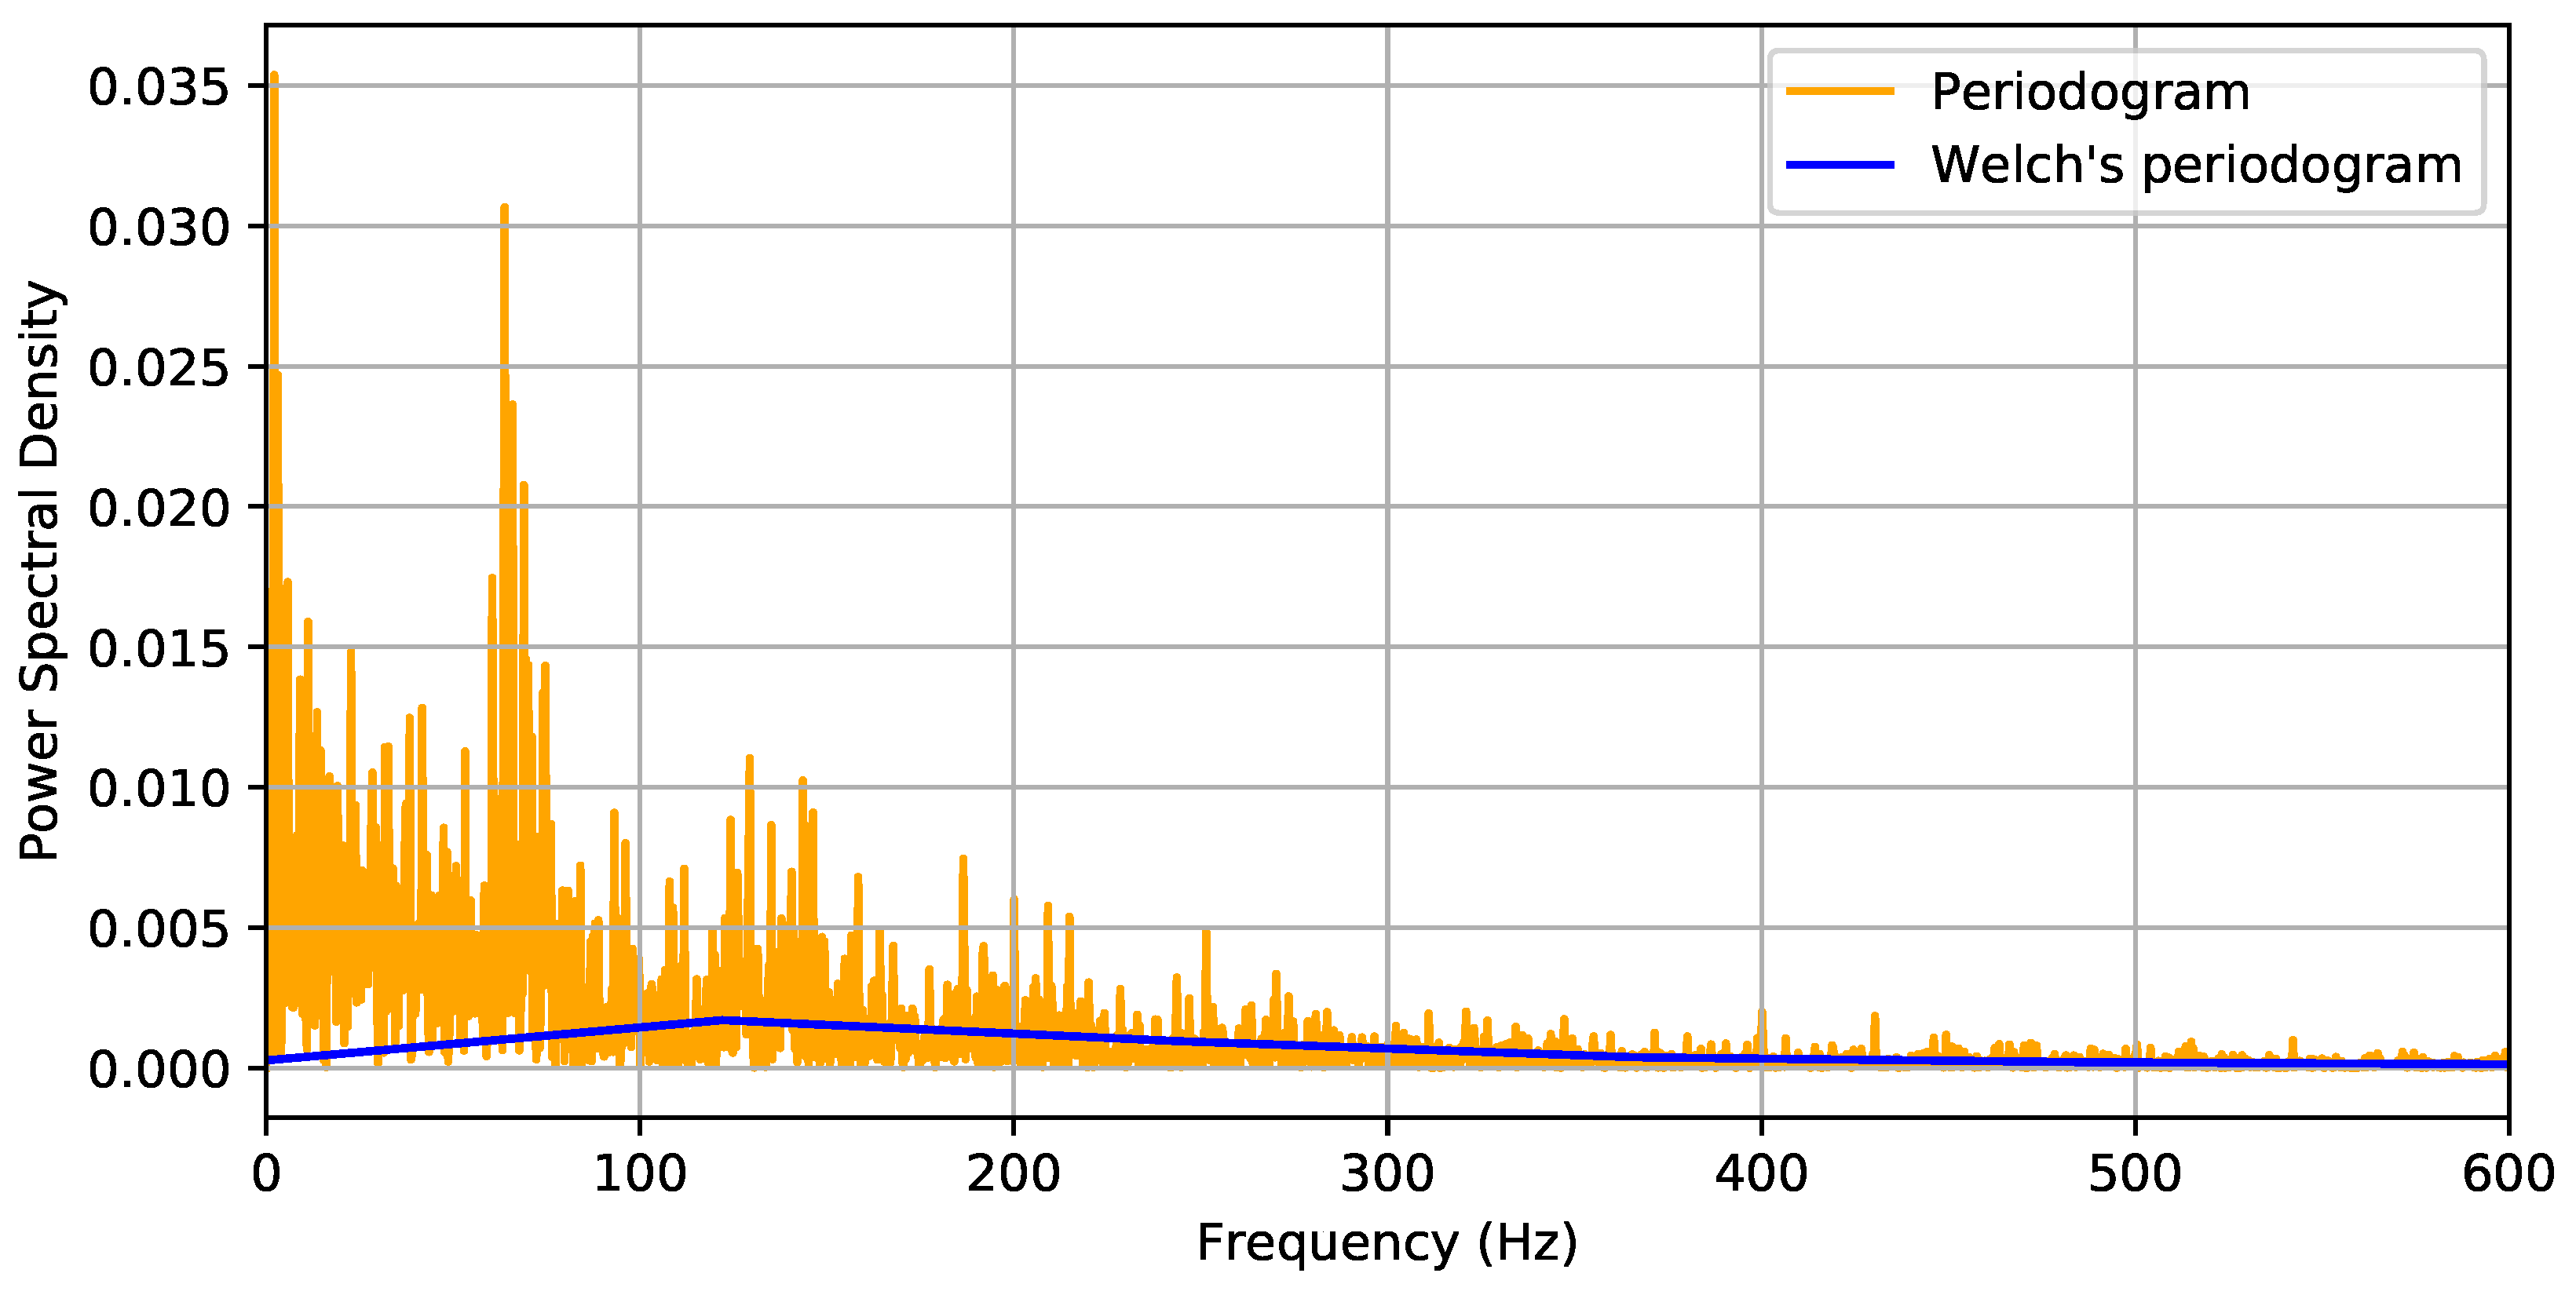
For the welding process under study, a recording of the arc ignition phase was performed. The first 5.5 s of welding arc emission were recorded. The selected sampling frequency of 31.25 kHz for this duration resulted in the series of 163,840 samples of the detector photocurrent. An example of the power spectral density of registered photocurrent values is presented in Figure A2 (Appendix A.2), and the properties of registered photocurrent series are shown in Table A1 (Appendix A.2). Then, the actual ignition peak at the very beginning of the welding action was identified, and the data before this point were rejected from further analysis (Figure 3). The average photocurrent of samples series (in mA) was calculated, and the photocurrent of each sample in the series was represented as the ratio of .
2.4. Measurement Geometry
The measuring head of the spectroradiometer and the detector of the photometer/flicker meter were installed on a tripod in front of the rotating welding stand. The position of the welding torch was adjusted during welding to a small extent. Torch position changes were perpendicular to the line of observation determined by the detectors.
Distance L between the measuring head and welding arc was 1.0 m. The measuring probe was mounted at the height D = 0.86 m, while the height d of the rotating stand was at 0.76 m (Figure 1). The applied geometry of measurement resulted in the observation angle between the measuring axis and rotating stand plane being equal to 6°. Although the highest actinic irradiance can be expected for an observation angle around 40° [14] or 50° [10], the angle was selected to capture mostly direct radiation emitted by the arc and limit the reflected radiation from the welded material.
2.5. Actinic Irradiance Determination
The analysis of photobiological hazard presented in this paper was based on actinic irradiance understood as irradiance within the UV wavelength range of 180 nm–400 nm, effective for adverse effects on human eyes and skin. The actinic irradiance is defined as the spectral irradiance distribution spectrally weighted by action spectrum defined in Directive 2006/25/EC [2] or ICNIRP [4] and integrated with Equation (1).
where:
- = actinic irradiance (W/m2)
- = spectral irradiance from measurement (W/(m2 nm))
- = actinic relative spectral effectiveness factor
- = bandwidth of the measurement.
Equation (2) expresses the maximum permissible exposure time based on actinic ELV. In the case of GL Spectis 5.0 Touch used for spectral measurement, effective irradiance , as well as other parameters related to photobiological hazard evaluation are automatically calculated by analytic software GL SpectroSoft provided together with the spectroradiometer (Figure 2). The actinic irradiance is expressed in Watts per square meter (W/m2). Actinic irradiance accumulated in selected time interval is defined as actinic radiant exposure.
The base for evaluation of actinic irradiance of the ignition peak was the arithmetic mean of actinic irradiance of 10 spectroradiometric measurements (performed after the ignition phase). For each series of 10 measurements, the maximum , the minimum , and the arithmetic mean were calculated. Average spectral irradiance distributions for different welding currents are presented in Figure A3 (Appendix A.2). Then, the standard deviation of the mean was determined (see Table 3). Based on the result, the expanded uncertainty was estimated for coverage factor k = 2.
The actinic irradiance of each sample was referred to the average actinic irradiance , average photocurrent , and photocurrent of each sample in the series and was calculated according to Equation (3).
2.6. Actinic Radiant Exposure Determination
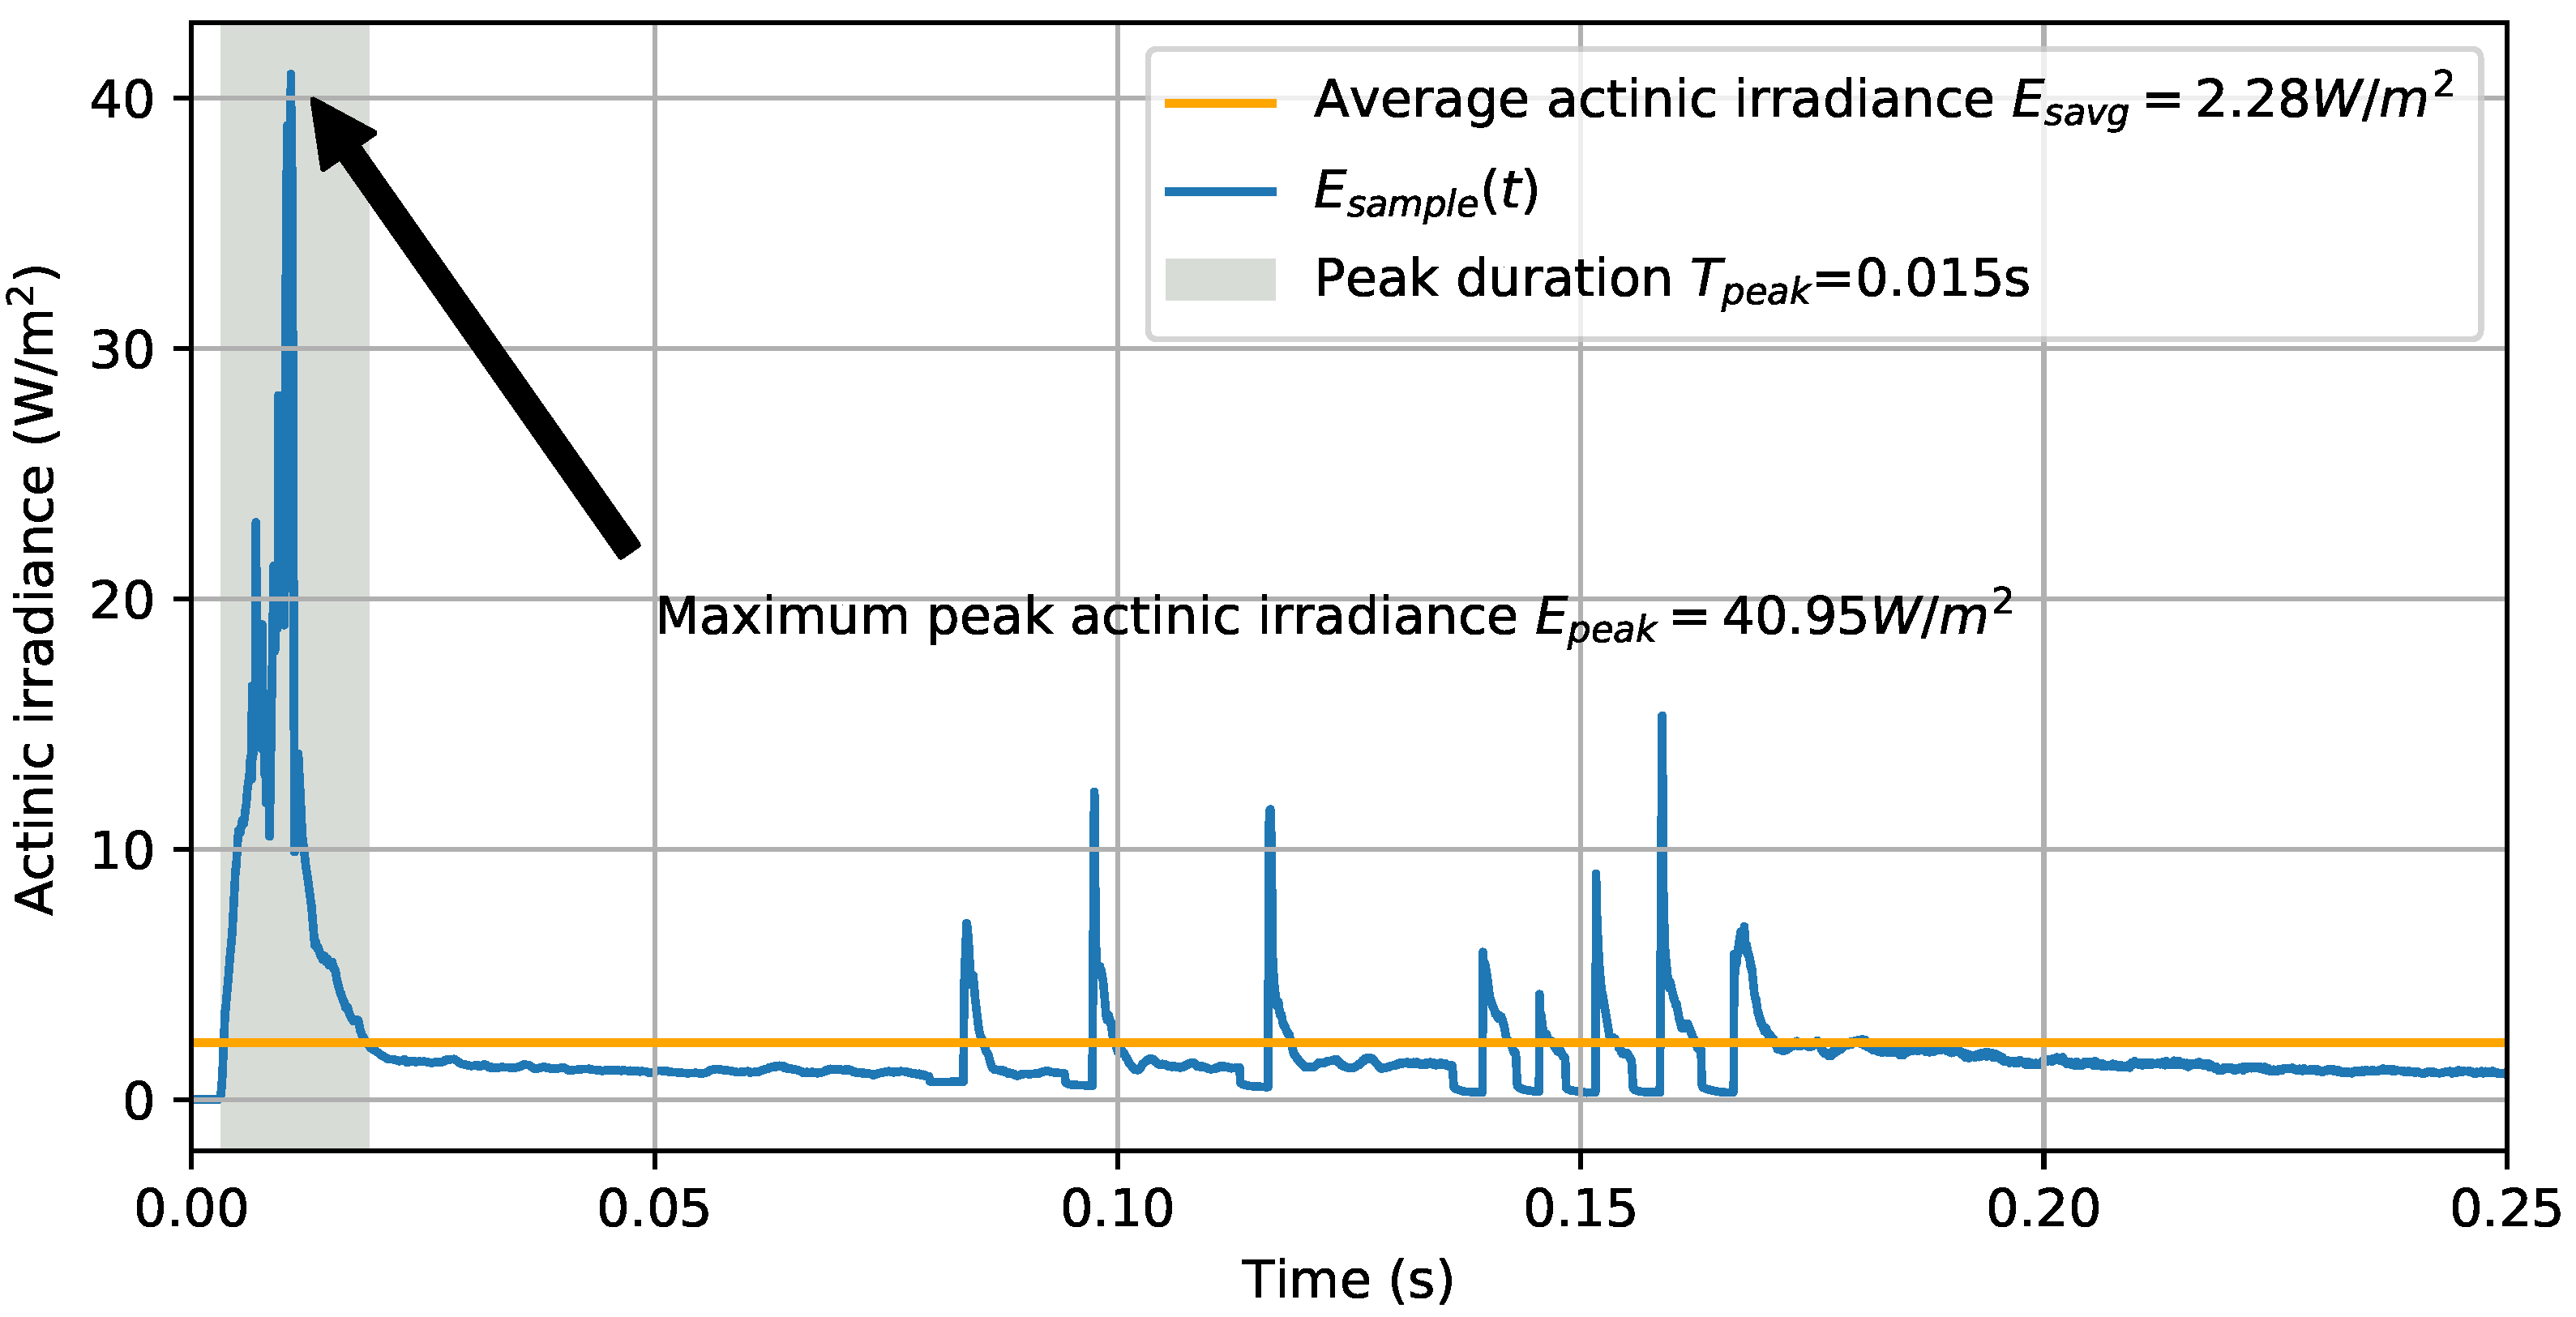
Two approaches have been used in the current study to determine actinic radiant exposure during the arc ignition phase, which was then applied to evaluate actinic hazard to eyes during aversion response time. The first approach, used also in the study of Rybczyński et al. [23], is based on the calculation as a product of maximum registered actinic irradiance of arc ignition (maximum peak actinic irradiance) and duration of arc ignition (without consideration of the shape of that peak output) (see Figure 4). The duration of ignition was defined for the purpose of these calculations as a period during the first 50 ms of welding action (according to [7]) when the recorded actinic irradiance was higher than average actinic irradiance (Figure 4).
The weighted average (Equation (4)) was used to calculate total actinic irradiance (Index 1 identifies the first approach) corresponding to eye aversion time and in the next step to calculate total actinic radiant exposure during this period (Equation (5)). The assumption was that duration will not exceed eye aversion time equal to 0.25 s. A maximum permissible time of exposure was calculated for each welding current with Equation (7) based on ELV = 30 [2].
The results of previous studies based on this method [23] indicated the possibility of exceeding the ELV for the MAG-P process with the duration of just one glance from a distance of 1.4 m. However, further analysis of arc radiation runs obtained in those studies suggested that improvement of the quality of recording of the ignition phase may lead to more accurate determination of actinic radiant exposure taking into account not only its maximum value, but the real shape of the peak output.
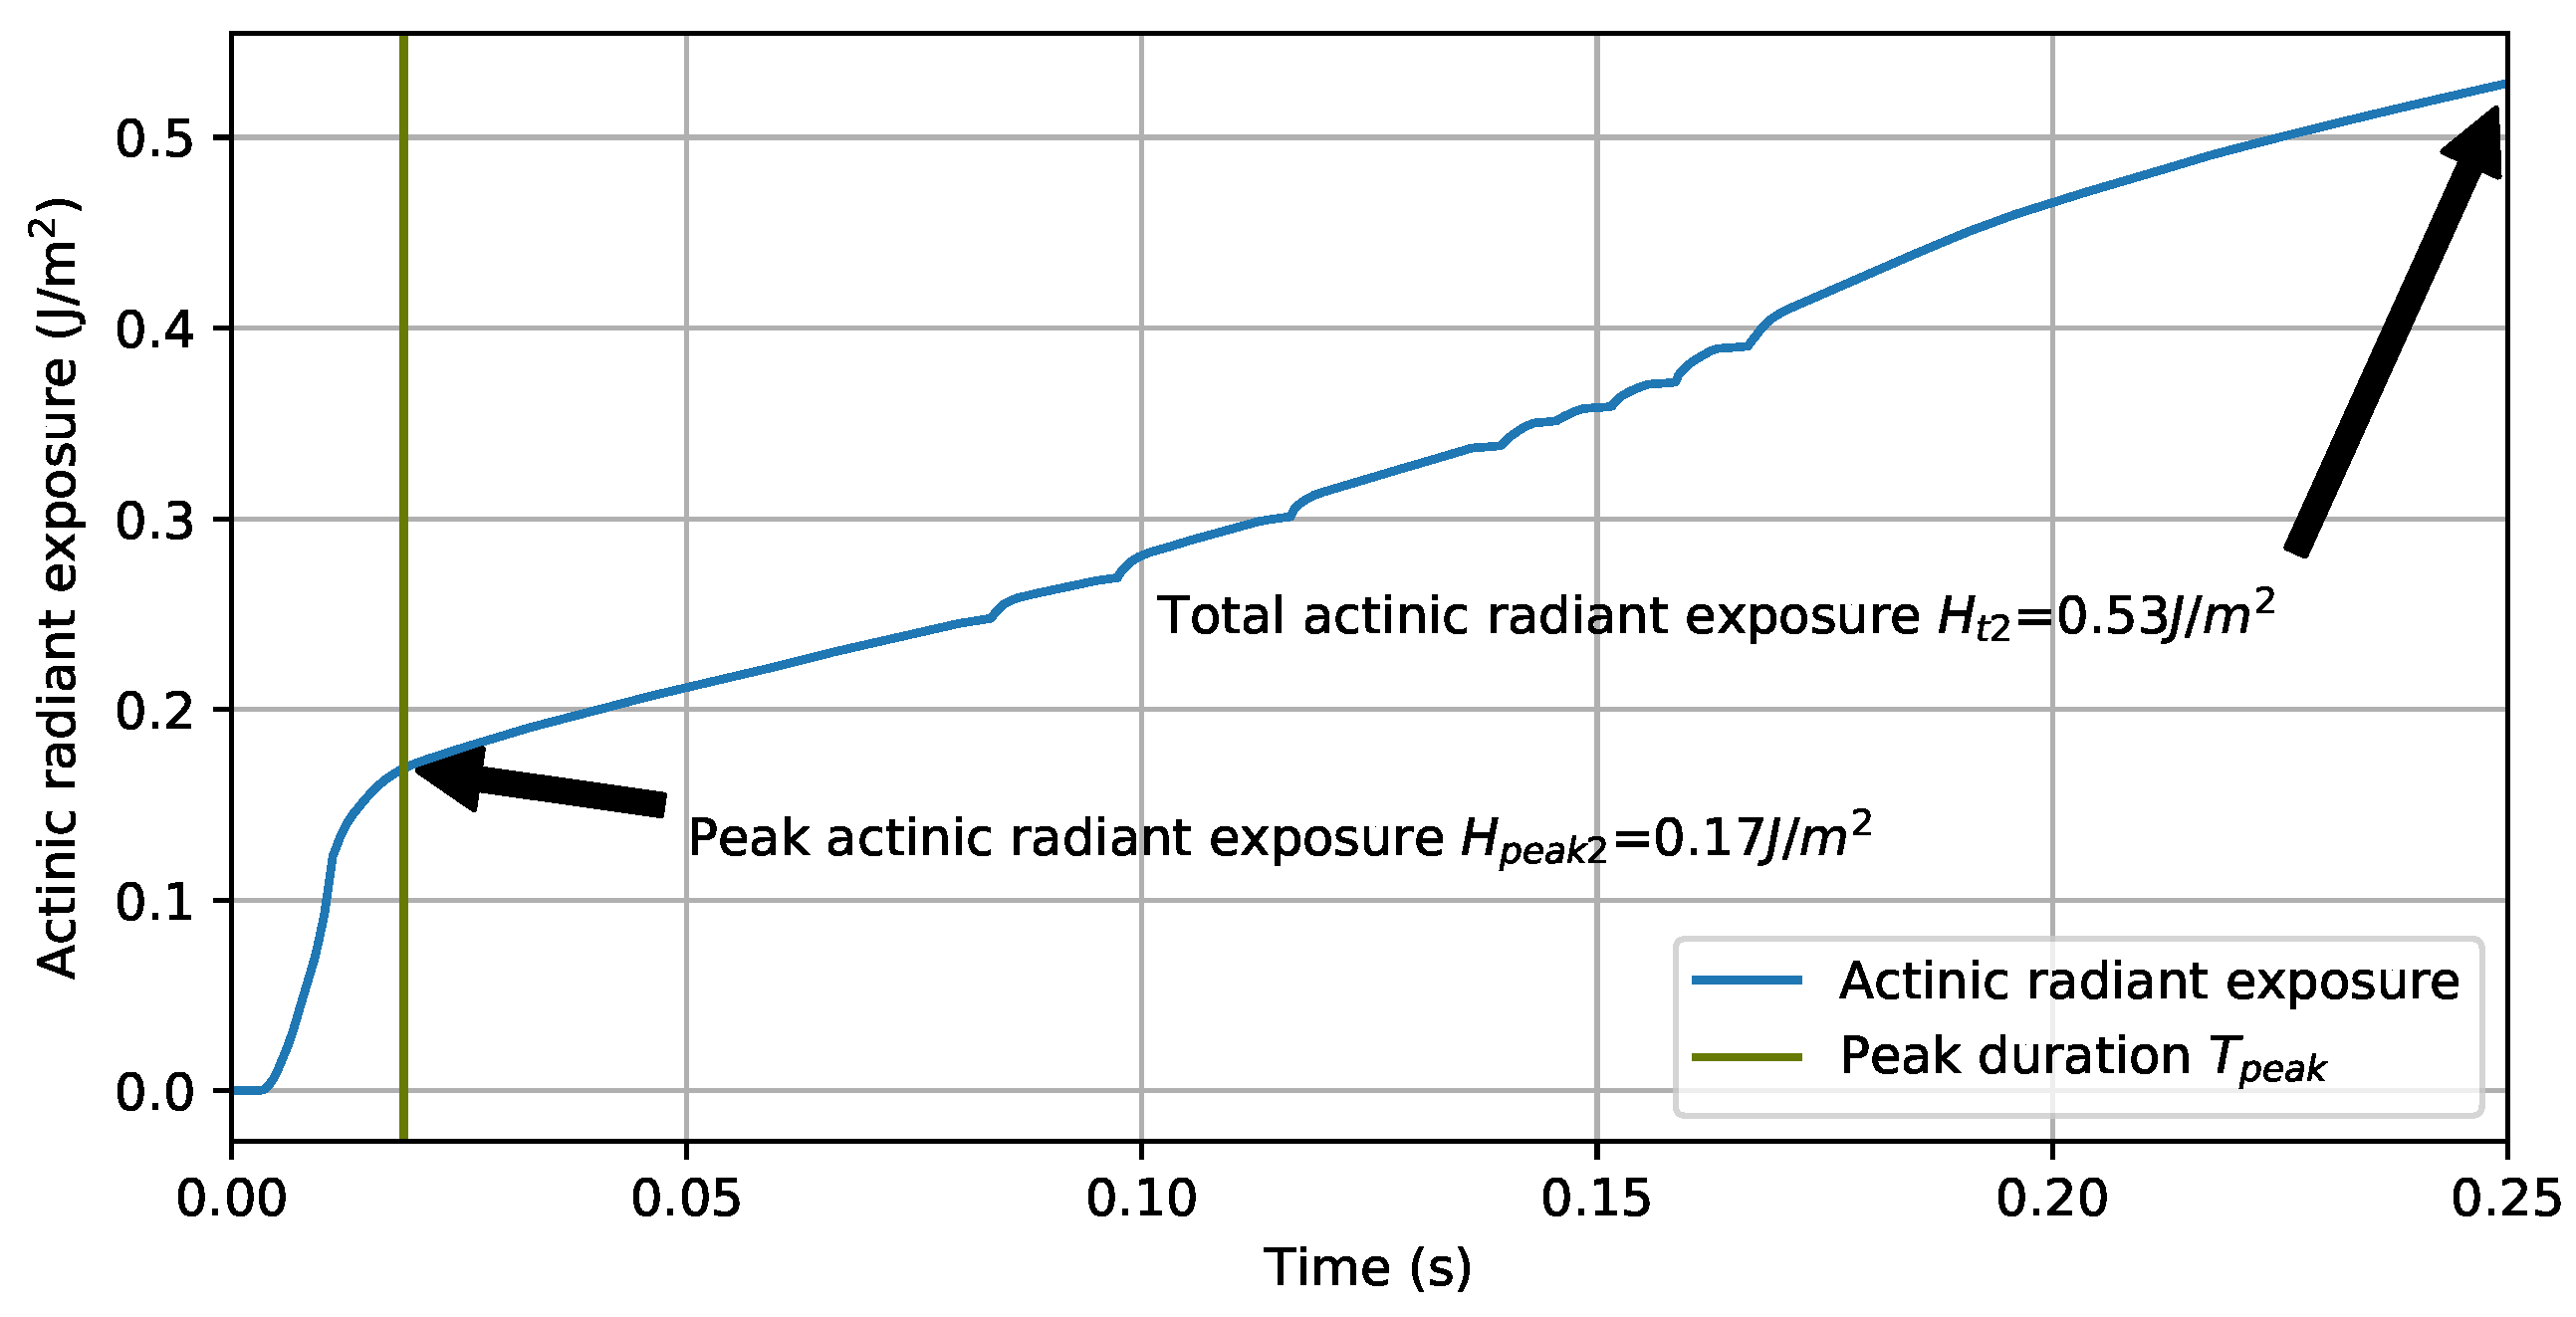
Therefore, the second approach used in the current study is based on the integration of irradiances recorded during the ignition phase taking into account the real shape of the peak output (Figure 4). This new approach was possible due to the use of a more adequate device for recording of photocurrent to determine the shape of the peak and then calculate actinic irradiance.
Actinic radiant exposures in this approach were calculated by summing up individual actinic irradiances obtained from Equation (3) (Figure 5). Actinic radiant exposure of peak (Index 2 was used for the second approach) was calculated using Equation (8), while the total actinic radiant exposure was calculated with Equation (9). In correspondence with the first approach, the maximum permissible time of exposure was determined with Equation (11).
The results obtained from both approaches were compared to determine the differences in evaluation of UV radiation actinic hazard during the welding arc ignition and the potential impact of the applied approach on risk assessment.
3. Results
An ignition peak can be identified for each registered distribution of photocurrent over time, although higher actinic irradiances were observed for lower welding currents. The time of ignition peak ranged from 0.009 s–0.015 s. The total actinic radiant exposure during the adopted 0.25 s (equal to eye aversion response time) after the start of welding arc ignition was calculated by applying both approaches described above. The total actinic radiant exposures calculated for the time longer than the adopted eye aversion time are presented in the Table A2 and Table A3 (Appendix A.3).
The results of the first approach of UV evaluation are presented in Table 4. The data obtained in the first approach can be characterized by large data scatter. The maximum peak actinic irradiance tends to be biggest for the smallest welding arc current, i.e., 70 A, then it decreases at 100 A, and increases at 120 A, and finally again decreases at 180 A, where it reaches its minimum. At first glance, this was surprising for us, so we repeated the measurement series for those currents a few times. The results revealed the same tendency.
The average actinic irradiance after the ignition phase increased according to the welding current; however, the increase was not simply proportional; in the range between 120 A and 240 A, it seemed to be approximately constant. Therefore, it could mean that it was probably related to the change in the mode of metal transfer in the arc during ignition and increasing amount of welding fumes close to the arc. The decrease of irradiance in the range of welding arc currents between 240 A and 400 A was also observed by Okuno et al. [10] during the measurement of effective irradiance during MAG welding with solid wire. The authors [10] attributed this decrease to the change in the mode of metal transfer in the arc from dip mode through globular mode to spray mode.
As the product of maximum peak actinic irradiance and peak duration, the maximum peak actinic radiant exposure for 70 A was about 5.3-times bigger than that for 180 A. However, when we compare the total actinic radiant exposure for different welding currents, the biggest one is for 120 A, and it is 1.9-times bigger than for 180 A (the smallest one). However, the big difference in peak actinic radiant exposure between 70 A and 180 A has been compensated during the arc emission after ignition (over 0.25 s), so the ratio of total actinic radiant exposures decreased to about 1.4. The calculated peak actinic radiant exposure and total actinic radiant exposure of the welding arc determined with the second approach are presented in Table 5. Additionally, the last column presents the ratio between total radiant exposures determined using both approaches. The calculations of radiant exposure were based on the same average actinic irradiances and recorded data as in the first approach. The peak actinic radiant exposure was the biggest for 120 A and approximately the same for 70-A welding current. The smallest one was for 180 A. The ratio between the maximum and minimum of the above-mentioned values was 2.83. Still, when we look at the total actinic radiant exposure, we can observe its increase with welding current increasing, with one exception for 180 A. The biggest one is for 240 A and the smallest for 100 A, giving the biggest/smallest ratio of 2.81.
The last column in Table 5 presents the ratio of total actinic radiant exposures obtained using both approaches. This way, we could see the differences of the determined radiant exposures for actinic hazard evaluation. It could be noticed that with the increase of the welding current, the ratio decreased from about three (at 70 A) to about one (at 240 A), which proves that radiant exposure using the first approach, especially for smaller welding currents, was overestimated. However, for a longer time of exposure like 3 s, the ratio of actinic radiant exposures was approximately 1.0, which suggests that the approach used for calculation was less significant and the contribution of peak radiant exposure decreased (see Appendix A.3).
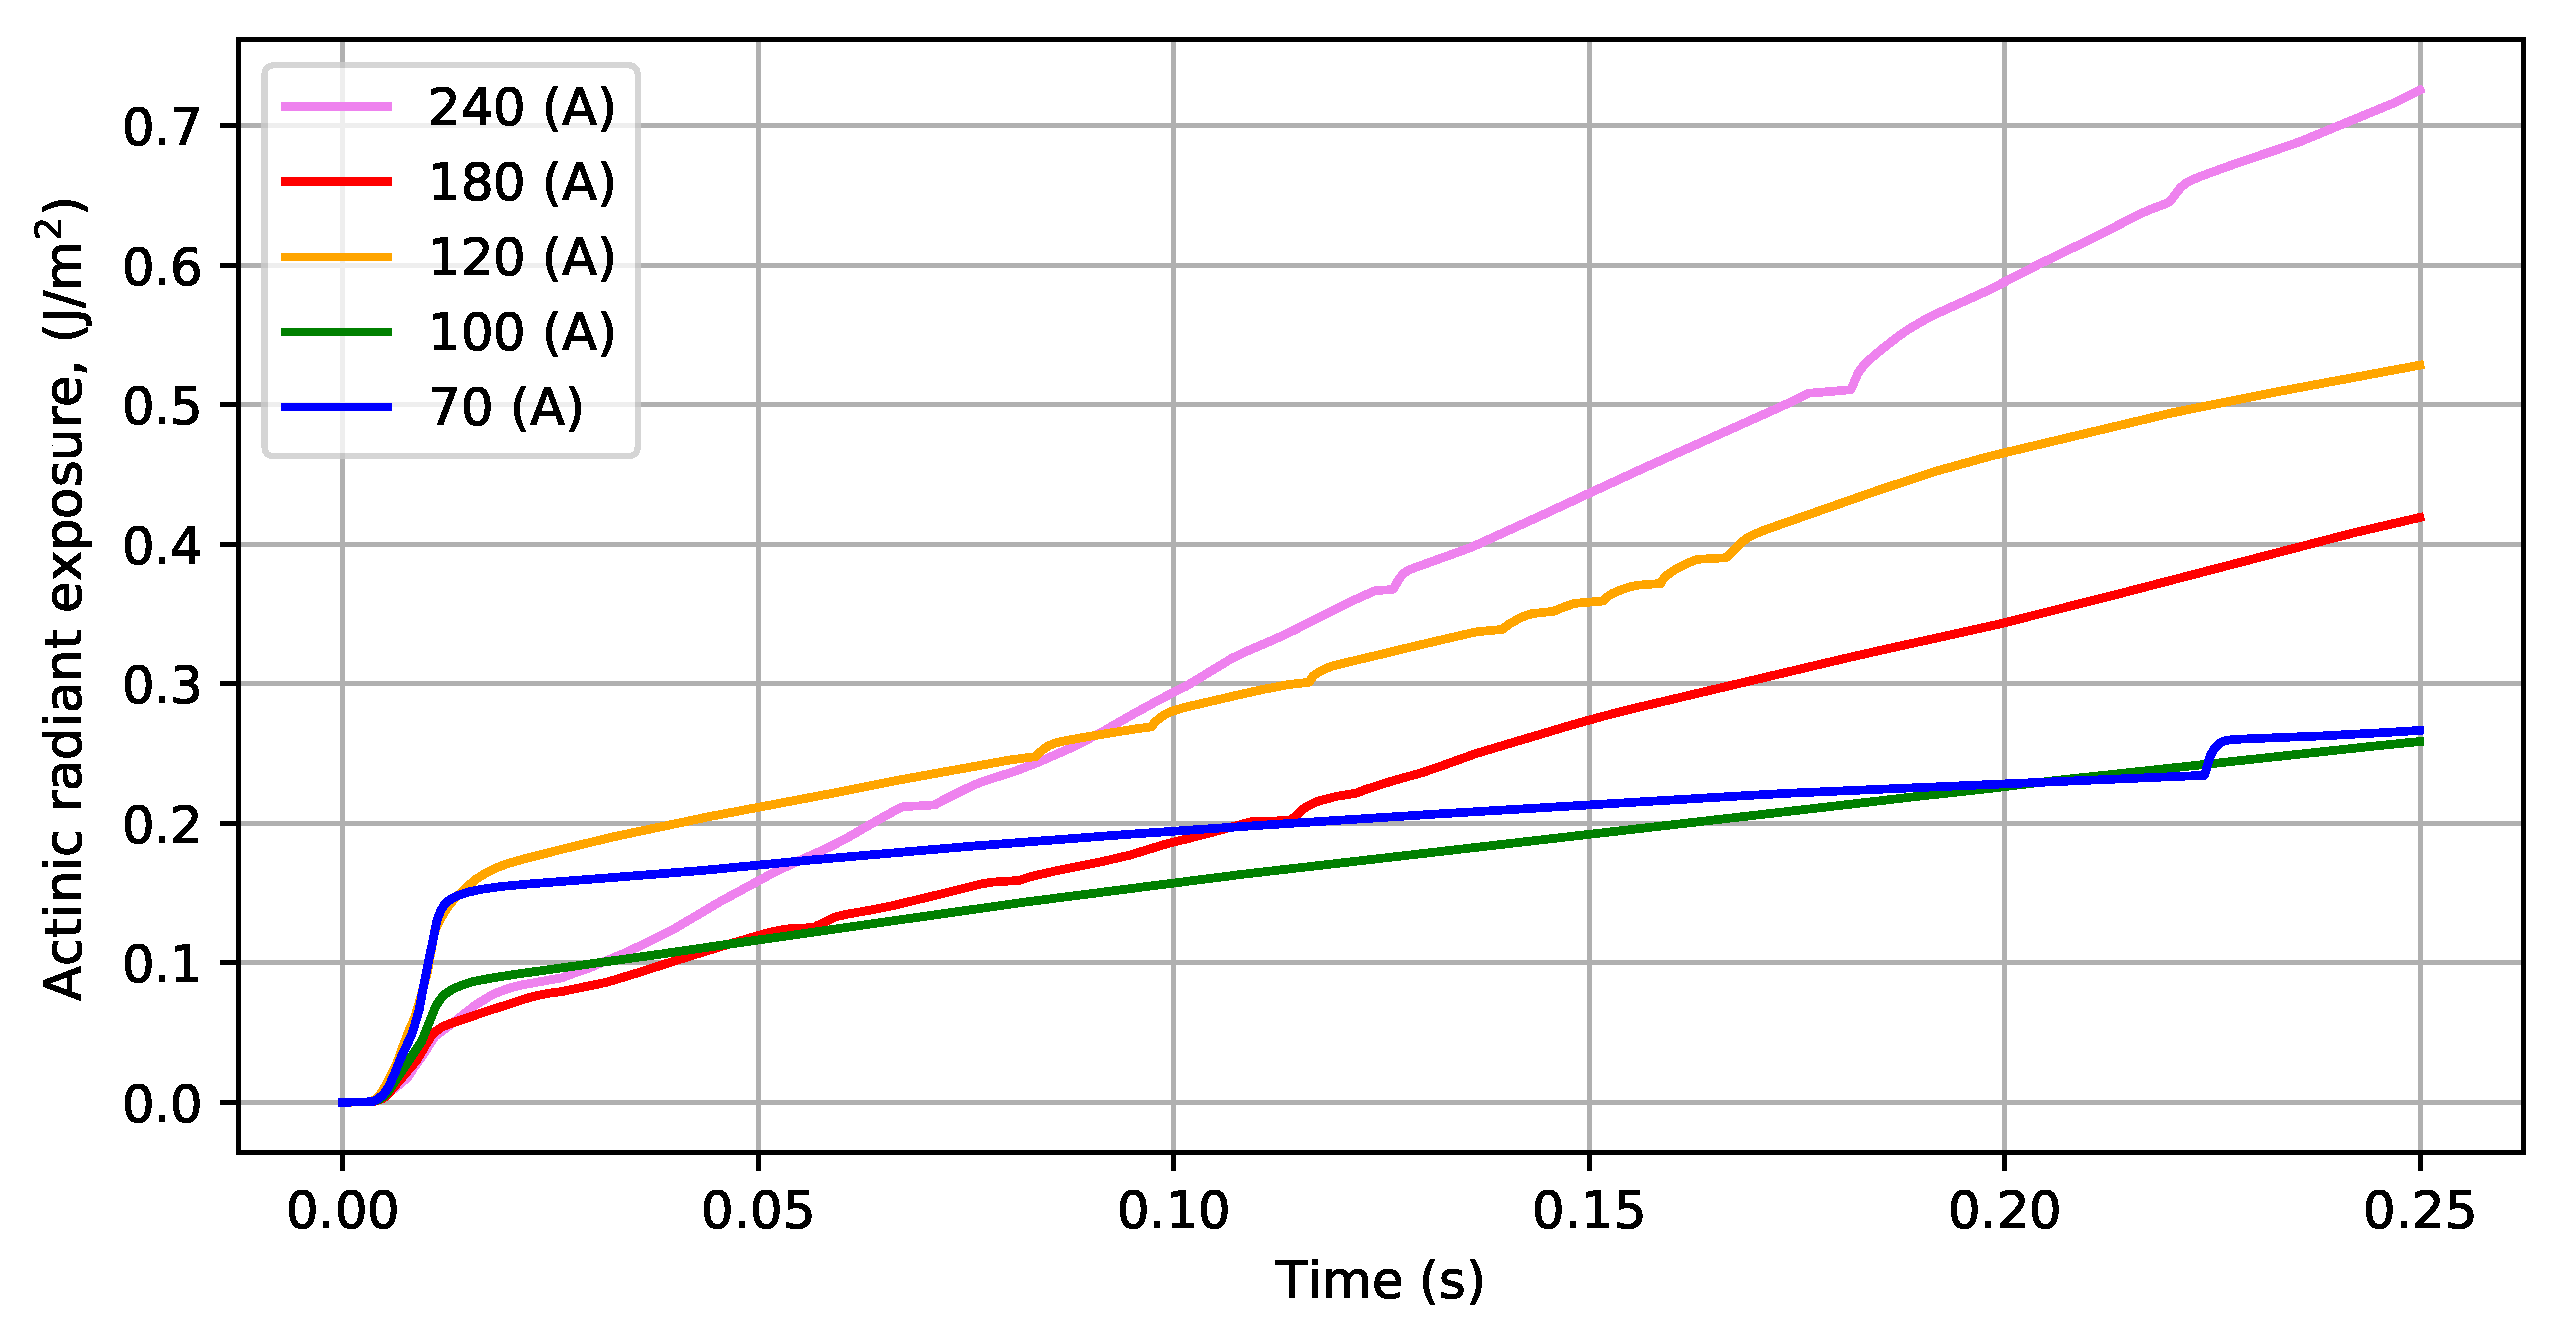
Figure 6 shows the distribution of actinic radiant exposure over time for different welding currents. The slopes of plots present the radiant exposure growth rate for particular welding currents. It could be concluded that for smaller welding arcs, the radiant exposure grew rapidly to higher values during ignition and then slowly increased. Conversely, in the case of bigger welding arcs, radiant exposure grew less rapidly and to smaller values during the ignition time and then increased evenly and almost linearly in the remaining time. The higher the current, the bigger the growth rate. This also indicates that the contribution of peak radiant exposure to total radiant exposure was bigger for smaller currents than for higher currents.
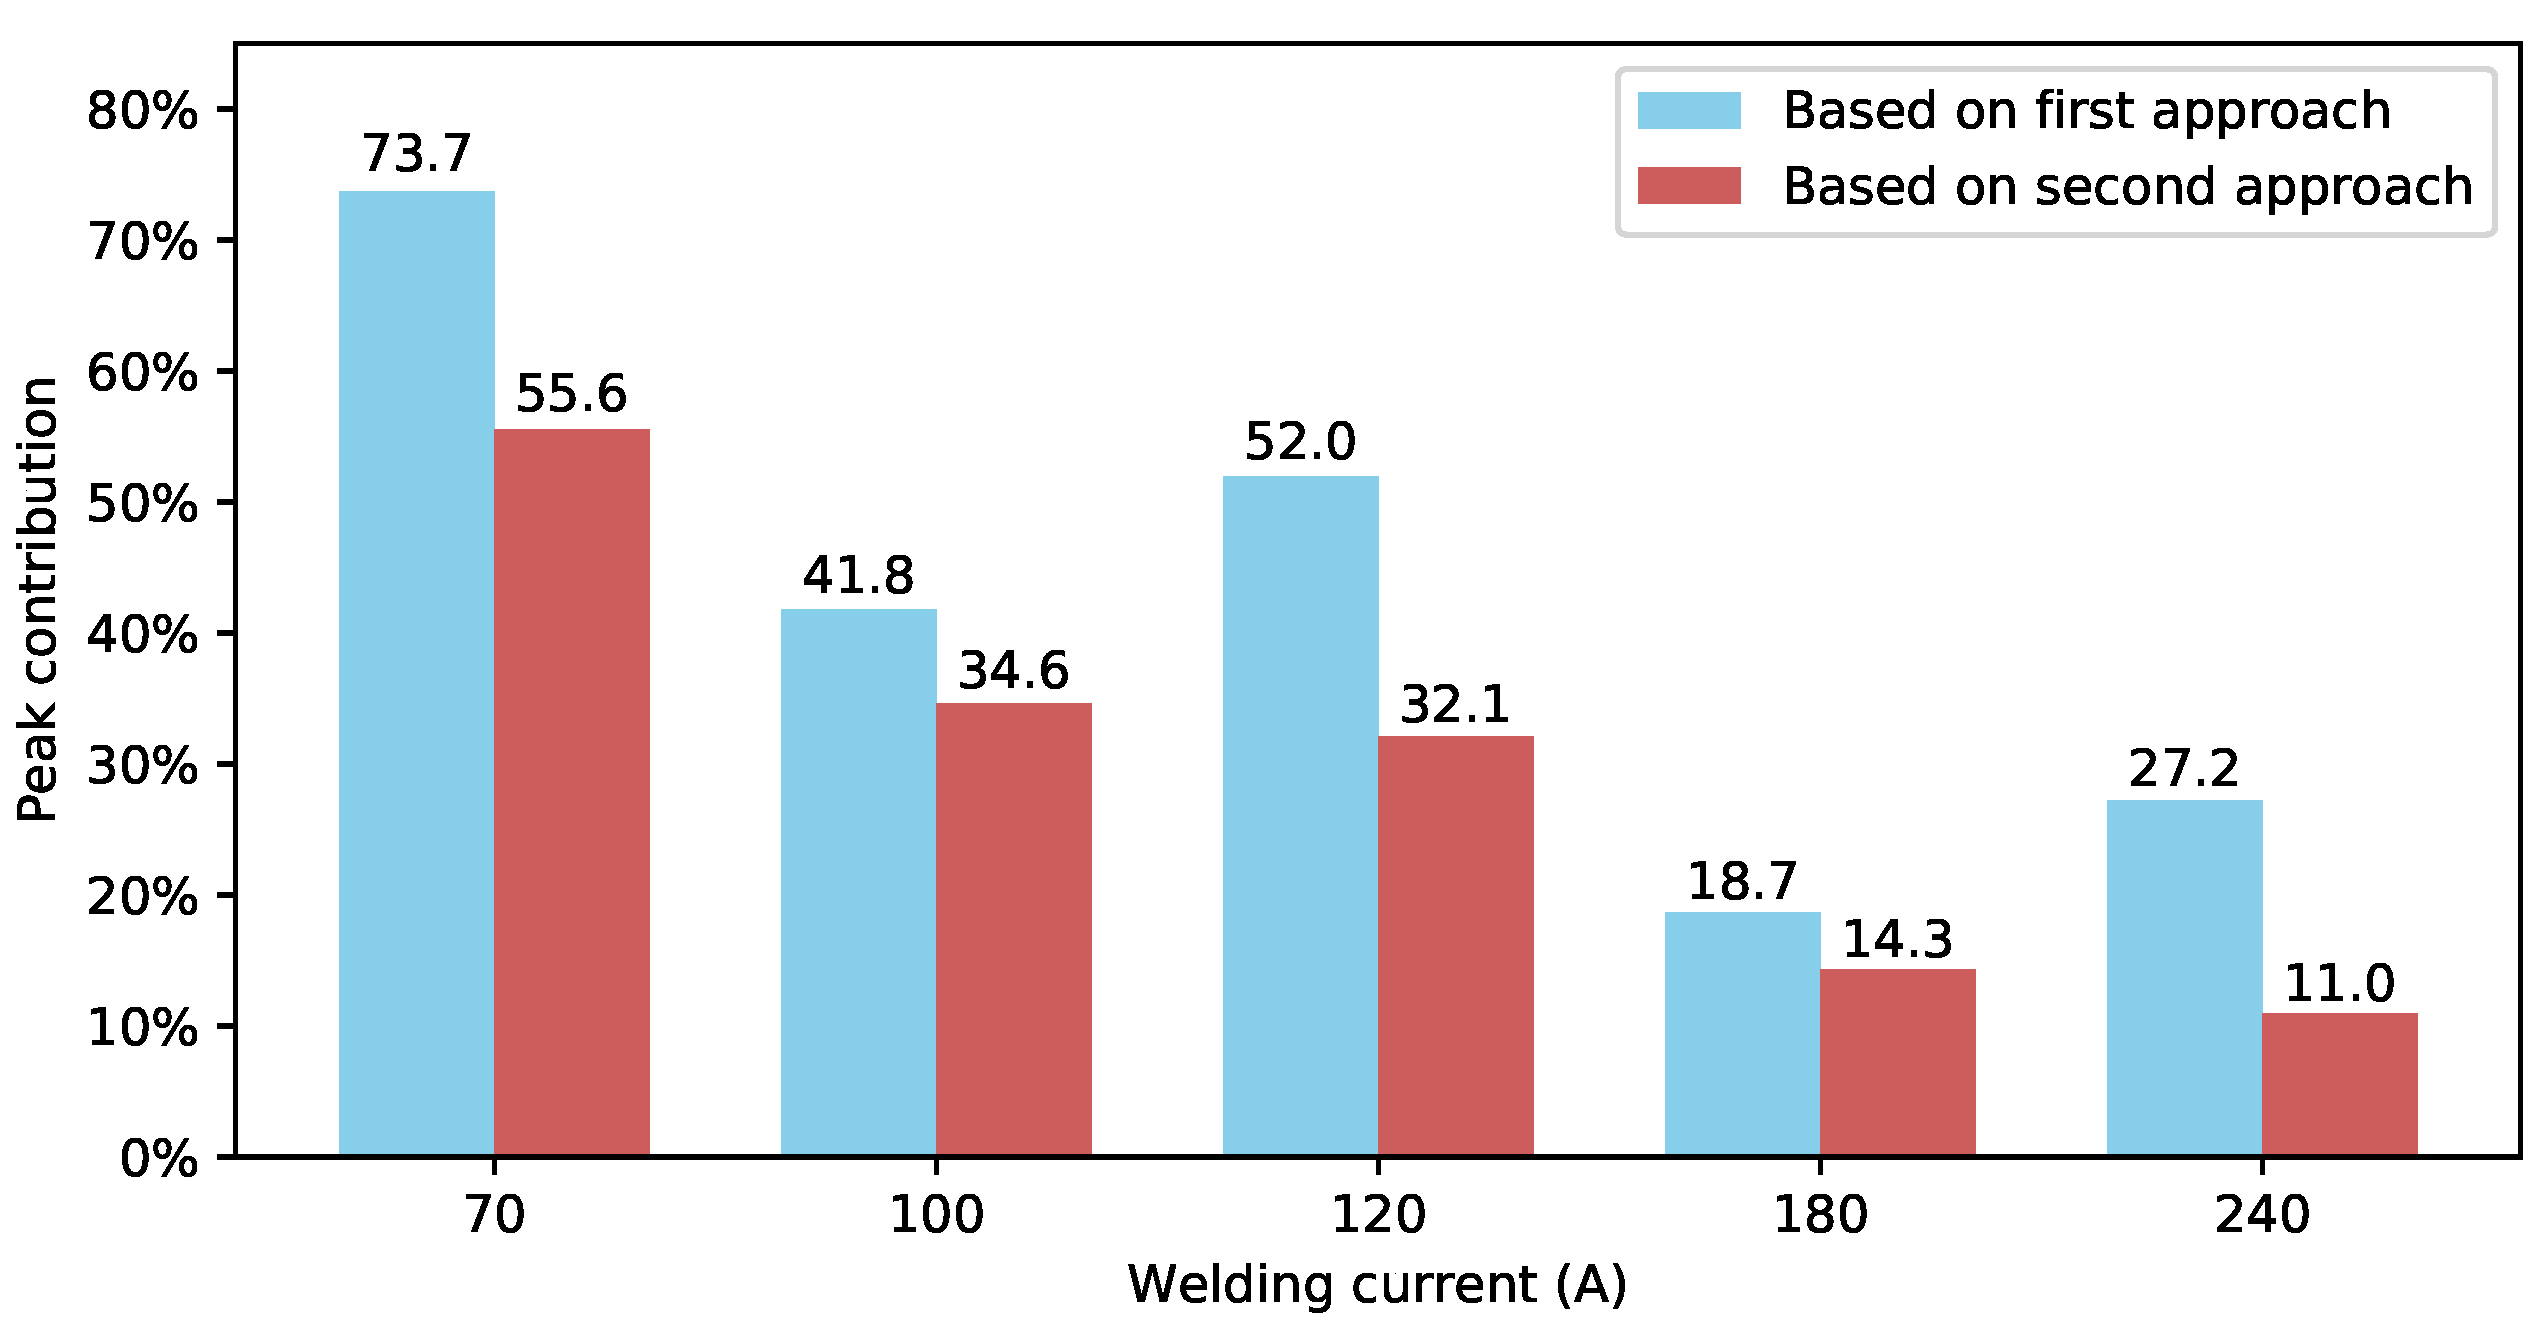
The contribution of peak radiant exposure to total radiant exposure obtained using both approaches is presented in Figure 7. The first approach of actinic radiant exposure determination for hazard evaluation resulted in a much bigger contribution of peak actinic radiant exposure to total radiant exposure than in the second approach. The maximum difference was about 20% (for 70 A and 120 A) and the smallest about 4% (for 180 A). The decrease of that contribution with increasing welding current is also visible in this figure.
4. Discussion
Due to the adopted measurement geometry, the obtained results of actinic irradiance and total actinic radiant exposure were lower than the maximum results recorded for the MAG-P or MAG processes in similar conditions reported in other articles [6,10,23]. Determination of maximum possible actinic irradiances at the accepted distance from welding and the height of probe above the floor arc was not a goal of this study. However, the relation between the increase of actinic irradiance of the ignition phase and average actinic irradiance of welding action should be approximately the same in all directions of arc emission, which we assumed in our analysis.
The improved method of recording the variability of welding arc ignition allowed for a more accurate mapping of the peak output shape of arc ignition and thus a more precise determination of its duration and the maximum value. The ratio of maximum peak irradiance and average irradiance (during the “stable” phase of arc emission) was in the range of about 6 and 47, which showed that the irradiance peak during the ignition phase could be much bigger than 10, as was stated by Eriksen [6]. This discovery was possible with the new method of registration. The range of ignition peak duration identified using the new photometer/flicker meter showed that the peak duration was narrower than the ranges determined in previous studies, i.e., 25 ms and 50 ms [6,7,23]. This suggests that actinic radiant exposure of UV during arc ignition evaluated on the basis of the previous results can be overestimated, and the subsequent hazard evaluation can be distorted. A higher accuracy of measurement obtained thanks to the proposed method of measurement can be expected to give a lower measurement error, which is crucial for the determination of expanded uncertainty, which should not be bigger than 30% according to EN 14255-1 [32]. Taking into account the wide range of uncertainty components related to arc welding (fumes, instability of arc emission over time, arc movement, reflections from welding area and surroundings, etc.), efforts should be focused on reducing any measurement errors related to measurement geometry, measurement processing procedure, and measurement equipment quality.
Another important aspect that strongly influences the determined parameters for UV hazard evaluation is the way in which parameters based on the obtained measurement results were calculated. As was presented in the article, consideration or not of the phase of arc ignition for short duration exposures (like eye aversion response) in actinic hazard evaluation of eye could have critical consequences. For the MAG-P welding process under investigation, omission of peak radiant exposure especially for low welding currents (between 70 A and 120 A) could result in a 44–66% decrease of the calculated radiant exposure. Furthermore, the determined maximum allowed time of exposure will be longer than it should be, and as a consequence, it will lead to increased hazard for workers related to overexposure to UV radiation.
The next important aspect is the determination of actinic radiant exposure used for photobiological hazard evaluation. Integration of actinic irradiances used to determine total actinic radiant exposure in the second approach leads to the more precise determination of the actinic hazard, especially for short exposure time including arc ignition (with special attention paid to aversion response time). For MAG-P welding, it is significant especially for smaller welding currents (70 A–120 A), while it does not seem to be so important for currents above 200 A (see Table A4 in Appendix A.3).
The same tendency may be observed for both approaches. As the welding current increases, the significance of ignition peak actinic radiant exposure for total actinic radiant exposure decreases (Figure 7). The ratio decreases with increasing welding current, which corresponds to lower contributions of peak actinic radiant exposure to total radiant exposure presented in Figure 6 and Figure 7.
However, the results of total actinic radiant exposure during eye aversion time were much lower than exposure limit values 30 J/m2, which means that a single glance of unprotected eye at arc ignition does not pose a high risk of adverse effect. However, multiple glances could lead to a high risk of acute effects like photokeratoconjunctivitis (“welding flash”), which was stated in other publications [7,10,14]. Unprotected skin, especially the skin of the head or neck, can be exposed to welding arc radiation for a longer time because of the lack of aversion response time. The importance of this fact both for welders and non-welders was emphasized by Tenkate [15,20]. Therefore, for this reason, the maximum permissible exposure time was determined in our study (Appendix A.3). It was in the range of 7 s–13 s (first approach) and 10 s–29 s (second approach). However, as reported in our study and in other published studies [10,11,14,20], the total daily exposure time of unprotected parts of skin to UV arc radiation could be easily much longer than permissible exposure times.
5. Conclusions
While the exposure is brief for each arc ignition, if it occurs many times in a workday, the total actinic radiant exposure may become sufficient to cause acute adverse effects like photokeratoconjunctivitis, erythema, and burn. If it is repeated for many days, chronic adverse effects of prolonged exposure to UV like ocular malignancy, actinic keratosis, or different kinds of skin cancer could appear. In fact, the total exposure time can easily exceed the permissible exposure time obtained in our study, i.e., 7 s–29 s at the distance of 1 m from the arc. This means that UV radiation from MAG-P arc welding is actually hazardous for the eyes and skin not only for welders, but also for workers in the vicinity of the welding arc.
The presented measurement method using a CCD spectroradiometer and photometer/flicker meter enables determination of radiant exposure of arc ignition radiation. This method is especially recommended for evaluation of UV hazard to eyes during the aversion response time exposure. Additionally, it reduces the uncertainty of welding arc emission measurements for the purpose of determining parameters for photobiological hazard evaluation through the limiting of errors related to the measurement method. The proposed method could be easily expanded to other hazards related to optical radiation emitted by welding arc, especially to blue light hazard evaluation.
The way of determination of UV radiant exposure during the arc ignition time, based on the obtained measurements results, has significant influence on hazard evaluation. For the MAG-P welding process and for the welding currents used in the study, it was especially significant for exposure duration below 3 s. The measurements using the same method should be continued for other welding techniques and welding parameters to determine characteristic dependencies occurring during arc ignition.
It is important to promote knowledge about the new methods of photobiological hazard evaluation among health safety officers, employees, and other experts who perform risk assessment, as this will contribute to the quality of hazard evaluation and will help to improve occupational safety.
Author Contributions
Conceptualization, A.R. and A.W.; methodology, A.R., T.P. and J.M.; validation, A.R. and A.W.; formal analysis, A.R. and A.W.; investigation, A.R., A.W., M.W., and J.M.; resources, A.W.; data curation, A.R.; writing, original draft preparation, A.R.; writing, review and editing, A.W.; visualization, A.R.; supervision, A.W.; project administration, A.W.; funding acquisition, A.W.
Funding
This paper is based on the results of a research task carried out within the scope of the fourth stage of the National Programme “Improvement of safety and working conditions” partly supported in 2017–2019 within the scope of state services by the Ministry of Family, Labour and Social Policy. The Central Institute for Labour Protection-National Research (CIOP-PIB) Institute is the Programme’s main coordinator.
Acknowledgments
We would like to thank the Instytut Spawalnictwa (Institute of Welding) for providing access to the MAG-P welding workstation, welding materials, and technical support during measurements.
Conflicts of Interest
The authors declare no conflict of interest. The funders had no role in the design of the study; in the collection, analyses, or interpretation of data; in the writing of the manuscript; nor in the decision to publish the results.
Abbreviations
The following abbreviations are used in this manuscript:
| BCC | Basal cell carcinoma |
| CCD | Charge-coupled device |
| CMM | Cutaneous malignant melanoma |
| DARSS | Diode array rapid scan spectrometer |
| EC | European Community |
| ELV | Exposure limit value |
| FWHM | Full width at half maximum |
| IARC | International Agency for Research on Cancer |
| ICNIRP | International Commission of Non-Ionizing Radiation Protection |
| IR | Infrared |
| MAG | Metal active gas |
| MAG-P | Metal active gas-pulsed |
| MIG | Metal inert gas |
| SCC | Squamous cell carcinoma |
| TIG | Tungsten inert gas |
| UV | Ultraviolet |
| UVR | Ultraviolet radiation |
| VIS | Visible |
| VNIIOFI | The All-Russian Research Institute for Optical and Physical Measurements Federal State Unitary Enterprise |
Appendix A.
Appendix A.1.
The UG11 filter used with photometer/flicker meter reduced the influence of visual and infrared radiation on the results of measurements. The relation between transmittance characteristic of the filter and actinic relative spectral effectiveness S() is presented in Figure A1.
Figure A1.
Relation of transmittance of photometer filter UG11 and actinic relative spectral effectiveness S().
Figure A1.
Relation of transmittance of photometer filter UG11 and actinic relative spectral effectiveness S().

Appendix A.2.
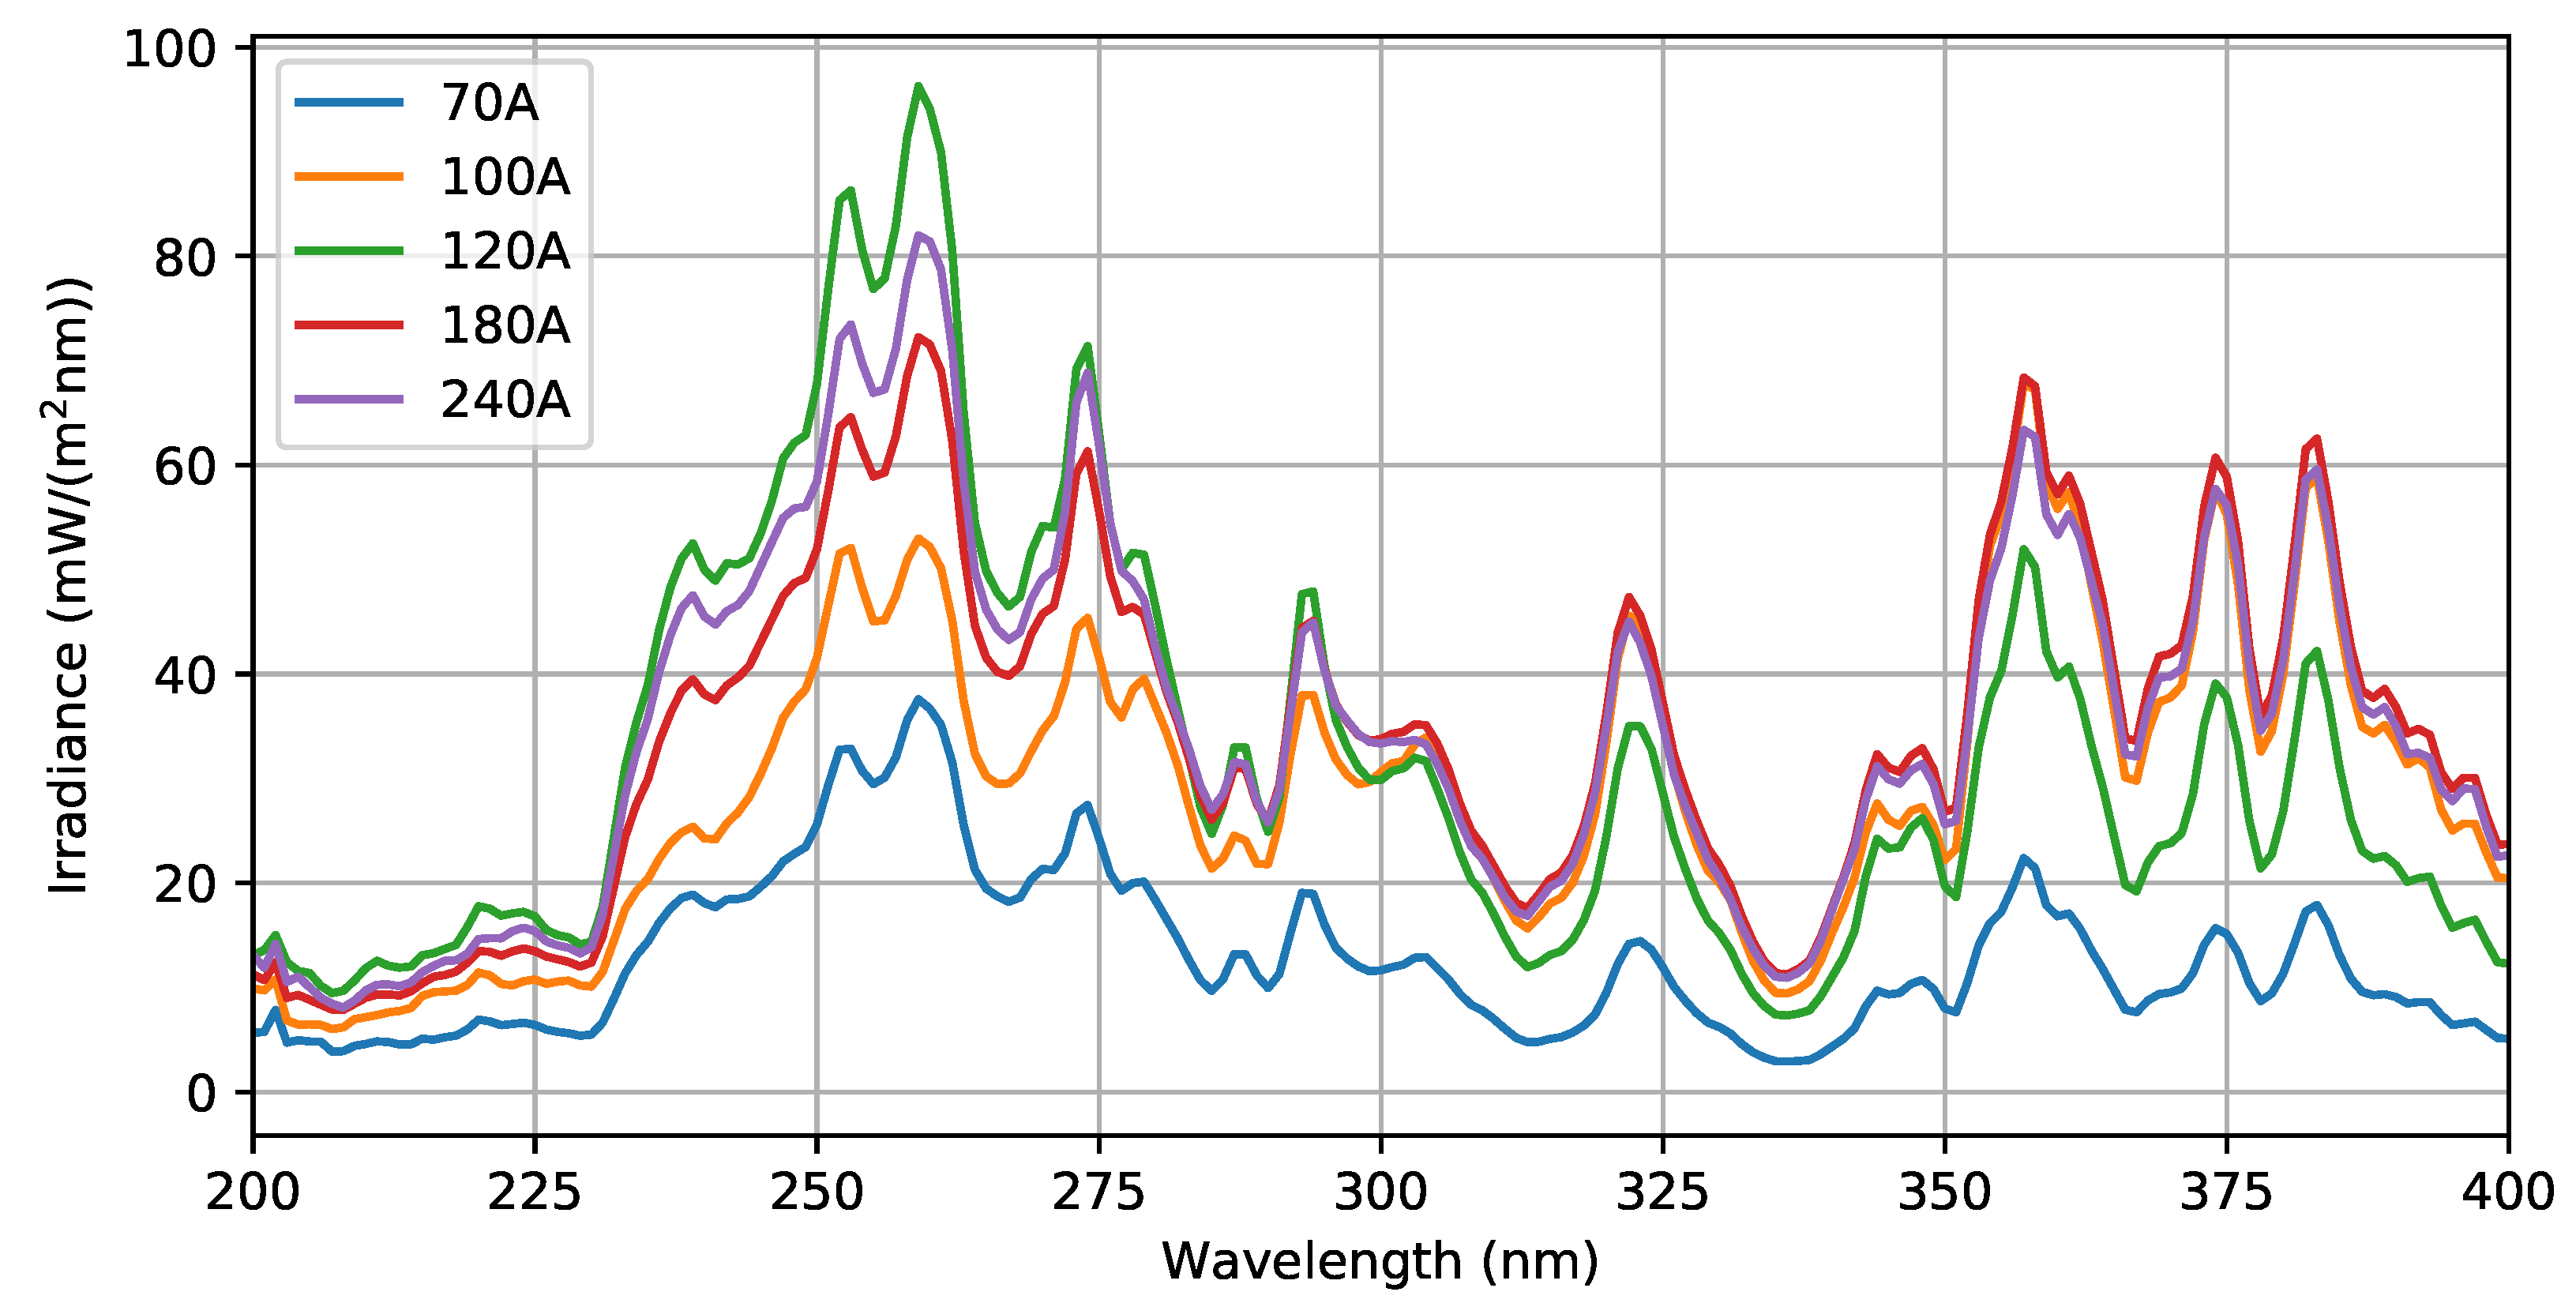
Average spectral irradiance distributions for different welding currents are presented in Figure A3. Similar shapes for almost all currents are visible. The exception is the spectral irradiance distribution recorded for 120 A, where the increase of irradiance for wavelengths below 310 nm can be observed. This fact contributed to the increased value of average actinic irradiance calculated for this welding current.
Figure A2.
Power spectral density of registered photocurrent for welding current of 70 A, presented as a periodogram and averaged periodogram using Welch’s method [35].
Figure A2.
Power spectral density of registered photocurrent for welding current of 70 A, presented as a periodogram and averaged periodogram using Welch’s method [35].
Figure A3.
Average spectral irradiance distributions for selected welding currents.

Table A1.
Properties of registered series of photocurrent over time.
| Welding Current A | Number of Samples | Time Period s | Average Photocurrent (mA) | Maximum Photocurrent (mA) | Standard Deviation (mA) |
|---|---|---|---|---|---|
| 70 | 103,404 | 3.31 | 0.54 | 25.31 | 0.93 |
| 100 | 123,419 | 3.95 | 1.69 | 33.57 | 1.25 |
| 120 | 102,410 | 3.28 | 1.00 | 17.85 | 0.93 |
| 180 | 94,742 | 3.03 | 2.89 | 28.03 | 1.81 |
| 240 | 149,072 | 4.77 | 4.12 | 36.69 | 2.07 |
Appendix A.3.
Calculation of total actinic radiant exposure estimated for eye or skin actinic hazards (for a time longer than the eye aversion time, i.e., 0.05 s) (arc ignition duration according to Eriksen [7], 1 s, 2 s, and 3 s) are presented in Table A2 and Table A3. Table A4 presents the ratio between total actinic radiant exposures obtained with both approaches.
Table A2.
Actinic radiant exposure corresponding to different times and maximum permissible time of exposure based on the first approach of UV hazard evaluation.
Table A2.
Actinic radiant exposure corresponding to different times and maximum permissible time of exposure based on the first approach of UV hazard evaluation.
| Welding Current | Total Actinic Radiant Exposure Over a Time | Maximum Allowed Time of Exposure | |||
|---|---|---|---|---|---|
| A | 0.05 s J/m2 | 1 s J/m2 | 2 s J/m2 | 3 s J/m2 | s |
| 70 | 0.61 | 1.45 | 2.33 | 3.21 | 33 |
| 100 | 0.32 | 1.75 | 3.26 | 4.77 | 20 |
| 120 | 0.66 | 2.83 | 5.11 | 7.40 | 13 |
| 180 | 0.19 | 2.03 | 3.97 | 5.91 | 15 |
| 240 | 0.26 | 2.27 | 4.39 | 6.51 | 14 |
Table A3.
Total actinic radiant exposure corresponding to different times and maximum permissible time of exposure based on the second approach of UV hazard evaluation.
Table A3.
Total actinic radiant exposure corresponding to different times and maximum permissible time of exposure based on the second approach of UV hazard evaluation.
| Welding Current | Total Actinic Radiant Exposure Over a Time | Maximum Allowed Time of Exposure | |||
|---|---|---|---|---|---|
| A | 0.05 s J/m2 | 1 s J/m2 | 2 s J/m2 | 3 s J/m2 | s |
| 70 | 0.17 | 0.76 | 1.76 | 2.68 | 34 |
| 100 | 0.12 | 1.16 | 2.73 | 4.37 | 20 |
| 120 | 0.21 | 1.98 | 4.25 | 6.84 | 13 |
| 180 | 0.12 | 1.95 | 3.93 | 5.82 | 15 |
| 240 | 0.26 | 2.50 | 4.61 | 6.46 | 14 |
Table A4.
Ratio of actinic radiant exposures .
| Welding Current | Ratio | |||
|---|---|---|---|---|
| 0.05 s | 1 s | 2 s | 3 s | |
| 70 | 3.61 | 1.91 | 1.32 | 1.20 |
| 100 | 2.63 | 1.51 | 1.19 | 1.09 |
| 120 | 3.15 | 1.43 | 1.20 | 1.08 |
| 180 | 1.56 | 1.04 | 1.01 | 1.02 |
| 240 | 1.63 | 0.91 | 0.95 | 1.01 |
References
- Weglowski, M.S. Investigation on the electric arc light emission in TIG welding. Int. J. Comput. Mater. Sci. Surf. Eng. 2007, 1, 734–749. [Google Scholar] [CrossRef]
- Directive 2006/25/EC of the European Parliament and of the Council of 5 April 2006 on the Minimum Health and Safety Requirements Regarding the Exposure of Workers to Risks Arising From Physical Agents (Artificial Optical Radiation) (19th Individual Directive Within the Meaning of Article 16(1) of Directive 89/391/EEC). Off. J. Eur. Union. 2006, 114, 38–59. Available online: http://data.europa.eu/eli/dir/2006/25/2014-01-01 (accessed on 4 January 2019).
- International Commission on Non-Ionizing Radiation Protection and others. Guidelines on limits of exposure to ultraviolet radiation of wavelengths between 180 nm and 400 nm (incoherent optical radiation). Health Phys. 2004, 87, 171–186. [Google Scholar] [CrossRef]
- International Commission on Non-Ionizing Radiation Protection and others. ICNIRP statement—Protection of workers against ultraviolet radiation. Health Phys. 2010, 99, 66–87. [Google Scholar] [CrossRef] [PubMed]
- Gourzoulidis, G.; Achtipis, A.; Topalis, F.; Kazasidis, M.; Pantelis, D.; Markoulis, A.; Kappas, C.; Bourousis, C. Artificial Optical Radiation photobiological hazards in arc welding. Phys. Med. 2016, 32, 981–986. [Google Scholar] [CrossRef] [PubMed]
- Eriksen, P. Measurements of welding arcs and plasma arcs. In Light, Lasers, and Synchrotron Radiation; Grandolfo, M., Ed.; Springer Science+Business Media: New York, NY, USA, 1991; pp. 157–167. [Google Scholar]
- Eriksen, P. Time Resolved Optical Spectra from MIG Welding Arc Ignitions. Am. Ind. Hyg. Assoc. J. 1985, 46, 101–104. [Google Scholar] [CrossRef]
- Okuno, T. Spectra of optical radiation from welding arcs. Ind. Health 1985, 23, 53–70. [Google Scholar] [CrossRef] [PubMed]
- Okuno, T. Measurement of ultraviolet radiation from welding arcs. Ind. Health 1987, 25, 147–156. [Google Scholar] [CrossRef]
- Okuno, T.; Ojima, J.; Saito, H. Ultraviolet radiation emitted by CO2 arc welding. Ann. Occup. Hyg. 2001, 45, 597–601. [Google Scholar] [CrossRef]
- Wolska, A. Occupational exposure of welders to ultraviolet and “blue light” radiation emitted during TIG and MMA welding based on field measuremants. Medycyna Pracy 2013, 64, 69–82. [Google Scholar]
- Peng, C.Y.; Lan, C.H.; Juang, Y.J.; Tsao, T.H.; Dai, Y.T.; Liu, H.H.; Chen, C.J. Exposure assessment of aluminum arc welding radiation. Health Phys. 2007, 93, 298–306. [Google Scholar] [CrossRef] [PubMed]
- Peng, C.Y.; Liu, H.H.; Chang, C.P.; Shieh, J.Y.; Lan, C.H. Evaluation and monitoring of UVR in Shield Metal ARC Welding processing. Health Phys. 2007, 93, 101–108. [Google Scholar] [CrossRef] [PubMed]
- Nakashima, H.; Utsunomiya, A.; Fujii, N.; Okuno, T. Hazard of ultraviolet radiation emitted in gas tungsten arc welding of aluminum alloys. Ind. Health 2016, 54, 149–156. [Google Scholar] [CrossRef] [PubMed]
- Tenkate, T.D.; Collins, M.J. Personal ultraviolet radiation exposure of workers in a welding environment. Am. Ind. Hyg. Assoc. J. 1997, 58, 33–38. [Google Scholar] [CrossRef] [PubMed]
- Mgonija, C.T. The effects of arc welding hazards to welders and people surrounding the welding area. Int. J. Mech. Eng. Technol. 2017, 8, 433–441. [Google Scholar]
- Emmett, E.A.; Buncher, C.R.; Suskind, R.B.; Rowe, K.W., Jr. Skin and eye diseases among arc welders those exposed to welding operations. J. Occup. Med. 1981, 23, 85–90. [Google Scholar] [CrossRef] [PubMed]
- Dixon, A.J.; Dixon, B.F. Ultraviolet radiation from welding and possible risk of skin and ocular malignancy. Med. J. Aust. 2004, 181, 155–157. [Google Scholar] [PubMed]
- Rybczyński, A.; Wolska, A. Selected measurement problems during the evaluation of occupational exposure to UV radiation emitted by the welding arc. In Proceedings of the 2016 IEEE Lighting Conference of the Visegrad Countries (Lumen V4), Karpacz, Poland, 13–16 September 2016; pp. 1–7. [Google Scholar]
- Tenkate, T.D. Ocular ultraviolet radiation exposure of welders. Scand. J. Work Environ. Health 2017, 43, 287–288. [Google Scholar] [CrossRef]
- Slagor, R.M.; La Cour, M.; Bonde, J.P. The risk of cataract in relation to metal arc welding. Scand. J. Work Environ. Health 2016, 42, 447–453. [Google Scholar] [CrossRef]
- Rybczyński, A.; Wolska, A.; Wisełka, M.; Pfeifer, T.; Matusiak, J.; Wyciślik Sośnierz, J. Problems Identified During Measurement And Assessment Of Blue-Light Hazard From Arc Welding Process. In Proceedings of the Lux Europa 2017 Conference—Lighting for Modern Society, Ljubljana, Slovenia, 18–20 September 2018; Kobav, M.B., Ed.; Lighting Engineering Society of Slovenia: Ljubljana, Slovenia, 2017; pp. 428–433. [Google Scholar]
- Rybczyński, A.; Wolska, A.; Wisełka, M.; Matusiak, J.; Pfeifer, T. Welding Arc Ignition and Photobiological Hazard Evaluation. In Proceedings of the 2018 IEEE International Conference on Environment and Electrical Engineering and 2018 IEEE Industrial and Commercial Power Systems Europe (EEEIC/I&CPS Europe), Palermo, Italy, 12–15 June 2018; pp. 1–6. [Google Scholar]
- Heltoft, K.N.; Slagor, R.M.; Agner, T.; Bonde, J.P. Metal arc welding and the risk of skin cancer. Int. Arch. Occup. Environ. Health 2017, 90, 873–881. [Google Scholar] [CrossRef]
- Falcone, L.M.; Zeidler-Erdely, P.C. Skin cancer and welding. Clin. Exp. Dermatol. 2018. [Google Scholar] [CrossRef]
- Zamanian, Z.; Mortazavi, S.M.J.; Asmand, E.; Nikeghbal, K. Assessment of Health Consequences of Steel Industry Welders’ Occupational Exposure to Ultraviolet Radiation. Int. J. Prev. Med. 2015, 6, 123. [Google Scholar] [PubMed]
- Ramdan, I.M.; Mursyidah, S.B.; Jubaedah, S. Photokeratoconjunctivitis Symptoms among Informal Welding Operators in North Samarinda, Indonesia. Glob. Med. Health Commun. (GMHC) 2017, 5, 144–151. [Google Scholar] [CrossRef]
- IARC. International Agency on Research of Cancer: IARC Monographs on the evaluation Carcinogenic risks to Humans. IARC Monogr. Eval. Carcinogenic Risks Hum. 2012, 100D, 90. [Google Scholar]
- Shi, L.; Song, Y.; Xiao, T.; Ran, G. Physical characteristics of welding arc ignition process. Chin. J. Mech. Eng. 2012, 25, 786–791. [Google Scholar] [CrossRef]
- Suban, M.; Tušek, J. Methods for the determination of arc stability. J. Mater. Process. Technol. 2003, 143, 430–437. [Google Scholar] [CrossRef]
- Garcia-Guinea, J.; Correcher, V.; Lombardero, M.; Gonzalez-Martin, R. Study of the ultraviolet emission of the electrode coatings of arc welding. Int. J. Environ. Health Res. 2004, 14, 285–294. [Google Scholar] [CrossRef] [PubMed]
- European Standard EN 14255-1. Measurement And Assessment Of Personal Exposures To Incoherent Optical Radiation—Part 1: Ultraviolet Radiation Emitted By Artificial Sources In The Workplace; European Committee for Standardization CEN: Brussels, Belgium, 2005. [Google Scholar]
- GL Optic. GL Spectis 5.0 Touch—Technical Datasheet. Available online: https://gloptic.com/products/gl-spectis-5-0-touch/ (accessed on 4 January 2019).
- Schott. Optical Filter Glass. 2015. Available online: https://www.schott.com/advanced_optics/english/products/optical-components/optical-filters/optical-filter-glass/index.html (accessed on 4 January 2019).
- Welch, P. The use of fast Fourier transform for the estimation of power spectra: A method based on time averaging over short, modified periodograms. IEEE Trans. Audio Electroacoust. 1967, 15, 70–73. [Google Scholar] [CrossRef]
Figure 1.
Measurement geometry. L, distance between the measuring head and welding arc; D, height of detector; d, height of the rotating stand; , observation angle.
Figure 1.
Measurement geometry. L, distance between the measuring head and welding arc; D, height of detector; d, height of the rotating stand; , observation angle.
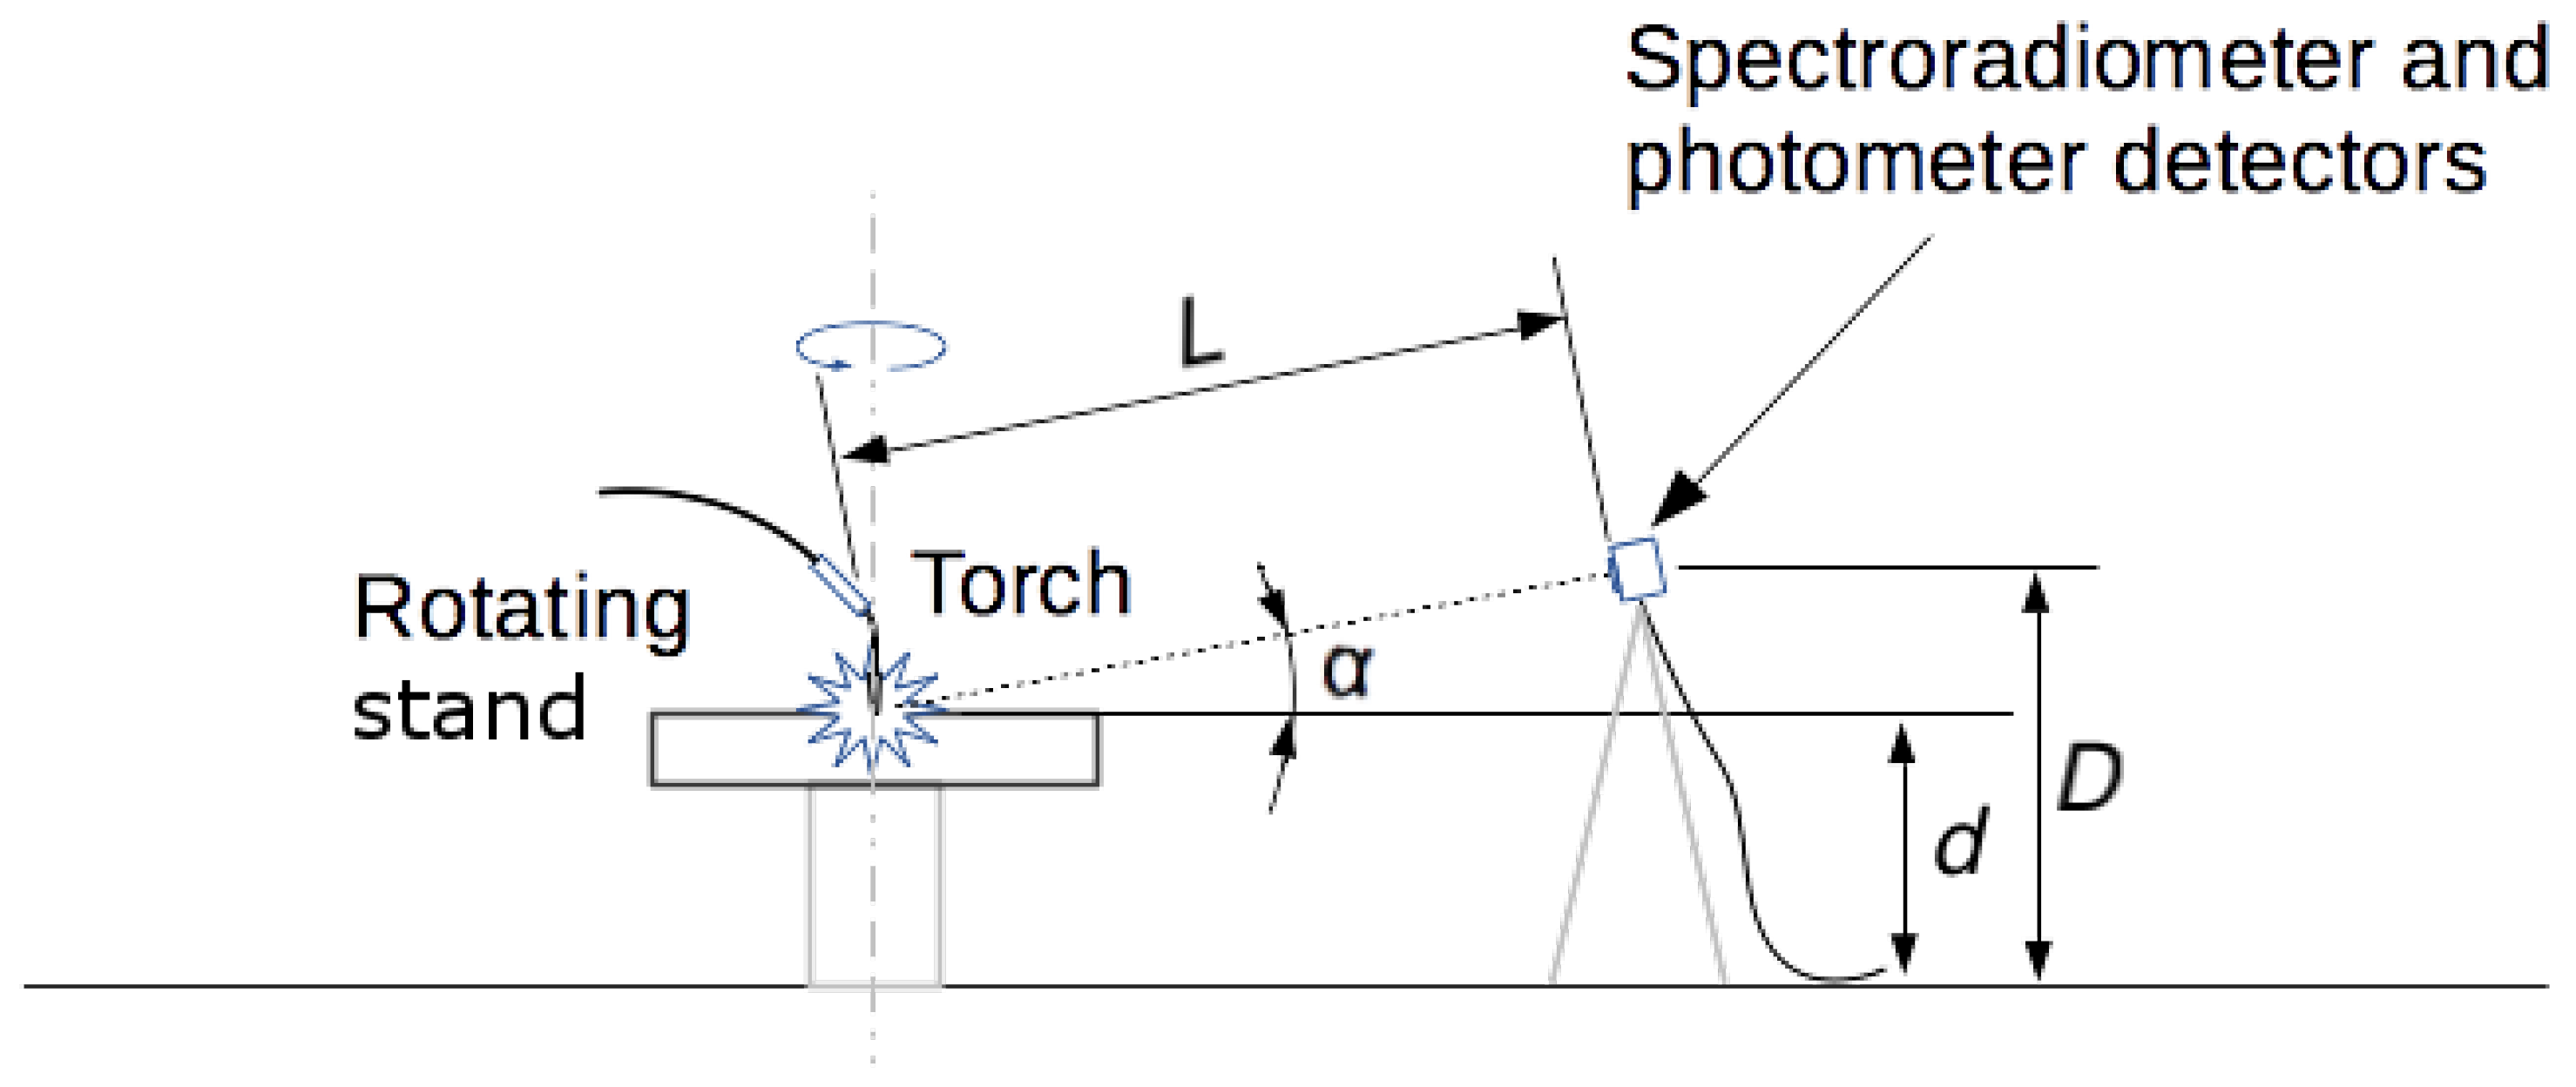
Figure 2.
A screenshot of GL SpectroSoft software presenting the measured spectrum, the table with measurement results for particular wavelengths, and selected results of calculations, like: total UV irradiance, actinic irradiance, UVA irradiance, and blue light hazard irradiance (example for current 120 A).
Figure 3.
Example of recorded photocurrent samples for welding current of 120 A.
Figure 4.
Distribution of actinic irradiance over eye aversion response time (example for current 120 A).
Figure 4.
Distribution of actinic irradiance over eye aversion response time (example for current 120 A).

Figure 5.
Distribution of actinic radiant exposure integrated over eye aversion response time (current 120 A).
Figure 5.
Distribution of actinic radiant exposure integrated over eye aversion response time (current 120 A).

Figure 6.
Distribution over time of actinic radiant exposure for different welding currents.

Figure 7.
Contribution of peak actinic radiant exposure in total actinic radiant exposure for different welding currents.
Figure 7.
Contribution of peak actinic radiant exposure in total actinic radiant exposure for different welding currents.

Table 1.
Pulsed metal active gas welding (MAG-P) welding parameters.
| Parameter | Welding Process MAG-P |
|---|---|
| Shielding gas | Ar+18%CO2+ |
| +2%O2 | |
| Gas flow | 12 L/min |
| Welding current | 70–240 A |
| Length of arc | 12 ± 1 mm |
| Welding wire | G3Si1 1.0 mm |
| Welded material | Construction steel |
Table 2.
Specification of GL Spectis5.0 Touch spectroradiometer.
| Parameter | Specification |
|---|---|
| Spectral range | 200 nm–1050 nm |
| Optical FWMH | 2.5 nm–3.5 nm |
| Wavelength reproducibility | 0.5 nm |
| Stray light | 2 × 10 |
| Signal-to-noise ratio | 1000:1 |
| Integration time | 10 ms–60 s |
Table 3.
Measures of actinic irradiances dispersion.
| Welding Current | Average Actinic Irradiance | Minimum Actinic Irradiance | Maximum Actinic Irradiance | Standard Deviation | Expanded Uncertainty k = 2 |
|---|---|---|---|---|---|
| A | Esavg W/m2 | Esmin W/m2 | Esmax W/m2 | σ(Esavg) W/m2 | U(Esavg) % |
| 70 | 0.88 | 0.82 | 0.97 | 0.01 | 3.21 |
| 100 | 1.51 | 1.07 | 1.82 | 0.07 | 9.36 |
| 120 | 2.28 | 1.86 | 2.75 | 0.08 | 6.92 |
| 180 | 1.94 | 1.43 | 2.48 | 0.11 | 11.44 |
| 240 | 2.12 | 1.36 | 2.82 | 0.14 | 12.94 |
Table 4.
Actinic irradiance and actinic radiant exposure corresponding to eye aversion response time = 0.25 s based on the first approach of UV actinic hazard evaluation.
Table 4.
Actinic irradiance and actinic radiant exposure corresponding to eye aversion response time = 0.25 s based on the first approach of UV actinic hazard evaluation.
| Welding Current | Maximum Peak Actinic Irradiance | Peak Duration | Peak Actinic Radiant Exposure | Average Irradiance | Total Actinic Radiant Exposure |
|---|---|---|---|---|---|
| A | Epeak1 W/m2 | Tpeak s | Hpeak1 J/m2 | Esavg1 W/m2 | Ht1 J/m2 |
| 70 | 41.60 | 0.014 | 0.58 | 0.88 | 0.79 |
| 100 | 21.51 | 0.012 | 0.26 | 1.51 | 0.62 |
| 120 | 38.72 | 0.015 | 0.58 | 2.28 | 1.12 |
| 180 | 11.94 | 0.009 | 0.11 | 1.94 | 0.58 |
| 240 | 12.42 | 0.015 | 0.19 | 2.12 | 0.68 |
Table 5.
Actinic radiant exposure corresponding to eye aversion response time = 0.25 s based on the second approach of UV actinic hazard evaluation.
Table 5.
Actinic radiant exposure corresponding to eye aversion response time = 0.25 s based on the second approach of UV actinic hazard evaluation.
| Welding Current | Peak Actinic Radiant Exposure | Total Actinic Time | Ratio Radiant Exposure |
|---|---|---|---|
| A | Hpeak2 J/m2 | Ht2 J/m2 | Ht1/Ht2 |
| 70 | 0.15 | 0.27 | 2.93 |
| 100 | 0.09 | 0.26 | 2.38 |
| 120 | 0.17 | 0.53 | 2.11 |
| 180 | 0.06 | 0.42 | 1.37 |
| 240 | 0.08 | 0.73 | 0.94 |
© 2019 by the authors. Licensee MDPI, Basel, Switzerland. This article is an open access article distributed under the terms and conditions of the Creative Commons Attribution (CC BY) license (http://creativecommons.org/licenses/by/4.0/).
Share and Cite
MDPI and ACS Style
Rybczyński, A.; Wolska, A.; Wisełka, M.; Matusiak, J.; Pfeifer, T. Ignition of Welding Arc and UV Actinic Hazard Evaluation. Energies 2019, 12, 512. https://doi.org/10.3390/en12030512
AMA Style
Rybczyński A, Wolska A, Wisełka M, Matusiak J, Pfeifer T. Ignition of Welding Arc and UV Actinic Hazard Evaluation. Energies. 2019; 12(3):512. https://doi.org/10.3390/en12030512
Chicago/Turabian StyleRybczyński, Andrzej, Agnieszka Wolska, Mariusz Wisełka, Jolanta Matusiak, and Tomasz Pfeifer. 2019. "Ignition of Welding Arc and UV Actinic Hazard Evaluation" Energies 12, no. 3: 512. https://doi.org/10.3390/en12030512
Note that from the first issue of 2016, this journal uses article numbers instead of page numbers. See further details here.