Article

Incorporating the Concept of Flexible Operation in the Design of Solar Collector Fields for Industrial Applications

by
Guillermo Martínez-Rodríguez
,
Amanda L. Fuentes-Silva
,
Juan R. Lizárraga-Morazán
and
Martín Picón-Núñez
*
Department of Chemical Engineering, University of Guanajuato, Guanajuato 36050, Mexico
*
Author to whom correspondence should be addressed.
Energies 2019, 12(3), 570; https://doi.org/10.3390/en12030570
Submission received: 30 December 2018 / Revised: 3 February 2019 / Accepted: 5 February 2019 / Published: 12 February 2019

Abstract

:
This work introduces the concept of flexible operation in the design of solar thermal utility systems for low temperature processes. The design objectives are: (a) The supply of the thermal needs of the process (heat duty and minimum required temperature), and (b) the maximization of the operating time during the day. The approach shows how the network structure is defined by adjusting the mass flow rate and the inlet temperature of the working fluid to achieve the smallest collector surface area. This work emphasizes the need to specify the solar network structure, which is comprised of two main elements: The number of lines in parallel and the number of collectors in series in each line. The former of these two design specifications is related to the heat load that the system will supply, while the latter is directly related to the delivery temperature. A stepwise design approach is demonstrated using two case studies where it is shown that the detailed design of the solar collector network structure is fundamental for a successful thermal integration with minimum investment. In this paper, the design methodology is based on flat-plate solar collectors, but it can be extended to any other type of low temperature solar technology.

Graphical Abstract

1. Introduction

The structure and size of a solar collector field is determined by the number of collectors placed in series in a line and by the number of lines placed in parallel. The definition of the structure must take into consideration operational and economical aspects. From the operational point of view, the design must meet the background process heat duty and the required process temperature taking into consideration the driving force for heat transfer. These targets must be met for the longer operation time that the technology and the availability of solar radiation can provide considering the daily and seasonal variability. Additionally, the network surface area must be the smallest possible for the minimum investment. Meeting all these requirements is not a straightforward task since some of the design objectives oppose each other. For instance, maximizing the daylight working hours would mean larger surface areas, while higher process target temperatures can only be achieved at reduced working time in the day. Additionally, meeting the objectives in summer requires less surface area than that needed for operation over the winter.
The situations mentioned above call for a design approach that not only considers the duty targets, but also considers the combination of operating conditions that are most favorable to ensure operation throughout the year, while maximizing the operating hours.
In design, the inlet temperature to the first collector in a network is an important design variable that can be manipulated to achieve the operational objectives and maintain investment at low levels. To this end, this work introduces a design approach of solar collector fields for flexible operation and minimum surface area.
The design of solar collector fields for low temperature applications (up to 100 °C) has been the subject of several research works. One of the first attempts to systematize a design approach was introduced by Oonk et al. [1], who used the collector thermal efficiency curve to approximate the number of collectors in a series required to achieve the process duties. Picón-Núñez et al. [2,3,4] extended the concept of thermal length and hydraulic length to the design of solar collector networks, which emerge from the thermal and hydraulic considerations in the design of heat transfer equipment. In the case of evacuated-tube technology, Martínez-Rodríguez et al. [5] further developed the methodology extending the concept of maximum number of collectors in series for a given solar radiation.
In the design of heat transfer equipment, there is a design space region where many possible and feasible designs exist [6]. In the case of solar collectors, the same applies and the existence of a design space can be availed for by means of the manipulation of operating variables such as inlet temperature, delivery temperature, and mass flow rate to search for the design that minimizes the solar-collector area and maximizes the operating time considering the variability of the solar radiation. The final selection is the one that has the flexibility to meet the process duties while maximizing the operating time throughout the year. While a considerable amount of work has been done on the integration of solar systems into industrial processes, very few works emphasize the importance of the accurate design of the solar collector fields. Most of the work published on thermal integration has focused on the process side and the delivery of the hot utility. To this end, it is assumed that the solar collector area is fixed with no further description of its structure and its performance. The rationale behind it is that the specification of the total surface area is enough to guarantee the supply of the thermal needs of the process. However, the specific structure of the solar field must be specified, otherwise it risks that the thermal targets will not be met. As has been mentioned, the temperature delivery depends on the number of collectors placed in series in a line, while the thermal duty depends on the number of lines placed in parallel. For instance, Martínez-Rodríguez et al. [7] reported the use of solar thermal heat to run a corn-derivative production plant and determined that a total of 580 collectors were needed and the network structure was specified as: 20 lines, each containing 29 collectors in series. Cases where the collector surface area is fixed without definition to its structure are the works by El-Nashar [8], who reported a solar plant with a total of 1,064 evacuated-tube collectors; the work by Quijera et al. [9] who reported on a case study involving the integration of solar heat into a tuna fish production plant where it was assumed that only 10% of the heat load could be met with a 358.6 m2 network. In a second work, Qujiera et al. [10] analyzed a dairy plant where a 1,939.2 m2 solar field with 646 collectors was required to supply 50% of the total heat duty of the process. In the case of a dairy factory in New Zealand, Walmsley et al. [11] reported that part of the hot utility consumption was supplied using a total surface area of 1000 m2.
Specific studies on the performance of solar collector networks have been published by Tiang et al. [12], who developed an experimentally validated quasi-dynamic simulation model for solar collector fields using TRNSYS. The solar network was composed of parabolic and flat-plate collectors to provide energy for district heating. The thermo-solar plant combined 5960 m2 flat-plate collectors with 4039 m2 of parabolic collectors. Ampuño et al. [13] proposed a dynamic model for the control and simulation of a solar network located in Almeria, Spain, to supply the thermal duty of a multi-effect desalination unit. The solar plant consisted of 60 flat-plate collectors with five parallel lines. The first line contains four collectors connected in cascade, while the other four lines contain seven collectors each. Shresthaa et al. [14] carried out the thermo-hydraulic study of two large solar fields in Chemnitz, Germany to provide district heating. The system has been operating since 2016 and is composed of two sets of fields totaling a surface of 2092.99 m2 with 172 flat-plate collectors. Lauterbach et al. [15] evaluated the thermal performance of a thermo-solar system that supplies heat, hot water, and air conditioning to a 6200 m3/year throughput brewing. The solar field consists of 22 collectors with a surface area of 169 m2. The solar network was monitored to get experimental data to be used in the validation of a thermal model. Their findings showed that the efficiency of the system is strongly affected by the geometry and by the operating variables such as mass flow rate and delivery temperature.
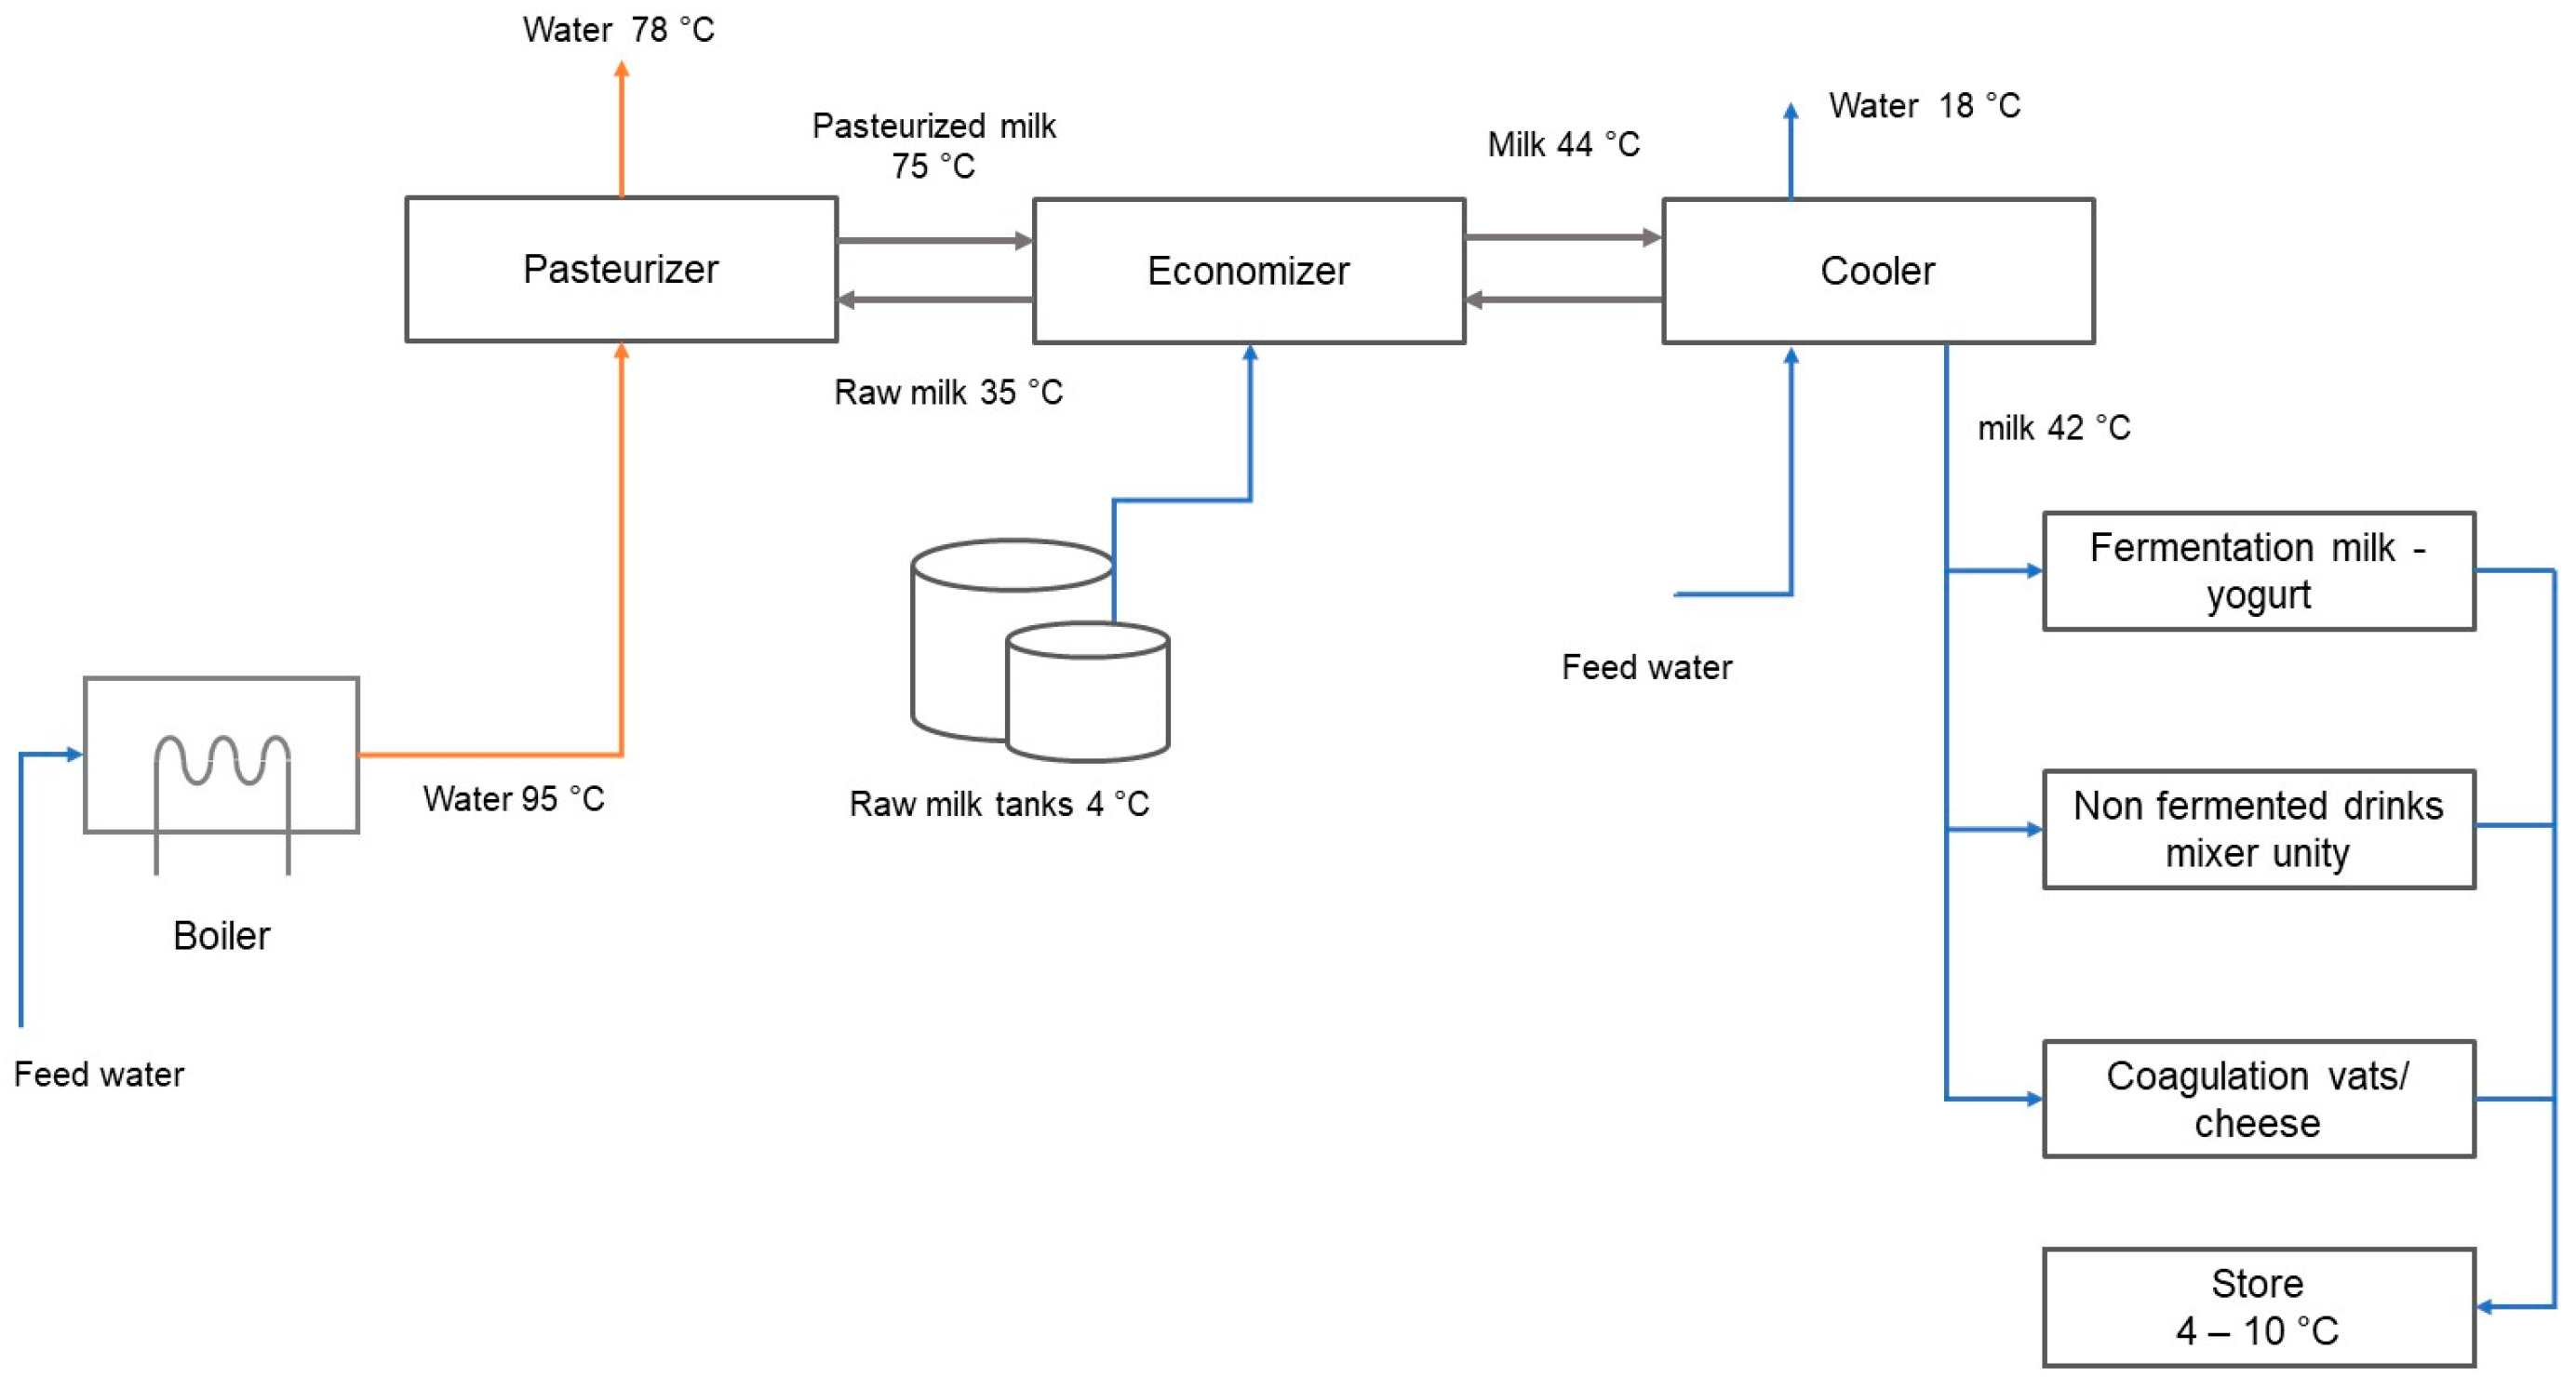
There are various industrial sectors that contain process operations whose operating temperatures are within the ranges of the operation of low temperature solar collectors [16]. For instance, the dairy industry where pasteurization takes place at 85 °C; the textile industry with temperatures below 100 °C except the fixing process that takes place between 160 °C and 180 °C [17]. In the pulp and paper industry, most temperatures are below 100 °C except by the bleaching process that operates between 130 °C and 150 °C [18]. Other examples are the beverage and meat industry, with temperatures below 80 °C [19,20], and the leather tanning industry with temperatures of around 45 °C [21] and the greenhouses industry with temperatures around 30 °C [22].
In design, the number of possible solutions to achieve a certain delivery temperature in a set of collectors arranged in series is large, especially, if the inlet temperature of the working fluid is changed. Likewise, there are many combinations of parallel arrangements able to meet the heat load if the working fluid mass flow rate is changed. The main features sought in a solar collector network are:
  • It exhibits the minimum surface area,
  • It provides the largest operating time in the day,
  • It fulfills the heat load and target temperature of the process.
Flexible operation of a solar system refers to the capability of the system to deliver the required thermal duties over the year as the ambient conditions vary. To this end, the operating variable that can be manipulated is the working fluid inlet temperature. Such manipulation can only be achieved by means of heat storage. The ideal scenario is that where the number of collectors in series and the number of lines in parallel are minimized, while the operating time is maximized. The reduction of the number of solar collectors works favorably in as much as the investment is concerned, since it reduces the pay-back time of the project.
This work introduces a stepwise design approach for solar collector networks. It incorporates the assessment of the effect that the design variables have upon the size of a solar installation. It also establishes a design strategy to obtain the network of solar collectors with the smallest surface that provides the longest operation during the day.

2. Thermal Performance

2.1. Assessment of the Design Variables

In design, the working fluid inlet temperature and mass flow rate are important design variables that can be manipulated to achieve the operational objectives and maintain investment at low levels. This section aims at presenting a close analysis of the effect of operating variables and ambient conditions upon the performance of networks of solar collectors and introduces the concept of minimum temperature rise (ΔTmin) to determine the maximum number of collectors in series for a given solar radiation intensity.

2.1.1. Effect of Solar Radiation Level

Figure 1 shows the total energy received per unit area in a day with ambient conditions typical of summer, spring, fall, and winter. The geographic coordinates where the measurements were made are: Latitude: 21°01′06″ N; longitude: 101°15′32″ O; and altitude: 2010 m above sea level. Collector tilt angle: 30°. During winter the total amount of energy received is 18.87 MJ/m2; over spring, the amount is 32.22% higher (27.84 MJ/m2). In summer, the increase is 34.90% compared to winter, while the fall is only 22.28% superior. From this information, it follows that the maximum outlet temperatures and the energy absorbed by a network structure will depend on the ambient conditions [23].
The thermal efficiency of a solar collector reduces as the inlet temperature to the first collector of the network increases. Therefore, in a set of flat plate collectors in series, the efficiency of the downstream units is reduced as the operating temperature increases. Figure 2 depicts the irradiance and the energy absorbed by a network comprised of 28 collectors in series. From the data shown, only 40% of the total energy received is absorbed. This indicates that there are major challenges in technology development. An additional problem is that not all the energy absorbed is available at the required temperature.
The highest and lowest solar radiation magnitudes are found in the summer and the winter, respectively. A comparison between these two periods is shown in Figure 3.
Design and performance analysis of solar collector networks are fundamental for understanding the operation of solar collector networks. While design is carried out at fixed operating and ambient conditions, the analysis of the performance of the network must be carried out for a range of operating conditions. There is a minimum solar radiation intensity where the amount of energy received is enough for the fluid to reach a desired target temperature for the installed surface area. For instance, if an outlet temperature of 60 °C is desired, it can only be achieved when the solar radiation is around 450 W/m2. The time of the day when this condition exists varies between seasons and latitudes, however, for such a radiation level, the target temperature can effectively be attained.
In solar collector network design, the operating conditions and the amount of solar radiation determine the maximum thermodynamic outlet temperature. However, such value can only be achieved with an infinite surface area and it would not be economical to force a design to reach this value. Therefore, for practical purposes, with the aim of finding the required surface area, or the required number of solar collectors, a design consideration must be formulated. Thus, the term maximum practical attainable temperature is introduced. To describe the concept, consider a design approach where solar collectors are placed in series, as they are needed. The decision to add a new collector in series is made only if the temperature difference between the inlet and outlet of the last collector is greater or equal than a specified value (ΔTmin). The smaller this value, the closer to the maximum thermodynamic outlet temperature, but the larger the number of collectors required. In this work, it is assumed that a practical design criterion for this value is ΔTmin = 1 °C (see Section 2.1.3).
To illustrate the concept described above, Figure 3a shows a case in a typical day in the winter. Starting from 9:15 h, 25 collectors in series can supply a temperature of 60 °C. As the day goes by, the outlet temperature increases and after midday reduces again until 15:45 h when the solar radiation is still enough for the outlet temperature to be 60 °C. After this time, the 25-collector network can no longer supply the target temperature. For a desired temperature of 90 °C, Figure 3a indicates that operation in the winter can start from 10:45 h and 30 collectors are required. The operation can go until 14:30, and after this time, the target temperature can no longer be attained. Figure 3b shows a similar analysis for summer conditions. Figure 4 is a schematic of a 25-collector network in series and Figure 5 shows the outlet temperature profile during the day for winter conditions.
The type of working fluid is another variable that must be considered in design. For instance, for water, the maximum outlet temperature is limited to 100 °C when the pressure is 1 atm. In this case, not all the energy content of the irradiance curve will be used. Under such situations, it might be advisable to increase the operating pressure or shift to a different working fluid with a higher boiling point.

2.1.2. Effect of Inlet Temperature upon the Delivery Temperature

For a given set of collectors arranged in series, the outlet temperature strongly depends on the working fluid inlet temperature. For the purposes of design, this can be seen from a different perspective: For a fixed outlet temperature, the number of collectors in series is a function of the inlet temperature. Figure 6 shows the temperature profiles of a 28-series collector network with different inlet temperatures. Feed water temperatures are: 19 °C, 40 °C, and 60 °C. The mass flow rate is kept at a constant value of 0.05 kg/s. If the network is to deliver a target temperature of 95 °C, it can be seen that, for an inlet temperature of 19 °C, the operating period where the target temperature is achieved is 4 h and 30 min (270 min), with an average outlet temperature of 94.37 °C. For an inlet temperature of 40 °C, the operating period increases to 5 h (300 min) and the average outlet temperature is 98 °C. If the inlet temperature is increased to 60 °C, the system reaches an average outlet temperature of 99.03 °C, over an operating period of 6 h (360 min). Under this last condition, the system collects 39% more energy compared to the scenario when the inlet temperature corresponds to ambient conditions.
In the operation of a solar collector network, the flow rate per line determines the thermal performance of the set of collectors in series. For a given solar collector network, the modification of the mass flow rate influences the outlet temperature as well as the period the system provides the required heat load. For a scenario where the number of collectors in series is kept constant, increasing the mass flow rate reduces the temperature delivered by the network. Figure 7 shows the temperature profiles for different mass flow rates for a 28-series collector network that operates with an inlet temperature of 60 °C and a flow rate per line of 0.05 kg/s. The time interval over which the network delivers a temperature equal or larger than 95 °C is 6 h. Within this period, the average temperature is 99.03 °C. If the flow rate increases to 0.067 kg/s, the average outlet temperature is 98 °C and the working period reduces to 4 h and 45 min.
Inlet temperature and mass flow rate can be manipulated strategically to reduce the number of solar collectors required to meet the process heat duty. Starting from the design of the network for the most critical ambient conditions, the inlet temperature is first increased. This will cause a rise in the delivery temperature and an increase in the available heat load for the process. Considering that the process heat duty is a fixed value, the flow rate per line can be increased to restore the delivery temperature of the solar plant. The new number of lines in parallel is determined from the heat balance and the flow rate per line. This approach is demonstrated in the case studies below.

2.1.3. Minimum Temperature Increment in a Network of Solar Collectors

The minimum number of solar collectors can be determined considering the ΔTmin. This is a design parameter defined as the difference between the outlet temperature (Tout)n and inlet temperature (Tout)n−1 in a collector (Equation (1)).
ΔTmin = (Tout)n − (Tout)n−1
where n refers to the position of a collectors in a network of collectors in series.
The criterion to determine the maximum number of collectors for a given set of operating conditions is based on the value of ΔTmin. The choice of its value is such that the number of collectors remains at a reasonable level with the aim of maintaining the investment at the lowest. Therefore, an analysis is carried out considering a range of solar irradiation levels and the fixed operating conditions shown in Table 1.
The thermal model is used to calculate the number of collectors in series. The results are shown in Table 2. From the results in Table 2, it is seen that, for a value of ΔTmin = 1, the maximum temperature attainable is 79.70 °C when the solar irradiation is 500 W/m2. This temperature is achieved with 23 collectors in series. For a solar radiation of 700 W/m2, a maximum temperature of 102.49 °C is reached with 26 collectors. Figure 8 shows the variation of the number of collectors with ΔTmin for various solar radiations.
In principle, from a thermodynamic point of view, as the number of collectors tends to infinity, there is a limiting temperature that can be attained. For instance, for a solar radiation of 500 W/m2 the limiting temperature is 91.15 °C; for a radiation of 700 W/m2, the limiting temperature is 112.04 °C and for 900 W/m2 is 130.82°C. The specification of a maximum ΔTmin in design allows the linking of three design parameters: Maximum delivery temperature, solar radiation, and operating time. For instance, if it is desirable to attain a delivery temperature of 79.70 °C, this can be achieved with 23 collectors in series from the moment of the day when the solar radiation is 500 W/m2. Before this time, the temperature cannot be reached. After this time, the temperature delivered by the 23-collectors in series will increase to the point of maximum solar intensity, then, as the day goes by, it will reduce to the point when the solar radiation comes back to 500 W/m2. After this point, the outlet temperature will no longer be met. The use of this concept in design is demonstrated in two case studies below.

3. Design of a Network of Solar Collectors

Thermal Model for Flat Plate Solar Collectors

An experimentally validated thermal model is used to design a solar collector network [2,3]. The model was validated according to the international norms for testing assays [24]. The aim of the model is to determine the number of collectors placed in series to achieve a desired target temperature. The methodology to design a collector network in series is to determine the outlet temperature of each unit using the approach described in this section. Starting from the first collector, the outlet temperature is calculated. Then, this outlet temperature becomes the inlet temperature of the next collector. If the difference between the inlet temperature and the outlet temperature is greater than the minimum acceptable value (Section 2.1.3), the collector is added to the network. The process continues until the difference is smaller than the minimum acceptable value. A counter is used to find the number of collectors and the outlet temperature for a given solar radiation. The main assumptions of the model are:
  • Steady state conditions
  • The heat flux is one-dimensional
  • The flow distribution inside the tubes is identical
  • The effect of dust on the optical properties of the transparent cover is negligible
  • Constant physical properties
  • Heat losses to ambient are considered
  • The temperatures of the plate and the cover are uniform at any moment in time
To determine the outlet temperature of a single flat plate collector, various energy balance equations must be written: (a) The overall energy balance, (b) the useful heat, and (c) the heat lost to the ambient from the upper side of the collector. Unknown variables are: The temperature of the surface (Ts), temperature of the cover (Tc), and outlet temperature (Tout). Therefore, the three heat balance equations must be solved simultaneously.
The overall heat balance is:
m C p ( T o u t T i n ) = G τ α   A s U L ( T s T a m b ) A s
The useful heat is equal to the total energy received by the collector minus the energy lost to the surrounding and is expressed as:
m C p ( T o u t T i n ) = h c w A s L M T D
where:
L M T D = T i n T o u t l n ( T s T o u t T s T i n )
The heat lost to ambient from the upper section of the collector can be expressed as:
h c s c + r s c ( T s T c ) = U L ( T s T a m b )
For the solution of the system of equations, heat transfer coefficients must be determined. The specific terms are: hcw, heat transfer coefficient between the water and the tubes; hcsc the convective heat transfer coefficient between the surface and the cover; hrsc, is the heat transfer coefficient by radiation from the surface to the cover; hcca, is the convective heat transfer coefficient between the cover and ambient; and hrca, is the heat transfer coefficient by radiation from the cover to ambient. Expressions to determine these parameters are taken from Reference [3]. For the calculation of the convective heat transfer coefficient between the cover and ambient, a wind velocity of 2.5 m/s was used.
The overall heat transfer coefficient of losses is obtained from:
U L = 1 R = ( 1 h c s c + h r s c + 1 h c c a + h r c a ) 1
The collectors are orientated toward the south with a tilt angle of 30 degrees. The solution of the system starts by assuming a surface temperature (Ts) and a cover temperature (Tc). Then, the Prandtl (Pr), Rayleigh number (Ra), and Nusselt number (Nu) between parallel plates using the Hollands equation [25] are calculated and the heat transfer coefficients are calculated: hcsc, hcca, and hrsc y hrca.
The heat transfer coefficient hcsc is calculated from Nusselt number correlations.
N u = h c s c   L e k
where Le is the spacing between the plate and the transparent cover, and k is the thermal conductivity of the fluid. In the tube, the appropriate Nusselt number is determined according to the flow regime: Laminar, turbulent, or transitional. General correlations of Nusselt number have the form:
N u = b R e x P r y
where x and y are constants; Nu is the Nusselt number; Re is the Reynolds number, and Pr is the Prandtl number.
R e = ρ   v   d μ
P r = C p μ k
Equations (2), (3) and (5) can be solved simultaneously to give Tout. The while model has been implemented in a Matlab platform using a Newton-Raphson numerical method. Figure 9 shows the solution algorithm in a block diagram. The physical properties of water and optical properties of the glass cover used in the calculations are presented in Table 3 and Table 4 respectively.

4. Case Studies

To exemplify the concept of flexible design of solar collectors for industrial applications, two case studies are analyzed. In the first case, a canned fish production factory is studied, where hot water is required at a temperature of 95 °C, while the second case refers to a dairy plant with temperature requirements below 100°C. The flat plate collectors used for the designs exhibit the geometrical features shown in Table 5.

4.1. Canned Fish Plant

The flow diagram of the process is shown in Figure 10 [9]. The plant processes 50 t/day of raw fish to produce 48.5 t/day of canned product. The factory operates five days a week over winter and six days a week over summer with a total of 250 days a year, from 06:00 to 24:00 h. Three batches a day processed and hot water at a temperature of 95 °C is required.
The first operation stage begins at 06:00 and finishes at 11:00 h. It consists of the fish preparation. In this stage tap water is used for washing. Subsequently, the fish sections are treated in two pre-cookers that come into operation twice a day to process 9281 kg/batch. This stage takes place at a temperature of 102 °C for 180 min. Heating is provided by saturated steam at 200 °C. Next, cold water at 4 °C is employed to wash the tuna fish pieces for 30 min. When the temperature drops to 50 °C, the fish is taken out of the pre-cookers and is hand-cleaned. The different fish pieces are classified by size and weight to be canned. Cans are filled up with olive oil, salt, and other additives at 50 °C. Then are sealed and washed before being sent to the sterilization stage. This stage lasts 90 min and takes place at 118 °C. Three autoclaves operate in parallel three times a day.
The first step in the sizing of the solar collector network consists in the determination of the maximum number of collectors required for operation. Winter is the most critical season to reach the specified total heat load; therefore, the calculations are performed for the ambient conditions that prevail over this time.

4.1.1. Design of the Solar Collector Network

The total collector count in a network structure can be refined to maximize the operation and reduce the surface area in two different scenarios. In the first scenario, the number of collectors in series required to meet the target process temperature is recalculated considering different inlet temperatures. The second scenario is analyzed considering the increased inlet temperature and the manipulation of the mass flow rate per line. Such combination results in a reduction of the lines in parallel to restore the heat load. These scenarios are analyzed below.

Design for Increased Inlet Temperature

For a total process heat load of 5.91 GJ, an inlet temperature of 19 °C and a mass flow rate per line of 0.05 kg/s, 29 collectors in series are needed to reach a delivery temperature of 95 °C starting from 11:00 h in winter (Figure 11a). The heat load is met with 31 lines in parallel giving a total of 899 collectors. Figure 8a also shows the operating time where the network delivers a temperature equal to or above 95 °C. The number of collectors in series to reach 95 °C can be reduced if the inlet temperature is increased. Important to note, that under new inlet temperature conditions, the working fluid must be fed to the network at the time where the target temperature is reached. For instance, for an inlet temperature of 40 °C (Figure 11b), 23 collectors are required, and the water can be fed to the system at 11:00 h. Additionally, it is important to observe that operation time is maintained. With less collectors in series, the total number of collectors reduces to 713. With a further increase of the inlet temperature to 60 °C, Figure 11c shows that the system can still be fed at 11:00 h; in this case, only 18 collectors in series are required, thus reducing the total collector count to 558, with a 31 × 18 collector structure. This represents a reduction of 37% in the total surface area.

Design for Increased Mass Flow Rate

An alternative strategy for the reduction of the number of collectors can be achieved by means of the manipulation of the mass flow rate per line. Table 6 shows the performance of a 23 series collector network for different mass flow rates per line and an inlet temperature of 60 °C. An increase of flow rate to 0.067 kg/s allows the reduction of the number of parallel lines to 23, giving a total number of collectors of 529 in an arrangement of 23 parallel lines with 23 collectors each. The largest flow rate that ensures a delivery temperature of 95 °C is 0.075 kg/s. The total number of collectors reduces to 483 with 21 lines in parallel and 23 collectors per line. With respect to the original design, the overall reduction is 46%.
Following the procedure described above, refined solar networks for the four seasons considering their corresponding average solar irradiance are presented in Table 7. In all cases, the inlet temperature and the mass flow rate per line are 60 °C and 0.075 kg/s. The number of collectors per line is kept at 23.
The largest solar field is required during the winter with a structure of 21 parallel lines with 23 collectors per line (21 × 23). The operation of this network during the year is shown in Table 8. The results indicate that for most part of the year the network delivers and excess of heat, except for winter where it meets the specified heat load.

4.2. Dairy Process

This plant produces yoghurt, cheese, and non-fermented milk drinks from caw milk as raw material [10]. From the 20,000 L a day pasteurized milk, 15% is sent to the production of yoghurt, 80% to produce cheese, and the other 5% to produce milk drinks. The plant operates seven days a week and 360 days a year. The whole process consists of four stages: Pretreatment and milk pasteurization, production of yoghurt, non-fermented milk drinks, and cheese production. Figure 12 shows a simplified block diagram of the production process.
Operation takes 12 h a day, beginning at 06:00 h and finishing at 18:00. For milk pasteurization a boiler operating with natural gas produces hot water at 95 °C. The thermal efficiency of the boiler is assumed to be 92%. To provide a heat load of 880.20 kW, 45.70 m3 of water at a temperature of 95 °C are needed every day. The total energy consumption in this period is 15.85 GJ.
For this plant, the whole thermal duty can be fully satisfied using a low temperature solar collector network. The pasteurization process takes place at 85 °C.

Design of the Solar Collector Network

The network of solar collectors was designed considering winter conditions. The daily heat duty is 4401.01 kWh (15.85 GJ). A 2233-collector network was designed with 77 parallel lines and 29 collectors per line (77 × 29), operating with a water feed temperature of 19°C and a flow rate of 0.05 kg/s. The network delivers the required temperature from 11:00 h until 14:15 h (195 min). The average delivery temperature is 98.04°C. As in the case study above, the total number of collectors can be reduced through the increase of the inlet temperature. Thus, for an inlet temperature of 60 °C, 23 collectors in series are required giving a collector count of 1771 (77 × 23), resulting in a reduction of 20% in collector area.
To explore other design options, a flow rate of 0.067 kg/s and a feed temperature of 60 °C are analyzed. The resulting network contains 1426 collectors in an arrangement of 62 lines in parallel and 23 collectors per line (62 × 23). Further increase of the flow rate to 0.075 kg/s with the same 60 °C inlet temperature results in a network with 1311 collectors containing 57 parallel lines and 23 collectors in series per line (57 × 23). With respect to the initial design, the total surface area is reduced in 41%. The results are summarized in Table 9.
Designs for the other seasons are shown in Table 10. Inlet temperature is maintained at 60°C, the flow rate at 0.075 kg/s and 23 collectors in series are used in all cases.
The operation of a network designed under the operating condition that prevail in winter will deliver a higher heat load in the other months of the year. The performance of a 57 × 23 network in other seasons in terms of operating time, delivery temperature, and heat load are shown in Table 11.

5. Analysis of Results

There is a design space where different solar networks that can supply the heat duty of a process coexist. Out of the many design options, there are few that minimize the investment. A design space is determined by: (a) Process conditions such as the specified target temperature; (b) ambient conditions such as the solar irradiation, ambient temperature, and wind velocity; and (c) solar plant operating conditions such as the fluid inlet temperature and the mass flow rate. The maximum delivery temperature of a solar plant is a function of the number of collectors placed in series. For a solar plant to exhibit a flexible operation, its design must be able to supply the process thermal needs throughout the year and at the same time, maximize the operating time. Fluid inlet temperature and fluid mass flow rate are two design variables that can be manipulated to achieve the design objectives. Increased inlet temperatures tend to reduce the number of solar collectors. Mass flow rate is an operating parameter that can be used to control the outlet temperature in periods of higher solar radiation. For a flexible operation, it is assumed that the manipulation of inlet temperature and mass flow rate is possible using a heat storage system (not discussed in this work). The results obtained in the case studies are further analyzed below.

5.1. Case Study 1

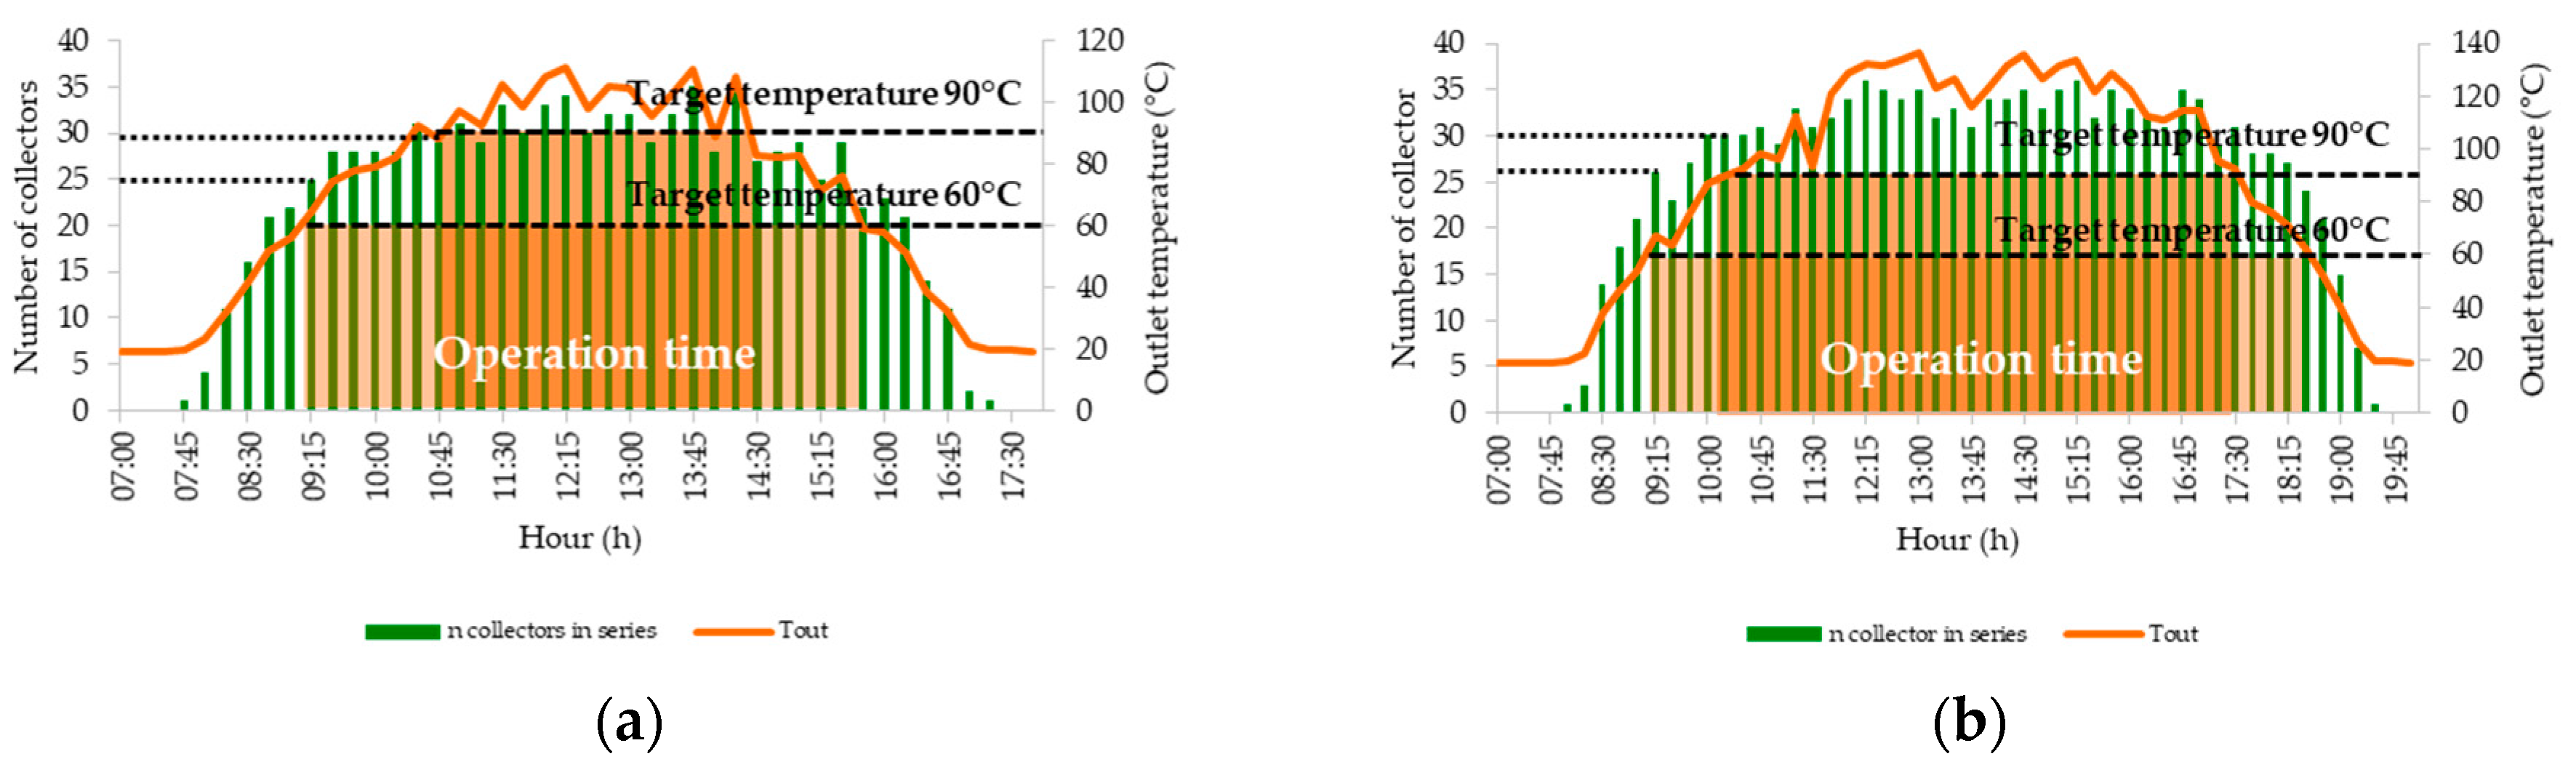
In the first case study, the solar plant was considered to provide a fraction of 0.115 of the total process heat duty in the winter with a hot temperature of 95 °C. With a water flow rate of 0.05 kg/s and an inlet temperature of 19 °C, 899 collectors arranged in 31 lines of 29 collectors per line were needed in the first approach. If the temperature of the feed is increased to 60 °C, the number of collectors in series to attain a target temperature of 95 °C is reduced to 18 with 31 lines in parallel resulting in a total number of collectors of 558. Over the summer, with 0.05 kg/s and a feed temperature of 60 °C, the outlet temperature increases to 103.18 °C. For the purposes of avoiding phase change in the summer, the water flow rate can be raised to 0.075 kg/s. With this flow rate, the system requires more units in series. Therefore, 23 collectors in series are analyzed. Under these conditions, the number of lines in parallel reduces from 31 to 21, giving a total of 483 collectors keeping the operating time in 195 min.

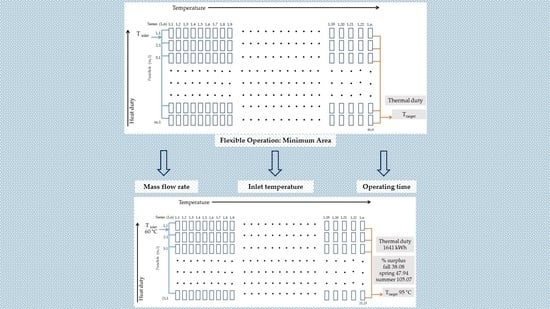
5.1.1. Flexible Operation of the Solar Network

The solar network with a structure of 21 × 23 supplies a daily heat load of 5.91 GJ. For an inlet temperature of 60 °C and a flow rate of 0.075 kg/s, the average delivery temperatures and excess heat load with respect to winter in the different seasons are:
  • Taverage, winter = 95.72 °C
  • Taverage, fall = 105.04 °C; excess heat load: 38.08 %
  • Taverage, spring = 100.95 °C, excess heat load: 47.94 %
  • Taverage, summer = 107.90 °C, excess heat load: 105.07 %

5.1.2. Solar Network

Figure 13 shows the network structure (21 × 23) with the process thermal requirements (heat load and temperature). This structure exhibits the minimum number of collectors and maximizes the operating time.

5.2. Case Study 2

The target temperature of case study 2 is 95 °C, and the number of collectors in series per line required to achieve this target is 29. The total heat load is 15,843.63 MJ. In this case, the whole heat duty can be supplied by the solar plant with 0.05 kg/s and an inlet temperature of 19 °C. The design approach reveals that for these conditions, 77 lines in parallel each with 29 collectors in series are required. If the temperature of the feed is increased to 60 °C, the number of collectors in series to attain a target temperature of 95 °C is 23. Thus, with 77 lines in parallel, the total number of collectors reduces to 1771. In the summer, the outlet temperature increases to 113.54 °C. For the purposes of avoiding phase change, the water flow rate can be raised to 0.075 kg/s. Under these conditions, the number of lines in parallel reduces from 77 to 57, giving a total of 1311 collectors.

5.2.1. Flexible Operation of the Solar Network

The network structure of 57 × 23 solar collectors supplies a daily heat load of 15.85 GJ. For an inlet temperature of 60 °C and a flow rate of 0.075 kg/s, the average delivery temperatures and excess heat load with respect to winter in the different seasons are:
  • Taverage, winter = 95.72 °C
  • Taverage, fall = 105.04 °C, excess heat load: 39.74 %
  • Taverage, spring = 100.95 °C, excess heat load: 49.73 %
  • Taverage, summer = 107.90 °C, excess heat load: 107.54 %

5.2.2. Solar network

Figure 14 shows the network structure (57 × 23) with the process thermal requirements (heat load and temperature). This structure exhibits the minimum number of collectors and maximizing the operating time.

6. Conclusions

A solar collector network is a thermal structure that absorbs solar energy, transforms it into heat, and delivers it to a user. When the user is an industrial process, the operation of the solar plant must be capable of supplying the process thermal needs under the most critical ambient conditions. The thermal design under these conditions fixes the maximum working hours wherein the process thermal requirements are achieved. For operation under more favorable atmospheric conditions, the excess heat collected can be taken advantage of to increase the plant working time. Heat storage can be used to provide a flexible operation. The features of a flexible solar collector network are:
  • It is designed for the less favorable ambient conditions to meet the process thermal needs
  • It contains a heat storage system to aid in the conditioning of the inlet temperature
  • It allows to maximize the working hours by regulating the inlet temperature
A complete approach to the integration of solar heat into process industries must involve, on the one hand, the detailed design and analysis of the operation of the solar collector plant, and on the other, the specification of the way heat is transmitted to the process. This work covers the design for flexible operation of a solar collector plant.
The design of a thermal plant must specify the total number of solar collectors and its arrangement. The target temperature is achieved by placing collectors in series, while the heat load is achieved by adding lines in parallel. The manipulation of the inlet temperature and the mass flow rate are fundamental to reduce the size of the solar plant. It was shown that significant reduction in collector surface area can be achieved by proper design and this has a direct impact on plant investment.

Author Contributions

Conceptualization, G.M.-R., J.R.L.-M. and M.P.-Z.; methodology, G.M.-R. and J.R.L.-M.; software, J.R.L.-M. and A.L.F.-S.; validation, G.M.-R. and J.R.L.-M.; formal analysis, M.P.-Z. and G.M.-R.; investigation, G.M.-R., J.R.L.-M., M.P.-Z. and A.L.F.-S.; resources, G.M.-R.; data curation, G.M.-R. and A.L.F.-S.; writing-original draft preparation, G.M.-R., J.R.L.-M. and M.P.-Z.; writing-review and editing, A.L.F.-S. and M.P.-Z.; visualization, A.L.F.-S.; supervision, G.M.-R.; project administration, G.M.-R.; funding acquisition, G.M.-R. and M.P.-Z.

Funding

This research received no external funding.

Conflicts of Interest

The authors declare no conflict of interest.

Nomenclature

ASHeat transfer surface area (m2)
CpHeat capacity, J/kg °C
dTube inner diameter, m
GSolar irradiance, W/m2
hcscCoefficient of heat transfer by convection from surface to cover, W/(m2 K)
hrscRadiative coefficient between the surface and the transparent cover, W/(m2 K)
hccaHeat transfer coefficient between the cover and ambient, W/(m2 K)
hrcaRadiative coefficient between the cover and ambient, W/(m2 K)
hcwHeat transfer coefficient between the water and the tubes, W/(m2 K)
kThermal conductivity of the fluid, W/(m2 K)
LMTDLogarithmic mean temperature difference, °C
LeSpacing between the plate and the cover, m
m ˙ Mass flow rate, kg/s
NuNusselt number
PrPrandtl number
RThermal resistance
ReReynolds number
TambAmbient temperature, °C
TaverageFluid average temperature, °C
TcCover temperature, °C
TinInlet temperature to the collector, °C
ΔTminTemperature difference between the outlet and inlet temperature of the last collector, °C
ToutOutlet temperature from tube, °C
TsSurface temperature, °C
ULOverall heat transfer coefficient of losses to ambient, W/(m2 °C)
vFluid velocity, m/s
Greek letters
μFluid viscosity, kg/(m s)
ρFluid density, kg/m3
ταnormal transmittance-absorptance product

References

  1. Oonk, R.L.; Jones, D.E.; Cole-Appel, B.E. Calculation of performance of N collectors in series from test data on a single collector. Sol. Energy 1979, 23, 535–536. [Google Scholar] [CrossRef]
  2. Picón-Núñez, M.; Martínez-Rodríguez, G.; Fuentes-Silva, A.L. Thermo-hydraulic Design of Solar Collector Networks for Industrial Applications. Chem. Eng. Trans. 2013, 35, 457–462. [Google Scholar] [CrossRef]
  3. Picón-Núñez, M.; Martínez-Rodríguez, G.; Fuentes-Silva, A.L. Design of solar Collector Networks for Industrial Applications. Appl. Therm. Eng. 2014, 70, 1238–1245. [Google Scholar] [CrossRef]
  4. Picón-Núñez, M.; Martínez-Rodríguez, G.; Fuentes-Silva, A.L. Targeting and design of evacuated-tube Solar Collector Networks. Chem. Eng. Trans. 2016, 52, 859–864. [Google Scholar] [CrossRef]
  5. Martínez-Rodríguez, G.; Fuentes-Silva, A.L.; Picón-Núñez, M. Solar Thermal Networks operating with Evacuated-tube Collectors. Energy 2018, 146, 26–33. [Google Scholar] [CrossRef]
  6. Picón-Núñez, M.; Polley, G.T.; Riesco-Ávila, J.M. Design Space for the Sizing and Selection of Heat Exchangers of the Compact Type. Chem. Eng. Trans. 2012, 29, 217–222. [Google Scholar] [CrossRef]
  7. Martínez-Rodríguez, G.; Fuentes-Silva, A.L.; Picón-Núñez, M. Targeting the maximum outlet temperature of solar collectors. Chem. Eng. Trans. 2018, 70, 1567–1572. [Google Scholar] [CrossRef]
  8. El-Nashar, A.M. Seasonal effect of dust deposition on a field of evacuated tube collectors on the performance of a solar desalination plant. Desalination 2009, 239, 66–81. [Google Scholar] [CrossRef]
  9. Quijera, J.A.; González-Alriols, M.; Labidi, J. Integration of a solar thermal system in canned fish factory. Appl. Therm. Eng. 2014, 70, 1062–1072. [Google Scholar] [CrossRef]
  10. Quijera, J.A.; González-Alriols, M.; Labidi, J. Integration of a solar thermal system in a dairy process. Renew. Energy 2011, 36, 1843–1853. [Google Scholar] [CrossRef]
  11. Walmsley, M.R.W.; Walmsley, T.G.; Atkins, M.J.; Neale, J.R. Options for Solar Thermal and Heat Recovery Loop Hybrid System Design. Chem. Eng. Trans. 2014, 39, 361–366. [Google Scholar] [CrossRef]
  12. Tiang, Z.; Perers, B.; Furbo, S.; Fan, J. Analysis and validation of a quasi-dynamic model for a solar collector field with flat plate collectors and parabolic trough collectors in series for district heating. Energy 2018, 142, 130–138. [Google Scholar] [CrossRef]
  13. Ampuño, G.; Roca, L.; Berenguel, M.; Gil, J.D.; Pérez, M.; Normey-Ricod, J.E. Modeling and simulation of a solar field based on flat-plate collectors. Sol. Energy 2018, 170, 369–378. [Google Scholar] [CrossRef]
  14. Shresthaa, N.L.; Frotscher, O.; Urbaneck, T.; Oppelt, T.; Göschel, T.; Uhlig, U.; Frey, H. Thermal and hydraulic investigation of large-scale solar collector field. Energy Procedia 2018, 149, 605–614. [Google Scholar] [CrossRef]
  15. Lauterbach, C.; Schmitt, B.; Vajen, K. System analysis of a low-temperature solar process heat system. Sol. Energy 2014, 101, 117–130. [Google Scholar] [CrossRef]
  16. Kalogirou, S. The potential of solar industrial process heat applications. Appl. Energy 2003, 76, 337–361. [Google Scholar] [CrossRef]
  17. Jia, H.; Cheng, X.; Zhu, J.; Li, Z.; Guo, J. Mathematical and experimental analysis on solar thermal energy harvesting performance of the textile-based solar thermal energy collector. Renew. Energy 2018, 129, 553–560. [Google Scholar] [CrossRef]
  18. Sharma, A.K.; Sharma, C.; Mullick, S.C.; Kandpal, T.C. Carbon mitigation potential of solar industrial process heating: Paper industry in India. J. Clean. Prod. 2016, 112, 1683–1691. [Google Scholar] [CrossRef]
  19. Pietruschka, D.; Fedrizzi, R.; Orioli, F.; Söll, R.; Staus, R. Demonstration of three large scale solar process heat applications with different solar thermal collector technologies. Energy Procedia 2012, 30, 755–764. [Google Scholar] [CrossRef]
  20. Mekhilef, S.; Saidur, R.; Safari, A. A review on solar energy use in industries. Renew. Sustain. Energy Rev. 2011, 15, 1777–1790. [Google Scholar] [CrossRef]
  21. Farjana, S.H.; Huda, N.; Parvez Mahmud, M.A.; Saidur, R. Solar Process heat in industrial systems—A global review. Renew. Sustain. Energy Rev. 2017, 82, 2270–2286. [Google Scholar] [CrossRef]
  22. Norton, B. Industrial and agricultural applications of solar heat. Compr. Renew. Energy 2012, 3, 567–594. [Google Scholar] [CrossRef]
  23. Private Database. Solar Collectors Testing Laboratory from University of Guanajuato. Unpublished work. 2018. [Google Scholar]
  24. Martínez-Rodríguez, G.; Fuentes-Silva, A.L.; Picón-Núñez, M. A parameter design tool for solar collectors. In Solar Collectors, Applications and Performance, 1st ed.; Picón-Núñez, M., Ed.; Nova Science Publishers Inc.: New York, NY, USA, 2018; pp. 51–84. [Google Scholar]
  25. Hollands, K.G.T.; Shewen, E.C. Optimization of flow passage geometry for air heating plate-type solar collectors. ASME J. Sol. Energy Eng. 1981, 103, 323–330. [Google Scholar] [CrossRef]
Figure 1. Solar irradiance measured at latitude: 21°01′06″ N; longitude: 101°15′32″ O; and altitude: 2010 m above sea level. Collector tilt angle: 30°.
Energies 12 00570 g001
Figure 2. Plot of irradiance and total energy absorbed during a day for a 28-collector network in series.
Energies 12 00570 g002
Figure 3. Maximum number of collectors in series and maximum practical outlet temperature during the day: (a) typical day in winter; (b) a typical day in summer.
Energies 12 00570 g003
Figure 4. Solar collector network in series.
Energies 12 00570 g004
Figure 5. Outlet temperature profile of a 25-collector network during the day.
Energies 12 00570 g005
Figure 6. Outlet temperature profiles of a 28-series collector network for different inlet temperatures.
Energies 12 00570 g006
Figure 7. Delivery temperature profiles for different mass flow rates for a 28-series collector network.
Energies 12 00570 g007
Figure 8. Maximum number of solar collectors with ΔTmin for various solar radiation intensities.
Energies 12 00570 g008
Figure 9. Algorithm to determine the outlet temperature of a flat-plate collector.
Energies 12 00570 g009
Figure 10. Simplified flow diagram of the canned-fish process. Adjusted from Reference [9].
Energies 12 00570 g010
Figure 11. Solar collector design plot for a mass flow rate of 0.05 kg/s and (a) inlet temperature of 19 °C; (b) 40 °C; and (c) 60 °C. The projection of the bars on to the right-hand and the left-hand side axes indicate the maximum outlet temperature achieved at that time of the day and the maximum number of collectors to reach that temperature.
Energies 12 00570 g011
Figure 12. Simplified flow diagram of the dairy plant. Adjusted from Reference [10].
Energies 12 00570 g012
Figure 13. Solar network structure for the canned-fish process. Case study 1.
Energies 12 00570 g013
Figure 14. Solar network structure for the dairy factory. Case study 2.
Energies 12 00570 g014
Table 1. Operating conditions for the determination of the maximum number of solar collectors.
VariableRange
Solar radiation, G (W/m2)500–900
Mass flow rate, m (kg/s)0.03
Wind velocity, vv (m/s)2
Inlet temperature, Tin (°C)20
Ambient temperature, Tamb (°C)17
Table 2. Maximum number of solar collectors for different values of ΔTmin and different levels of solar radiation.
ΔTminG = 500 W/m2G = 700 W/m2G = 900 W/m2
# collectorsTout# collectorsTout# collectorsTout
4542.25968.221293.03
3955.351381.1215102.46
21569.0318.0092.2519.00111.60
12379.7026.00102.4927.00122.12
0.72883.6029.00104.7930.00124.37
0.53285.7533.00107.0334.00126.51
0.33887.9039.00109.1739.00128.21
0.24389.0243.00110.0643.00129.08
0.15190.0751.00111.1050.00129.96
0.055990.6058.00111.5556.00130.35
0.000113291.15125.00112.04118.00130.82
Table 3. Optical properties of the glass cover.
DescriptionData
Transmittance of glass cover0.92
Emissivity of the glass cover0.88
Absorbance of the selective surface0.96
Emissivity of the selective surface0.05
Table 4. Physical properties of water.
DescriptionData
Density998.49 kg/m3
Specific heat4.182 kJ/kg K
Dynamic viscosity0.001028 kg/m s
Thermal conductivity0.58 W/m K
Table 5. Geometrical features of the flat plate collector.
Total area (length × width) (1.995 × 0.995)1.985 m2
Number of tubes (copper)8
Tube length1.970 m
Tube outer diameter0.0054 m
Header outer diameter0.0210 m
Distance between tubes (from center to center)0.1125 m
Fin dimensions (aluminum with a selective layer)0.1125 m
Thickness of glass cover (tempered)0.0045 m
Spacing between transparent cover and absorbing plate0.025 m
Side insulation (glass fiber)0.0125 m
Bottom insulation (glass fiber)0.055 m
Table 6. Redesign of the solar network for 23 collectors in series and different flow rates.
Flow Rate (kg/s)Start (h)End (h)Operating Time (min)Average T (°C)No. of Parallel LinesTotal No. of Collectors
0.0511:0014:15195103.1829667
0.06711:0014:1519597.8523529
0.07511:0014:1519595.7221483
Table 7. Solar collector network design for the different seasons.
SeasonStart (h)End (h)Operating Time (min)Average T (°C)No. of Parallel LinesTotal No. of Collectors
Spring10:3015:00270100.9514345
Summer11:1517:00345107.9011253
Fall11:1515:15240105.0416368
Winter11:0014:1519595.7221483
Table 8. Heat duty and delivery temperature for a network designed for winter conditions and operated in a different season. Solar network operation with 0.075 kg/s and a feed temperature of 60 °C.
SeasonStart (h)End (h)Operating Time (min)Average T (°C)Heat Duty Excess (%)
Spring10:3015:00270100.9547.94
Summer11:1517:00345107.90105.07
Fall11:1515:15240105.0438.08
Winter11:0014:1519595.720
Table 9. Redesign of the solar network for 23 collectors in series and different flow rates.
Flow Rate (kg/s)Start (h)End (h)Operating Time (min)Average T (°C)No. of Parallel LinesTotal No. of Collectors
0.0511:0014:15195103.18771771
0.06711:0014:1519597.85621426
0.07511:0014:1519595.72571311
Table 10. Solar collector network design for the different seasons.
SeasonStart (h)End (h)Operating Time (min)Average T (°C)No. of Parallel LinesTotal No. of Collectors
Spring10:3015:00270100.9539897
Summer11:1517:00345107.9028644
Fall11:1515:15240105.0441943
Winter11:0014:1519595.72571311
Table 11. Heat duty and delivery temperature for a network designed in winter and operated in a different season. Operation with 0.075 kg/s and an inlet temperature of 60 °C.
SeasonStart (h)End (h)Operating Time (min)Average T (°C)Heat Duty Excess (%)
Spring10:3015:00270100.9549.73
Summer11:1517:00345107.90107.54
Fall11:1515:15240105.0439.74
Winter11:0014:1519595.720

