Reducing Voltage Volatility with Step Voltage Regulators: A Life-Cycle Cost Analysis of Korean Solar Photovoltaic Distributed Generation


1
KEPCO EC (Korea Electric Power Corporation Engineering Construction), 269 Hyeoksin-ro, Gimcheon 39660, Korea
2
Graduate Institute of Ferrous Technology, Pohang University of Science and Technology (POSTECH), 77 Cheongam-Ro, Nam-Ku, Pohang 37673, Korea
3
Department of Industrial and Management Engineering, Pohang University of Science and Technology (POSTECH), 77 Cheongam-Ro, Nam-Ku, Pohang 37673, Korea
4
Construction Engineering and Management, Department of Civil, Environmental and Architectural Engineering, University of Colorado, Boulder, CO 80309, USA
*
Author to whom correspondence should be addressed.
Energies 2019, 12(4), 652; https://doi.org/10.3390/en12040652
Submission received: 24 January 2019
/
Revised: 8 February 2019
/
Accepted: 11 February 2019
/
Published: 18 February 2019
(This article belongs to the Special Issue Energy Policy in South Korea)
Abstract
:To meet the United Nation’s sustainable development energy goal, the Korean Ministry of Commerce announced they would increase renewable energy generation to 5.3% by 2029. These energy sources are often produced in small-scale power plants located close to the end users, known as distributed generation (DG). The use of DG is an excellent way to reduce greenhouse gases but has also been found to reduce power quality and safety reliability through an increase in voltage volatility. This paper performs a life-cycle cost analysis on the use of step voltage regulators (SVR) to reduce said volatility, simulating the impact they have on existing Korean solar photovoltaic (PV) DG. From the data collected on a Korean Electrical Power Corporation 30 km/8.2 megawatts (MW) feeder system, SVRs were found to increase earnings by one million USD. SVR volatile voltage mitigation increased expected earnings by increasing the estimated allowable PV power generation by 2.7 MW. While this study is based on Korean PV power generation, its findings are applicable to any DG sources worldwide.
1. Introduction
In January 2015, United Nation members agreed to 17 sustainable development goals. These included substantially increasing the share of renewable energy worldwide [1]. In accordance with this goal, the Korean Ministry of Commerce announced they would increase electricity generated through renewable sources to 5.3% by 2029 [2]. Furthermore, Korea aims to generate 12.5% of their total electricity through distributed generated (DG) power, as opposed to through conventional centralized generated power [2]. DG energy sources generate less than 10 megawatts (MW), are located near their end users, and tend to be in the form of renewable energy [3]. These sources are becoming popular worldwide due to their potential to limit greenhouse gas emissions, reduce new transmission line construction, enhance energy security, and lower investment risks [4]. However, they also often cause reverse flow [5], voltage fluctuations, and harmonics occurrences which all result in systemwide power distribution grid reliability and safety concerns [6]. These occurrences negatively impact the management of harmonics, stand-alone operations, protection coordination, power factors, and frequencies [7]. To cope with these problems, power and utility corporations such as the Korea Electric Power Corporation (KEPCO) need to find ways to mitigate voltage fluctuation while still allowing an increase in feeder DG capacity [8]. This paper performs a life-cycle cost analysis (LCCA) of mitigating solar photovoltaic (PV) DG voltage volatility through step voltage regulators (SVR), pillar transformers, and an on-load tap-changers (OLTC) on an existing 30 km/8.2 MW KEPCO feeder.
There has been significant research interest within the larger field of DG penetration and associated voltage management. Lopes et al. [4] present an overview of the key issues concerning DG penetration, suggesting best practice mitigating planning, operations, and active management processes. Chae [8], Barker [9], Kim [10], and Duong et al. [11] analyzed the voltage characteristics of consumers connected to power networks with large DG penetration, finding load increases and power quality issues such as over and under voltage. Quezada et al. [12] found a correlation between the increase of DG penetration and a reduction in usable power. To this end, Viral and Khatod [13], Esmaili et al. [14], and Gkaidatzis et al. [15] have presented the optimal sizing and locations of DG penetration that minimize system energy losses. Abdmouleh et al. [16] specifically optimized DG penetration as produced by renewable energy sources to minimize annual energy loss considering constraints such as voltage limits, distribution network capacity, maximum penetration limit, and available DG units. Concerning the benefits of DGs, Chiradeja and Ramakumar [17] quantified them as reduced line and transformer losses, reduced reserve requirements, improved system voltage profiles, increased system reliability, enhanced power quality, peak shaving, and relieved transmission and distribution congestion.
In assessing differing methods of mitigating voltage fluctuations, Chae found the installation of SVR to be the most impactful [8]. Building off this finding, there have been multiple research endeavors dedicated to the effectiveness of SVR. Lee et al. [18] proposed an optimal voltage adjustment algorithm for the use of OLTC and SVR to increase voltage stability. Takahashi [19] proposed a method of automating the OLTC and SVR tap-changers from the central voltage control center via data from the information technology switch. Liu et al. [20] proposed a distributed energy storage system which provides voltage rise management and relieves stresses on the OLTC and SVR tap-changers. Kojovic [21,22], Lee [23], and Kim [24,25] studied SVR’s integration into distribution networks with high DG penetration, finding them to have a positive effect on the line voltage control. Finally, Shin [26] investigated the delivery voltage of the OLTC such that a large-capacity DG would not create unsafe voltage variations when penetrating the distribution network.
There have also been studies dedicated to voltage fluctuation mitigation that do not include the use of OLTC and SVR. Farag and El-Saadany [27] proposed a multi-agent voltage control structure for adjusting the voltage of a distribution line with high DG penetration. Thirugnanam et al. [28] is one of many publications to propose the use of a battery energy management system for PV microgrids to smooth out the power fluctuations. Bjelic and Ciric [29] studied the impact combining hydro, combined heat and power, PV, and/or wind power generation has on optimizing DG planning at a local level. While outside of the purview of this study, it is necessary to understand that tap-changing equipment is just one of the ways to mitigate DG voltage fluctuation.
Another area of DG research is the economics of power generation. Strbac et al. [30] found the cost of DG electricity to be two to three times more expensive to produce than traditional centralized generated power [31]. This finding was mirrored by Audenaert et al. [32] who found PV power systems to have a negative net present value (NPV). Alternatively, Kolhe et al. [33] Bernal-Augustin and Dufo-Lopez [34] found PV power generation economically viable. Kolhe et al. [33] compared the economic efficiency of a stand-alone solar PV system versus a conventional diesel-powered generation plant finding the PV system to be economically competitive. Bernal-Augustin and Dufo-Lopez [34] also conducted a financial analysis of PV systems, finding PV power generation plants to be financially viable but with long payback periods. Finally, from a more generalized approach, Muttaqi et al. [35] proposed an economic optimization of DG plant development which included the direct and indirect costs of power supply quality, reliability, energy loss, total power operation, and DG investment. While all significant contributions to the body of knowledge, the existing DG economic literature restricts the boundaries of assessment to a singular power plant, often within renewable generation [36,37]. Furthermore, there has yet to be an economic assessment on the feasibility of voltage mitigation measures [38]. As such, the novelty of this paper is in investigating what impact integrating voltage adjustment equipment (OLTC and SVR) has on a feeder distribution network system’s LCCA with and without solar PV power penetration.
2. Research Methodology and Data Collection
Figure 1 below depicts the data collection and research methodology required to achieve the above research goals. The authors performed DG capacity analyses of existing KEPCO feeder lines, finding the maximum acceptable DG penetration with and without the use of SVRs. An LCCA was performed from these findings, taking into account economic variables such as the discount rate, service life, depreciation, tax rate, capital (CAPEX) and operational expenditures (OPEX), and revenue options. The final product is the internal rate of return (IRR), NPV, and profitability index (PI) of the feeder system with and without the installation of an SVR. These processes are described in greater detail in the following sections.
2.1. Data Collection
The authors collected data from KEPCO and their subsidiaries on feeder layouts, feeder node-to-node characteristics, existing solar power plant capacity, and general economic data. A distribution network was developed based on said KEPCO data collection, current Korea PV renewable energy distribution market, and typical SVR and DG characteristics. This is represented below in Figure 2. The resultant network includes four feeders and is used to perform simulations of voltage characteristics through the matrix laboratory (MATLAB) software. The following assumptions were used in the analysis:
- Although four feeders are shown, the authors only simulated Feeder 1, as it is the most complex.
- The load ratio, consistent for all feeders, is 1 at the maximum load and 0.3 at the minimum load.
- The load of the whole system is 32.8 MW and the power factor is 0.9.
- The distribution system consists of four feeders, each of which has a load of 8.2 MW and a 0.9 power factor, with a total load capacity of 32.8 MW.
- The section data of the high-voltage distribution line is shown in Table 1, below.
- The output voltage of the main transformer is adjusted by the line drop compensation (LDC) method presented in Section 2.2. The parameters of the main transformer, OLTC and SVR are shown below.
- Pillar transformer taps shall be applied with 13,200 V taps when the voltage drop is less than 5% at full load, and 12,600 V taps when exceeding 5%.
- The DG power supply is connected to the ends of Feeders 1 and 2 first, and the power factor is 0.9. Thereafter, the location of the DG power supply is moved around along the feeder line one and two between the branches to assess the criticality of the voltage fluctuation and regulation. This is needed to generalize the model in the case of a different DG being connected along the line, as recent research by Mahmud and Zahedi highlighted [39].
Prior to performing calculations with a hypothetical SVR, the authors calculated existing feeder conditions and voltage, observing the required OLTC and pillar transformer tap changes to maintain the allowable voltage. The results of this are shown in Table 5 in the Findings Section. The allowable voltage was assumed to be between 0.94 percentage units (p.u.) to 1.06 p.u. of the main transformer voltage [40]. This showed the appropriateness of the configuration of the simulated distribution grid, seen below in Figure 2.
Table 1 provides the section length, load ratio, and pole transformer tap for Feeder 1 based on KEPCO data and Shin [26]. The line resistance (r) is 0.182 Ω/km and the line reactance (x) is 0.391 Ω/km for the entire feeder system [26].
The parameters of the main transformer, OLTC, and SVR are as presented below:
2.2. Maximum DG Capacity Analysis
In general, the OLTC, SVR, and pillar transformer regulators adopted a line drop compensation (LDC) method to maintain end user voltage within permissible limits. In the LDC method, as the bank load (Ibank) increases or decreases beyond an acceptable limit due to an equivalent impendence (Zeq), a voltage regulation element (Vce) compensates [41]. In this method, the sending-end reference voltage is given by the following equation [42,43]:
where Vser is the sending-end reference voltage, Vce is the load center voltage, Zeq is the equivalent impedance of LDC device (ex. OLTC), and Ibank is the main transformer bank current.
For the purposes of this paper, the voltage regulation element (Vce) shown in Figure 3 will be the tap-changer setting of the OLTC, pillar transformer, and/or SVR. The tap-changer allows variable turn ratios to be selected in discrete steps. The variable turn ratios are obtained by connecting to a number of access points, known as taps, along either the primary or secondary winding. OLTCs are used when an interruption during a tap change is unacceptable. Both the OLTC and SVR typically include 32 taps, 16 to increase and 16 to decrease voltage, each tap equating to a 0.625% voltage variation for a total of a ± 10% voltage variation [44]. The pillar transformer tap works in the same way but is often set and infrequently changed [45]. Using the tap changer as the voltage regulation element, Equation (1) can be modified as follows [6]:
where, Vser is the sending-end reference voltage, Vtap,k is the secondary voltage when the tap is located at the k-th position, Zk is the equivalent impedance when the tap is located at the k-th position, and Ibank is the main transformer bank current.
Using these equations, the authors calculated the maximum DG capacity of Feeder 1 with and without the use of an SVR. This process was cyclical, with the authors performing voltage calculations based on simulated OLTC and SVR tap changes at 0.1 MW increments until the constraints were unsatisfied (voltage of system became greater than 1.06 p.u. or less than 0.94 p.u.). The voltage was impacted by the sending-end reference voltage (Equation (2)), DG penetration (Equation (3)), and the change in the voltage over distance (Equation (4)). The impact of the voltage by DG penetration was calculated as follows [6]:
where ΔVDG is the voltage change due to DG penetration, Zeq is the equivalent impedance of LDC device (ex. OLTC), and is sum of injected current by DGs.
The impact of the voltage by distance can be calculated as follows:
where, ΔVDist is the voltage change, Ip is the active current, r is the line resistance, Iq is the reactive current, x is the line reactance, l is the length of the transmission line (km), and Vce is the voltage regulation element represented by the tap-changer.
2.3. Economic Analysis
Finally, the authors performed an LCCA analysis, comparing the impact using an SVR has on a feeder’s profitability when DG penetration occurs. Table 2 shows the initial investment costs used for said analysis. The data includes the cost of the solar panels, PV system materials or all non-panel material costs, construction costs, the connection fee, design and licensing fees, and indirect costs which includes all management and overhead. These values were taken from Korea’s PV industry trends [46] and KEPCO’s database [40].
Table 3 depicts the revenue calculations and key economic variables used for said analysis, most of which were taken from the KEPCO database [40]. The analysis was performed on the penetration of Node 7 at the end of Feeder 1 in the simulated power system with the maximum penetration capacity estimated using the process provided in Section 2.2. As a standard LCCA practice, the study assumed the total cost defined as CAPEX + OPEX + Tax, as defined in the below Table 3.
Of the many economic variables shown in Table 3, the CAPEX provided the clearest insight into the difference in initial investment required when installing an SVR. As can be seen, the CAPEX for solar PV systems was estimated as $2.5 million per MW with and $2 million per MW without SVR, based on recent trend data from Korea’s electricity market [47]. An argument could be made that, with an increase in SVR use, production, and installation, there would be an expectant investment savings due to economies of scale. However, KEPCO practitioners and Korean renewable energy experts involved with this research believe that the unit cost of SVR installation has stabilized as the installation of SVRs in tandem with solar PV power penetration is nearly common practice and beyond the initial trial stage.
Along with the variables presented in Table 2 and Table 3, the LCCA was based off worst case, most likely case, and best-case revenue generation scenarios. These scenarios represented KEPCO’s ability to achieve a system marginal price (SMP), a renewable energy certificate (REC), and/or Korean offset credit (KCU). For the worst-case or “low scenario: SMP”, the plant would receive only revenue from the electricity tariff, or SMP. For the most likely or “base scenario: SMP + REC”, the plant would receive additional revenue from the REC transaction, which is expected under the current renewable portfolio standard (RPS) system in Korea. Finally, for the best-case or “high scenario: “SMP+ REC + KCU,” additional revenue would be received through the KCU, which is the CO2 emission trading systems (ETS) in Korea. Table 4 shows the six scenarios in which an LCCA was performed.
To compare the economic performance of the scenarios, the authors calculated the NPV, IRR, and PI. The NPV calculated the present value of future cash flows using a chosen discount rate. For this paper, if the NPV was greater than $2 million, the investment was considered economically viable. The NPV is calculated in Equation (5):
where CFI denotes cash flow input, CFO denotes cash flow output, r is the discount rate, and t is the time or payback period.
The IRR was the discount rate at which the present value of the future cash inflows from the investment was equal to the present value of the cash outflow. If the IRR was greater than the identified target return rate, 5.5% for this publication, the investment was considered to be economical. The IRR is calculated in Equation (6).
where, CFI denotes cash flow input, CFO denotes cash flow output, r is the discount rate, and t is the time or payback period.
Finally, the PI was the ratio of the present value of future cash flows to the initial investments of the project. In essence, this was a cost/benefit analysis and projects were considered viable when the PI was greater than one. The PI is calculated in Equation (7).
where NPV denotes the net present value as defined in Equation (5), and I denotes the initial investment required.
A probabilistic Monte Carlo analysis was then performed with the @Risk software (Microsoft Excel 2016, Microsoft, Redmond, WA, USA) using the variables found in Table 2 and Table 3. Through the @Risk Monte Carlo simulation, the authors used a program evaluation and review technique (PERT) distribution (commonly known in probabilistic simulation approach), which used a weighted average for input parameters’ probability, as shown below [49].
where, te denotes the weighted average of expected revenue; to denotes the high revenue; tm denotes the base revenue; and tp denotes the low revenue.
The standard deviation was calculated using the following equation, which is commonly known in the PERT probabilistic approach, [49]:
where σ denotes the standard deviation; to denotes the high revenue; and tp low revenue.
3. Findings
The existing feeder conditions and consumer voltage characteristics at a maximum and minimum load can be seen in Table 5, below. The data within the ’without SVR’ column and the ‘distributed generation penetration: 0 MW’ row cells represent existing conditions. The authors then simulated the feeder adding 3 MW DG penetration and/or SVR installation. As can be seen, when there was no DG penetration, the voltage stayed within the allowable range and no SVR was needed. Alternatively, when 3 MW DG was penetrated at a minimum load, the voltage increased above the allowable voltage to 1.0717 p.u. due to reverse current flow. In this case, voltage quality degradation occurred, and a mitigation plan was required to ensure a safe supply of power. Table 5 shows that the installation of an SVR was an appropriate mitigation technique as the voltage experiences dropped from 1.0717 p.u. to an acceptable variation of 1.0420 p.u. Even when the voltage was within the acceptable limits, it can be seen that the SVR still reduced the maximum to minimum voltage ranges. This is evidence of the SVR effectively improving the power quality of a distribution network with DG penetration.
Figure 3, below, depicts the result of the maximum penetration capacity analysis. The authors found that Feeder 1 had the capacity to be at 2.4 MW of DG penetration without an SVR and at 5.1 MW of DG penetration with an SVR prior to exceeding allowable voltage fluctuations.
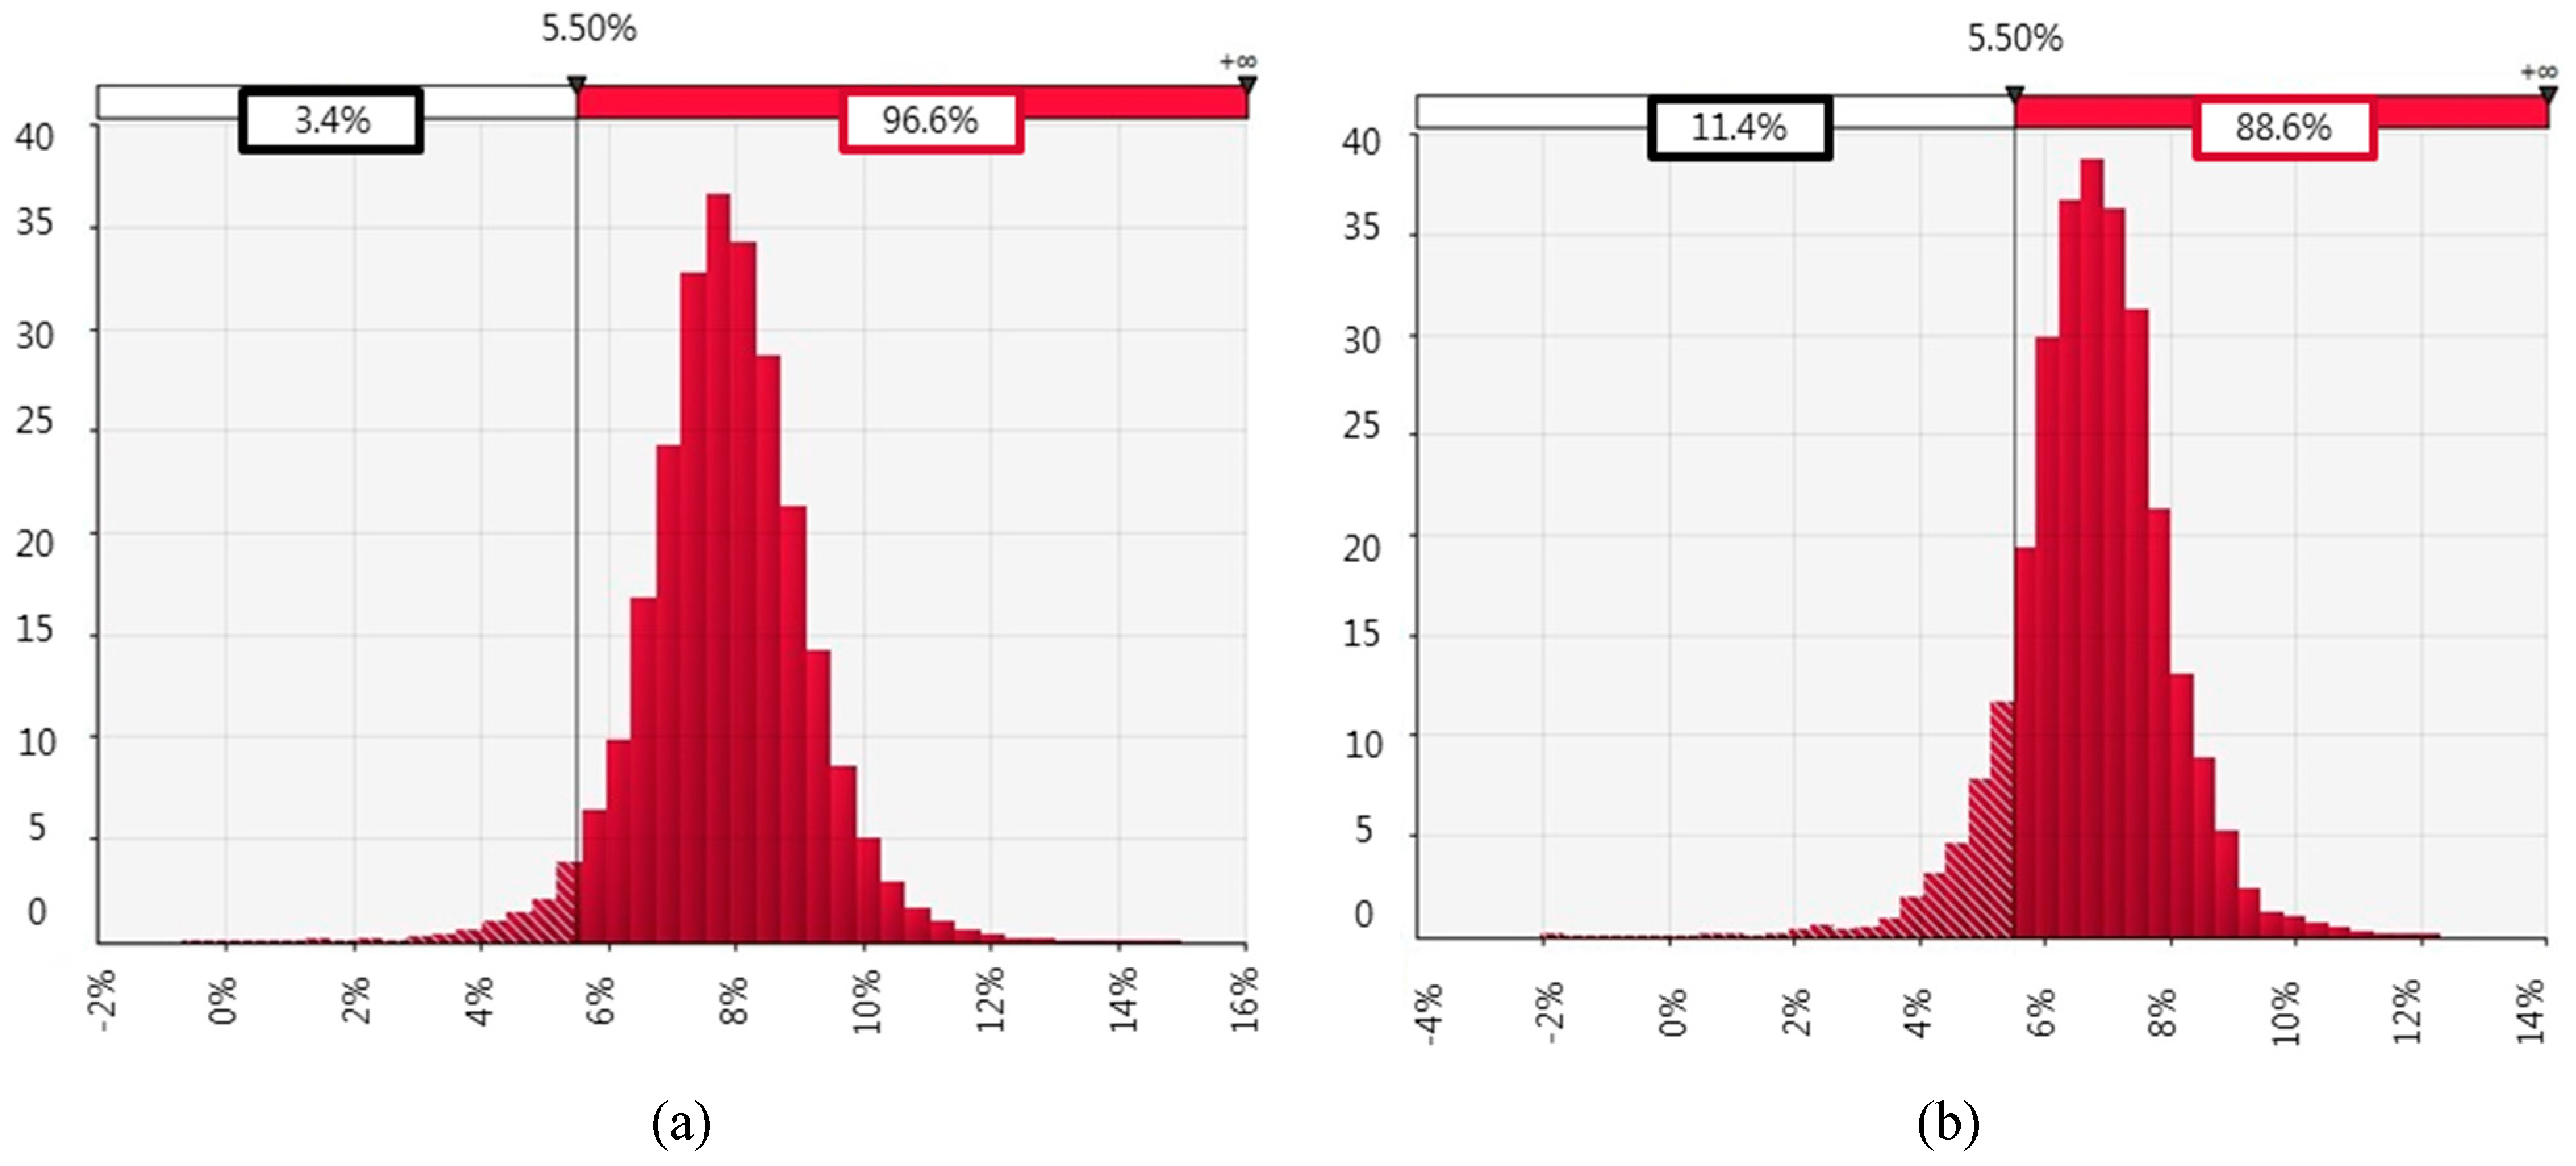
Using a DG penetration of 2.4 MW for a system without SVR and 5.1 MW DG for a system with SVR installations, the authors performed a Monte Carlo analysis. Results are shown in Figure 4 and Figure 5 These analyses use the most-likely or base case scenario in which KEPCO would receive revenue from SMP and REC. Figure 4 shows the results of the probabilistic analysis of the IRR, both when a power distribution network does not use an SVR (Figure 4a) and does use an SVR (Figure 4b). As can be seen, the probability that IRR is higher than the desired 5.5% was 96.6% without installing an SVR and 88.6% when the SVR was installed. This result means that not installing an SVR is more likely to be an attractive financial investment than installing an SVR. This is due to the more significant up-front installation costs associated with installing the SVR.
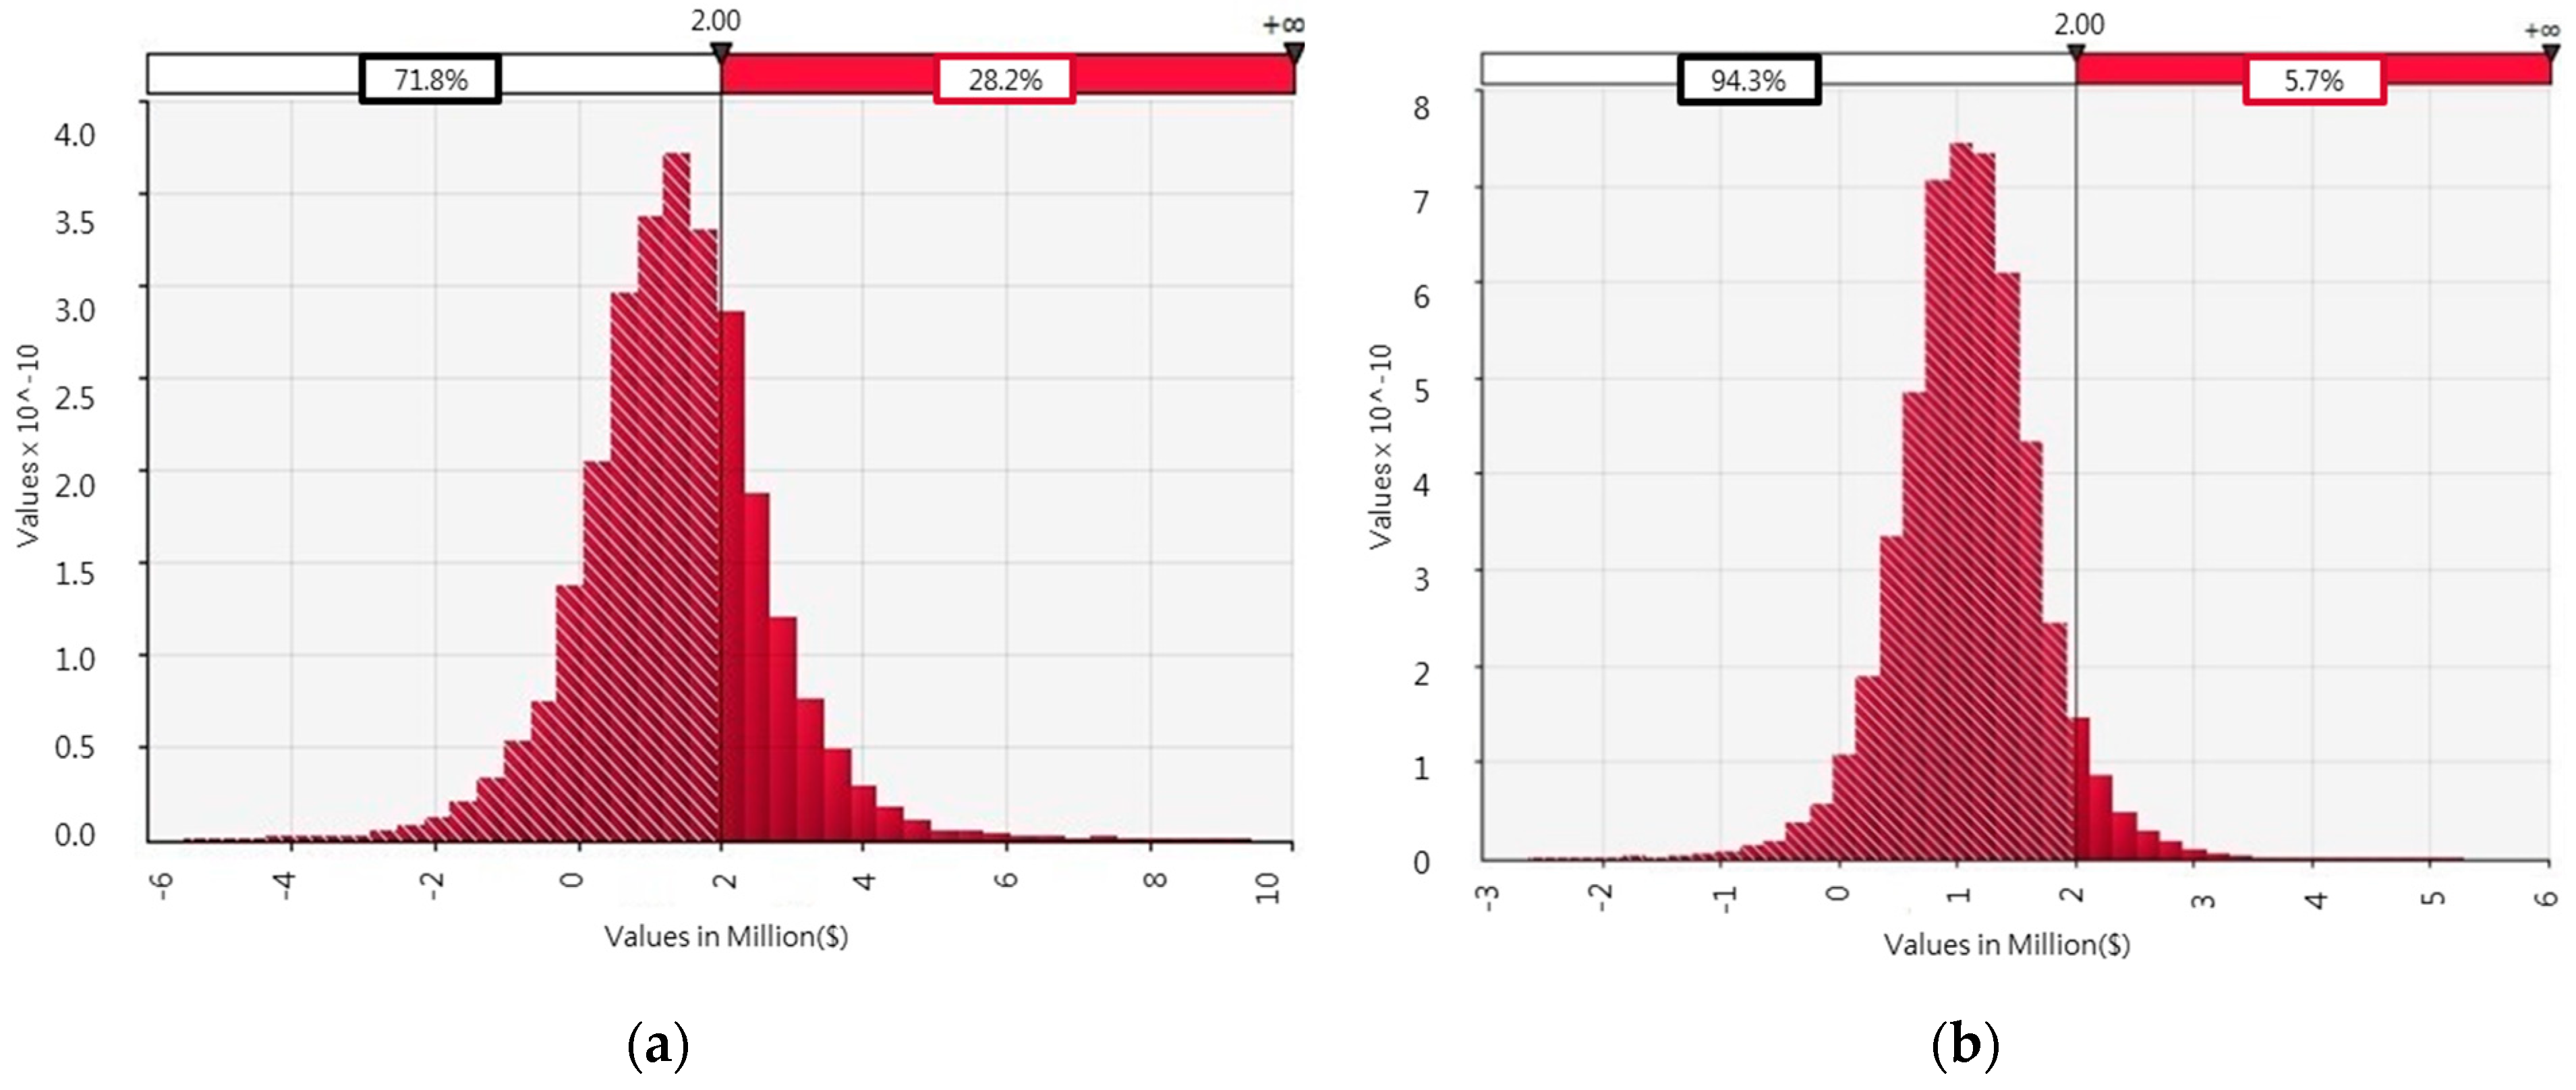
Figure 5 shows the results of the probabilistic analysis of the NPV, both when a power distribution network does not use an SVR (Figure 5a) and does use an SVR (Figure 5b). As can be seen, installing an SVR equated to a 20% greater chance of a financially viable project, receiving an NPV of $2M USD. This finding is in disagreement with the IRR findings, as it depicts the installation of an SVR as more economically attractive. The IRR and NPV findings mean that installing an SVR is more likely to earn KEPCO more profit over the life-span of the project, but not installing the SVR is more likely to result in KEPCO earning a profit at an earlier date. This is due to the high initial costs of installing the SVR.
The authors also performed a Monte Carlo Analyses on Feeder 1 with and without installing an SVR across the differing revenue scenarios. Table 6, below, shows the average results of each study. As can be seen, at the lowest scenario in which no additional revenue sources are received, installing an SVR had a financially inferior performance compared to not installing an SVR across all economic measures. It should be noted that at the low scenario, allowing DG penetration was not economically viable for KEPCO whether an SVR was installed or not. The base scenario results are repeated from above and, as stated above, show that installing the SVR reduced the IRR but increased the NPV. This is also mirrored if both REC and KCU are received.
4. Discussion
Traditionally, power generation has been through centralized units [50], large enough for automatic voltage regulator systems (AVRS) to be economically viable [51]. However, the current trend is towards much smaller, geographically dispersed power generation or DG [50]. In a general sense, this trend is a result of a desire to decentralize power grids due to its potential to increase the sustainability of power grids through the context of providing an even distribution of political, technological, economic, and social resources [3]. More specifically, this trend is guided by the powerful international [1] and domestic [2] political/societal push to pursue renewable or non-carbon-fueled power generation. Nuclear power has been a viable centralized alternative to the traditional carbon-based power generation but, due to the Japanese Fukushima Daiichi disaster, countries worldwide are abandoning its expansion [52]. Governments are therefore resorting to smaller, decentralized renewable power facilities or DG power generation as their non-carbon-fueled options [50]. Aside from the political and societal push, alternative power generation plants are also reaching grid parity, the point at which an alternative energy source can generate power at a cost less than or equal to the price of the existing power grid, making them attractive to investors regardless of the societal/environmental benefits [53]. For example, one study found that PV modules have decreased in cost by 75% between 2009 and 2014 [54]. With the financial, social, environmental, health, security, and general sustainable benefits [55], it is a near inevitability that DG penetration will rise exponentially in the upcoming years. This is most likely to be the case in sparsely settled countries (ex. Canada and Russia) and in countries with poor existing power grids (ex. developing nations) [55].
With the push towards DG, specifically renewable energy’s emerging grid parity, there is a high pressure on grid management internationally to mitigate the resultant reduction in power quality. This push equates to the utility operator and renewable power generation company having conflicting goals: the utility operator wants a stable power system and the renewable power generation company wants to maximize power production. Korea is already feeling the impacts with KEPCO currently encountering problems with DG penetration and the associated reverse flow and reduced power quality nationwide. Common solutions to this problem are policies to cap DG penetration [56]; requiring the plant to supply their own voltage regulators (ex. AVRS) [51]; combined heat and power [29]; battery energy management systems [28]; and/or feeder tap changer systems such as SVRs presented above. At the international scale, the utility operator’s response has often been to set caps on the allowable DG penetration when voltage readings become too high [56]. This solution limits renewable energy growth, contrast to international [1] and domestic [2] policies; reduces energy security and efficiency by reducing generation diversity [3]; minimizes the opportunities to reduce carbon emissions [51]; and negatively impacts the economy at a national and individual level [57]. The PV market has become attractive to a wide range of investors ranging from the traditional electric utility industry to private homeowners [58]. Capping DG penetration also caps the PV market, reducing feeder-wide (and nationwide) economic efficiencies. It also impacts individual’s ability to increase economic efficiency as ‘grid defection,’ when a consumer self-supplies reliable power and disconnects from the local utility, was found to be two times as expensive as tying into the existing feeder system [57]. In summary, placing caps on DG penetration appears to be unsustainable, if not inadvisable, solution.
Concerning the alternative voltage mitigation measures, KEPCO has yet to require DG power generation facilities to provide their own voltage regulators (ex. AVRS). Due to the small scale inherent to DG power generation, this solution may not be economically feasible. KEPCO has found energy storage systems to be an overly expensive option, and the use of combined heat and power units, while considered a promising approach, is still in the pilot stages. As such, the solution that best mitigates voltage fluctuation while still allowing free market DG power generation thus far has been for the utility operator to install SVRs to manage the voltage of the power system. As shown by the above findings, with the introduction of an SVR in the power distribution network, the maximum DG penetration capacity increases. This allows the renewable power generation company to increase revenues by investing in more facilities near the existing point of DG penetration. KEPCO has recently decided to implement voltage mitigation measures based on system simulations identical to those presented in the above paper. The findings of this paper support SVR installation becoming an industry trend in voltage management as other utility operators perform similar system simulations and come to the same conclusion.
5. Conclusions and Future Research
The results of this paper confirm that voltage fluctuations caused by the penetration of distributed generation (DG) in power distribution networks is mitigated through the use of on-load tap-changers (OLTC) and step voltage regulators (SVR). In the case of a 3 megawatt (MW) DG penetration, overvoltage outside the allowable range occurred when there was no SVR installed. Alternatively, when the SVR was installed, a 5% voltage drop was experienced. This resulted in the voltage lowering to an allowable range. This paper also conducted a study on the impact SVRs have on the maximum allowable DG penetration capacity. Simulating the impacts of DG penetration on 30 km of transmission line, it was found that the SVR increased the allowable DG penetration from 2.4 MW to 5.1 MW. This was a result of the SVRs mitigating the increased voltage caused by DGs.
To understand what impact SVRs have on renewable energy profitability, this paper also performed an LCCA on the feeder system without an SVR (2.4 MW) and with an SVR (5.1 MW). Since the installation of the SVR increased upfront costs and operation and maintenance expenditures, not installing SVR resulted in an approximate 10% greater likelihood of an economically viable project (internal rate of return discount rate) than if an SVR was installed. Alternatively, the net present value (NPV) was found to be 0.6–1.0 million USD greater at an 80% likelihood when an SVR was used versus when it was not used. In the most pessimistic scenario, which included no REC or KCU revenue, the installation of an SVR was not a financially viable option (NPV was $4 million less than without an SVR). This was because the proportion of SVR investment in total investment would increase as solar PV investment decreased. However, in the most likely scenario of receiving REC revenue, and the optimistic scenario of receiving both REC and KCU, installing the SVR would lead to an increase in NPV.
Future Research
The study findings within this paper were based on a hypothetical power distribution network in Korea. To validate the findings, future research will include collecting field data for several distribution system models. This will include research on investments made in real-world applications based on the needs of the renewable power generation company and utility operators. In addition, although in this study the LDC parameter is assumed as a fixed value for the purposes of simplicity, the effect of SVR implementation can be maximized further by applying it with the optimization method of SVR LDC. This paper’s scope has also been limited to the binary assessment of using or not using an SVR. There are many voltage mitigation solutions and future research should include comparing the economic feasibility of all these options. Future research will also include an NPV analysis on private renewable power producers’ voltage mitigation solutions as the industry begins to shift responsibility from KEPCO to those who supply solar PV to the power grid. Future research will include considering protection cooperation’s impact on DG penetration capacity. Studies will also be optimizing SVR conditions by minimizing the frequency of tap changes required, thereby improving the reliability of the power distribution network.
The reliance on OLTC transformers to mitigate voltage fluctuations caused by DG penetration through PV energy production may reduce the lifespan of electrical devices. The OLTC transformers experience many tap changes with DG penetration, as this is the main method of voltage fluctuation mitigation, which results in an increased maintenance requirement and decreased lifespan [59]. Future research will incorporate this potential negative concern when more reliable data is available. Future research will also incorporate EES control schemes, as battery back-up systems for solar PV, to study their impact on the value of electrical energy storage to network operations [60].
Author Contributions
Y.-C.J. developed the concept and drafted the manuscript. E.-B.L. reviewed and revised the manuscript and supervised the overall work. D.A. enhanced the study contents and added academic feedback on the manuscript. All authors read and approved the final manuscript.
Funding
The authors acknowledge that this research was sponsored by the Ministry of Trade Industry and Energy (MOTIE/KEIT) Korea through the Technology Innovation Program funding for: (1) Artificial Intelligence Big-data (AI-BD) Platform for Engineering Decision-support Systems (grant number = 20002806); and (2) Intelligent Project Management Information Systems (i-PMIS) for Engineering Projects (grant number = 10077606).
Acknowledgments
The authors would like to thank KEPCO EC for providing the data and information used for this study. The authors would like to thank C. S. Hong (a researcher in POSTECH University) for his academic inputs and feedback on this research.
Conflicts of Interest
The authors declare no conflicts of interest.
Abbreviations
| CAPEX | Capital Expenditures |
| DG | Distributed generation |
| ETS | Emission Trading System |
| IRR | Internal Rate of Return |
| KCU | Korean Offset Credit |
| KEPCO | Korea Electric Power Corporation |
| LCCA | Life Cycle Cost Analysis |
| LDC | Line Drop Compensation |
| MATLAB | Matrix Laboratory |
| NPV | Net Present Value |
| OLTC | On-load tap-changers |
| OPEX | Operation Expenditure |
| PV | photovoltaic |
| REC | Renewable Energy Certificate |
| RPS | Renewable Portfolio Standard |
| SMP | System Marginal Price |
| SVR | Step Voltage Regulators |
References
- United Nations. Ensure Access to Affordable, Reliable, Sustainable, and Modern Energy. Sustainable Development Goals. 2018. Available online: https://www.un.org/sustainabledevelopment/energy/ (accessed on 14 November 2018).
- The Government of the Republic of Korea. The 7th Basic Plan for Long-Term Electricity Supply and Demand; Ministry of Trade, Industry Energy: Sejong City, Korea, 2015.
- Alanne, K.; Saari, A. Distributed energy generation and sustainable development. Renew. Sustain. Energy Rev. 2006, 10. [Google Scholar] [CrossRef]
- Lopes, J.P.; Hatziargyriou, N.; Mutale, J.; Djapic, P.; Jenkins, N. Integrating distributed generation into electric power systems: A review of drivers, challenges and opportunities. Electr. Power Syst. Res. 2007, 77, 1189–1203. [Google Scholar] [CrossRef]
- Sgouras, K.I.; Bouhouras, A.S.; Gkaidatzis, P.A.; Doukas, D.I.; Labridis, D.P. Impact of reverse power flow on the optimal distributed generation placement problem. IET Gener. Transm. Distrib. 2017, 11, 4626–4632. [Google Scholar] [CrossRef]
- Song, I.K.; Jung, W.W.; Chu, C.M.; Cho, S.S.; Kang, H.K.; Choi, J.H. General and simple decision method for DG penetration level in view of voltage regulation at distribution substation transformers. Energies 2013, 6, 4786–4798. [Google Scholar] [CrossRef]
- Kim, J.E. Distributed Power Distribution System Voltage Analysis. Trans. Korean Inst. Electr. Eng. 2012. [Google Scholar]
- Chae, W.K. A Study on the Application of SVR at the Distribution Line Interconnected with Wind Turbine. J. Korean Inst. Illum. Electr. Install. Eng. 2010, 24, 109–118. [Google Scholar] [CrossRef]
- Barker, P. Overvoltage considerations in applying distributed resources on power systems. In Proceedings of the IEEE Power Engineering Society Summer Meeting, Chicago, IL, USA, 21–25 July 2002; Volume 1, pp. 109–114. [Google Scholar] [CrossRef]
- Kim, S.H. A Study on the Analysis of Customer Voltage Characteristic with Distributed Generation. Trans. Korean Inst. Electr. Eng. 2010, 333–335. Available online: https://www.dbpia.co.kr/Journal/ArticleDetail/NODE01575855#/ (accessed on 5 December 2018).
- Duong, M.Q.; Tran, N.T.; Sava, G.N.; Scripcariu, M. The impacts of distributed generation penetration into the power system. InElectromechanical and Power Systems (SIELMEN). In Proceedings of the IEEE 2017 International Conference, Boston, MA, USA, 11–14 December 2017; pp. 295–301. [Google Scholar] [CrossRef]
- Quezada, V.M.; Abbad, J.R.; Roman, T.G. Assessment of energy distribution losses for increasing penetration of distributed generation. IEEE Trans. Power Syst. 2006, 21, 533–540. [Google Scholar] [CrossRef]
- Viral, R.; Khatod, D.K. An analy tical approach for sizing and siting of DGs in balanced radial distribution networks for loss minimization. Int. J. Electr. Power Energy Syst. 2015, 1, 191–201. [Google Scholar] [CrossRef]
- Esmaili, M.; Firozjaee, E.C.; Shayanfar, H.A. Optimal placement of distributed generations considering voltage stability and power losses with observing voltage-related constraints. Appl. Energy 2014, 1, 1252–1260. [Google Scholar] [CrossRef]
- Gkaidatzis, P.A.; Doukas, D.I.; Bouhouras, A.S.; Sgouras, K.I.; Labridis, D.P. Impact of penetration schemes to optimal DG placement for loss minimisation. Int. J. Sustain. Energy 2017, 36, 473–488. [Google Scholar] [CrossRef]
- Abdmouleh, Z.; Gastli, A.; Ben-Brahim, L.; Haouari, M.; Al-Emadi, N.A. Review of optimization techniques applied for the integration of distributed generation from renewable energy sources. Renew. Energy 2017, 113, 266–280. [Google Scholar] [CrossRef]
- Chiradeja, P.; Ramakumar, R. An approach to quantify the technical benefits of distributed generation. IEEE Trans. Energy Convers. 2004, 19, 764–773. [Google Scholar] [CrossRef]
- Lee, E.M.; Kim, M.Y.; Rho, D.S.; Sohn, S.W.; Kim, J.E.; Park, C.H. A Study on the Optimal Introduction of Step Voltage Regulator (SVR) in Distribution Feeders. Trans. Korean Inst. Electr. Eng. 2004, 53, 610–618. Available online: http://www.dbpia.co.kr/Journal/ArticleDetail/NODE01242881#/ (accessed on 5 December 2018).
- Takahashi, S.; Hayashi, Y.; Tsuji, M.; Kamiya, E. Method of Optimal Allocation of SVR in Distribution Feeders with Renewable Energy Sources. J. Int. Council Electr. Eng. 2012, 2, 159–165. [Google Scholar] [CrossRef] [Green Version]
- Liu, X.; Aichhorn, A.; Liu, L.; Li, H. Coordinated control of distributed energy storage system with tap changer transformers for voltage rise mitigation under high photovoltaic penetration. IEEE Trans. Smart Grid 2012, 3, 897–906. [Google Scholar] [CrossRef]
- Kojovic, L.A. Coordination of distributed generation and step voltage regulator operations for improved distribution system voltage regulation. In Proceedings of the 2006 IEEE Power Engineering Society General Meeting, Montreal, QC, Canada, 18–22 June 2006; p. 6. [Google Scholar] [CrossRef]
- Kojovic, L.A. Modern techniques to study voltage regulator—DG interactions in distribution systems. In Proceedings of the 2008 IEEE/PES Transmission and Distribution Conference and Exposition, Chicago, IL, USA, 21–24 April 2008; pp. 1–6. [Google Scholar] [CrossRef]
- Lee, H.O. A Study on Optimal Placement and Voltage Control Method of SVR in Smart Grid. Soongsil University, Seoul. 2014. Available online: http://www.riss.kr/link?id=T13515858/ (accessed on 5 December 2018).
- Kim, M.Y. A Study for Influence of Step Voltage Regulator in Distribution Systems with Distributed Generations. Trans. Korean Inst. Electr. Eng. 2009, 11, 284–285. Available online: http://www.dbpia.co.kr/Journal/ArticleDetail/NODE01394148#/ (accessed on 5 December 2018).
- Kim, M.Y.; Oh, Y.T.; An, J.Y.; Kim, J.E.; Kim, E.S.; Rho, D.S. A Study on the Optimal Voltage Regulation in Distribution Systems with Dispersed Generation Systems. Trans. Korean Inst. Electr. Eng. 2005, 54, 251–258. [Google Scholar] [CrossRef]
- Shin, K.H. A Study on the Method for Controlling Sending-End Voltage for Voltage Regulation at the Distribution System with Large Distributed Generation. Master’s Thesis; Soongsil University: Seoul, Korea, 2015. Available online: http://www.riss.kr/link?id=T13818300/ (accessed on 5 December 2018).
- Farag, H.E.; El-Saadany, E.F. Voltage regulation in distribution feeders with high DG penetration: From traditional to smart. In Proceedings of the 2011 IEEE Power and Energy Society General Meeting, Detroit, MI, USA, 24–29 July 2011; pp. 1–8. [Google Scholar] [CrossRef]
- Thirugnanam, K.; Kerk, S.G.; Yuen, C. Battery integrated solar photovoltaic energy management system for micro-grid. In Proceedings of the Innovative Smart Grid Technologies-Asia (ISGT ASIA), Bangkok, Thailand, 3–6 November 2015; pp. 1–7. [Google Scholar]
- Bjelic, I.B.; Ciric, R.M. Optimal distributed generation planning at a local level—A review of Serbian renewable energy development. Renew. Sustain. Energy Rev. 2014, 39, 79–86. [Google Scholar] [CrossRef]
- Strbac, G.; Ramsay, C.; Pudjianto, D. Integration of Distributed Generation into the UK Power System. Summary Report. DTI Centre for Distributed Generation and Sustainable Electrical Energy. 2007. Available online: https://www.ofgem.gov.uk/ofgem-publications/55759/dgseeewpdgvaluepaperv30.pdf/ (accessed on 7 December 2018).
- DECC. Review of the Generation Costs and Deployment Potential of Renewable Electricity Technologies in the UK: Study Report. 2011. Available online: http://www.gov.uk/government/uploads/system/uploads/attachment_data/file/147863/3237-cons-ro-banding-arup-report.pdf (accessed on 14 November 2018).
- Audenaert, A.; De Boek, L.; De Cleyn, S.; Lizin, S.; Adam, J.F. An economic evaluation of photovoltaic grid connected systems (PVGCS) in Flanders for companies: A generic model. Renew. Energy 2010, 35, 2674–2682. [Google Scholar] [CrossRef]
- Kolhe, M.; Kolhe, S.; Joshi, J.C. Economic viability of stand-alone solar photovoltaic system in comparison with diesel-powered system for India. Energy Econ. 2002, 24, 155–165. [Google Scholar] [CrossRef]
- Bernal-Agustin, J.L.; Dufo-Lopez, R. Economical and environmental analysis of grid connected photovoltaic systems in Spain. Renew. Energy 2006, 31, 1107–1128. [Google Scholar] [CrossRef]
- Muttaqi, K.M.; Le, A.D.; Aghaei, J.; Mahboubi-Moghaddam, E.; Negnevitsky, M.; Ledwich, G. Optimizing distributed generation parameters through economic feasibility assessment. Appl. Energy 2016, 165, 893–903. [Google Scholar] [CrossRef] [Green Version]
- Calovic, M.-S. Modeling and analysis of under load tap changing transformer control system. IEEE Trans. Power Appar. Syst. 1984, 107, 1909–1915. [Google Scholar] [CrossRef]
- Jordehi, A.R. Allocation of distributed generation units in electric power systems: A review. Renew. Sustain. Energy Rev. 2016, 1, 893–905. [Google Scholar] [CrossRef]
- Allan, G.; Eromenko, I.; Gilmartin, M.; Kockar, I.; McGregor, P. The economics of distributed energy generation: A literature review. Renew. Sustain. Energy Rev. 2015, 1, 543–556. [Google Scholar] [CrossRef]
- Mahmud, N.; Zahedi, A. Review of control strategies for voltage regulation of the smart distribution network with high penetration of renewable distributed generation. Renew. Sustain. Energy Rev. 2016, 64, 582–595. [Google Scholar] [CrossRef]
- KEPCO. Distributed Energy Resources Distribution System Interconnection Technology Standard. 2015. Available online: https://cyber.kepco.co.kr/ckepco/front/jsp/CY/H/C/CYHCHP00801.jsp (accessed on 14 November 2018).
- Seo, K.H. A Study on Output Voltage Method for Maintaining Line Voltage in High Capacity Distributed Power Distribution System Connection. Master’s Thesis, Graduate School of Soongsil University, Seoul, Korea, 2015. [Google Scholar]
- Choi, J.H.; Kim, J.-C. Advanced voltage regulation method of power distribution systems interconnected with dispersed storage and generation systems. IEEE Trans. Power Deliv. 2001, 16, 329–334. [Google Scholar] [CrossRef]
- Choi, J.H.; Moon, S.-I. The dead band control of LTC transformer at distribution substation. IEEE Trans. Power Syst. 2009, 24, 319–326. [Google Scholar] [CrossRef]
- Siemens Energy Sector. Power Engineering Guide; Siemens: Erlangen, Germany, 2016; Available online: http://www.energy.siemens.com/hq/en/energy-topics/publications/power-engineering-guide/ (accessed on 14 November 2018).
- Advanced Distribution System Engineering; Korean Institute of Electrical Engineers: Seoul, Korea, 2014.
- Korea Eximbank. Photovoltaic Industry Trend in the Second Quarter of 2017. Seoul, Korea, 2017. Available online: http://keri.koreaexim.go.kr/site/program/board/basicboard/view?boardtext8=PA03currentpage=3menuid=007002001003pagesize=10boardtypeid=168boardid=57900 (accessed on 5 December 2018).
- Rho, D.S.; Lee, E.M.; Park, C.H.; Kim, E.S. In Economic Evaluation of Step Voltage Regulator in Distribution Systems. Proceedings of the KIEE Conference, The Korean Institute of Electrical Engineers. Available online: http://www.dbpia.co.kr/Journal/ArticleDetail/NODE01339555#/ (accessed on 5 December 2018).
- Jun, K.S. A Case Study on Decision-Making Process for Economic Feasibility under Uncertainty for Steel Plant Projects. Master’s Thesis, POSTECH, Pohang, Korea, 2014. Available online: http://www.riss.kr/link?id=T13405695/ (accessed on 5 December 2018).
- Cottrell, W.D. Simplified program evaluation and review technique (PERT). J. Constr. Eng. Manag. 1999, 125, 16–22. [Google Scholar] [CrossRef]
- Gozde, H.; Taplamacioglu, M.C. Comparative performance analysis of artificial bee colony algorithm for automatic voltage regulator (AVR) system. J. Frankl. Inst. 2011, 348, 1927–1946. [Google Scholar] [CrossRef]
- Wolsink, M. The research agenda on social acceptance of distributed generation in smart grids: Renewable as common pool resources. Renew. Sustain. Energy Rev. 2012, 16, 822–835. [Google Scholar] [CrossRef]
- Fam, S.D.; Xiong, J.; Xion, G.; Yong, D.L.; Ng, D. Post-Fukushima Japan: the continuing nuclear controversy. Energy Policy 2014, 68, 199–205. [Google Scholar] [CrossRef]
- Karneyeva, Y.; Wüstenhagen, R. Solar feed-in tariffs in a post-grid parity world: The role of risk, investor diversity and business models. Energy Policy 2017, 106, 445–456. [Google Scholar] [CrossRef]
- Taylor, M.; Daniel, K.; Ilas, A.; So, E.Y. Renewable Power Generation Costs in 2014; International Renewable Energy Agency: Masdar City, Abu Dhabi, UAE, 2015. [Google Scholar]
- Owusu, P.A.; Asumadu-Sarkodie, S. A review of renewable energy sources, sustainability issues and climate change mitigation. Cogent Eng. 2016, 3, 1167990. [Google Scholar] [CrossRef]
- Alyami, S.; Wang, Y.; Wang, C.; Zhao, J.; Zhao, B. Adaptive real power capping method for fair overvoltage regulation of distribution networks with high penetration of PV systems. IEEE Trans. Smart Grid 2014, 5, 2729–2738. [Google Scholar] [CrossRef]
- Hittinger, E.; Siddiqui, J. The challenging economics of US residential grid defection. Utilities Policy 2017, 45, 27–35. [Google Scholar] [CrossRef]
- Bergek, A.; Mignon, I.; Sundberg, G. Who invests in renewable electricity production? Empirical evidence and suggestions for further research. Energy Policy 2013, 56, 568–581. [Google Scholar] [CrossRef] [Green Version]
- Yan, R.; Marais, R.; Saha, T.K. Impacts of residential photovoltaic power fluctuation on on-load tap changer operation and a solution using DSTATCOM. Electric Power Syst. Res. 2014, 111, 185–193. [Google Scholar] [CrossRef]
- Wang, P.; Liang, D.H.; Yi, J.; Lyons, P.F.; Davison, P.J.; Taylor, P.C. Integrating Electrical Energy Storage Into Coordinated Voltage Control Schemes for Distribution Networks. IEEE Trans. Smart Grid 2014, 5, 1018–1032. [Google Scholar] [CrossRef]
Figure 1.
Research methodology.
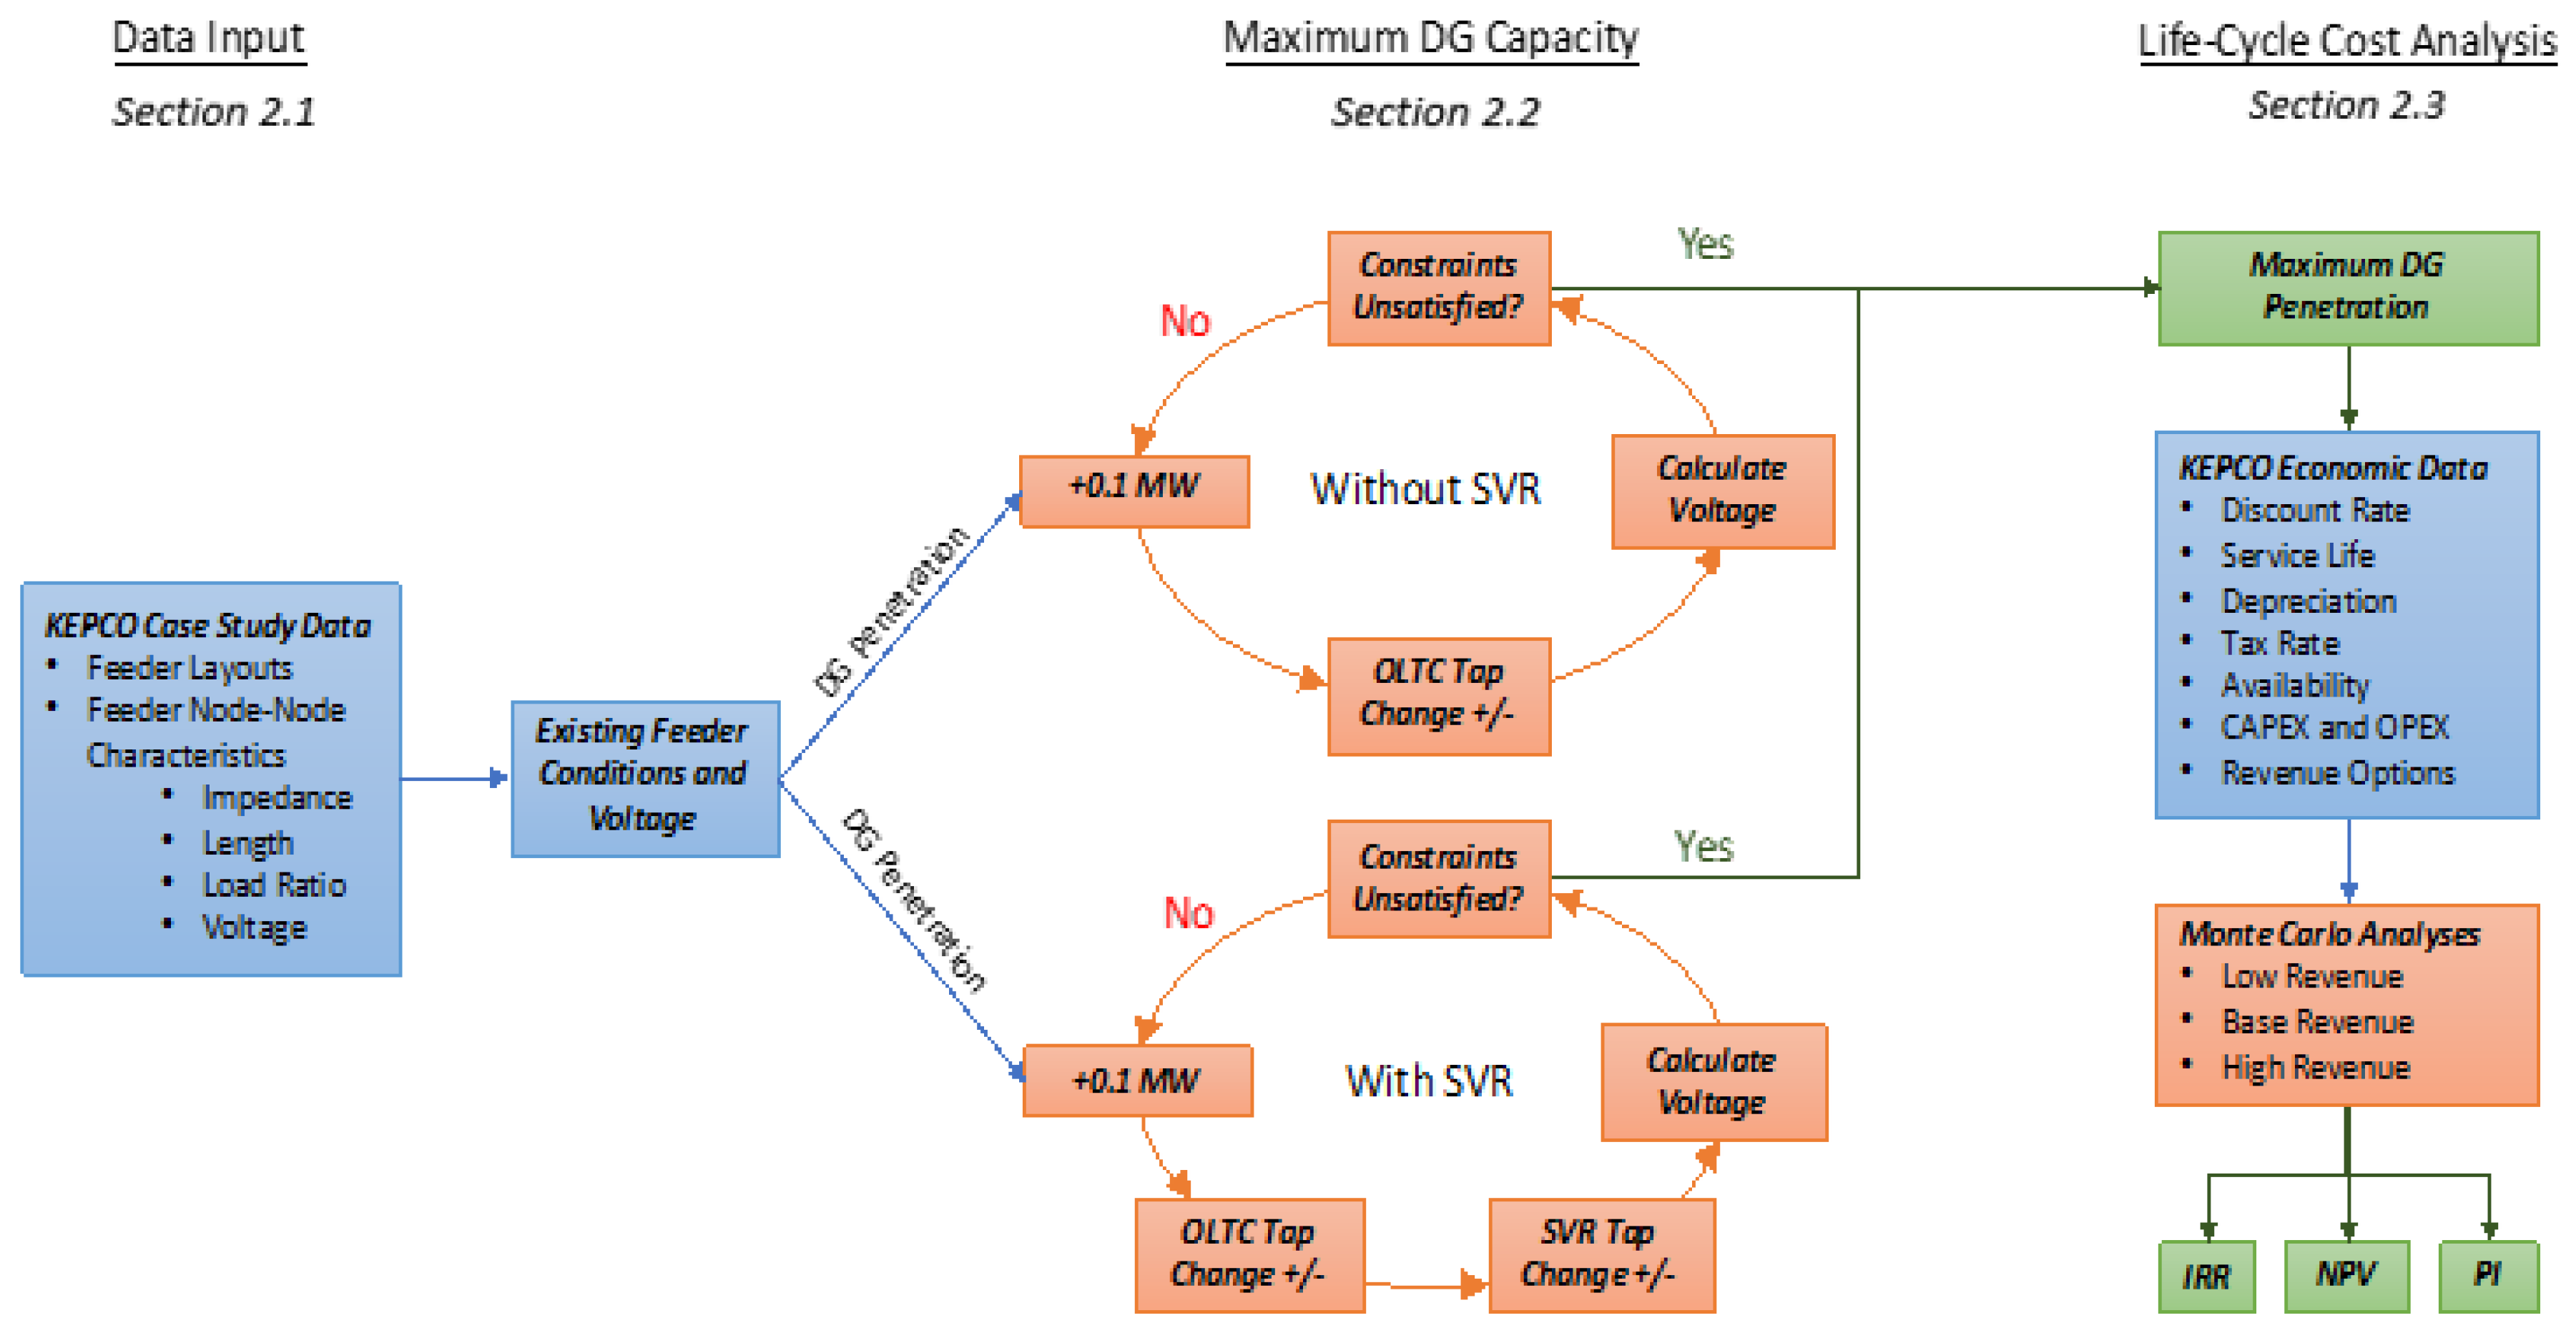
Figure 2.
Hypothetical power distribution network scheme.

Figure 3.
Maximum capacity DG penetration with and without SVR.
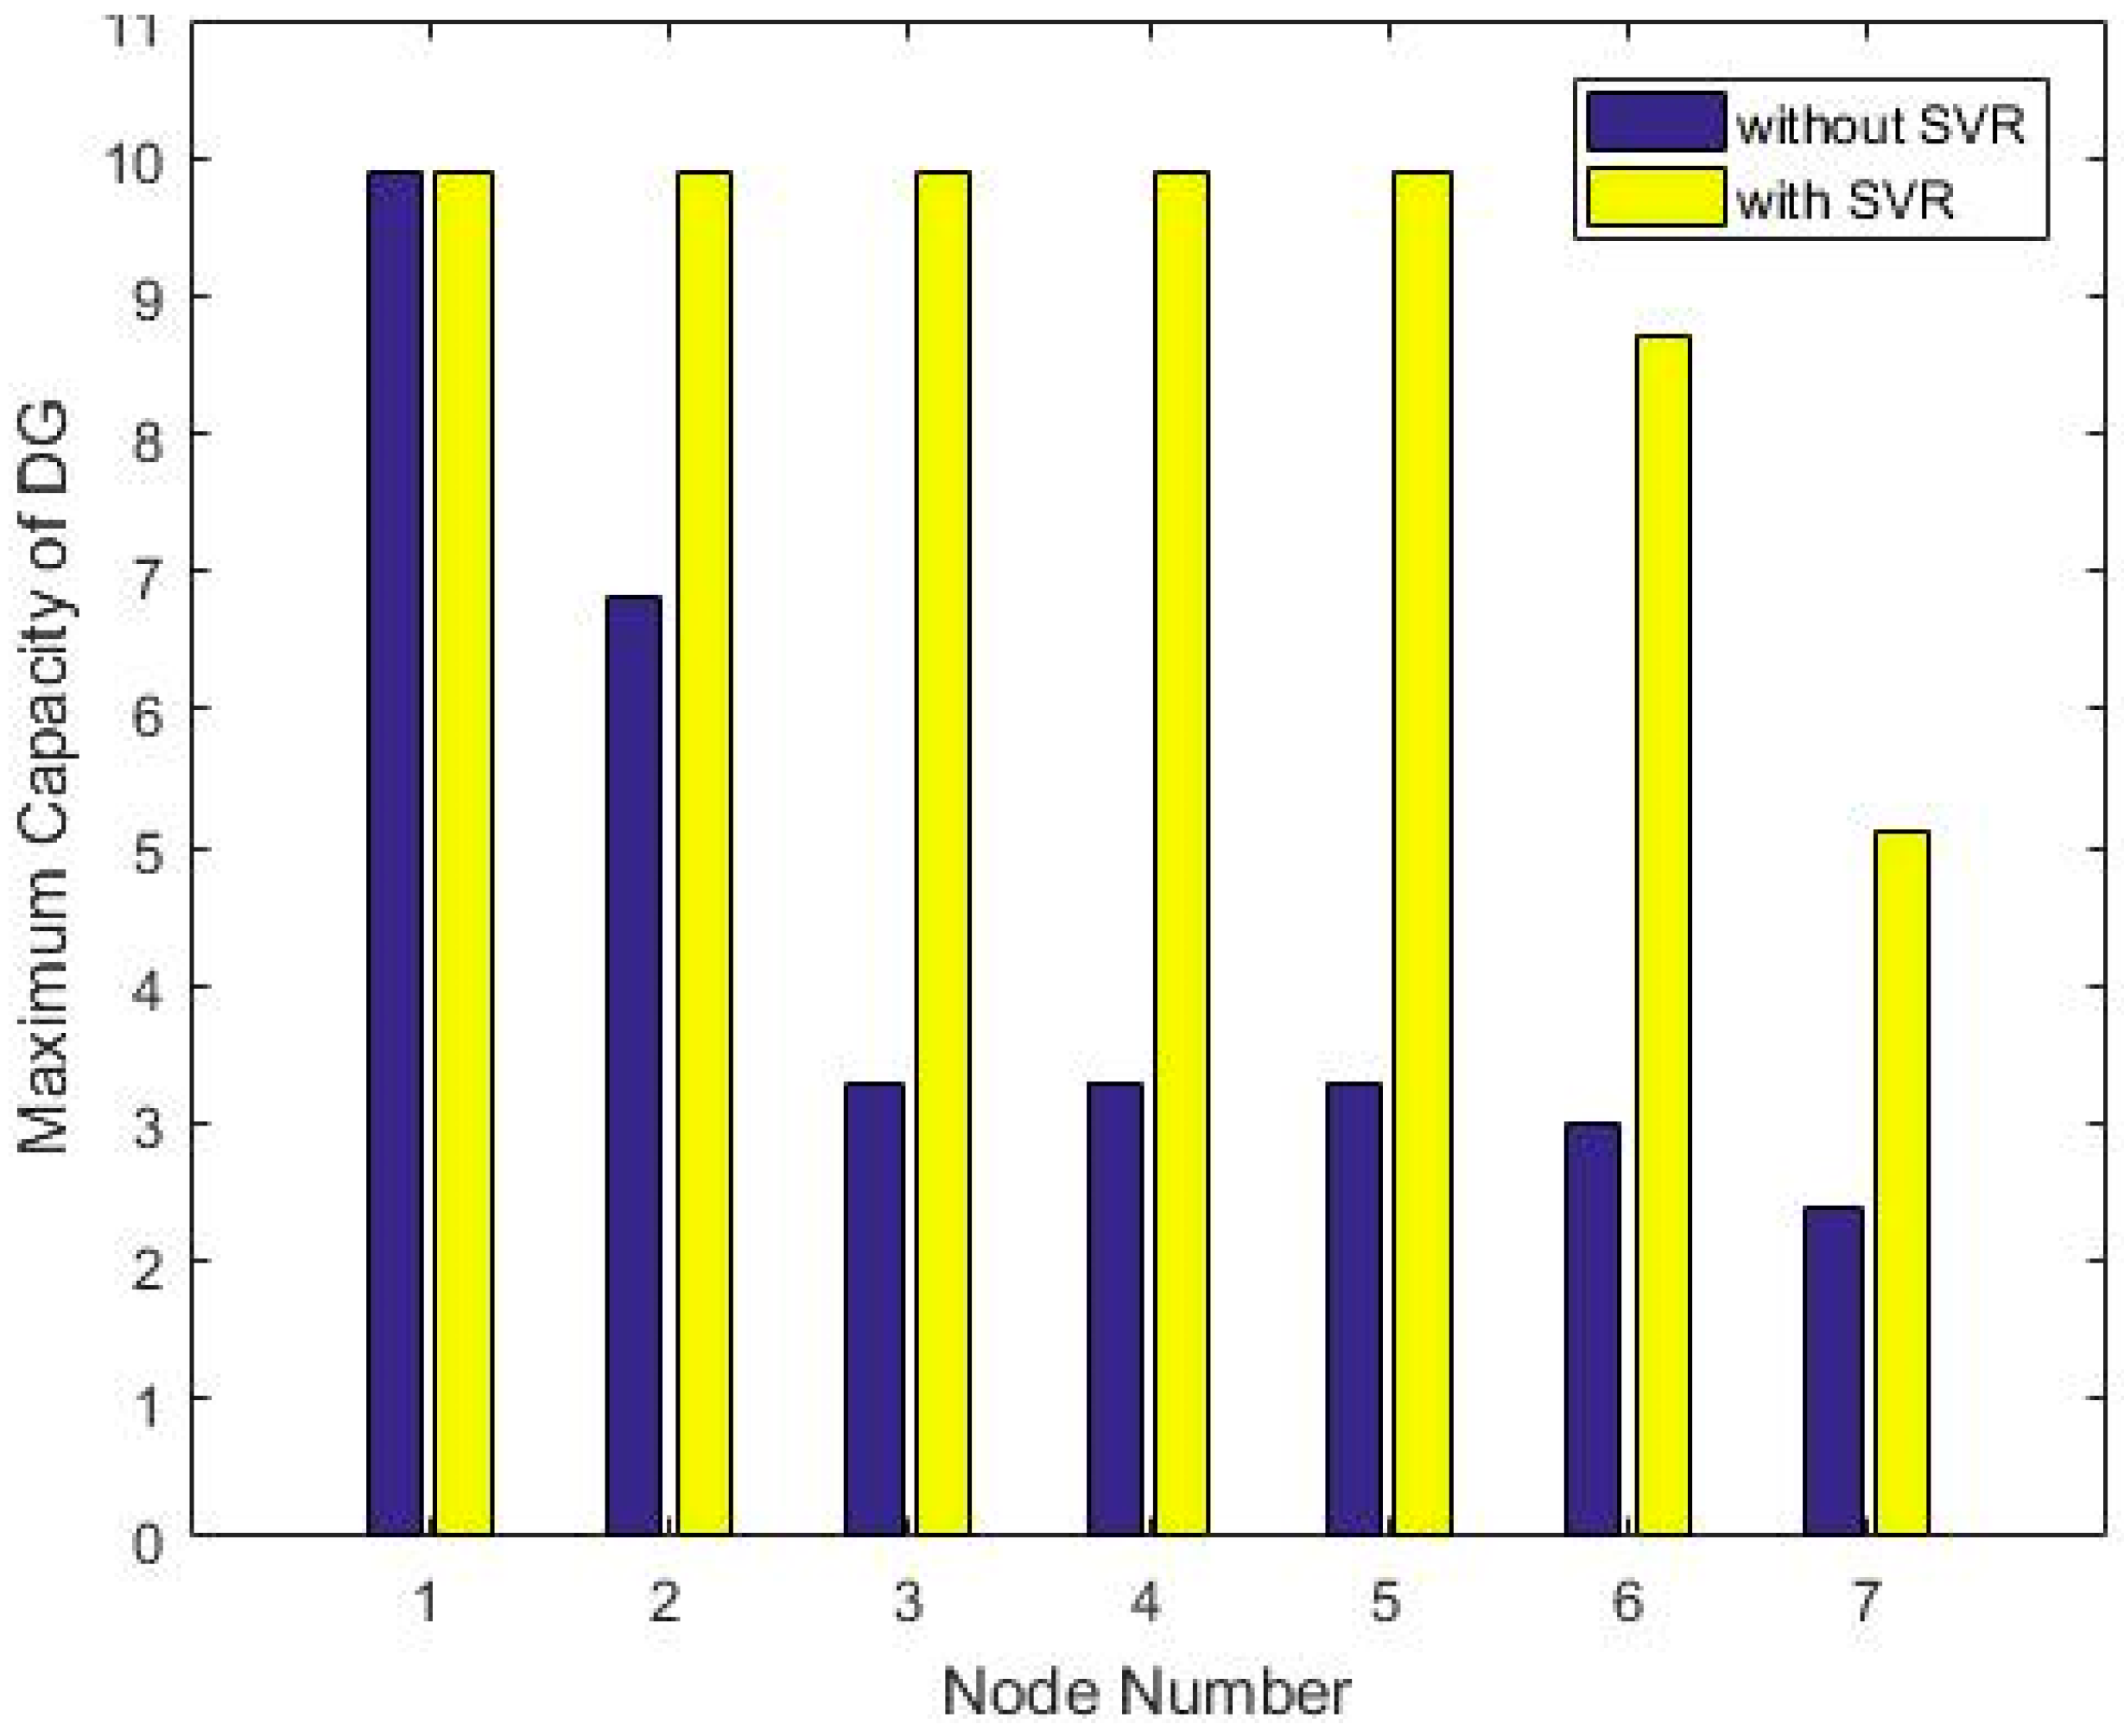
Figure 4.
Internal rate of return (IRR) Monte Carlo Analysis (a) without SVR and (b) with SVR.

Figure 5.
Net present value (NPV) Monte Carlo Analysis (a) without SVR and (b) with SVR.

Table 1.
High-voltage distribution line section data for Feeder 1.
| Node No. | Length (l) (km) | Load Ratio [%] | Pole Transformer Tap (V/V) | |
|---|---|---|---|---|
| From | To | |||
| 0 | 1 | 5 | 3 | 13,200/230 |
| 1 | 2 | 4 | 3 | 13,200/230 |
| 2 | 3 | 4 | 1 | 12,600/230 |
| 4 | 5 | 2 | 3 | 12,600/230 |
| 5 | 6 | 5 | 4 | 12,600/230 |
| 6 | 7 | 4 | 7 | 12,600/230 |
| 7 | 8 | 6 | 5 | 12,600/230 |
Table 2.
Initial investment costs.
| Costs | Detailed Criteria | Estimated Value | Cost Used for Analysis * |
|---|---|---|---|
| Solar Panels |
| $400/kW | $400/kW |
| PV System Materials |
| $1000/kW | $1000/kW |
| Construction |
| 10% | $199/kW |
| Connection Fee |
| 8% | $159/kW |
| Design/Licensing |
| 2% | $40/kW |
| Indirect |
| 9.50% | $189/kW |
| Total Cost: | $1987/kW | ||
* All costs are shown in USD, using a Korean Won 1000 to $1 USD exchange rate.
Table 3.
Key economic variables.
| Parameter | Value | Remark |
|---|---|---|
| Discount Rate | 5.50% | Korea Development Institute for public investment projects |
| Service Life | 25 years | - |
| Depreciation | 20-year straight line | Domestic Development Company Accounting Regulations |
| Tax Rate | 24.2% | - |
| Capacity | 2.4 MW (No SVR) 5.1 MW (SVR) | Introduced limit capacity to Node 7 of Feeder 1 |
| Days of operation | 365 days | - |
| Availability | 3.28 h/day | 20-year average value of national solar power generation |
| CAPEX | $2 M/MW (No SVR) $2.5 M/MW (SVR) | PV equipment and power system entrance cost [47] |
| OPEX | 1.0% | O M cost average of general solar industry |
| Electricity tariff | $0.0803/kWh | Average of November ’16 to October ’17 [48] |
| REC | $0.1372/kWh | Average of November ’16 to October ’17 [48] |
| KCU | $18.5/tCO2 | 16.11.9 Offset trading price |
REC = renewable energy certificate; KCU = Korean offset credit.
Table 4.
Six scenarios for economic assessment.
| Case Scenario | Economics Analysis Condition | |
|---|---|---|
| No SVR | Low-scenario | revenue: SMP |
| Base-scenario | revenue: SMP + REC | |
| High-scenario | revenue: SMP + REC + KCU | |
| SVR Installed | Low-scenario | revenue: SMP |
| Base-scenario | revenue: SMP + REC | |
| High-scenario | revenue: SMP + REC + KCU | |
Table 5.
Existing distributed generation (DG) penetration, and step voltage regulators (SVR) installation voltage characteristics.
Table 5.
Existing distributed generation (DG) penetration, and step voltage regulators (SVR) installation voltage characteristics.
| Power Penetration | Without SVR | With SVR | |||
|---|---|---|---|---|---|
| Consumer Voltage | Consumer Voltage | ||||
| Distributed Generation penetration: 0 MW | Minimum load | Maximum | 1.0345 | Maximum | 1.0345 |
| Minimum | 0.9774 | Minimum | 0.9774 | ||
| Maximum load | Maximum | 1.0420 | Maximum | 1.0420 | |
| Minimum | 0.9546 | Minimum | 0.9706 | ||
| Distributed Generation penetration: 3 MW | Minimum load | Maximum | 1.0717 | Maximum | 1.0379 |
| Minimum | 0.9662 | Minimum | 0.9662 | ||
| Maximum load | Maximum | 1.0566 | Maximum | 1.0420 | |
| Minimum | 0.9779 | Minimum | 0.9779 | ||
Table 6.
A summary of life cycle cost analysis (LCCA) for all cases and scenarios.
| LCCA Output | Low Scenario (SMP) | Base Scenario (SMP + REC) | High Scenario (SMP + REC + KCU) | |
|---|---|---|---|---|
| IRR (%) | without SVR | −1.6 | 8.41 | 9.36 |
| with SVR | −2.52 | 7.31 | 8.2 | |
| NPV ($M) | without SVR | −2.594 | 1.366 | 1.841 |
| with SVR | −6.644 | 1.945 | 2.954 | |
| PI | without SVR | 0.46 | 1.28 | 1.38 |
| with SVR | 0.41 | 1.17 | 1.26 | |
© 2019 by the authors. Licensee MDPI, Basel, Switzerland. This article is an open access article distributed under the terms and conditions of the Creative Commons Attribution (CC BY) license (http://creativecommons.org/licenses/by/4.0/).
Share and Cite
MDPI and ACS Style
Jeong, Y.-C.; Lee, E.-B.; Alleman, D. Reducing Voltage Volatility with Step Voltage Regulators: A Life-Cycle Cost Analysis of Korean Solar Photovoltaic Distributed Generation. Energies 2019, 12, 652. https://doi.org/10.3390/en12040652
AMA Style
Jeong Y-C, Lee E-B, Alleman D. Reducing Voltage Volatility with Step Voltage Regulators: A Life-Cycle Cost Analysis of Korean Solar Photovoltaic Distributed Generation. Energies. 2019; 12(4):652. https://doi.org/10.3390/en12040652
Chicago/Turabian StyleJeong, Yu-Cheol, Eul-Bum Lee, and Douglas Alleman. 2019. "Reducing Voltage Volatility with Step Voltage Regulators: A Life-Cycle Cost Analysis of Korean Solar Photovoltaic Distributed Generation" Energies 12, no. 4: 652. https://doi.org/10.3390/en12040652
Note that from the first issue of 2016, this journal uses article numbers instead of page numbers. See further details here.