Thermal Performance of a Low-Temperature Heat Exchanger Using a Micro Heat Pipe Array


1
College of Architectural and Civil Engineering, Beijing University of Technology, Beijing 100124, China
2
College of Municipal and Environmental Engineering, Jilin Jianzhu University, Changchun 130118, China
*
Author to whom correspondence should be addressed.
Energies 2019, 12(4), 675; https://doi.org/10.3390/en12040675
Submission received: 29 December 2018
/
Revised: 1 February 2019
/
Accepted: 18 February 2019
/
Published: 20 February 2019
(This article belongs to the Collection Advances in Heat Transfer Enhancement)
Abstract
:Domestic heat exchangers, even though widely used in industry, are not adequate for studies on low-temperature flue-gas use technologies. Despite spite their limitations, very few theoretical models have been investigated based on practical applications. Moreover, most of the existing studies on heat exchangers have focused particularly on one-dimensional and two-dimensional heat transfer models, while limited studies focus on three-dimensional ones. Therefore, this study aims at investigating the thermal performance of a low-temperature flue-gas heat recovery unit in the cold regions. Specifically, this study was conducted in the context of Changchun of Jilin Province, China, a city with the mean ambient temperature of −14 °C and mean diurnal temperature of −10 °C during winter. Experimental results showed that the thermal efficiency of the heat exchanger was higher than 60%. Through assessing the heat exchange coefficient and heat exchange efficiency of the heat exchanger, it is found that the thermal efficiency had been improved up to 0.77–0.83. Furthermore, the ICEPAK software and the standard k-ε RNG turbulence model were used to carry out simulations. The velocity and outlet temperature of fresh airflow and polluted airflow were simulated through setting different inlet temperatures of fresh air and polluted air inlet. Numerical results further indicated that the flow state was laminar flow. The micro heat pipe array side had small eddies and the heat transfer was significantly improved due to the flow of air along the surface of the micro heat pipe.
1. Introduction
Domestic heat exchangers are widely used in chemical processing industries, including oil refineries, power, and other industrial domains [1,2]. Consequently, several studies have dealt with the recovery of waste heat from flue-gases in terms of high-temperature flue-gas heat recovery. In these studies, the exhaust temperature of the gases is generally over 90 °C [3]. Yang et al. proposed a novel heat pipe-based desiccant device [4]. Galindo et al. analyzed some models based on an experimental Organic Rankine Cycle (ORC) in a turbocharged 2.0 L gasoline engine, using the waste heat recovery, and they found that the effect was good [5]. There are, however, limited studies focusing on low-temperature flue-gas heat recovery, which is a challenge in its application. The traditional low-temperature flue-gas heat exchanger mostly adopts condensers, ceramic heat exchangers, and so on. This results in several limitations such as low heat transfer coefficients, excessive auxiliary power, excessive supporting facilities and high cost. In addition, the structure of such equipment is complex and bulky, and the heating surface is susceptible to corrosion and formation of deposits, highly increasing the maintenance demands [6,7]. These problems have negatively constrained the use and extensive promotion of low-temperature flue-gas heat exchangers [7]. Therefore, the improvement and optimization of the overall structure and production process of the heat transfer element become significant. Furthermore, the quality and the material of the heat transfer element also play an important role in improving the efficiency of heat transfer [8].
At present, studies on structural optimization mainly focus on fins, runners, fluid flow regimes, etc. while those on fins mainly concentrate on shapes, angles, spacing, etc. It has been indicated that increasing fins’ size to expand heat transfer area is still the main way to enhance heat transfer in heat exchangers [9]. For instance, Tian and He [10] conducted research on the airside performance of corrugated fin-fin heat exchangers and studied the heat exchangers containing triangular fins formed by stamping by Computational Fluid Dynamics (CFD) simulation. The Colburn factor and friction coefficient of wavy fins and single-row fins under staggered array were compared, respectively. They found out that when the Reynolds number of the outer diameter of the tube reached 3000, the Colburn factor and friction coefficient of the two types of fins would increase by 13.1%, 7%, 15.4% and 10.5%, respectively. Agung and Indri [11] designed double-sided triangular fins (T-W) in the heat exchanger to enhance the convective heat transfer of the double-tube heat exchanger. According to their findings, the wing width ratio (0.31, 0.47 and 0.63) had a significant influence on heat transfer and fluid flow characteristics. In addition, the Nussert number, heat exchange efficiency and friction coefficient of heat exchanger showed an increase with the rise in wing width ratio. Lee and Kim [12] also studied the frost height of various boundary layer discontinuities between fins in a circular finned tube heat exchanger at different airflow rates, fin spacing, relative humidity and fluid inlet temperatures. They concluded that when relative humidity increased from 50% to 80%, the frost height of 8.0 mm wing space increased by 91.9%. The frost-height increase rate at the wind volume of 1.2 m3/min was 13.0% higher than that at the wind volume of 0.8 m3/min.
The frost-blocking rate between fins is, therefore, an important reference for the heat exchanger design in severe cold regions. Chen and Wang [13] used experimental open high-temperature wind tunnel systems to study the pressure drop and heat transfer characteristics of H-type finned tube bundles. They also studied the effects of fin width, spacing, height and airflow rate on fin efficiency, convective heat transfer rate, integrated heat transfer capacity and pressure drop. In addition, CFD studies have been carried out to compare several types of fins. It is proven that the fin thermal efficiency decreased with the increasing air velocity, fin height and width. Convection heat transfer coefficient was directly proportional to the fin spacing, but inversely proportional to the fin height and width whereas pressure drop increased with the increase in fin height and width. CFD simulations also shown that heat transfer effect of the discontinuous fins did not change substantially with the increase of the waveform rate but would increase with baffle spacing and Reynolds number [14,15,16].
Many studies have also conducted to investigate the shape and wall of heat exchanger channels, considering the influence of thermophysical properties [17], channel shapes [18], corrugated shapes [19], laminar flow state in a three-dimensional rectangular sinusoidal channel [20], and varying cross-section channel [21,22,23,24] on heat transfer efficiency and pressure drop. Other studies established a relationship between the flow patterns of the heat exchange fluid and heat transfer and its influence on vortex generator lateral distance (VGs) by adding fins, optimizing the shape of the flow path and increasing the roughness [25,26,27,28].
Since the internal working medium of the heat exchanger is liquid, it can easily freeze and crack during severe winter weather, possibly leading to low efficiency of heat exchange devices. Consequently, these devices are not common in cold regions. In some cases, a thick insulation layer is placed on the surface to solve the freezing problem; however, this technique is expensive. Though the conventional heat exchanger device has advantages of high heat exchange efficiency and large floor space, it is unfavorable in small working environments. There is, therefore, a need for a kind of heat exchange element with high efficiency, small size, lightweight and corrosion-resistant, so as to replace the heat exchanger core of traditional heat exchange device. This will simplify the structure, save the area, improve the heat transfer efficiency and reduce unnecessary flow resistance. At the same time, the most reasonable heat transfer device should be designed under the optimum conditions of the flow passage, spacing, structure and other parameters.
This study, therefore, concerns the micro heat pipe array, which is a new type of flat heat pipe and has the merits of fast heat response, large surface area, high heat transfer performance, good temperature performance and low cost. This device is capable of eliminating the drawbacks and recover the flue-gas heat better. The study describes the structure and characteristics of the heat recovery of low-temperature flue-gas in a microthermal tube array. The heat transfer performance is also evaluated to provide the basis for its practical application.
2. Materials and Methods
2.1. Low-Temperature Flue Gas Heat Exchanger Based on Microthermal Tube Array
2.1.1. Micro Heat Tube Array
The micro heat pipe (MHP) is a novel type of flat heat pipe, whose outer surface is fabricated with aluminium materials and small amounts of the working medium. The MHP has three major parts-the evaporation section, adiabatic section and condensation section (as shown in Figure 1) [7]. In its operation, the surface of the evaporation section absorbs heats and transfers it to the heat pipe wall, where the liquid is vaporized to gas within the working medium. The heat is then absorbed from the wall and channelled to the adiabatic section and later to the condensation section. In the condensation section, steam is condensed to a liquid state where heat is released. In this system, heat is transferred from one end of the heat pipe to the other end (from the condensation section to the evaporation section) by gravity and capillary force [29,30].
The MHP array is comprised of multiple micro heat pipes which produces evaporation and condensation phenomena through a permutation and combination of heat transfer mechanisms. There are finned channels for enhancing heat transfer on the outside of each micro heat pipe, thereby increasing the area of direct heat and heat absorption of heat pipes. At the same time, the numerous micro-fins arranged on the inner wall of a single micro heat pipe (as shown in Figure 1) enhances heat transfer and the pressure-bearing capacity of the micro-heat pipe and prevents leakages, as well [31,32,33]. Besides, because each MHP works independently, when one part of the heat pipe is damaged, other micro heat pipes can still maintain the normal operation of the heat exchanger and remain high reliabilities [34]. Moreover, the micro-heat pipes can be mass-produced, which can significantly reduce the cost of production.
2.1.2. Low-Temperature Flue-Gas Heat Recovery Device of the Microthermal Tube Array
Figure 2 shows the structure of low-temperature flue-gas heat exchanger based on microthermal tube array. The dimensions of the heat exchanger used was 500 mm × 500 mm × 700 mm (l × b × h), which was the thermal exchanging lining. The division plate of the MHP array divided the entire section into condensation and evaporation parts at a height of 295 mm and 405 mm, respectively, with the length and breadth of 500 mm, respectively. There were 21 layers in this device, and each layer had six micro heat pipes. A total of 126 MHP arrays and fin channel were installed through the thermally conductive silicone. During the operation of the heat exchanger, the evaporation section at the bottom absorbed heat from the flue-gas.
2.2. Thermal Performance Test of Low-Temperature Flue Gas Heat Exchanger in Microthermal Tube Array
2.2.1. Data Measurement of Low-Temperature Flue Gas Heat Exchanger in Microthermal Tube Array
The flue-gas temperature was controlled and measured in real-time in the laboratory. The MHP low-temperature flue-gas heat recovery system is shown in Figure 3.
The heat exchanger was tilted at an angle of 10° to the ground; the multi-function recorder probes (Beijing Century Jiantong Technology Development Co. Ltd, Beijing, China) were installed perpendicularly to the pipe section in the air duct. The anemometer sensors (Beijing Century Jiantong Technology Development Co., Ltd.) were installed perpendicularly to the pipe surface normal while the pressure gauges (Testo SE & Co. KGaA, Lenzkirch, Germany) were installed on the wall surface. Indoor data was taken with the heater, and a voltage regulator was used to control the air temperature in the wind tunnel; data was collected over a 3-minute interval.
The air volume was calculated indirectly based on wind speed. The test used a Testo 425 (Testo SE & Co. KGaA, Lenzkirch, Germany) hot ball anemometer to measure wind speed. Since the airflow was more active at the inlet and outlet of the heat exchanger, the wind speed varied greatly. Moreover, the variation in the wind speed was also large. In order to reduce the measurement error, we selected a cross-section of the heat pipe which was at the location of wind inlet 2D of the heat exchanger as the section for the measurement of inlet wind speed. In addition, the one at wind outlet 4D as the section for the measurement of outlet wind speed (D for the diameter of circular windpipes). To ensure accurate measurements, the test sections were divided into four parts (as shown in Figure 3c). The anemometer hot ball was placed at the center of each grade, and the average value of each grade was taken.
A Testo 512 differential pressure gauge was used to measure the pressure loss of the new and exhaust air through the heat pipe heat exchanger with an accuracy of ±0.5% of the measured value in the pressure-loss measurement experiment. The pressure-measuring hole was on the side of the inlet pipe and the outlet pipe, 15 cm away from the inlet and outlet of the heat pipe heat exchanger. Therefore, the air volume, wind speed, wind temperature and wind pressure of the heat exchanger were obtained at an end. Based on this, the efficiency of the heat exchanger was calculated.
2.2.2. The Test System of Low-Temperature Flue Gas Heat Exchanger in Microthermal Tube Array
The new wind duct (Φ 250 mm) (Shangyu Shuangye Ventilation Equipment Company, Shaoxing China) simulated the flue-gas duct (Φ 300 mm) in the test system. The airflow was generated by an axial flow fan (model EG-2.5-A-4) (Shangyu Shuangye Ventilation Equipment Company). The total pressure was 45-24 Pa; the liquid flow was 790–1460 m3/h, rated power was 0.18 kW. The simulated wind volume of the polluted air was regulated by the axial flow fan model EG-2.5-A2-2 at 168-126 Pa, the flow rate was 1200–1740 m3/h, the power was 0.25 kW, and the flow was adjusted by the corresponding pipe diameter manual control valve. The heater was made of two pieces of 345 × 243 mm high-power PTC electric heaters with a combined power of 10.4 kW to simulate the polluted air temperature.
2.2.3. Experimental Process
The low-temperature flue-gas thermal recovery device was studied experimentally, and the effect of different temperatures and temperature gradients on the heat exchanger performance were analyzed [35]. The actual measurement of flue gas temperature also changed when operating between 25 and 34 °C, wherein the numerical result agreed with the experimental results. Furthermore, the experiment was conducted at outdoor temperature range of −19 °C–−2 °C, while the indoor temperature was controlled at 22 °C. The air duct and measuring instruments were insulated simultaneously to reduce the influence of room temperature on test data and to ensure uniformity in airflow into the air duct. The electric heating was installed in the air duct with a voltage regulator to attain inlet air temperatures between 26 and 36.6 °C. The inlet air volume of simulated polluted air was 1500 m3/h and that of fresh air was 1000 m3/h. There were nine thermocouples at both ends of the heat exchanger in the duct to ensure the accuracy of temperature measurement. The experimental parameters were collected once every ten seconds.
3. Results and Analysis
3.1. Results and Analysis of Heat Exchange Test of Low-Temperature Flue Gas Heat Exchanger in Microthermal Tube Array
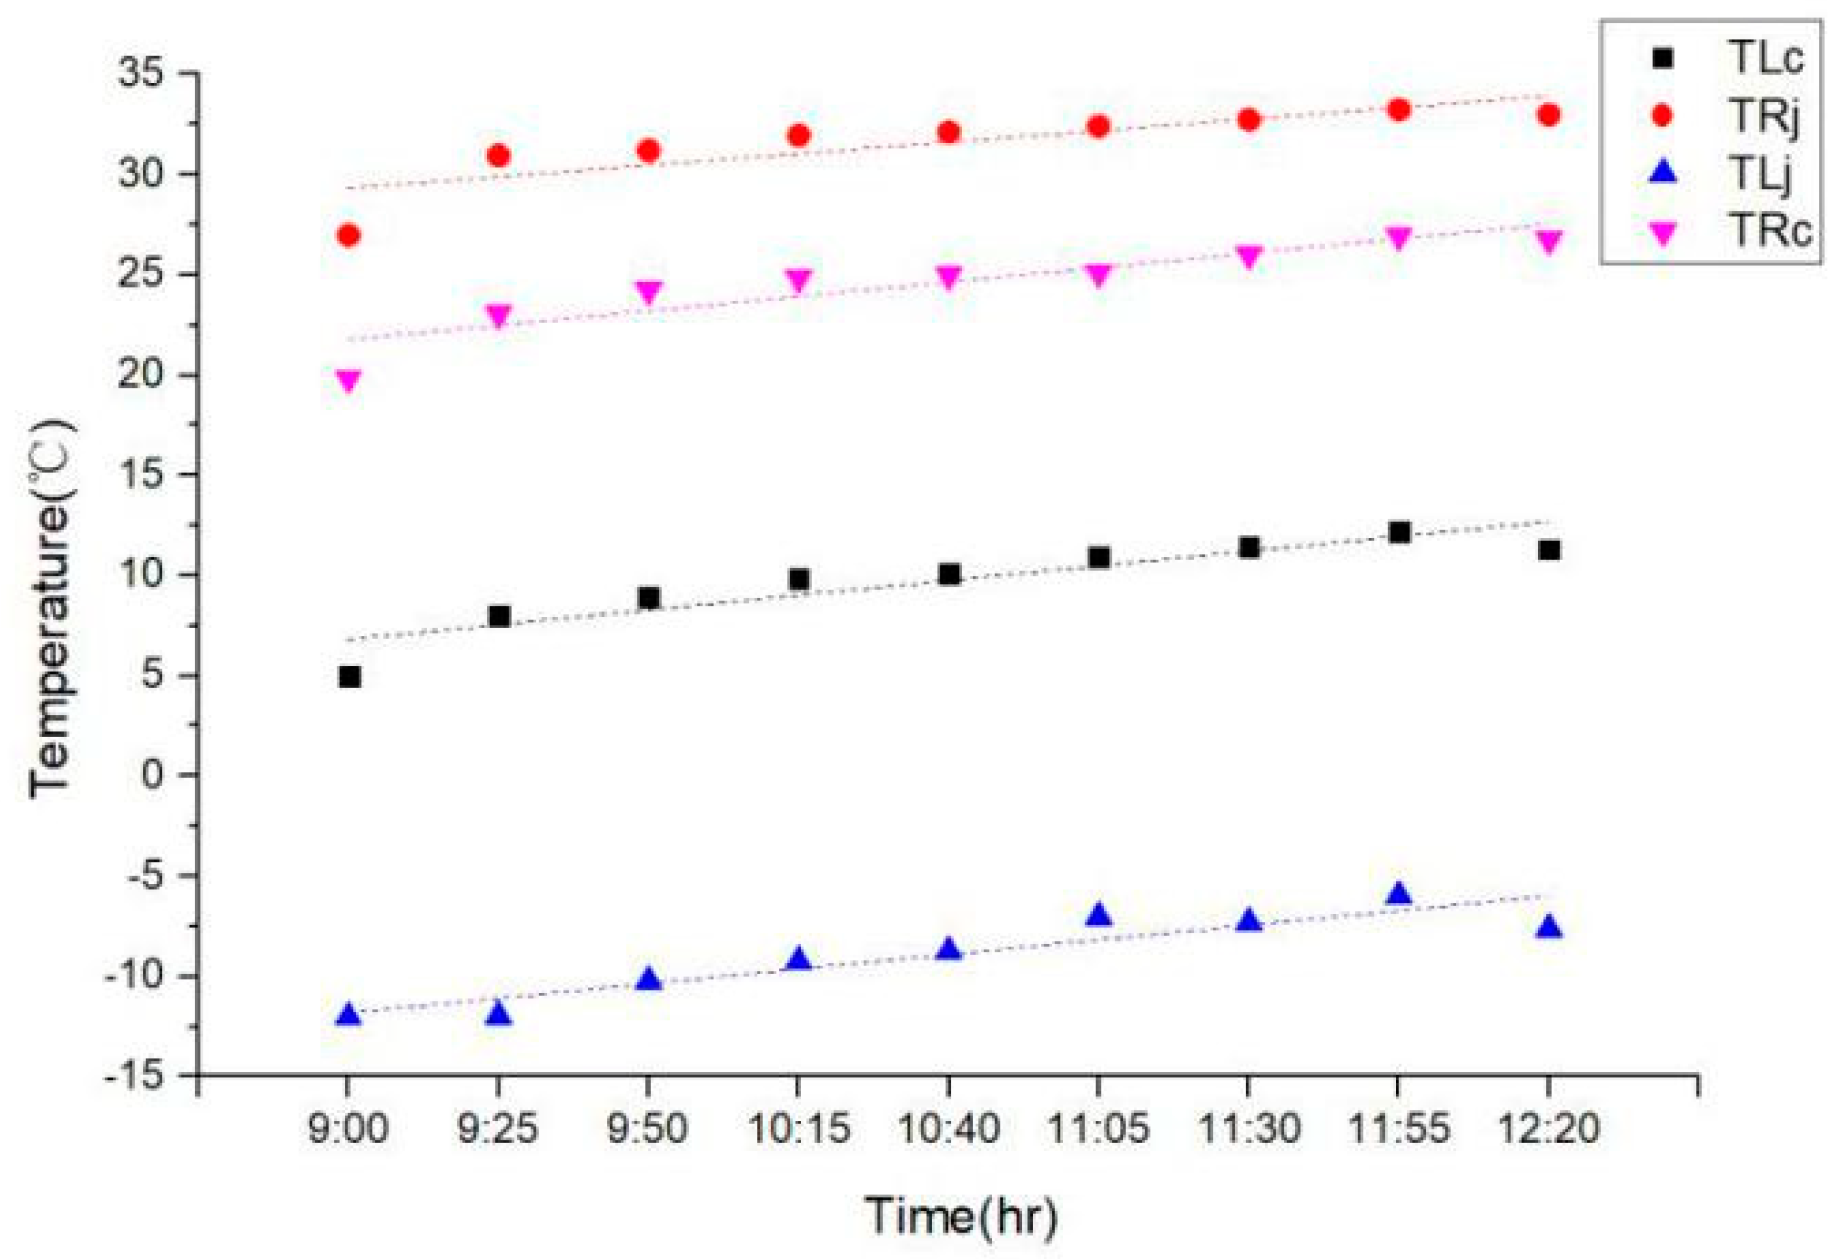
The test was conducted from January 8 to 13 of 2017. The indoor smoke temperature was controlled between 25 to 30 °C. A series of multiple tests were carried out under the experimental conditions, and the average value of a series of data points were adopted to draw the coordinate axes as well as the state curve, as shown in Figure 4. From the curve, the thermal performance parameters of the heat exchanger did not change substantially within the temperature range of the test, but the heat transfer effect had a clear relationship with the temperature change. Compared with the traditional device that has a constant volume heat exchanger, the MHP array showed a higher heat exchange rate. Moreover, the uniform heat exchange temperature reduced the heat transfer loss to a certain extent. Additionally, the highest indoor fresh air outlet temperature recorded was 12.65 °C on 12 January 2017, and the maximum simulated flue-gas inlet temperature was 33.55 °C, as shown in Figure 5.
The indoor air inlet temperature was 5.85 °C, and the highest simulated flue-gas outlet temperature was 27.05 °C. On 13 January 2017, the indoor fresh air outlet temperature was 14.05 °C, and the maximum simulated flue-gas inlet temperature was 35.7 °C, the indoor air inlet temperature was as high as 5.4 °C, while the simulated flue-gas outlet temperature was as high as 29.05 °C. On 16 January 2017, the maximum indoor fresh air outlet temperature was 17.25 °C, the simulated flue-gas inlet temperature was 36.6 °C, and the indoor air inlet temperature was 0.35 °C. The maximum simulated flue-gas outlet temperature was 30.75 °C. The maximum indoor fresh air outlet temperature was 14.75 °C, and the maximum simulated flue-gas inlet temperature was 33.45 °C; the maximum indoor air inlet temperature was 2.1 °C. The maximum simulated flue-gas outlet temperature was 27.65 °C on 17 January 2017 (as shown in Figure 4).
3.2. Performance of Low-Temperature Flue Gas Heat Exchanger in Microthermal Tube Array
Based on the indoor test results, the heat transfer coefficient of the heat exchanger was obtained using Equation (1):
Equation (1) can be rewritten as:
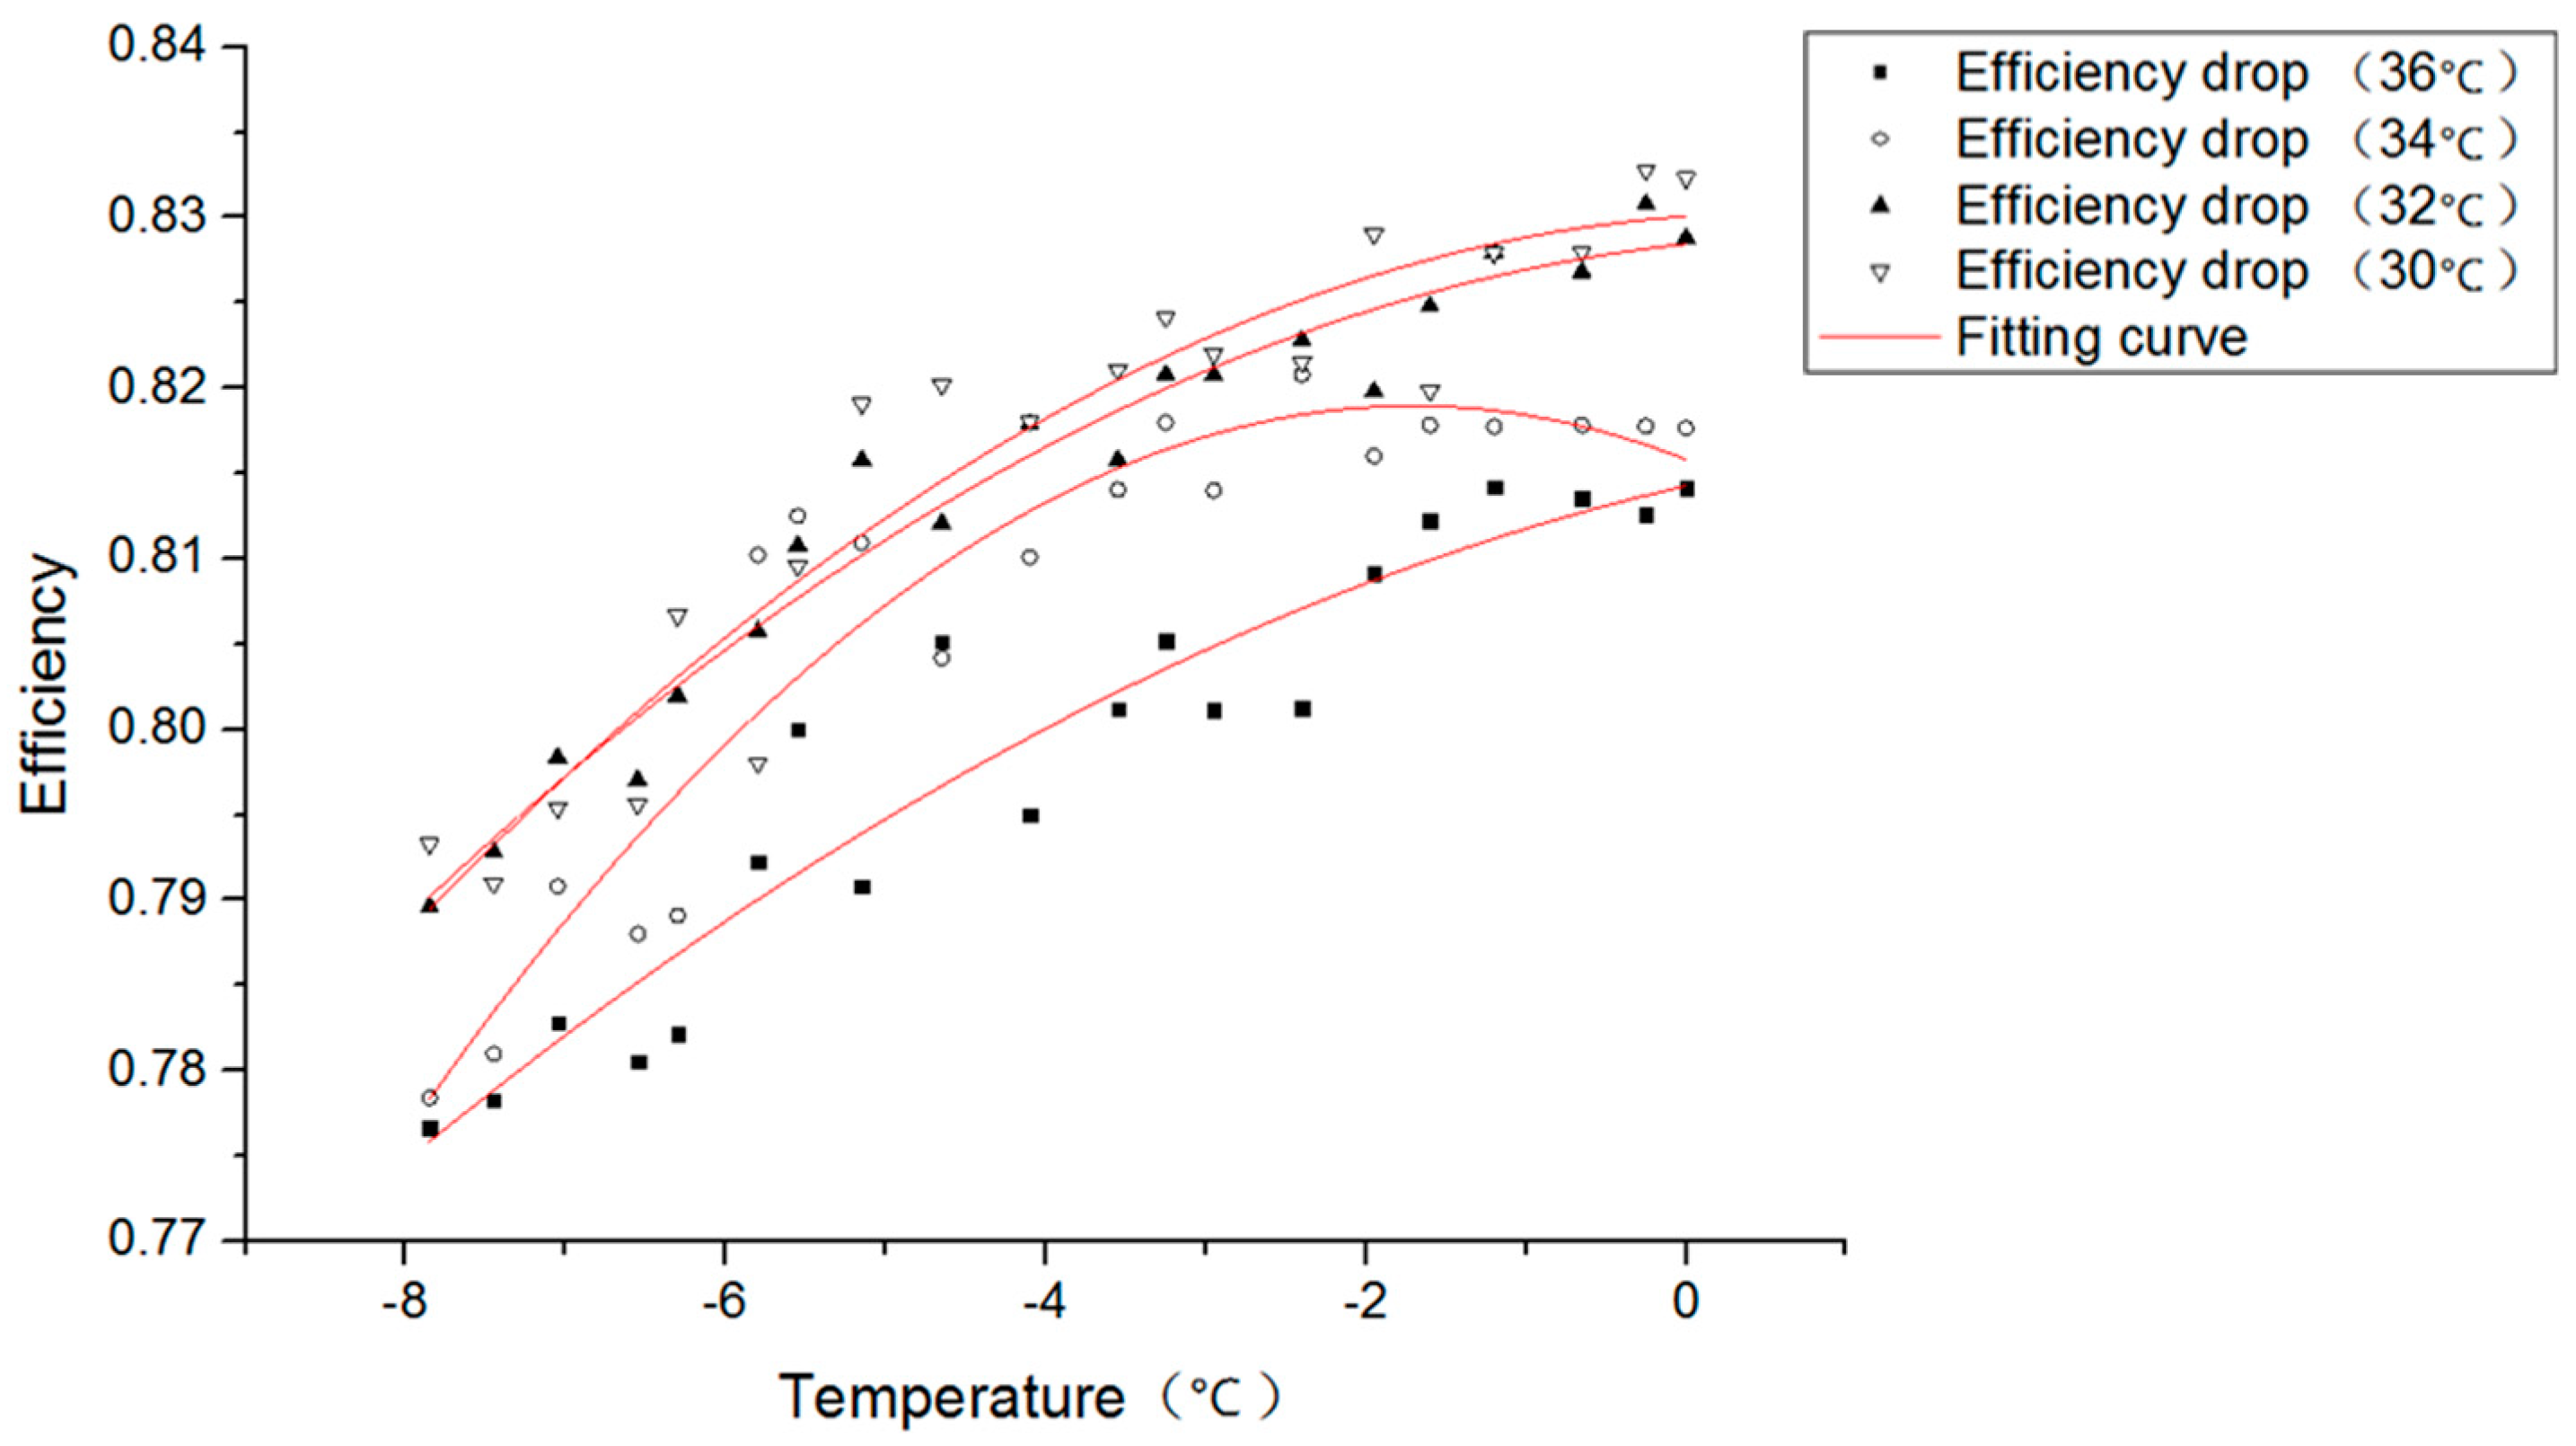
The temperature, T, was set as the abscissa and a linear fitting function was used to obtain the instantaneous efficiency of the plane curve of the heat exchanger. As shown in Figure 6, the fresh inlet temperature in the laboratory was between −8 °C and 0 °C. When the polluted air inlet temperature changed between 30 and 36 °C, the η values were between 0.77 and 0.83; under the flue-gas inlet temperature of 36 °C; η values were between 0.777 and 0.814. Again, η recorded values between 0.793 and 0.827 when the flue-gas inlet temperature was 30 °C.
At the same time, the amplification of efficiency increased slightly, proportional with the increase in the outdoor air temperature. The four curves of the initial position, as shown in Figure 6, unified the fresh air inlet temperature to significantly influence the efficiency with which the polluted air inlet temperature increased.
The temperature of outlet flue-gas was simulated by adjusting modulator-demodulator voltage from 250 V to 0 V. During the simulation, inlet temperature of the flue-gas was maintained at 36 °C (as shown in Figure 7), and inlet temperature of fresh air was −8 °C. The corresponding air energy recovery was 10487 W, and the flue-gas discharge energy was 12123 W. When the inlet temperature of fresh air was 0 °C, the energy recovery could reach 8837 W and the flue-gas discharge energy 9717 W. When the temperature difference between the simulated flue gas inlet and outlet was 30 °C and the fresh inlet temperature −8 °C, the air energy recovery could reach 9056 W and the flue-gas discharge energy 10468 W. When the inlet temperature of fresh air was 0 °C, the fresh air energy recovery could reach 7833 W and the flue-gas discharge energy 9103 W.
As shown in Figure 6, at higher inlet flue-gas temperatures, heat efficiency of heat exchanger increased slightly. However, as shown in Figure 6, although the efficiency of heat exchanger increased, the energy efficiency decreased, and this was caused by the temperature difference of the heat exchanger. The temperature of the fresh air could significantly influence the variation of discharged flue-gas heat. With an increase in the inlet temperature of fresh air, the flue-gas discharge heat reduced gradually, thereby reducing the fresh air heat recovery.
The objective of this experiment was to simulate the performance of low-temperature flue-gas heat exchanger and study the heat exchange efficiency under winter conditions, so that the outlet temperature of flue-gas was maintained between 30 and 36 °C. Although the outdoor temperature in winter was low in Changchun, the experimental equipment used was a flue-gas heat recovery device, which is usually used for energy saving. It was only open and tested during cooking in the kitchen, so that the fresh air inlet temperature could be maintained between −10° and 0 °C. Measurement analysis was carried out in this temperature range to determine the actual performance of the flue-gas heat recovery device. At the same time, the heat exchange efficiency and heat transfer coefficient of the heat exchanger was used to characterize the heat transfer capacity of the heat exchanger. Temperature difference curve and efficiency flat curve were relevant in determining the thermal performance of heat exchanger.
4. Discussion
4.1. Pressure Analysis
Pressure plays a very important role in any heat exchanger. It does not only affect a series of heat exchangers such as fans but also directly affect the use value of heat exchangers. The array low-temperature flue gas heat exchanger in this experiment had a designed air volume of 1000 m3/h, and six different stable air volumes from 500 to 1000 m3/h were selected in the stress simulation. The results proved that there was a slight pressure dropped across the heat exchanger and it fluctuated between 2.1 and 12.3 Pa. The low resistance experienced by the flowing air through the microthermal channel was approximate two time of the pressure of the same pipe. To improve the performance of the radiators as well as the heat exchanger, pressure loss was minimized. Overall, it was revealed that the design of the MHP array, low-temperature flue-gas heat exchanger had obvious advantages in terms of pressure performance.
4.2. Error Analysis
In the experiment, the inlet and outlet temperatures and flow rates of the cold and hot gases were measured directly; the heat exchange efficiency and total heat exchanged in the heat exchanger were obtained indirectly.
The values were recorded using a high-performance Agilent 34970 A data acquisition instrument (Agilent Technologies Inc., Penang Pulau, Malaysia). The T-type copper-constantan thermocouple measurement error was ±0.5 °C; pressure sensors measurement error was ±0.25%; flowmeter measurement error was 2%; platinum resistance measurement error was ±0.2 °C; measurement error for the regular size was 0.1 mm. The error of indirect measurement data in this study was calculated using the error transfer formula (Equation (5)).
In Equation (5), function y is a function of an independent variables. The relative uncertainty of each independent variable was calculated using the transmission error, which is given as follows:
The above equation was used to analyze the relative uncertainty of the main parameters, such as the heat transfer and the efficiency variables, of the experiment in detail. Error analysis of Qw in cold and hot gas side of the heat exchanger was obtained by Equations (6) and (7):
In summary, the measurement error of flat heat pipe wall temperature in the heat exchanger was ±0.5 °C and the measurement error of inlet temperature of cold and hot flue gas was ±0.2 °C. The measurement error of the import and export pressure loss on both the cold and hot flue-gas side was ±0.25 °C and the measurement error of cold and hot flue-gas side flow was ±2 °C. The relative maximum error of the indirect measurement of the heat exchanger was 11.4 °C whiles the error of the indirect measurement of the heat exchanger efficiency was 10.6 °C. In the experiment, the error was relatively small so as to meet experimental requirements.
Through data analysis, a certain gap between the actual results and the theoretical design results was found. The reasons are as follows:
- (1)
- The gas flow state was different; in the actual process, the airflow did not achieve a steady state due to structural and other factors. In theoretical design, flow state was assumed unchanged.
- (2)
- The smoke design parameters were different; the actual smoke composition was complex, and the proportion of each component varied with time. In theoretical calculations, the exhaust gas form, composition, and proportion were fixed, thereby introducing a significant bias in the results.
- (3)
- The accuracy errors in the measuring instrument; the measuring instruments could have brought errors due to external weather factors and human operation.
4.3. Heat Exchanger Simulation and Analysis
The simulation was carried out using ICEPAK software (Version 16.0, ANSYA Inc., Canonsburg, PA, USA). The complete geometric model was established with NX10.0 software (Version 10.0.0.24, Siemens PLM Software Inc., Berlin, Germany) in a ratio of 1:1, and the standard k-ε RNG turbulence model was used for simulation calculation. The fresh airflow passage and the polluted airflow passage were set to a fixed flow rate, and the fresh air outlet temperature was simulated by setting different fresh air and polluted air inlet temperatures. In addition, different fresh airflows were set, and other conditions remained unchanged to simulate the pressure loss of fresh air inlet and outlet of the heat exchanger. Numerical results were compared with experimental results to verify the accuracy of the model.
4.4. Numerical Calculation Model of the Heat Exchanger
4.4.1. Physical Model
The physical model of the heat exchanger (Figure 8) showed that fresh air entered air passage between the MHP arrays through fresh air inlet on the right side of the partition. The polluted air passed through the MHP array to conduct heat to the lower temperature fresh airside in order to complete the heat exchange process. The characteristic parameters of the heat exchanger are shown in Table 1. The surface material of the MHP array was a polished aluminium alloy. The specific heat capacity c = 1.24 × 10³ J/(kg·°C) density ρ = 2.547 × 10³ kg/m3, thermal conductivity λ = 70,000 K).
4.4.2. Relevant Assumptions and Simplifications
The temperature difference in this study was small. Moreover, the heat transfer did not involve phase change. Thus, the following assumptions can be made:
- (1)
- The fluid was considered incompressible.
- (2)
- The thermal effect of viscous dissipation in fluid flow was ignored.
- (3)
- The physical quantities of the flow do not change with time and are assumed to be in the steady flow.
- (4)
- The internal fluid flow in the micro heat pipe array was assumed to be equivalent to a solid block with the same heat transfer coefficient as the medium.
- (5)
- The effect of the fin on the heat exchanger performance was not significant; thus, the effect of the fin was ignored.
In the model, adiabatic boundary conditions were used, and the hot and cold flow path was considered as the heat transfer surface. The Hexa-core Cartesian grid was used for the trellis partition. The maximum mesh size in the x, y and z directions of global mesh and assembly mesh parameters are set to 34, 23, 74 and 12, 11, 20 mm, respectively. The assembly mesh parameters used in the inlet and outlet sections, the buffer layer is set to six layers. The number of grids is 2115412. After initializing the mesh to reset the grid nodes of each block according to the distribution, the mesh of key areas was densified, thereby meeting the grid quality requirements for the relevant simulation. The grid is shown in Figure 9.
4.4.3. Boundary Conditions
The boundary conditions of the fluid inlet of the heat exchanger adopted the velocity inlet boundary condition, the velocity was from 600–1500 m3/h, and the temperature at the inlet followed the experimentally measured temperature value, −15 °C–0 °C; the boundary condition of the heat exchanger outlet fluid is set as free outflow boundary condition [36]. The calculation area was insulated from the external environment, and the flow paths of the cold fluid and the hot fluid were set as heat transfer surfaces.
4.5. Results of Numerical Simulation
Figure 10 shows both polluted and fresh airside wind profile and the temperature distribution of each air duct at each position. Since the temperature of the polluted air reduced from the inlet to the outlet, air temperature approached the microthermal tube array lowered.
At higher temperatures, an obvious temperature gradient was witnessed. As the fresh air increased from the inlet to the outlet, its temperature gradually increased. The temperature near the microthermal tube array was higher; however, near the center, the temperature was lower, and the temperature gradient was 0 at the fresh air outlet.
Figure 11 shows the velocity of the airflow in the shroud. There was a small eddy current at the junction of the shroud and the duct to form a partial negative pressure region. This increased the fan pressure, which was not conducive to energy saving. It can be considered to enhance the sharp angle and to allow smooth the airflow.
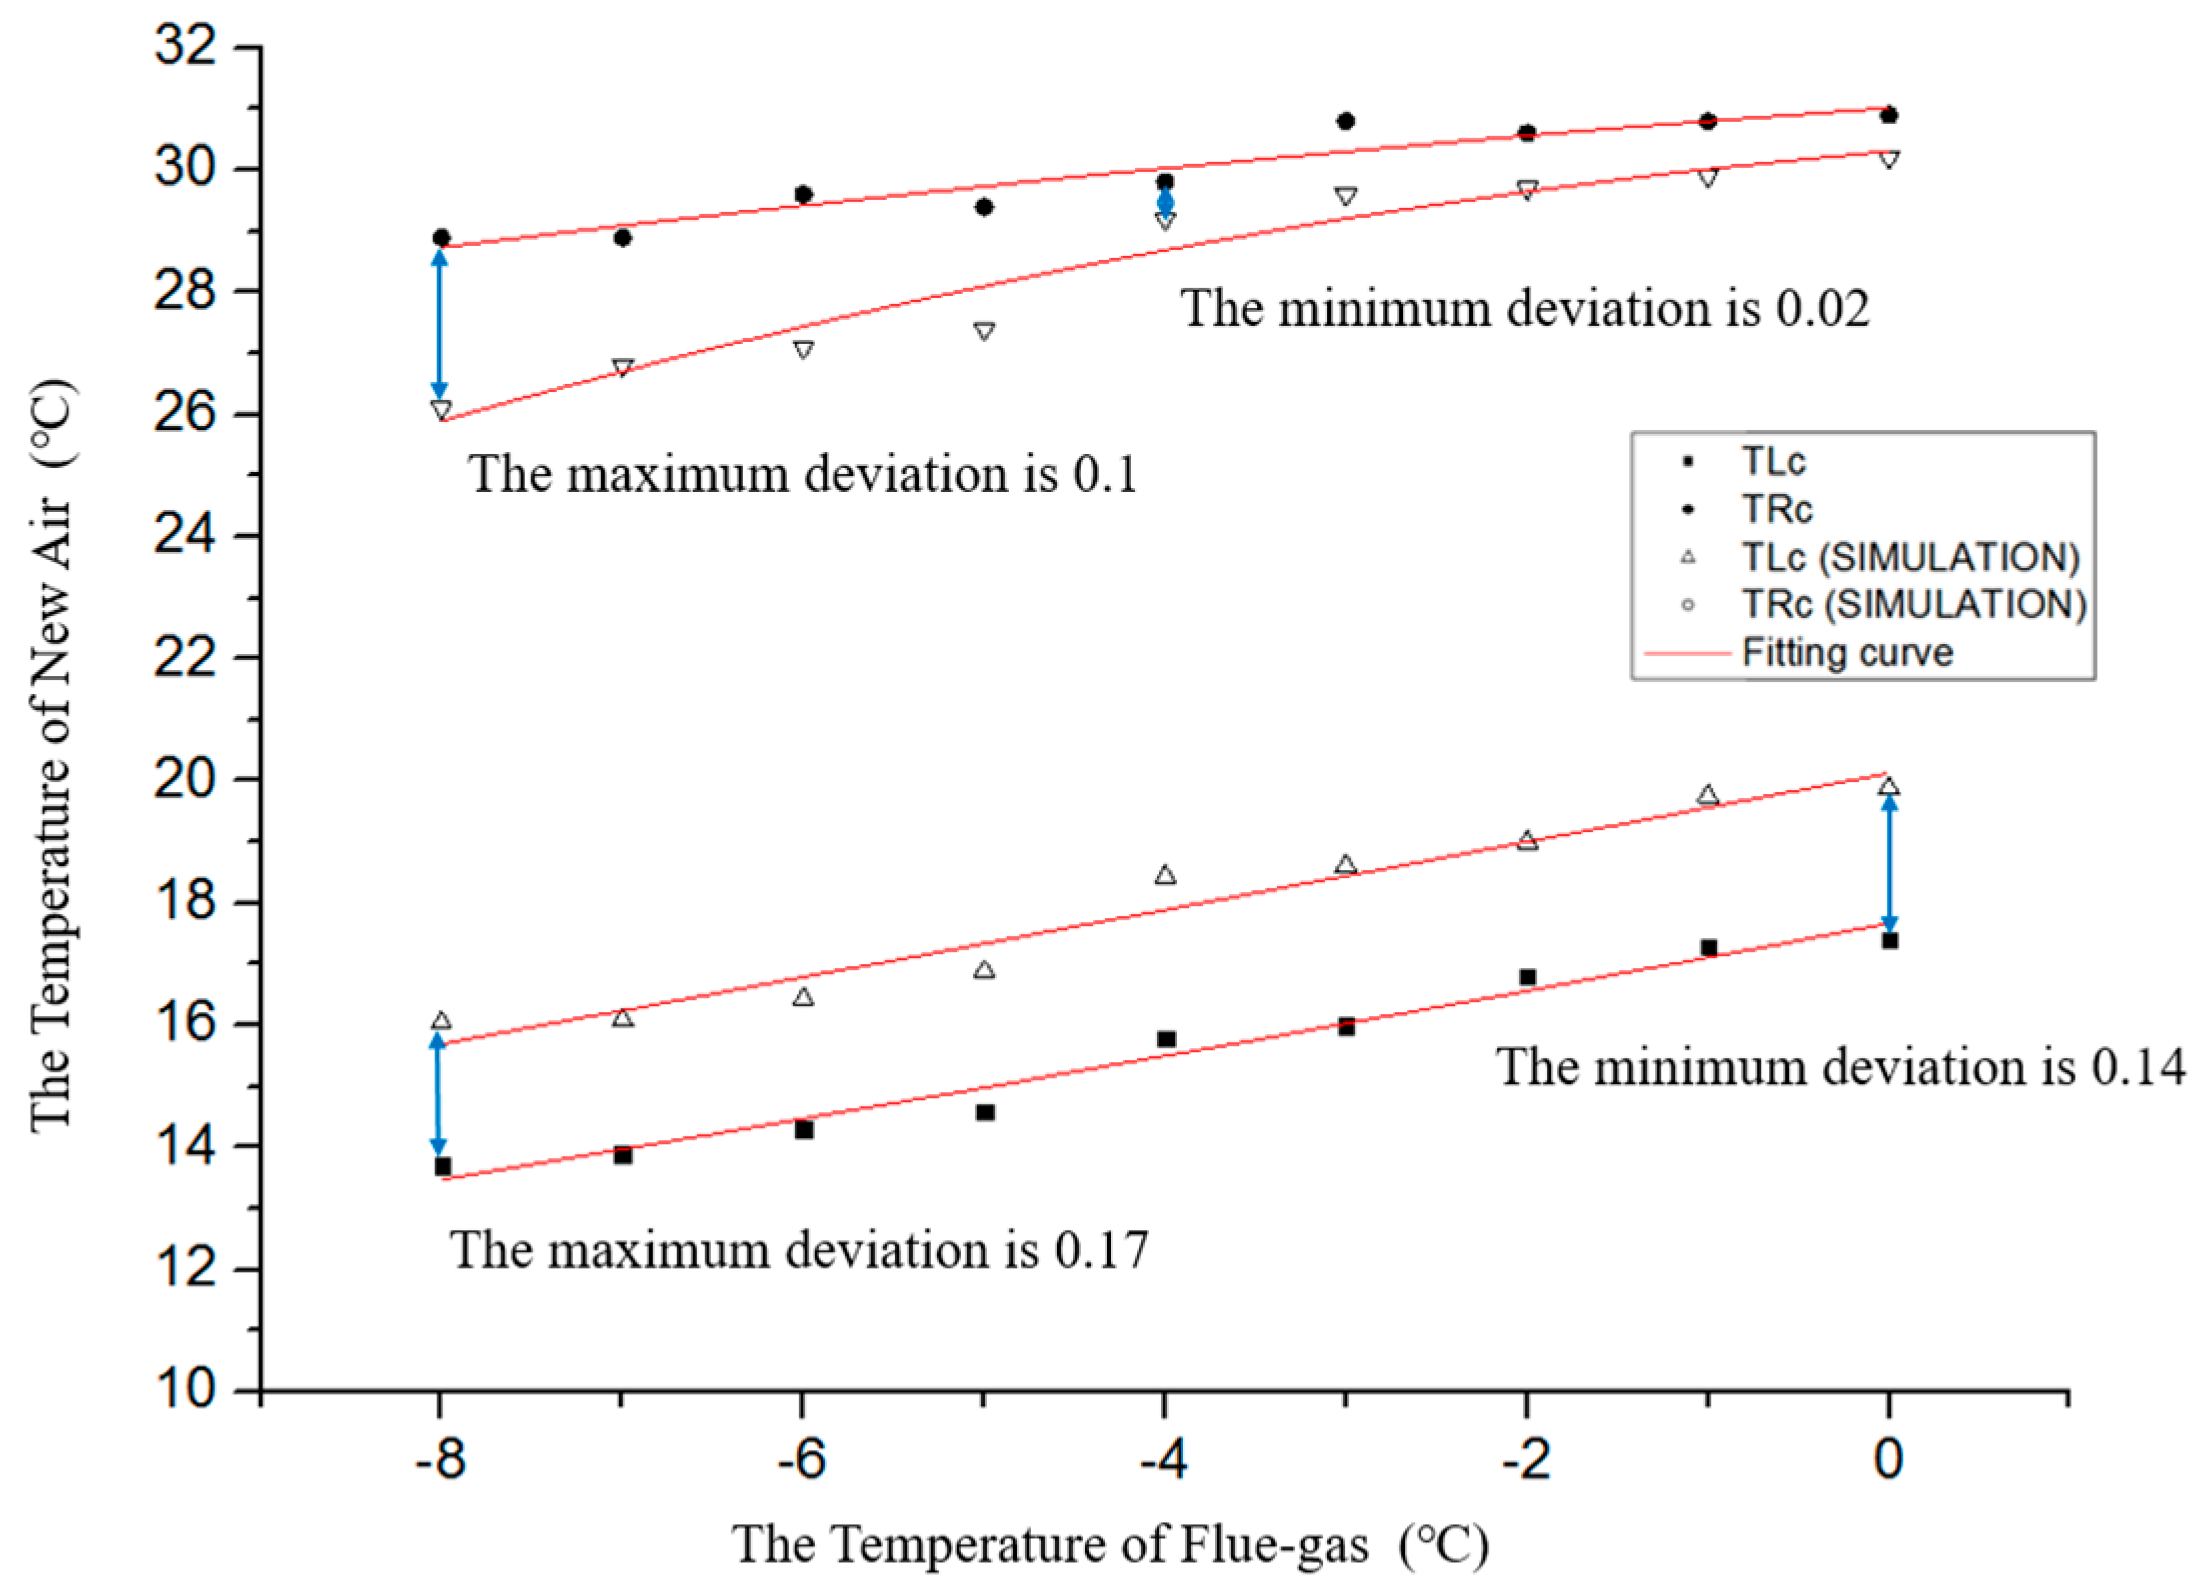
In the simulation, the inlet temperatures of the fresh air were −8, −7, −6, −5, −4, −3, −2, −1, and 0 °C, while the corresponding inlet air temperatures were 35.4, 35.5, 35.6, 35.7, 35.8, 35.9, 36, 36.1, and 36.2 °C, respectively. The simulation results are shown in Figure 12.
The abscissa represented the inlet temperature of the fresh air, and the ordinate number 8 represented the temperature of the fresh air, the simulation of the flue gas outlet value and the measured values. Then, the numerical and measured outlet temperatures of fresh air and flue-gas were plotted for different air inlet temperatures to obtain the fitting curve. In comparison, the minimum deviation of the simulated air outlet temperature and the measured air outlet temperature was 14%, which appeared at 0 °C. The maximum deviation was 17%, which was recorded at −8 °C; the minimum deviation between the simulated polluted air outlet temperature and the measured polluted air outlet temperature was 2% at 4 °C. The maximum deviation of 10% was observed at −8 °C. This phenomenon can be ascribed to the following reasons:
- (1)
- The indoor temperature was 22 °C; with the improvement of the inlet temperature of fresh air, the heat between the fresh air and indoor one decreased gradually, which led to the abatement of the indoor heat transfer, thereby reducing the tail deviation, as shown in Figure 12.
- (2)
- The simulation and measured results increased with increasing inlet fresh air temperature. This phenomenon can be attributed to errors caused by the experimental conditions, measurement methods and physiological characteristics. In Figure 12, numerical results were more appropriate than the measured ones.
Overall, the simulation results were relatively accurate. In the follow-up experiment, the thermal potential between the fresh air and indoor air was reduced by improving the insulation method. This led to the minimization of the influence of indoor environment on the experiment. To reduce the influence of measurement error, we utilized state-of-the-art measuring instruments as well as the measurement method. Consequently, the numerical results agreed with experimental results well.
5. Conclusions
In this paper, a novel low-temperature flue gas heat exchanger was proposed, and the following conclusions are drawn from the experimental study: the low-temperature flue-gas heat recovery device is a state-of-the-art heat exchanger. In comparison with traditional heat exchangers, it has lighter weight, strong load bearing capacity, high efficiency, high thermal exchanging speed, small volume, frost resistance and low risk of leakage. Its sensible heat efficiency value varied between 0.77 and 0.83, and the efficiency variation increased with the increase of temperature difference between the inlet and outlet of fresh air, and then fell back. The resistance increased linearly with the increase of wind speed, and the simulation results of sensible heat efficiency were basically the same as the measured results. Based on the heat transfer coefficient of heat recovery and the analysis of the fitting of heat exchange efficiency, the overall heat exchanger performance was excellent. The heat transfer mechanism and heat transfer efficiency of low-pressure loss high-efficiency of the heat pipe heat exchanger were studied. The effects of different loads on heat transfer efficiency and flow resistance of heat exchanger were analyzed experimentally based on different operating conditions.
The experimental results showed that the thermal efficiency was influenced by the extent of oil pollution and the composition of the smoke; this is an area that needs further studies. The experiment was consistent with the simulation, and further improvement can be made to the design of the heat exchanger. Future experiments can involve additional fins to improve fluid disturbance.
Author Contributions
Conceptualization, Y.Z. and Z.Q.; Methodology, Z.Q.; Software, J.Y.; Validation, Y.Z.; Z.Q. and A.C.; Formal Analysis, J.Y.; Investigation, J.Y.; Resources, Y.Z.; Data Curation, Jingang Yang.; Writing-Original Draft Preparation, A.C.; Writing-Review & Editing, Z.Q.; Visualization, Z.Q.; Supervision, J.Y.; Project Administration, J.Y.; Funding Acquisition, J.Y.
Funding
The study was funded by the Science and Technology Project of the Jilin Provincial Education Department in 13th Five-Year, Grant No. JJKH20170251KJ.
Conflicts of Interest
The authors declare no conflict of interest.
Nomenclature
| specific heat of the air (J/(kg K)) | |
| Density of air (kg/m3) | |
| Volume flow of air side (m³/s) | |
| Air side outlet temperature (°C) | |
| Air side outlet temperature (°C) | |
| Fresh air actually gets the heat | |
| Actual wind volume of fresh air (J) | |
| Fresh air terminal heat exchange capacity (m3) | |
| Fresh air constant pressure specific heat (J/(kg K)) | |
| Fresh air inlet temperature (K) | |
| Flue-gas inlet temperature (K) | |
| Air temperature difference (K) | |
| The flue gas actually changes the heat (J) | |
| Actual air volume of flue gas (m3/h) | |
| Heat transfer capacity of flue gas (m3) | |
| Flue-gas constant pressure specific heat (J/(kg K)) | |
| Fresh air outlet temperature (K) | |
| Flue gas outlet temperature (K) | |
| Flue-gas temperature difference (K) | |
| Scaling factor | |
| ρ air | Air density (kg/m3) |
| t0 | Average temperature of fresh air |
| () | Flue-gas average temperature () |
| u | Velocity component in the x direction (m/s) |
| v | Velocity component in the y direction (m/s) |
| w | Velocity component in the z direction (m/s) |
| i | On behalf of the direction |
| Ui | Velocity component in that direction (m/s) |
| ρ | Fluid density (kg/m3) |
| P | Partial pressure (Pa) |
| μ | Dynamic viscosity (kg/(m·s)) |
| α | Fluid thermal diffusivity (m2/s) |
References
- Building Energy Research Center of Tsinghua University. Annual Report on China Building Energy Efficiency in 2008; China Building Industry Press: Beijing, China, 2008. [Google Scholar]
- Liu, Z.; Liu, Y.; He, B.J.; Xu, W.; Jin, G.; Zhang, X. Application and suitability analysis of the key technologies in nearly zero energy buildings in China. Renew. Sustain. Energy Rev. 2019, 101, 329–345. [Google Scholar] [CrossRef]
- Niu, Y.; Hua, J.; Fan, H. Optimization of the solution heat exchanger of AHP in flue gas waste heat recovery. Procedia Eng. 2017, 205, 477–484. [Google Scholar] [CrossRef]
- Yang, K.S.; Wang, J.S.; Wu, S.K.; Tseng, C.Y.; Shyu, J.C. Performance Evaluation of a Desiccant Dehumidifier with a Heat Recovery Unit. Energies 2017, 10, 2006. [Google Scholar] [CrossRef]
- Galindo, J.; Dolz, V.; Royo-Pascual, L.; Haller, R.; Melis, J. Modelling and Experimental Validation of a Volumetric Expander Suitable for Waste Heat Recovery from an Automotive Internal Combustion Engine Using an Organic Rankine Cycle with Ethanol. Energies 2016, 9, 279. [Google Scholar] [CrossRef]
- Noie-Baghban, S.; Majideian, G. Waste heat recovery using heat pipe heat exchanger (HPHE) for surgery rooms in hospitals. Therm. Eng. 2000, 20, 1271–1282. [Google Scholar] [CrossRef]
- El-Baky, M.A.A.; Mohamed, M.M. Heat pipe heat exchanger for heat recovery in air conditioning. Therm. Eng. 2007, 27, 795–801. [Google Scholar] [CrossRef]
- Li, F.; Duanmu, L.; Fu, L.; Zhao, X.L. Research and Application of Flue Gas Waste Heat Recovery in Co-generation Based on Absorption Heat-exchange. Procedia Eng. 2016, 146, 594–603. [Google Scholar] [CrossRef] [Green Version]
- Sadeghianjahromi, A.; Kheradmand, S.; Nemati, H.; Liaw, J.-S.; Wang, C.-C. Compound Heat Transfer Enhancement of Wavy Fin-and-Tube Heat Exchangers through Boundary Layer Restarting and Swirled Flow. Energies 2018, 11, 1959. [Google Scholar] [CrossRef]
- Tian, L.; He, Y.; Tao, Y.; Tao, W. A comparative study on the air-side performance of wavy fin-and-tube heat exchanger with punched delta winglets in staggered and in-line arrangements. Int. J. Therm. Sci. 2009, 48, 1765–1776. [Google Scholar] [CrossRef]
- Agung, T.W.; Indri, Y.; Muhammad, A.; Takahiko, M.; Shigeru, K. Double-sided delta-wing tape inserts to enhance convective heat transfer and fluid flow characteristics of a double-pipe heat exchanger. Appl. Therm. Eng. 2018, 145, 1359–4311. [Google Scholar]
- Lee, M.-Y.; Kim, Y.; Lee, D.-Y. Experimental Study on Frost Height of Round Plate Fin-Tube Heat Exchangers for Mobile Heat Pumps. Energies 2012, 5, 3479–3491. [Google Scholar] [CrossRef] [Green Version]
- Chen, H.; Wang, Y.; Zhao, Q.; Ma, H.; Li, Y.; Chen, Z. Experimental Investigation of Heat Transfer and Pressure Drop Characteristics of H-type Finned Tube Banks. Energies 2014, 7, 7094–7104. [Google Scholar] [CrossRef] [Green Version]
- Tauscher, R.; Mayinger, F. Heat Transfer Enhancement in a Plate Heat Exchanger with Rib-roughened Surfaces. In Heat Transfer Enhancement of Heat Exchangers; Springer: Dordrecht, The Netherlands, 1999; Volume 4, pp. 207–221. [Google Scholar]
- Xue, Y.; Ge, Z.; Du, X.; Yang, L. On the Heat Transfer Enhancement of Plate-Fin Heat Exchanger. Energies 2018, 11, 1398. [Google Scholar] [CrossRef]
- Maakoul, A.E.; Laknizi, A.; Saadeddine, S.; Abdellah, A.B.; Meziane, M.; Metoui, M.E. Numerical design and investigation of heat transfer enhancement and performance for an annulus with continuous helical baffles in a double-pipe heat exchanger. Energy Convers. Manag. 2017, 133, 76–86. [Google Scholar] [CrossRef]
- Ma, T.; Li, L.; Xu, X.Y.; Chen, Y.T.; Wang, Q.W. Study on local thermal–hydraulic performance and optimization of a zigzag-type printed circuit heat exchanger at high temperature. Energy Convers. Manag. 2015, 104, 55–66. [Google Scholar] [CrossRef]
- Hasan, M.I.; Rageb, A.A.; Yaghoubi, M.; Homayoni, H. Influence of channel geometry on the performance of a counter flow microchannel heat exchanger. Int. J. Therm. Sci 2009, 48, 1607–1618. [Google Scholar] [CrossRef]
- Zhang, L.; Che, D. Influence of corrugation profile on the thermal-hydraulic performance of cross-corrugated plates. Numer. Heat Tran. Part A Appl. 2011, 59, 267–296. [Google Scholar] [CrossRef]
- Sui, Y.; Teo, C.J.; Lee, P.S. Direct numerical simulation of fluid flow and heat transfer in periodic wavy channels with rectangular cross-sections. Int. J. Heat Mass Trans. 2012, 55, 73–88. [Google Scholar] [CrossRef]
- Focke, W.W. Asymmetrically corrugated plate heat exchanger plates. Int. Commun. Heat Mass Trans. 1985, 12, 67–77. [Google Scholar] [CrossRef]
- Stasiek, J.M.; Collins, W.; Ciofalo, M.; Chew, P.E. Investigation of flow and heat transfer in corrugated passages—I. Experimental results. Int. J. Heat Mass Trans. 1996, 39, 149–164. [Google Scholar] [CrossRef]
- Elshafei, E.A.M.; Awad, M.M.; El-Negiry, E.; Ali, A.G. Heat transfer and pressure drop in corrugated channels. Energy 2010, 35, 101–110. [Google Scholar] [CrossRef]
- Ismail, L.S.; Velraj, R.; Ranganayakulu, C. Studies on pumping power in terms of pressure drop and heat transfer characteristics of compact plate-fin heat exchangers—A review. Renew. Sustain. Energy Rev. 2010, 14, 478–485. [Google Scholar] [CrossRef]
- Song, K.; Tagawa, T. The optimal arrangement of vortex generators for best heat transfer enhancement in a flat-tube-fin heat exchanger. Int. J. Therm. Sci. 2018, 132, 355–367. [Google Scholar] [CrossRef]
- Song, K.W.; Xi, Z.; Su, M.; Wang, L.C.; Wu, X.; Wang, L.B. Effect of geometric size of curved delta winglet vortex generators and tube pitch on heat transfer characteristics of the fin-tube heat exchanger. Exp. Fluid Sci. 2017, 82, 8–18. [Google Scholar] [CrossRef]
- Tiggelbeck, S.; Mitra, N.K.; Fiebig, M. Comparison of wing-type vortex generators for heat transfer enhancement in channel flows. ASME J. Heat Trans. 1994, 116, 880–885. [Google Scholar] [CrossRef]
- Wu, J.M.; Tao, W.Q. Numerical study on laminar convection heat transfer in a channel with longitudinal vortex generator, Part B: A parametric study of major influence factors. Int. J. Heat Mass Trans. 2008, 51, 3683–3692. [Google Scholar] [CrossRef]
- Deng, Y.C.; Quan, Z.H.; Zhao, Y.H.; Wang, L.C. Experimental investigations on the heat transfer characteristics. Sci. China Technol. Sci. 2013, 5, 1177–1185. [Google Scholar] [CrossRef]
- Yang, W.; Zhao, D.; Wang, X.; Jiang, L. Economic analysis and calculations of low-temperature gas waste heat recovery by heat pipe technology. Ind. Furn. 2012, 1, 46–49. [Google Scholar]
- Chen, H.; Zhang, H.; Li, M.; Liu, H.; Huang, J. Experimental investigation of a novel LCPV/T system with micro-channel heat pipe array. Renew. Energy 2018, 115, 773–782. [Google Scholar] [CrossRef]
- Milani, M.; Montorsi, L.; Terzi, S. Numerical analysis of the heat recovery efficiency for the post-combustion flue gas treatment in a coffee roaster plant. Energy 2017, 141, 729–743. [Google Scholar] [CrossRef]
- Jabari, F.; Mohammadi-Ivatloo, B.; Li, G.; Mehrjerdi, H. Design and performance investigation of a novel absorption ice-making system using waste heat recovery from flue gases of air to air heat pump. Appl. Therm. Eng. 2018, 130, 782–792. [Google Scholar] [CrossRef]
- Hu, G.; Yue, Y. Research and practice on recover boiler waste heat by reduce the exhaust gas temperature. Energy Conserv. Technol. 2012, 4, 295–298. [Google Scholar]
- Solanki, S.C.; Dubey, S.; Tiwari, A. Indoor simulation and testing of photovoltaic thermal (PV/T) air collectors. Appl. Energy 2009, 86, 2421–2428. [Google Scholar] [CrossRef]
- Mou, B.; He, B.J.; Zhao, D.X.; Chau, K.W. Numerical simulation of the effects of building dimensional variation on wind pressure distribution. Eng. Appl. Comput. Fluid Mech. 2017, 11, 293–309. [Google Scholar] [CrossRef] [Green Version]
Figure 1.
The operation principle and the internal dimensions of a microtube array.
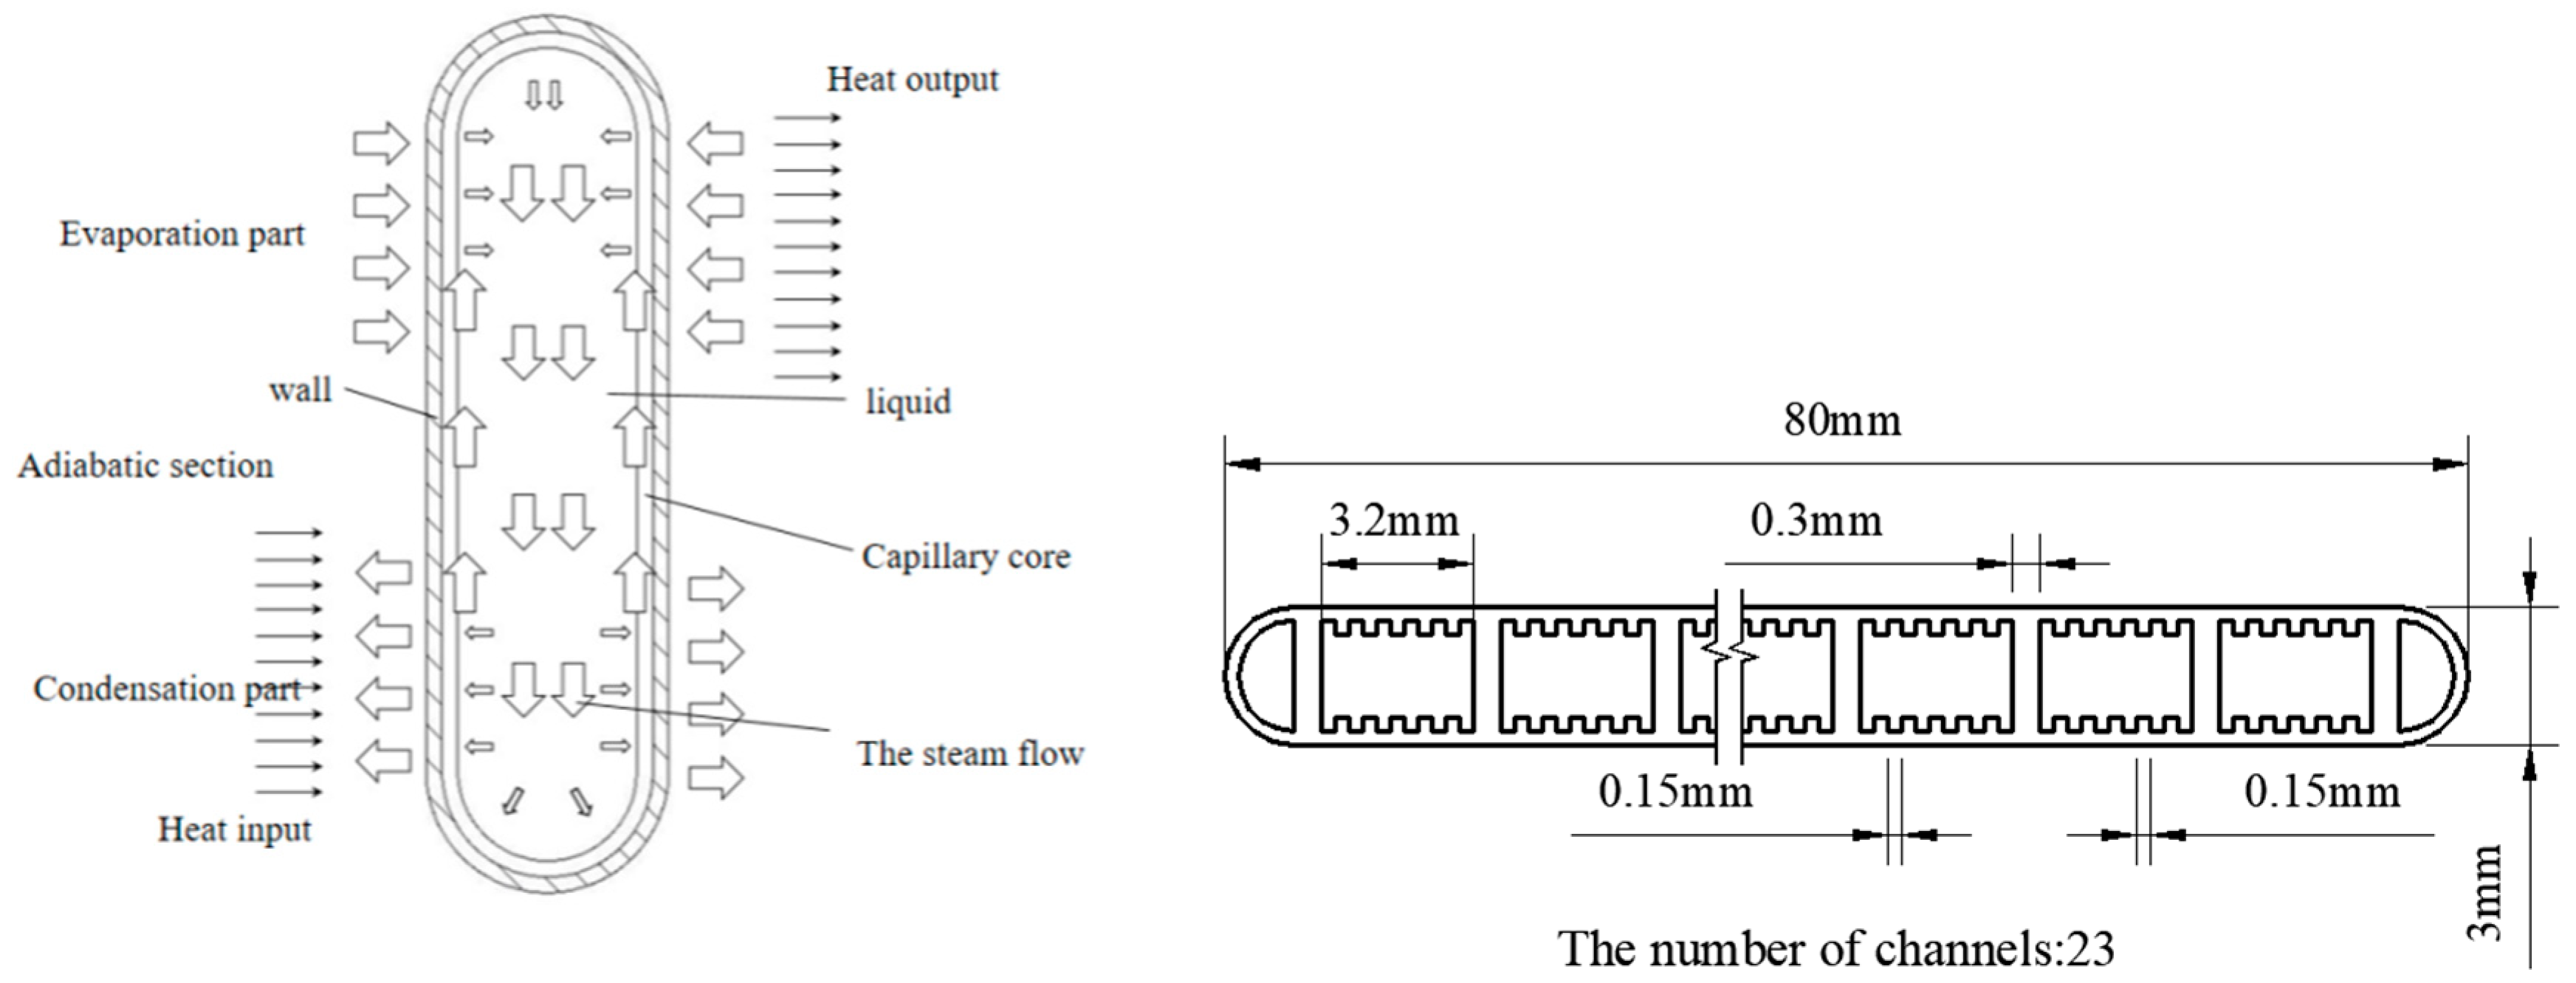
Figure 2.
Structural representation of the micro heat pipe low-temperature flue gas heat exchanger.

Figure 3.
(a) Micro heat pipe low-temperature flue gas heat recovery system; (b) Experimental test of low-temperature flue gas heat recovery unit of the micro heat pipe Layout for wind speed measurement; (c) Layout for wind speed measurement.
Figure 3.
(a) Micro heat pipe low-temperature flue gas heat recovery system; (b) Experimental test of low-temperature flue gas heat recovery unit of the micro heat pipe Layout for wind speed measurement; (c) Layout for wind speed measurement.

Figure 4.
Indoor temperature and time changes on Jan.17 (TLc-fresh air outlet temperature; TRj-flue gas inlet temperature; TLj-fresh air inlet temperature; TRc-flue gas outlet temperature).
Figure 4.
Indoor temperature and time changes on Jan.17 (TLc-fresh air outlet temperature; TRj-flue gas inlet temperature; TLj-fresh air inlet temperature; TRc-flue gas outlet temperature).

Figure 5.
Outdoor device time—temperature change the map outdoor device time—temperature change the map (SN-indoor temperature; YJ-flue gas inlet temperature; YC-flue gas outlet temperature; XC-fresh air outlet temperature; ST-canteens outlet temperature; SW-outdoor air temperature).
Figure 5.
Outdoor device time—temperature change the map outdoor device time—temperature change the map (SN-indoor temperature; YJ-flue gas inlet temperature; YC-flue gas outlet temperature; XC-fresh air outlet temperature; ST-canteens outlet temperature; SW-outdoor air temperature).
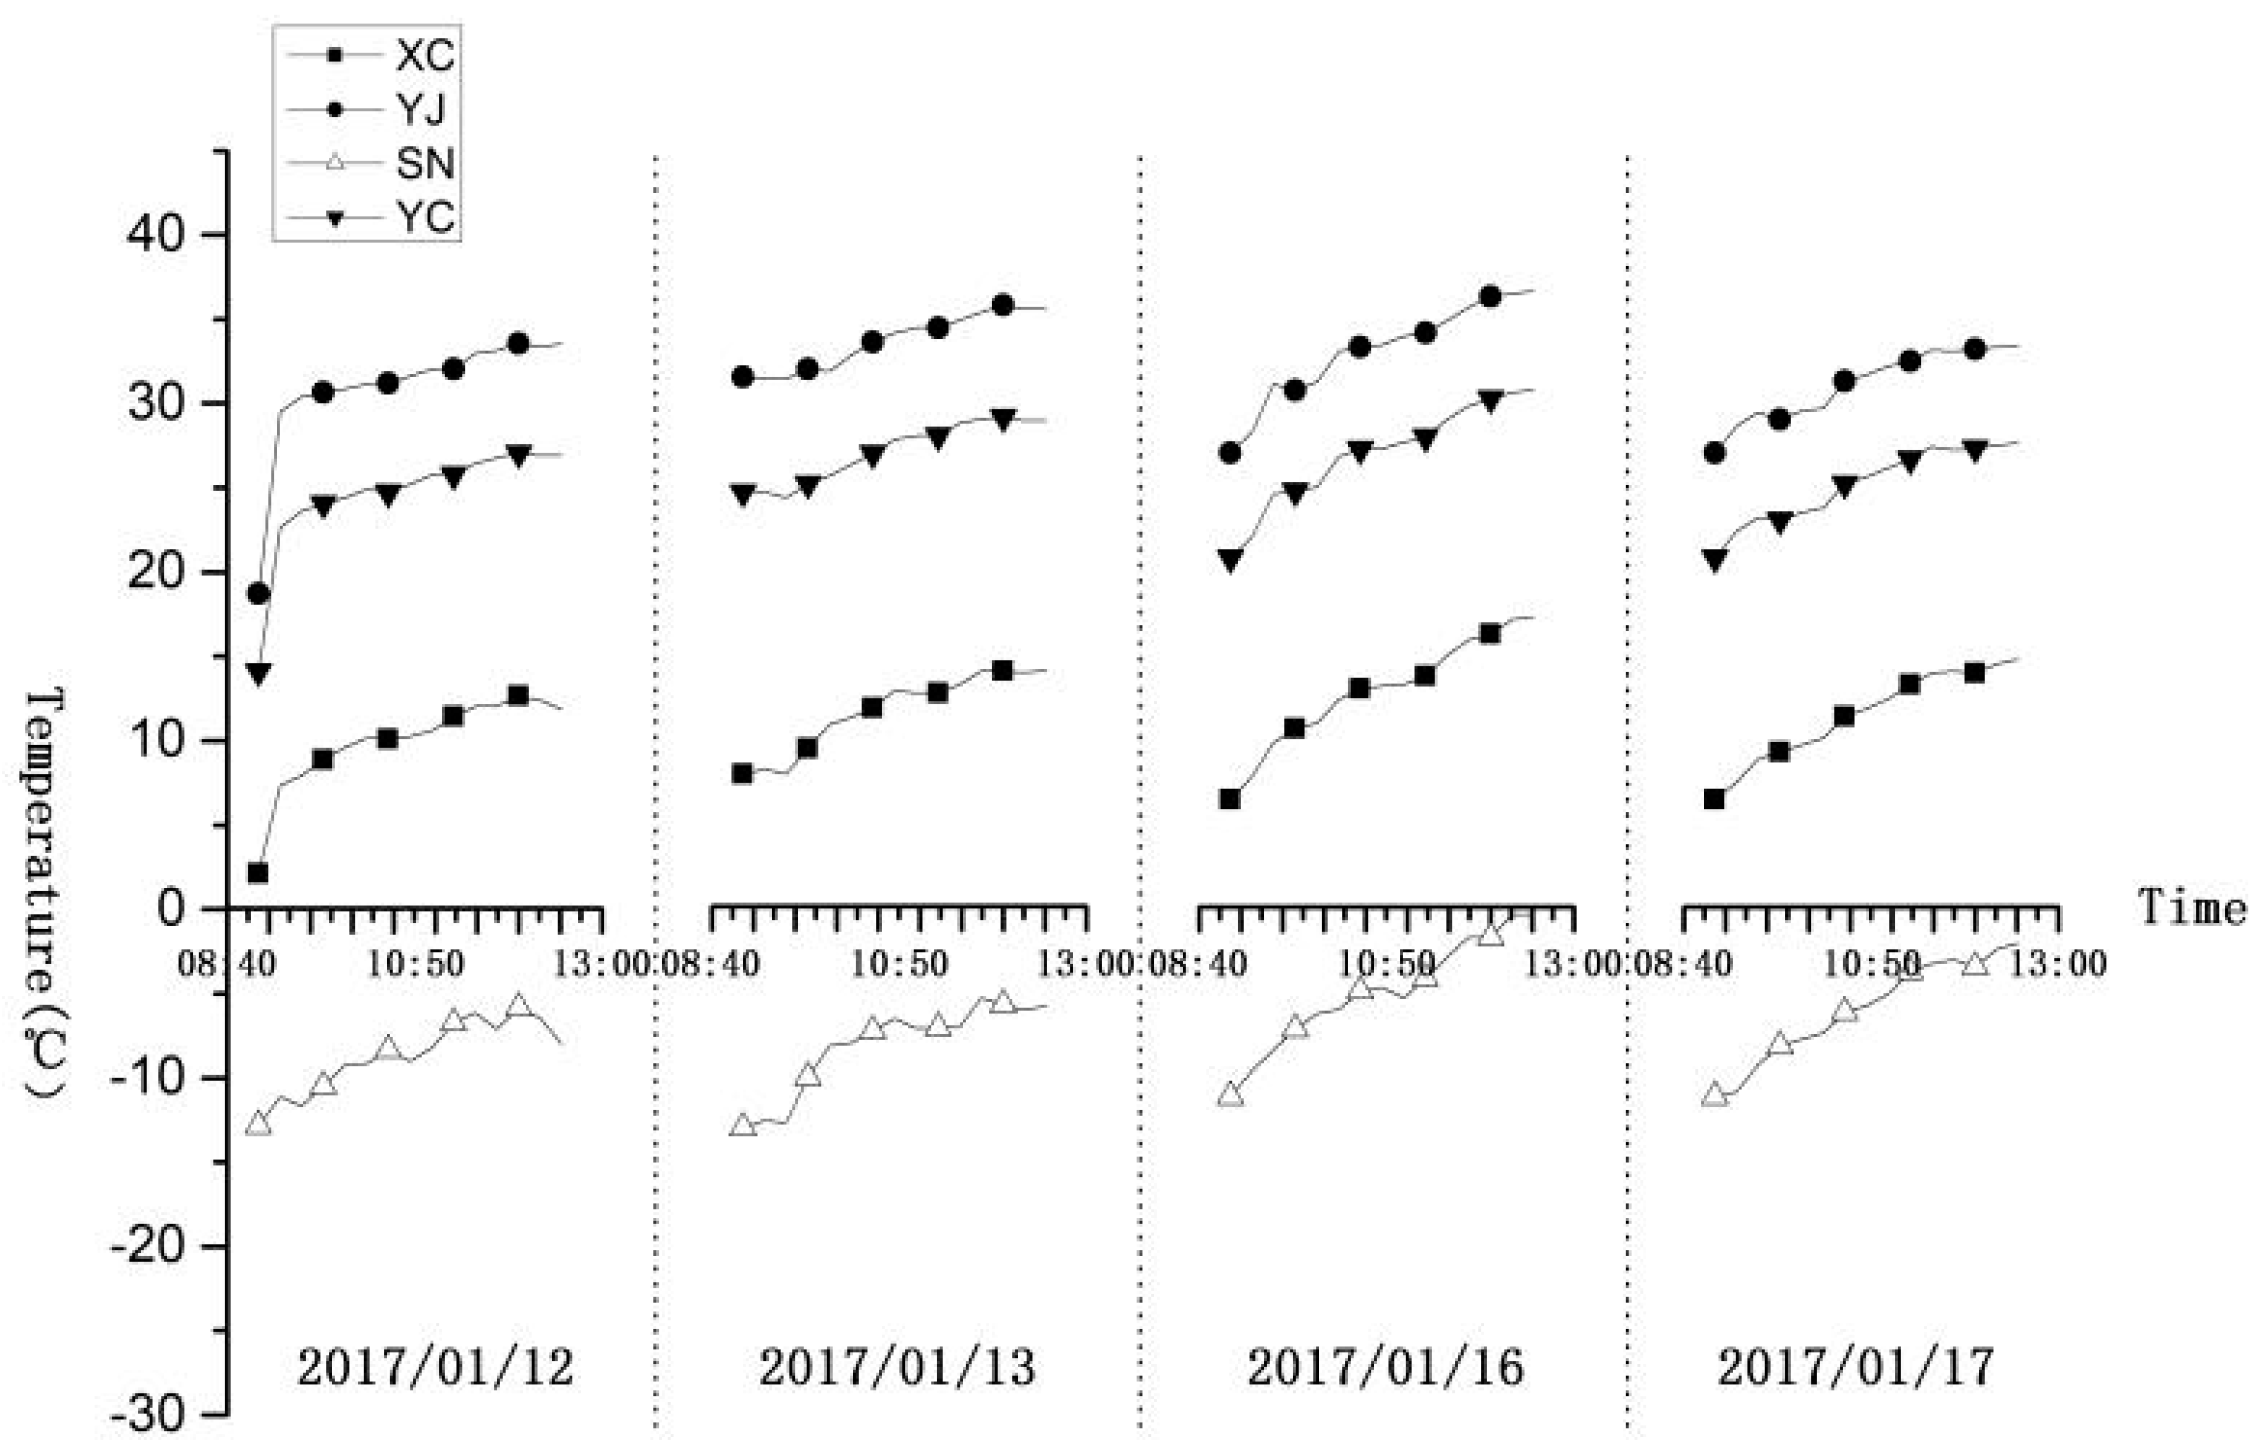
Figure 6.
Efficiency curve of heat pipe heat exchanger.

Figure 7.
Energy consumption and saving of heat exchangers.
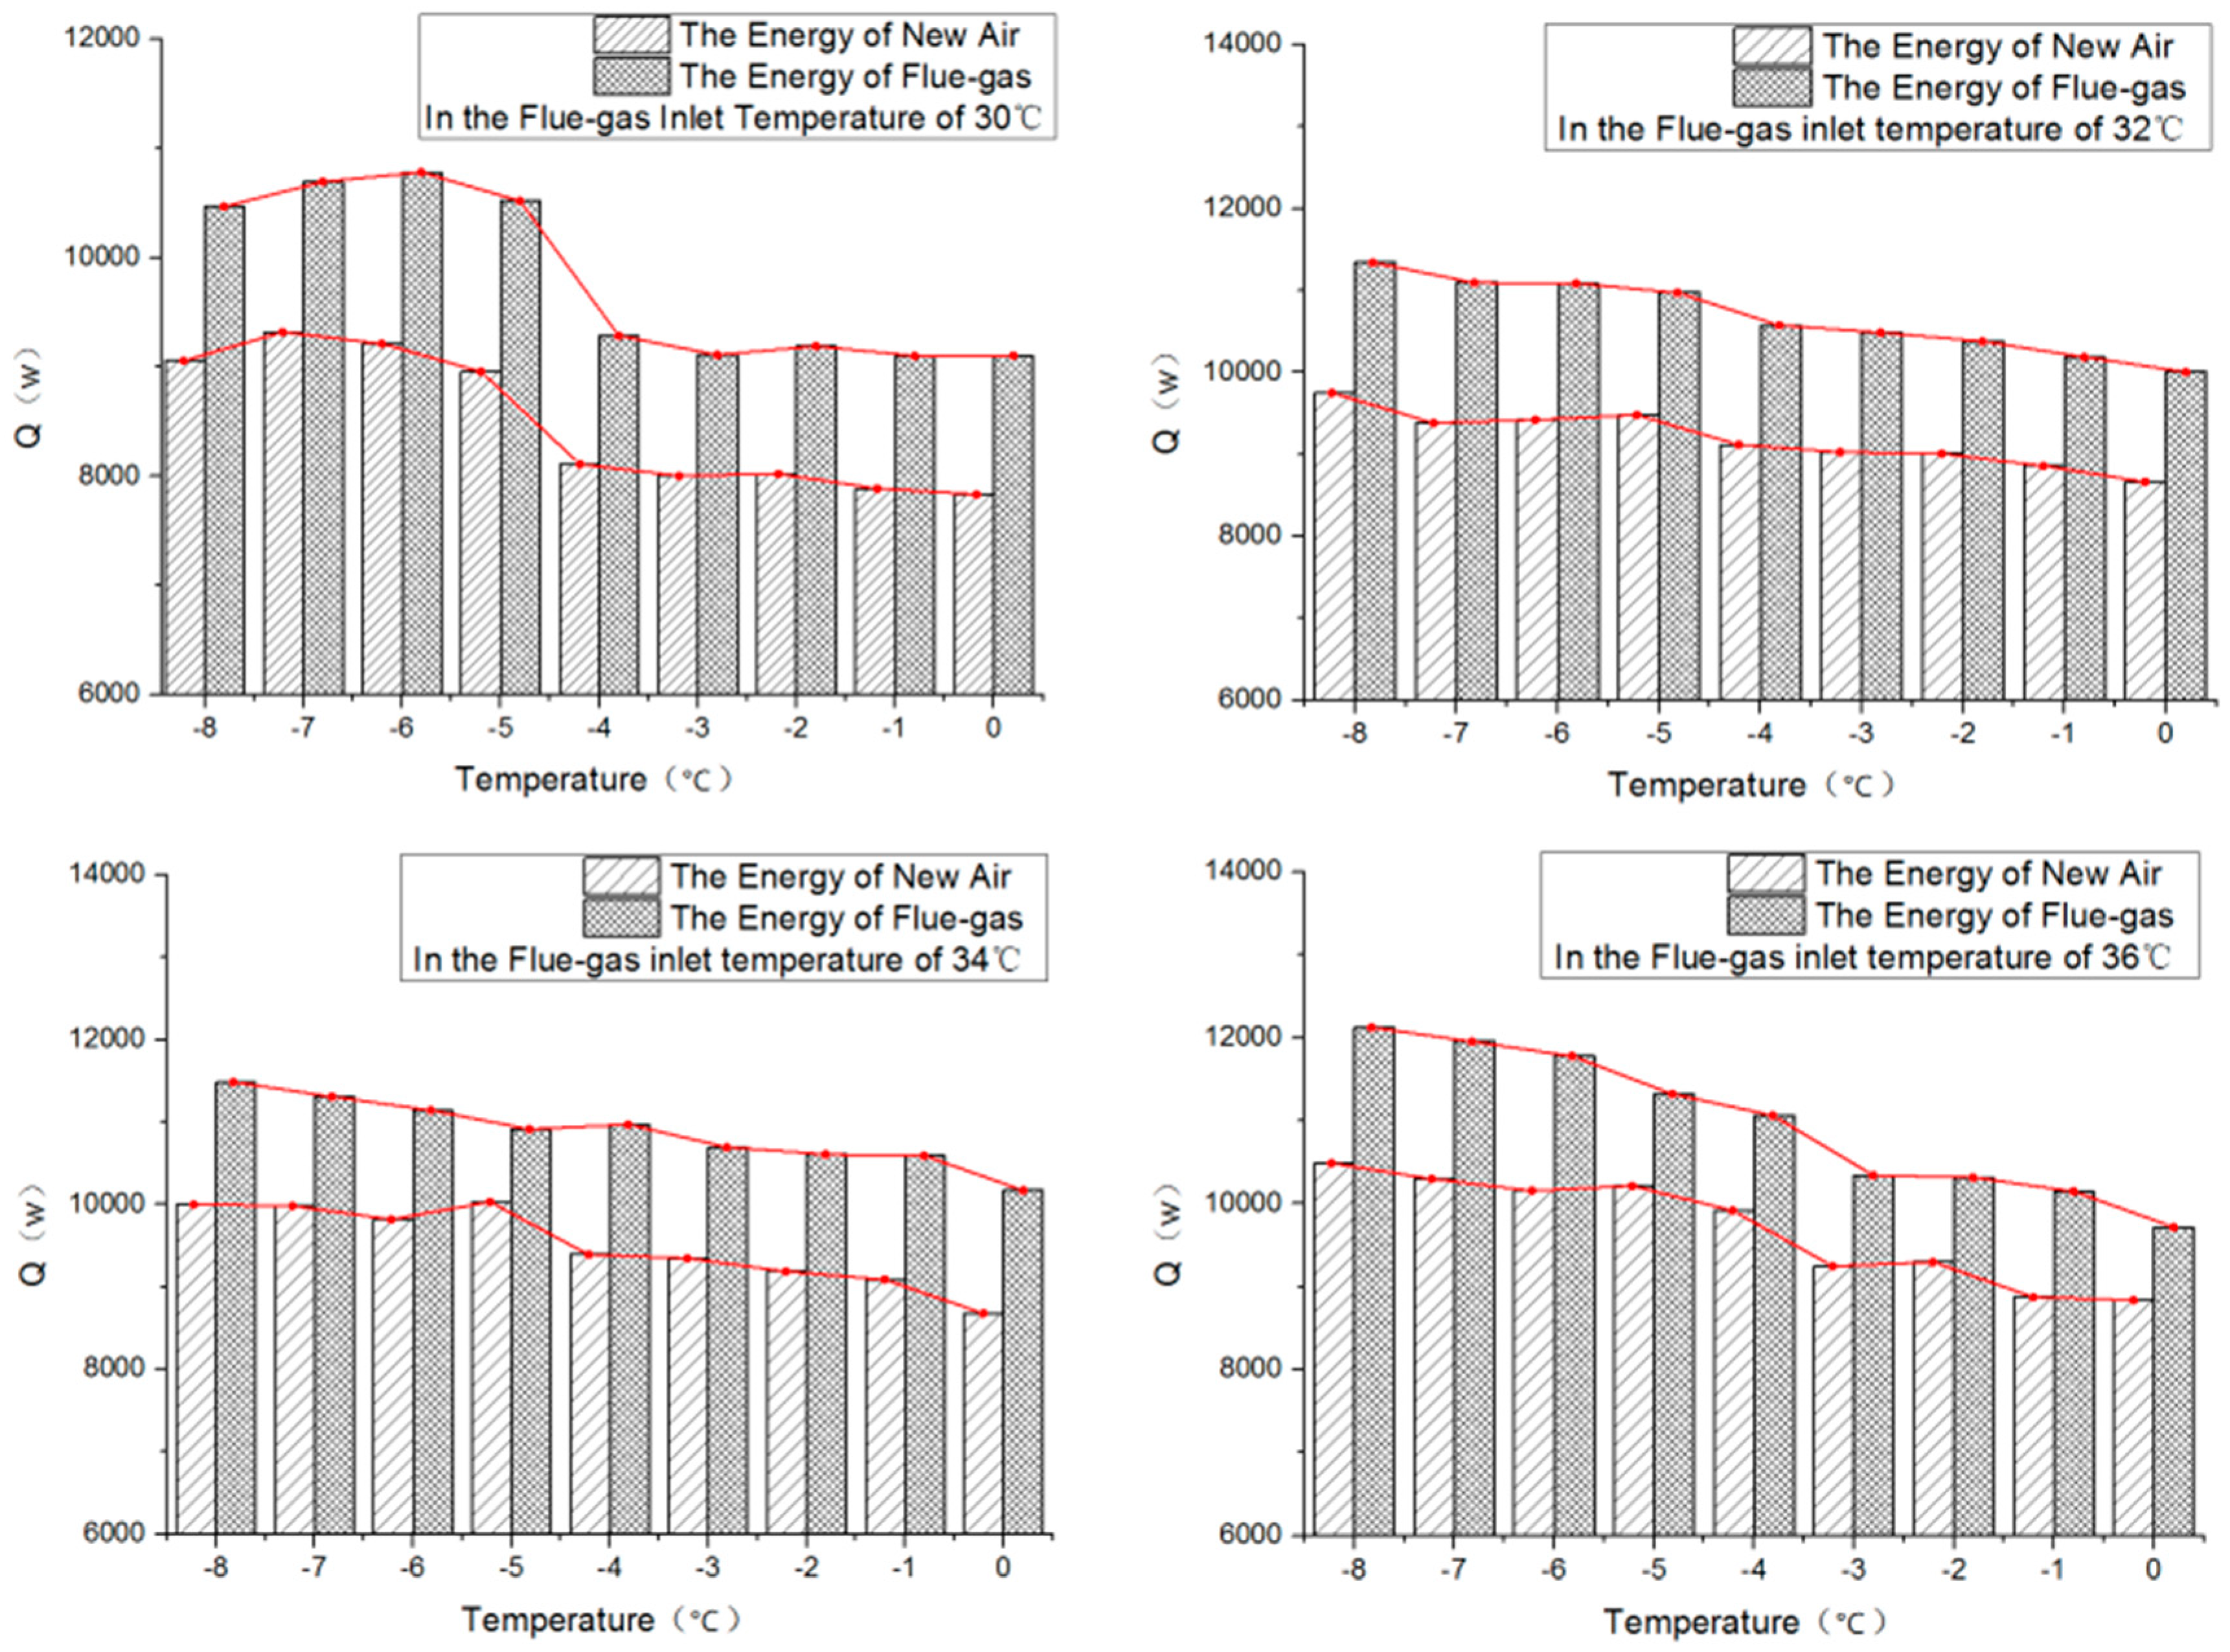
Figure 8.
Simulation diagram of the micro-heat pipe heat exchanger, unit: mm.

Figure 9.
Simulation of discontinuous grid division.
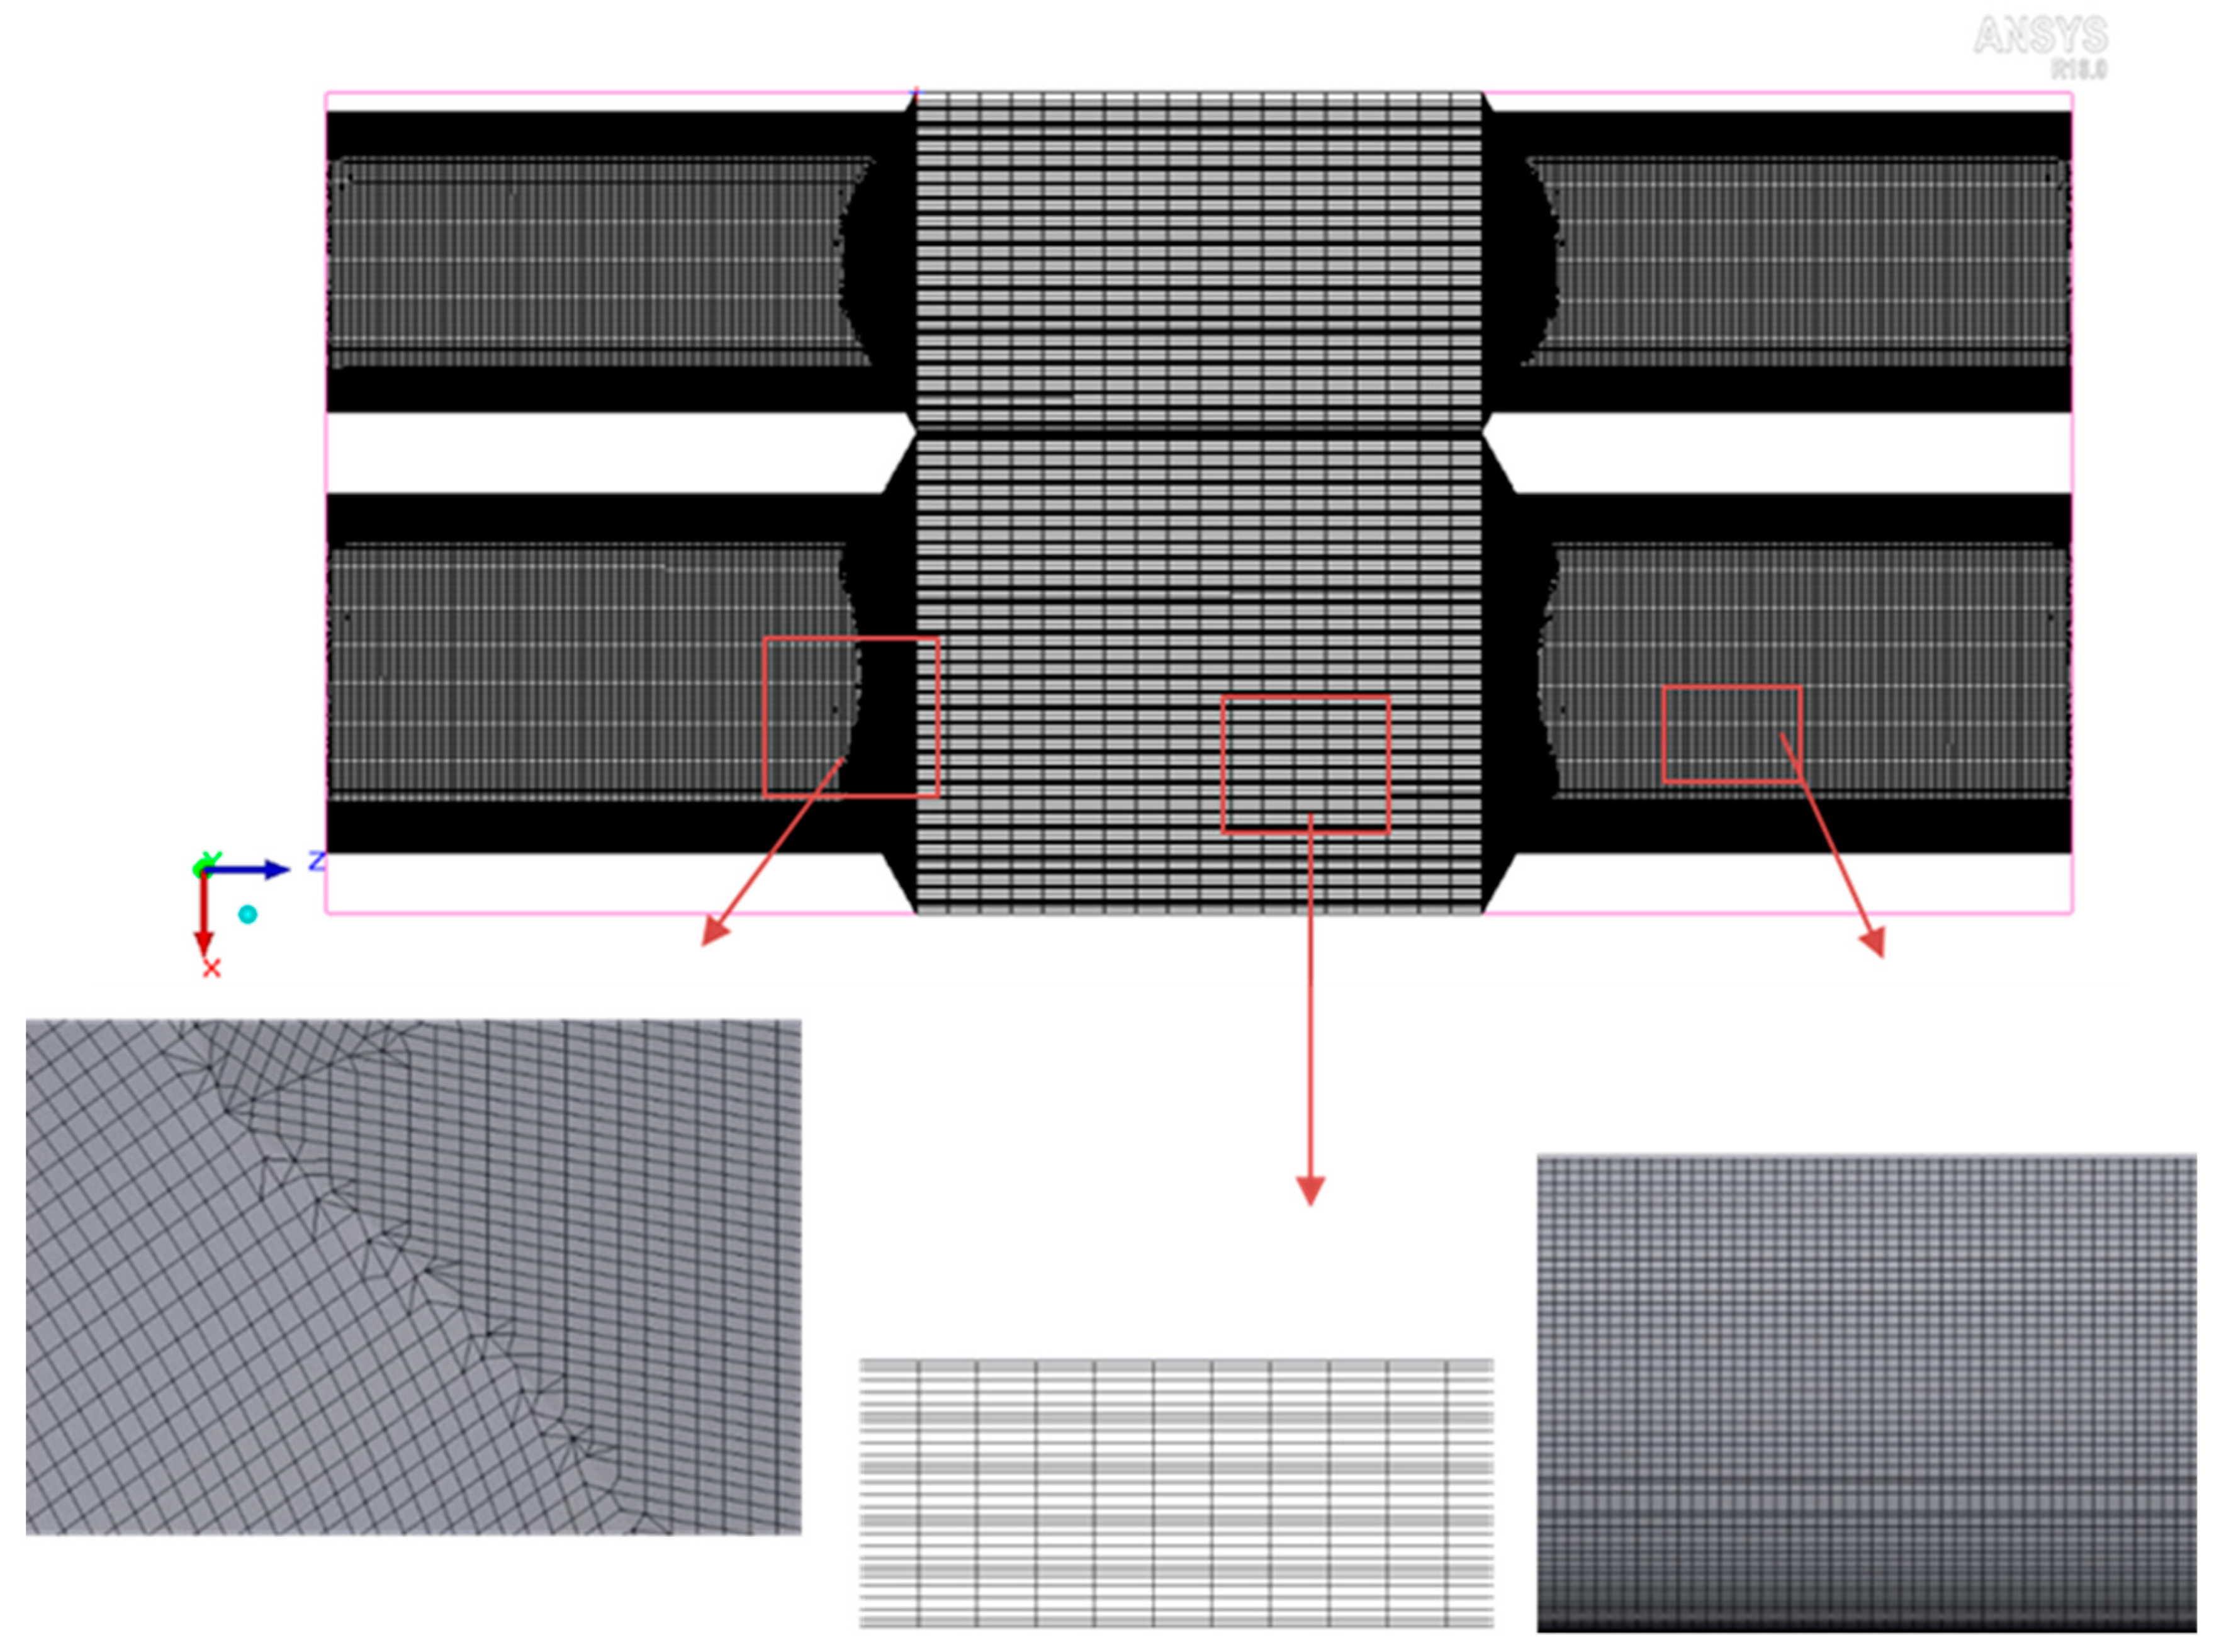
Figure 10.
(a) Temperature cloud diagram in the polluted air duct; (b) Temperature cloud diagram in the fresh air tunnel; (c) Temperature cloud diagram of inlet surface of polluted air and outlet surface of fresh air; (d) Temperature cloud diagram of inlet surface of fresh air and outlet surface of polluted air.

Figure 11.
The flow velocity of the guide cover.

Figure 12.
Comparison of the simulated and measured temperature.

Table 1.
Characteristic parameters of the heat exchanger.
| Characteristic Parameters | Value of Number | Measurement Unit |
|---|---|---|
| Overall dimensions | 685 × 475 × 490 | mm × mm × mm |
| The number of microthermal tube arrays | 126 | |
| Single piece effective heat transfer area. | 0.106 | m2 |
| The thickness of the segment | 4 | mm |
| Plate spacing | 20 | mm |
| Fresh air inlet/outlet area | 0.190 | m2 |
| Polluted air inlet/outlet area | 0.134 | m2 |
| The width of the partition between new and polluted air | 3 | mm |
© 2019 by the authors. Licensee MDPI, Basel, Switzerland. This article is an open access article distributed under the terms and conditions of the Creative Commons Attribution (CC BY) license (http://creativecommons.org/licenses/by/4.0/).
Share and Cite
MDPI and ACS Style
Yang, J.; Zhao, Y.; Chen, A.; Quan, Z. Thermal Performance of a Low-Temperature Heat Exchanger Using a Micro Heat Pipe Array. Energies 2019, 12, 675. https://doi.org/10.3390/en12040675
AMA Style
Yang J, Zhao Y, Chen A, Quan Z. Thermal Performance of a Low-Temperature Heat Exchanger Using a Micro Heat Pipe Array. Energies. 2019; 12(4):675. https://doi.org/10.3390/en12040675
Chicago/Turabian StyleYang, Jingang, Yaohua Zhao, Aoxue Chen, and Zhenhua Quan. 2019. "Thermal Performance of a Low-Temperature Heat Exchanger Using a Micro Heat Pipe Array" Energies 12, no. 4: 675. https://doi.org/10.3390/en12040675
Note that from the first issue of 2016, this journal uses article numbers instead of page numbers. See further details here.