Article

A Two-Stage Feature Selection Method for Power System Transient Stability Status Prediction

1
State Grid Sichuan Electric Power Research Institute, Chengdu 610041, China
2
State Grid Sichuan Electric Power Company, Chengdu 610041, China
3
Sichuan Energy Internet Research Institute, Tsinghua University, Chengdu 610213, China
4
Department of Electrical Engineering, Tsinghua University, Beijing 100084, China
*
Author to whom correspondence should be addressed.
Energies 2019, 12(4), 689; https://doi.org/10.3390/en12040689
Submission received: 10 January 2019 / Revised: 12 February 2019 / Accepted: 13 February 2019 / Published: 20 February 2019
(This article belongs to the Special Issue Optimization Methods Applied to Power Systems)

Abstract

:
Transient stability status prediction (TSSP) plays an important role in situational awareness of power system stability. One of the main challenges of TSSP is the high-dimensional input feature analysis. In this paper, a novel two-stage feature selection method is proposed to handle this problem. In the first stage, the relevance between features and classes is measured by normalized mutual information (NMI), and the features are ranked based on the NMI values. Then, a predefined number of top-ranked features are selected to form the strongly relevant feature subset, and the remaining features are described as the weakly relevant feature subset, which can be utilized as the prior knowledge for the next stage. In the second stage, the binary particle swarm optimization is adopted as the search algorithm for feature selection, and a new particle encoding method that considers both population diversity and prior knowledge is presented. In addition, taking the imbalanced characteristics of TSSP into consideration, an improved fitness function for TSSP feature selection is proposed. The effectiveness of the proposed method is corroborated on the Northeast Power Coordinating Council (NPCC) 140-bus system.

1. Introduction

With the continual enlargement in scale of power grid interconnections and the increasing large-scale integration of renewable power generation, the dynamic characteristics of power systems have become more and more complex, resulting in higher requirements for power system stability analysis [1,2]. In recent years, due to the wide application of wide-area measurement systems and rapid development of artificial intelligence (AI) methods, power system transient stability status prediction (TSSP) based on AI methods has attracted extensive attention. Generally, TSSP is treated as a two class classification problem, including the stable class and the unstable class [3]. Offline, the mapping relationship between the input features and the stability status is established by using the strong nonlinear mapping abilities of AI methods. Online, the upcoming transient stability status of the system can be quickly predicted by feeding the input features into the established classification model.
The input features are important factors that affect the performance of the classification model. However, the existing feature sets applied to TSSP are often manually selected according to experience, which can significantly degrade the performance of the classification model due to the existence of irrelevant and redundant features [4].
Feature selection, which refers to the process of filtering out the optimal feature subset from the original feature set, can eliminate irrelevant and redundant features and improve classification performance [5]. Therefore, it has become a basic data preprocessing method, and it is of great significance to study the feature selection method for TSSP.
The existing methods for TSSP feature selection can be divided into two main categories [6]: the filter method and the wrapper method.
The filter method ranks the original features by calculating the importance of each individual feature, and it selects a predefined number of top-ranked features as the input features for classification models. Different filter methods are generated according to different importance metrics. In [7,8], the Fisher criterion is utilized to evaluate features comprehensively, considering both the intra-class distance and the inter-class distance. Information measure-based feature selection methods are utilized to select important features in [9,10]. Other methods, such as the relief method [11] and the rough set method [12], are also adopted for TSSP feature selection. The filter method is computationally efficient since it ranks features individually, but it is less effective due to the lack of a classification model in the search process.
The wrapper method considers the feature selection as an optimization problem, and evaluates the feature subset by using certain search strategies and classification algorithms. Based on different search strategies, the wrapper method can be classified into the greedy search technique and the heuristic search technique. The former includes sequence forward search (SFS) methods and sequence backward search (SBS) methods, and the latter mainly includes genetic algorithms (GA) [13], binary particle swarm algorithms (PSO) [14], etc. Since the wrapper method combines the feature selection problem with the classification model, it often has a better performance than the filter method [15]. However, as the feature dimension increases, the wrapper method is usually preferred to obtain the local optimal solution of the problem.
From the above analysis, it can be concluded that both the filter method and the wrapper method have their own merits and demerits, and a more effective feature selection approach should be developed for TSSP problem.
In this paper, a novel two-stage feature selection method is proposed for TSSP problem. In the first stage, normalized mutual information (NMI) is utilized for measuring the relevance between individual feature and classes, and the features are ranked based on the NMI values. Then, the top-ranked features are selected to form the strongly relevant feature subset (SRFS), and the remaining features are described as the weakly relevant feature subset (WRFS). The results obtained in the first stage will be used as the prior knowledge for the next stage. In the second stage, binary particle swarm optimization (BPSO) is utilized as the search algorithm for feature selection, and a new particle encoding strategy that considers population diversity and prior knowledge is proposed. In addition, fitness function plays a very important role in controlling the search direction of BPSO. By taking the imbalanced characteristic of the TSSP problem into consideration, an improved fitness function composed of the geometric mean index and feature subset length is proposed. In this paper, k-nearest neighbor (KNN) is chosen as the classifier to evaluate the classification performance of the candidate feature subset because of its simplicity and rapidity.
The rest of the paper is organized as follows. Section 2 introduces the methodologies used in the paper. Section 3 describes the process of initial feature set construction and data generation. In Section 4, the proposed two-stage feature selection method is provided. The case study is shown in Section 5 and the conclusion is drawn in Section 6.

2. Methodology

2.1. Normalized Mutual Information

Mutual information represents the information shared by two variables, which can be utilized for measuring the correlation degree of two variables [16].
Entropy is the measure of the uncertainty of a random variable. If the probabilities of different output classes C are P(ci), i = 1, …, Nc, then the entropy H(c) is defined as follows:
H ( C ) = i = 1 N c P ( c i ) log 2 ( P ( c i ) )
The joint entropy of feature vector F and output class C is defined as:
H ( C ; F ) = i = 1 N c j = 1 N f P ( c i , f j ) log 2 ( P ( c i , f j ) )
When the feature vector F is known, the residual uncertainty in the output class C is measured by the conditional entropy:
H ( C | F ) = j = 1 N f P ( f j ) i = 1 N C P ( c i | f j ) log 2 ( P ( c i | f j ) ) = i = 1 N c j = 1 N f P ( c i , f j ) log 2 ( P ( c i | f j ) )
The relationship between the conditional entropy, entropy, and joint entropy can be demonstrated as below:
H ( C | F ) = H ( C ; F ) H ( F )
The mutual information between two variables C and F is defined as [16]:
M I ( C ; F ) = H ( C ) H ( C | F )
From the above equation, it can be concluded that mutual information measures the reduction amount of class uncertainty after proving the knowledge of feature vectors.
The mutual information is symmetric and can be reduced to the following equation:
M I ( C ; F ) = M I ( F ; C ) = i = 1 N c j = 1 N f P ( c i , f j ) log 2 P ( c i , f j ) P ( c i ) P ( f j )
In order to normalize the mutual information value into [0, 1], the normalized mutual information (NMI) [17] is denoted as:
N M I ( C ; F ) = 2 M I ( C ; F ) H ( C ) + H ( F )
The larger the NMI value is, the stronger the relevance between features and classes will be, and vice versa. If the NMI value is 0, it means that the feature vector and classes are totally irrelevant or independent of each other. If the NMI value is 1, it indicates that the feature vector and classes are completely relevant.
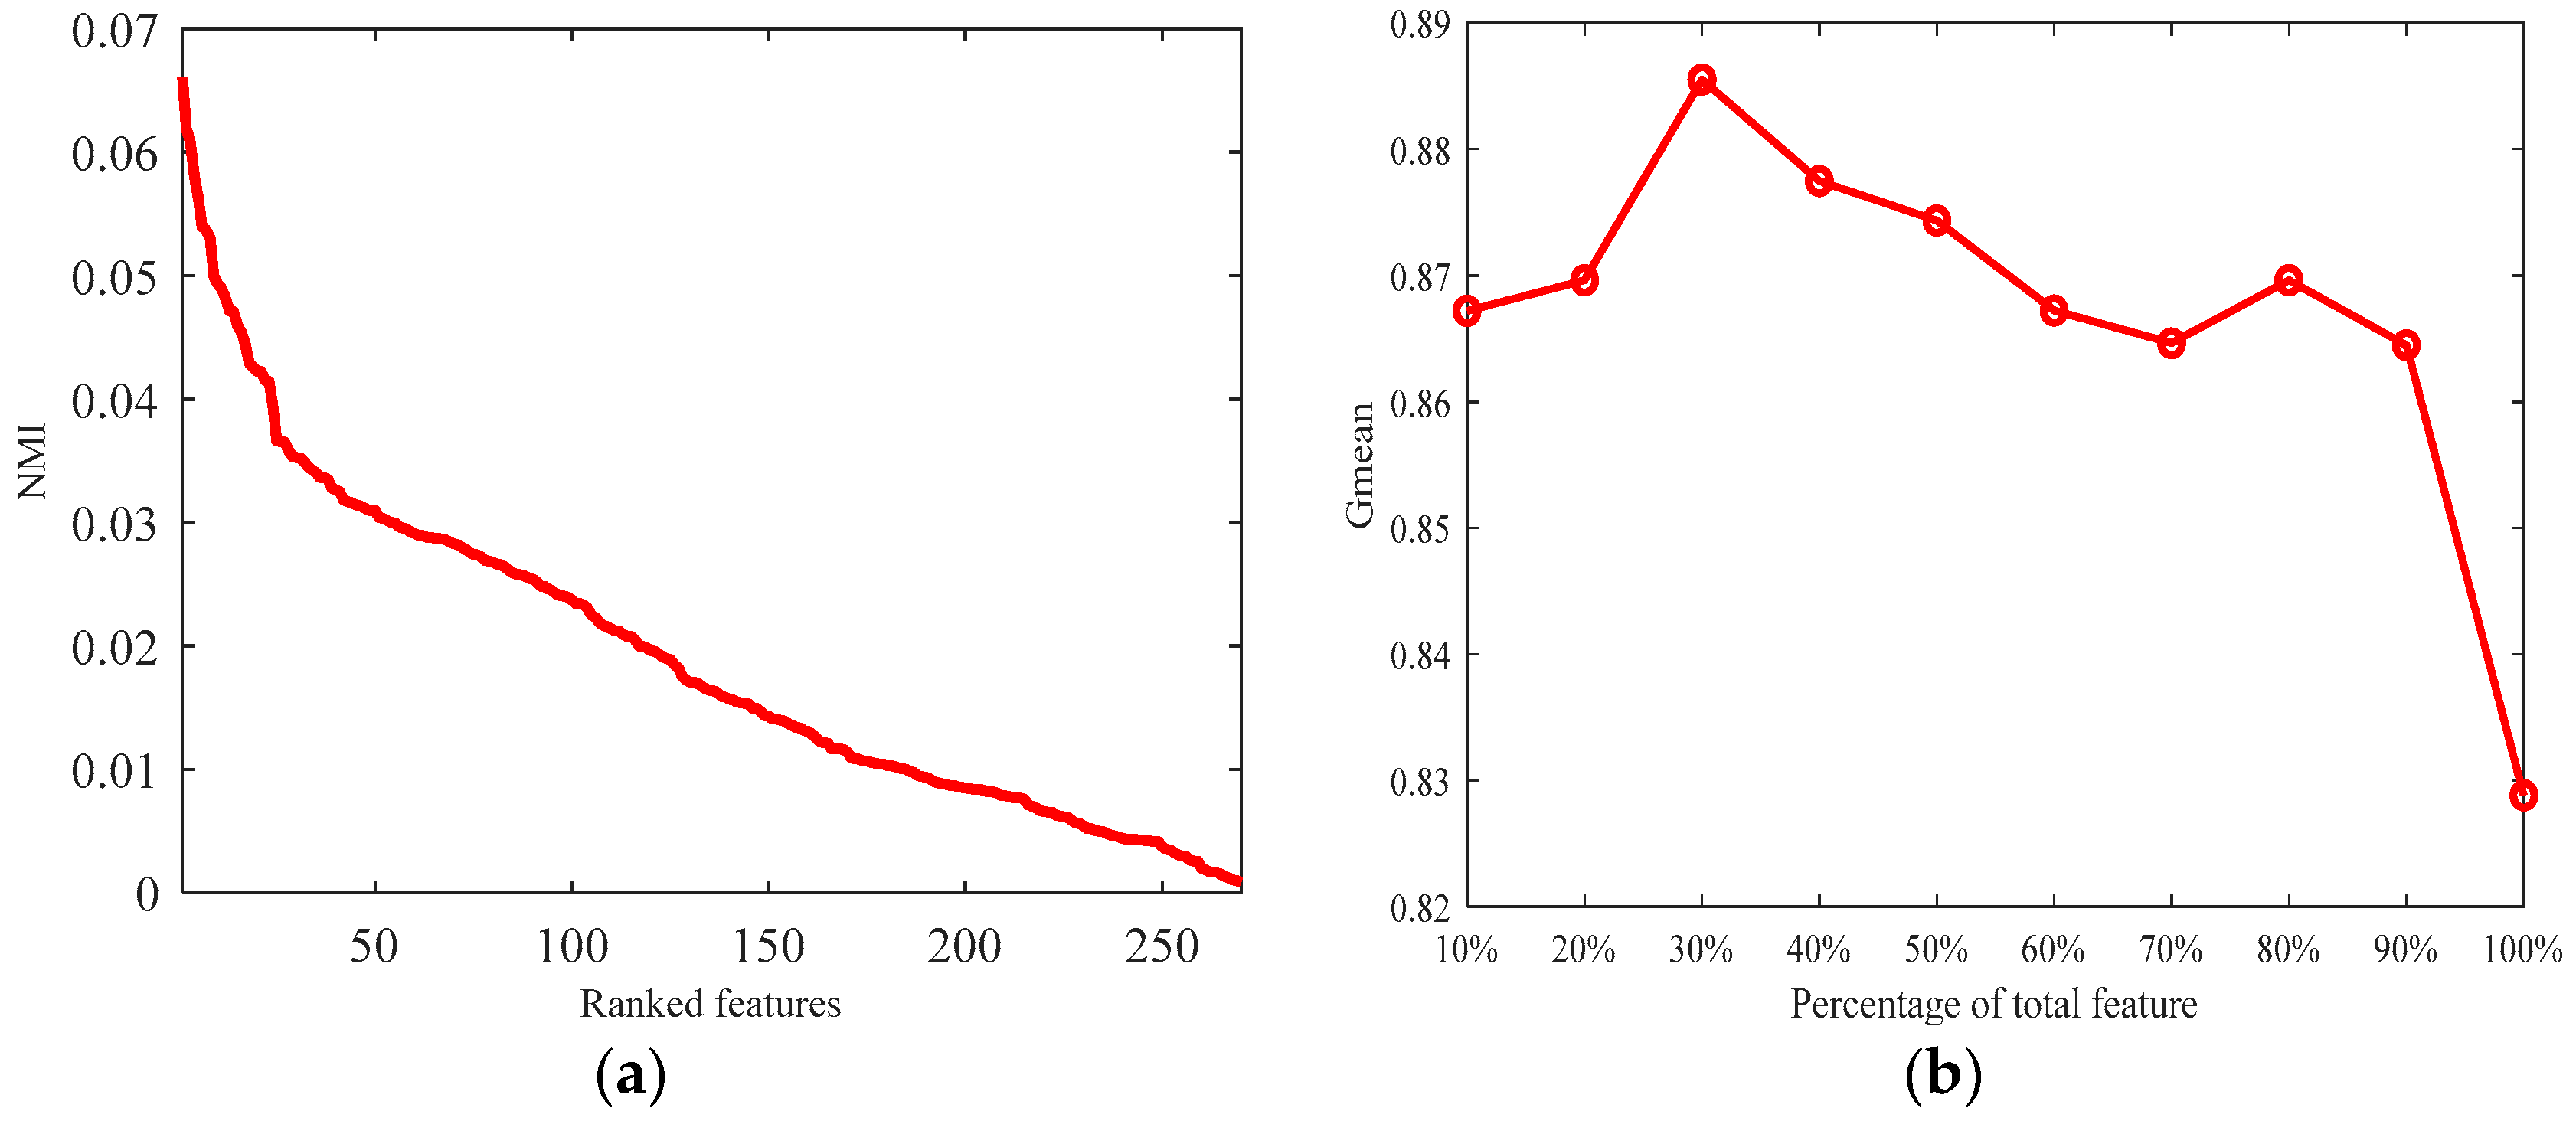
After ranking the features based on the NMI values, the predefined number of top-ranked features can be selected to form the SRFS, and the remaining features are described as WRFS.

2.2. Binary Particle Swarm Optimization

Among the heuristic intelligent optimization algorithms, the particle swarm optimization (PSO) algorithm, which is easy to implement and has few parameters to tune, is superior to other algorithms in terms of success rate and solution quality. The binary version of PSO (BPSO) is employed for TSSP feature selection since it is a discrete optimization problem with binary solution space [18].
In BPSO, every possible solution to this optimization problem is presented by a particle, which has the two attributes of position and velocity. The next particle velocity is determined by the current particle velocity and particle position. Specifically, during each iteration, particles will be updated based on the distance from the individual best position and the distance from the global best position. The velocity updating formulas of PSO are provided as follows:
v i d k + 1 = ω v i d k + c 1 r 1 ( p b e s t i d k x i d k ) + c 2 r 2 ( g b e s t d k x i d k ) ] a = 1
ω = ω max k N k × ( ω max ω min )
where x i d k and v i d k are velocity and position of the particle i in dimension d at iteration k, respectively; pbest indicates the best position of the particle i in dimension d at iteration k, while gbest is the best position in the swarm so far; c1 and c2 represent the acceleration coefficients; r1 and r2 are the random numbers from a uniform distribution within the range of [0, 1]. The inertia weight ω is used to control the impact of the last velocity to the current velocity, which is linearly decreased from ωmax to ωmin to balance the global and local search [19], as shown in Equation (9). Nk is the maximum number of iterations.
The particle position in BPSO algorithm is updated based on the velocity value, and the transfer function should be employed to map the real valued velocity to a probability value between [0, 1] to change the binary position.
The velocity value in the BPSO algorithm means the difference between the current particle and the optimal particle. If the absolute value of velocity is relatively large, it means that the difference between the current particle and the optimal particle is large, and at this time, the transfer function should provide a higher possibility to change the position status of the current particle. Conversely, if the absolute value of the velocity is small, the difference between the current particle and the optimal particle is small. Then the transfer function should provide a higher probability to maintain the current position status. Therefore, v-shaped transfer functions designed in [20,21] is utilized for converting the velocity value to the changing probability of position status, as shown below:
T ( v i d k + 1 ) = { 2 1 + exp ( v i d k + 1 ) 1   if   v i d k + 1 0 1 2 1 + exp ( v i d k + 1 )   if   v i d k + 1 < 0
After calculating the probability value, the binary position is then updated with the following formula:
x i d k + 1 = { 1 x i d k + 1 if   r 3 T ( v i d k + 1 ) x i d k + 1 otherwise
where r3 is a random number uniformly distributed between [0, 1].
According to Equation (11), the particle position will be changed to the opposite status when the random number is smaller than T ( v i d k + 1 ) , and when the random number is larger than T ( v i d k + 1 ) , the status of particle position will be maintained.
The main steps of BPSO for solving binary optimization problem are describe below:
Step 1:
Set the parameters of BPSO including population size, maximum iteration number, velocity range, learning factors, and inertia weight range.
Step 2:
Initialize the binary position and velocity of each particle randomly.
Step 3:
Calculate the fitness function of each particle, and update the values of individual best position pbest and global best position gbest.
Step 4:
Update the velocity by using Equation (8) and the binary position by using Equations (10) and (11).
Step 5:
Terminate the optimization process when the maximum iteration number is reached, and go on to step 6. Otherwise, increase the iteration number and return to step 3.
Step 6:
Save the global best position as the ultimate solution for the binary optimization problem.

2.3. New Particle Encoding Strategy

Before using the heuristic search method for feature selection, the population initialization should be carried out first. 
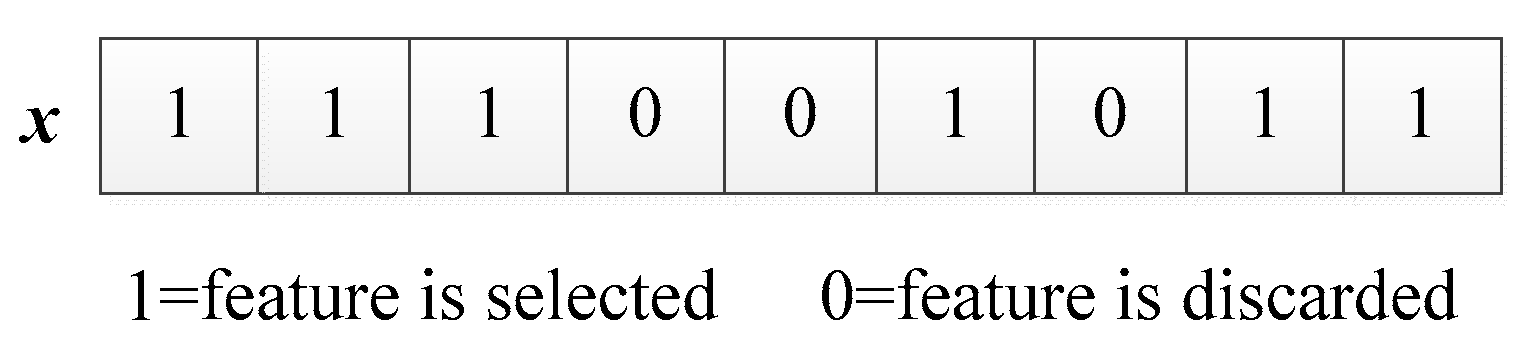
Figure 1 is an encoding schematic diagram of a particle with 9-dimensional features, where 1 indicates that the feature is selected, and 0 indicates that the feature is discarded.
The binary status of the dimension d of particle i is encoded by the following formula:
x i d = { 1 r 4 p 0 otherwise
where r4 is a random number uniformly distributed between [0, 1], and p is a value between [0, 1].
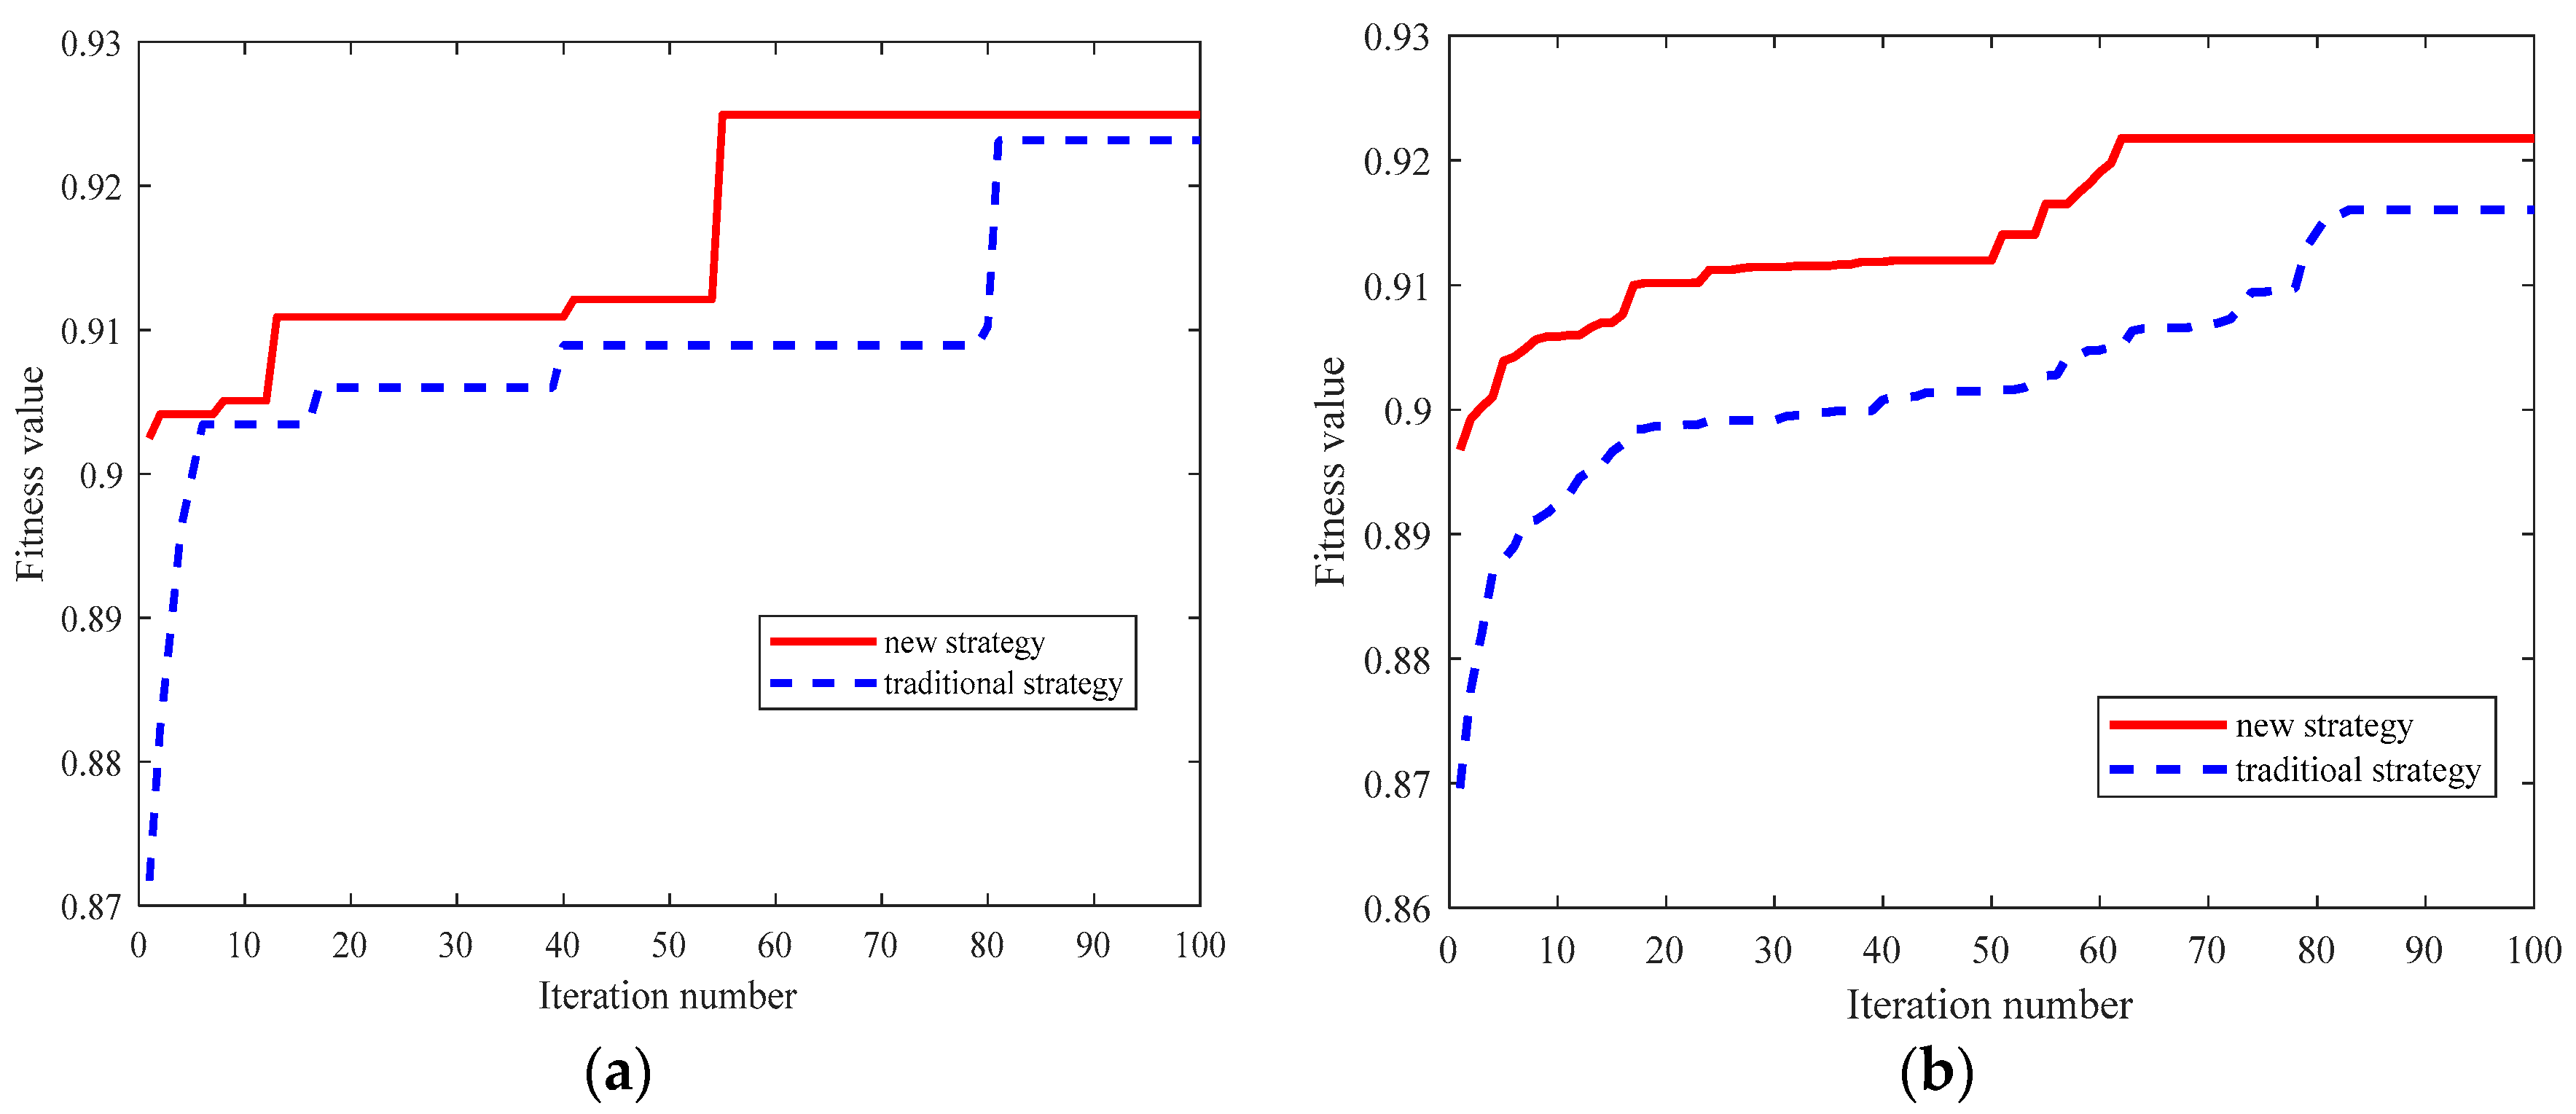
The value of p indicates the probability that the dimension d is set to 1. In the conventional particle encoding method, each feature is selected by a completely random way, and the p is set to 0.5. The advantage of this particle encoding method is that it can increase the population diversity, but the disadvantages are that it can slow down the convergence speed and easily lead to local optimal solution, especially when the dimensions of feature selection problem is large.
As described in Section 2.1, the initial feature set can be divided into SRFS and WRFS based on the value of NMI. A feature in SRFS means that this feature has a higher probability to be chosen as the ultimate input feature, and a feature in WRFS means that this feature has a lower probability to be chosen as the ultimate input feature. The information obtained in Section 2.1 can be embedded into the particle encoding process as prior knowledge, which can guide the search direction of particles, and improve the efficiency and effectiveness of the feature selection results.
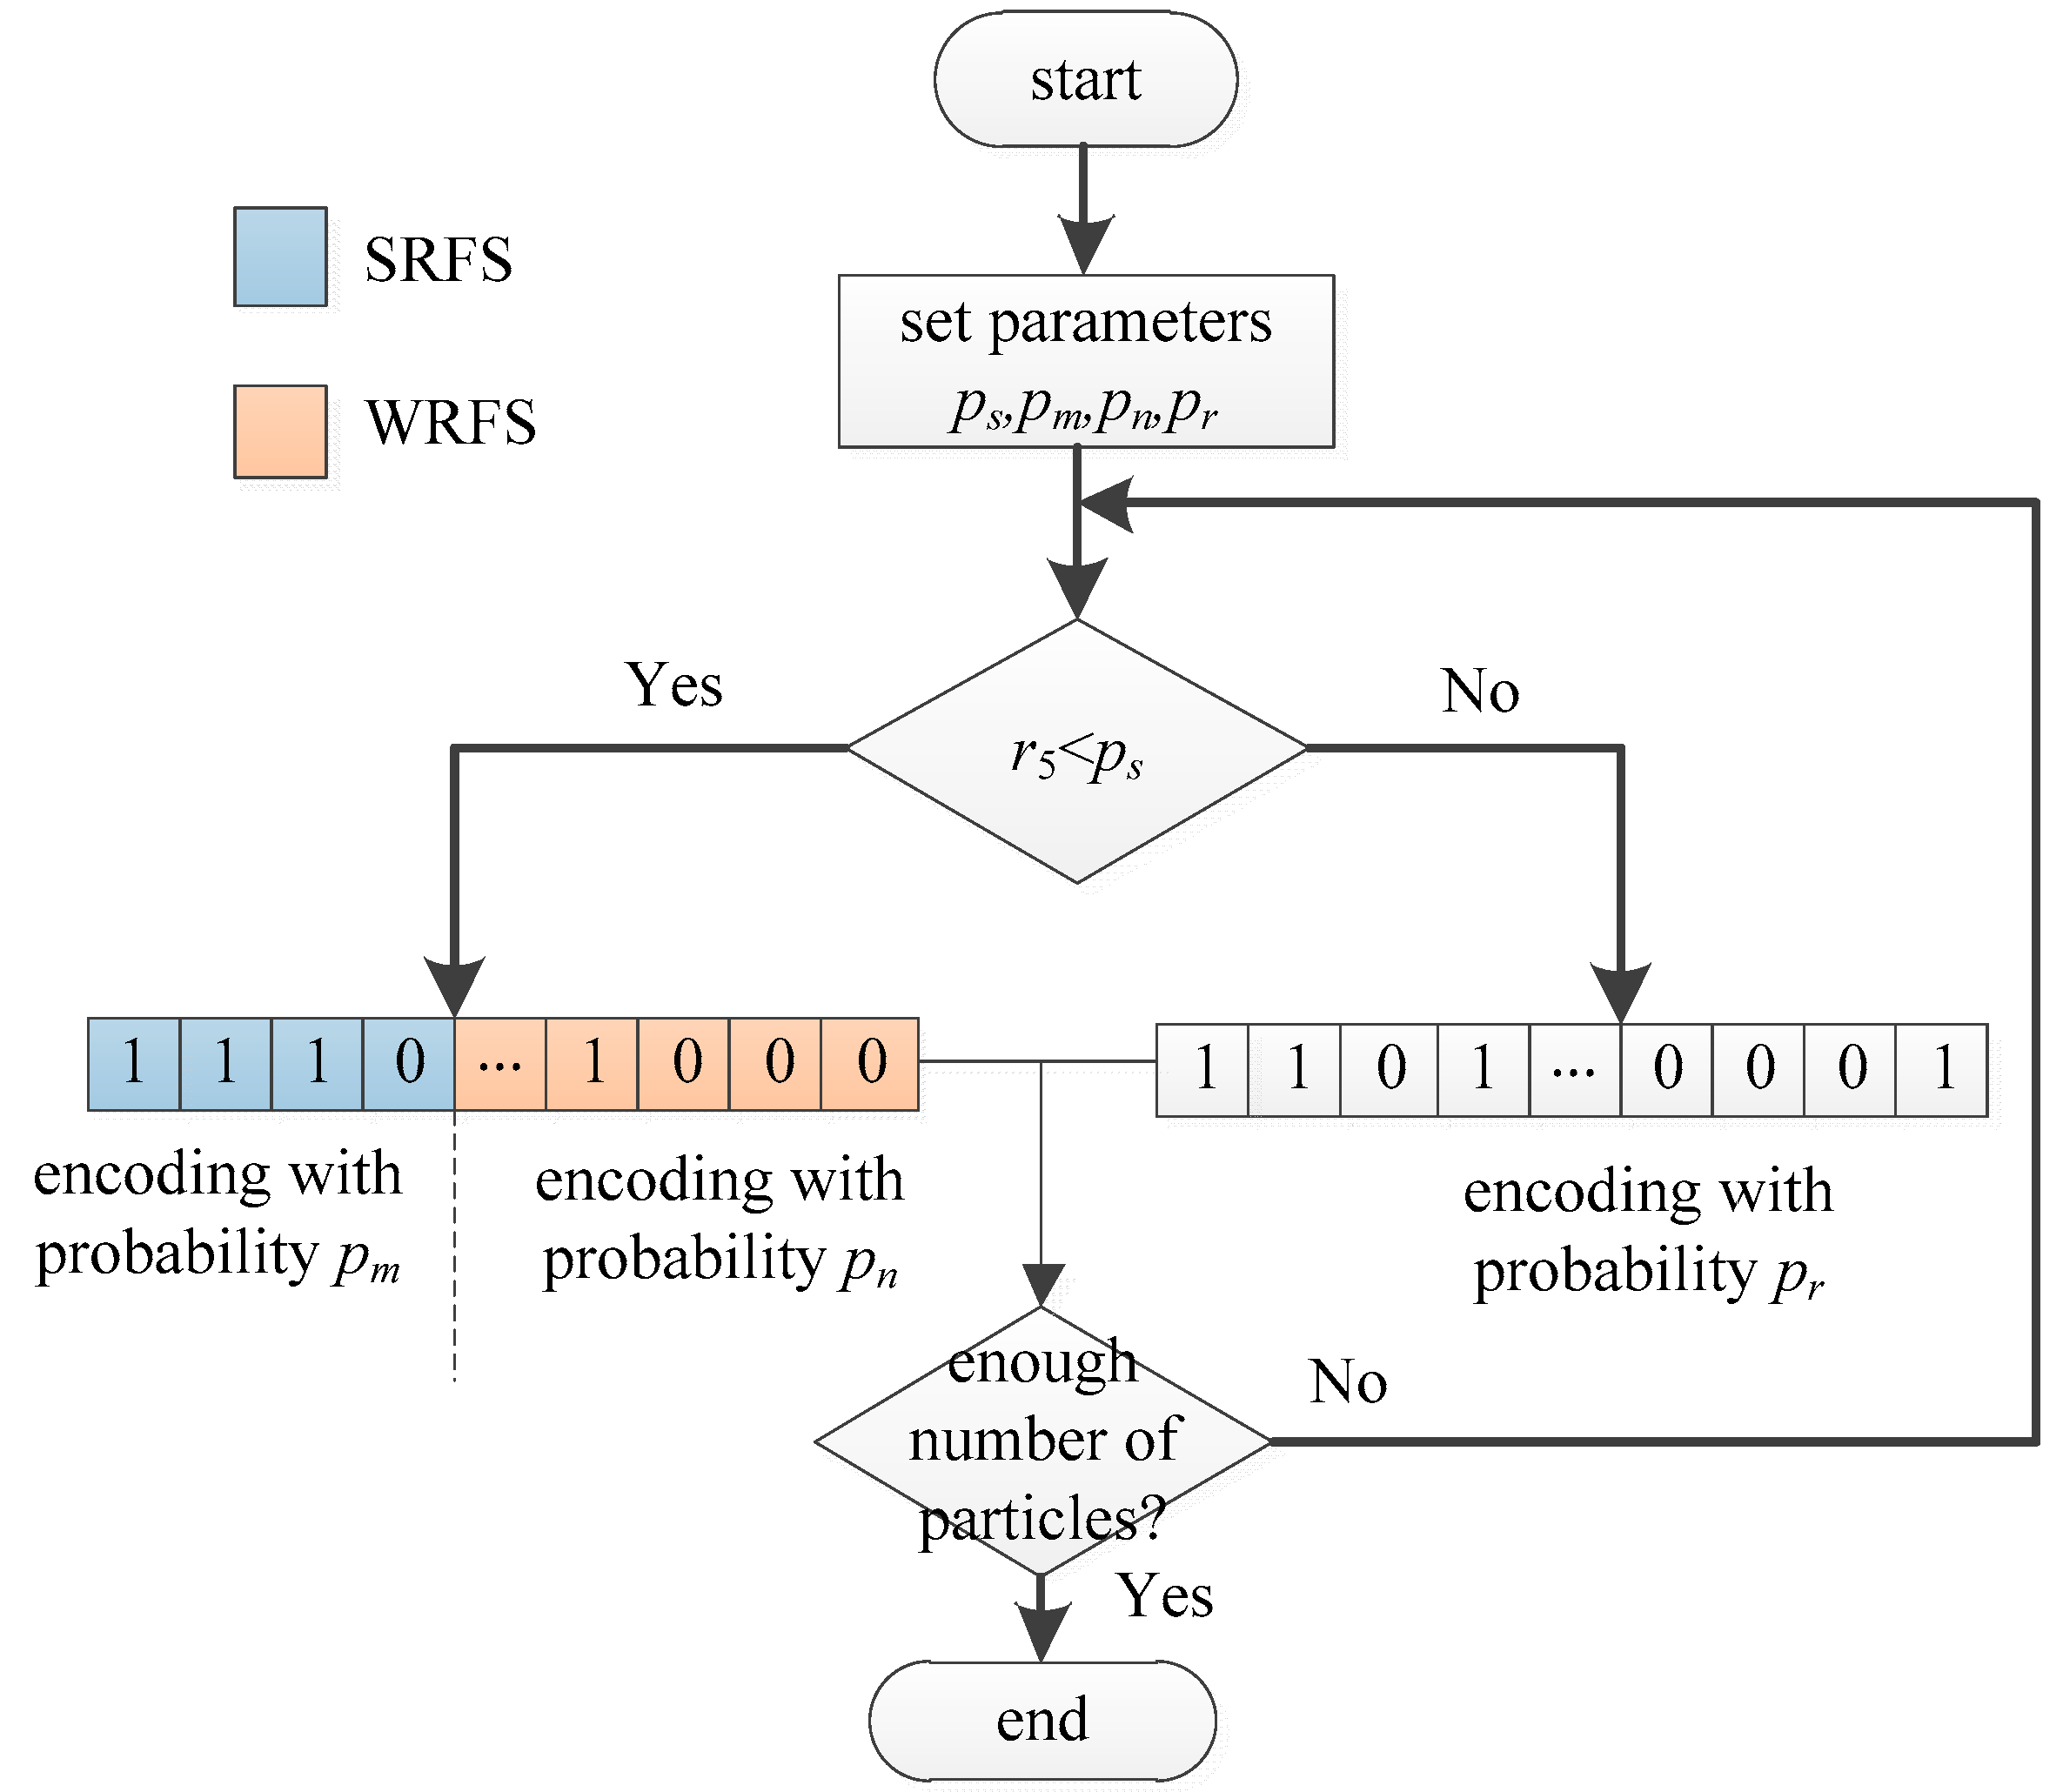
Based on the analysis above, a new particle encoding strategy considering the population diversity and priori knowledge is proposed, whose flowchart is shown in Figure 2.
From Figure 2, the main steps of the proposed particle encoding are listed below:
Step 1:
Generate a random number r5 uniformly distributed in [0, 1], and compare the random number with ps. If the random number r5 is smaller than ps, go to step 2; otherwise, go to step 3. The value of ps determines the proportion of completely random particle encoding and the particle encoding with prior knowledge, and ps is set to 0.5 in this paper to balance two different particle encoding methods.
Step 2:
Encode the particles considering the prior knowledge which is obtained from Step 1. For the feature in SRFS, the value of p in Equation (12) is set to pm, and the pm is bigger than 0.5, meaning that these kinds of features have higher probabilities to be selected. For the feature in WRFS, the value of p in Equation (12) is set to pn = 1 − pm, meaning that the pn is smaller than 0.5 and these kinds of features have higher probabilities to be discarded. Then, go to step 4.
Step 3:
Encode the particles in a completely random way. All the features are encoded with the original way, meaning that the value of pr is set to 0.5, and each feature has the same probability to be selected. The purpose of this operation is to increase the diversity of populations. Then, go to step 4.
Step 4:
Check whether the number of particles is enough. If yes, stop the particle encoding process, otherwise, back to step 1.

2.4. Geometric Mean (Gmean)-Based Fitness Function

For TSSP feature selection, classification performance and feature number are two inevitable aspects which should be taken into consideration in fitness function. In the existing research, the overall classification accuracy (OCA) is always utilized as the index of classification performance. However, since power systems are scheduled to operate under stable conditions most of the time, the sample numbers of stable class and unstable class are usually highly imbalanced [13]. In this situation, the OCA tends to obscure the classification performance of the unstable class with a small sample number, which does not meet the actual operational requirements of the power system. Therefore, it is not suitable to use the OCA as the classification performance index for TSSP feature selection.
In general, the classification performance of TSSP can be represented by a confusion matrix, which is shown below.
In Table 1, TS represents the sample number of stable classes classified as stable class, TU represents the sample number of unstable classes classified as unstable class, FU represents the sample number of stable classes misclassified as unstable class, and FS represents the sample number of unstable classes misclassified as stable class.
The true stable class rate (TSR) represents the proportion of the sample number of stable classes truly classified as stable class in the total number of stable classes, as shown below:
T S R = T S T S + F U
The true unstable class rate (TUR) indicates the proportion of the sample number of unstable classes truly classified as unstable class in the total number of unstable classes, as shown below:
T U R = T U T U + F S
To cope with the class-imbalance problem of TSSP, the geometric mean (Gmean) [22,23] of TSR and TUR is employed as the overall performance of classification model in lieu of conventional classification accuracy, which can be expressed as:
G m e a n = T S R × T U R
It can be seen from the above formula that the larger the Gmean is, the better the classification performance will be. When both TSR and TUR are 1, Gmean is 1.
In order to further illustrate that Gmean is more suitable for evaluating classification model performance than the traditional accuracy for TSSP, comparison of these two indexes are done below.
The formula of OCA can be expressed as below:
O C A = T S + T U N = N s N × T S R + N u N × T U R
where Ns, Nu, and N are the sample number of stable class, the sample number of unstable class and total sample number, respectively.
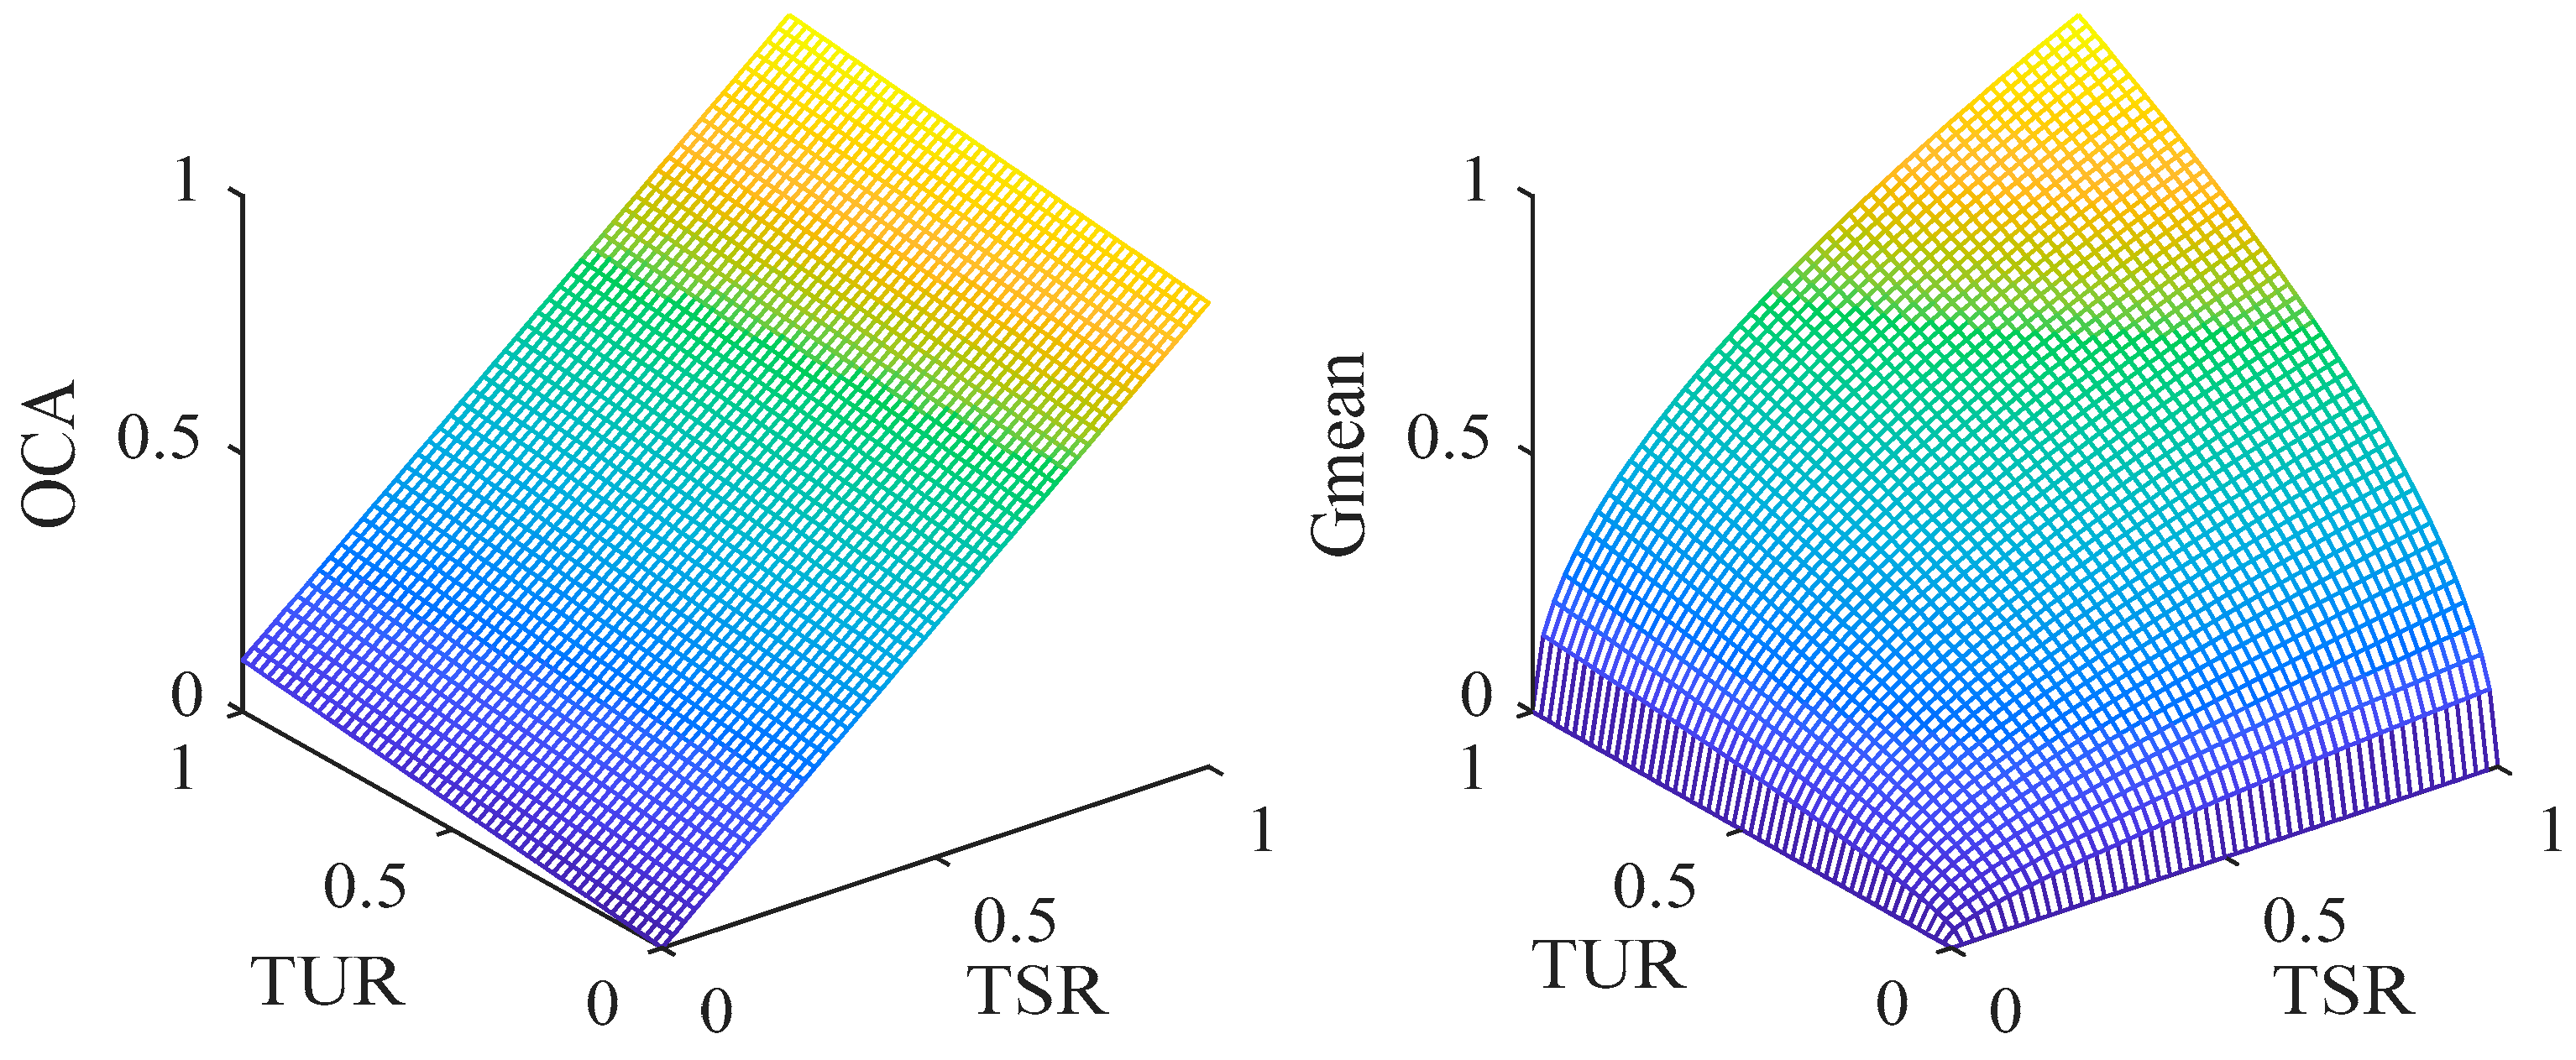
The OCA index can be considered as the linear weighting of TSR and TUR, and the weight factor is related to the sample number of stable class and unstable class. Assuming that the sample number ratio of stable class and unstable class is 9:1, the comparison of OCA and Gmean is shown in Figure 3.
It can be seen from the Figure 3 that OCA is biased toward stable class classification performance, which has more samples, and Gmean is not biased towards the classification performance of stable class and unstable class since it is independent of the sample number. Specifically, when TUR is 0 and TSR is 1, OCA is about 90%, but Gmean is 0. Therefore, Gmean is more suitable for evaluating TSSP classification performance than OCA.
Considering both the TSSP classification performance and the number of features, the Gmean-based fitness function is defined below:
F i t n e s s = G m e a n λ N C N F
where NC is the number of selected features and NF is the total number of features. λ is the weight factor to balance these two terms, which is very small to ensure that the classification performance is more important than feature subset length.

3. Data Preparation

3.1. Initial Feature Set

The initial feature set considers the electrical variables closely related to the power system transient stability characteristics, including power flow characteristics before fault occurrence and generator response characteristics after fault occurrence. The former contains load level, generator active power output, and bus voltage level, and the latter includes imbalanced active power, rotor angle, angular velocity, angular acceleration, and kinetic energy [24,25,26].
In addition, from the aspects of system-level and single-machine level, the initial feature set is going to describe the overall and the partial transient characteristics of the power system. Among them, the system-level features are the statistical values of electrical variables, including extreme value difference, mean absolute value and variance value. The single-machine level features are the electrical variables of each generator. The constructed initial feature set is shown in Table 2. It is worth noting that the rotor angle, angular velocity, and angular acceleration in the feature set are converted to the values relative to the center of inertia.
In Table 2, t0, tf, and tc indicate before fault occurrence time, fault occurrence time, and fault clearing time, respectively. The initial feature set contains 30-dimensional system level features and 5ng-dimensional single-machine level features, where ng is the number of generators. The total feature dimension is related to the number of system generators, which means that the size of the power grid directly affects the number of feature dimensions, and the larger the number of generators is, the higher the total feature dimension will be.

3.2. Database Generation

In order to generate a typical and statistical database, large numbers of power system operating conditions (OCs) should be generated by adding random disturbances on the basic power flow [6,27]. The active power and reactive power of load buses are varied randomly within ±20% of the basic value, as shown below:
P L i = P L i 0 [ 1 + Δ P L ( 1 2 r 6 ) ]
Q L i = Q L i 0 [ 1 + Δ Q L ( 1 2 r 7 ) ]
where PLi and QLi are generated active power and reactive power of load i, respectively. PLi0 and QLi0 are basic value of active power and reactive power of load i, respectively. ΔPL and ΔQL are both set at 20%.
Without considering slack bus, the active power and terminal voltage of generator buses are varied randomly within ±20% and ±2% of the basic value, respectively.
P G i = P G i 0 [ 1 + Δ P G ( 1 2 r 8 ) ]
V G i = V G i 0 [ 1 + Δ V G ( 1 2 r 9 ) ]
where PGi and VGi are generated active power and terminal voltage of generator i, respectively. PGi0 and VGi0 are the basic value of active power and terminal voltage of generator i, respectively. ΔPG is 20% and ΔVG is 2%. r6-r9 are all random numbers uniformly distributed between [0, 1].
In order to ensure the convergence and availability of randomly generated OC, power flow results needed to be checked. If the power flow converges and all electrical variables are within the normal range, the OC is retained, otherwise it is discarded.
Fault conditions should be provided before time domain simulation. In this paper, the fault type is considered as three-phase permanent short-circuit, and fault duration time is set to 0.12 s. The end of one transmission line is randomly selected as the fault location. Time domain simulation is executed with the available OC and the fault condition, and power flow results and generator response curves are collected to construct the initial feature set. The stability status is determined by the following index:
σ = 360 Δ δ max 360 + Δ δ max
where Δδmax is the maximum rotor angle deviation at the end of simulation time. If σ < 0, the system is deemed transiently unstable, and the class label is set at 1, otherwise, the system remains stable and the class label is set at 0. The features and corresponding class labels are utilized to form a sample.
The above process is repeated until a predefined number of samples are generated.

4. Proposed Two-Stage Feature Selection Method

In this section, two-stage feature selection method for the TSSP problem is proposed, which is described briefly below.
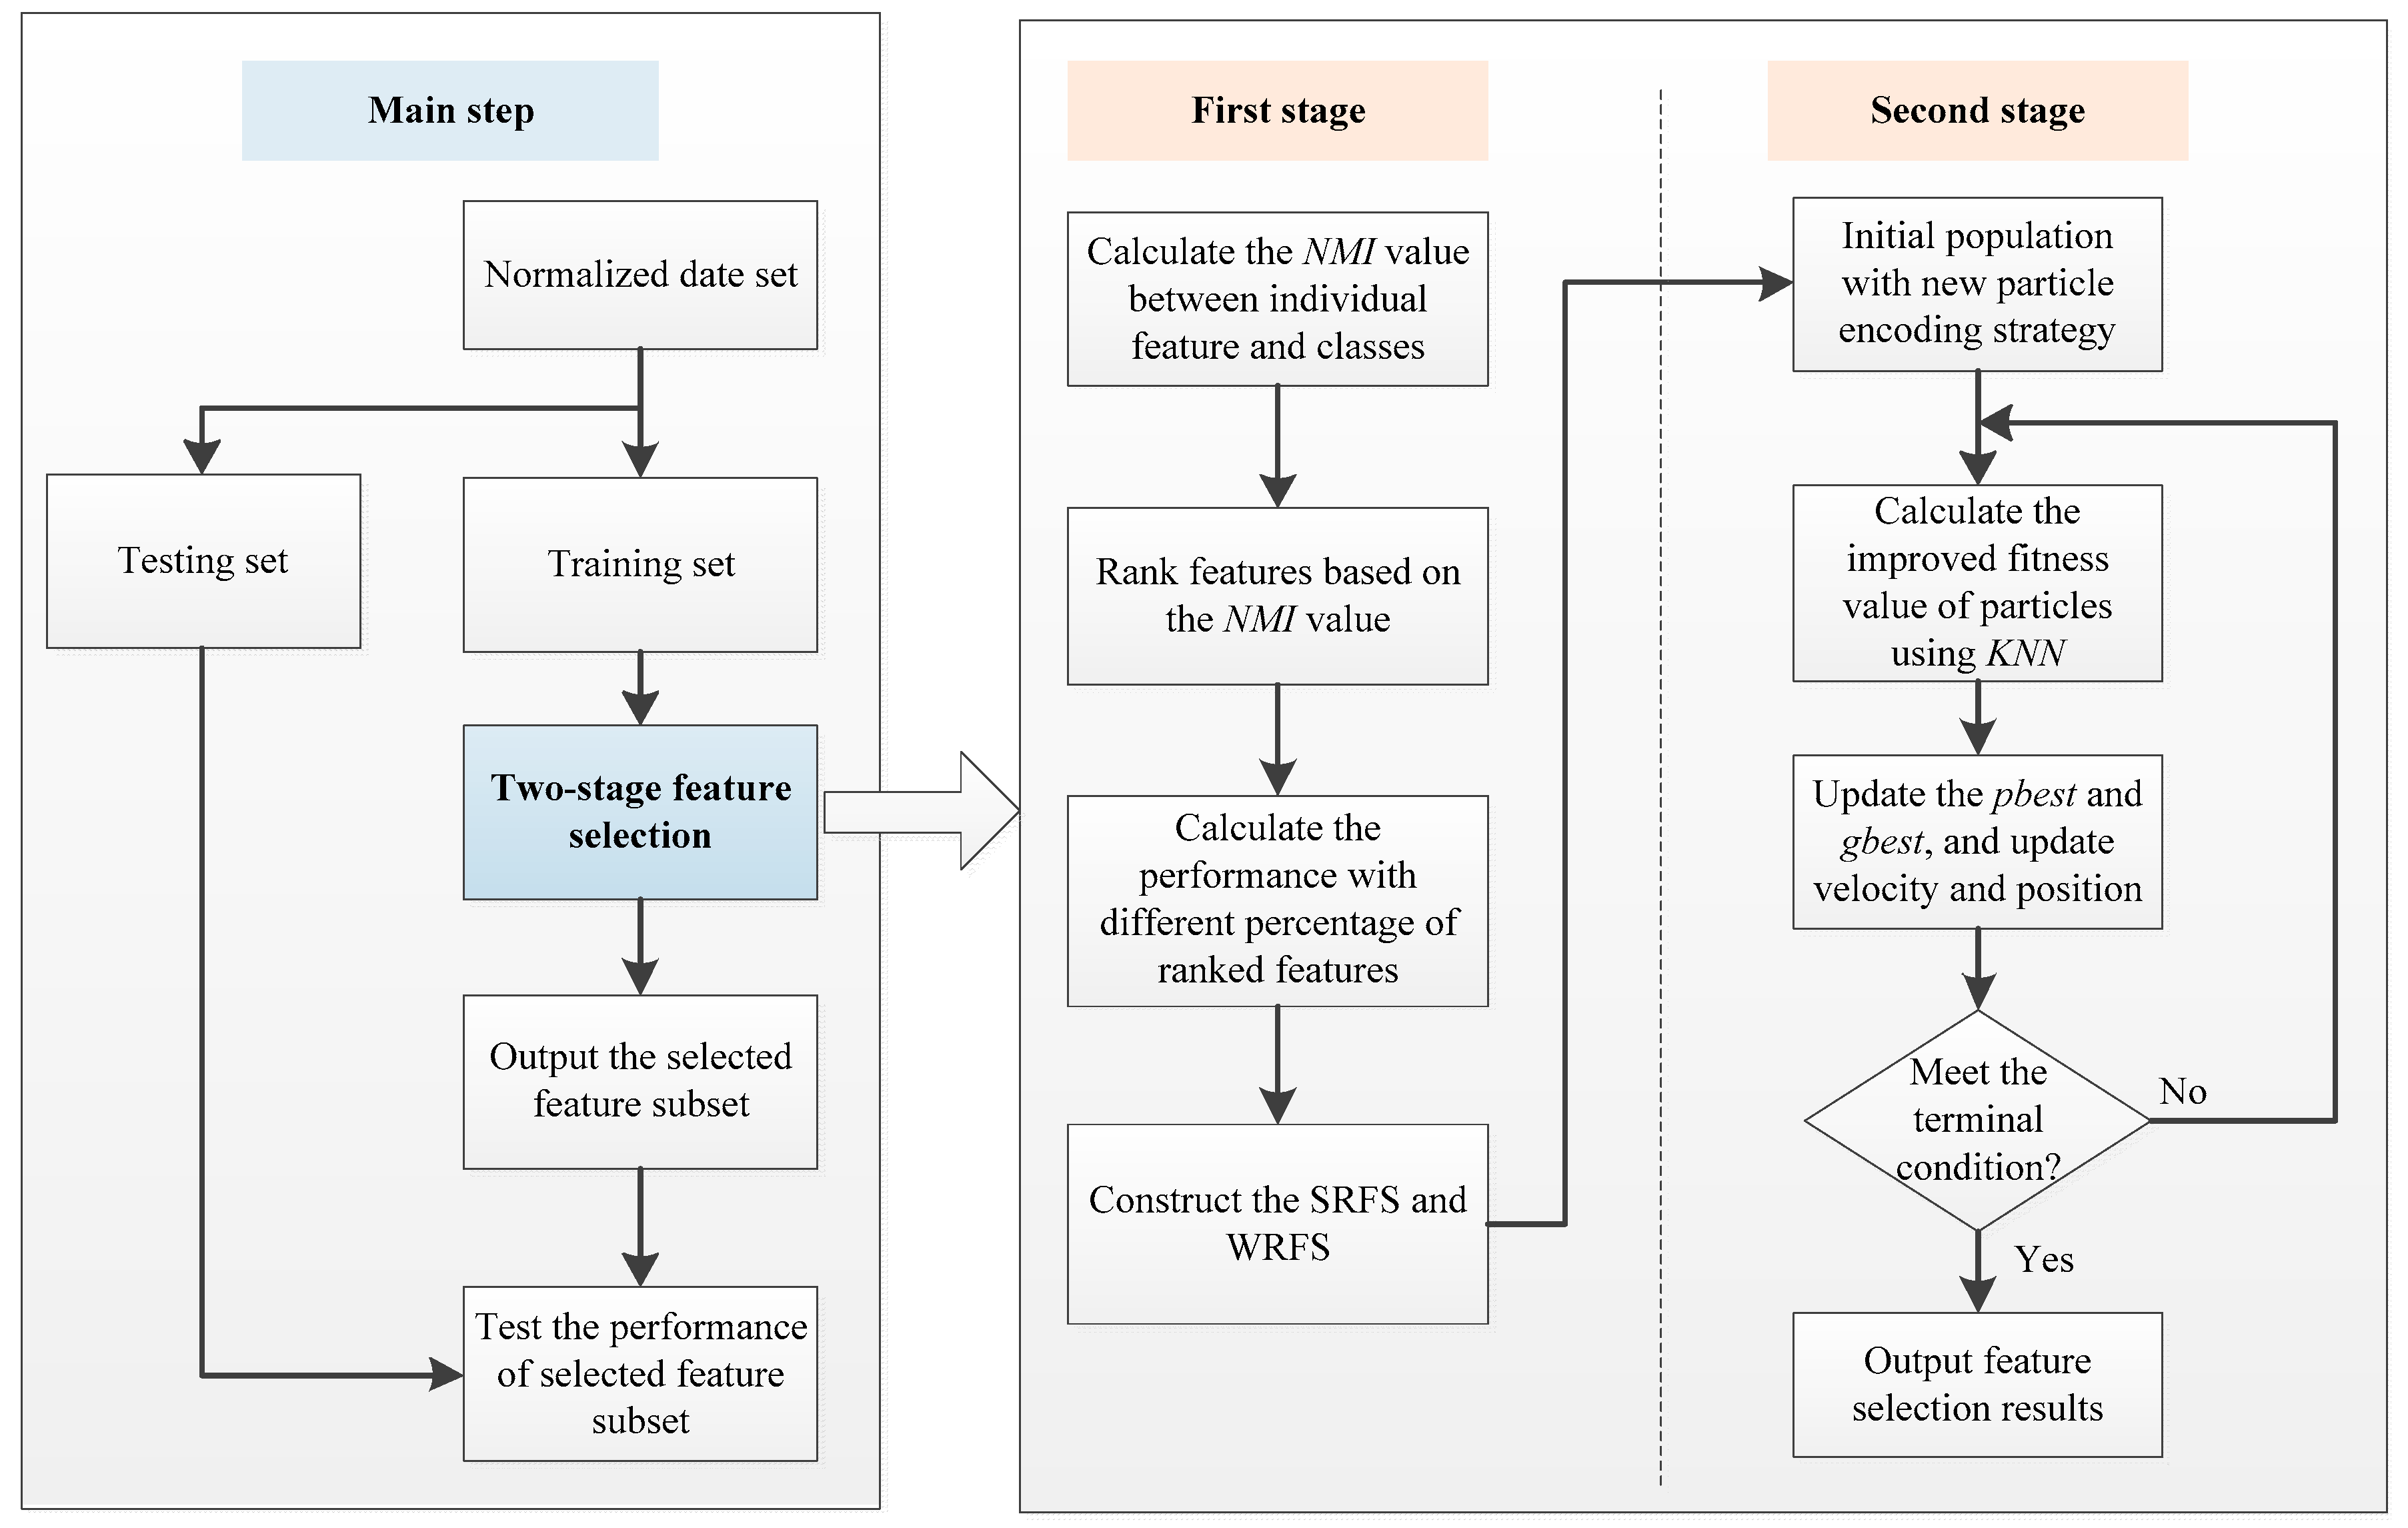
The collected data is normalized and randomly divided into training set and testing set. The training set is employed for feature selection and the testing set is utilized to check the quality of the selected feature subset.
In the first stage, the NMI value is calculated with the training set and utilized for measuring the relevance between features and classes, and the features are ranked from large to small based on the NMI values. Then, the classification performance of the ranked features is calculated by using the KNN model to determine the SRFS and WRFS.
In the second stage, the population of BPSO is initialized with the new particle encoding strategy, and the improved fitness value of the particle is calculated with KNN. The values of individual best position and global best position are updated, and the velocity and binary position of particles are updated. The above process is repeated until the terminal condition is met.
After finishing the feature selection process, the classification performance of the selected feature subset is calculated on the testing set.
The flowchart of the proposed two-stage feature selection method is depicted in Figure 4.

5. Case Study

5.1. Basic Description

The proposed methodology is examined on the NPCC 140-bus system including 48 generators and 140 buses, which represents the backbone transmission of the Northeast region of the U.S. Eastern Interconnection power grid [28]. In addition, since the number of generators in this power system is 48, the dimension of the initial feature set is 270. To examine the proposed model on the test system, 8000 samples are generated by time-domain simulations utilizing the scheme in Section 3.2. Randomly, 70% of total samples are selected as the training set, and the remaining 30% are the testing set. Furthermore, 25% of the training set is randomly allocated as the validation set. The detailed description of sample sets is tabulated in Table 3.
It can be observed from Table 3 that the sample number ratio of unstable class and stable class is about 1:5, showing apparent imbalanced characteristics between classes.

5.2. Parameter Setting

5.2.1. Construction of Strongly Relevant Feature Subset (SRFS) and Weakly Relevant Feature Subset (WRFS)

The individual feature ranking results based on the NMI values are shown in Figure 5a. Furthermore, different percentages of top-ranked features are respectively selected as the input features of KNN. The classification performance of these feature subsets with the training data is presented in Figure 5b.
It can be observed that the best Gmean value can be achieved when the top 30% of ranked features are input features. Therefore, in this study, the top 30% of ranked features are selected as SRFS, and the remaining features are recognized as WRFS.

5.2.2. Other Parameters

The main BPSO parameters utilized in the second stage are given in Table 4.
KNN with k = 1 [29,30] is employed as the classification model to evaluate the performance of the feature subset. In addition, considering the randomness of the proposed method, ten trials of repeated experiments on the same training and testing set are conducted to obtain the representative results.
In addition, in order to determine the value of pm, the performance with different pm values, including {0.6, 0.7, 0.8, 0.9, 1}, is evaluated on the training set. The results are shown in Table 5.
It can be seen from Table 5 that when pm value is set to 0.9, the best performance is achieved, and pn value is equal to 0.1.

5.3. Comparison of Different Particle Encoding Strategies

Under different particle encoding strategies, the best and average convergence curves on the training set are compared, respectively, as depicted in Figure 6.
From Figure 6, compared with the traditional completely random particle encoding strategy, the new particle encoding strategy that considers the prior knowledge has better initial solution and convergence characteristics.
Under different strategies, the best and average classification results on the testing set are compared, respectively, as presented in Table 6.
In Table 6, the classification performance of the new strategy is superior to the traditional strategy, both in best results and average results. At the same time, the number of selected features of the new strategy is less than that of the traditional strategy. The results illustrate that the new particle encoding strategy proposed in this paper is more effective than the traditional strategy.

5.4. Comparison of Different Fitness Functions

To verify the effectiveness of the improved fitness function, the average results of the OCA-based fitness function and Gmean-based fitness functions are compared on the training set and the testing set, as shown in Table 7.
As seen in Table 7, compared with the OCA-based fitness function, the Gmean-based fitness function achieves better performance on TUR and Gmean on the training set and the testing set. It shows that the Gmean-based fitness function is inclined to select the feature subset having stronger recognition ability for the unstable class, which is more suitable for actual power system TSSP problem.

5.5. Comparison with Other Feature Selection Methods

In this section, some state-of-the-art feature selection methods, including Fisher Score, Relief, NMI, and BPSO, are employed with the same database. The average results comparison of these methods are presented in Table 8.
As seen in Table 8, compared with other feature selection methods, the proposed two-stage method achieves significantly better performance results in terms of TUR and Gmean, and similar results in TSR, which indicates that the proposed method is a better solution for TSSP feature selection.
The running time of different feature selection methods are compared in Table 9. The experiments are performed in a MATLAB (R2017b) environment, running on a personal computer with an Intel core i5-6200 CPU processor with 2.3 GHz and 4 GB memory.
As seen in Table 9, since Fisher Score, Relief, and NMI belong to the filter method, they are computationally efficient. BPSO belongs to the wrapper method, and it needs longer running time than the filter methods. The proposed method belongs to the hybrid method combining the filter method and the wrapper method, therefore, its running time is almost the same as that of BPSO.
It is worth noting that the feature selection process of TSSP is done offline, so the relatively larger running time is acceptable. In addition, other techniques, such as parallel computation, can be employed to reduce the running time of the proposed method.

6. Conclusions

This paper proposed a new two-stage feature selection algorithm for TSSP. In the first stage, all the features are divided into SRFS and WRFS based on the NMI values, and in the second stage, a new particle encoding strategy considering both population diversity and prior knowledge is presented. Additionally, considering the imbalanced characteristics of TSSP, an improved fitness function is utilized. The following conclusions can be made from experimental results: (1) compared with the traditional completely random particle encoding method, the proposed particle encoding method can obtain better feature selection results, (2) compared with the OCA-based fitness function, the proposed Gmean-based fitness function tends to select the feature subset having stronger recognition ability for unstable class, and (3) compared with some state-of-the-art feature selection methods, the proposed two-stage feature selection achieves significantly better performance results in terms of TUR and Gmean, and similar results in TSR, which shows that the proposed feature selection method is more suitable for actual power system TSSP problem.
Future work will focus on the improvement of classification model to better handle the imbalanced characteristics of power system TSSP problem.

Author Contributions

Z.C. and X.H. developed the idea of this research and performed simulation verification; C.F. collected and processed the data; Z.C. and T.Z. wrote this paper; S.M. checked and polished this paper.

Funding

This research received no external funding.

Conflicts of Interest

The authors declare no conflict of interest.

References

  1. Kundur, P.; Paserba, J.; Ajjarapu, V.; Andersson, G.; Bose, A.; Canizares, C.; Hatziargyriou, N.; Hill, D.; Stankovic, A.; Taylor, C.; et al. Definition and classification of power system stability. IEEE Trans. Power Syst. 2004, 19, 1387–1401. [Google Scholar]
  2. Edrah, M.; Lo, K.L.; Anaya-Lara, O. Impacts of high penetration of DFIG wind turbines on rotor angle stability of power systems. IEEE Trans. Sustain. Energy 2015, 6, 759–766. [Google Scholar] [CrossRef]
  3. Kamwa, I.; Samantaray, S.R.; Joos, G. Catastrophe predictors from ensemble decision-tree learning of wide-area severity indices. IEEE Trans. Smart Grid 2010, 1, 144–158. [Google Scholar] [CrossRef]
  4. Ji, L.Y.; Wu, J.Y.; Zhou, Y.Z.; Hao, L.L. Using trajectory clusters to define the most relevant features for transient stability prediction based on machine learning method. Energies 2016, 9, 898. [Google Scholar] [CrossRef]
  5. Li, Y.; Yang, Z. Application of EOS-ELM with binary jaya-based feature selection to real-time transient stability assessment using PMU data. IEEE Access 2017, 5, 23092–23101. [Google Scholar] [CrossRef]
  6. Zhou, Y.Z.; Wu, J.Y.; Ji, L.Y.; Yu, Z.H.; Lin, K.J.; Hao, L.L. Transient stability preventive control of power systems using chaotic particle swarm optimization combined with two-stage support vector machine. Electr. Power Syst. Res. 2018, 155, 111–120. [Google Scholar] [CrossRef]
  7. Jensen, C.A.; El-Sharkawi, M.A.; Marks, R.J. Power system security assessment using neural networks: Feature selection using fisher discrimination. IEEE Trans. Power Syst. 2001, 16, 757–763. [Google Scholar] [CrossRef]
  8. Xu, Y.; Dong, Z.Y.; Meng, K.; Zhang, R.; Wong, K.P. Real-time transient stability assessment model using extreme learning machine. IET Gener. Transm. Distrib. 2011, 5, 314–322. [Google Scholar] [CrossRef]
  9. Amjady, N.; Keynia, F. Day-ahead price forecasting of electricity markets by mutual information technique and cascaded neuro-evolutionary algorithm. IEEE Trans. Power Syst. 2009, 24, 306–318. [Google Scholar] [CrossRef]
  10. Śmieja, M.; Warszycki, D. Average information content maximization—a new approach for fingerprint hybridization and reduction. PLoS ONE 2016, 11, e0146666. [Google Scholar] [CrossRef]
  11. Xu, Y.; Dong, Z.Y.; Zhao, J.H.; Zhang, P.; Wong, K.P. A reliable intelligent system for real-time dynamic security assessment of power systems. IEEE Trans. Power Syst. 2012, 27, 1253–1263. [Google Scholar] [CrossRef]
  12. Li, B.Y.; Xiao, J.M.; Wang, X.H. Feature reduction for power system transient stability assessment based on neighborhood rough set and discernibility matrix. Energies 2018, 11, 185. [Google Scholar] [CrossRef]
  13. Moulin, L.S.; Alves da Silva, A.; El-Sharkawi, M.A.; Marks, R.J. Support vector machines for transient stability analysis of large-scale power systems. IEEE Trans. Power Syst. 2004, 19, 818–825. [Google Scholar] [CrossRef]
  14. Zhang, Y.D.; Wang, S.H.; Phillips, P.; Ji, G.L. Binary PSO with mutation operator for feature selection using decision tree applied to spam detection. Knowl. Based Syst. 2014, 64, 22–31. [Google Scholar] [CrossRef]
  15. Xue, B.; Zhang, M.J.; Browne, W.N.; Yao, X. A survey on evolutionary computation approaches to feature selection. IEEE Trans. Evol. Comput. 2016, 20, 606–626. [Google Scholar] [CrossRef]
  16. Battiti, R. Using mutual information for selecting features in supervised neural net learning. IEEE Trans. Neural Net. 1994, 5, 537–550. [Google Scholar] [CrossRef] [PubMed]
  17. Yao, Y.Y.; Wong, S.K.M.; Butz, C.J. On information-theoretic measures of attribute importance. In Proceedings of the Third Pacific-Asia Conference on Knowledge Discovery and Data Mining, Beijing, China, 26–28 April 1999. [Google Scholar]
  18. Kennedy, J.; Eberhart, R.C. A discrete binary version of the particle swarm algorithm. In Proceedings of the IEEE International Conference on System, Man, and Cybernetics, Orlando, FL, USA, 12–15 October 1997. [Google Scholar]
  19. Moradi, P.; Gholampour, M. A hybrid particle swarm optimization for feature subset selection by integrating a novel local search strategy. Appl. Soft Comput. 2016, 43, 117–130. [Google Scholar] [CrossRef]
  20. Mirjalili, S.; Lewis, A. S-shaped versus V-shaped transfer functions for binary particle swarm optimization. Swarm Evol. Comput. 2013, 9, 1–14. [Google Scholar] [CrossRef]
  21. Rahman, N.H.A.; Zobaa, A.F. Integrated mutation strategy with modified binary PSO algorithm for optimal PMUs placement. IEEE Trans. Ind. Inform. 2017, 13, 3124–3133. [Google Scholar] [CrossRef]
  22. Chen, Z.; Xiao, X.Y.; Li, C.S.; Zhang, Y.; Hu, Q.Q. Real-time transient stability status prediction using cost-sensitive extreme learning machine. Neural Comput. Appl. 2017, 27, 321–331. [Google Scholar] [CrossRef]
  23. He, H.B.; Garcia, E.A. Learning from imbalanced data. IEEE Trans. Knowl. Data Eng. 2009, 21, 1263–1284. [Google Scholar]
  24. Zhou, Y.Z.; Wu, J.Y.; Yu, Z.H.; Ji, L.Y.; Hao, L.L. A hierarchical method for transient stability prediction of power systems using the confidence of a SVM-based ensemble classifier. Energies 2016, 9, 778. [Google Scholar] [CrossRef]
  25. Wang, B.; Fang, B.W.; Wang, Y.J.; Liu, H.S.; Liu, Y.L. Power system transient stability assessment based on big data and the core vector machine. IEEE Trans. Smart Grid 2016, 7, 2561–2570. [Google Scholar] [CrossRef]
  26. Gu, X.P.; Li, Y.; Jia, J.H. Feature selection for transient stability assessment based on kernelized fuzzy rough sets and memetic algorithm. Int. J. Electr. Power Energy Syst. 2015, 64, 664–670. [Google Scholar] [CrossRef]
  27. Geeganage, J.; Annakkage, U.D.; Weekes, T.; Archer, B.A. Application of energy-based power system features for dynamic security assessment. IEEE Trans. Power Syst. 2015, 30, 1957–1965. [Google Scholar] [CrossRef]
  28. Ju, W.Y.; Qi, J.J.; Sun, K. Simulation and analysis of cascading failures on an NPCC power system test bed. In Proceedings of the 2015 IEEE PES General Meeting, Denver, CO, USA, 26–30 July 2015. [Google Scholar]
  29. Tran, B.; Xue, B.; Zhang, M.J. A new representation in PSO for discretisation-based feature selection. IEEE Trans. Cybern. 2018, 48, 1733–1746. [Google Scholar] [CrossRef] [PubMed]
  30. Oh, I.S.; Lee, J.S.; Moon, B.R. Hybrid genetic algorithms for feature selection. IEEE Trans. Pattern Anal. Mach. Intell. 2004, 11, 1424–1437. [Google Scholar]
Figure 1. The encoding of a particle for feature selection.
Energies 12 00689 g001
Figure 2. Flowchart of the new particle encoding strategy.
Energies 12 00689 g002
Figure 3. Comparison of overall classification accuracy (OCA) and geometric mean (Gmean).
Energies 12 00689 g003
Figure 4. Flowchart of the proposed feature selection method.
Energies 12 00689 g004
Figure 5. Feature selection results in the first stage: (a) Ranked features results; (b) Performances with different percentages of total feature.
Energies 12 00689 g005
Figure 6. Comparison of convergence curves. (a) Best convergence curves; (b) Average convergence curves.
Energies 12 00689 g006
Table 1. Confusion Matrix.
Real StatusPredicted Status
StableUnstable
stableTSFU
unstableFSTU
Table 2. Initial feature set.
Feature TypetNumberFeature Description
System level featurest0F1system load level
F2mean value of generator active power
F3mean value of bus voltage magnitude
tfF4− F6extreme value difference, mean absolute and variance of generator acceleration
F7rotor angle difference of generators with max and min rotor angular acceleration
F8− F10extreme value difference, mean absolute and variance of imbalanced active power
tcF11− F13Inertia center reference of rotor angle, angular velocity, and angular acceleration
F14− F25extreme value difference, mean absolute, variance of generator rotor angle, angular velocity, angular acceleration and kinetic energy, respectively
F26− F27rotor angle difference and angular velocity difference of generators with max and min kinetic energy
F28− F29rotor angle difference and angular velocity difference of generators with max and min angular acceleration
F30total energy adjustment of the system
Single-machine level featurestfF31F30 + ngimbalanced active power of each generator
tcF31 + ngF30 + 2ngrotor angle difference between tc and tf of each generator
F31 + 2ngF30 + 3ngangular velocity of each generator
F31 + 3ngF30 + 4ngangular acceleration of each generator
F31 + 4ngF30 + 5ngkinetic energy of each generator
Table 3. Training set and testing set.
DatasetTotal Number of SamplesNumber of Stable SamplesNumber of Unstable Samples
Training set56004625975
Testing set24001961439
Table 4. Parameter settings in the proposed method.
ParametersSettings
Population size30
Maximum iterations100
ωmax, ωmin0.9, 0.4
c1, c22, 2
λ0.002
Table 5. Performance with different pm values.
pmGmean (%)Number of Selected Features
0.691.94120.7
0.791.95115
0.892.09105.6
0.992.2593.6
192.1193.8
Table 6. Comparison of the results of different particle encoding strategies.
Performance IndexBest ResultsAverage Results
Traditional StrategyNew StrategyTraditional StrategyNew Strategy
TSR (%)96.4396.5896.2596.56
TUR (%)77.4583.1476.5682.30
Gmean (%)86.9489.6185.8489.15
Number of selected features13387129.993.6
Table 7. Comparison of the average results of different fitness functions.
Performance IndexTraining SetTesting Set
OCA-Based Fitness FunctionGmean-Based Fitness FunctionOCA-Based Fitness FunctionGmean-Based Fitness Function
TSR (%)97.9797.050.96730.9656
TUR (%)85.6587.690.80320.8230
Gmean (%)91.6092.250.88140.8915
Table 8. Comparison of the results of different feature selections.
MethodsTSR (%)TUR (%)Gmean (%)
All features96.4874.0384.51
Fisher Score96.7479.2787.57
Relief96.6373.5884.32
NMI96.3379.5087.91
BPSO96.2576.5685.84
Proposed method96.5682.3089.15
Table 9. Running time comparison.
MethodsRunning Time (s)
Fisher Score0.05
Relief70.24
NMI0.95
BPSO1501.71
Proposed method1514.92

