Data Science for Vibration Heteroscedasticity and Predictive Maintenance of Rotary Bearings


1
Institute of Manufacturing Information and Systems, National Cheng Kung University, Tainan City 701, Taiwan
2
Department of Mechanical Engineering, National Taiwan University of Science and Technology, Taipei City 10607, Taiwan
*
Author to whom correspondence should be addressed.
Energies 2019, 12(5), 801; https://doi.org/10.3390/en12050801
Submission received: 29 January 2019
/
Revised: 22 February 2019
/
Accepted: 25 February 2019
/
Published: 28 February 2019
(This article belongs to the Special Issue Advanced Manufacturing Informatics, Energy and Sustainability)
Abstract
:Electric motors are widely used in our society in applications like cars, household appliances, industrial equipment, etc. Costly failures can be avoided by establishing predictive maintenance (PdM) policies or mechanisms for the repair or replacement of the components in electric motors. One of key components in the motors are bearings, and it is critical to measure the key features of bearings to support maintenance decision. This paper proposes a data science approach with embedded statistical data mining and a machine learning algorithm to predict the remaining useful life (RUL) of the bearings in a motor. The vibration signals of the bearings are collected from the experimental platform, and fault detection devices are developed to extract the important features of bearings in time domain and frequency domain. Regression-based models are developed to predict the RUL, and weighted least squares regression (WLS) and feasible generalized least squares regression (FGLS) are used to address the heteroscedasticity problem in the vibration dataset. Support vector regression (SVR) is also applied for prediction benchmarking. Case studies show that the proposed data science approach handled large datasets with ease and predicted the RUL of the bearings with accuracy. The features extracted from time domain are more significant than those extracted from frequency domain, and they benefit engineering knowledge. According to the RUL results, the PdM policy is developed for component replacement at the right moment to avoid the catastrophic equipment failure.
1. Introduction
Electric motors, which convert electrical energy into mechanical energy, are used in pumps, compressors, gear sets, drive belts, machine tools, etc. The electricity consumption of electric motors accounts for over twenty-five percent of the global electricity use. Generally, they have about 20 years of useful life under normal usage and maintenance [1]. Over time, however, heat, vibration, torque, load, power supply, wear and pollution will shorten their lifecycles in the manufacturing process. Predictive maintenance (PdM), which monitors machinery and operations continuously, alerts management to an impending failure. Generally, motor vibration analysis and current signature analysis [2] are conducted. However, the complicated manufacturing process environment causes a higher false alarm rate because of the disturbance from the initial irregular signal and the outer noise during the detection. To address the motor monitoring and maintenance problem, the literature introduces “diagnostics” methods and “prognostics” methods [3,4]. The former identify the root cause when failures are presented in an equipment, while the latter predicts the potential failure and replaces the parts before the failure happens. In fact, prevention is better than cure. Prognostics hence health management (PHM) are obtaining a lot of attention recently, as evidenced by the literature. In particular, condition-based maintenance (CBM), which is usually applied in practice [3], consists of data collection, data processing, and maintenance decision-making [4]. In the data collection phase, a sensor collects actionable condition information from the machine or parts being monitored. The data processing phase consists of data preprocessing, feature extraction, and feature selection. The phase identifies the key parameters/variables which significantly affect the machine performance, and then develops the prediction model for prognostics analysis [5]. The maintenance decision-making phase decides whether to replace or repair the machine [6].
Studies of remaining useful life (RUL) predictions use signal data in different ways [7,8]. In [3], the features or other information in frequency domain, time domain, or time-frequency domain have been extracted to represent the health status of the components inside the equipment for RUL prediction. In [3] different mathematical models or artificial intelligence (AI) algorithms have been developed for different conditions. The taxonomies of the physical, statistical, and machine learning methods [9,10] are summarized in Figure 1.
In [3] a comprehensive review and list of the critical components of PHM with corresponding models and algorithms are provided. Jardine et al. [4] and Heng et al. [11] have reviewed machine learning and statistical techniques of PHM. Keogh et al. [12] and Fu [13] have addressed large-scale signal datasets and discussed signal processing, segmentation methods, and time series data mining techniques for dimensionality reduction. To avoid ignoring the process characteristic and the variable interpretation, this study constructs statistical regression-based models and support vector machine with the extracted features from the time domain and frequency domain. The proposed data science approach can handle large-scale raw data, identify key factors, and predict the RUL of the bearings installed in electric motors.
The remainder of this paper is organized as follows: Section 2 explains the fundamental methods and techniques. Section 3 proposes data science approach including the data collection, data preprocessing, feature extraction, feature selection and RUL prediction models. An empirical study and experiments are conducted to validate the proposed approach in Section 4. Section 5 concludes and suggests future research.
2. Fundamental Methods and Techniques
This section introduces the fundamental methods and techniques used in the study.
2.1. Sliding Window with Rolling and Tumbling Aggregates
Sliding window (SW) [14,15] is a method usually used to extract the important features (e.g., mean or extreme value) from the large-scale raw dataset (e.g. current or vibration) and reduces the data to a workable volume. The idea of SW is similar to moving average (MA). Some of the parameters used in SW can be adjusted for different datasets such as vibration, current, etc.:
- (1)
- Window size: a vector or list regarded as offsets compared to the current time.
- (2)
- Step size: moved by the step size of the number of data points rather than every point.
- (3)
- Selected statistic in the window: statistics such as mean, maximum, minimum, etc. can be calculated in the window.
In general, there are two common types of SW: tumbling aggregates and rolling aggregates. The former suggests non-overlapping between windows, i.e., window size equals the step size. The latter one suggests overlapping windows, i.e., window size is larger than the step size. Given a sequence , the new sequence can be derived by mean value:
and by extreme value:
where denotes the window size, denotes the step size, denotes the index of new sequence and and . SW can effectively reduce the large-scale signal dataset into a smaller volume (called aggregated dataset hereafter). The aggregated dataset is used in the next process.
2.2. Stepwise Regression
Stepwise regression is a variable selection technique which evaluates the subsets of variables by either adding or deleting variables one at a time according to a specific statistic (e.g., F-value) in linear regression models [16].
There are three main types of the stepwise selection methods: forward selection, backward selection, and both-sided selection. Forward selection begins with no variable in the regression model and adds one variable at a time until no more variables remain. Backward selection begins with all of the variables and removes one insignificant variable at a time until it reaches the stopping criteria. Both-sided selection integrates the forward and backward selections to obtain the balance between them [16,17].
2.3. Ordinary Least Squares (OLS) and Heteroscedasticity
OLS provides the best linear unbiased estimator (BLUE) of the coefficient estimation, given three strong assumptions (a) normality (b), homoscedasticity, and (c) serial independent. The parameter estimation method for linear regression has the following form:
where index represents time, the dataset consists of observations with independent variables, one response variable , one independent variable , the coefficient of independent variables, and the error term .
The vibration signals violate the homoscedasticity assumption since the amplitude exponentially grows when the bearing wears over time. Theoretically, the homoscedasticity can be defined by simple linear regression:
If heteroscedasticity exists, the variance of the errors are not identical with respect to :
In practice, the White test is used to detect the heteroscedasticity effect. In this study weighted least squares (WLS) and feasible generalized least squares (FGLS) are used to correct heteroscedasticity.
2.3.1. Weighted Least Squares (WLS)
WLS addresses heteroscedasticity by adding the weights on each independent variables to adjust the effect of the variance. In general, we can decide the form of weights and add the pre-determined form to the linear equation. If there is heteroscedasticity, the error form can be formulated as , where denotes the variance function of the . In this way, the problem of heteroscedasticity can be accommodated by taking the root squared of on the original regression function, and the variance can finally become homoscedasticity as Equations (6) and (7).
where are the pre-determined weights used to correct the variance of errors.
2.3.2. Feasible Generalized Least Squares (FGLS)
In practice, the form of the variance function with heteroscedasticity is usually unknown, and the weights are difficult to define. FGLS estimates the best weights to address heteroscedasticity. The variance function is always positive, so the variance with heteroscedasticity can be formulated as:
where the variance function is written as an exponential function to be positive, is the intercept term of the function, and is the coefficient of . The estimated linear regression is:
The regression on the is run to estimate , and log function is used to remove the exponential term to obtain:
The term is set to be , and the regression is run to estimate , i.e., the variance function, to obtain:
Deriving obtains:
where are the estimated weights used to correct the variance of errors.
The best weights are included in WLS, i.e., FGLS, to obtain a double estimated coefficient. In this way, the heteroscedasticity problem is solved and the variance of the coefficient of independent variables is effectively reduced [18].
2.4. Partial Least Squares (PLS) Regression
PLS, which is a regression-based approach based on principal component analysis (PCA), uses a set of latent or unobserved variables to identify the relation between the principal components (PCs) and the response variable [19]. A typical PCA method transforms the original variables into several orthogonal principal components (PCs) for dimensionality reduction and eliminates the multi-collinearity problem. Instead of finding hyperplanes of maximum variance of the independent variables in PCA, PLS extracts a small number of latent variables by projecting the independent variable and the response variable to a new space simultaneously. Thus, PLS retains the merits of PCA and is not limited to uncorrelated variables like OLS. PLS handles noise and collinearity, and there is no requirement of independence between observations. PLS also models several response variables simultaneously [19].
2.5. Support Vector Regression (SVR)
SVR, which is a regression variant of support vector machine (SVM) is commonly used for prediction rather than classification [20]. SVR maps the nonlinear function with independent variables into high dimensional kernel feature space, and then constructs a linear hyperplane with the biggest margin in the kernel space. SVR, uses a new type of loss function, i.e., -insensitive loss function, to minimize the norm of the normal vector regarding the hyperplane, which reduces the complexity of the prediction model. SVR is formulated as quadratic programming:
where a pair is an observation with independent variable and response variable at period , w is the normal vector of the hyperplane, and error is a pre-determined parameter. The goal is to find a hyperplane with an appropriate deviation between the targets and predicted value [20]. Variants of SVR models with different parameters result in different tradeoffs between model complexity and degree of deviation, or choose a kernel function that best represents the distribution of the dataset.
3. Data Science
This section describes the proposed approach to extract the key features and predict the RUL of bearings. The approach includes the data collection, data preprocessing, feature extraction, feature selection and prediction models. This is as shown in Figure 2 and Figure 3. The vibration data is collected from an operational real-world induction motor. Besides to vibration signals, the proposed approach can be applied to other similar-type variables such as voltage, current, loading, speed, etc.
3.1. Experimental Platform and Data Collection
In an experimental rotary system, the facilities consist of a three-phase induction motor, tachometer, torsion meter, pump, coupling, magnetic powder brake and sensors. For RUL analysis, the motor runs and the data are collected until bearing failure through the electrical discharge fatigue destruction, which shortens the time-to-failure. The steps are as follows:
Experimental Platform and Data Collection
|
3.2. Data Preprocessing
The data collection process produces a large-scale dataset which is computationally burdensome. To reduce the volume of data and retain the characteristics of original dataset, the steps are as follows:
Data Preprocessing
|
Note that, in reality, there is probably no machine that just starts running when we are going to collect the data in a real-setting factory. The motors may have been working for a long while. To mimic the real-world condition of the system, a random interval sampling method is proposed to pick a time point and collects the data with a fixed time window during the lifetime of the system’s induction motor, which is used for RUL analysis.
3.3. Feature Extraction
As mentioned, the data with a fixed time interval are randomly sampled. Each sample size (i.e., fixed interval) equals twenty seconds of data collection. Randomly sampling the intervals establishes the uncertain time periods of the rotary motor. The features are extracted from the time domain and the frequency domain. The time domain is split into a time-series dimension (i.e., the aggregated dataset in the time domain) and a change-point dimension (i.e., the time index of the extreme values of amplitude to create the change-point dimension by piecewise linear segmentation). The details are as follows:
3.3.1. Time-series Dimension
OLS is used to identify statistical features from the random interval sampling dataset. Given is the sample standard deviation and n is the sample size. There are six statistical features:
- (1).
- mean squared error (MSE) =
- (2).
- slope = coefficient of time variable in OLS
- (3).
- intercept = coefficient in OLS
- (4).
- skewness =
- (5).
- kurtosis =
- (6).
- max = in the random interval
3.3.2. Change-point Dimension
The time index of the change-point in the time-series dimension represents the value in the change-point dimension. An illustrative example is shown in Figure 4, where the sequence {} represent the time index of the change-point. Given is the sample standard deviation and is the sample size with respect to sequence {}. There are four more features:
- (7).
- standard deviation () =
- (8).
- first point = the time index when the first change-point occurs
- (9).
- skewness =
- (10).
- kurtosis =
3.3.3. Frequency Domain
Fast Fourier Transformation (FFT), which transforms each part of the random interval, contains the amplitude (i.e., power) in the time domain that is changed into the frequency domain. In general FFT obtains the spectrum (i.e., the power in each frequency revealed by the data-point) and the corresponding frequency. The power-frequency relation of a random interval is shown in Figure 5. Feature extraction uses the corresponding frequencies of the maximum amplitude and the second strongest amplitude as the features, respectively. The first-to-fourth moments are the mean, variance, skewness and kurtosis, of the spectrum in each random time interval. The steps of the feature extraction from a random time interval sampling are as follows:
Feature Extraction
|
3.4. Feature Selection
Using the regression-based method to predict the RUL, a variance inflation factor (VIF) detects the multi-collinearity issue of the features before running a regression model [21]:
where is the coefficient of determination of the regression model using the predictor as the response variable on the remaining predictors. If VIF exceeds 10, significant multi-collinearity exists [20], and features with the least information loss need to be removed. After correcting for multi-collinearity, stepwise regression is used to obtain the features that significantly influence the RUL (i.e., selected features hereafter) and to remove the less important ones.
3.5. Model Adjustment and Prediction
Based on the significant features obtained from random interval sampling, the prediction models are applied to identify unstable signals and predict the RUL of the motor’s bearings and other components. The OLS model is applied first. The basic concept of OLS is to minimize the sum of squares error, but the error should follow assumptions such as normality, homoscedasticity and independence. If heteroscedasticity is detected by the White test, WLS is applied to eliminate the effect and correct the variances of the coefficient of independent variables (i.e., selected features). If the weights are unknown, FGLS is used to find the proper weights. For comparison of prediction accuracy, we also suggest PLS and SVR. The procedure is as follows:
Model Adjustment and Prediction
|
4. Empirical Study and Experiments
An empirical study of the accelerated electrical discharge destruction experiment is conducted to validate the proposed approach. The data and signals are collected from four accelerometers, three-phase voltage, three-phase current, a rotary encoder, and a torque meter. The data collection interval is 10 min for each twenty-second time span. The rotation speed is 30 Hz (1800 rpm).
4.1. Data collection and data preprocessing
The experiment data are collected from the facilities and Labview program of a queued message handler (QMH) structure. The SW algorithm is used to reduce the raw data in the very large dataset (see Figure 6), while maintaining the characteristics of the raw data with sufficient information. The aggregated dataset is shown in Figure 7.
Some of the findings and the data source (see Table 1) are as follows:
- The sensors recorded the data at 25,600 data-points per second.
- Redundant information was removed and the data files were compiled into one large data table.
Setting in SW: window size = 853, step size = the moving window for the tumbling aggregates or rolling aggregates for the overlapping windows, and selected statistic = the maximum in each window. The transformation formula to determine the parameters of the window size and step size in the SW algorithm are summarized in Table 2.
4.2. Feature Extraction
The three dimensions to extract the features (i.e., time-series dimension (including MSE, slope, intercept, skewness, kurtosis, maximum value), change-point dimension (including standard deviation of the locations of change-points, the location when the first change-point occurs (first-point), and the skewness and kurtosis of the locations of the change-point), and frequency dimension (the maximum and the second strong amplitude, Ampl1, Ampl2, and their corresponding frequency, Ampl1-freq, Ampl2-freq, and the first to fourth moments, which are mean, variance, skewness, and kurtosis, of the spectrum in each random time interval) are shown in Table 3. A total of eighteen features were collected from these dimensions.
4.3. Feature Selection
By using VIF to address multi-collinearity, “Mse.ts”, “Intercept.ts”, “First-point.cp”, “Ampl1.f”, “Ampl-mean.f” and “Ampl-Kurtosis.f” were removed because of their high correlation with the other features. Stepwise regression, which was used to select the statistically significant features affecting RUL via both-sided selection, identified “Kurtosis.ts”, “Max.ts”, “Ampl1-freq.f”, “Ampl2.f” and “Ampl2-freq.f”. Table 4 shows the result of feature selection. The significant coefficients of the selected features are shown in Table 5. Take “Max.ts” as an example, when the maximal value in the sampling interval increases one unit, the RUL will reduce 46856.5 units because the coefficient of the estimate value is negative. In particular, the features “Kurtosis.ts” and “Max.ts” in time domain are more significant than the features extracted from frequency domain. This result provides insights to engineering knowledge and justifies the importance of time domain which gets less attention than frequency domain in the signal analysis.
4.4. Model Adjustment and Prediction
To investigate the heteroscedasticity issue, the White test is applied and the p-value is 1.899 × 10⁻¹⁰ (<0.05). It rejects the homoscedasticity assumption. WLS or FGLS regression models are used to adjust the influence of heteroscedasticity (non-constant variances) caused by the differences in the amplitude of the bearing signals. Higher variance terms are given lower weights to reduce their influence on the fitted value. When nothing is known about the variance of the residuals, the weights are estimated first, and then added into the original OLS model, which is called FGLS regression.
First, the FGLS is compared to OLS. We focus on the coefficient estimate and its interpretation. Second, to ensure the prediction models’ robustness, the aggregated dataset is divided into ten sub-datasets and 10-fold cross validation (i.e., K = 10) is implemented. As an example, nine of ten folds are used as the training dataset and the remaining fold as the testing dataset. The procedure repeats until every fold is taken as the testing dataset.
4.5. Prediction Result and Comparison
4.5.1. OLS & FGLS
The coefficient estimation of the selected features by OLS and FGLS with respect to the first testing dataset (k=1), are shown in Table 6 and Table 7, respectively. FGLS adjusts and reduces the variance of the coefficient (the coefficient of standard error is lower than the OLS estimate), which implies a robust estimation. In particular, the FGLS model adds lower weights on the higher variance to reduce the effect. Thus, the standard error of this coefficient estimate is reduced. For the slope interpretation, using the feature “Max.ts” as an example, the FGLS coefficient estimate -40658.3 implies that increasing one unit of the maximal value of amplitude in the sampling interval decreases the RUL by -40,658.3 points in the aggregated data, which is nearly 11.2 h of lifetime reduction. In practice, regression-based approach provides excellent causal interpretation, and thus engineer can refer to the selected features and make the maintenance decision (i.e., PdM).
The dataset is split into training and testing sets, and the 10-fold cross validation (CV) of OLS and FGLS is conducted. The prediction results are shown in Table 8 and Table 9. While the prediction performance of OLS appears “better” than the prediction performance of FGLS, the presence of heteroscedasticity defeats the underlying assumptions of OLS.
The prediction results of OLS and FGLS with the real value and the fitted value are shown in Figure 8 and Figure 9, respectively. The x-axis is the ordered sample index by the time, and the y-axis represents the RUL prediction. The intervals of each ordered index on the x-axis may not be equal because of random interval sampling.
Generally, the prediction values of the RUL by FGLS are lower than OLS. The underestimated RUL by FGLS, implies the possibility of an early warning signal prior to actual machine fatigue or failure, and thus it may increase the maintenance cost for bearing replacement. In both figures, though it is still BLUE (but not efficient), the OLS estimate is no longer a robust estimate and shows the worsening performance in the later stage because of heteroscedasticity. FGLS corrects the irregular variances by estimating the parameters twice to obtain the proper weights for adjusting the variances, though its estimate is biased (but efficient). The results should be interpreted with care so that maintenance is not postponed.
In addition, both FGLS and OLS underestimate RUL in the early stage of the data. In practice, poor prediction results are common at the early stages, because machines operate erratically (We generally collect data when the motors have been working for a long while). Though FGLS underestimates the RUL more in the beginning, OLS becomes overestimate later, which will delay warning (called type-II error) and may cause a catastrophic failure. The result claim that FGLS provides a more conservative and secure decision; however, OLS may overestimate the RUL and postponing the timing for equipment maintenance may lead to equipment failure, serious capacity loss, or defects. Therefore, this study suggests applying FGLS to afford the less loss than OLS.
Although FGLS appears to provide a better result its prediction performance is not good enough as shown in Table 9, and it implies model misspecification and the linear regression is not justified. To overcome the problem, PLS and SVR is suggested.
4.5.2. PLS & SVR
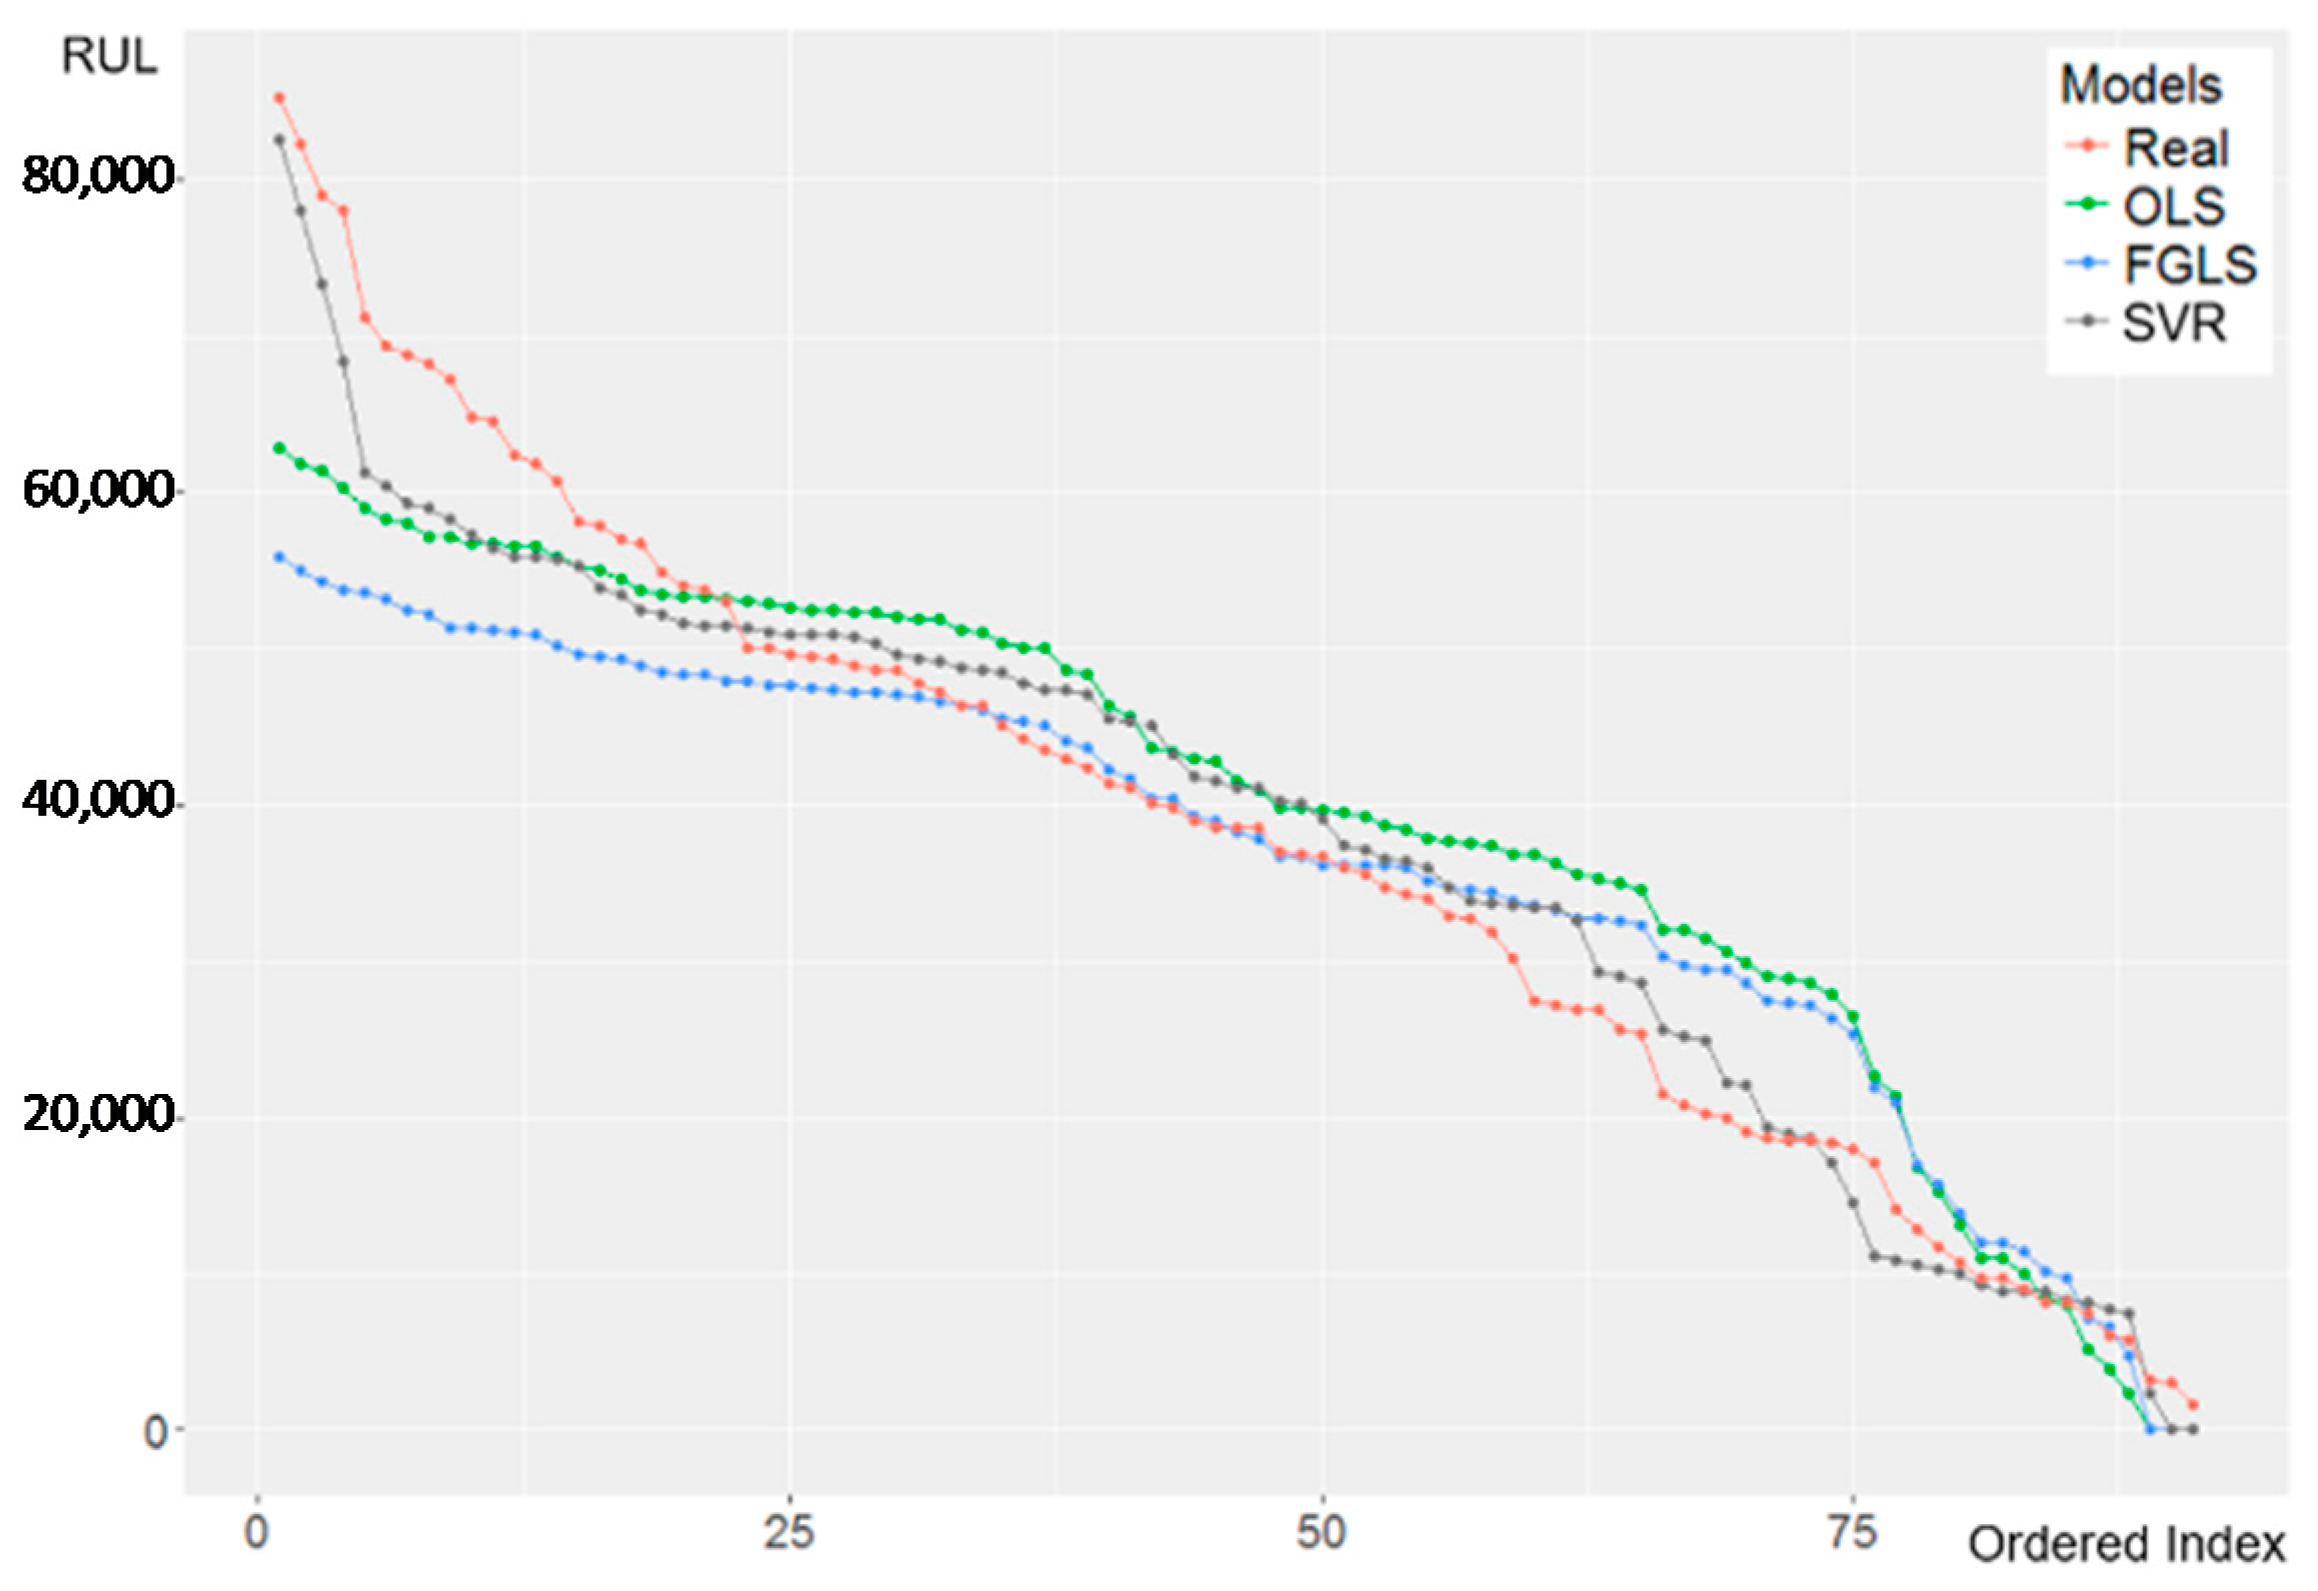
The prediction performance by SVR is shown in Figure 10 and the 10-fold CV is shown in Table 10. Unlike OLS and FGLS, SVR handles prediction bias in the early stage, thus giving a more accurate fitted result. The variance with R-squared of approximately 0.82 demonstrates its accurate prediction of RUL. Engineer or staff can make the PdM decision to maintain and repair the components of the equipment according to the result. A comparison of the prediction performances of OLS, FGLS, and SVR is shown in Figure 11.
Again, however, the results must be treated with care, because SVR maps the nonlinear function with features into high dimensional kernel feature space and the interpretation is limited. SVR needs more computation time (in this case, more than 2 h) because it is difficult to find the best or proper combination of the parameters (platform: OS Windows 7, CPU Intel Core i7-4790 CPU @ 3.60 GHz, RAM 8 GB). Note that the result of PLS for this case is neglected because the number of its components equals the number of selected features (i.e., PLS and OLS results are very similar).
5. Conclusions
This study proposed a data science approach, which improved the data preprocessing procedure, identified key features, and built several prediction models to predict the RUL. FGLS was developed to address heteroscedasticity. If RUL is long, we keep operating the equipment; otherwise, we may replace or repair the parts before equipment failure. The numerical study showed that OLS and FGLS obtained prediction results quickly, whereas SVR provided more accurate prediction value although incurring a computational burden.
The contribution of this study suggests: (1) using a sliding window algorithm to handle large-scale datasets, (2) using a random interval sampling to collect signal data at any time interval, (3) identifying significant features, (4) FGLS adequately addressing the heteroscedasticity issue commonly shown in the signal pattern of RUL, and (5) regression-based models for simple interpretation and SVR for prediction accuracy. In particular, creating features and identifying key feature is the most important step (i.e., feature engineering) for prediction model. This study identified five features “Kurtosis.ts”, “Max.ts”, “Ampl1-freq.f”, “Ampl2.f” and “Ampl2-freq.f” which significantly affect the RUL. This results benefit the maintenance decision in practice.
The research in this study should be extended to investigate RUL prediction using signals other than vibration such as current, voltage, pressure, acoustic emission, and magnetic fields. The datasets of components other than motors such as gears, shafts, pumps, or alternators also deserve attention. The research can also be applied to industries; for example, collecting real data from jet engine, diagnosing bearing faults and pre-determining failures.
Author Contributions
Conceptualization, C.-Y.L., M.-K.L. and C.-Y.L.; Data curation, M.-K.L.; Formal analysis, C.-Y.L. and T.-S.H.; Funding acquisition, C.-Y.L. and M.-K.L.; Methodology, C.-Y.L.; Resources, M.-K.L.; Supervision, C.-Y.L., M.-K.L. and C.-Y.L.; Validation, T.-S.H. and M.-K.L.; Writing – original draft, C.-Y.L. and T.-S.H.; Writing – review & editing, M.-K.L.
Funding
This research was funded by the Ministry of Science and Technology (MOST106-2628-E-006-009-MY3; MOST105-2218-E-007-027), Taiwan.
Conflicts of Interest
The authors declare no conflict of interest.
References
- U.S. Congress. Industrial Energy Use; OTA-E-198; U.S. Congress, Office of Technology Assessment: Washington, DC, USA, June 1983.
- Thomson, W.T.; Fenger, M. Current signature analysis to detect induction motor faults. IEEE Ind. Appl. Mag. 2001, 7, 26–34. [Google Scholar] [CrossRef]
- Lee, J.; Wu, F.; Zhao, W.; Ghaffari, M.; Liao, L.; Siegel, D. Prognostics and health management design for rotary machinery systems—Reviews, methodology and applications. Mech. Syst. Signal Process. 2014, 42, 314–334. [Google Scholar] [CrossRef]
- Jardine, A.K.; Lin, D.; Banjevic, D. A review on machinery diagnostics and prognostics implementing condition-based maintenance. Mech. Syst. Signal Process. 2006, 20, 1483–1510. [Google Scholar] [CrossRef]
- Lee, C.Y.; Tsai, T.L. Data science framework for variable selection, metrology prediction, and process control in TFT-LCD manufacturing. Robot. Comput. Integr. Manuf. 2019, 55, 76–87. [Google Scholar] [CrossRef]
- Susto, G.A.; Schirru, A.; Pampuri, S.; McLoone, S.; Beghi, A. Machine learning for predictive maintenance: A multiple classifier approach. IEEE Trans. Ind. Inform. 2015, 11, 812–820. [Google Scholar] [CrossRef]
- Si, X.S.; Wang, W.; Hu, C.H.; Zhou, D.H. Remaining useful life estimation–a review on the statistical data driven approaches. Eur. J. Oper. Res. 2011, 213, 1–14. [Google Scholar] [CrossRef]
- Yang, H.; Mathew, J.; Ma, L. Vibration Feature Extraction Techniques for Fault Diagnosis of Rotating Machinery: A Literature Survey. In Proceedings of the Asia-Pacific Vibration Conference, Gold Coast, Australia, 12–14 November 2003. [Google Scholar]
- Susto, G.A.; Schirru, A.; Pampuri, S.; Beghi, A.; De Nicolao, G. A hidden-Gamma model-based filtering and prediction approach for monotonic health factors in manufacturing. Control Eng. Pract. 2018, 74, 84–94. [Google Scholar] [CrossRef]
- Graß, A.; Beecks, C.; Soto, J.A.C. Unsupervised Anomaly Detection in Production Lines. In Machine Learning for Cyber Physical Systems. Technologien für die intelligente Automation (Technologies for Intelligent Automation); Beyerer, J., Kühnert, C., Niggemann, O., Eds.; Springer: Berlin/Heidelberg, Germnay, 2019; Volume 9. [Google Scholar]
- Heng, A.; Zhang, S.; Tan, A.C.; Mathew, J. Rotating machinery prognostics: State of the art, challenges and opportunities. Mech. Syst. Signal Process. 2009, 23, 724–739. [Google Scholar] [CrossRef]
- Keogh, E.; Chakrabarti, K.; Pazzani, M.; Mehrotra, S. Dimensionality reduction for fast similarity search in large time series databases. Knowl. Inf. Syst. 2001, 3, 263–286. [Google Scholar] [CrossRef]
- Fu, T.C. A review on time series data mining. Eng. Appl. Artif. Intell. 2011, 24, 164–181. [Google Scholar] [CrossRef]
- Bastiaans, M. On the sliding-window representation in digital signal processing. IEEE Trans. Acoust. Speechand Signal Process. 1985, 33, 868–873. [Google Scholar] [CrossRef] [Green Version]
- Malanda, A.; Rodriguez-Carreno, I.; Navallas, J.; Rodriguez-Falces, J.; Porta, S.; Gila, L. Sliding window averaging for the extraction of representative waveforms from motor unit action potential trains. Biomed. Signal Process. Control 2016, 27, 32–43. [Google Scholar] [CrossRef] [Green Version]
- Hocking, R.R. The analysis and selection of variables in linear regression. Biometrics 1976, 32, 1–49. [Google Scholar] [CrossRef]
- Lee, C.Y.; Chen, B.S. Mutually-exclusive-and-collectively-exhaustive feature selection scheme. Appl. Soft Comput. 2018, 68, 961–971. [Google Scholar] [CrossRef]
- Strutz, T. Data Fitting and Uncertainty: A Practical Introduction to Weighted Least Squares and Beyond; Vieweg and Teubner; Available online: https://www.springer.com/kr/book/9783658114558 (accessed on 27 February 2019).
- Tenenhaus, M.; Vinzi, V.E.; Chatelin, Y.M.; Lauro, C. PLS path modeling. Comput. Stat. Data Anal. 2005, 48, 159–205. [Google Scholar] [CrossRef]
- Drucker, H.; Burges, C.J.; Kaufman, L.; Smola, A.J.; Vapnik, V. Support vector regression machines. In Advances in Neural Information Processing Systems; Available online: http://papers.nips.cc/paper/1238-support-vector-regression-machines.pdf (accessed on 27 February 2019).
- O’brien, R.M. A caution regarding rules of thumb for variance inflation factors. Qual. Quant. 2007, 41, 673–690. [Google Scholar] [CrossRef]
Figure 1.
Summary of RUL prediction methods.
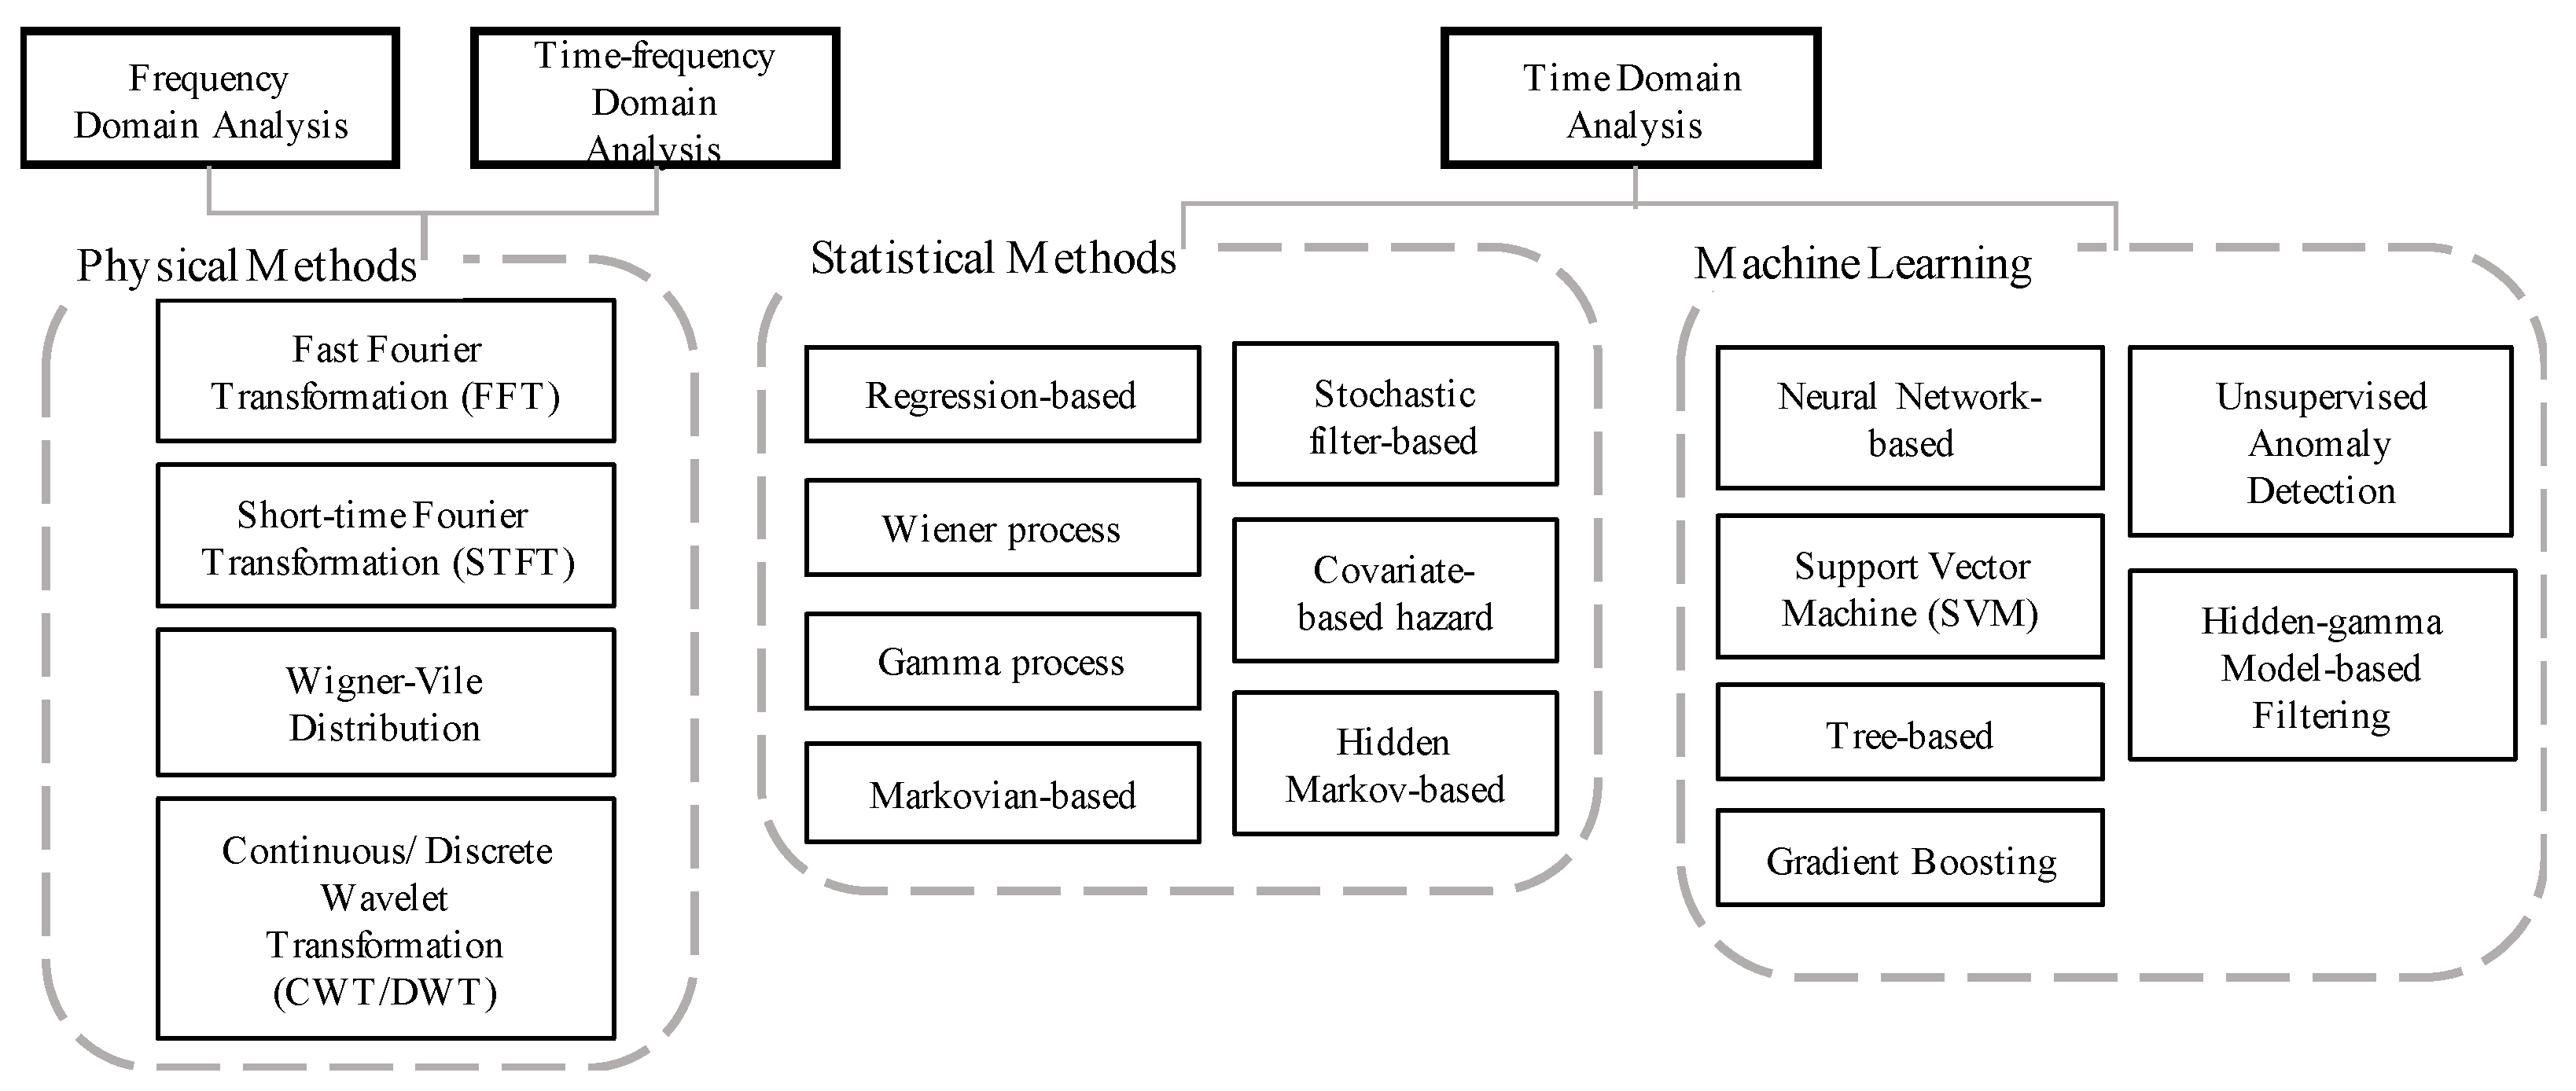
Figure 2.
Data collection and preprocessing.

Figure 3.
Feature extraction, selection and prediction.
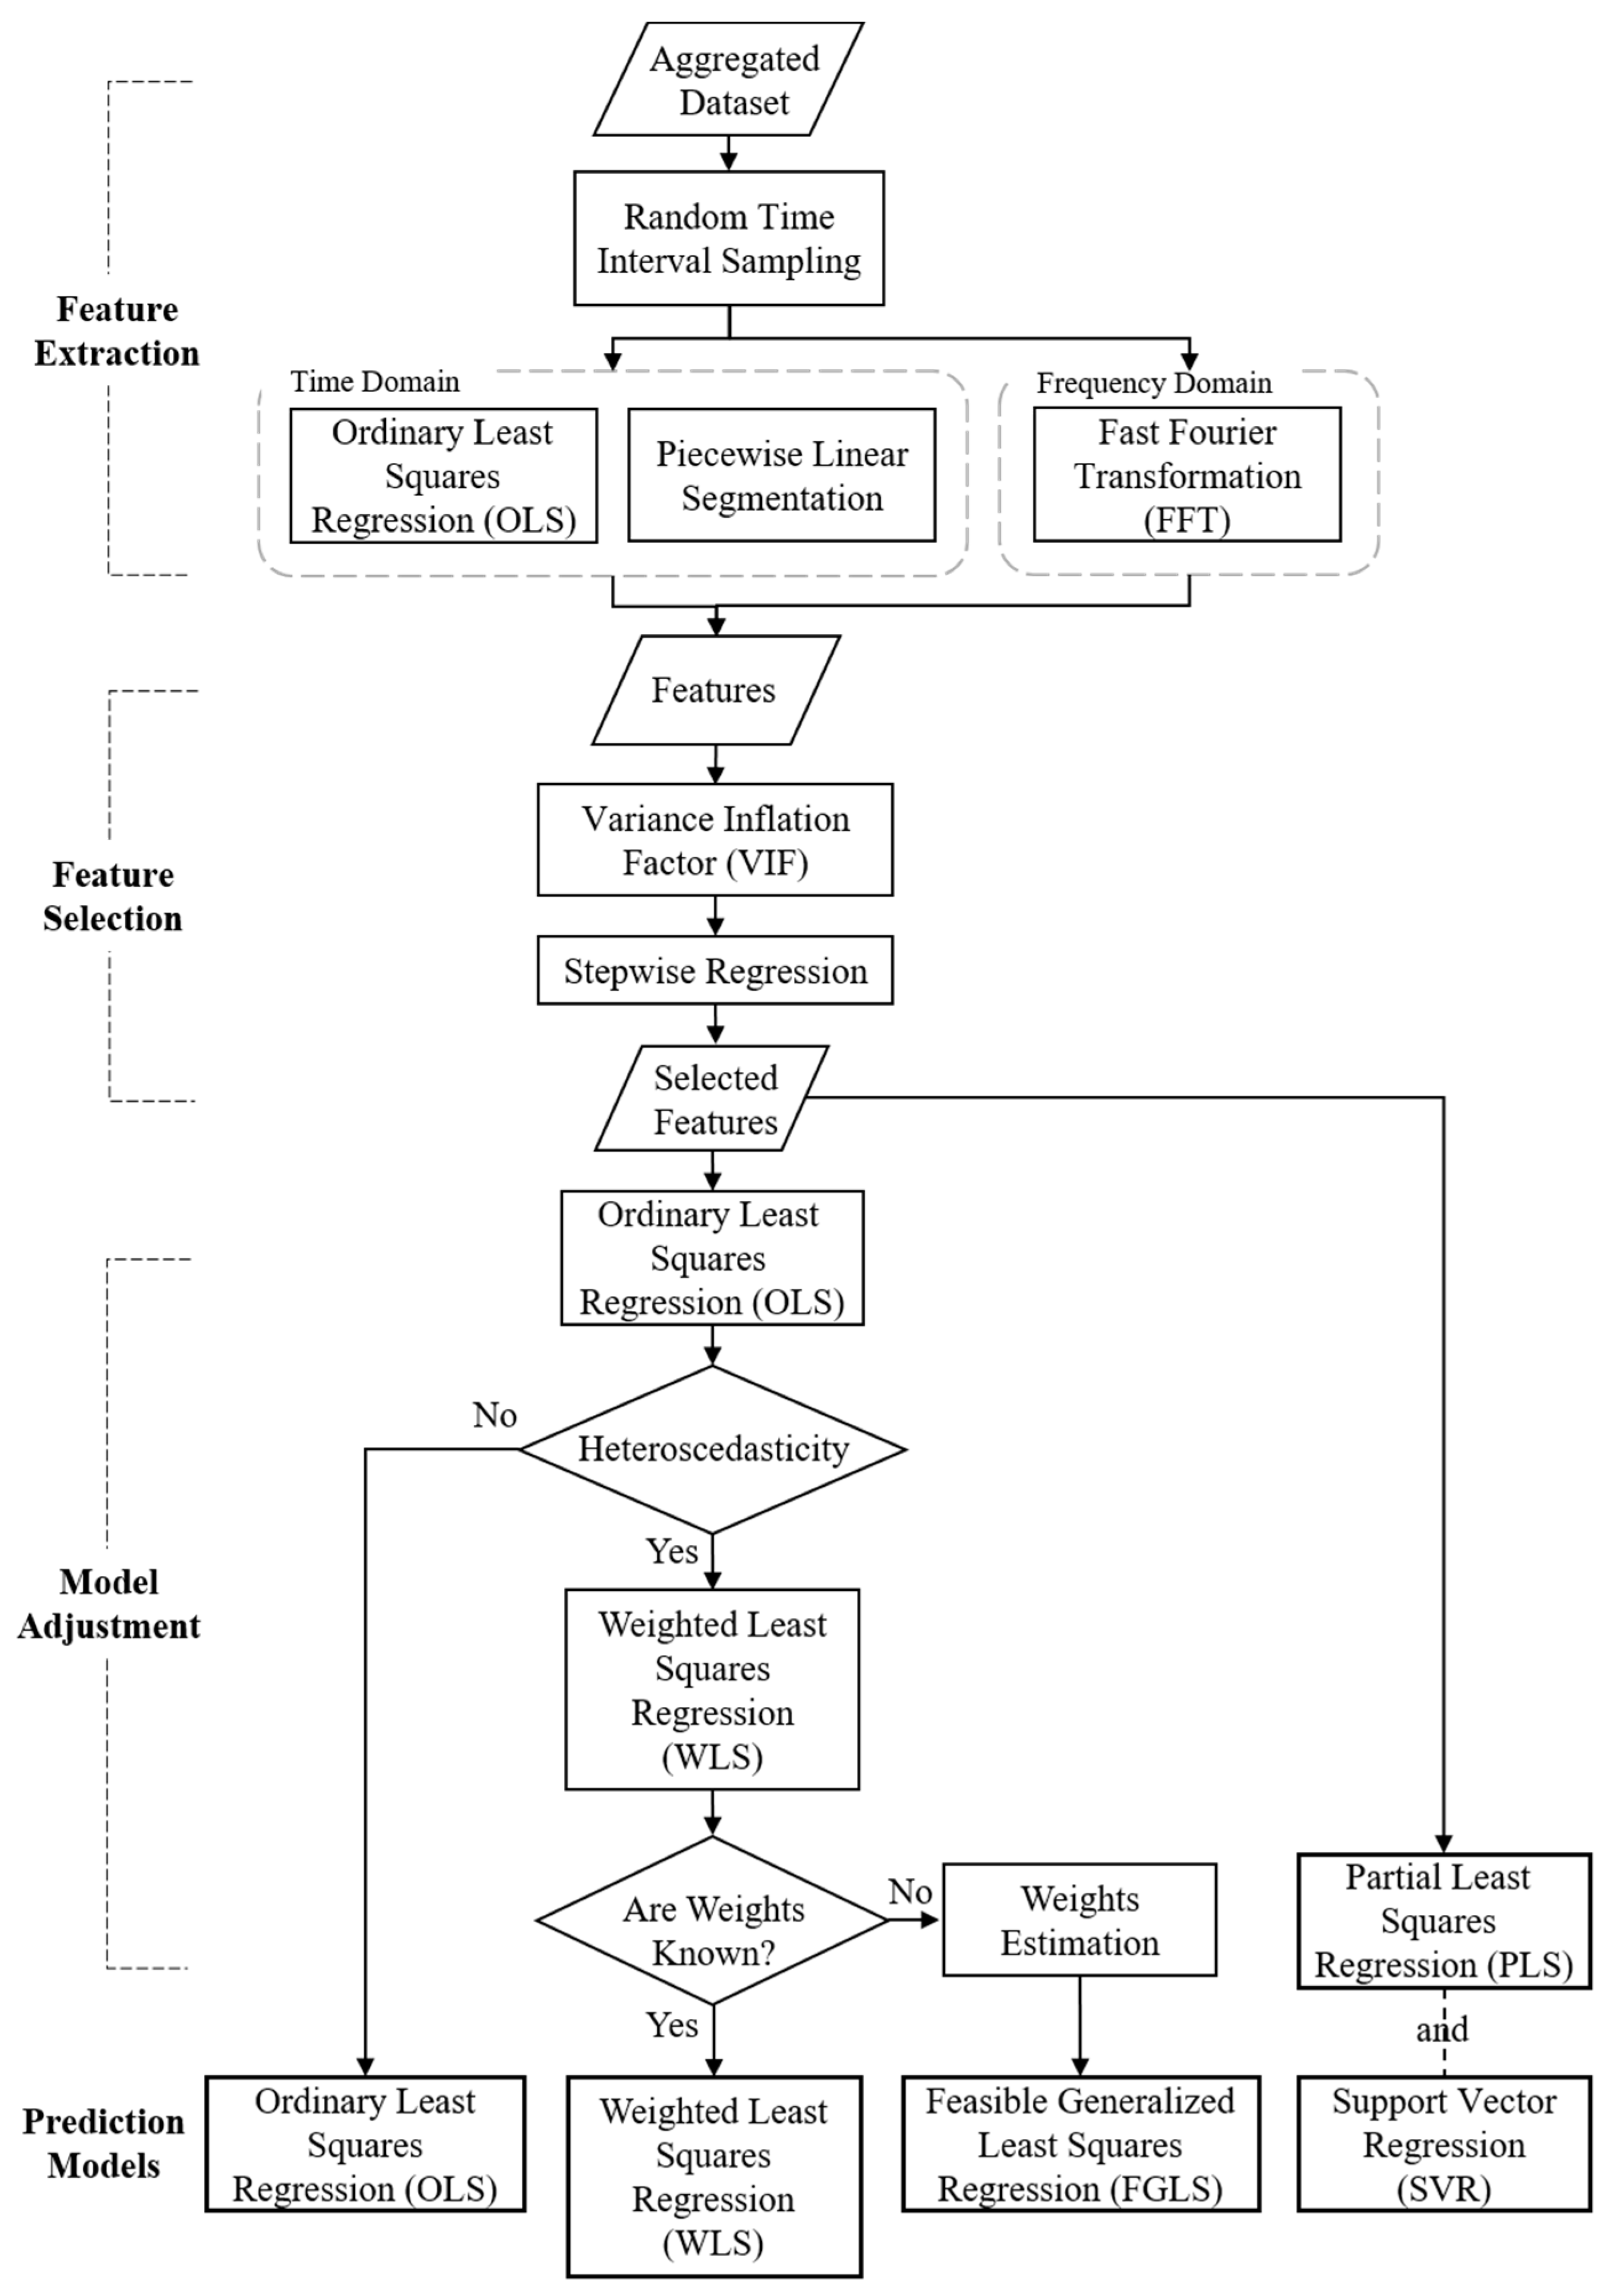
Figure 4.
Change-points identified by piecewise linear segmentation.
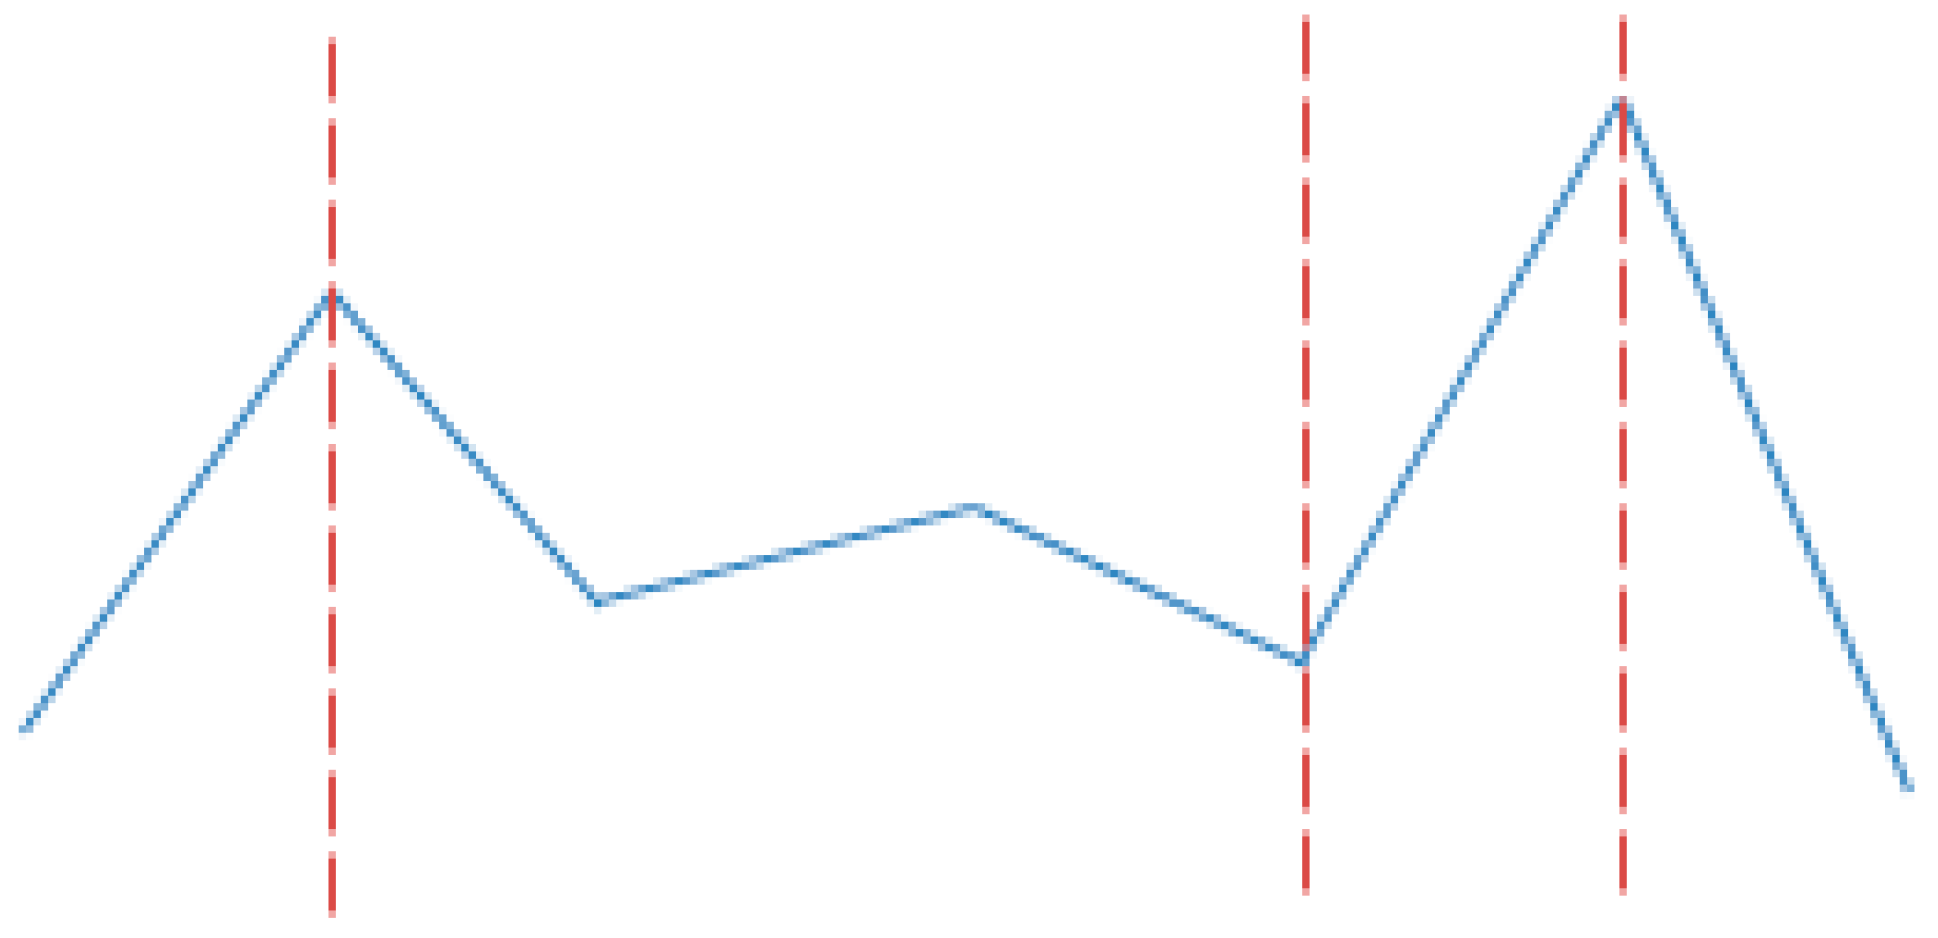
Figure 5.
Frequency Domain.

Figure 6.
Raw data.

Figure 7.
Aggregated data.
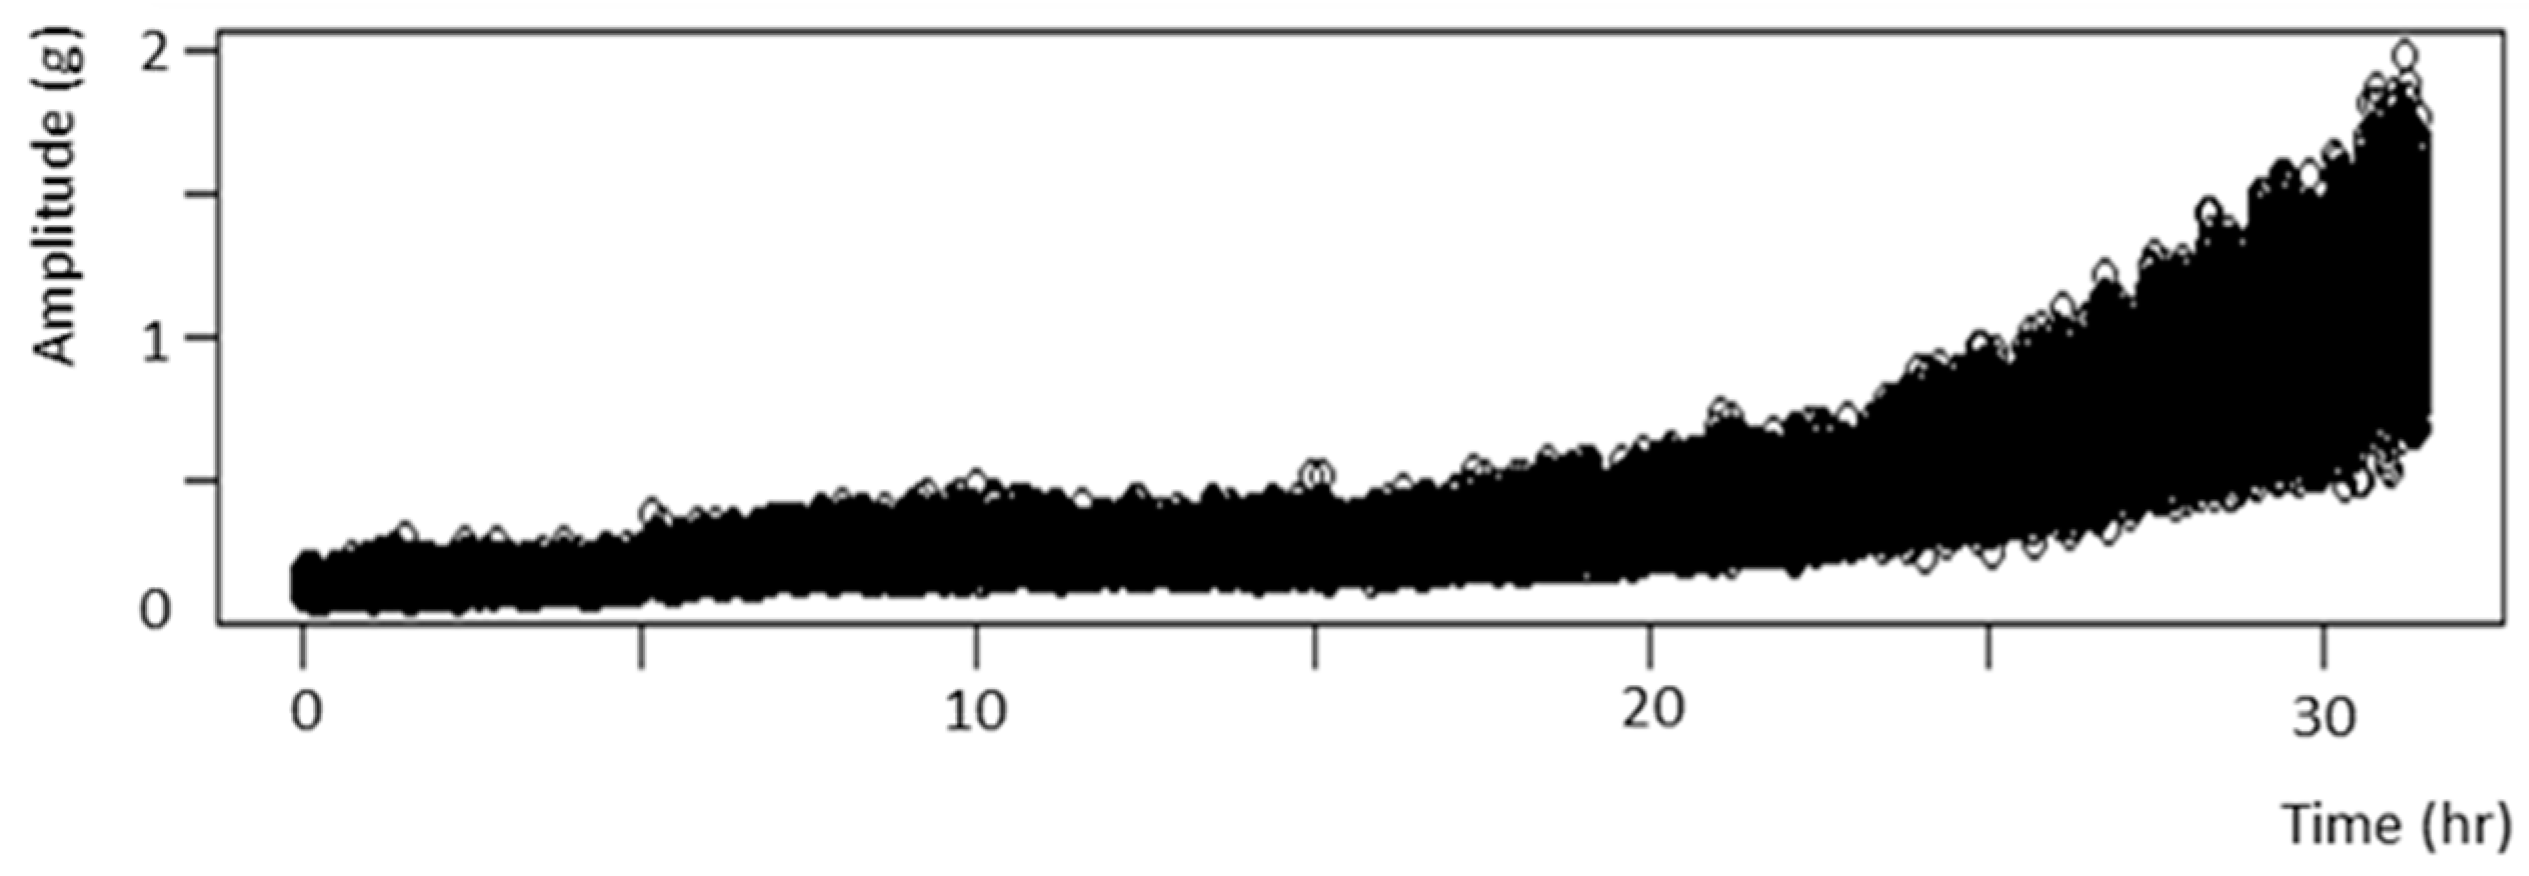
Figure 8.
Fitted plot of OLS.
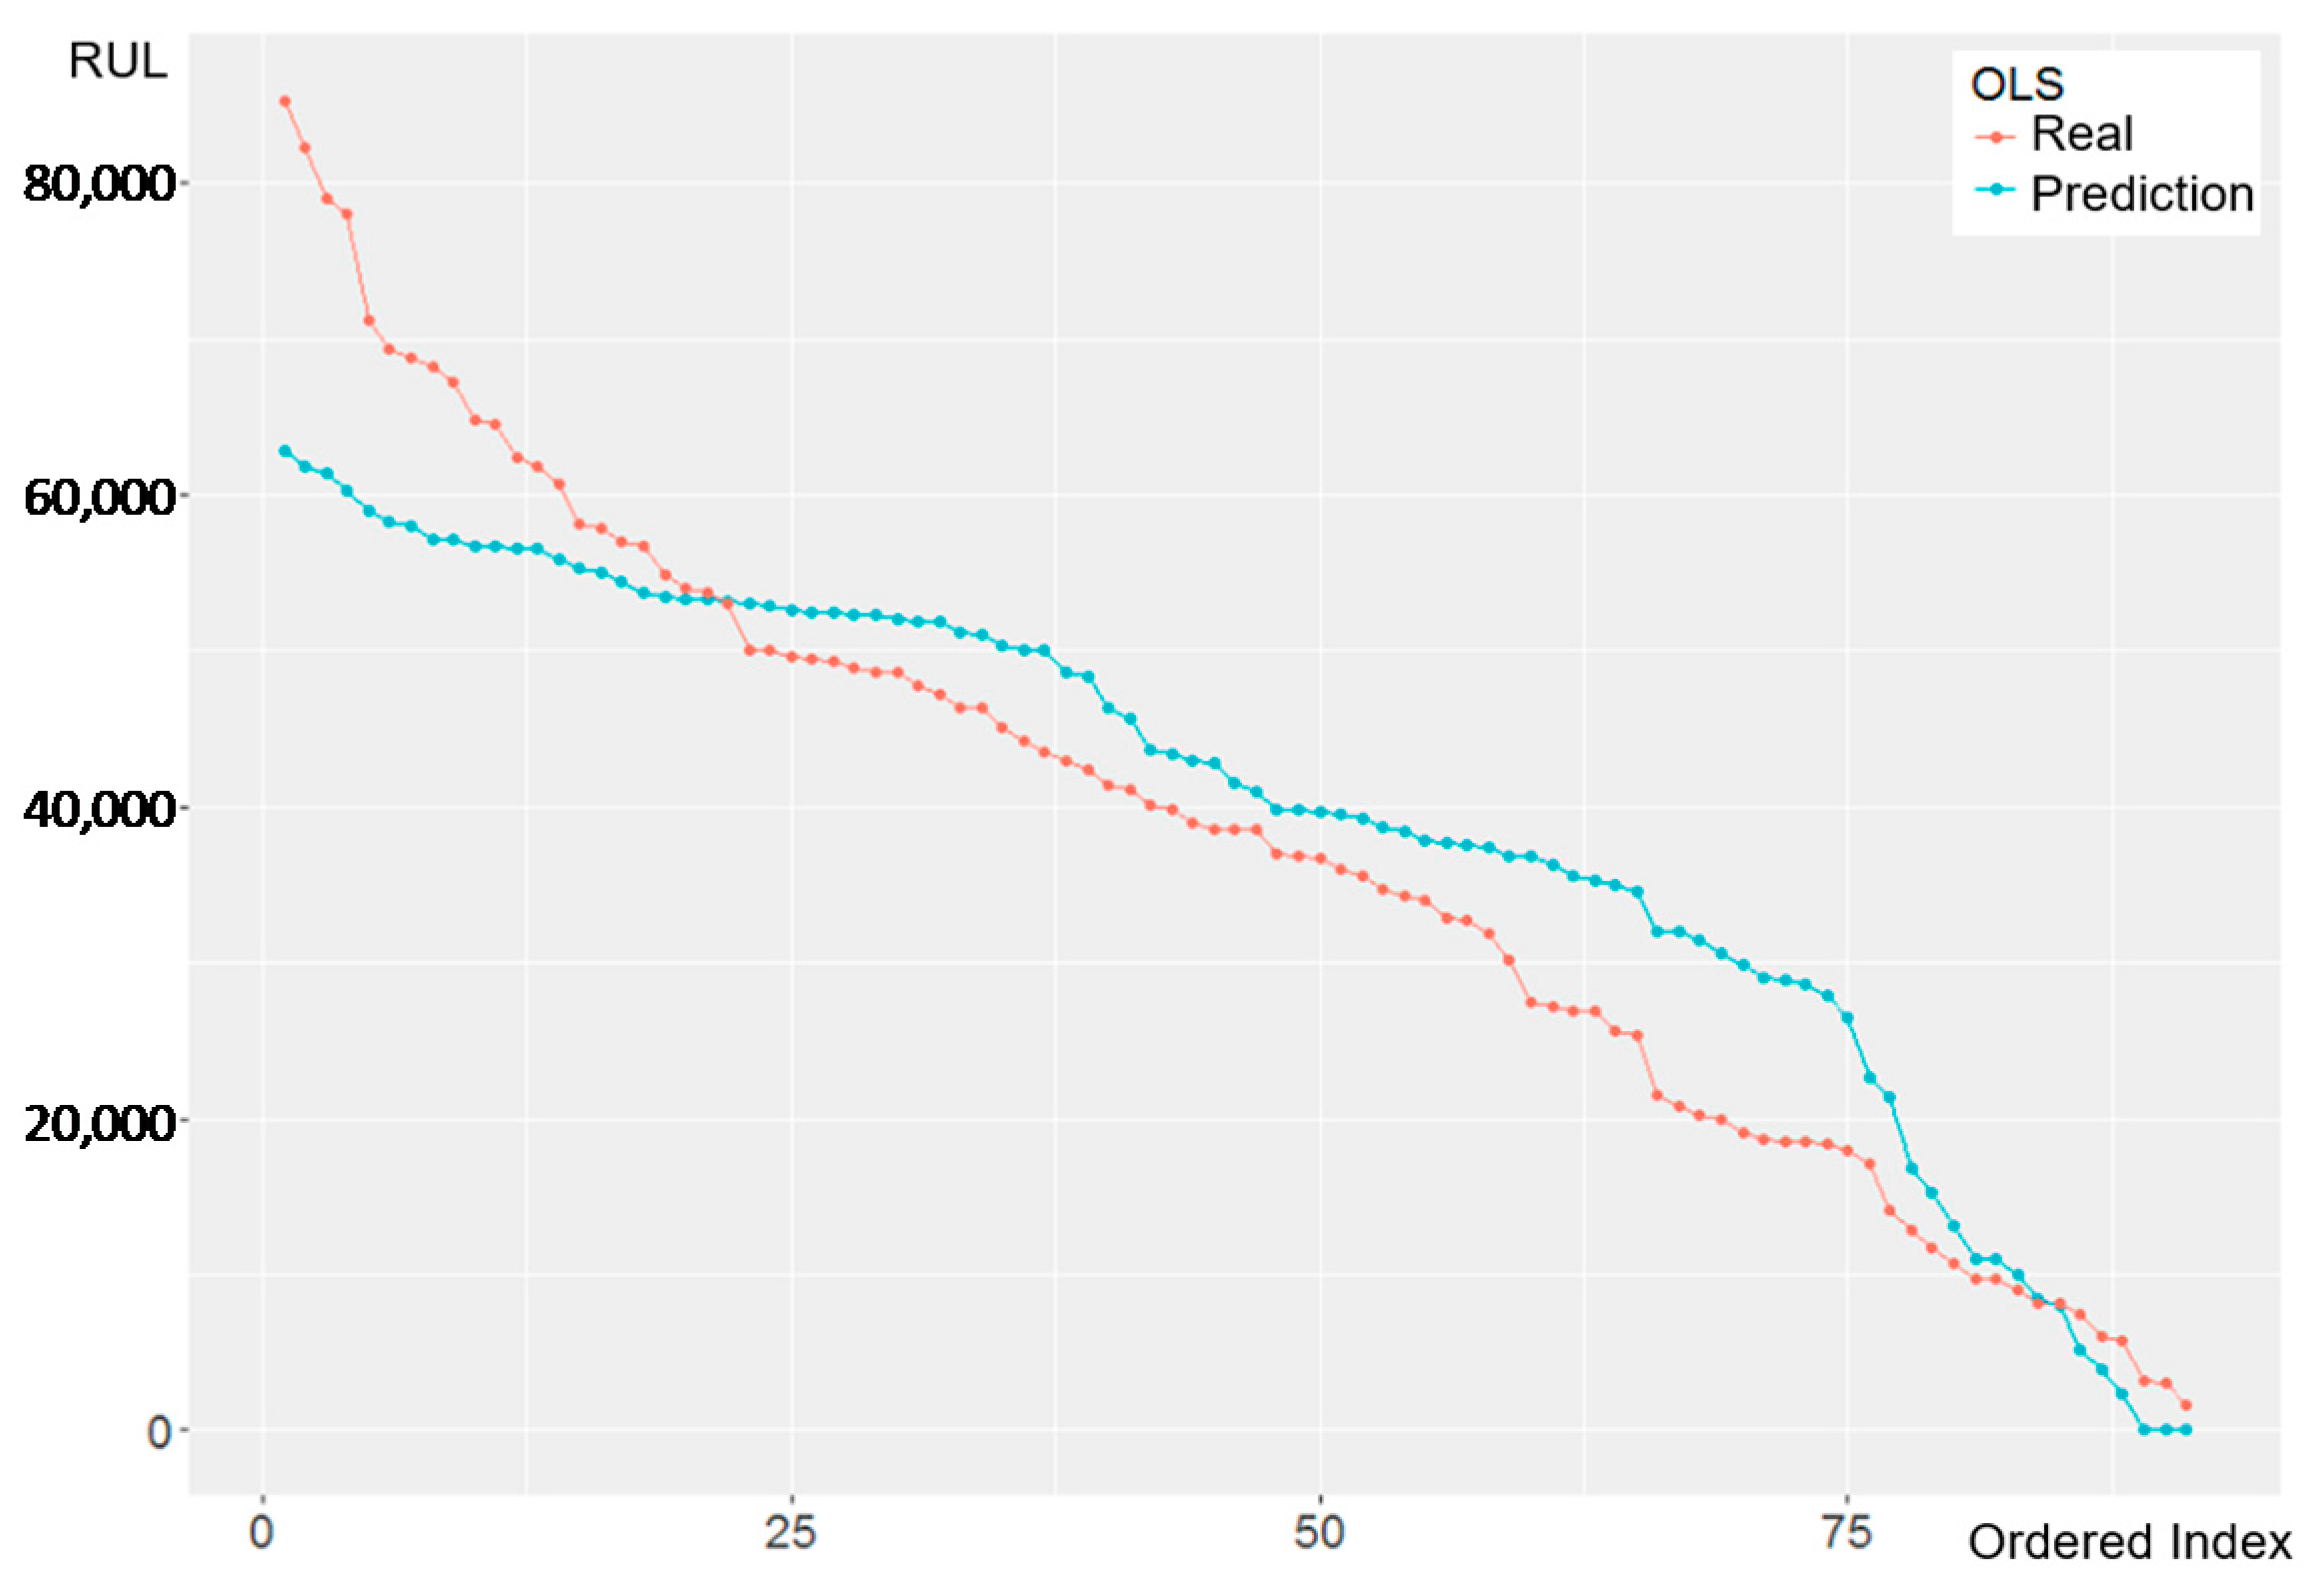
Figure 9.
Fitted plot of FGLS.
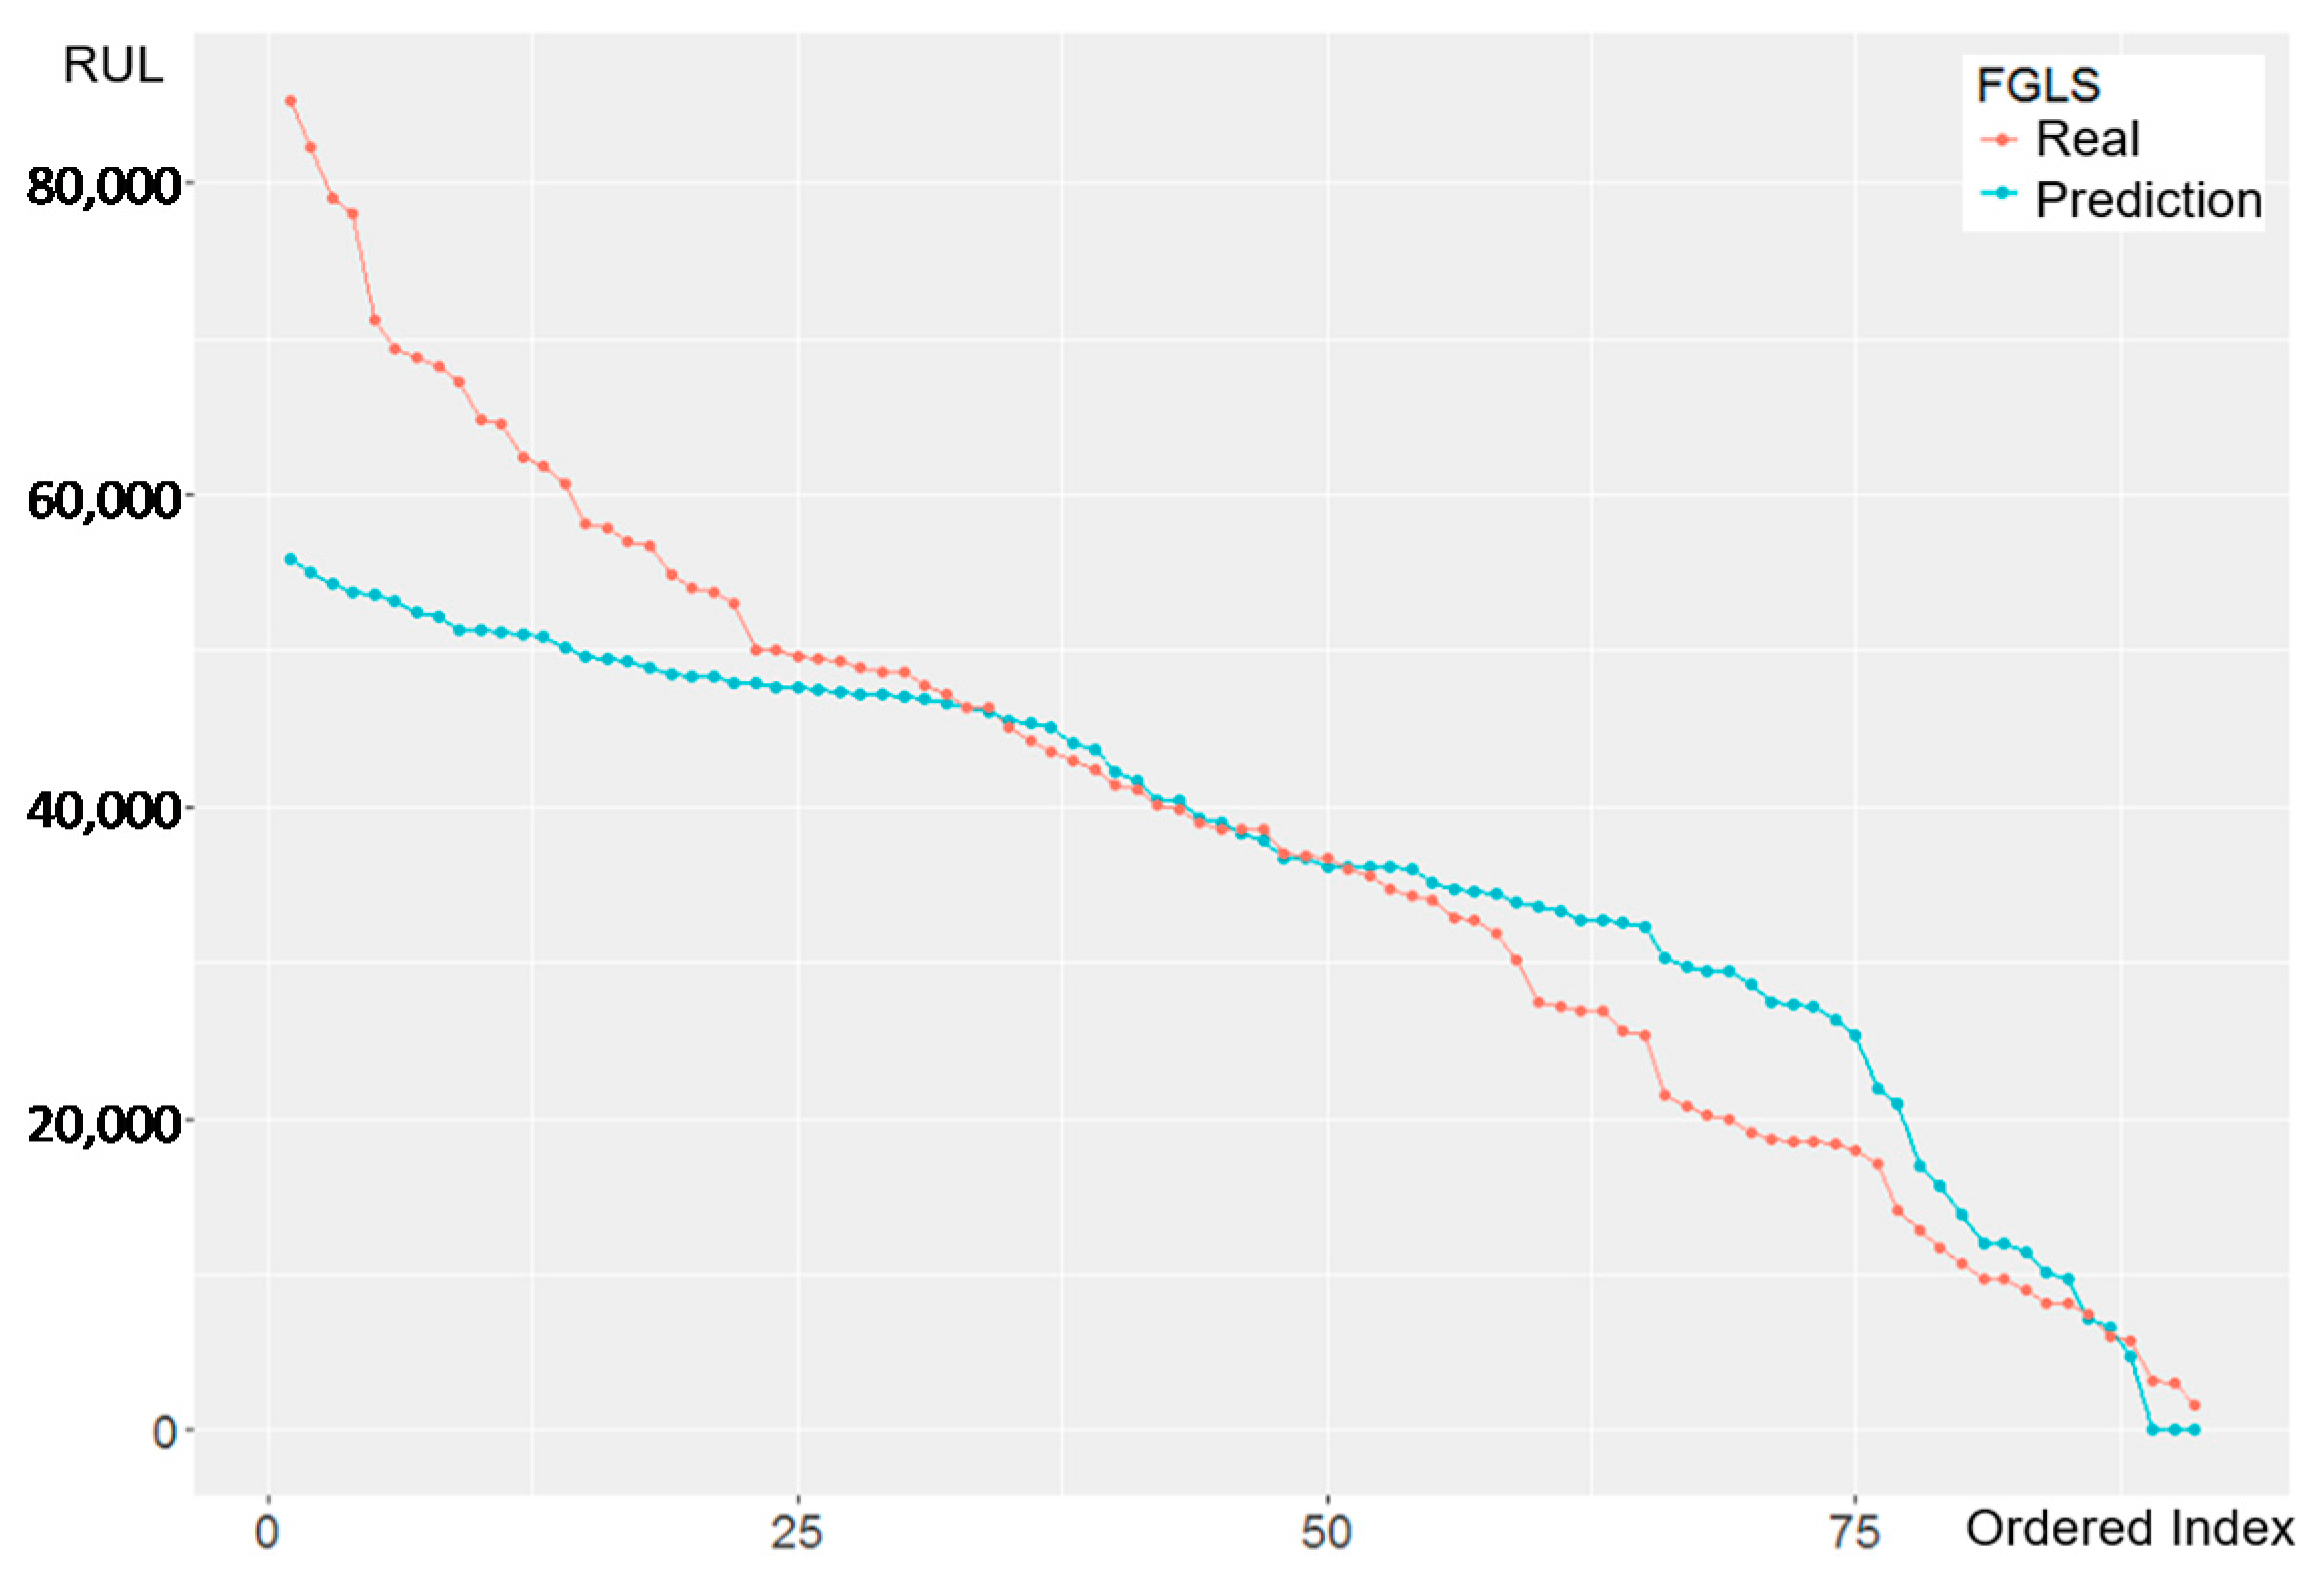
Figure 10.
Fitted plot of SVR.

Figure 11.
Fitted plot of OLS, FGLS and SVR.

Table 1.
Data sources.
| Provider | Company | Remarks |
|---|---|---|
| Experiment | Electrical discharge fatigue destruction experiment | |
| Date | From #1 to #223 (with different hardware and software): 2016.7.25~2018.1.20 From #204 to #221 (with the same settings): 2017.11.26~2018.1.20 | |
| Target | Vibration signal data (amplitude) | |
| Settings | hydraulic oil: 15 mL revolution: 1800 rpm, 30 Hz (mechanical frequency) inverter: 60 Hz (electrical frequency) discharge switch: 6 A self-coupling switch: 16.8 V | |
| Program | Labview program (QMH structure) | |
| Collection frequency | 20 s every 10 min | |
| Stop time | Amplitude > Threshold | |
| Sample Size | three experiments (204, 205, and 206) with the same setting criteria | |
Table 2.
Summary of data processing.
| Time & Revolution & Data point |
| 1 s = 30 rev = 25,600 points, 1/30 s = 1 rev = 853 points |
| Aggregation (turns 853 points into 1 point by SW) |
| 25,600 points ÷ 853 = 30 points/s, 1 point = 1/30 s |
| Return to real time |
| Steps in data preprocessing |
|
| Notes |
|
Table 3.
Feature extraction from three dimensions.
| Method/ Dimensions | Time-Series Dimension | Change-Point Dimension | Frequency Dimension |
|---|---|---|---|
| Method | OLS | Piecewise linear segmentation | FFT |
| Features | (1) Mse.ts (2) Slope.ts (3) Intercept.ts (4) Skewness.ts (5) Kurtosis.ts (6) Max.ts | (7) Sd.cp (8) First-point.cp (9) Skewness.cp (10) Kurtosis.cp | (11) Ampl1.f (12) Ampl1-freq.f (13) Ampl2.f (14) Ampl2-freq.f (15) Ampl-mean.f (16) Ampl-var.f (17) Ampl-skewness.f (18) Ampl-kurtosis.f |
Table 4.
Feature selection.
| VIF Test | Stepwise Regression | ||
|---|---|---|---|
| Features | VIF | Features | State |
| Mse.ts | >10 | ||
| Slope.ts | Slope.ts | out | |
| Intercept.ts | >10 | ||
| Skewness.ts | Skewness.ts | out | |
| Kurtosis.ts | Kurtosis.ts | in | |
| Max.ts | Max.ts | in | |
| Sd.cp | Sd.cp | out | |
| First-point.cp | >10 | ||
| Skewness.cp | Skewness.cp | out | |
| Kurtosis.cp | Kurtosis.cp | out | |
| Ampl1.f | >10 | ||
| Ampl1-freq.f | Ampl1-freq.f | in | |
| Ampl2.f | Ampl2.f | in | |
| Ampl2-freq.f | Ampl2-freq.f | in | |
| Ampl-mean.f | >10 | ||
| Ampl-var.f | Ampl-var.f | out | |
| Ampl-skewness.f | Ampl-skewness.f | out | |
| Ampl-kurtosis.f | >10 | ||
Table 5.
Coefficients of the selected features.
| Coefficient | ||||
|---|---|---|---|---|
| Features | Estimate | Std. Error | t-Value | p-Value |
| (intercept) | 82213.7 | 1142.3 | 71.97 | <2 × 10⁻¹⁶ |
| Max.ts | −46856.5 | 1143.3 | −40.98 | <2 × 10⁻¹⁶ |
| Kurtosis.ts | 2552.9 | 250.1 | 10.21 | <2 × 10⁻¹⁶ |
| Ampl1-freq.f | −15082.7 | 3564.1 | −4.23 | 2.56 × 10⁻⁵ |
| Ampl2.f | 3327.4 | 827.9 | 4.02 | 6.34 × 10⁻⁵ |
| Ampl2-freq.f | −12951.2 | 2940.9 | −4.40 | 1.19 × 10⁻⁵ |
Table 6.
Coefficient estimation of OLS of testing dataset k = 1.
| OLS | Estimate | Std. Error | t-Value | p-Value |
|---|---|---|---|---|
| (Intercept) | 82196.5 | 1143.7 | 71.87 | <2 × 10⁻¹⁶ |
| Max.ts | −46850.2 | 1144.7 | −40.93 | <2 × 10⁻¹⁶ |
| Kurtosis.ts | 2545.5 | 250.4 | 10.17 | <2 × 10⁻¹⁶ |
| Ampl1-freq.f | −14999.1 | 3568.3 | −4.20 | 2.89 × 10⁻⁵ |
| Ampl2.f | 3426.3 | 827.1 | 4.14 | 3.76 × 10⁻⁵ |
| Ampl2-freq.f | −12801.0 | 2943.4 | −4.35 | 1.53 × 10⁻⁵ |
Table 7.
Coefficient estimation of FGLS of testing dataset k = 1.
| FGLS | Estimate | Std. Error | t-Value | p-Value |
|---|---|---|---|---|
| (Intercept) | 73313.9 | 1091.7 | 67.16 | <2 × 10⁻¹⁶ |
| Max.ts | −40658.3 | 944.4 | −43.05 | <2 × 10⁻¹⁶ |
| Kurtosis.ts | 2277.4 | 153.7 | 14.82 | <2 × 10⁻¹⁶ |
| Ampl1-freq.f | −12084.4 | 2906.8 | −4.16 | 3.53 × 10⁻⁵ |
| Ampl2.f | 1929.8 | 567.1 | 3.40 | 0.0007 |
Table 8.
10-fold CV of OLS.
| k-Fold | k = 1 | k = 2 | … | k = 10 | Avg. | Std. | |
|---|---|---|---|---|---|---|---|
| Training dataset | R2 | 0.765 | 0.769 | … | 0.764 | 0.767 | 0.003 |
| RMSE | 11259 | 11114 | … | 11206 | 11115.86 | 71.61 | |
| Testing dataset | R2 | 0.733 | 0.775 | … | 0.711 | 0.691 | 0.053 |
| RMSE | 10785 | 11081 | … | 10555 | 11428.34 | 657.92 |
Table 9.
10-fold CV of FGLS.
| k-Fold | k = 1 | k = 2 | … | k = 10 | Avg. | Std. | |
|---|---|---|---|---|---|---|---|
| Training dataset | R2 | 0.617 | 0.625 | … | 0.594 | 0.617 | 0.013 |
| RMSE | 12435 | 12364 | … | 12677 | 12211.61 | 121.58 | |
| Testing dataset | R2 | 0.574 | 0.627 | … | 0.563 | 0.566 | 0.033 |
| RMSE | 12919 | 12361 | … | 12880 | 12620.84 | 956.21 |
Table 10.
10-fold CV of SVR.
| k-Fold | k = 1 | k = 2 | … | k = 10 | Avg. | Std. | |
|---|---|---|---|---|---|---|---|
| Training dataset | R2 | 0.831 | 0.839 | … | 0.842 | 0.829 | 0.01 |
| RMSE | 9223 | 9041 | … | 9015 | 9066.63 | 90.54 | |
| Testing dataset | R2 | 0.907 | 0.834 | … | 0.915 | 0.824 | 0.055 |
| RMSE | 9090 | 10219 | … | 8165 | 9772.45 | 927 |
© 2019 by the authors. Licensee MDPI, Basel, Switzerland. This article is an open access article distributed under the terms and conditions of the Creative Commons Attribution (CC BY) license (http://creativecommons.org/licenses/by/4.0/).
Share and Cite
MDPI and ACS Style
Lee, C.-Y.; Huang, T.-S.; Liu, M.-K.; Lan, C.-Y. Data Science for Vibration Heteroscedasticity and Predictive Maintenance of Rotary Bearings. Energies 2019, 12, 801. https://doi.org/10.3390/en12050801
AMA Style
Lee C-Y, Huang T-S, Liu M-K, Lan C-Y. Data Science for Vibration Heteroscedasticity and Predictive Maintenance of Rotary Bearings. Energies. 2019; 12(5):801. https://doi.org/10.3390/en12050801
Chicago/Turabian StyleLee, Chia-Yen, Ting-Syun Huang, Meng-Kun Liu, and Chen-Yang Lan. 2019. "Data Science for Vibration Heteroscedasticity and Predictive Maintenance of Rotary Bearings" Energies 12, no. 5: 801. https://doi.org/10.3390/en12050801
Note that from the first issue of 2016, this journal uses article numbers instead of page numbers. See further details here.