Article

Research on a Faulty Line Selection Method Based on the Zero-Sequence Disturbance Power of Resonant Grounded Distribution Networks

1
School of Electronics and Information, Xi’an Polytechnic University, Xi’an 710048, China
2
Electric Power Research Institute, State Grid Shaanxi Electric Power Company, Xi’an 710054, China
3
School of Automation and Information Engineering, Xi’an University of Technology, Xi’an 710048, China
*
Author to whom correspondence should be addressed.
Energies 2019, 12(5), 846; https://doi.org/10.3390/en12050846
Submission received: 30 January 2019 / Revised: 25 February 2019 / Accepted: 28 February 2019 / Published: 4 March 2019
(This article belongs to the Section F: Electrical Engineering)

Abstract

:
For fast and accurate faulty line selection (FLS) in single phase-to-ground (SPG) faults for resonant grounded distribution networks (RGDNs), this paper proposes a FLS method based on zero-sequence power characteristics. Through analysis of the zero-sequence current of SPG faults, it is found that the transient zero-sequence current in the faulty line contains abundant attenuated DC components, while that in the sound line is weak, which could be utilized as a technically practical way of judging faulty lines. Thus a FLS scheme using a transient zero-sequence DC component energy integral is put forward, which highlights the difference of the DC components in the faulty line and the sound line. A series of simulation test results indicate that the proposed scheme shows favorable performance under various SPG fault conditions, and should be helpful to improve the success rate of FLS significantly for RGDN in the future.

1. Introduction

Nowadays, most medium voltage distribution networks in China employ an ineffectively grounded (i.e., isolated or a anti-arc coil grounded) neutral to reduce overvoltage caused by SPG faults [1,2]. As a result, the very low fault current and unstable fault arcs make it difficult to detect faulty lines during SPG faults [3,4,5]. When a SPG fault occurs, the anti-arc coil over-compensates the total capacitive current in the network, and the residual fault current is not seriously harmful to the power supply equipment in a short time, but on the other hand it may leads to deadly consequences if the faulty line is not isolated from the distribution network in time, so it is very necessary to detect and isolate the faulty line automatically to ensure the reliability of the distribution automation and power supply.
Due to the fact the over-compensation of the anti-arc coil greatly weakens the characteristics in SPG fault conditions, which makes it difficult to accurately perform FLS in RGDN [6,7]. By now, some methods have been proposed and applied to select faulty lines in RGDN. The existing faulty line selection methods can be categorized into two groups: active FLS (i.e., signal injection methods) ones and passive FLS ones [8,9]. The former need additional signal injection devices and are limited by the capacity of voltage transformers, and the operation and maintenance is comparatively complex. The latter can be divided into ones using steady-state signal [10] and others using transient signals [11]. The steady-state signal is weaker than the transient signal and is greatly affected by the system operation mode and arc stability. With regard to those using transient signal, FLS can be realized by extracting high frequency components within the signals. The transient process of SPG faults contains abundant fault characteristic information [12]. The FLS methods based on transient information are expected to further improve the accuracy of FLS in distribution networks, and have been a focus for relevant researchers in recent years. FLS methods based on transient information have been proposed, such as high-frequency component [13], wavelet transform [14,15], neural network [16], expert system [17], extreme learning machine [18], zero-sequence reactive power method [19], transient energy method [20,21] etc. Moreover [22] and [23] discussed synthesis algorithms for FLS.
In order to improve the performance of FLS in RGDN, a FLS method based on power integral of transient DC component in zero-sequence is proposed. By constructing the transient zero-sequence equivalent network in a RGDN and analyzing the characteristics of the transient zero-sequence current, it is found that the fault current of SPG faults contains a notable attenuated DC component, which is formed by the anti-arc coil, faulty line and grounding resistance. However, the corresponding DC component in the sound line is very weak. In the following, on the basis of the discussion of current in zero-sequence, a novel FLS based on zero-sequence DC energy integral is proposed. Theoretical analysis and simulation results demonstrate that it is a sensitive and reliable FLS method for RGDN, and with the increasing development of electronic transformer technology such as advanced current transformer with Rogowski coil and low power current transformer (LPCT) etc, saturation of current transformers caused by aperiodic components will be solved effectively and the method proposed in this paper is expected to be applied in practice.

2. Characteristics of Transient Zero-sequence Current in RGDN

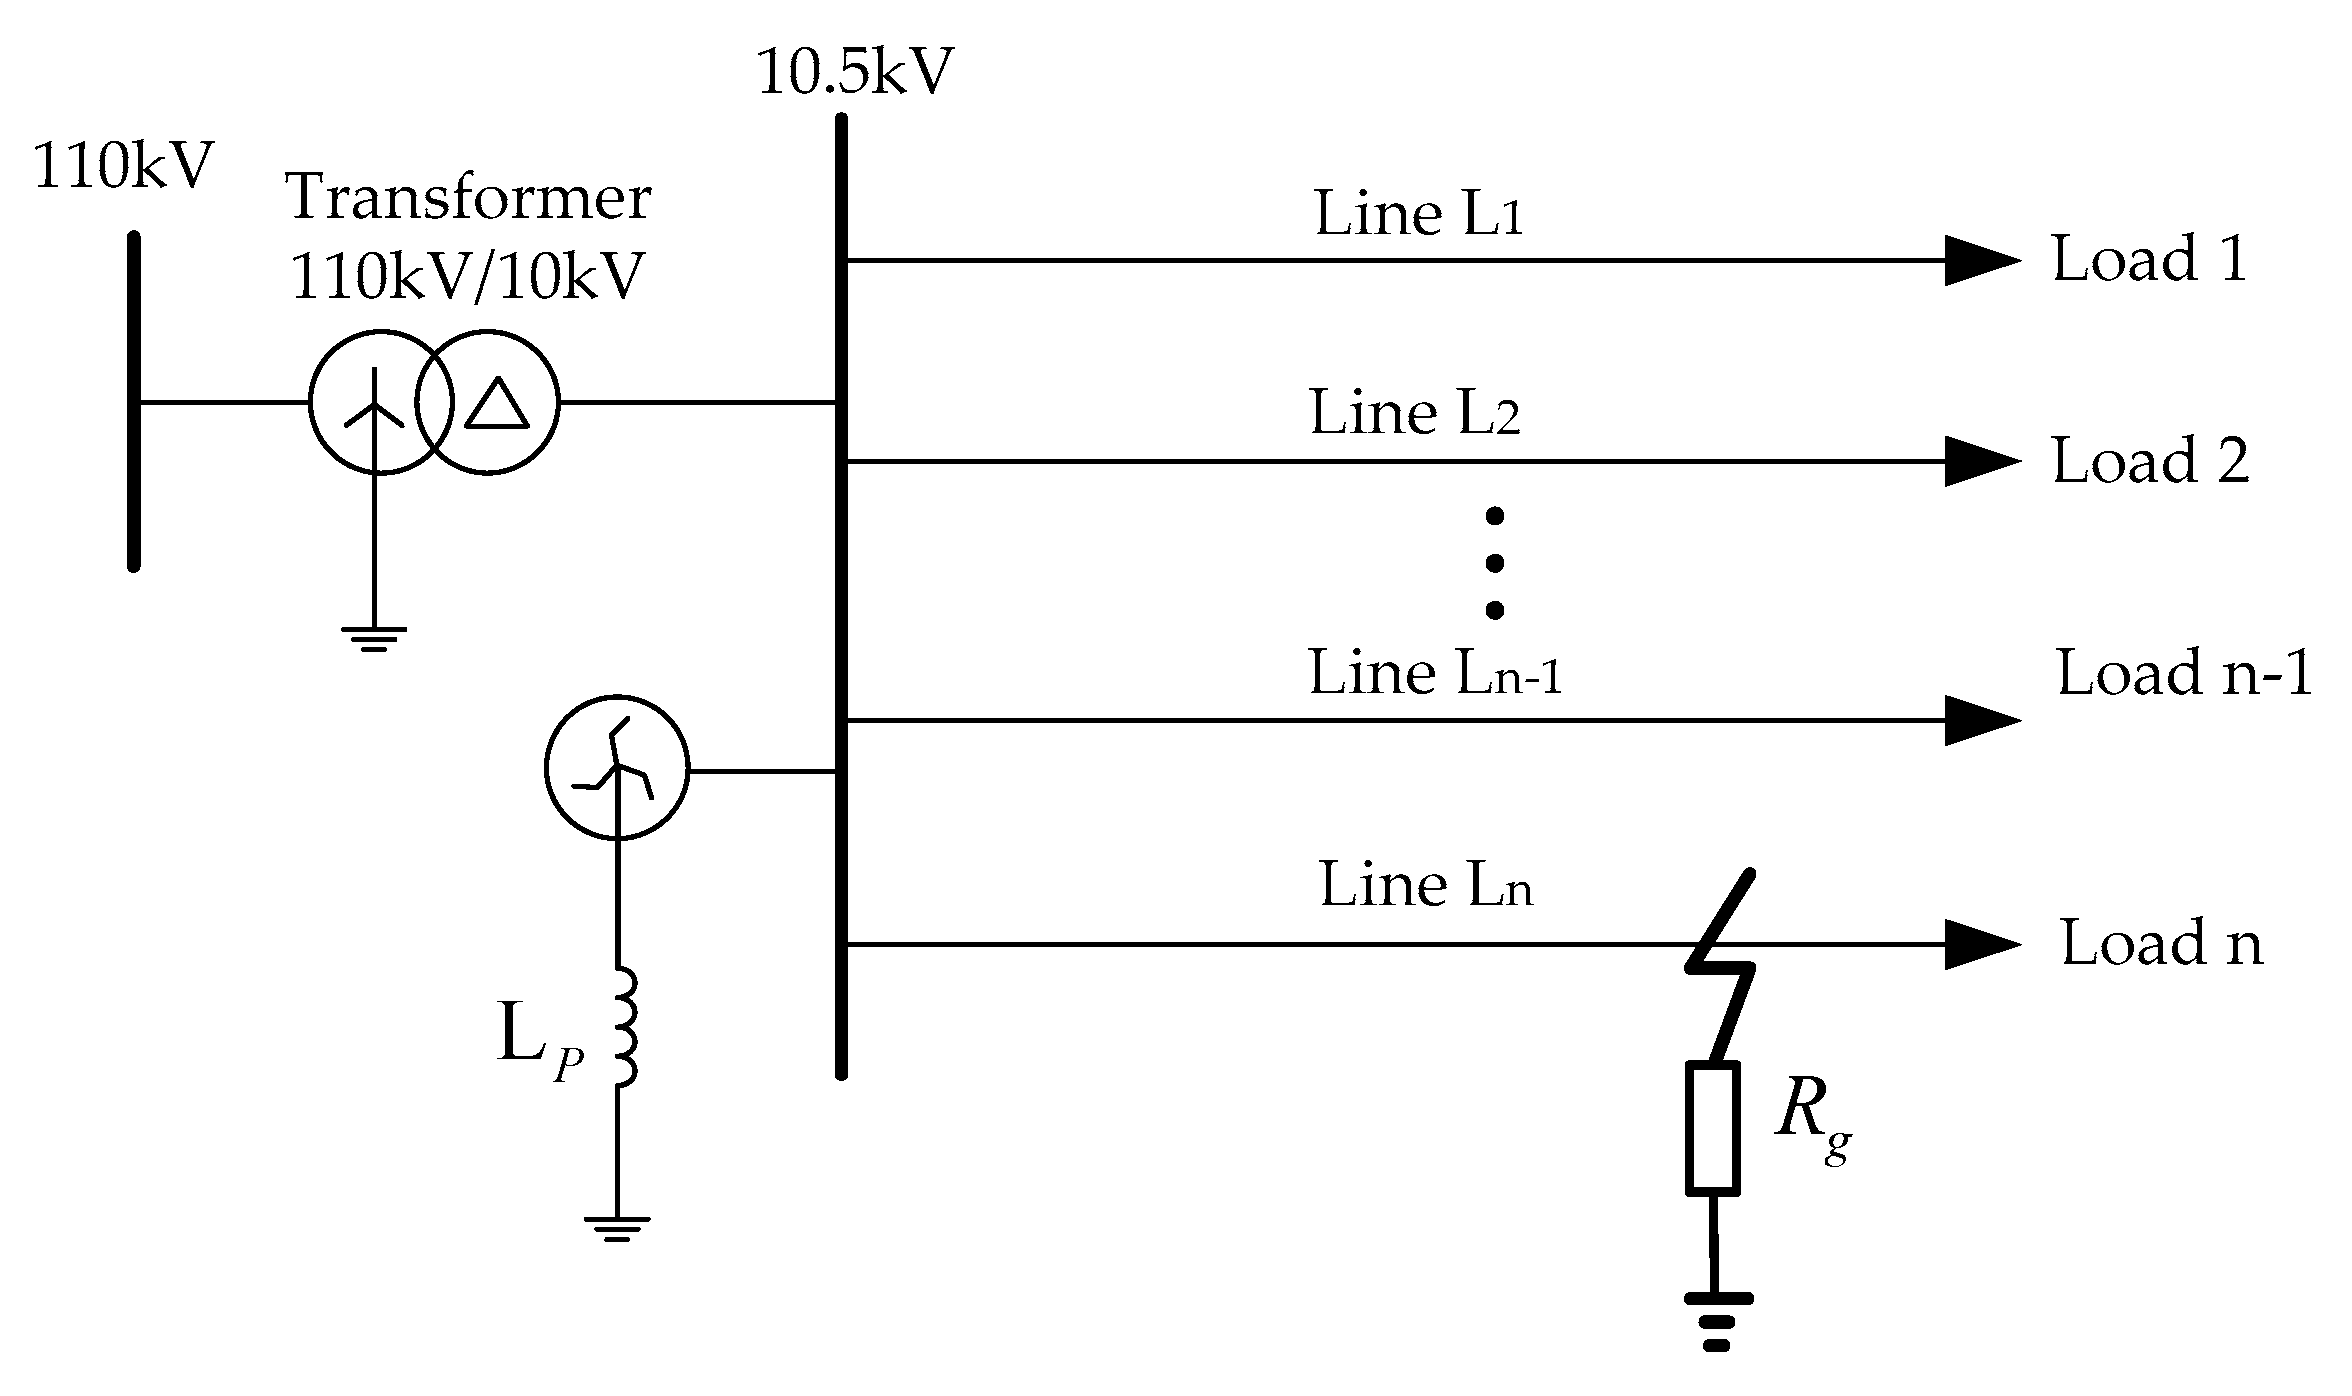
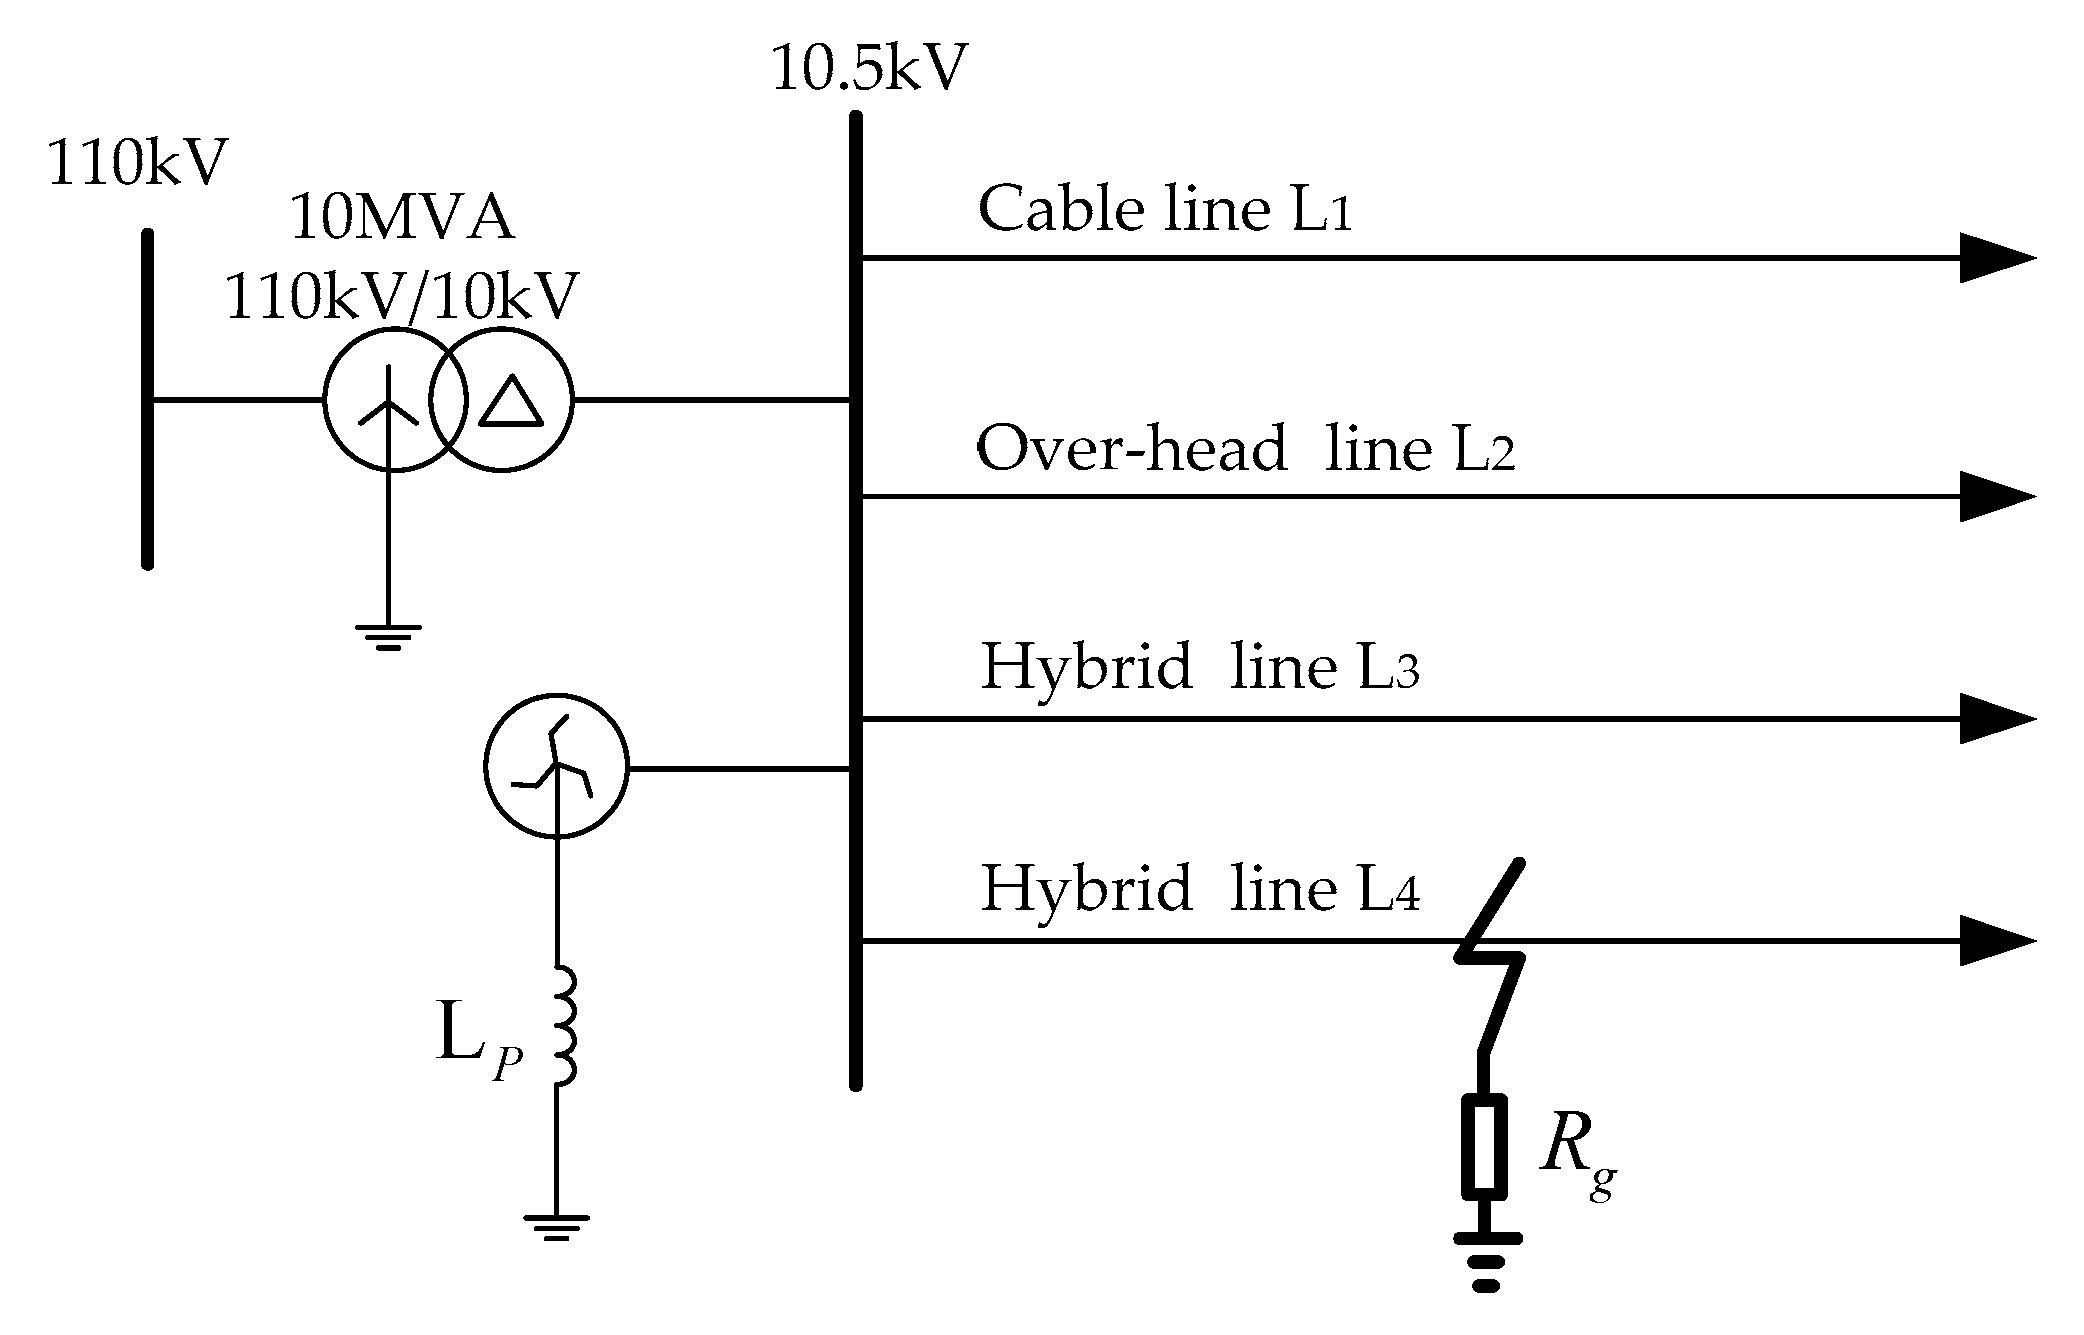
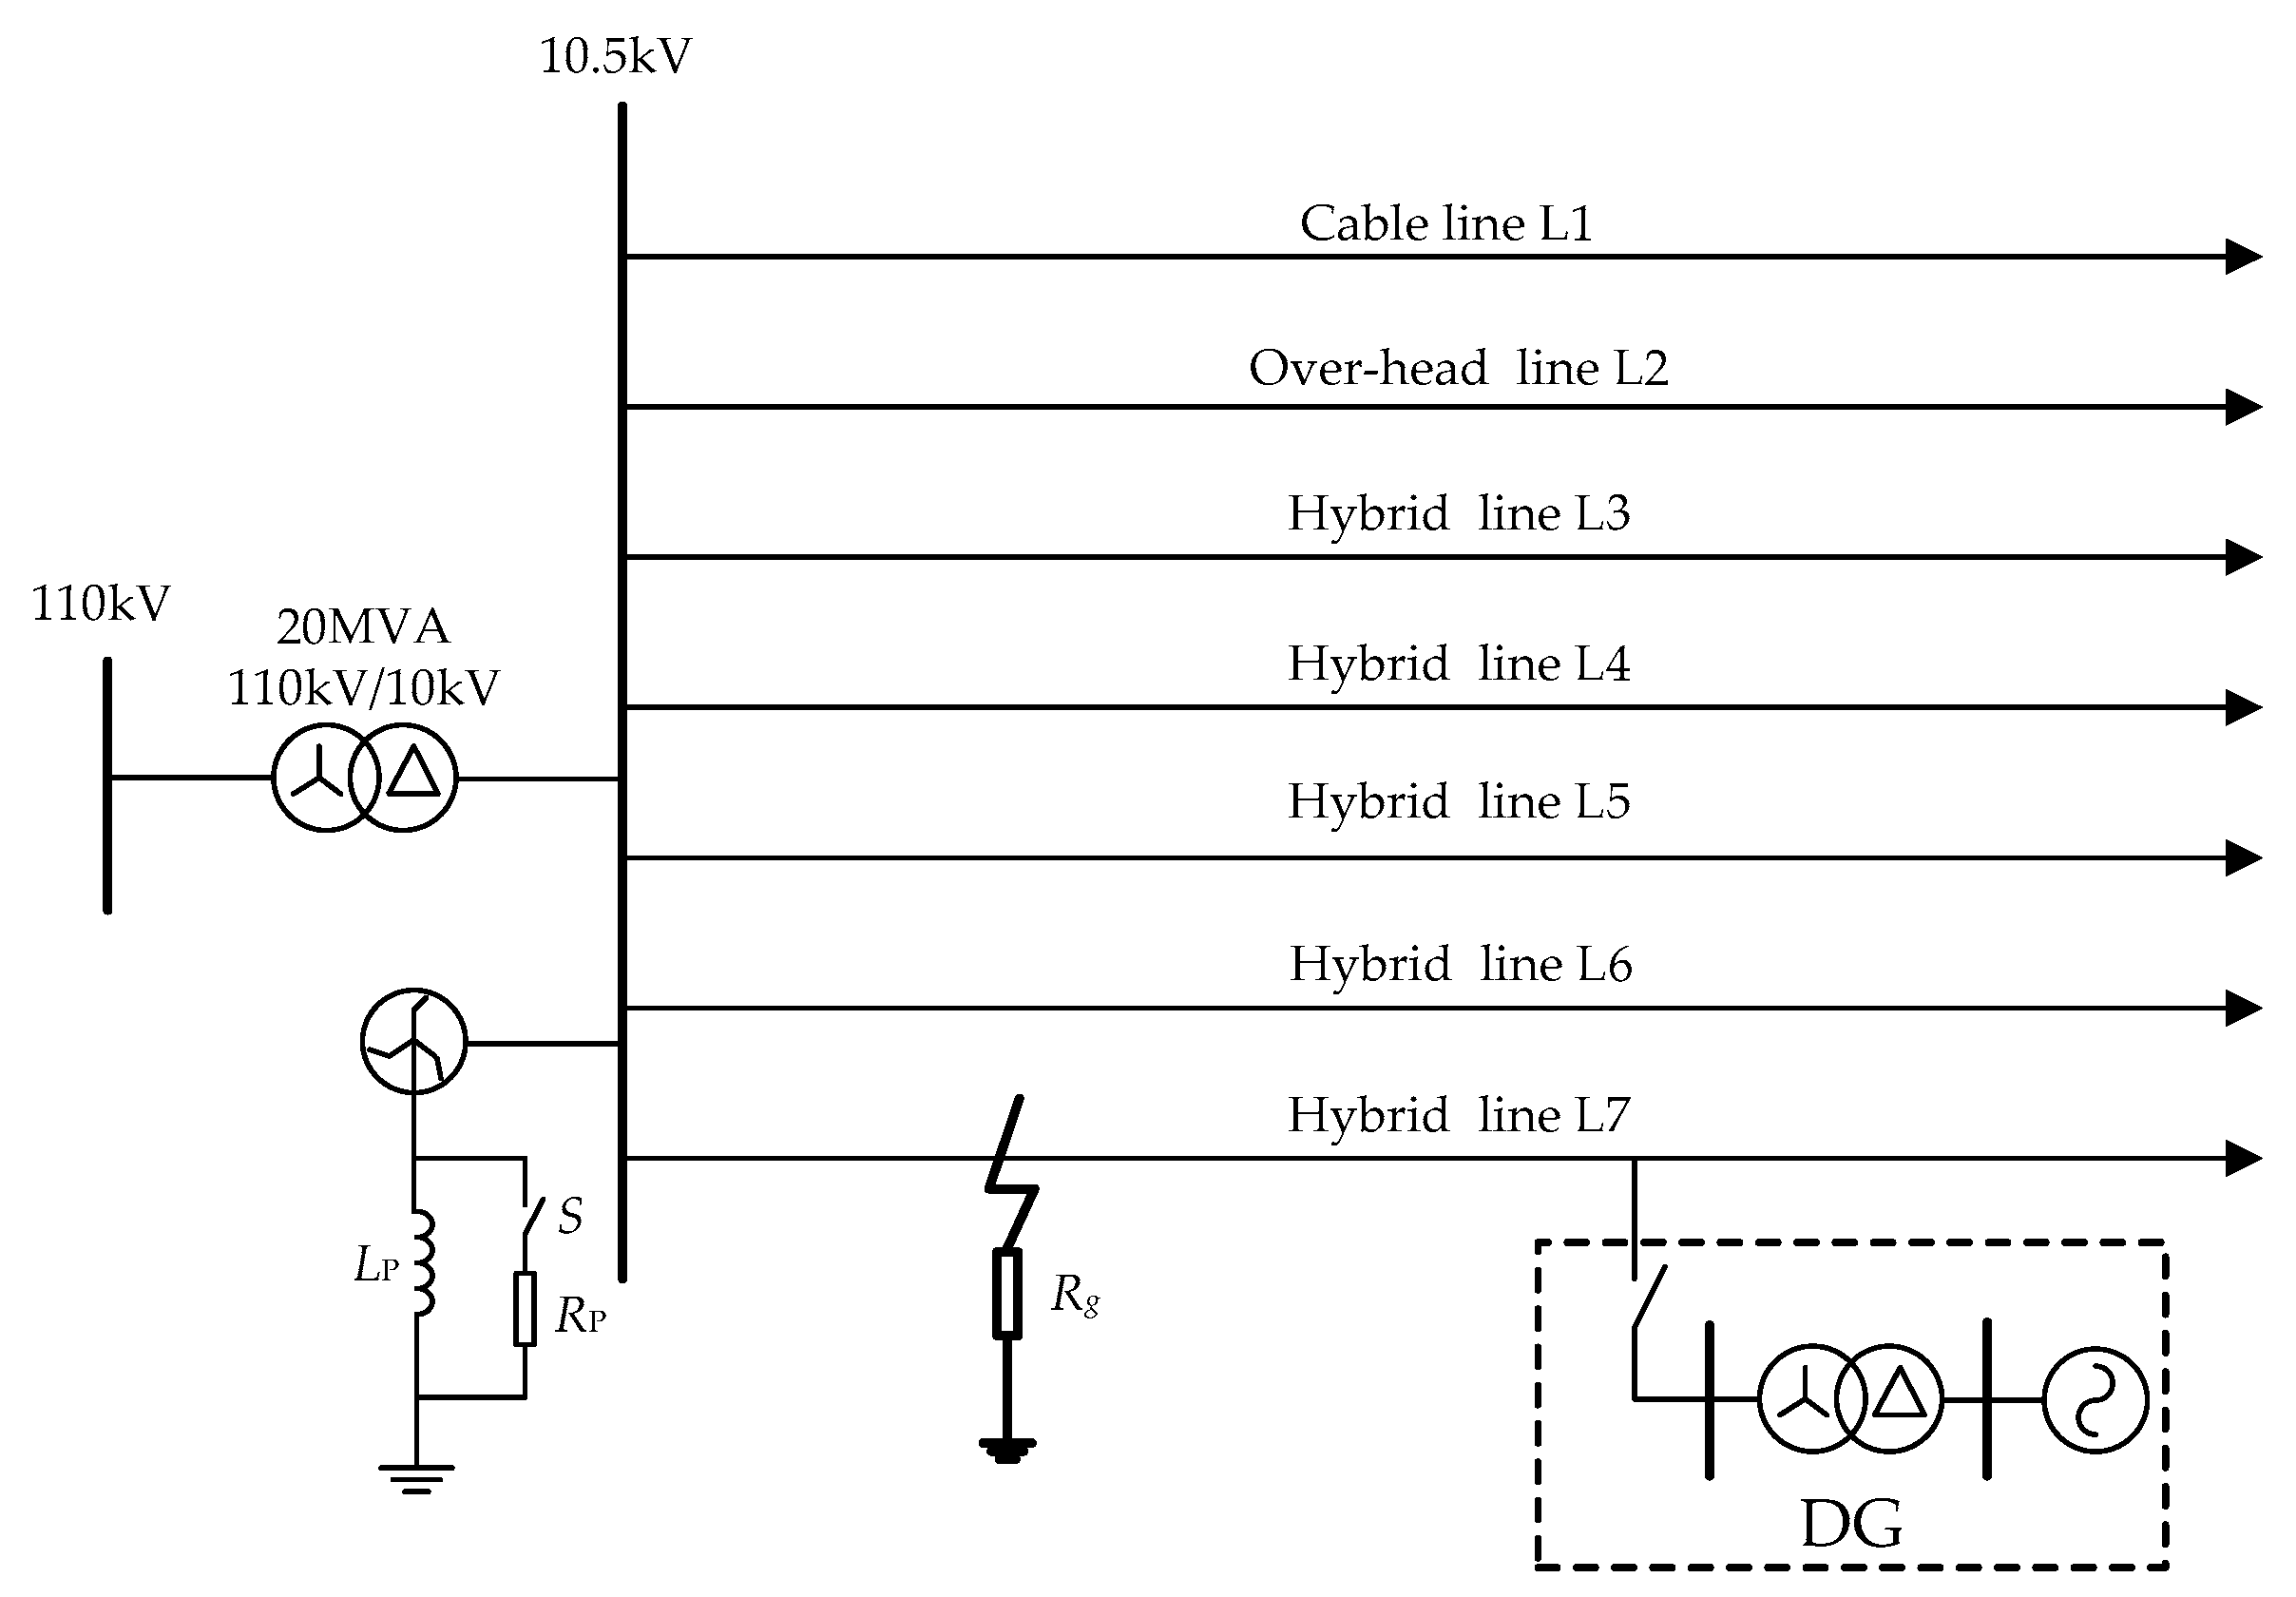
RGDN is widely used to improve the reliability of the power supply in medium and low-voltage distribution networks in China. At the same time, the anti-arc coil weakens the fault characteristics of the SPG faults and lower the current of the system, which increases the difficulty of FLS. The distribution power system network with arc-anti coil, which is listed as Figure 1, was used for analyzing SPG faults that occur in the system.
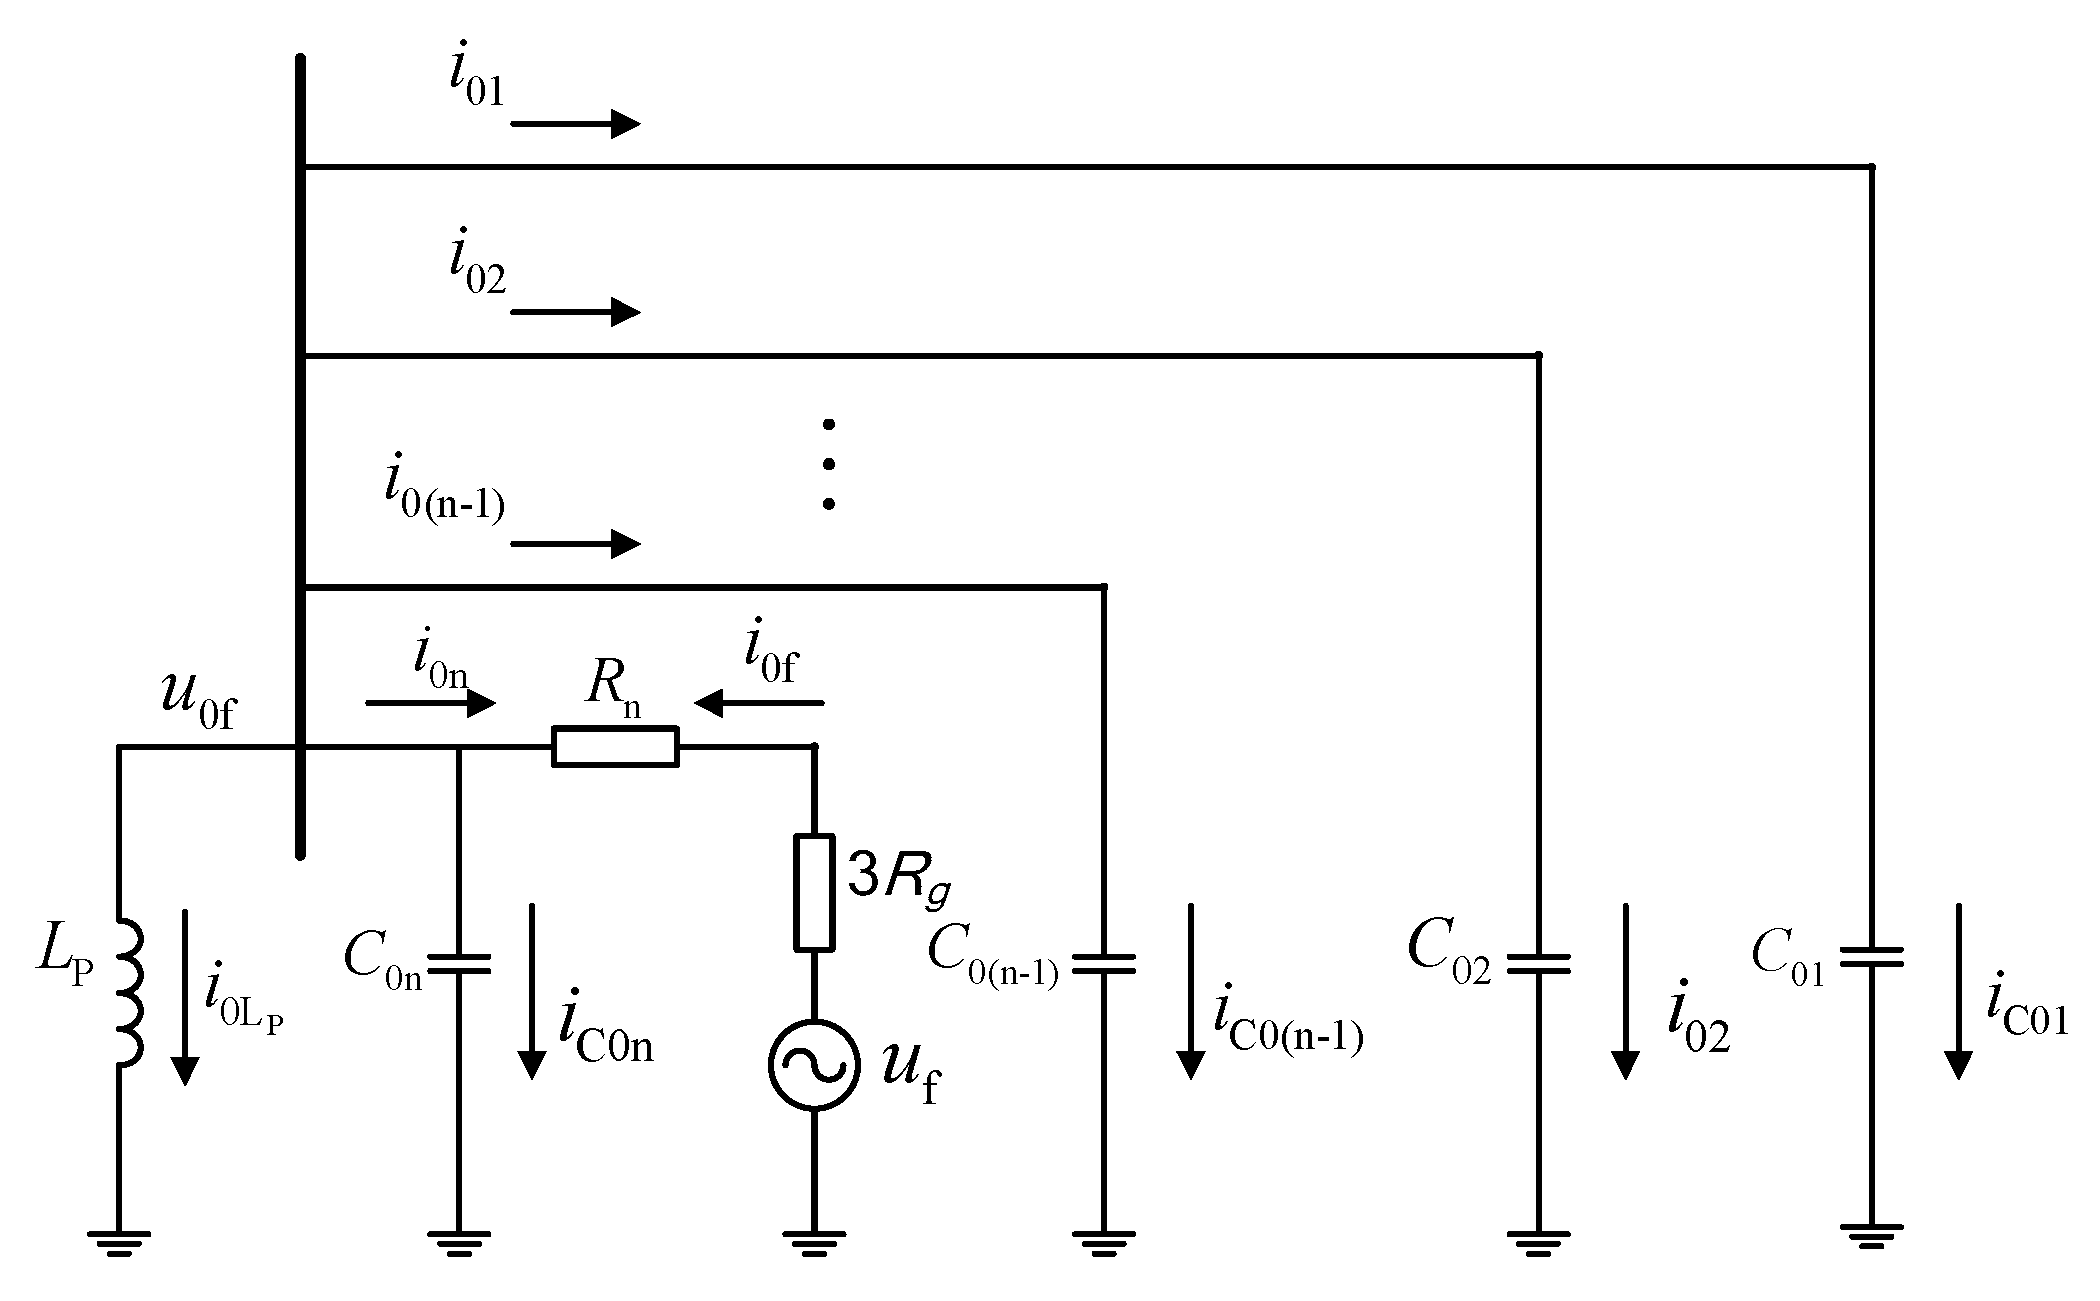
The zero-sequence circuit shown in Figure 2 is discussed, and the parameters are defined as follows:
  • u f is the equivalent source at the fault point, that is u f = u F ( 0 ) = U m sin ( ω 0 t + φ ) , where U m is the voltage amplitude of the fault phase, and ω 0 is the fundamental angular frequency, and φ is the initial phase angle at the fault time;
  • u 0 f is the neutral point displacement voltage;
  • i 0 L P is anti-arc coil branch current, i 0 i is the zero-sequence current of each line; C 0 i is the zero sequence capacitance of each line to ground ( i = 1 , 2 , n 1 , n ).
According to Figure 2, Equation (1) is expressed as follows:
u 0 f = L P d i 0 L P d t
The current in the anti-arc coil is closely related to the magnetic flux of the anti-arc coil, which is expressed as (2):
U phm sin ( ω t + φ ) = r L P i 0 L P + W d ψ L P d t
In which, U phm is the RMS of phase voltage, W is the turn number of the anti-arc coil and ψ L is the flux of anti-arc coil. The current in the anti-arc coil can be expressed as:
i 0 L P = ψ L P W L P
The flux equation of anti-arc coil can be obtained by substituting Equation (3) into (2).
{ ψ L P = ψ st ω L P Z [ cos ( φ + ξ ) e t τ L P cos ( ω t + φ + ξ ) ] ψ st = U phm ω W ξ = arctan 1 r L P ω L P Z ~ L P = r L P + j ω L P
where, ψ st is determined the steady-state flux, ξ is used to compensate the phase angle of the current, Z ~ L P is the impedance of the anti-arc coil and τ L P is the time constant of the flux.
Usually, due to r L P < < ω L P , thus after substitution Z L P ω L P ; ξ 0 into (4) can be obtained as follows:
ψ L P = ψ st [ cos φ e t τ L P cos ( ω t + φ ) ]
Then Equation (6) expresses the current in the anti-arc coil as follows:
i 0 L P = I 0 L P m [ cos φ e t τ L P cos ( ω t + φ ) ]
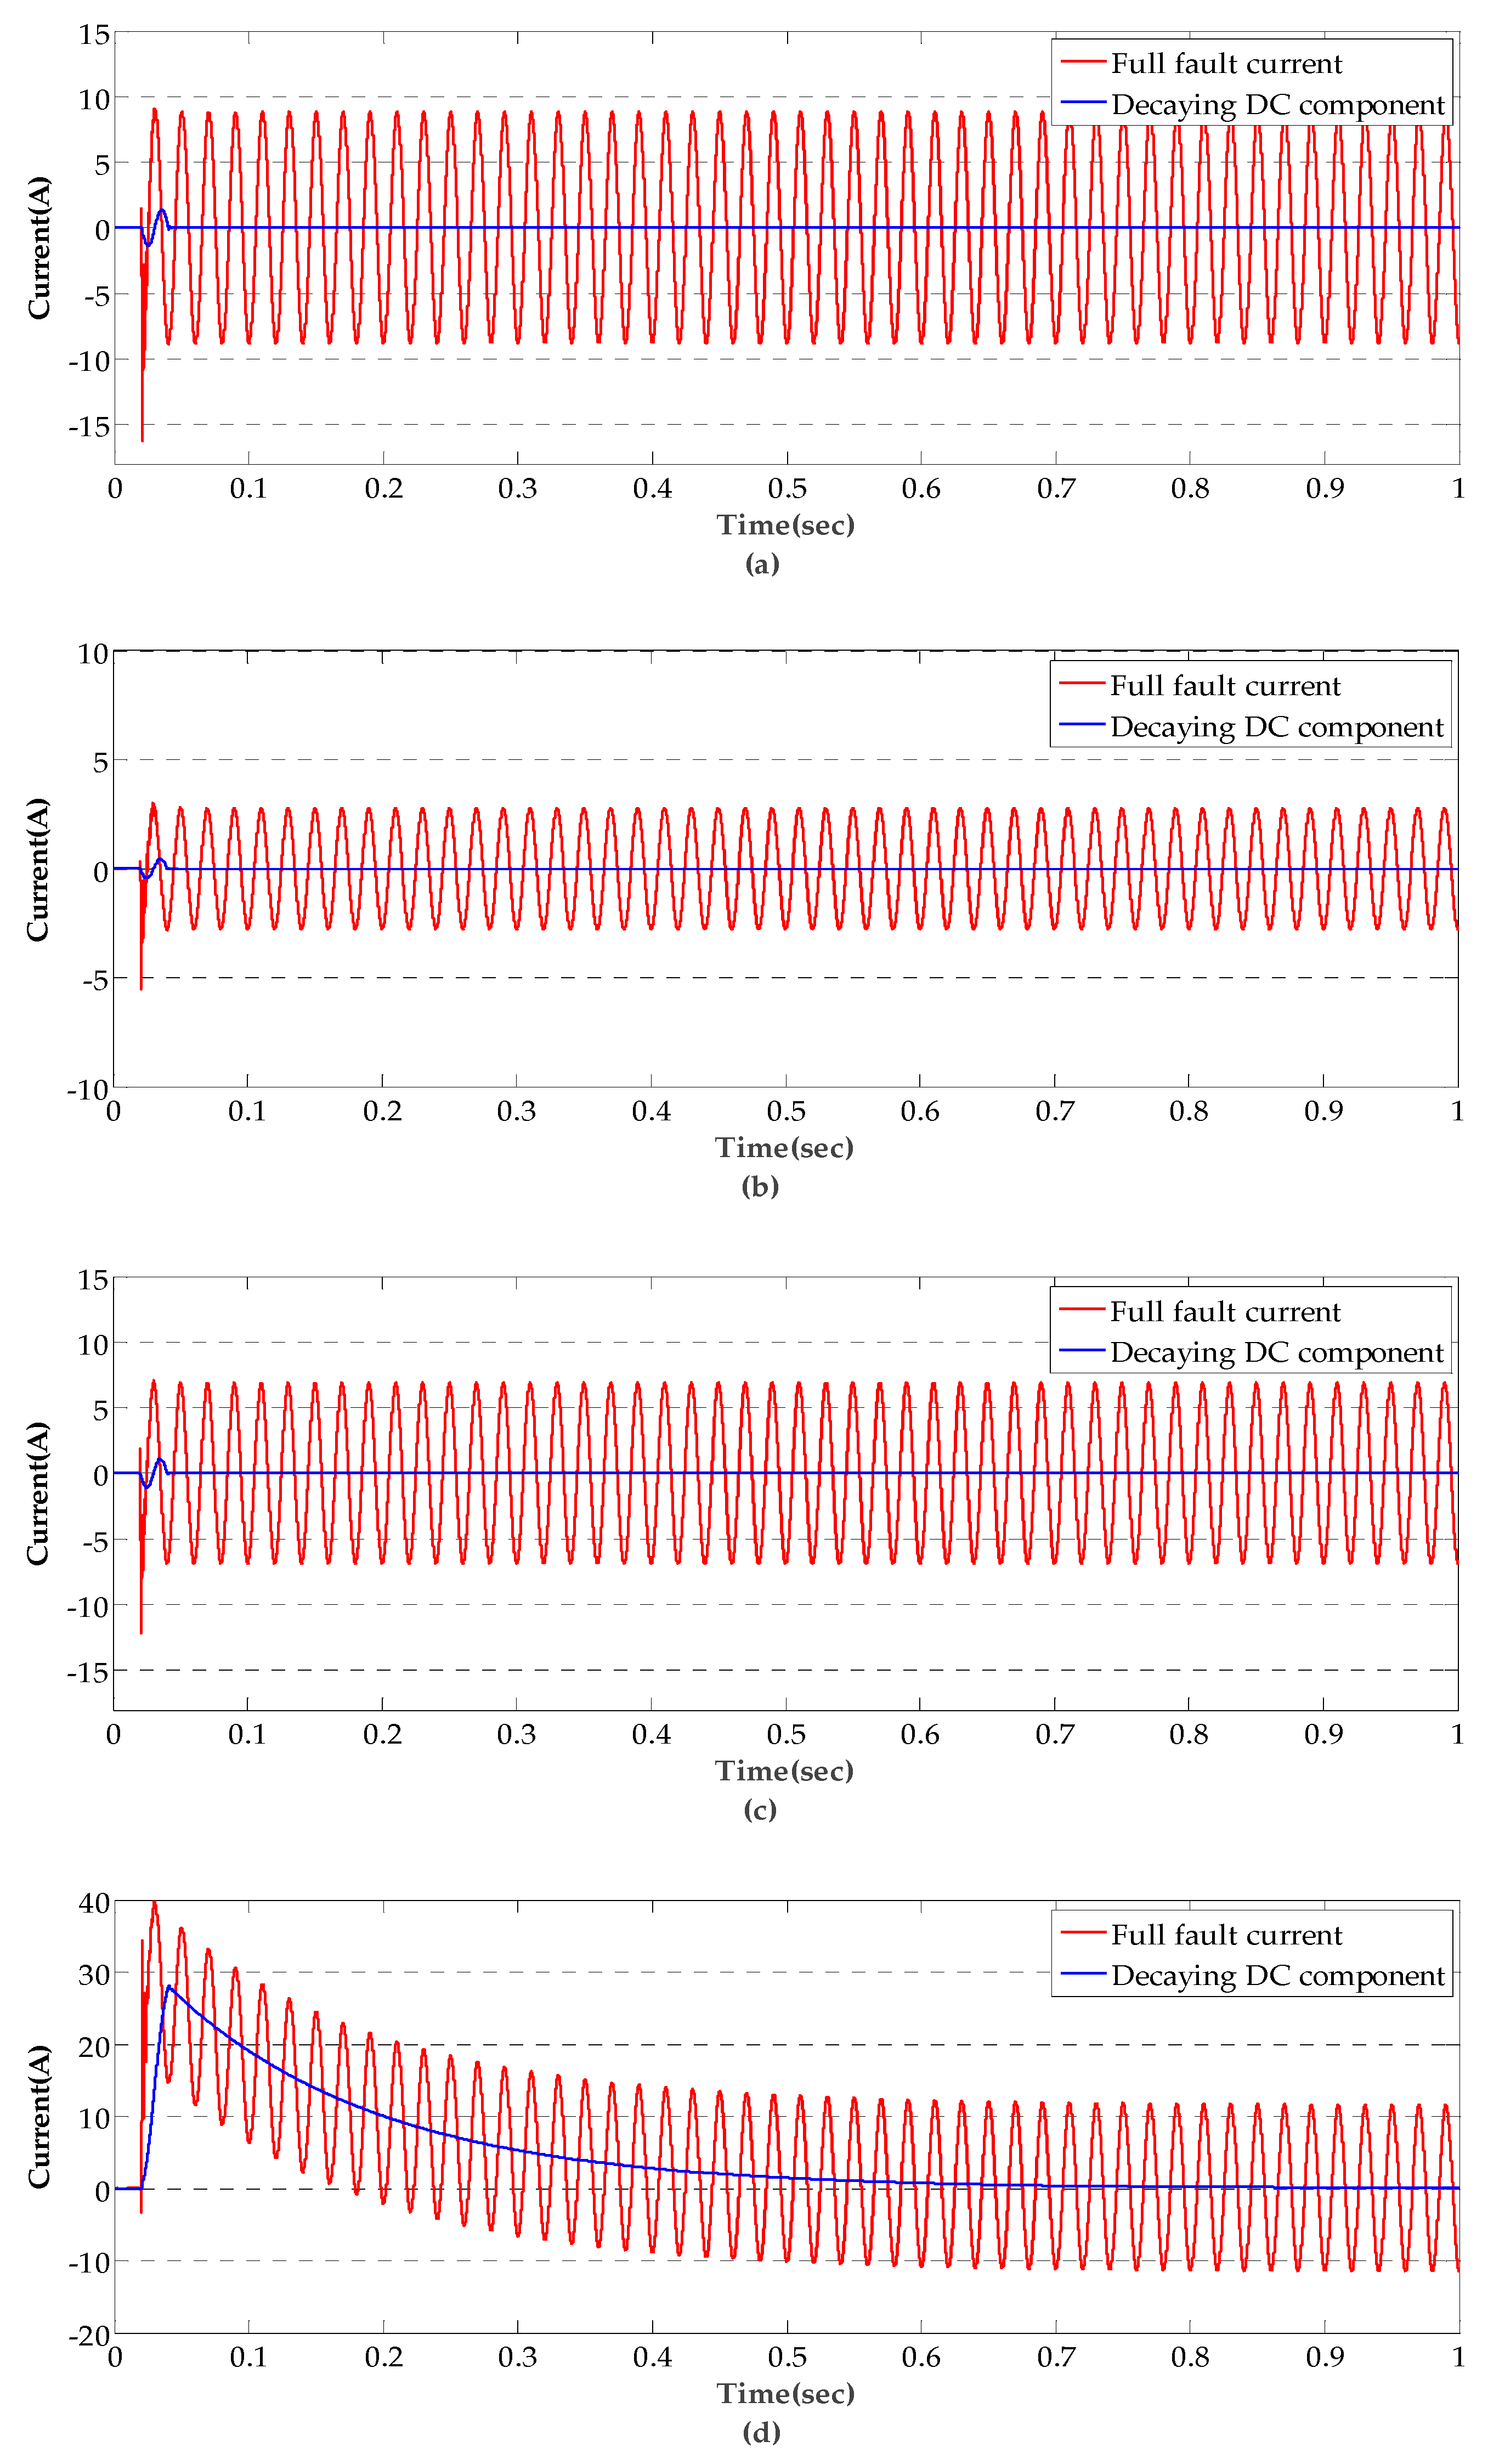
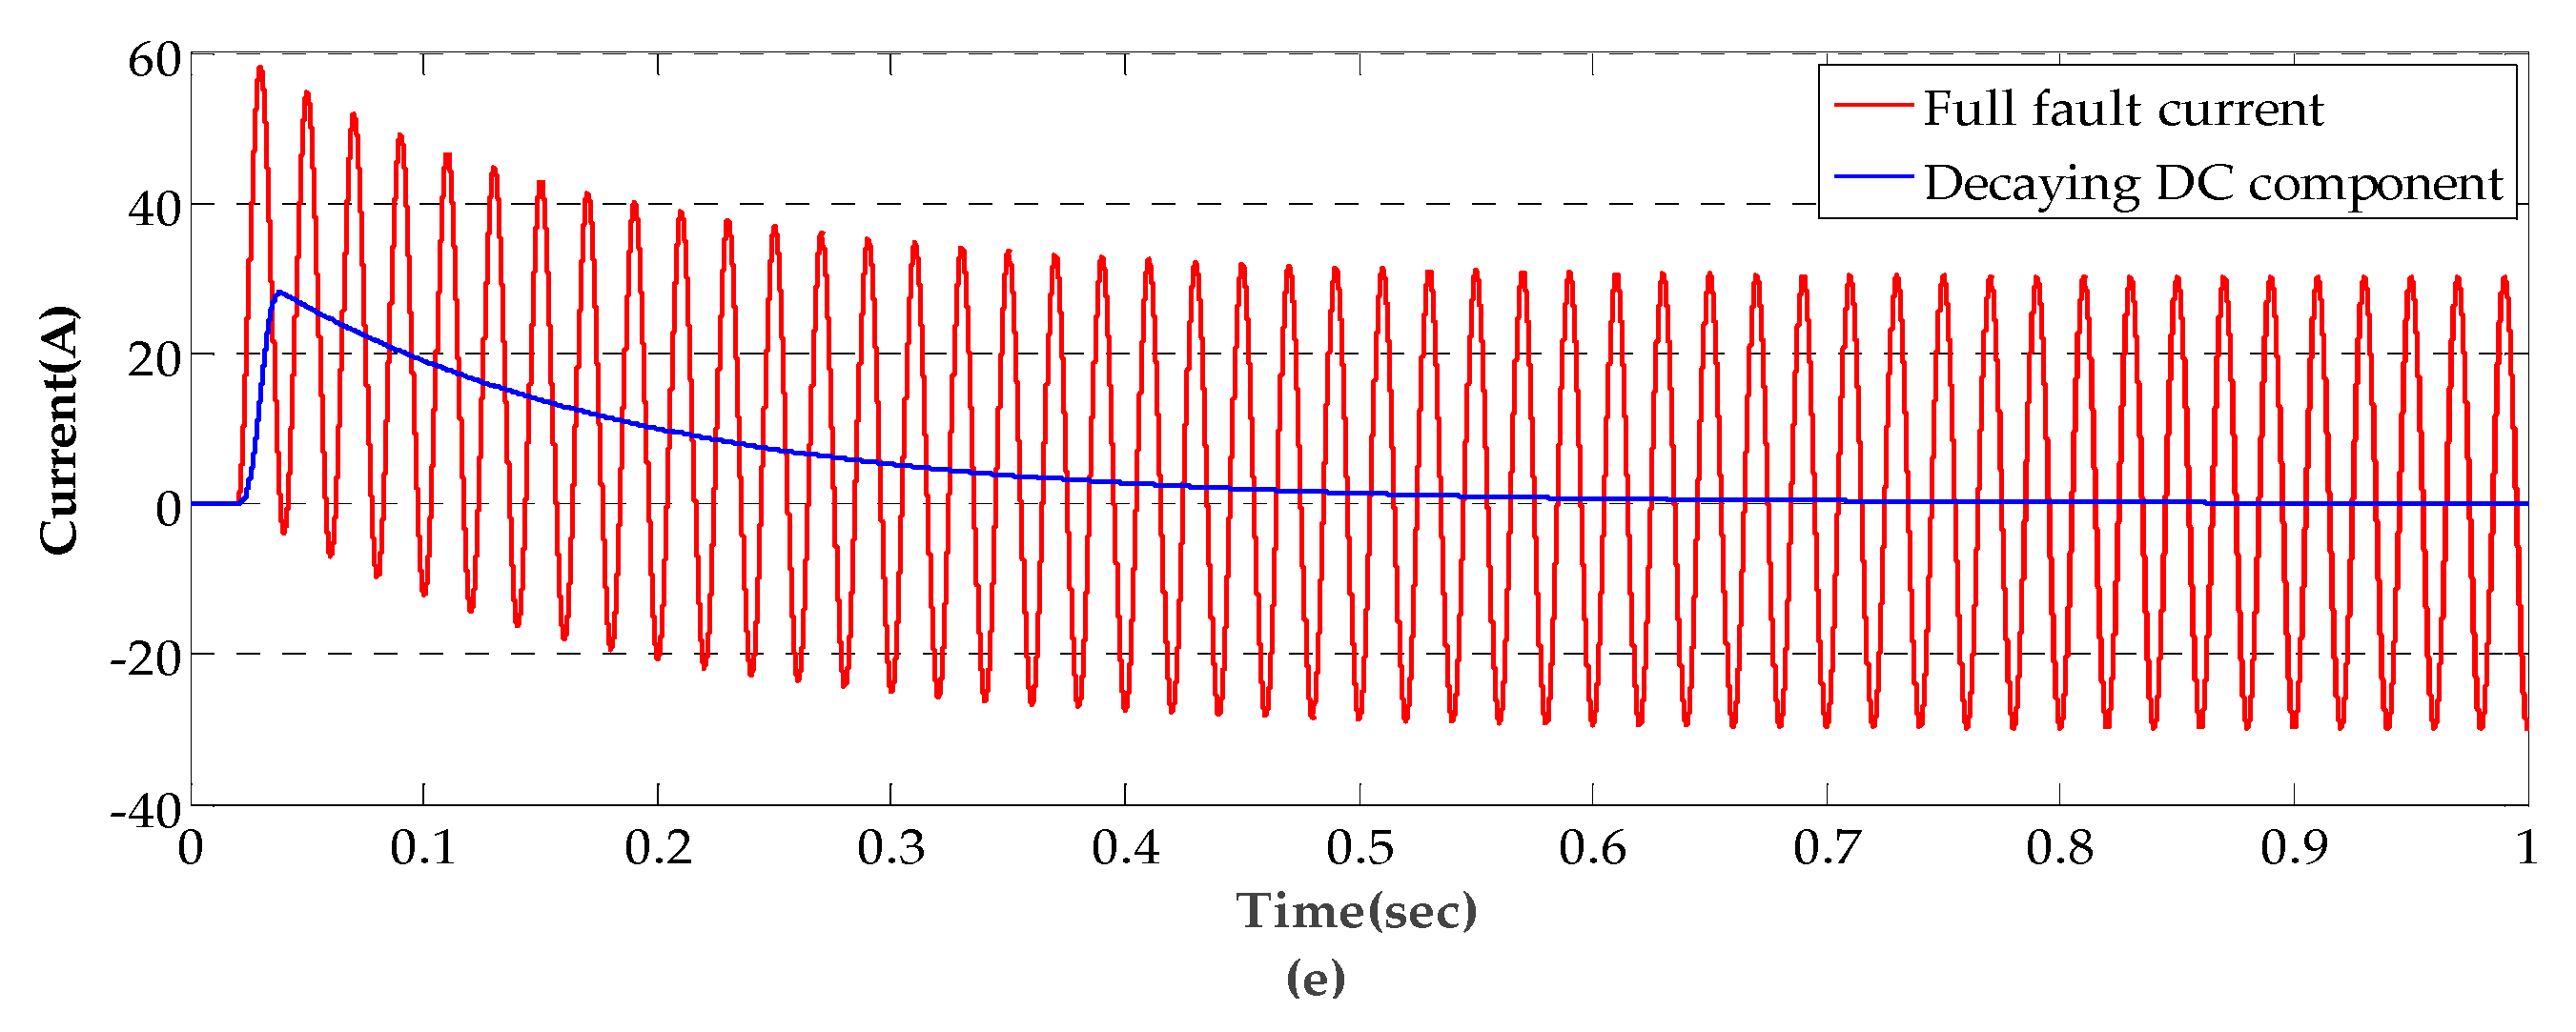
Equation (6) shows that the transient current in the anti-arc coil includes power frequency component and decaying DC component.
The zero-sequence current i 0 i in the sound line in the fault transient process is determined as follows:
i 0 i = i c 0 i = C 0 i d u 0 f d t = C 0 i L P d 2 i 0 Lp d t 2 = L P C 0 i ( 1 τ L ) 2 I 0 Lm cos φ e t τ L ω 2 I 0 Lm cos ( ω t + φ ) = i 0 i DC i 0 i AC
Moreover, the zero-sequence current i 0 n in the faulty line is described as follows:
i 0 n = i 0 L P + i = 1 n 1 i c 0 i = i 0 Lp + L P d 2 i 0 Lp d t 2 i = 1 n 1 C 0 i = [ I 0 Lm cos ( ω t + φ ) ω 2 I 0 Lm cos ( ω t + φ ) ] + [ I 0 Lm cos φ e t τ L + L P i = 1 n 1 C 0 i ( 1 τ L ) 2 I 0 Lm cos φ e t τ L ] = i 0 i AC + i 0 i DC
In Equations (7) and (8), i 0 i AC , i 0 i DC are the AC and DC components of the zero-sequence current, respectively.
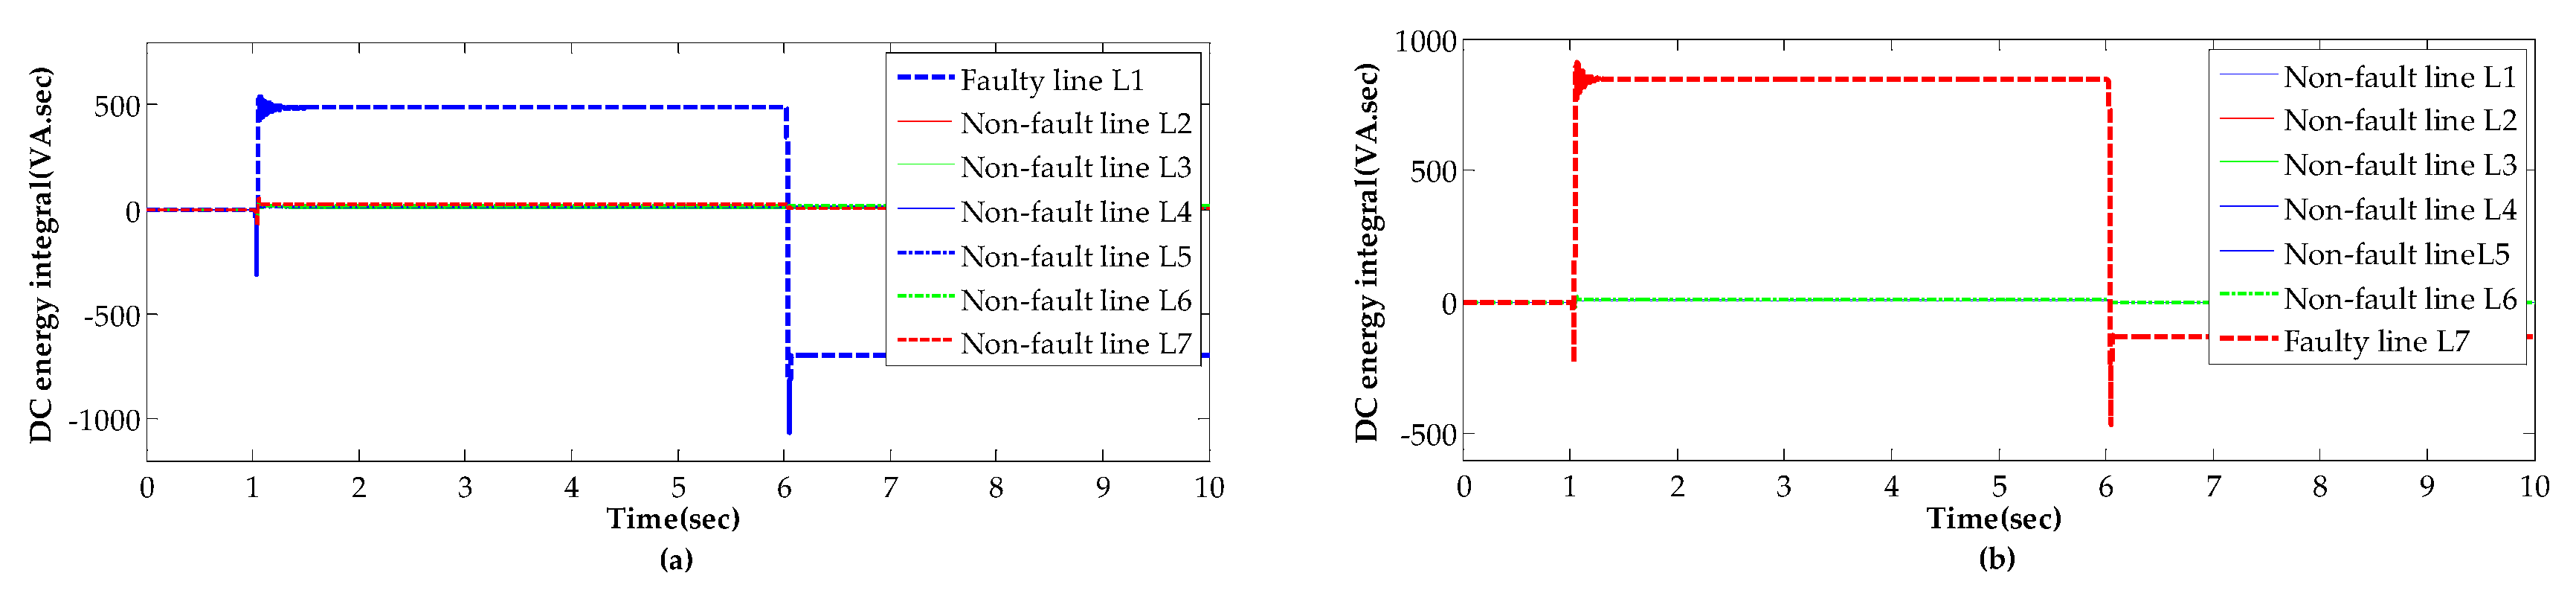
From the above analysis, it can be seen that in the case of a SPG fault, the currents in the anti-arc coil, the faulty line and the sound lines all contain attenuated DC components. The zero-sequence DC component of all lines at the bus is extracted and calculated in Equation (9), where i 0 n DC is the DC component attenuated in the faulty line and i 0 i DC is the the decaying DC component in the sound line. | | denotes the amplitude calculation:
| i 0 n DC i 0 i DC | = | I 0 Lm cos φ e t τ L + L P i = 1 n 1 C 0 i ( 1 τ L ) 2 I 0 Lm cos φ e t τ L | | L P C 0 i ( 1 τ L ) 2 I 0 Lm cos φ e t τ L | = i = 1 n 1 C 0 i C 0 i + 1 L P C 0 i ( 1 τ L ) 2 = i = 1 n 1 C 0 i C 0 i + L P R 2 C 0 i = i = 1 n 1 C 0 i C 0 i + L P C 0 i 1 R 2 > 1 + L P C 0 i 1 R 2
Equation (9) shows that the DC component of zero-sequence current in faulty line is larger than that of any sound line when a SPG fault occurs. Especially in the case of a metal SPG fault, the DC component of zero-sequence current in faulty line is much larger than that of sound line; even when a high-resistance SPG fault occurs, due to the fact L P C 0 i R 2 0 , but i = 1 n 1 C 0 i C 0 i > 1 is always satisfied, which still indicates that the zero-sequence DC component in the faulty line is the largest.
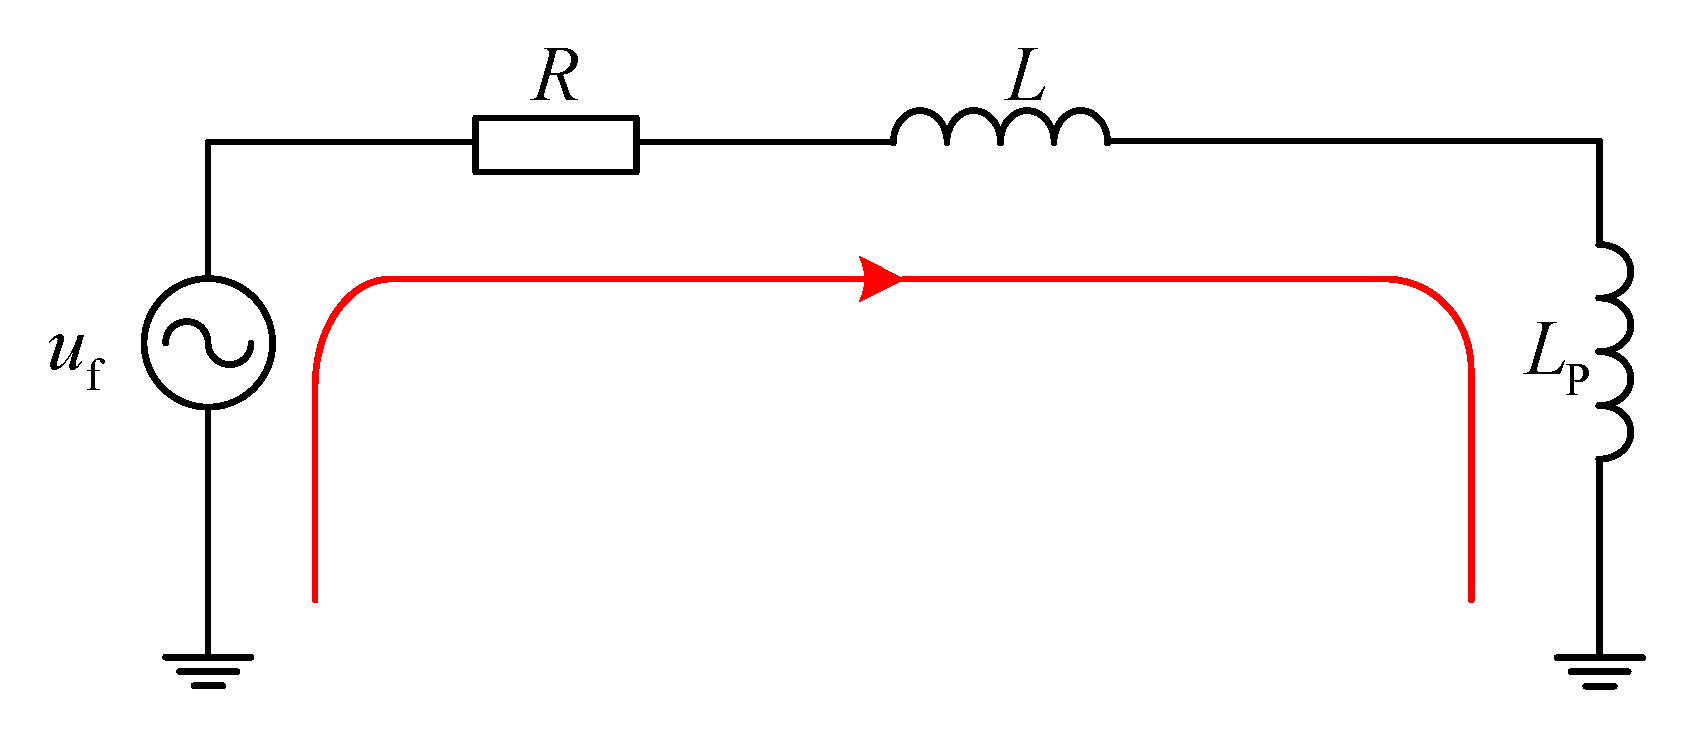
It can be seen from Equation (9), in the condition of a SPG fault in RGDN, the DC component of the zero-sequence current of the faulty line is much larger than that of the sound line, so a large number of DC components only constitute a loop between the anti-arc coil, the faulty line and the grounding resistance. The simplified equivalent circuit of zero-sequence DC component is shown as Figure 3. In which, R is the equivalent resistance from the fault point to the bus side and the tripled grounding resistance; L is the equivalent inductance from the fault point to the bus side.
Through the analysis above, it can be seen that the fault current in the anti-arc coil contains abundant DC components, which is mainly distributed between the faulty line and the grounding resistance and forms a circuit. That means that the zero-sequence DC component distributed in the sound line is very weak. Therefore, the DC component in zero-sequence can be used to develop FLS method, and a FLS scheme using energy integral of DC component in zero-sequence is developed in the following.

3. FLS Scheme Using Energy Integral of Zero-Sequence DC Component

According to the analysis in Section 2, the current in the anti-arc coil in SPG fault contains the steady-state power frequency component and the decaying DC component. As the anti-arc coil is designed according to power frequency, there is almost no high harmonics in the current of the anti-arc coil. The DC component mainly forms a loop in anti-arc coil, faulty line and grounding point, while the DC component is weak in the sound line. By using this feature, the DC component in zero-sequence of all lines is extracted for energy integral to FLS.
After a SPG fault occurs, the displacement voltage of neutral point and zero-sequence current of all lines are collected under the same data window, and the DC component is extracted. The power of zero-sequence DC component of each line is calculated respectively. Equation (10) determined the power of any sound line:
P 0 i DC = u 0 f i 0 i DC = u 0 f L P C 0 i ( 1 τ L ) 2 I 0 Lm cos φ e t τ L
Similarly, Equation (11) described the power of the faulty line:
P 0 n DC = u 0 f i 0 n DC = u 0 f ( I 0 Lm cos φ e t τ L + L P i = 1 n 1 C 0 i ( 1 τ L ) 2 I 0 Lm cos φ e t τ L )
where i is the number of the faulty line, u 0 f is the displacement voltage. P 0 i DC is the power of zero-sequence DC of any sound line and P 0 n DC 
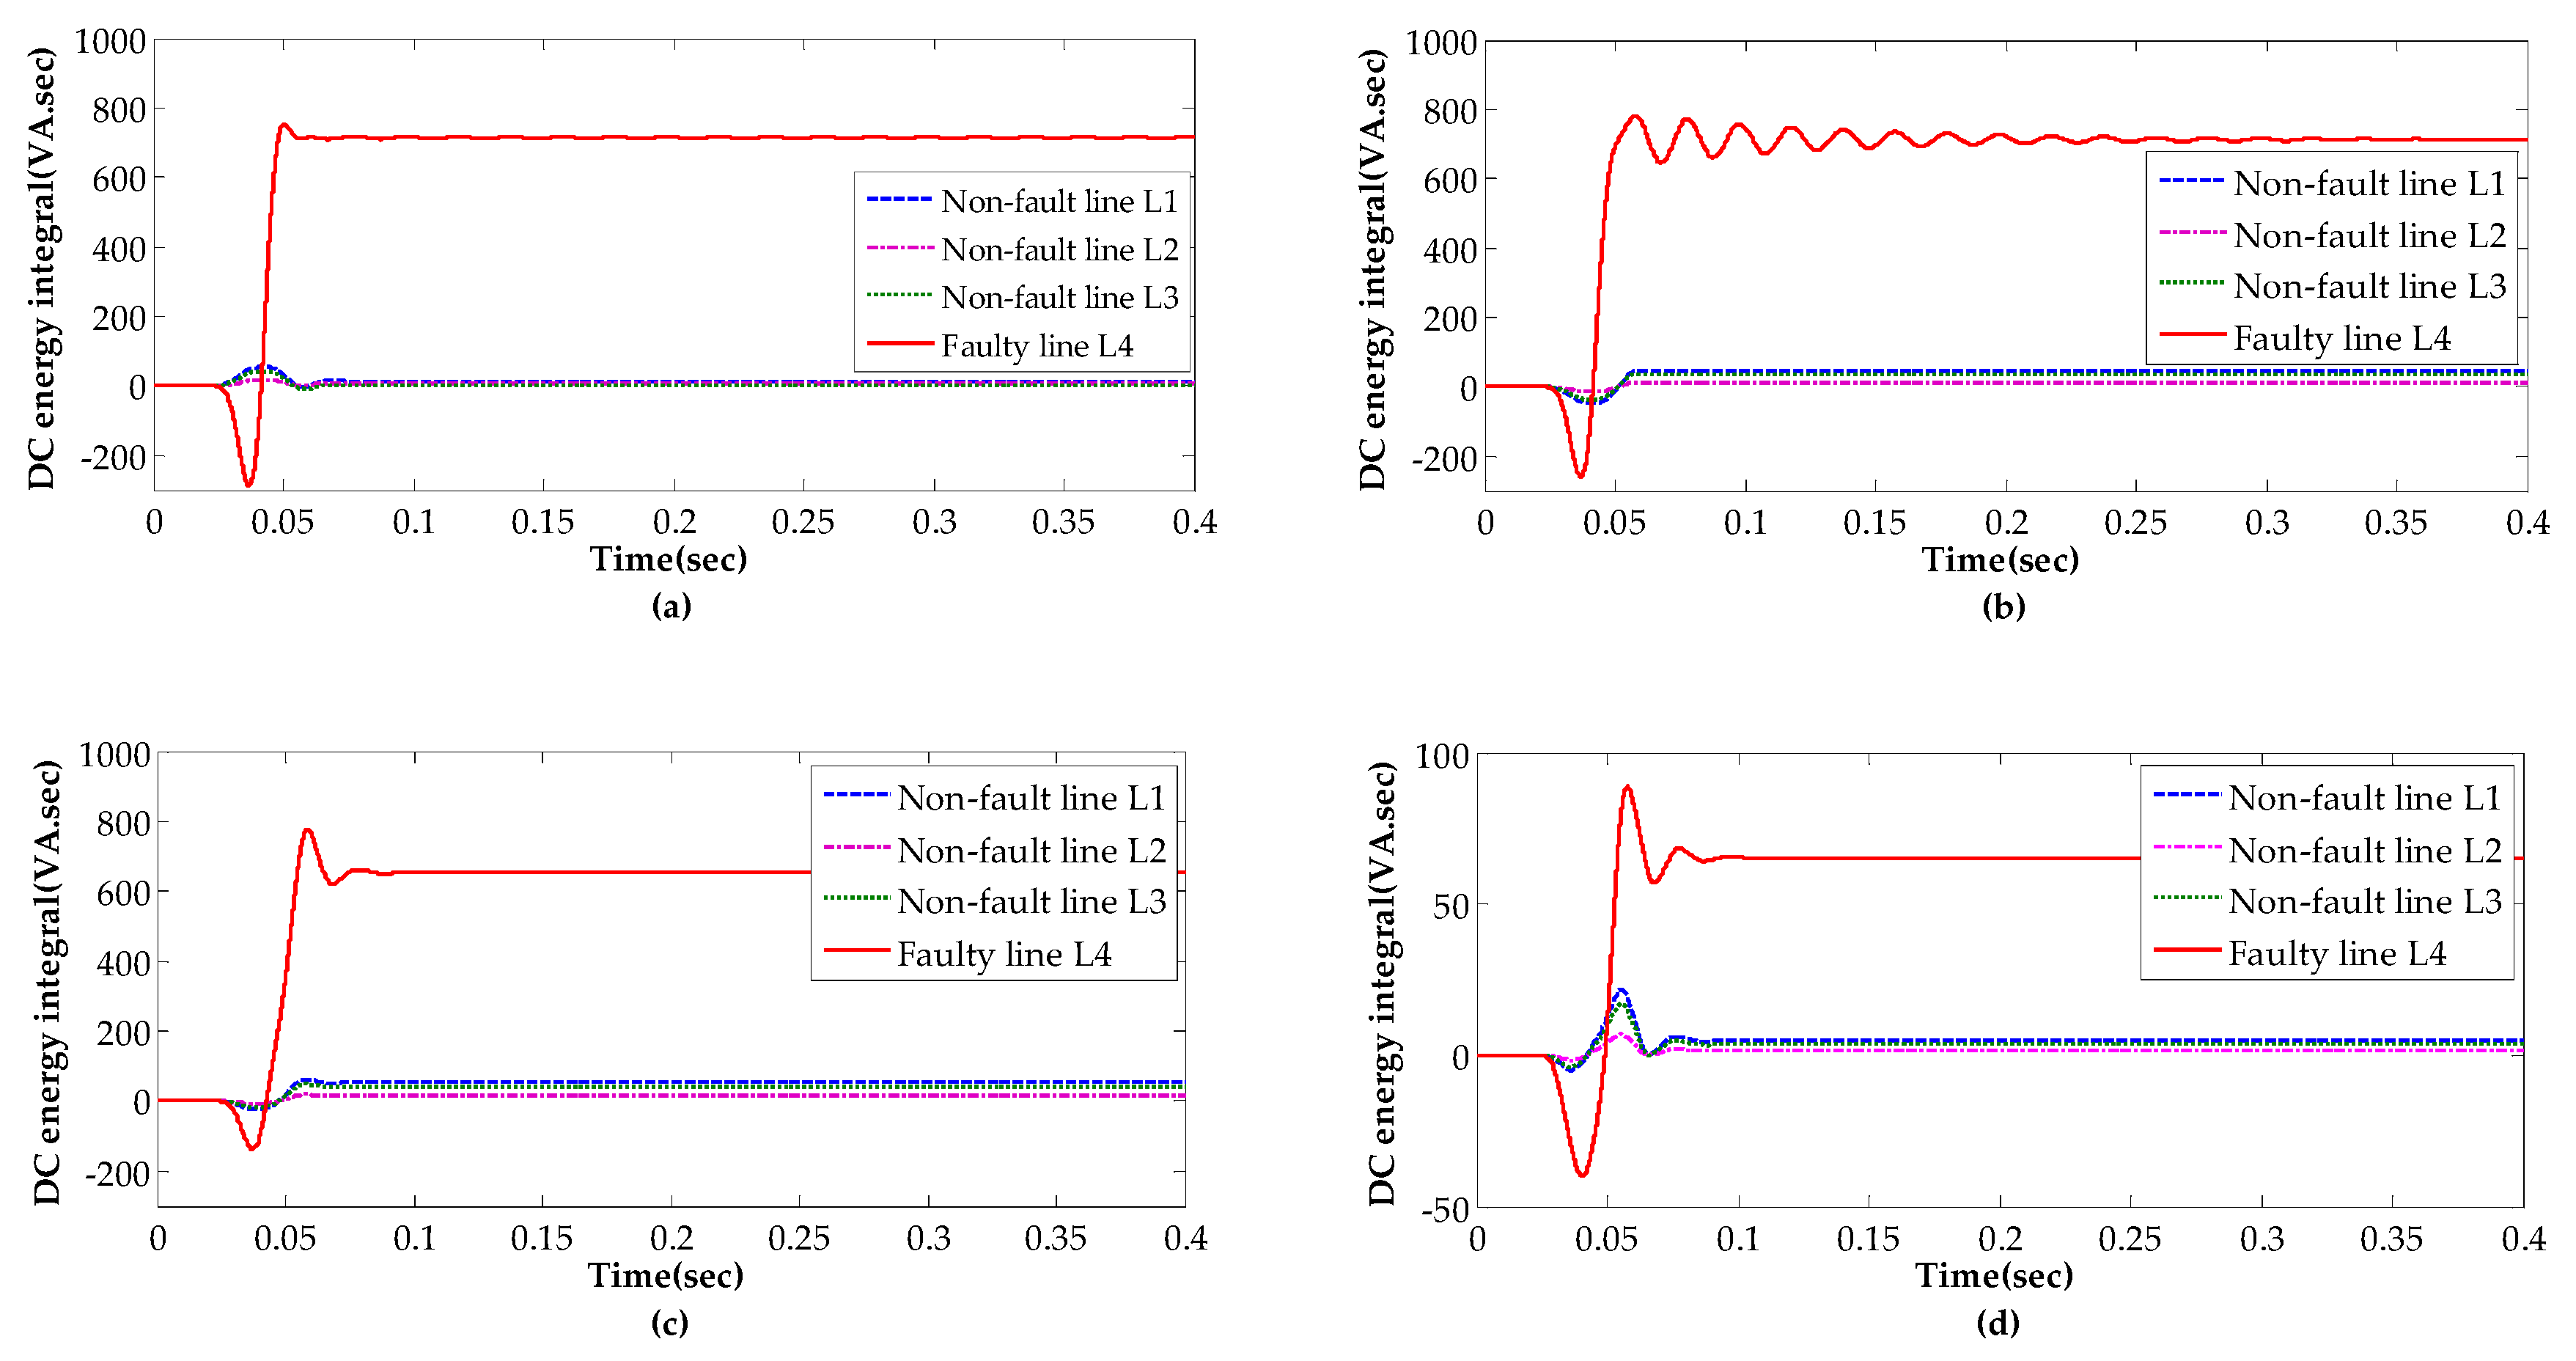
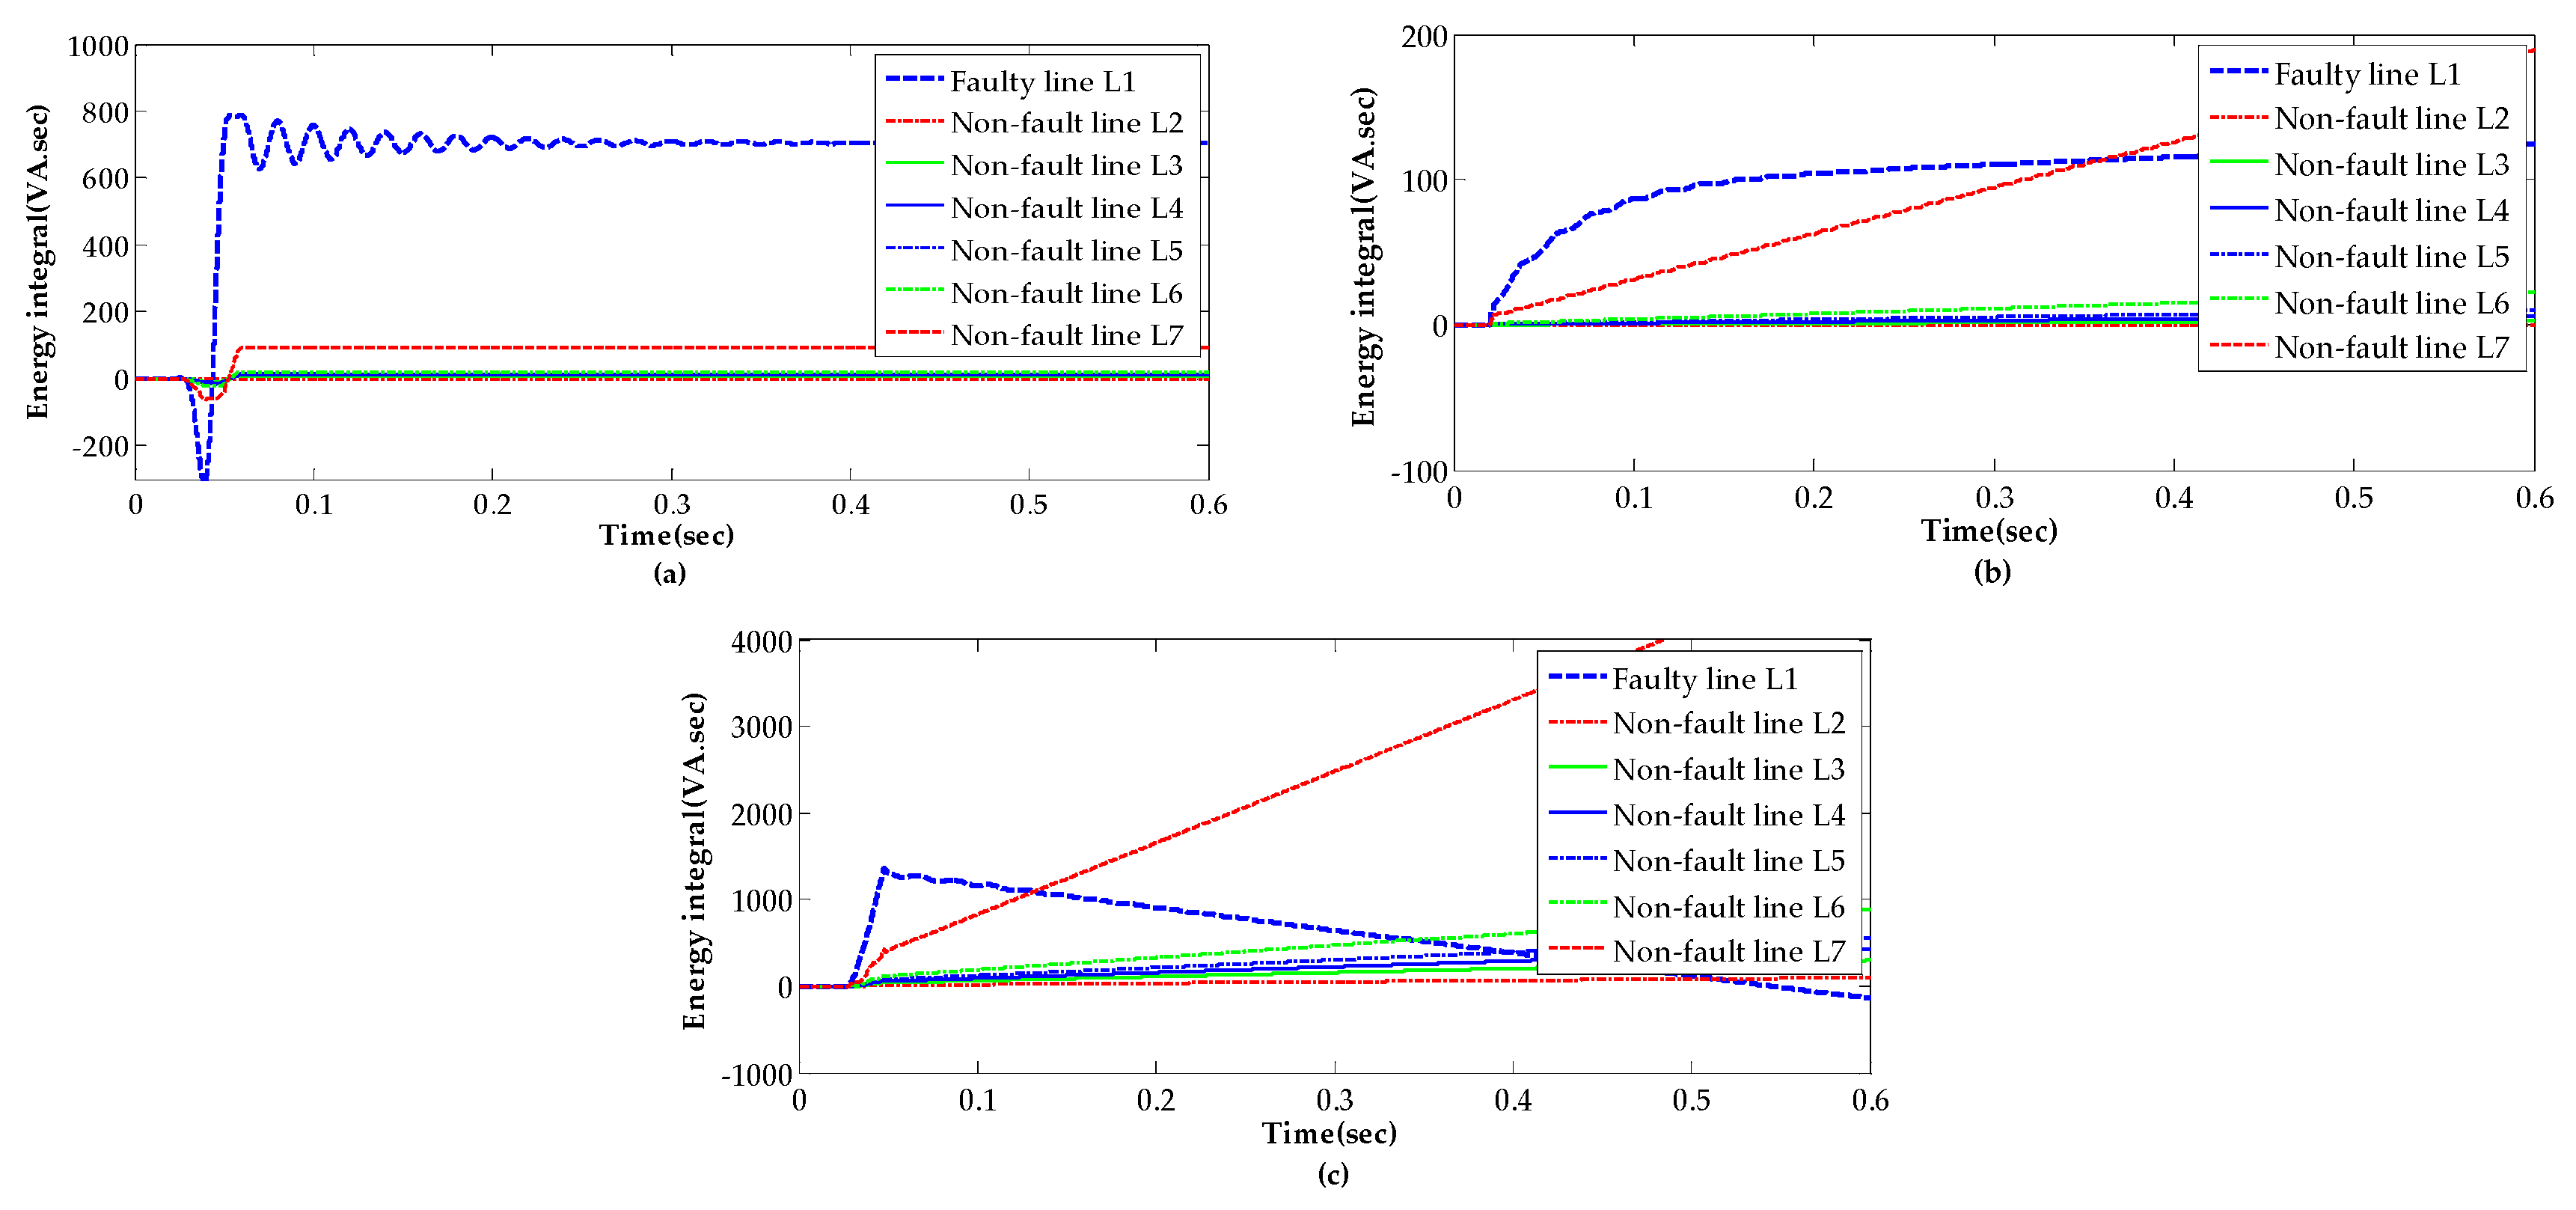
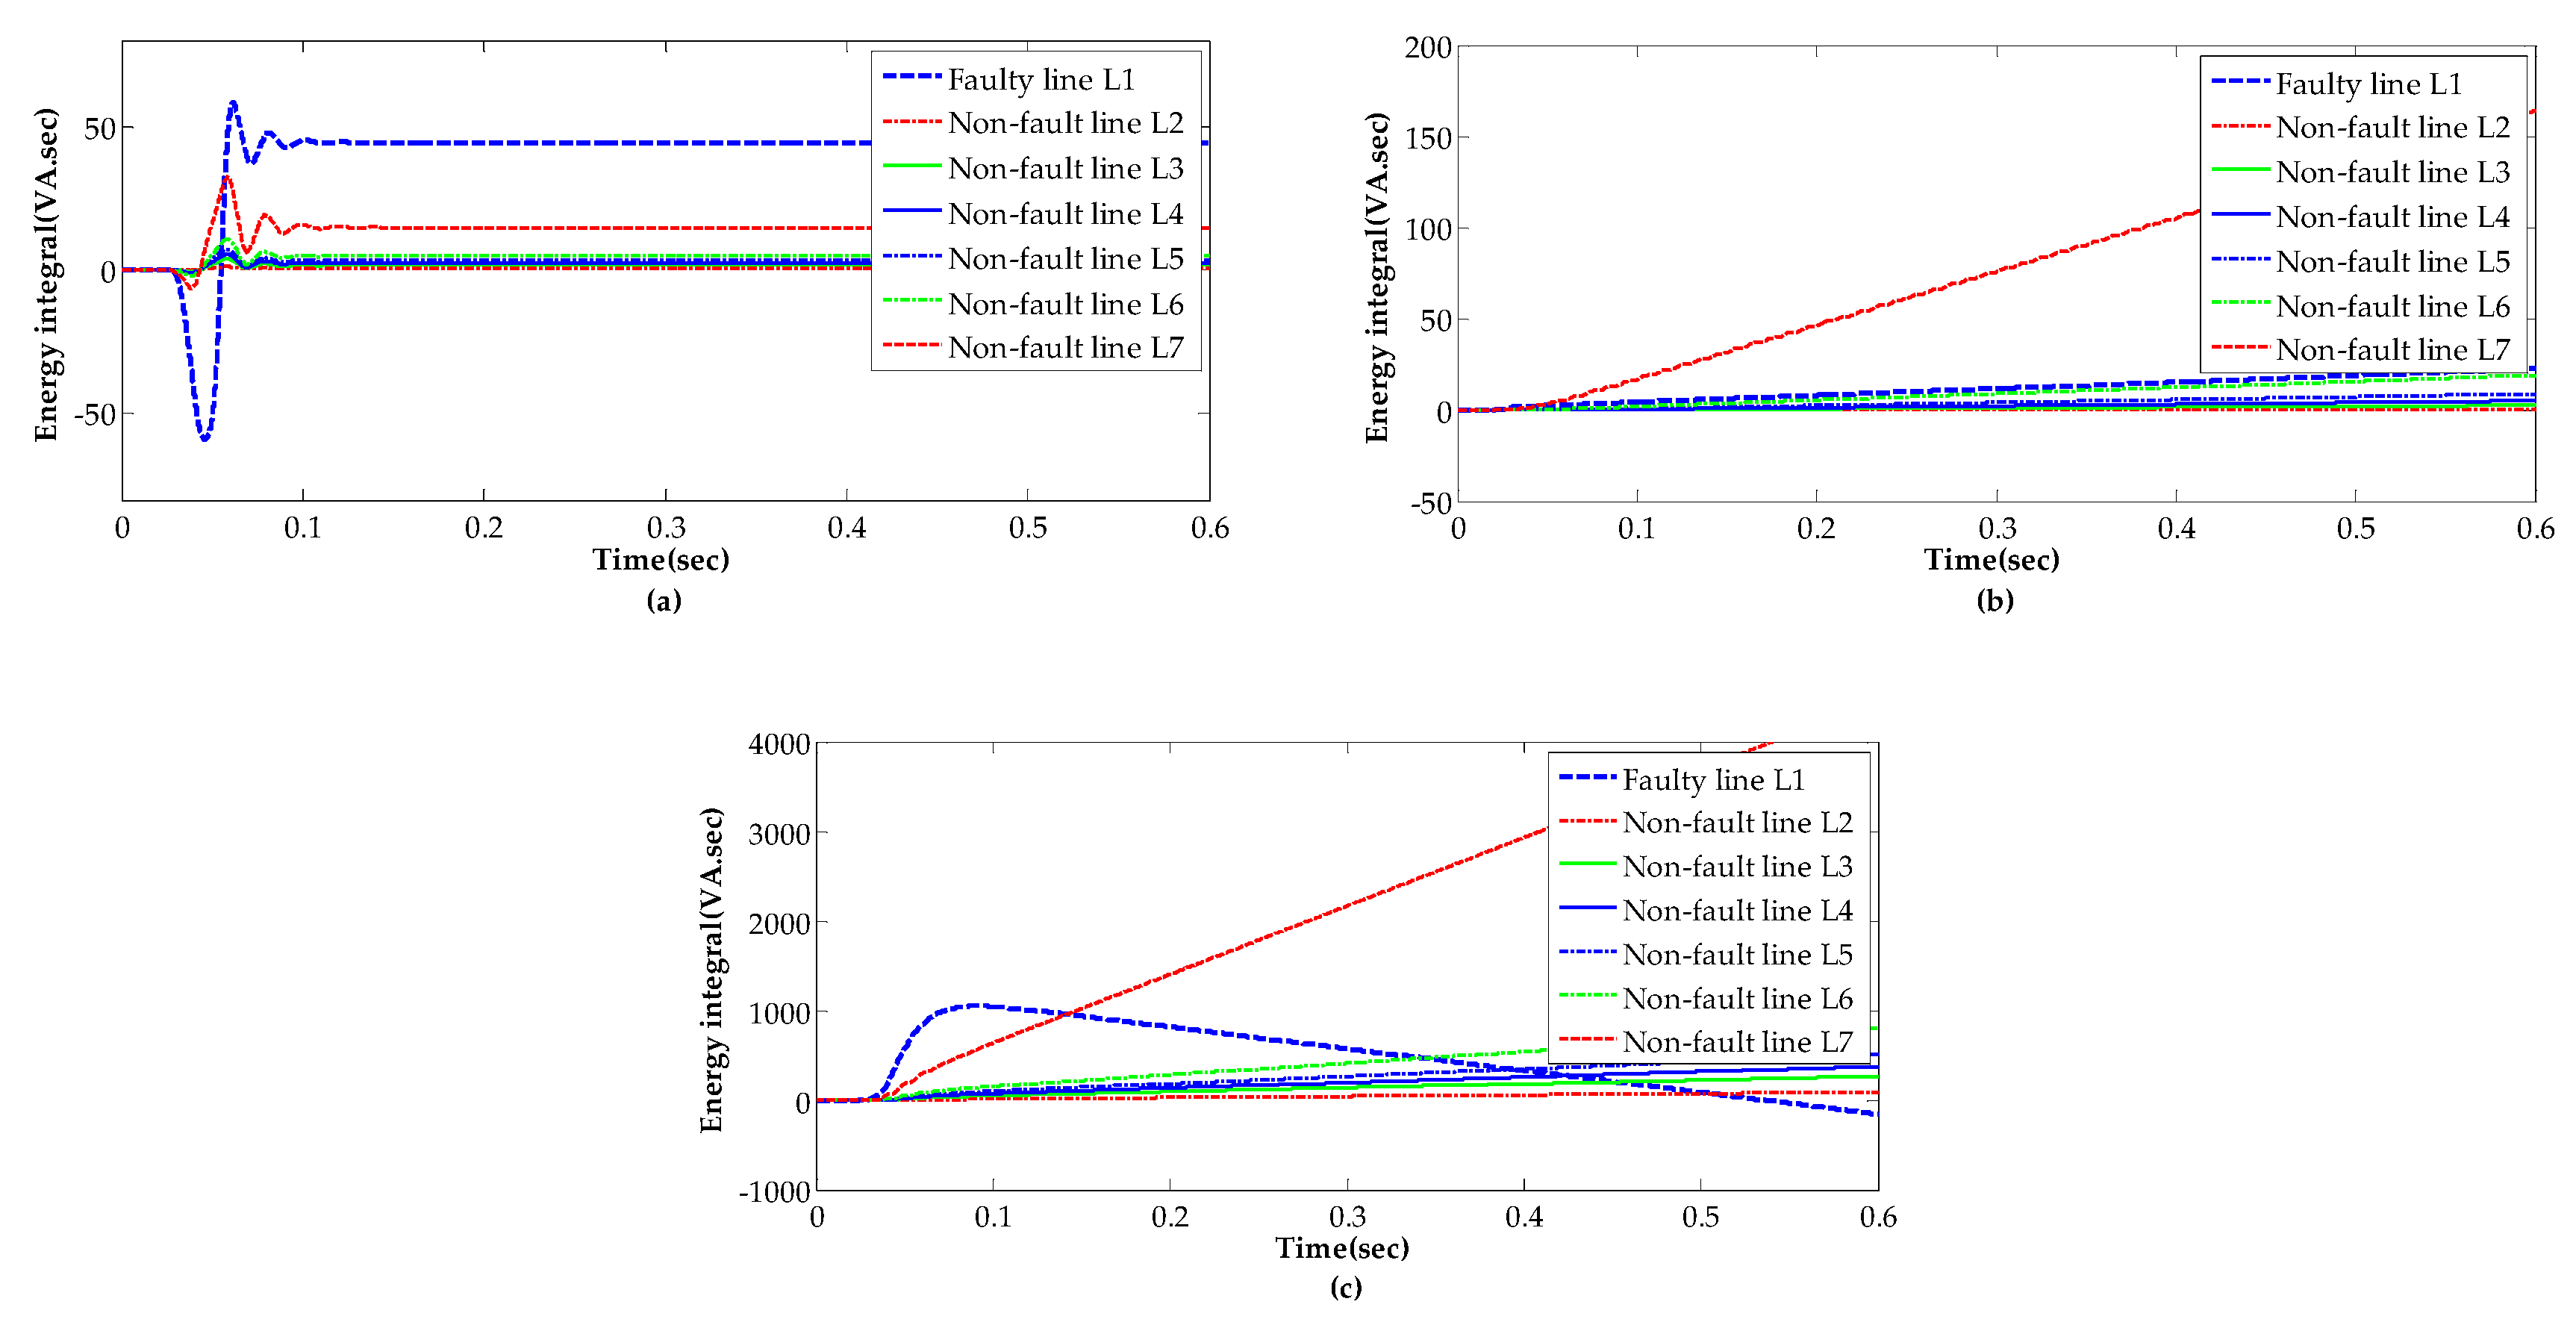
is the power of zero-sequence DC of the faulty line. The zero-sequence DC energy of the sound line is obtained by power integral in the same time domain as shown in Equation (12):
W 0 i DC = t 0 t 0 + t P 0 i DC d t = [ L P C 0 i ( 1 τ L ) 2 I 0 Lm cos φ e t τ L | t 0 t 0 + t ] t 0 t 0 + t u 0 f d t = τ L ( e t 0 τ L e t 0 + t τ L ) I 0 Lm cos φ L P C 0 i ( 1 τ L ) 2 t 0 t 0 + t u 0 f d t
and that of the faulty line is shown as follows:
W 0 n DC = t 0 t 0 + t P 0 n DC d t = [ t 0 t 0 + t I 0 Lm cos φ e t τ L d t + t 0 t 0 + t L P i = 1 n 1 C 0 i ( 1 τ L ) 2 I 0 Lm cos φ e t τ L d t ] t 0 t 0 + t u 0 f d t = [ τ L e t τ L I 0 Lm cos φ τ L e t τ L L P i = 1 n 1 C 0 i ( 1 τ L ) 2 I 0 Lm cos φ ] | t 0 t 0 + t t 0 t 0 + t u 0 f d t = τ L ( e t 0 τ L e t 0 + t τ L ) I 0 Lm cos φ ( 1 + L P i = 1 n 1 C 0 i ( 1 τ L ) 2 ) t 0 t 0 + t u 0 f d t
Thus, Equation (14) gives the DC power integral ratio between the faulty line and the sound line:
W 0 n DC W 0 i DC = τ L ( e t 0 τ L e t 0 + t τ L ) I 0 Lm cos φ ( 1 + L P i = 1 n 1 C 0 i ( 1 τ L ) 2 ) t 0 t 0 + t u 0 f d t τ L ( e t 0 τ L e t 0 + t τ L ) I 0 Lm cos φ L P C 0 i ( 1 τ L ) 2 t 0 t 0 + t u 0 f d t = 1 + L P ( 1 τ L ) 2 i = 1 n 1 C 0 i L P C 0 i ( 1 τ L ) 2 > 1 + L P C 0 i R 2
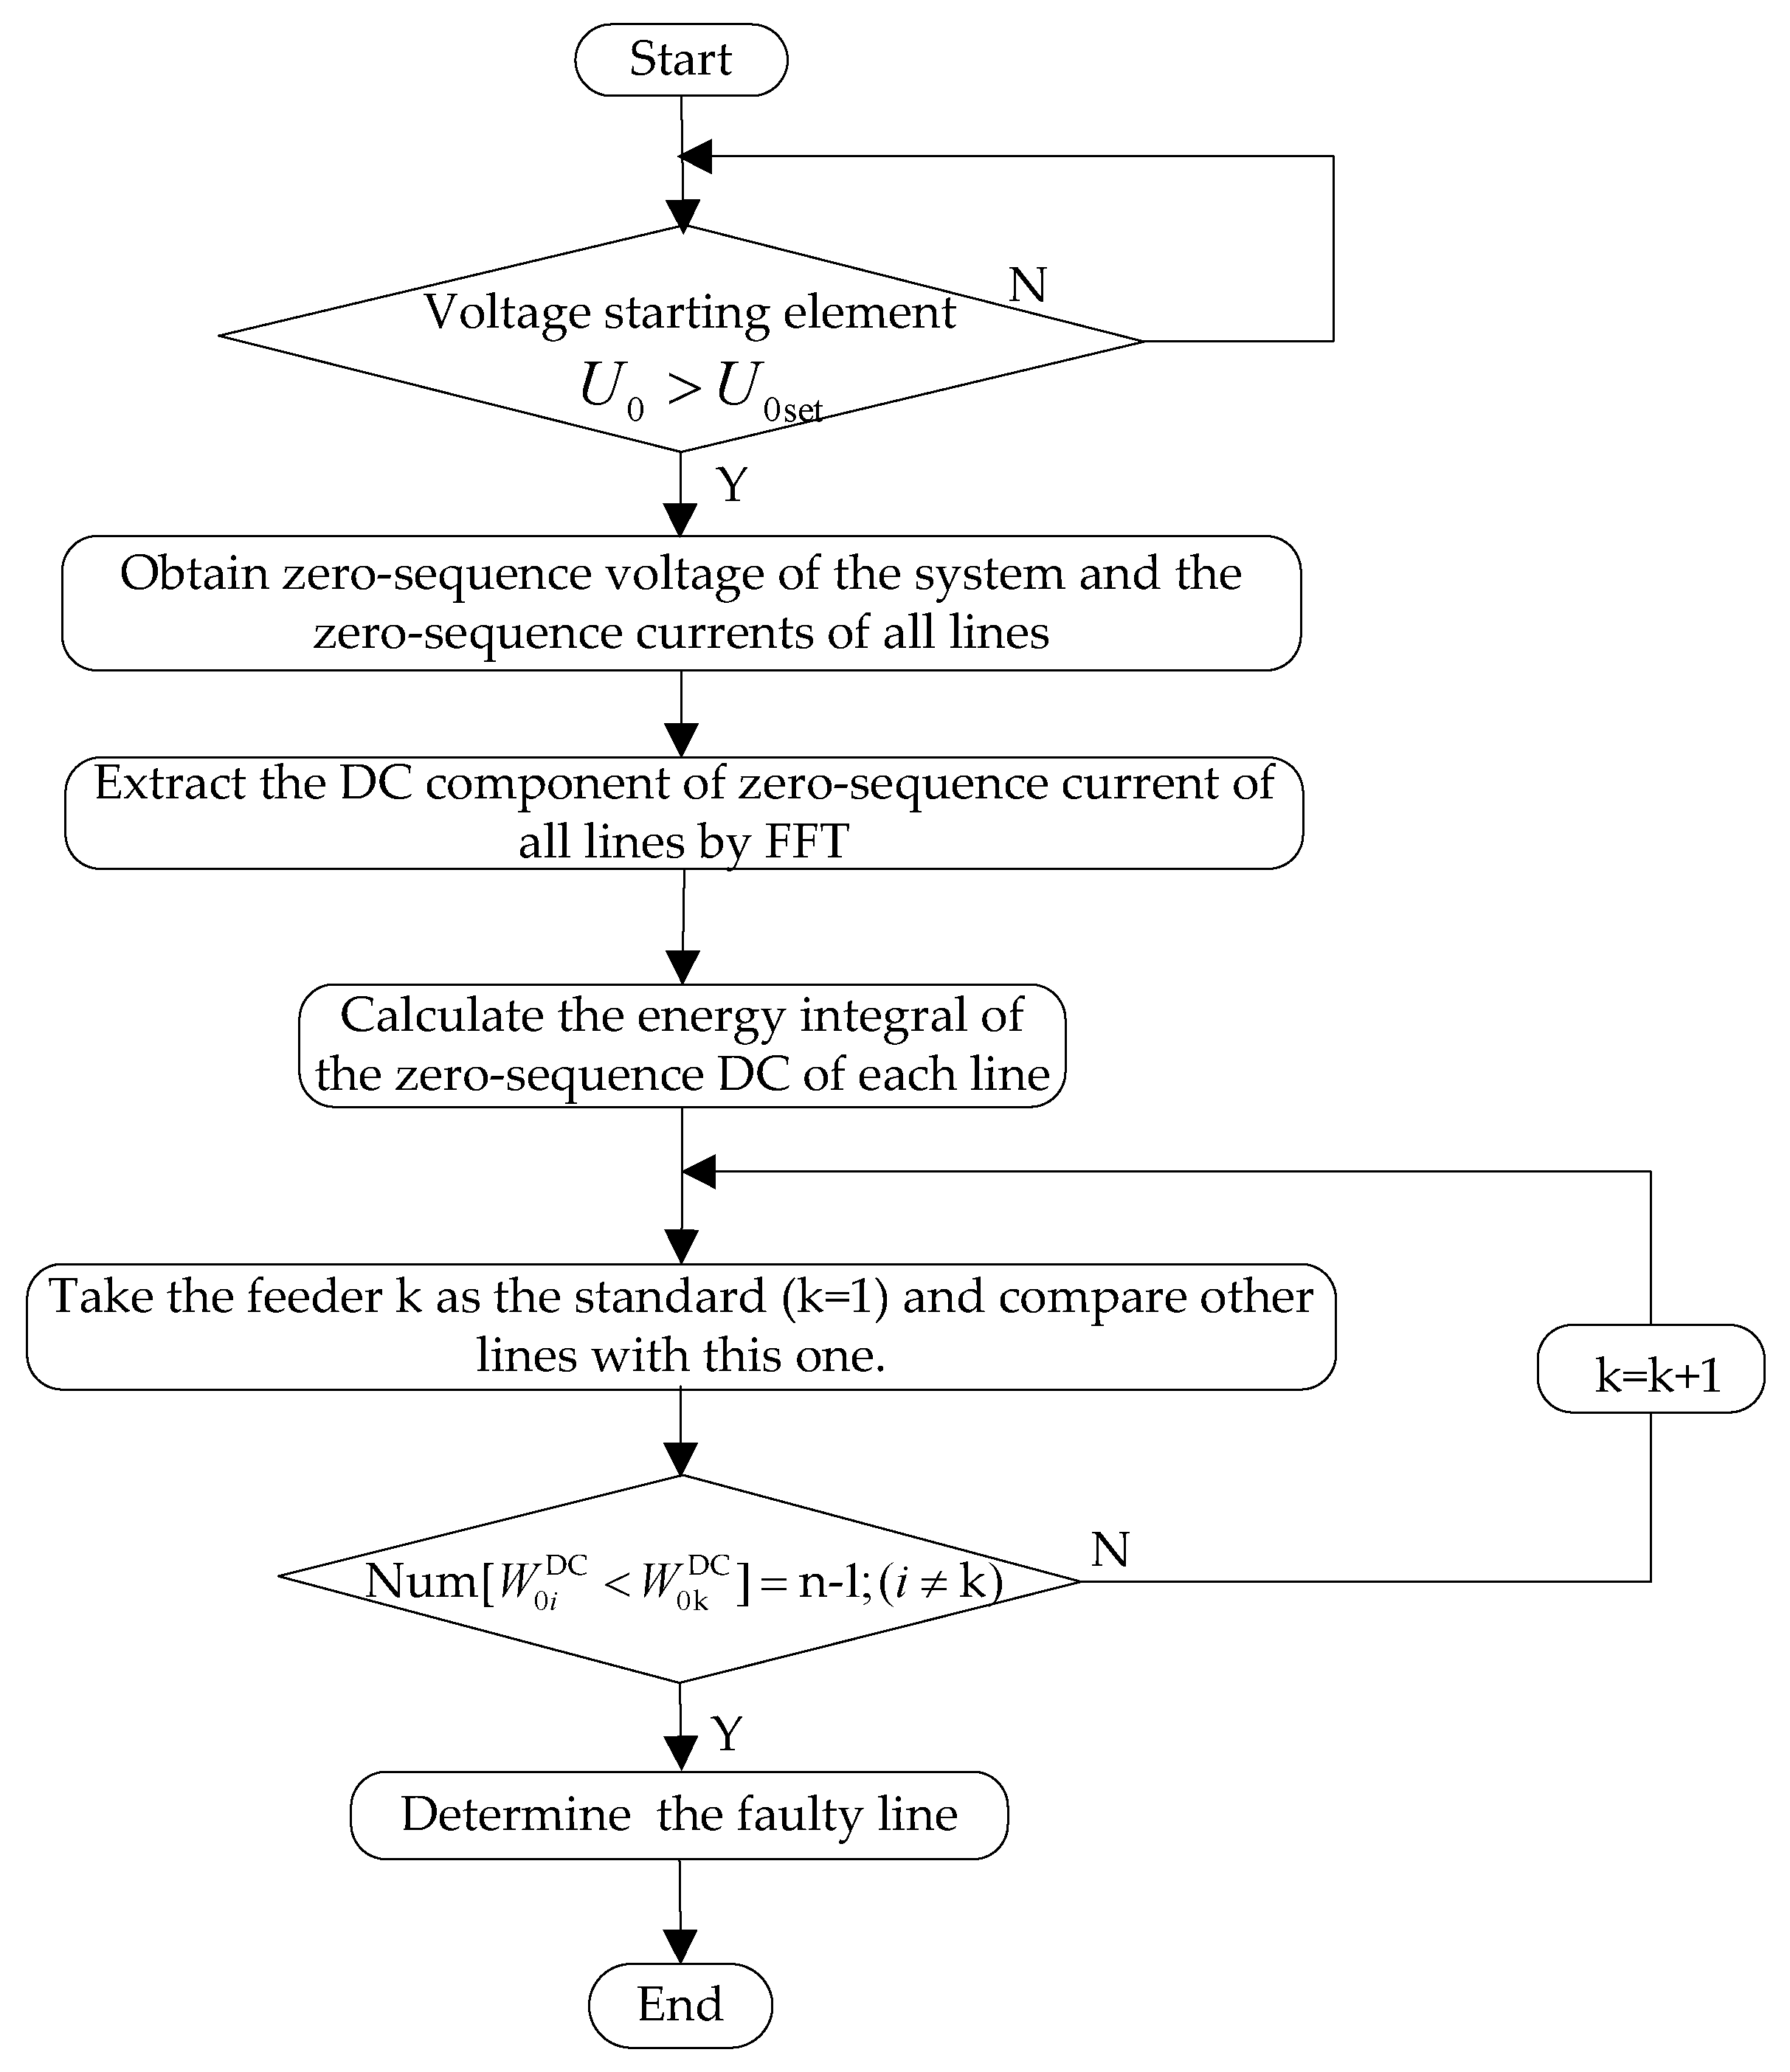
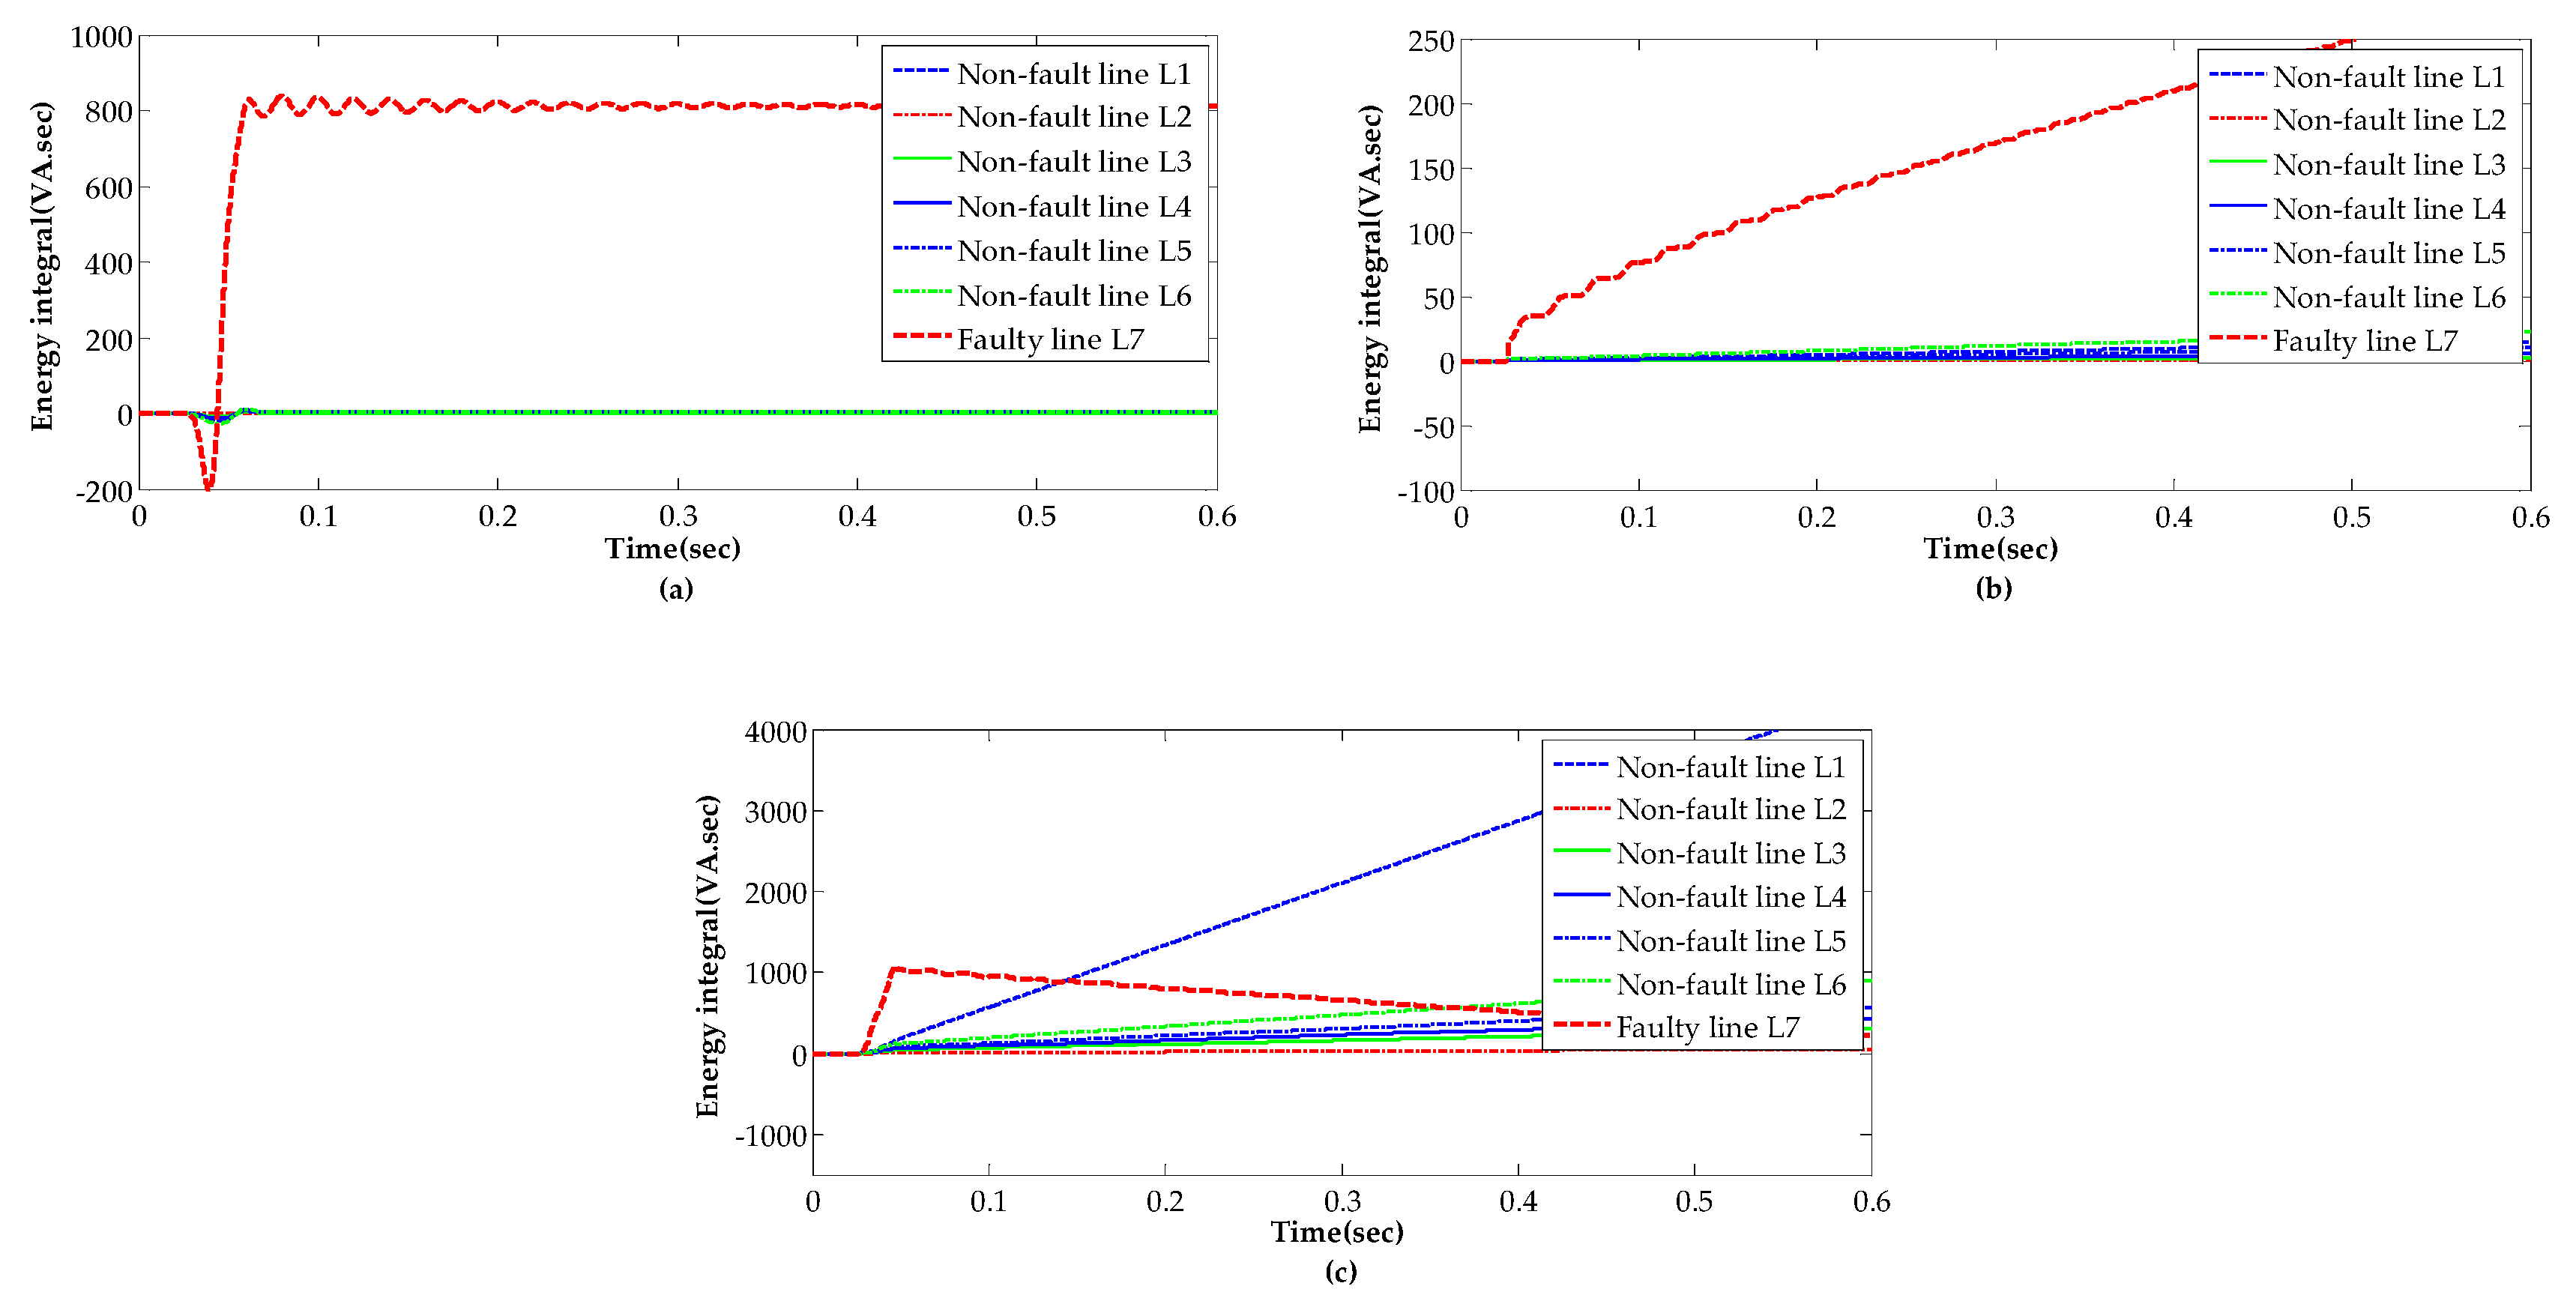
Analysis of Equations (7)–(14) shows that there is a notable DC component in the zero-sequence current of the faulty line, but the DC component in the zero-sequence current of the sound line is poor. Thus, using the same zero-sequence voltage, the DC energy in zero-sequence of the faulty line will be much larger than that of the sound line, and even in the case of a high resistance SPG fault, the DC energy in the zero sequence of the faulty line is higher than in any sound line. Therefore, the difference can be used to FLS in the condition of SPG faults. The FLS method based on the zero-sequence current feature recognition is shown in Figure 4.
The proposed FLS scheme implementation steps are described as follows:
  • Step 1: Collect the bus terminal zero-sequence voltage in real time and judge whether that zero-voltage element exceeds the setting value, if not, return to continue; else, the system may occurred a SPG fault, perform the next step.
  • Step 2: Obtain the zero-sequence currents of all lines and extract the DC component by fast Fourier transform (FFT), then calculate the energy integral of the zero-sequence DC current of each line.
  • Step 3: By comparing the DC energy of all lines one by one, the line with the largest energy integral is identified as the faulty line and the result feedback to fault processing system timely.
On the above steps and processes of the faulty line selection, when a SPG fault occurs, the FLS device is started, and the line with the largest DC energy is selected as the faulty line. Moreover, lots of simulations are carried out for a typical 10 kV RGDN in the next section.

4. Simulation Study

4.1. Simulation Modeling

In order to verify the effectiveness and reliability of the scheme proposed in this paper, a 10 kV distribution network as shown in Figure 5 is developed using MATLAB software (R2013a, MathWorks, Natick, MA, USA), which includes four lines, line L1 is a 6 km cable line, line L2 is a 17 km overhead line, and e line L3 is a hybrid line of 3 km cable line and 12 km overhead line, and line L4 is a hybrid line of a 4 km cable line and a 14 km overhead line. The over-compensation degree of the anti-arc coil is 10% and its equivalent inductance is 0.794 H; and the transformer ratio is 110 kV/10.5 kV, and its rated capacity is 10 MVA. Each line is in the operation with a 1.8 MVA load. In addition, the parameters per kilometre for the lines are shown in Table 1.

4.2. Performance Analysis

In the following simulation analysis, first, in order to verify the difference of the DC components between the faulty line and the sound line, a typical SPG fault is simulated. Suppose that a SPG fault occurs on line L4, at 8 km away from the bus, and grounded through a resistance of 10 Ω , and at a 45 ° initial phase angle on the fault time. The full current and the decaying DC component in zero-sequence of the four lines and the anti-arc coil are shown in Figure 6a–e, respectively. Figure 6a–c shows the fault currents in the sound lines L1, L2, L3, respectively, where is obvious that the DC component in any sound line is slight, and it decays completely in even less than a power frequency cycle.
However, the results in Figure 6d,e show that the DC components in the faulty line L4 and the anti-arc coil are attenuated for a long time, in which the DC component forms a loop in the anti-arc coil, the faulty line and the fault point, so the DC component in the faulty line is greater than that of the sound line.
Moreover, a variety of simulations on the line L4 under different SPG faults such as fault distance and fault resistance, etc., are carried out to validate the different DC component characteristics of the sound line and the faulty line. The percentage of DC component to power frequency is calculated in a cycle after the occurrence of SPG faults, and the results are shown in Table 2, Table 3 and Table 4.
In Table 2, Table 3 and Table 4, the percentage of the DC component in the faulty line L4 is larger than 50% under a lot of SPG faults such as different initial phase angles, and fault locations and grounding resistance, but unlike the faulty line, the percentage of the DC components in the sound lines is nearly close to 25%, even the maximum percentage of those is under 30% which is far away from that of the faulty line. Therefore, the difference of the DC component between the faulty line and the sound lines is helpful to employed for FLS in RGDN.
Consequently, the energy integral of the DC component shown in Equations (12) and (13) are employed to deal with FLS, in which the calculated sampling data is 5 ms. The simulation results under different SPG fault conditions are given as follows. In which, considering the SPG faults occurring at 8 km away from the bus with different initial phase angle, and grounding resistances, the results are shown in Figure 7 and Figure 8.
From Figure 7, it can be seen that the energy integral of the decaying DC component in zero-sequence of the faulty line is much higher than that of the sound line in SPG fault condition with different grounding resistances, either a solid SPG fault or a high impedance SPG fault, the DC energy integral in the faulty line is of significant difference to that of the any sound line. The faulty line can be accurately identified by using DC energy integral.
It should be pointed out that the transient SPG fault occurred in RGDN is often accompanied by a continuous arc phenomenon, which may cause high-frequency oscillation components during the arcing period. In [24], it was shown that the arc resistance is approximately equal to zero at the initial stage of a SPG fault, but with the compensation of anti-arc coil and the attenuation of harmonics, the arc length and the arc resistance both increase gradually until the arc resistance tends to infinity that means the fault disappears. The proposed energy-based FLS algorithm uses the fault information from transient period to steady period, thus the results may be larger fluctuations due to the change of arc resistance in the transient period, and it tends to be stable with the increase of harmonic attenuation and fault arc resistance. Finally, the energy integral results in steady period is stable and employed for faulty line identification, thus the proposed method is independent of the transient arcing effect.
As seen from Figure 8, the energy integral value of the DC component in zero-sequence of the faulty line is tens to hundreds times of that of the sound line during SPG faults for different fault initial phase angles. As a result, the faulty line is distinguished accurately from sound lines.
Moreover, in order to test the validity and effectiveness of the proposed FLS scheme using energy integral DC component, a lot of simulations in the conditions of different initial phase angles, fault locations and resistances are carried out to test this method. The results are listed in Table 5, Table 6 and Table 7.
Besides, it is obvious that the DC energy integral of any sound line is lower than 100 VA·s, but that of the faulty line is greater than that of any sound line, even in the case of SPG faults with 90° fault initial phase angle or grounded through a high impedance of 500 Ω. Thus, the line with maximum of the DC energy integral is the corresponding faulty line. Simulation results verified the effectiveness and reliability of of the proposed FLS method, which is independent of the different fault conditions such as fault location, fault initial phase angle, and fault resistance, etc.

4.3. Analysis of Other Conditions

Considering the trend of distributed generation connected to distribution network and the gradual cabling of main lines in urban distribution network, the distribution network shown in Figure 9 is used for the following simulation analysis. In Figure 8, which includes seven lines:
  • the line L1 is a 5 km cable line;
  • the line L2 is a 20 km over-head line;
  • the line L3 is a hybrid of a 2 km cable line and a 15 km over-head line;
  • the line L4 is a hybrid of a 3 km cable line and a 10 km over-head line;
  • the line L5 is a hybrid of a 4 km cable line and a 12 km over-head line;
  • the line L6 is a hybrid of a 6 km cable line and a 13 km over-head line;
  • the line L7 is a hybrid of a 18 km cable line and a 5 km over-head line;
in which, the over-compensation degree of anti-arc coil is 10% and its equivalent inductance is 0.277 H; and the transformer ratio is 110 kV/10.5 kV, and its rated capacity is 20 MVA. Each line is in the operation with a 1.8 MVA load. In addition, the parameters per kilometre for the lines are consistent with Table 1 shown above.
(1) Effect of the connected distributed power
In order to simplify the configuration of relay protection and improve the reliability of power supply, it is advisable to adopt neutral point non-grounding mode for the distributed sources connected to RGDN in [25], which means that the zero sequence circuit is independent of the distributed generation when a SPG fault occurs. Therefore, the zero-sequence component-based FLS scheme is not affected by the distributed generation theoretically.
(2) Effect of anti-arc coil saturation
It is certain that even harmonics and large amplitudes can be detected in the field due to the saturation of the anti-arc coil, which may be caused by a severe overvoltage at the neutral point in the condition of a SPG fault or switching operation. Moreover, high-order harmonics and high peak voltage may generated by ferromagnetic resonance of the transformer and lines, large excitation current may lead to the saturation of anti-arc coil, which makes it is difficult to accurately collect information. In order to reduce the influence caused by saturation of anti-arc coil, it generally adopts a damping resister for the anti-arc coil to the RGDN in China, and [26] shows that damping resistor of anti-arc coil can effectively decrease serious over-voltage, and thus it is capable of avoiding anti-arc coil in saturation condition. In [27], the results shown that it will produce a certain impulse voltage in RGDN, but it will not generally have a serious impact on the RGDN.
(3) Effect of the long cable line
It is increasing trend for long cable line widely applied in urban distribution network, thus it is necessary to analyze the influence of long cable line on the proposed FLS method in this paper. Seen from Equations (9) and (14), whether a SPG fault occurs on a long cable line such as the line L7 or a short cable line such as L1, the energy integral of the faulty is always higher than that of any healthy line. Moreover, the comparison of a SPG fault occurs on the longer cable line L7 and the shorter cable line L1 are shown in Figure 10 and Figure 11, respectively.
The results displayed in Figure 10 and Figure 11, show that whether a SPG fault occurs on the shorter line L1 or on the longer line L7, the energy integral of the faulty line is continuously the higher than any sound line in the detection period. No matter whether the SPG faults occur with different conditions such as fault location and resistance, etc., the proposed energy algorithm always satisfies Equation (14), which means it can select the faulty line reliably.
(4) Effect of grounding resistor parallel with anti-arc coil
Because most SPG faults in distribution networks are transient faults, the neutral anti-arc coil is used to accelerate the instantaneous fault arc extinction, but when a permanent fault occurs, in order to isolate the fault zone quickly, a small resistance parallel with the anti-arc coil is put in within 5 s to 2 h after fault, which is aim to enhance the zero-sequence current and realize correct action of zero-sequence current protection in [28], so as to isolate the fault zone. In fact, the finish time for FLS is relatively earlier to the input time of the resistance parallel with the anti-arc coil, thus from this perspective, the input of shunt resistance does not affect the performance of proposed FLS scheme. Figure 12a,b shows the results of the proposed FLS scheme in the case of a SPG fault on a shorter line L1 and on a longer line L7, respectively.
As seen from Figure 12a,b, when a permanent SPG fault occurs in the RSDN on the continuous overrun of zero-sequence voltage starting element, the small resistance parallel with the anti-arc coil is put into at 6.025 s to increase zero-sequence current. Whether on the shorter line L1 or the longer line L7, the faulty line can be selected reliably the proposed method before the resistance put into. That means there is enough time to realize reliable FLS before paralleled resistance is put into operation. Therefore, the proposed method is independent of the parallel resistance on the anti-arc coil.

4.4. Comparison Analysis

In this section, the proposed method is compared to the zero-sequence energy FLS schemes developed in [20,21]. The energy of zero-sequence current is calculated using 5 ms data after fault, then the energy algorithm of short window of the line k is defined as in [20]:
W 2 = t 0 t 0 + T / 4 i 0 k 2 d t ( k = 1 , 2 , n )
In [21], the zero-sequence energy algorithm is described as:
W 3 = t 0 t 0 + t u 0 ( t ) i 0 k ( t ) d t ( k = 1 , 2 , n )
Subsequently, Figure 13 and Figure 14 display the comparison of the three zero-sequence energy algorithms based FLS schemes on the line L1 under different SPG fault conditions, respectively.
Seen from Figure 13a and Figure 14a, whether in the case of a metal SPG fault or with 200 Ω resistance, the zero-sequence energy integral of the faulty line L1 is higher than that of any non-fault line only for the proposed scheme in this paper. As seen from Figure 13b and Figure 14b, the scheme in [20] fails to detect the faulty line in the steady state period with a metal SPG fault, but in Figure 13c and Figure 14c, the zero-sequence energy integral algorithm developed in [21] works within only a short time after fault of even less than 5 ms, that means it is unable to achieve continuous and reliable judgment in steady state. Moreover, Figure 15 and Figure 16 show the comparison results of the three zero-sequence energy based FLS schemes on the line L7 under different SPG fault conditions, respectively.
From Figure 15a,b and Figure 16a,b, it can be seen that whether in a metal SPG fault or with 200 Ω resistance in the longer line L7, the zero-sequence energy integral of the faulty line L1 is higher than that of any non-fault line for the proposed scheme and that developed in [20], which proves the two schemes show favorable performance for a longer line, but the energy algorithm in [21] is satisfied within a short time after the occurrence of the SPG fault.
Besides, as seen from Figure 16, in the case of a SPG fault with 200 Ω resistance in the longer line L7, the zero-sequence energy integral of the faulty line L1 is consistently higher than that of any non-fault line for the proposed scheme in this paper and that in [20], although, for the zero-sequence energy algorithm in [21], the results of the faulty line are larger than that of any sound line within 5 ms after the occurrence of the fault.
In summary, the energy algorithm developed in this paper can achieve reliable FLS for a longer time after fault and the proposed FLS scheme is independent of the length of the line, but the energy algorithm developed in [20], it is of favorable performance for SPG faults occur on the longer line, but the accurate detection period is shortened for a shorter line. Due to the requirement of severe transient short window data, this algorithm is influenced by the length of the faulty line, and fault resistance etc. Moreover, it may be difficult for the transient energy algorithm in the case of SPG faults with short transient process due to faulting with a high resistance or at 0° initial angle on the fault time.

5. Conclusions

This work is focused on improvement of the low success rate of FLS under SPG faults in RGDN with anti-arc coil. In order to promote the adaptability and performance of fault line selection, the following studies were mainly carried out in this work:
  • This paper analyzed in detail the characteristics of the currents in zero-sequence of the faulty line and the sound line. It found that the current consists of abundant decaying slowly DC component in the faulty line, but the DC component is weak and attenuated quickly in the sound line.
  • Thus, a FLS scheme based on energy integral of DC component in zero-sequence is developed. The simulation under different conditions verified that the proposed FLS can detect the faulty line quickly and accurately.
  • Moreover, the performance was assessed under various fault conditions, and a comparison study was made between the proposed method and other transient zero-sequence energy- based methods, indicating that the proposed method has better capability and adaptability than other transient zero-sequence energy methods, and it is more suitable for field application.
From a prospective propose, it is a focus to detect the faulty line in SPG faults with a very high resistance due to the weak difference between the faulty line and the sound line. Therefore, we need to further study feasible and effective FLS methods for real systems and fault records, finding limitations and improvements in RGDN.

Author Contributions

All authors read and approved the manuscript. W.S. and J.B. provided the main idea of this work and designed this article. Y.C. proposed some simulation analysis. Z.Z. and N.L. thoroughly reviewed literature and provided resources of this article.

Funding

We thank the financial support provided by the Foundation of Shaanxi Educational Committee (17JK0337) and Xi’an Polytechnic University key Subject construction fund (10709), and in part by Natural Science Foundation of China (51507140).

Conflicts of Interest

The authors declare no conflict of interest.

References

  1. Chaari, O.; Bastard, P.; Meunier, M. Prony’s method: An effect tool for the analysis of earth fault currents in Petersen-coil-protected networks. IEEE Trans. Power Deliv. 1995, 3, 1234–1241. [Google Scholar] [CrossRef]
  2. Zhang, J.; He, Z.; Lin, S.; Zhang, Y.; Qian, Q. An ANFIS-based fault classification approach in power distribution system. Int. J. Electr. Power Energy Syst. 2013, 49, 243–252. [Google Scholar] [CrossRef]
  3. Sadeh, J.; Bakhshizadeh, E.; Kazemzadeh, R. A new fault location algorithm for radial distribution systems using modal analysis. Int. J. Electr. Power Energy Syst. 2013, 45, 271–278. [Google Scholar] [CrossRef]
  4. Guo, Z.; Yao, J.; Yang, S.; Zhang, H.; Mao, T.; Dong, T. A new method for non-unit protection of power transmission lines based on fault resistance and fault angle reduction. Int. J. Electr. Power Energy Syst. 2014, 55, 760–769. [Google Scholar] [CrossRef]
  5. Verho, P.; Nikander, A.; Jarventausta, P. Aspects on development of distribution network fault location and management. Proc. IEE Int. Conf. Dev. Power Syst. Protect. 2004, 2, 784–787. [Google Scholar]
  6. Xue, Y.; Li, J.; Xu, B. Transient equivalent circuit and transient analysis of single-phase earth fault in arc suppression coil grounded system. Electr. Power Autom. Equip. 2015, 35, 5703–5714. [Google Scholar]
  7. Su, J. Research of neutral grounding modes in power distribution network. Power Syst. Protect. Control 2013, 8, 141–148. [Google Scholar]
  8. Guo, M.; Gao, Y.; Yang, G. Faulty line detection based on transient waveform difference recognition for resonant earthed system. Electr. Power Autom. Equip. 2014, 5, 59–66. [Google Scholar]
  9. Guo, Q.; Wu, T. Survey of the methods to select faulty line in neutral point ineffectively grounded power system. Power Syst. Protec. Control 2010, 2, 146–152. [Google Scholar]
  10. Lin, X.; Sun, J.; Kuran, I.; Zhao, F.; Li, Z.; Li, X.; Yang, D. Zero-sequence compensated admittance based faulty feeder selection algorithm used for distribution network with neutral grounding through Peterson-coil. Electr. Power Energy Syst. 2014, 63, 747–752. [Google Scholar] [CrossRef]
  11. Zhang, H.; He, Z.; Zhang, J. Frequency spectrum characteristic analysis of single-phase grounding fault in resonant grounded systems. Autom. Electr. Power Syst. 2012, 6, 79–84. [Google Scholar]
  12. Song, J.; Li, Y.; Shi, Z.; Ma, L. A faulty line selection method for resonant earthed system with high accuracy. Power Syst. Protect. Control 2017, 6, 9–15. [Google Scholar]
  13. Han, X.L.; Wu, Q.H.; Li, M.S.; Zhang, L.L. Mathematical morphology-based single phase-to-ground fault feeder selector for a resonant grounded distribution system. IEEJ Trans. Electr. Electr. Eng. 2018, 13, 517–518. [Google Scholar] [CrossRef]
  14. Costa, F.; Souza, B.; Brito, N.; Silva, J. Real-Time Detection of transients induced by high-impedance faults based on the boundary wavelet transform. IEEE Trans. Indus. Appl. 2015, 6, 5312–5323. [Google Scholar] [CrossRef]
  15. Veerapandiyan, V.; Noor, I.; Rajeswari, R.; Muhammad, M.; Mariammal, T.; Mohammad, L. High impedance fault detection in medium voltage distribution network using discrete wavelet transform and adaptive neuro-fuzzy inference system. Energies 2018, 11, 3330. [Google Scholar] [CrossRef]
  16. Russell, B.; Benner, C. Arcing fault detection for distribution feeders: Security assessment in long term field trials. IEEE Trans. Power Deliv. 1995, 2, 676–683. [Google Scholar] [CrossRef]
  17. Benner, C.; Russell, B. Practical high-impedance fault detection on distribution feeders. IEEE Trans. Ind. Appl. 1997, 3, 635–640. [Google Scholar] [CrossRef]
  18. Wang, X.; Wei, Y.; Zeng, Z.; Hou, Y.; Gao, J.; Wei, X. Faulty line selection method of small current to ground system based on atomic sparse decomposition and extreme learning machine. J. Sens. 2015, 2015, 678120. [Google Scholar] [CrossRef]
  19. Cui, T.; Dong, X.; Bo, Z.; Juszczyk, A. Hilbert-transform-based transient intermittent earth fault detection in non-effectively grounded distribution systems. IEEE Trans. Power Deliv. 2011, 1, 143–151. [Google Scholar] [CrossRef]
  20. Wu, L.; Huang, C.; Huang, J.; Zheng, J. Fault line detection algorithm for resonant ground power distribution system by improving energy. Comput. Eng. Appl. 2013, 16, 248–251. [Google Scholar]
  21. Zhang, J.; Liu, H.; He, Z.; Wu, S. A novel fault line identification approach based on instantaneous energy function. Power Syst. Prot. Control 2012, 14, 1–9. [Google Scholar]
  22. Fang, Y.; Xue, Y.; Song, H.; Guan, Y.; Yang, F.; Xu, B. Transient energy analysis and faulty feeder identification method of high impedance fault in the resonant grounding system. Proc. Chim. Soc. Electr. Eng. 2018, 19, 5636–5645. [Google Scholar]
  23. Haghifam, M.; Sedighi, A.; Malik, O. Development of a fuzzy inference system based on genetic algorithm for high-impedance fault detection. IEE Gen. Trans. Distr. 2006, 3, 359–367. [Google Scholar] [CrossRef]
  24. Xu, Y.; Guo, M.; Chen, B.; Yang, G. Modeling and simulation analysis of arc in distribution network. Power Syst. Prot. Control 2015, 7, 57–64. [Google Scholar]
  25. Xue, Y.; Guo, L. Discussion about grounding mode of active distribution networks. Distrib. Util. 2015, 6, 6–11. [Google Scholar]
  26. Wang, F.; Cheng, H. Application of Arc Suppression Coil and Damping Resistance in Distribution Network. China Water Transp. 2016, 12, 141–143. [Google Scholar]
  27. Wang, W.; Zhou, J.; Ji, S.; Cao, T.; Zhang, J.; Ou, X.; Li, Y. Impact of Neutral Grounding Mode on Ferroesonance in 35 kV Power System. High Volt. App. 2010, 1, 93–96. [Google Scholar]
  28. Huang, Z.; Wei, L.; Li, G. Flexible grounding via arc-suppression coil and low resistance in parallel. Guang Dong Electr. Power 2014, 6, 64–67. [Google Scholar]
Figure 1. SPG fault in RGDN.
Energies 12 00846 g001
Figure 2. Zero-sequence current circuit in SPG fault.
Energies 12 00846 g002
Figure 3. Simplified equivalent circuit of zero-sequence DC component.
Energies 12 00846 g003
Figure 4. The faulty line identification flow chart.
Energies 12 00846 g004
Figure 5. Simulation model of RGDN.
Energies 12 00846 g005
Figure 6. The results of the full fault current and the decaying DC component in zero-sequence of the lines and the anti-arc coil. (a) The results of the non-fault line L1; (b) The results of the non-fault line L2; (c) The results of the non-fault line L3; (d) The results of the fault line L4; (e) The results of the anti-arc coil.
Energies 12 00846 g006aEnergies 12 00846 g006b
Figure 7. DC energy integral under SPG faults occurring at 8 km away from the bus, at 45° initial phase angle, with different grounding resistances. (a) R g = 0.0001 Ω ; (b) R g = 10 Ω ; (c) R g = 100 Ω ; (d) R g = 1000 Ω .
Energies 12 00846 g007
Figure 8. DC energy integral under SPG faults occurring at 8 km away from the bus, grounded through a resistance of 100 Ω, with different initial phase angles. (a) θ = 0 ° ; (b) θ = 30 ° ; (c) θ = 60 ° ; (d) θ = 90 ° .
Energies 12 00846 g008aEnergies 12 00846 g008b
Figure 9. Simulation model of RGDN with distributed sources.
Energies 12 00846 g009
Figure 10. Results under SPG faults occurring on the shorter line L1 at 2 km away from the bus, at different initial phase angles and resistances. (a) θ = 0 ° , R g = 0.0001 Ω ; (b) θ = 90 ° , R g = 300 Ω .
Energies 12 00846 g010
Figure 11. Results under SPG faults occurring on the longer line L7 at 7 km away from the bus, at different initial phase angles and resistances. (a) θ = 0 ° , R g = 0.0001 Ω ; (b) θ = 90 ° , R g = 300 Ω .
Energies 12 00846 g011
Figure 12. Results of metal SPG faults occurring on the line L1 and the line L7, the fault location is 2 km away from the bus, the fault time is 1.025 s, and the shunt resistance is put into at 6.025 s. (a) The results of the shorter line L1; (b)The results of the longer line L7.
Energies 12 00846 g012
Figure 13. Comparison of the three energy integral schemes under a metal SPG fault occurring on the line L1, at 2 km away from the bus, at 0° initial phase angle. (a) The results of the energy integral scheme in this paper; (b) the results of the energy integral scheme in [20]; (c) the results of the energy integral scheme in [21].
Energies 12 00846 g013
Figure 14. Comparison of the three energy integral under a SPG fault occurring on the line L1, at 2 km away from the bus, at 0° initial phase angle, with a resistance of 200 Ω. (a) The results of the energy integral scheme in this paper; (b) the results of the energy integral scheme in [20]; (c) the results of the energy integral scheme in [21].
Energies 12 00846 g014
Figure 15. Comparison of the three energy integral under a metal SPG fault occurring on the line L7, at 8 km away from the bus, at 0° initial phase angle. (a) The results of the energy integral scheme in this paper; (b) the results of the energy integral scheme in [20]; (c) the results of the energy integral scheme in [21].
Energies 12 00846 g015
Figure 16. Comparison of the three energy integral under a SPG fault occurring on the line L7, at 8 km away from the bus, at 0° initial phase angle, with a resistance of 200 Ω. (a) The results of the energy integral scheme in this paper; (b) The results of the energy integral scheme in [20]; (c) The results of the energy integral scheme in [21].
Energies 12 00846 g016
Table 1. The parameters per kilometre for the lines.
Line TypesSequenceResistance
( Ω /km)
Inductance
( mH / km )
Capacitance
( uF / km )
Over-head linepositive-sequence0.12501.3000.0096
zero-sequence0.27504.6000.0054
Cable linepositive-sequence0.27000.22500.3390
zero-sequence2.70001.01900.2800
Table 2. The percentage of the DC component in SPG faults under different initial phase angles.
Grounding Resistance (Ω)Fault Position (km)Fault Initial Phase Angle (°)Non-Fault Line L1Non-Fault Line L2Non-Fault Line L3Fault Line L4
508017.23%17.24%17.29%64.80%
4521.21%21.17%21.19%122.71%
9021.34%21.24%21.43%120.26%
Table 3. The percentage of the DC component in SPG faults under different fault locations.
Grounding Resistance (Ω)Fault Position (km)Fault Initial Phase Angle (°)Non-Fault Line L1Non-Fault Line L2Non-Fault Line L3Fault Line L4
5024520.94%20.81%20.93%125.66%
821.21%21.17%21.19%122.71%
1621.41%21.36%21.40%120.92%
Table 4. The percentage of the DC component in SPG faults under different grounding resistances.
Grounding Resistance (Ω)Fault Position (km)Fault Initial Phase Angle (°)Non-Fault Line L1Non-Fault Line L2Non-Fault Line L3Fault Line L4
5084521.21%21.17%21.19%122.71%
50023.79%23.65%23.69%64.76%
100025.18%25.07%25.13%58.40%
Table 5. DC energy integral under SPG faults with different initial phase angles.
Fault Position (km)Grounding Resistance (Ω)Fault Initial Phase Angle (°)DC Energy Integral (VA·s)Detection Results
Non-Fault Line L1Non-Fault Line L2Non-Fault Line L3Faulty Line L4
250064.1220.2250.05825.61
564.1320.2350.06825.63
1064.3820.3150.25823.31
2065.2820.5450.96799.92
3566.0520.8551.55764.70
5064.8520.5450.59693.55
7050.2314.9239.55578.82
9021.125.9517.22137.22
Table 6. DC energy integral under SPG faults with different fault locations.
Fault Position (km)Grounding Resistance (Ω)Fault Initial Phase Angle (°)DC Energy Integral (VA·s)Detection Results
Non-Fault Line L1Non-Fault Line L2Non-Fault Line L3Faulty Line L4
0.1504565.2920.6050.98699.96
165.1520.6350.80696.90
264.8520.5450.60693.53
464.2720.3150.23686.92
763.5620.0049.65677.29
962.9019.7549.13669.48
1361.6719.3448.07656.17
1660.5118.9647.27647.76
Table 7. DC energy integral under SPG faults with different grounding resistances.
Fault Position (km)Grounding Resistance (Ω)Fault Initial Phase Angle (°)DC Energy Integral (VA·s)Detection Results
Non-Fault Line L1Non-Fault Line L2Non-Fault Line L3Faulty Line L4
80.014512.394.916.66697.04
59.802.479.42694.30
1028.658.6323.33693.38
2049.7715.4839.18690.36
5063.3119.8749.46674.15
10052.7216.6441.19635.15
20031.9510.0824.96522.35
50018.795.9314.74251.01

