Modelling of the Bearing Breakdown Resistance in Bearing Currents Problem of AC Motors


School of Electrical Engineering, Beijing Jiaotong University, Haidian Disctrict, Beijing 100044, China
*
Author to whom correspondence should be addressed.
Energies 2019, 12(6), 1121; https://doi.org/10.3390/en12061121
Submission received: 29 January 2019
/
Revised: 19 March 2019
/
Accepted: 20 March 2019
/
Published: 22 March 2019
Abstract
:With the wide application of pulse width modulation (PWM) technology in motor driving, the bearing current problem has become more and more severe. The most complicated problem in analyzing bearing currents is modeling the equivalent circuit of the bearing and determination of the equivalent parameters of the model. During the process of bearing current breakdown, the bearing undergoes a transition from the capacitor state to the resistor state. The previously used equivalent model, which only consists of a capacitor parallel with a constant resistor, cannot reveal the real breakdown process. In this paper, an improved equivalent bearing model is derived from the waveform analysis of the experiment. The variable breakdown resistance model of the bearing is put forward and the calculation method of the breakdown resistance is given. The circuit simulation results from the variable resistance bearing model were much closer to the results of the experiment than those from the constant resistance model.
1. Introduction
The motors play an important role in the process of energy conversion. Factors affecting the normal operation of the motors have received the attention of many motor manufacturers and motor users. Bearing current is one of the factors affecting the normal operation of the motors and generators [1,2,3]. With the rapid development of the power electronics technology, pulse width modulation (PWM) variable frequency drive technology is widely used. When the AC motors are driven by the PWM converter, the motors have better operating characteristics and control characteristics than before. At the same time, the PWM technology brings the advantages of a smaller torque ripple and energy saving. Therefore, the application of PWM frequency conversion technology is more and more extensive. However, the common mode voltage generated by the converter can induce electrical corrosion of the bearing, which brings danger to the motor system. The common mode voltage Vcom is defined as the electric potential difference between the neutral point of motor windings and the ground. The stray capacitances exist between the different parts of the motor. With the coupling of the stray capacitances, the common mode voltage induces a high frequency bearing voltage Vb between the inner raceway and the outer raceway of the motor bearing. When the bearing voltage Vb exceeds the threshold voltage of the lubricating oil film, the oil film will be broken down. Then the bearing breakdown current is generated and a huge amount of heat appears in a short period of time, which is enough to melt the metal near the breakdown point and generate a pit. Once the bearing is subjected to electrical corrosion, the spots and grooves will increase the vibration and noise of the motor, which directly affects the reliability of motor operation.
Many scholars have researched the bearing currents problem in depth, which includes the bearing currents generation mechanism [4], the calculation of the stray capacitance parameters of the motor [5,6] and the analysis of the bearing currents equivalent circuit [7,8,9]. However, the most complicated and difficult problem in simulating the bearing current is the motor bearing breakdown process and the determination of the equivalent electrical parameters of the bearing. When the motor is in normal operation, the bearing oil film between the rolling elements and bearing raceway is integrated, and the bearing can be equivalent to a capacitor. The calculation of bearing capacitance value has been widely discussed in the literature [10,11,12,13]. When the bearing voltage surpasses the bearing threshold voltage, the bearing oil film will be broken down and the bearing will appear as a resistor. The bearings are modelled as the capacitor series or parallel with a constant resistor [13]. However, the results of such a model are not in accordance with the experimental results. The equivalent model of bearing breakdown needs further study.
In this paper, first we describe building the bearing breakdown experiment. The bearing voltage and bearing current waveforms from the test are used to observe the electrical properties transition of bearing during the bearing breakdown process. Then, an improved bearing breakdown equivalent circuit model is proposed. The method of determining the electrical parameter values of the bearing is given. Finally, the accuracy of the new model is verified by comparison of simulations.
2. Experiment of Electrical Properties of the Bearing
In order to analyze the bearing breakdown process, the following experiments were designed. A 5.5 kW induction motor is driven by 3-phase 380 V sinusoidal voltage. Under this power supply condition, the bearing voltage due to the 3-phase power supply can be neglected. An adjustable high-frequency sinusoidal voltage is applied between the shaft and the frame through a function signal generator. This voltage is also applied between the outer raceway and the inner raceway of the bearing. The frequency of the voltage signal is changing from 10 kHz to 100 MHz, and the voltage of the signal is changing from 5 V to 20 V. On the other side of the shaft, the bearing current and bearing voltage waveforms are measured. In order to measure the bearing current, one bearing is isolated from the motor frame. A layer of 5 mm insulation layer is inserted between the bearing outer raceway and the bearing housing of one bearing. The principle of measurement is shown in Figure 1a. Figure 1b is the equivalent circuit of the measurement. Vg is the output voltage of the signal generator, Zg is the impedance of the signal generator, Zsf is the equivalent impedance of the shaft and the frame of the motor, Zb.left is the bearing impedance of the left side bearing without insulation, and Zb.right is the bearing impedance of the right side bearing with insulation. The bearing current can only be measured on the right side bearing. From the measured bearing current and bearing voltage, the bearing equivalent impedance of the right side bearing can be analyzed from the volt-ampere characteristics.
The overall experiment platform is shown in Figure 2 and the bearing current test point and the bearing voltage test point are shown in Figure 3. As shown in Figure 3 a copper wire is drawn from the bearing outer raceway across the insulation layer and connected to the frame. The current flowing through the copper wire measured by the current probe is the bearing current. The voltage of the function signal generator is applied to the shaft through an exposed copper wire, which is in contact with the shaft. The bearing voltage should be the voltage between the inner and outer raceway of the bearing. The inner raceway of the bearing is connected with the shaft, and the outer raceway is connected with the frame. Therefore, the voltage between the shaft and the frame is the bearing voltage. The input voltage from the signal generator and the bearing voltage test point are on the different ends of the shaft. The sinusoidal signal frequency f is set as 1 MHz, and the peak-to-peak value of the signal generator is 10V. The waveforms of the bearing voltage Vb and the bearing current Ib are shown in Figure 4.
While the bearing oil film is unbroken the lubricant oil between the bearing raceway and the balls can be taken as the dielectric medium. The mental bearing balls and the raceway can be regarded as the plates of the capacitor. When the bearing voltage surpasses the threshold voltage of the oil film, the oil film will be broken down, as shown in Figure 4. The voltage suddenly drops and the bearing current becomes large abruptly. After 20 μs, bearing voltage recovers to a high value and the bearing current recovers to a small value as the beginning state. Because the balls are rolling during the operation, there is oil continuously injected to the gap between the balls and the raceway, which could replace the original medium and establish a new oil film, and return to the capacitive state.
The waveforms at the breakdown period and not breakdown period are enlarged in Figure 5. It can be seen in Figure 5a that the bearing current leads the bearing voltage by 90° at the period of not breakdown. It can be seen in Figure 5b that the bearing voltage and the bearing current are in phase at the period of breakdown. Such results mean that the bearing is under a capacitive state at not breakdown and the bearing is under a resistive state at the breakdown period.
Also, it is worth noting in Figure 4 that while the bearing is at the breakdown period, the duration time between the bearing voltage suddenly dropping and recovering to a high value of the capacitive state is about 20 μs. The bearing current becomes large suddenly while the bearing oil film is broken down, and then gradually recovers to a small current value after 20 μs. During the breakdown period, the amplitudes of the bearing voltage and the bearing current are not constant. The envelopes of the bearing voltage and the bearing current gradually change with time. The question arises whether the variation of the bearing voltage and the bearing current are related with the charging process. The time constant of the bearing capacitor can be calculated approximately from the bearing equivalent capacitance and resistance. The bearing capacitance is about 120 pF, and the breakdown resistance is about 20 Ω; these data are calculated by experimental data. Then the charging time constant τ is about 0.0024 μs. But the duration time of the bearing breakdown is 20 μs which is much longer than the capacitor charging period. Therefore, the variation of bearing voltage and the bearing current is not determined by the charging process of the bearing capacitor. The variation of the bearing voltage and the bearing current must be related to other factors.
3. Bearing Breakdown Equivalent Model
In [13], the equivalent bearing circuit consists of a capacitor in series with a constant resistor. In [14], the equivalent bearing circuit consists of a capacitor in parallel with a constant resistor, and a switch is used to switch between the capacitor and the resistor. From the experiment above, we can see that, during the breakdown period, the bearing voltage and the bearing current change slowly. It can be supposed that the equivalent breakdown resistance probably is not a constant resistance. According to the analysis above we put forward an improved bearing circuit with the variable resistance, as shown in Figure 6.
In Figure 6, Cm is the equivalent capacitance of the bearing when it is not broken down, and Rm represents the equivalent variable resistance at bearing breakdown period. When the bearing oil film is not broken down, the switch K1 closes and the switch K2 opens and the bearing is under the capacitive state. When the bearing is at breakdown, K2 closes and K1 opens and the bearing is under the resistive state.
4. Determination the Electrical Parameters in the Bearing Breakdown Model
4.1. Capacitance in Bearing Breakdown Model
The model of the bearing involves the bearing capacitance Cm and the variable resistance Rm. Cm can be obtained from the bearing voltage Vb, the bearing current Ib and the frequency f while the bearing is at not break down state through (1),
The bearing capacitance in this experiment was 120 pF. The bearing capacitance is affected by the motor speed, the load and the temperature of the bearing [15].
4.2. Variable Breakdown Resistance in Bearing Breakdown Model
In order to determine the bearing breakdown resistance, the breakdown process should be thoroughly investigated. The breakdown of bearing oil film belongs to the electric spark discharge. From the perspective of discharge morphology, the electric spark discharge can be divided into the spark discharge, the over discharge and the arc discharge [16,17]. The characteristic of spark discharge is that the plasma discharge channel of each pulse must be formed by re-breaking the processing medium. The medium of arc discharge is gas and it is a phenomenon of continuous discharge. The spark discharge and the arc discharge are formed by collisional ionization of particles in the medium. There are many similarities between the arc discharge and the electric spark discharge.
The arc discharge process includes three stages, which are arc starting, arc stabilization and arc extinction. The equivalent impedance variation can be used to analyze the breakdown process. The impedance of bearing Zb equals to Vb divided by Ib, The curve of Zb varing with time is shown as Figure 7.
Combining Figure 4 and Figure 7, we can conclude that the process of bearing breakdown can also be divided into three sections, which are the starting section, the stable section and the recovery section. During the starting section, the bearing voltage drops and the bearing current rises, the bearing is under the transition from a capacitor with high impedance to a resistor with small value. During the stable section, the bearing stays at a lower resistance value. During the recovery section, the bearing is under the transition from a resistor to a capacitor. In this section, the bearing voltage rises and the bearing current drops again. The bearing discharge includes three sections just same as the arc discharge. Since the external characteristics of the two kinds of discharge are similar, the calculation method of the equivalent resistance of arc is used to determine the bearing breakdown resistance creatively in this paper.
Corresponding to the bearing breakdown process, the equivalent breakdown resistance of bearing can be divided into three stages. From t0 to t1, it is the starting section. From t1 to t2, it is the stable section. From t2 to t3, it is the recovery section. The breakdown bearing resistance Rm at different sections is shown in (2),
where r is the resistance of the bearing when it is not broken down, it can use the impedance while the bearing is not broken down. R0 is the stable breakdown resistance. τ1 is the time constant during the transition of the breakdown. τ2 is the time constant of oil film recovery. The unknown quantities in (2) are r and R0, which can be obtained by the experimental measurement. Through the experiments of Figure 2, we can get r = 628 Ω, R0 = 28 Ω.
5. Verification and Simulation of the Variable Breakdown Resistance Model
5.1. Verification of the Variable Breakdown Resistance Model
In order to verify the correctness of the model of the variable breakdown resistance, the comparison between the measured breakdown resistance curve and the calculated resistance curve from (2) should be carried out. Here, by substituting r = 628 Ω and R0 = 28 Ω into (2), a variable breakdown resistance curve can be calculated. The experimentally measured resistance curve is compared with the resistance curve from the resistance model (2), as shown in Figure 8. It can be seen that the calculation model (2) of the breakdown resistance can simulate the variation trend of equivalent resistance during the breakdown and the recovery process very well.
5.2. Simulation of the Variable Resistance Model and the Constant Resistance Model
In order to verify the accuracy of the proposed model, the variable resistance model and the constant resistance model are compared through the circuit simulation. The simulation model of the variable breakdown resistance is shown in Figure 9a. The voltage applied to the bearing is Vb = 10 V, f = 1 MHz. Rm is a variable resistance module, according to (2). The bearing capacitance Cm is 120 pF, the capacitance Ci is the insulation capacitance induced by the motor modification and RCu is the resistance of measuring lead line. RCu ≈ 4.8 mΩ, Ci = 25.49 pF. The simulation circuit of the constant breakdown resistance model is shown in Figure 9b, in which the equivalent breakdown resistance Rm is 20 Ω which is the resistance R0 in (2) at the stable section.
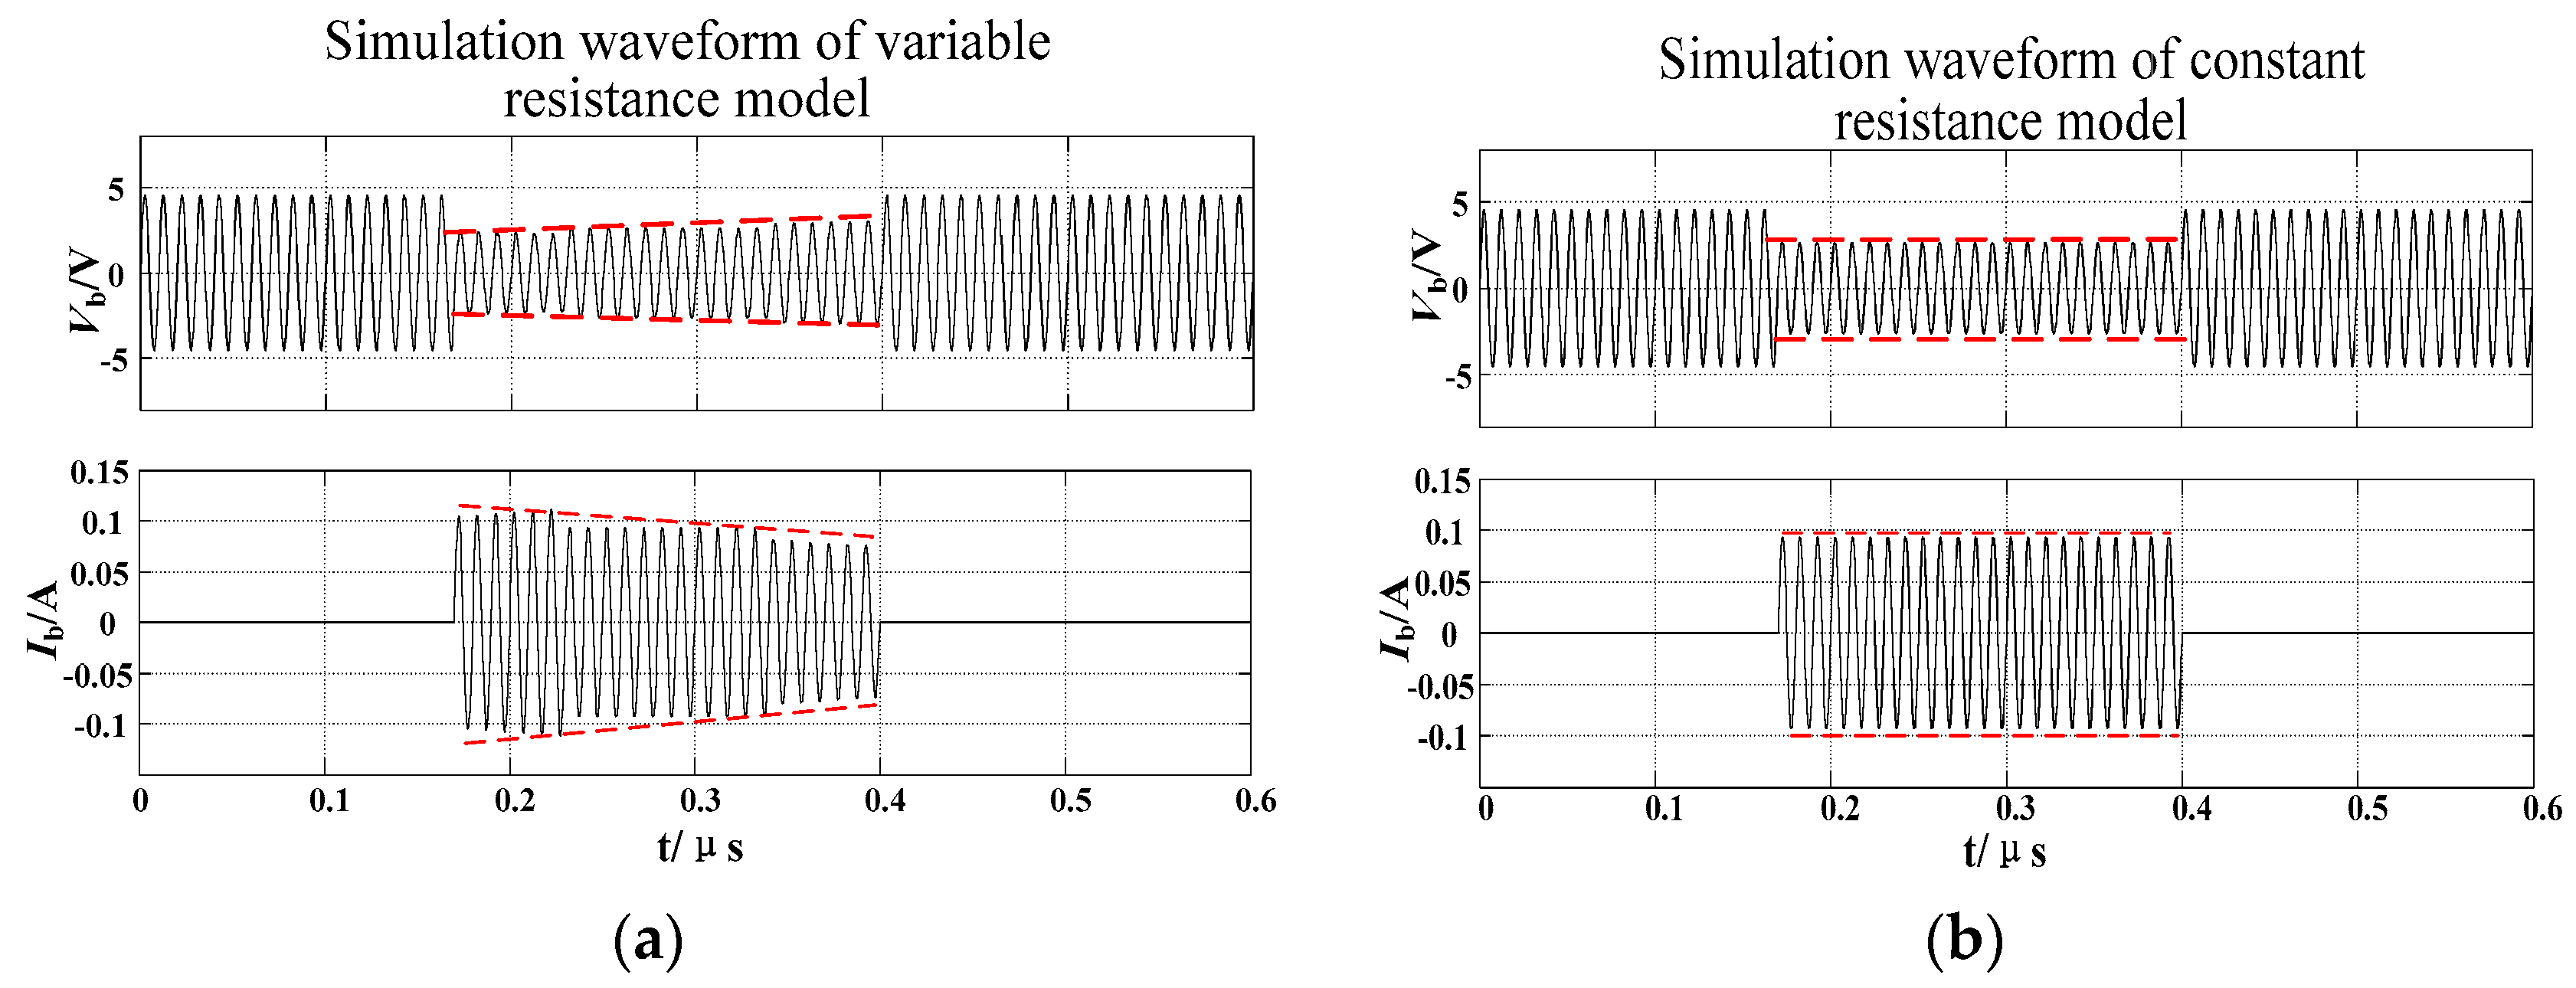
The waveforms obtained from the variable breakdown resistance model are shown in Figure 10a. The waveforms obtained from the variable breakdown resistance model are shown in Figure 10b. When there is no breakdown on bearing, the bearing voltage and bearing current are the same in two models. However, when the bearing breakdown happens, the bearing voltage of the variable resistance model shows a slight increase, and the bearing current tends to decrease slowly. In the constant resistance model, the voltage and current remain constant after breakdown.
The bearing voltage and the bearing current waveforms obtained from the two kinds of simulation results are compared with the measured results. The waveforms from the experiment in Figure 4 also have a tendency to change slowly after breakdown. Therefore, comparing the waveforms obtained from the two models, we can see that the variable resistance model is much closer to the experimentally measured results.
6. Conclusions
This paper mainly analyzes the bearing breakdown resistance model. From the experimental waveforms of the bearing current and the bearing voltage during the bearing breakdown process, the characteristics of non-step variation in the process of resistance-capacitance transition were observed. A variable breakdown bearing resistance model is proposed in this paper. Based on the principle of electrical breakdown, a segmental calculation for the breakdown equivalent variable resistance model is determined according the arc discharge model. Through simulating comparison of the constant resistance model and the variable resistance model, the bearing breakdown process obtained from the variable resistance model simulation was much closer to the experimental results. This model can be used to accurately predict the bearing current, which will be helpful in fault detection and the prevention of bearing failure. The bearing currents of AC motors fed by PWM converters based on the improved resistance model will be investigated in the future.
Author Contributions
Conceptualization, X.R.; Methodology, R.L. and X.R.; Software, X.R.; Formal Analysis, X.R.; Resources, R.L.; Writing-Original Draft Preparation, X.R. and E.Y; Writing-Review & Editing, R.L. and E.Y.; Funding Acquisition, R.L.
Funding
This research was funded by the National Natural Science Foundation of China grant number [51777008].
Acknowledgments
The authors express their gratitude to the National Natural Science Foundation of China.
Conflicts of Interest
The authors declare no conflict of interest.
References
- Plazenet, T.; Boileau, T.; Caironi, C.; Nahid-Mobarakeh, B. An overview of shaft voltages and bearing currents in rotating machines. In Proceedings of the 2016 IEEE Industry Applications Society Annual Meeting, Portland, OR, USA, 2–6 October 2016. [Google Scholar]
- Liu, R.; Ma, X.; Ren, X. Comparative Analysis of Bearing Current in Wind Turbine Generators. Energies 2018, 11, 1305. [Google Scholar] [CrossRef]
- Schiferl, R.F.; Melfi, M.J. Bearing current remediation options. IEEE Ind. Appl. Mag. 2004, 10, 40–50. [Google Scholar] [CrossRef]
- Muetze, A. Bearing Currents in Inverter-Fed AC-Motors. Ph.D. Thesis, Darmstadt University of Technology, Aachen, Germany, 2004. [Google Scholar]
- Sang, B. Analysis and Measurement of Bearing Current of Variable Frequency Power Supply AC Motor. Master’s Thesis, Beijing Jiaotong University, Beijing, China, 2016. [Google Scholar]
- Chaves, C.S.; Camacho, J.R.; De Paula, H.; Chaves, M.L.; Saraiva, E. Capacitances calculation using FEM for transient overvoltage and common mode currents prediction in inverter-driven induction motors. In Proceedings of the 2011 IEEE Trondheim PowerTech, Trondheim, Norway, 19–23 June 2011. [Google Scholar]
- Muetze, A.; Binder, A. Calculation of motor capacitances for prediction of discharge bearing currents in machines of inverter-based drive systems. In Proceedings of the IEEE International Conference on Electric Machines and Drives, San Antonio, TX, USA, 15 May 2005. [Google Scholar]
- Wellawatta, T.; Park, J.K.; Kim, H.M.; Hur, J. New Equivalent Circuit of the IPM-Type BLDC Motor for Calculation of Shaft Voltage by Considering Electric and Magnetic Fields. In Proceedings of the IEEE Energy Conversion Congress and Exposition (ECCE), Montreal, QC, Canada, 20–24 September 2015. [Google Scholar]
- Wang, Y.; Bai, B.; Liu, W.; Wang, X. Determination of key parameters of common parameters equivalent circuit of distributed parameters and calculation of bearing current. Trans. China Electrotech. Soc. 2014, 29, 124–131. [Google Scholar]
- Ruifang, L.; Zhuofu, L.; Xiping, M. Modeling of Bearing Capacitance and Resistance in Motor Bearing Current Problem. Proc. CSEE 2014, 34, 2430–2437. [Google Scholar]
- Prashad, H. Tribology in Electrical Environments; Elsevier: Hyderabad, India, 2006. [Google Scholar]
- Bartz, M. Lubricant Film Formation in Grease Lubricated High Speed Spindle Bearings. Ph.D. Thesis, University of Hannover, Hannover, Germany, 1996. [Google Scholar]
- Busse, D.; Erdman, J.; Kerkman, R.J.; Schlegel, D.; Skibinski, G. System Electrical Parameters and Their Effects On Bearing Currents. IEEE Trans. Ind. Appl. 1997, 33, 577–584. [Google Scholar] [CrossRef]
- Busse, D.; Erdman, J.; Kerkman, R.J.; Schlegel, D.; Skibinski, G. Bearing Currents and Their Relationship to PWM Drives. IEEE Trans. Power Electron. 1997, 12, 243–252. [Google Scholar] [CrossRef]
- Niskanen, V.; Muetze, A.; Ahola, J. Study on bearing impedance properties at several hundred kilohertz for different electric machine operating parameters. IEEE Trans. Ind. Appl. 2014, 50, 3438–3447. [Google Scholar] [CrossRef]
- Rui, X. Theoretical Analysis of Electrical Discharge Channel and Research of Gap Distance Testing. Master’s Thesis, Shanghai JiaoTong University, Shanghai, China, 2011. [Google Scholar]
- Zhan, H.; Duan, S.; Li, C.; Yao, L.; Zhao, L. A Novel Arc Model for Very Fast Transient Overvoltage Simulation in a 252-kV Gas-Insulated Switchgear. IEEE Trans. Plasma Sci. 2014, 42, 3423–3429. [Google Scholar] [CrossRef]
Figure 1.
(a) The principle of the measurement; (b) The equivalent circuit of the measurement.
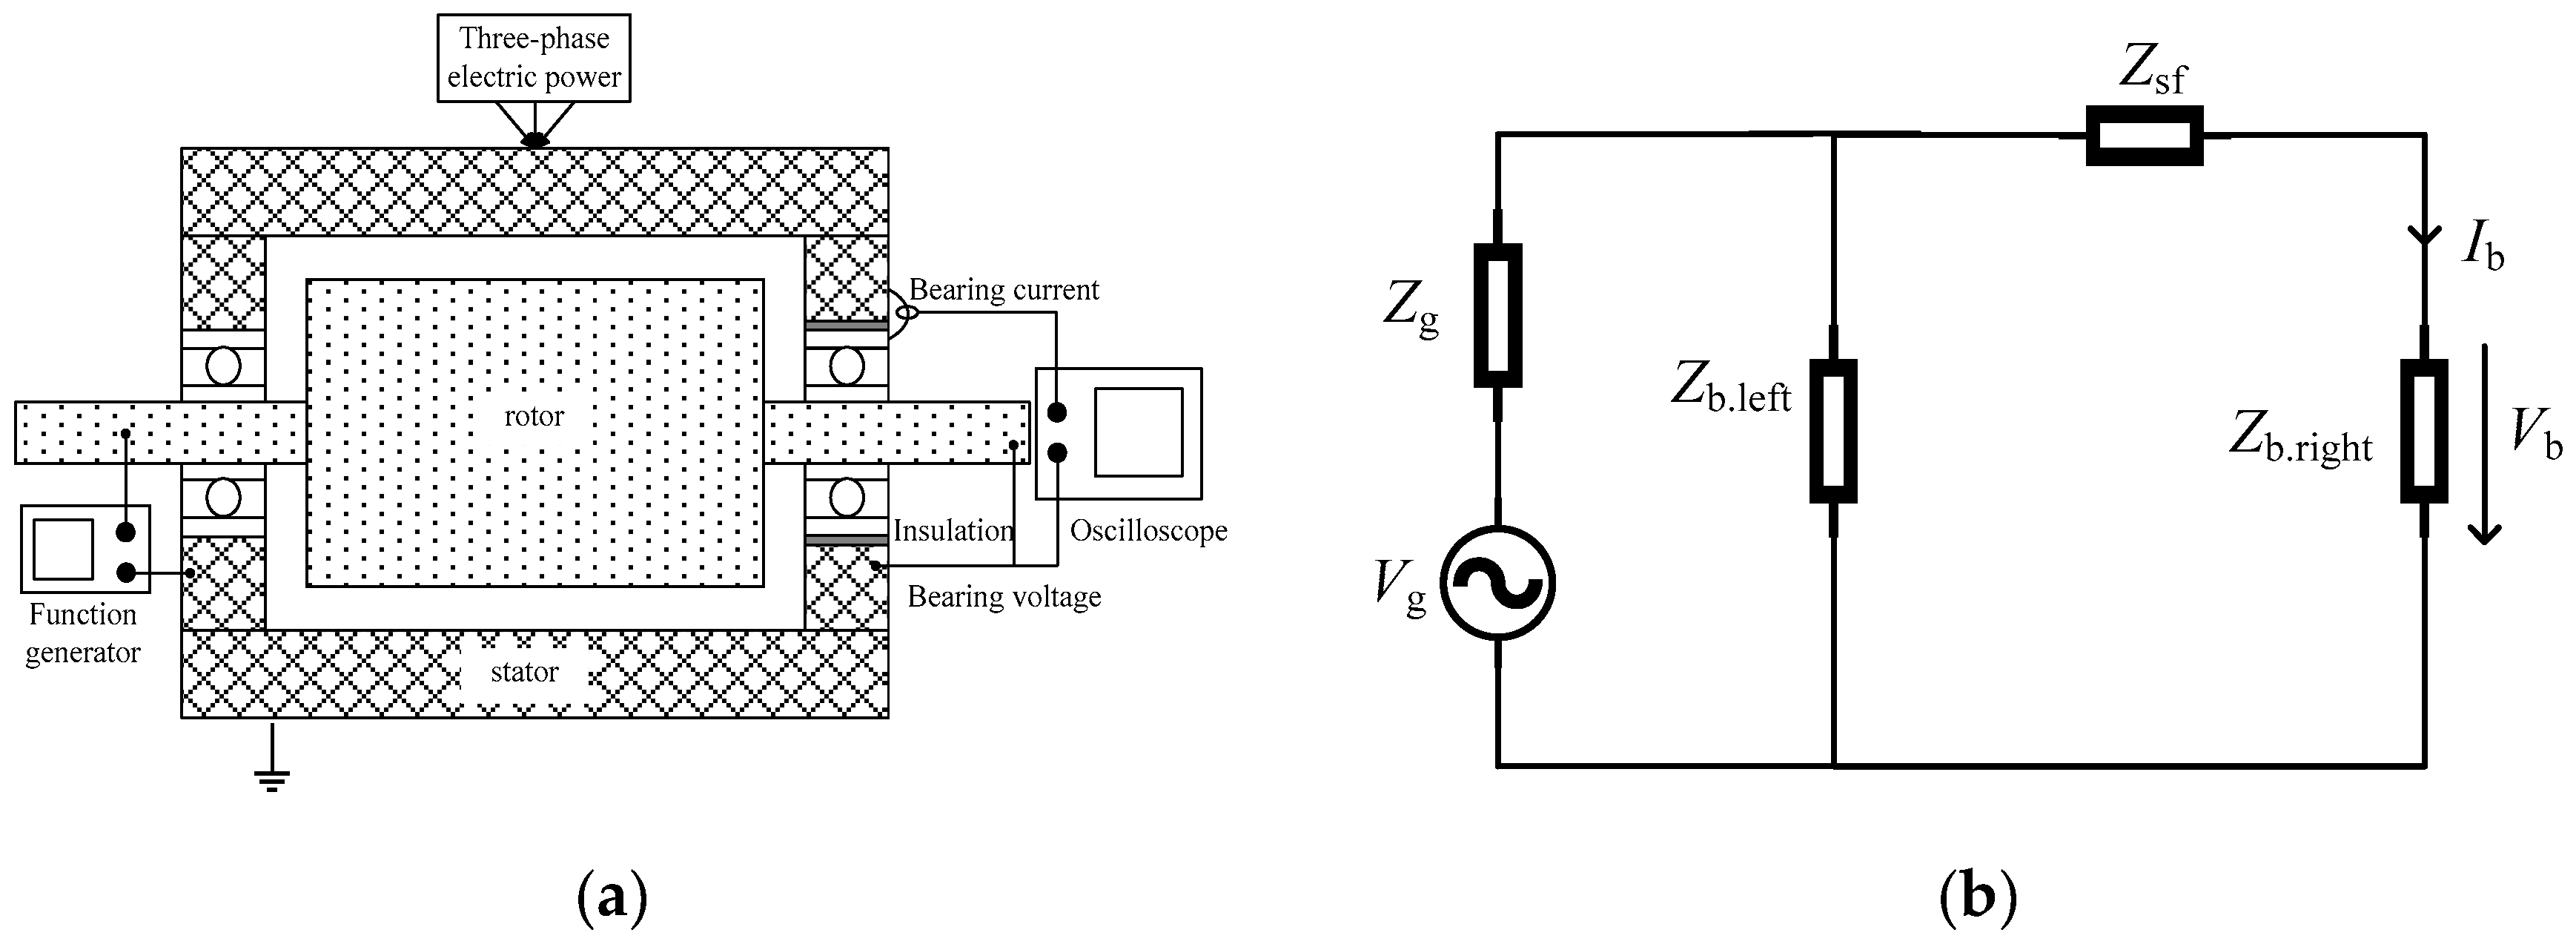
Figure 2.
The experimental platform.
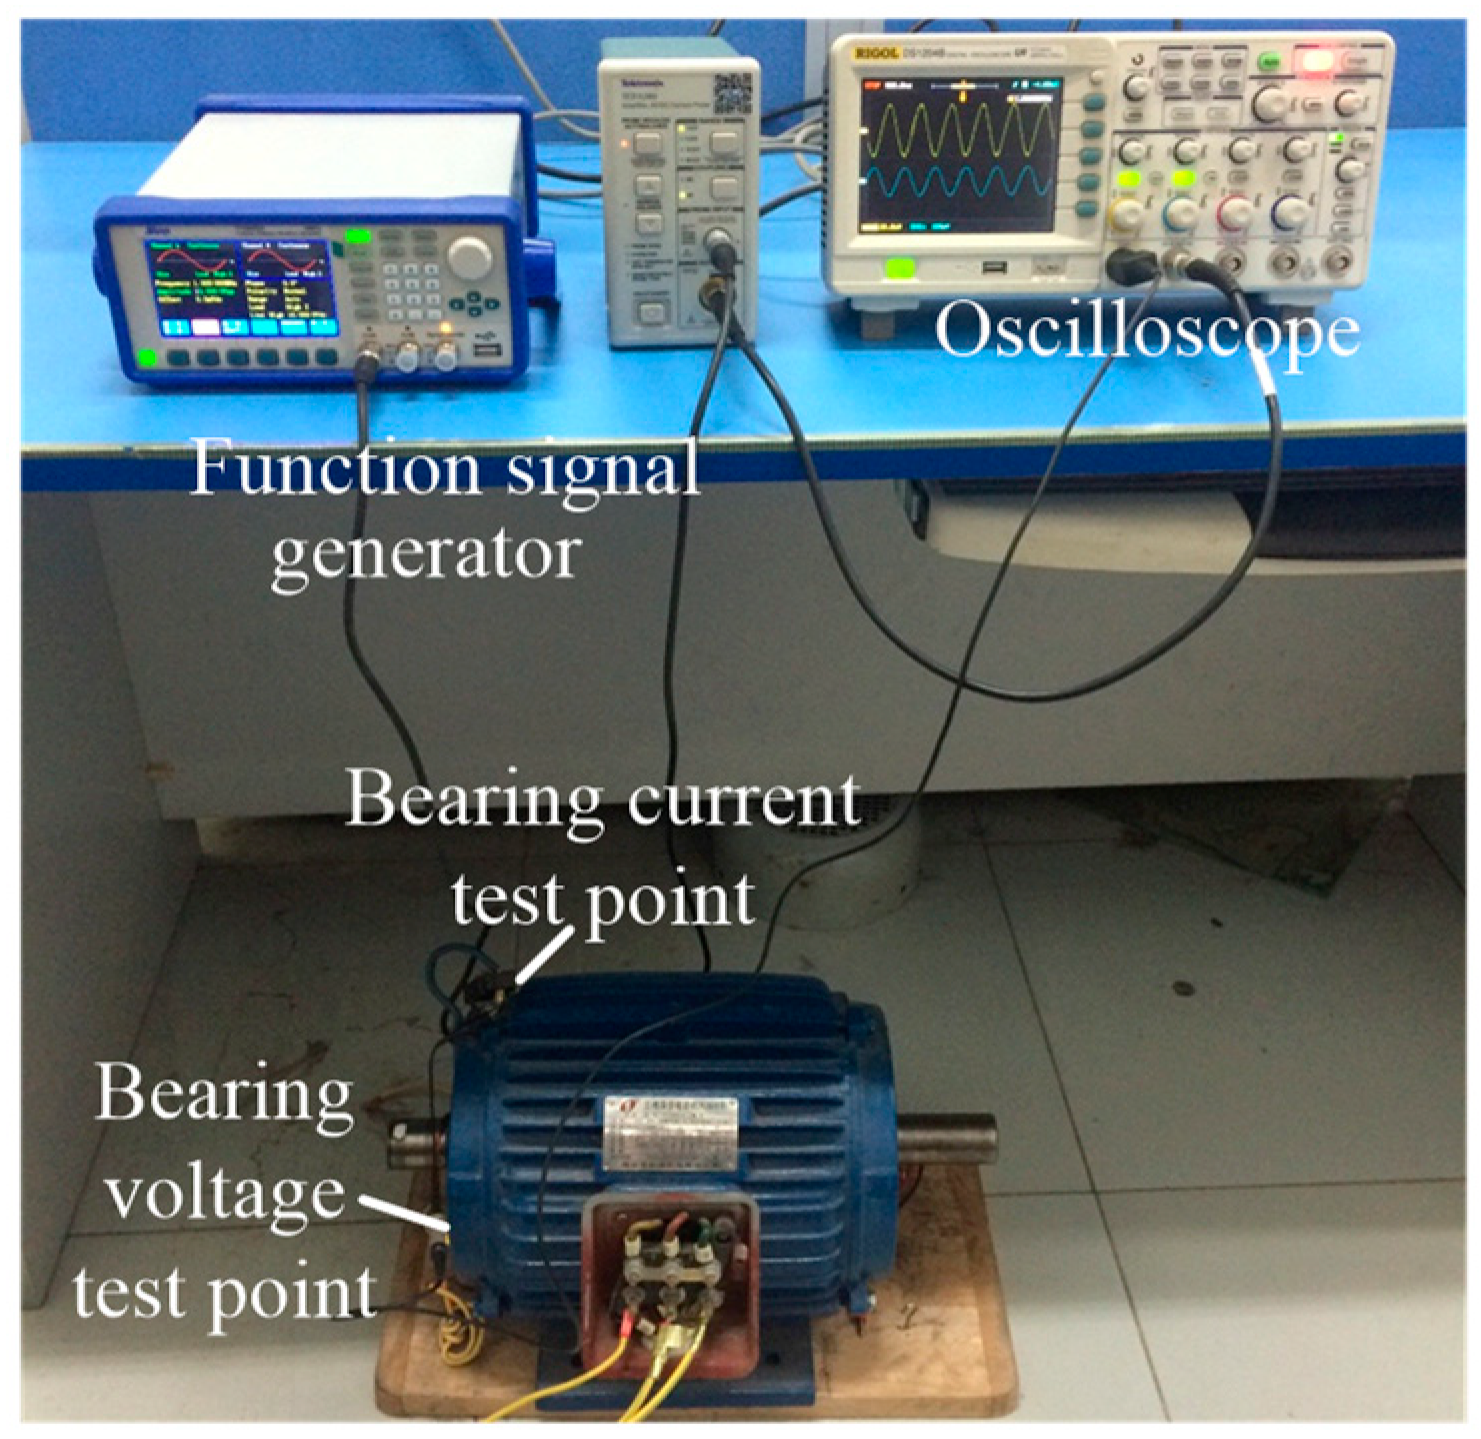
Figure 3.
The test point display.

Figure 4.
Waveforms of the bearing voltage Vb and the bearing current Ib.
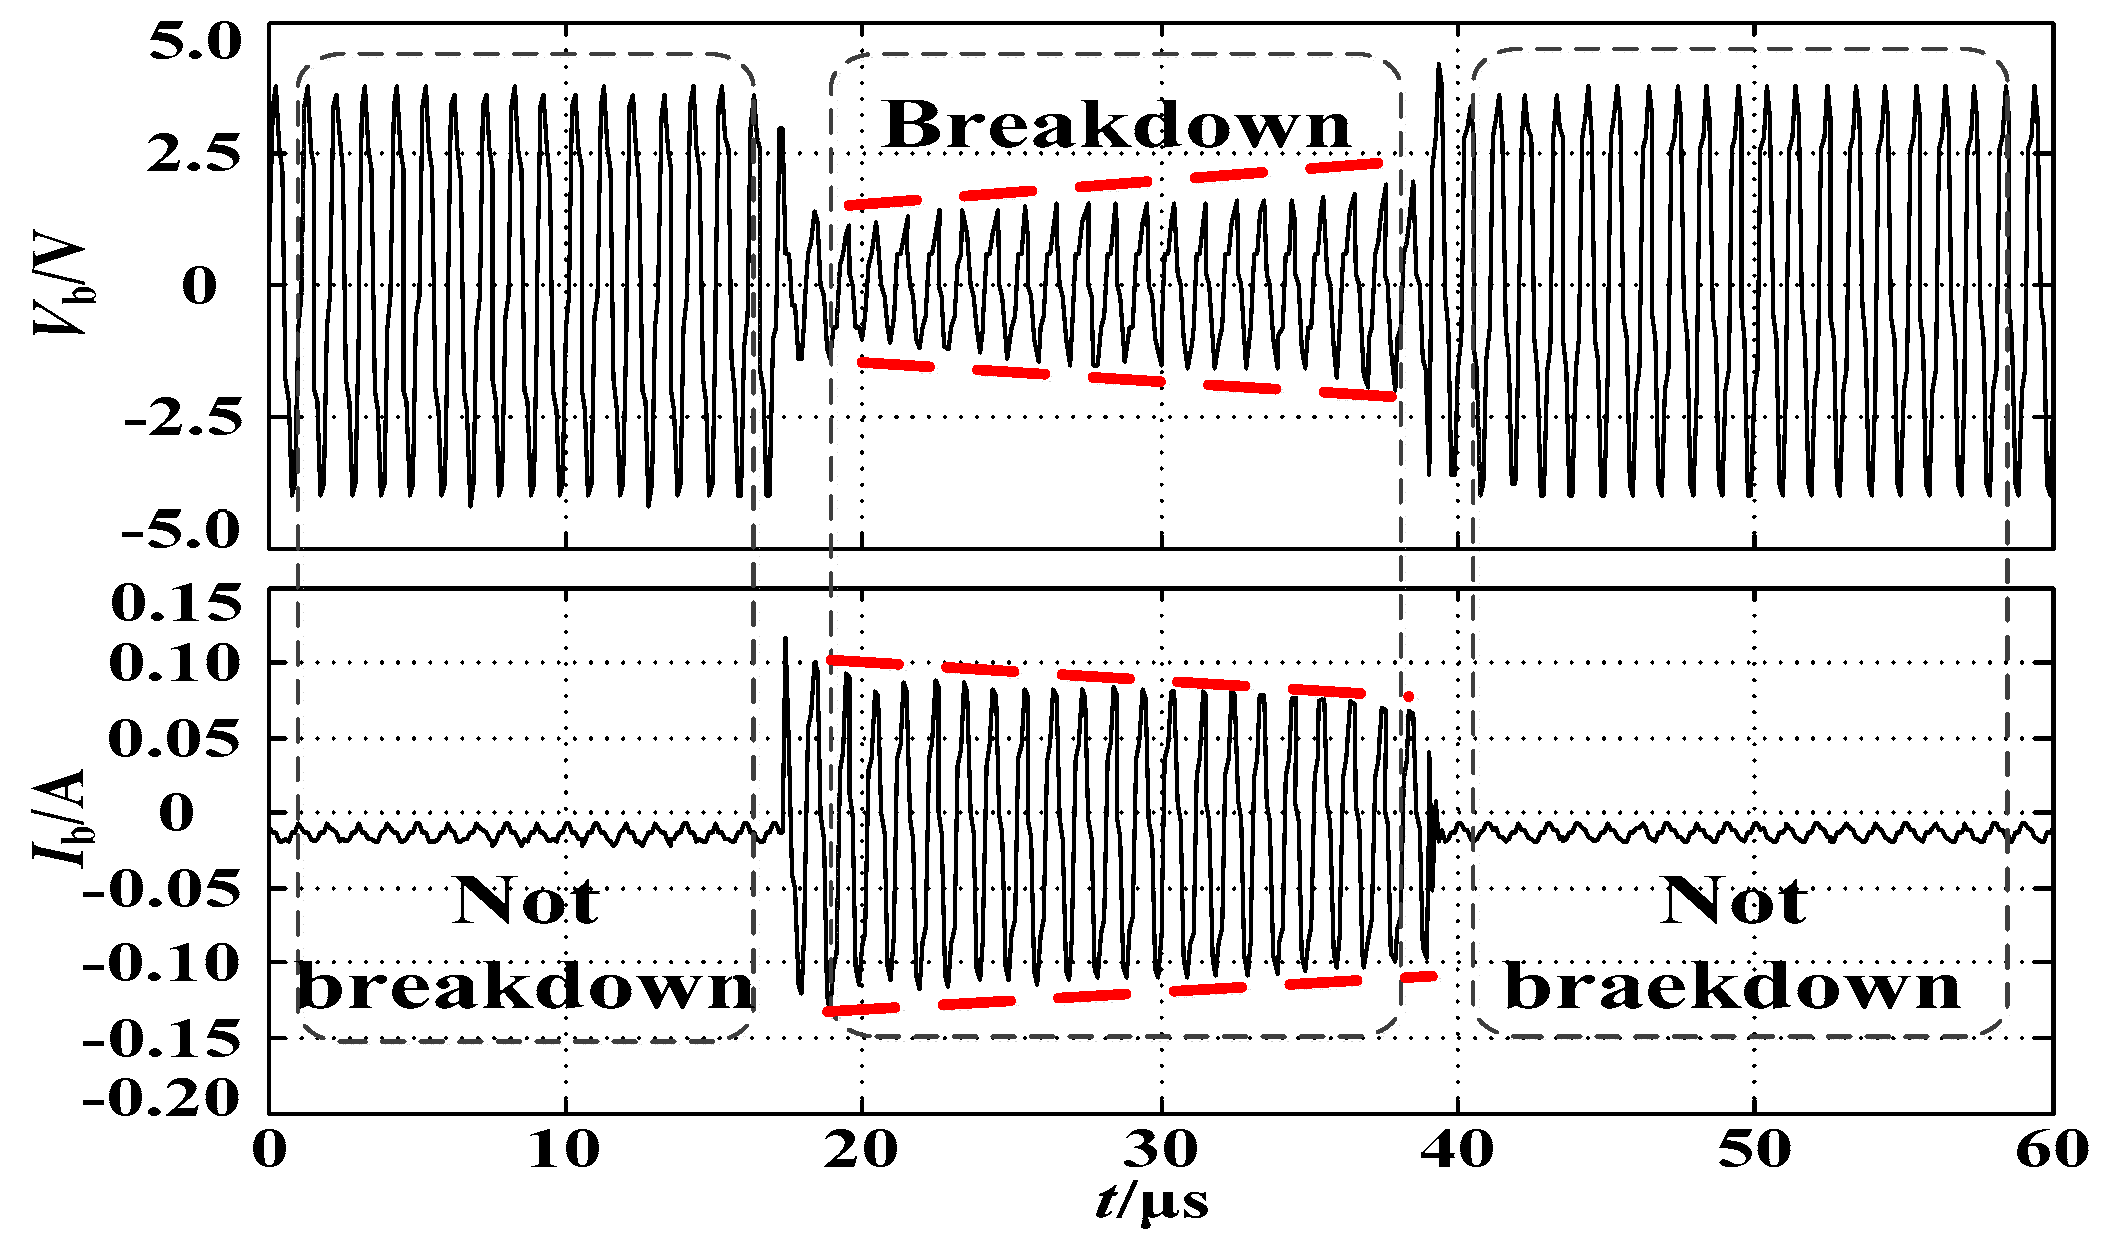
Figure 5.
Waveforms of the bearing voltage and the bearing current (a) at not breakdown (b) at breakdown.
Figure 5.
Waveforms of the bearing voltage and the bearing current (a) at not breakdown (b) at breakdown.

Figure 6.
Improved bearing equivalent breakdown model.
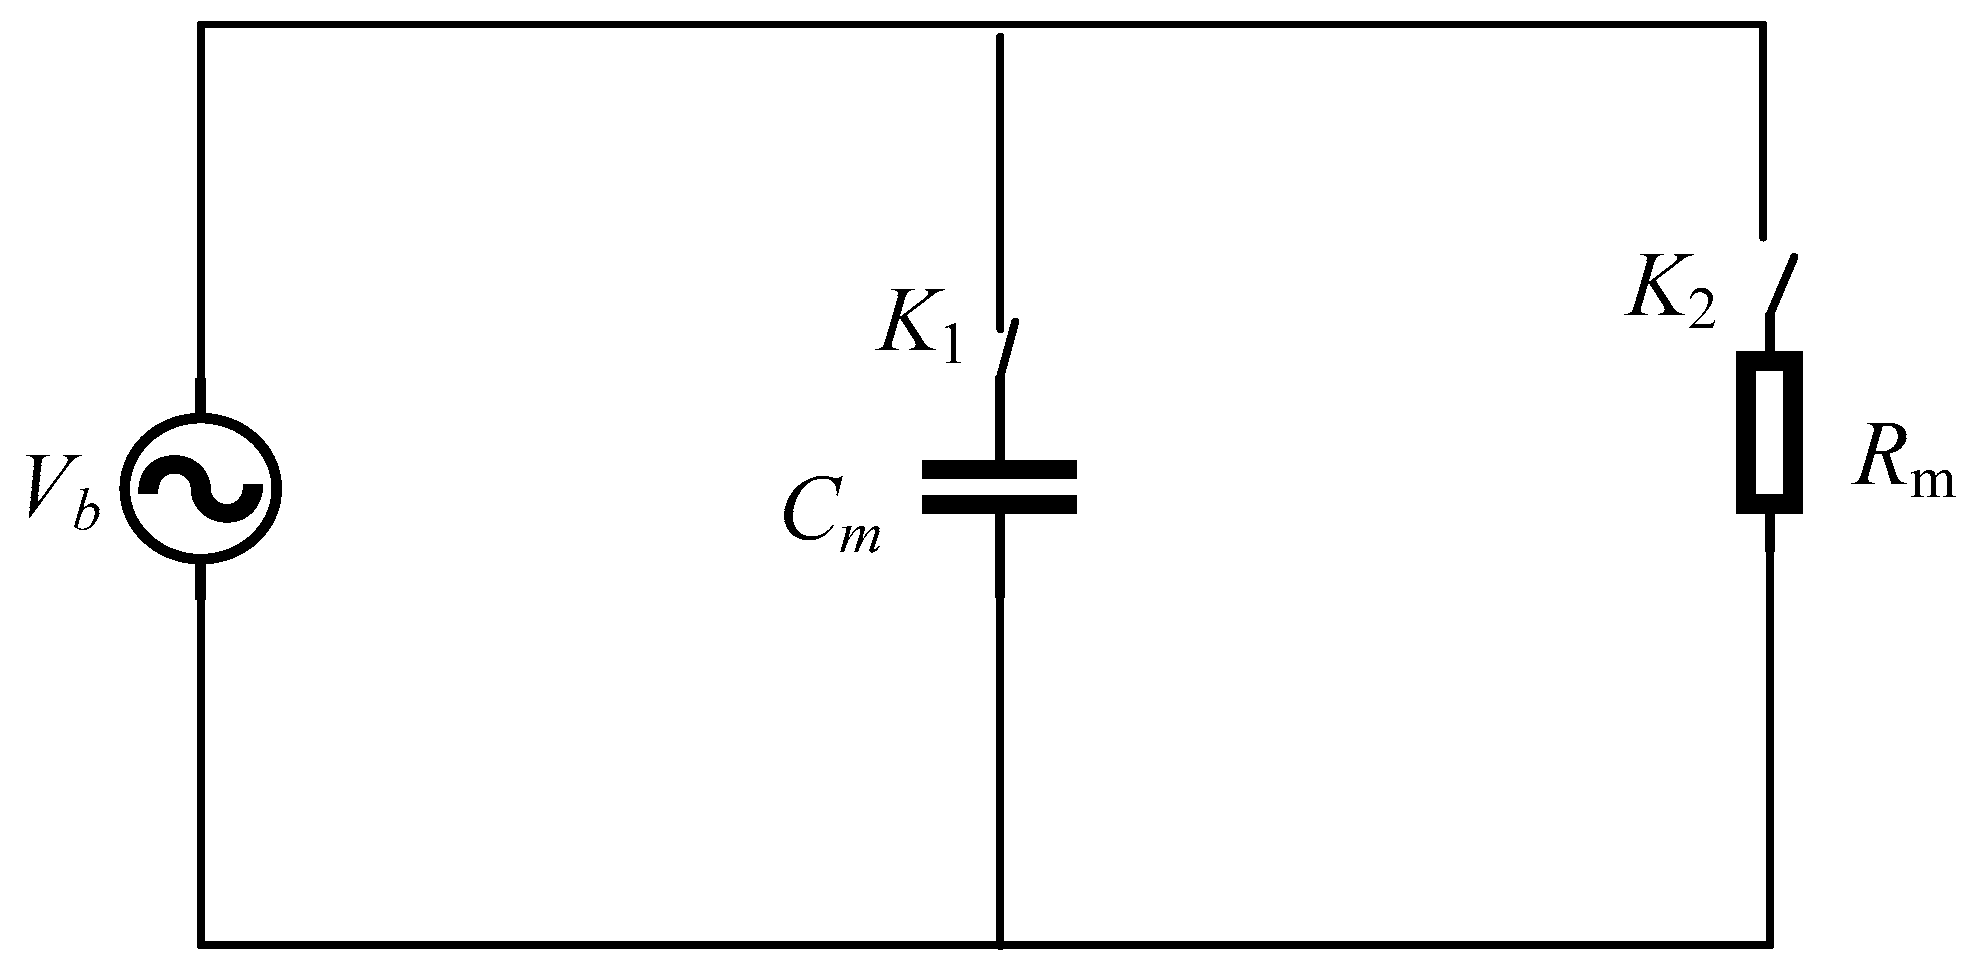
Figure 7.
Impedance curve during the bearing breakdown process.
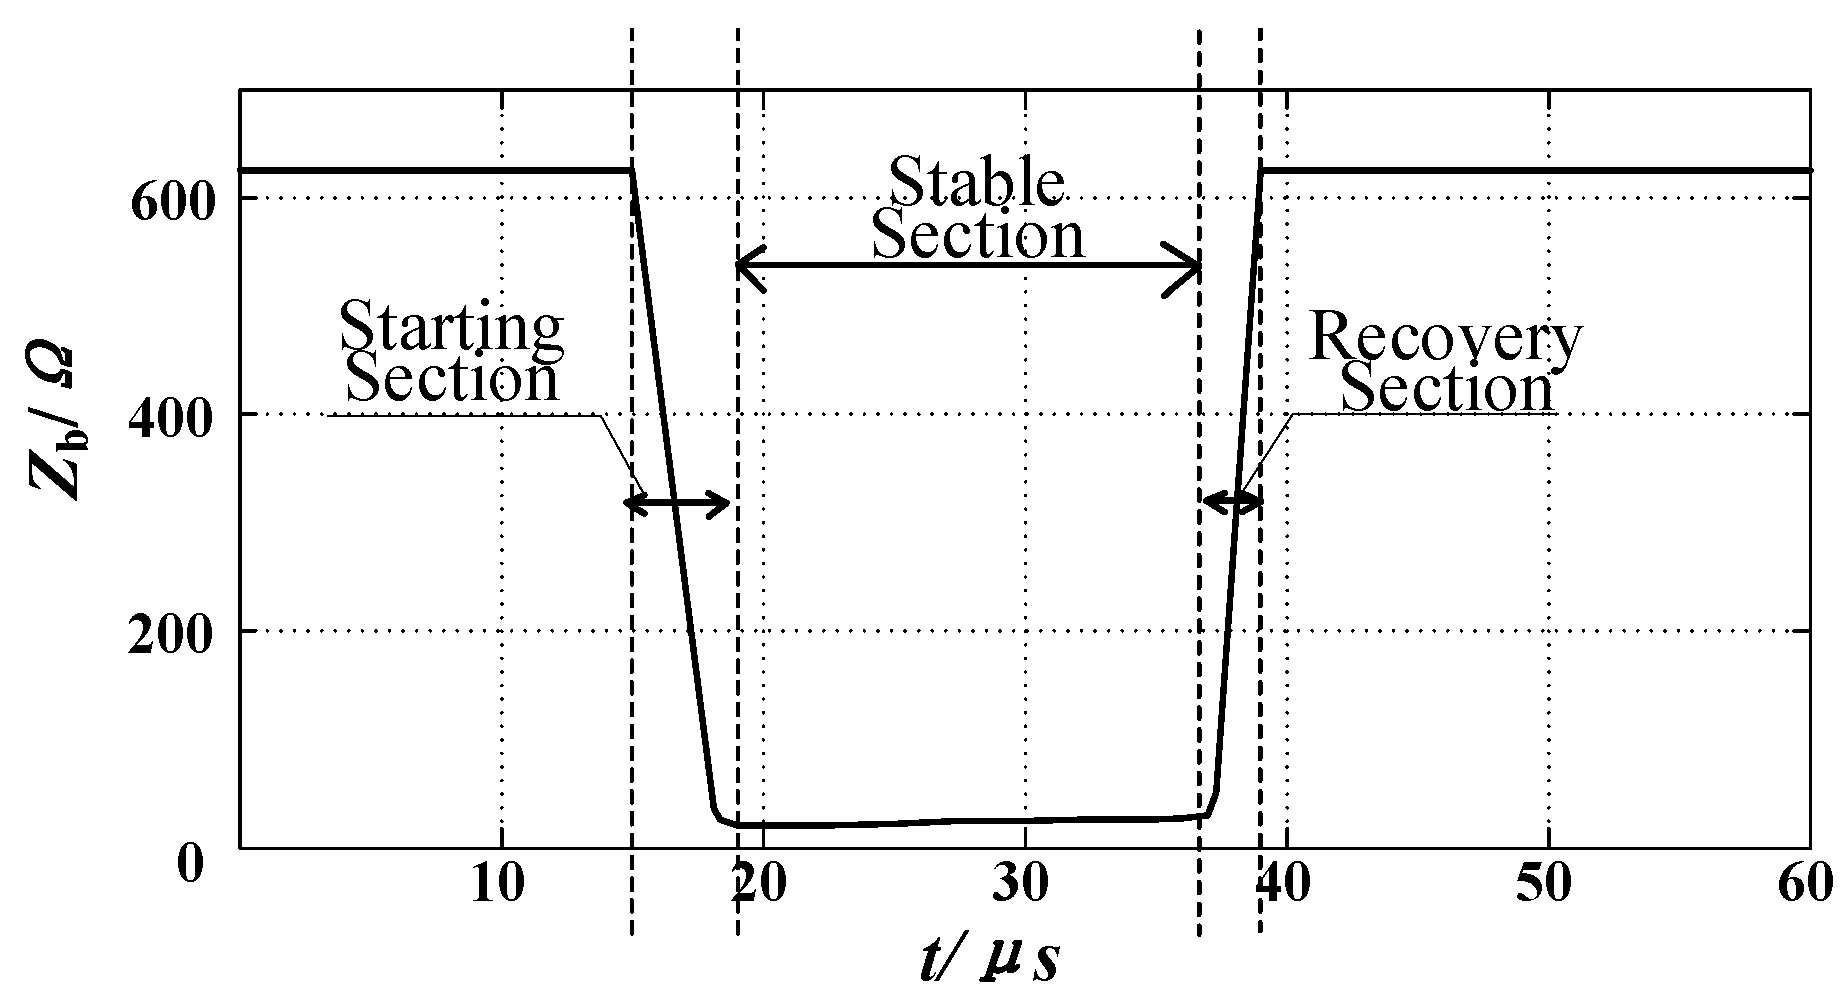
Figure 8.
Equivalent resistance of the measured and calculated curve.

Figure 9.
Simulation circuit of bearing breakdown with (a) the variable breakdown resistance model (b) the constant breakdown resistance model.
Figure 9.
Simulation circuit of bearing breakdown with (a) the variable breakdown resistance model (b) the constant breakdown resistance model.
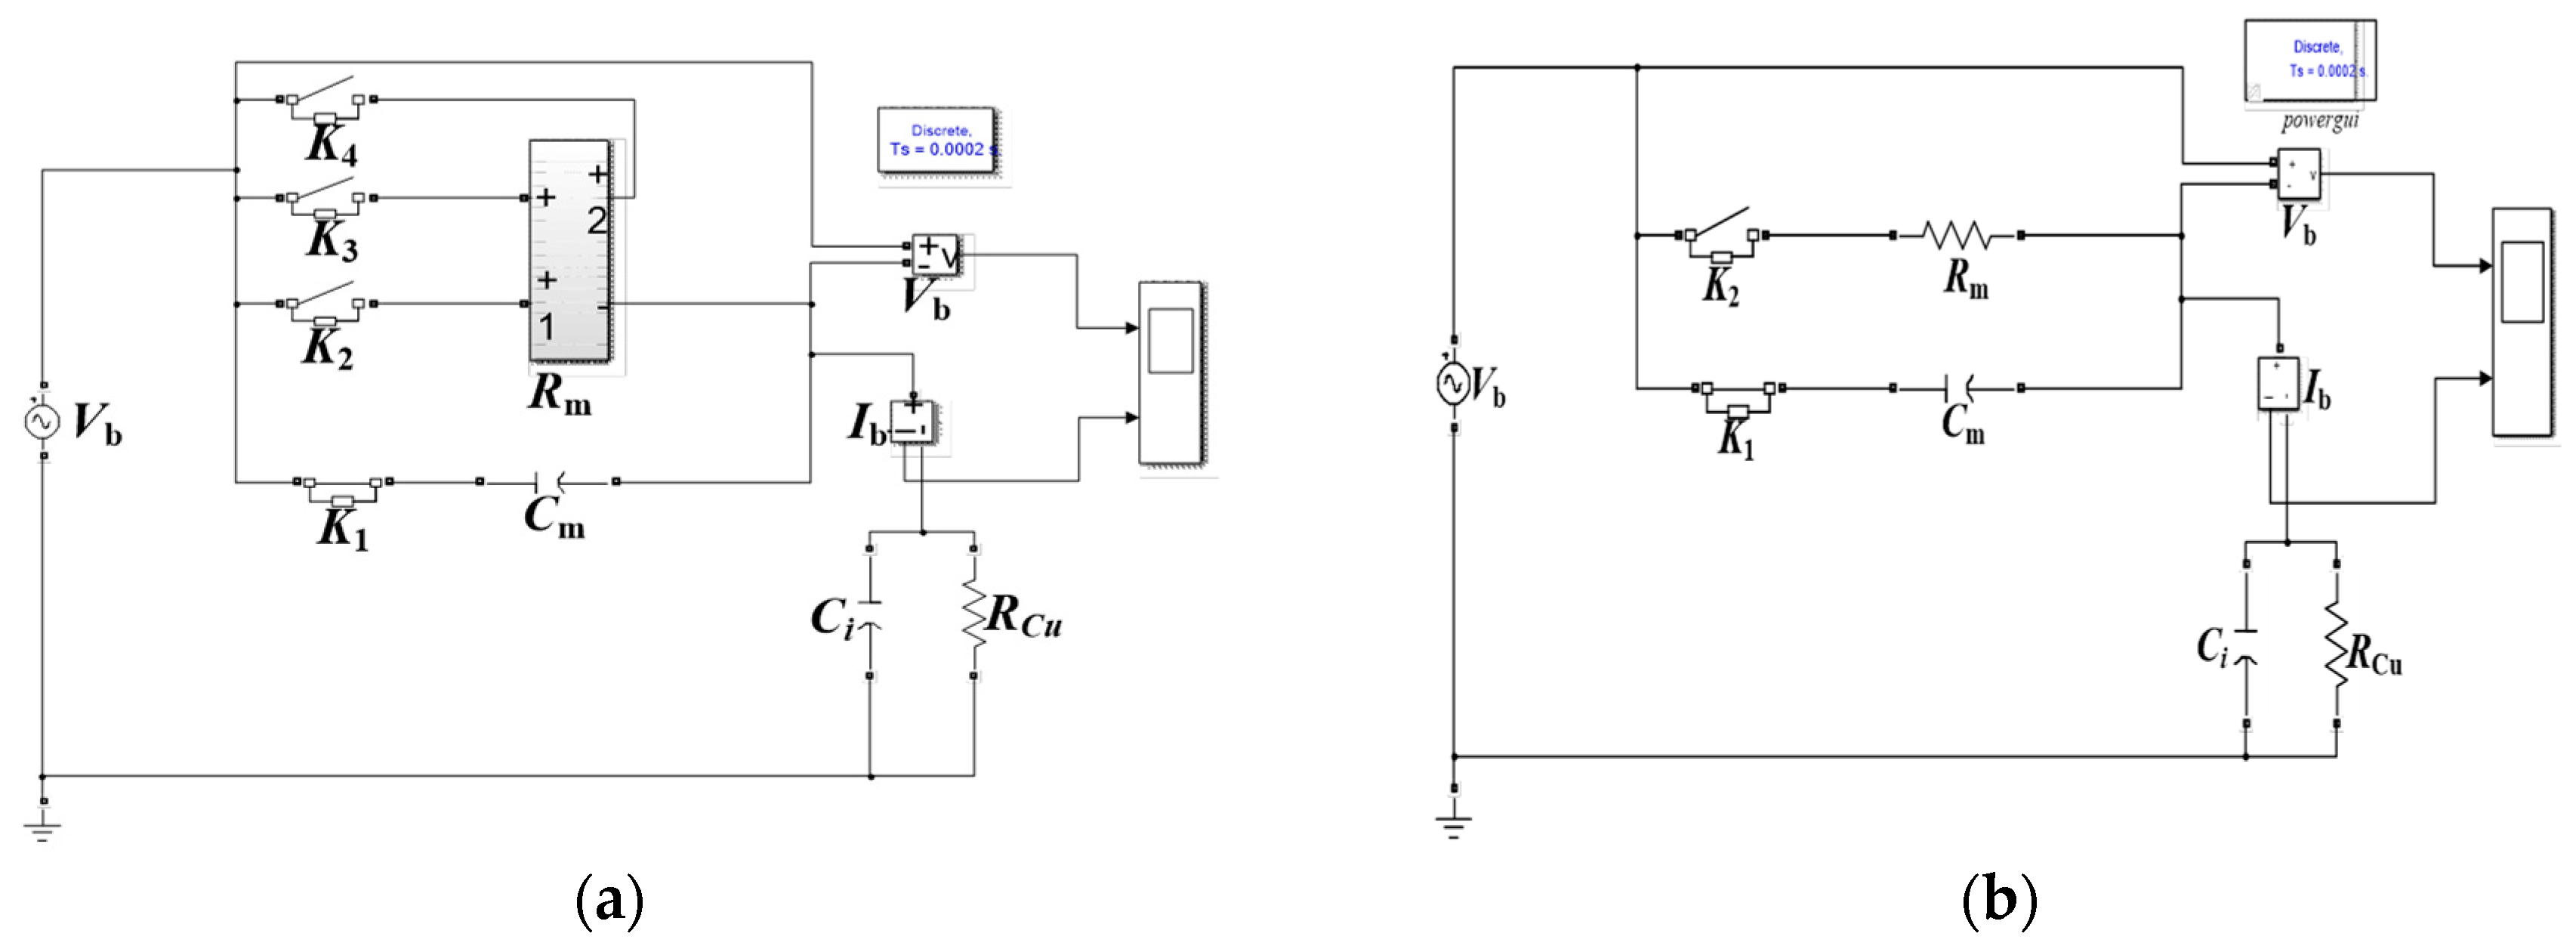
Figure 10.
Simulation waveforms of (a) the variable resistance models and (b) the constant resistance models.
Figure 10.
Simulation waveforms of (a) the variable resistance models and (b) the constant resistance models.
© 2019 by the authors. Licensee MDPI, Basel, Switzerland. This article is an open access article distributed under the terms and conditions of the Creative Commons Attribution (CC BY) license (http://creativecommons.org/licenses/by/4.0/).
Share and Cite
MDPI and ACS Style
Ren, X.; Liu, R.; Yang, E. Modelling of the Bearing Breakdown Resistance in Bearing Currents Problem of AC Motors. Energies 2019, 12, 1121. https://doi.org/10.3390/en12061121
AMA Style
Ren X, Liu R, Yang E. Modelling of the Bearing Breakdown Resistance in Bearing Currents Problem of AC Motors. Energies. 2019; 12(6):1121. https://doi.org/10.3390/en12061121
Chicago/Turabian StyleRen, Xuejiao, Ruifang Liu, and Erle Yang. 2019. "Modelling of the Bearing Breakdown Resistance in Bearing Currents Problem of AC Motors" Energies 12, no. 6: 1121. https://doi.org/10.3390/en12061121
Note that from the first issue of 2016, this journal uses article numbers instead of page numbers. See further details here.