Monitoring Wind Turbine Gearbox with Echo State Network Modeling and Dynamic Threshold Using SCADA Vibration Data


School of Electrical Engineering, Yanshan University, Qinhuangdao 066004, China
*
Authors to whom correspondence should be addressed.
†
These authors contributed equally to this work.
Energies 2019, 12(6), 982; https://doi.org/10.3390/en12060982
Submission received: 22 February 2019
/
Revised: 7 March 2019
/
Accepted: 7 March 2019
/
Published: 13 March 2019
(This article belongs to the Collection Wind Turbines)
Abstract
:Health monitoring of wind turbine gearboxes has gained considerable attention as wind turbines become larger in size and move to more inaccessible locations. To improve the reliability, extend the lifetime of the turbines, and reduce the operation and maintenance cost caused by the gearbox faults, data-driven condition motoring techniques have been widely investigated, where various sensor monitoring data (such as power, temperature, and pressure, etc.) have been modeled and analyzed. However, wind turbines often work in complex and dynamic operating conditions, such as variable speeds and loads, thus the traditional static monitoring method relying on a certain fixed threshold will lead to unsatisfactory monitoring performance, typically high false alarms and missed detections. To address this issue, this paper proposes a reliable monitoring model for wind turbine gearboxes based on echo state network (ESN) modeling and the dynamic threshold scheme, with a focus on supervisory control and data acquisition (SCADA) vibration data. The aim of the proposed approach is to build the turbine normal behavior model only using normal SCADA vibration data, and then to analyze the unseen SCADA vibration data to detect potential faults based on the model residual evaluation and the dynamic threshold setting. To better capture temporal information inherent in monitored sensor data, the echo state network (ESN) is used to model the complex vibration data due to its simple and fast training ability and powerful learning capability. Additionally, a dynamic threshold monitoring scheme with a sliding window technique is designed to determine dynamic control limits to address the issue of the low detection accuracy and poor adaptability caused by the traditional static monitoring methods. The effectiveness of the proposed monitoring method is verified using the collected SCADA vibration data from a wind farm located at Inner Mongolia in China. The results demonstrated that the proposed method can achieve improved detection accuracy and reliability compared with the traditional static threshold monitoring method.
1. Introduction
With the gradual depletion of petrochemical energy, wind energy as a kind of renewable energy with huge resource potential has attracted worldwide attention. However, most wind turbines are located in remote areas and usually operating in harsh environments, thus causing frequent faults, and even shutdowns in serious cases [1]. As a result, unexpected failures and shutdowns will lead to a significant increase in the operation and maintenance costs of wind turbines. To deal with such issues, condition monitoring and fault diagnosis of wind turbines have gained considerable interest [2,3] due to their benefits from improving the availability and reducing the operation and maintenance costs of wind turbines. Typically, a wind turbine is a complex electromechanical system consisting of various subsystems and components, such as gearbox, generator, main shaft, and bearing, etc. [4]. The gearbox, as a core component of the wind turbine, is responsible for transfering mechanical energy to the generator and then increasing its speed to the requirement of power generation. Due to constantly changing operating condition with variable load and excessive temperature differentials, the gearbox failure has become the main source of the total failures of wind turbines [5]. Therefore, it is desirable to develop effective and reliable health monitoring methods to detect early potential faults timely and reliably, thus helping avoid secondary damages and even catastrophic accidents.
In recent years, numerous techniques have been widely used for condition monitoring of wind turbine gearboxes [6], which can be mainly classified as vibration analysis [7,8,9], oil analysis [10], acoustic emission monitoring [11,12], electrical signal analysis [13], and others. However, not all wind turbines are equipped with corresponding sensors or data acquisition equipment, and the additional installation of these devices actually increases the investment costs. Practically, modern large-scale wind turbines have been equipped with a Supervisory Control and Data Acquisition (SCADA) system to record and collect the operation data and status data. Typically, these data include meteorological conditions (e.g., wind speed, wind direction), bearing temperatures, pressures, and power and electrical measurements [14], which contain rich information concerning the health of the wind turbine and its key components or subsystems. Consequently, condition monitoring based on SCADA data has proven to be an available and valuable approach [15]. Up to now, numerous methods for early fault detection of wind turbine gearboxes using SCADA data have been studied extensively, including nonlinear state estimation technique [16], auto-associative kernel regression [17], neural networks [18,19,20], support vector machines [21,22], and recently emerged deep neural networks [23,24]. The above methods and studies have made great progress in health monitoring and fault detection of wind turbines, and they mainly focus on modeling and analysis of several typical parameters in SCADA data, including power, temperature and pressure. In contrast to most existing works, this paper focuses on monitoring gearbox using SCADA vibration data for early fault detection. Monitoring gearbox vibrations of a wind turbine is helpful to prevent material fatigue, reduce component failures and even extend the life-cycle of some components.
Naturally, SCADA vibration data are time series presenting temporal dynamics and have nonlinear characteristics due to the interaction and dependency between different subsystems or components. To deal with such complex vibration data, the neural networks algorithm could provide an effective solution. Echo state network (ESN) is a new type of textcolorredrecurrent neural networks (RNNs) proposed by Jaeger in 2001 [25], which presents a distinguishable simple learning procedure. The unique feature of the ESN algorithm is that it takes full advantage of the dynamic reservoir composed of many randomly sparsely connected neurons to represent inputs in a high dimensional and nonlinear manner and needs only one-step linear training for readouts [25]. Compared with the traditional neural network algorithms, ESN has powerful stability, efficient training performance and even can overcome the problems of memory fading and easy to fall into the local minimum. In recent years, ESN has been successfully applied to chaotic system prediction [26], electricity energy consumption prediction [27], wind speed and power forecasting [28,29], and power quality improvement [30]. Inspired by its powerful properties in dynamic modeling and prediction, this paper attempts to apply ESN to model and predict gearbox vibration for condition monitoring and fault detection purpose of wind turbine gearboxes.
This aim of this paper is to develop a reliable health monitoring model for wind turbine gearboxes using SCADA vibration data. It is well recognized in previous studies that wind turbines usually operate in the dynamic operating conditions driven by the external wind speed variations [31,32]. It has been proven that such highly dynamic operating conditions of a wind turbine pose a great challenge to traditional condition monitoring methods based on a meaningful and actionable threshold for when maintenance activities should be optimally performed [31]. In practical engineering applications, most health monitoring systems for wind turbines mainly used a static or constant threshold [33,34]. Specifically, if a threshold is set too high, it will lead to many missed detections; otherwise, if it is set too low, it will result in relatively high false alarms. Therefore, an appropriate scheme is desired to dynamically update the threshold selection based on the variations in the values of the monitored data to give better performance [35,36]. To this end, this paper proposes a dynamic threshold monitoring scheme with a sliding window technique to generate dynamic threshold control limits. In summary, the main contributions of this paper are as follows.
- (1)
- A vibration normal behavior model is built based on the ESN algorithm to capture the nonlinear correlations and temporal dynamics between the inputs and outputs, which can well describe the vibration normal behavior of wind turbine gearboxes. To our best knowledge, this is the first application of the ESN in the field of wind turbine health monitoring and fault detection.
- (2)
- A dynamic threshold monitoring scheme with the sliding window technique is designed to update the residual monitoring threshold in real time, and then an anomaly ratio indicator is defined to further reduce the false alarms.
- (3)
- SCADA vibration data from a wind turbine gearbox in a real wind farm is used to evaluate the performance of the proposed method. Compared with the traditional static threshold monitoring method, the proposed method achieved more reliable monitoring performance with no or fewer false alarms.
The rest of this paper is organized as follows. Section 2 briefly introduces the wind turbine gearbox monitoring and describes the corresponding SCADA vibration data. Section 3 gives the proposed vibration-based health monitoring framework for wind turbine gearbox in detail. Model validation and comparative analysis are carried out in Section 4. Conclusions are drawn in Section 5.
2. Wind Turbine Gearbox Monitoring and SCADA Vibration Data Description
A typical gear-driven wind turbine consists of multiple components, including blades, main bearing, gearbox, generator, converter, transformer and others, as shown in Figure 1a. The gearbox has been considered as a critical component which is a major cause of failures and results in a large amount of downtime [37]. Therefore, it is of great significance to effectively monitor the gearbox operating states to ensure the safe and reliable operation of the turbine. The SCADA system mainly monitors the gearbox from the following three aspects: temperature, pressure and vibration [5]. However, both temperature and pressure are inertia variables, which are easily affected by their inherent inertia, and as a result, the alarm cannot be performed quickly when a gearbox anomaly or fault occurs. Until when the specified alarm value is reached through the accumulation of time, the alarm command will be issued. Whereas the vibration signal can reflect in real time the instantaneous characteristics related to the operation status of the gearbox. If a fault occurs, vibration signals will present some changes quickly. Therefore, compared with the temperature and pressure monitoring variables, the vibration signals are preferred for gearbox condition monitoring. This study focuses on the development of SCADA vibration-based health monitoring system for wind turbine gearboxes.
The SCADA data used in this study is from wind turbines located in Inner Mongolia, in China. All wind turbines are variable speed constant frequency with the rated power of 1.5 MW, which are equipped with standard SCADA systems to collect and record the operational status information of the subsystems and components, including wind speed, active power, gearbox oil temperature, tower vibration, gearbox vibration and the other continuous parameters. At the same time, discrete information such as startup, shutdown and fault information, etc., are also recorded. The sampling interval of the SCADA data was 30 s. As shown Figure 1b,c, a two-channel vibration analyzer (Type: WP4084) is fitted to the gearbox to measure vibration data from two directions, where we denote Channel 1 as the X-direction representing the horizontal direction, and Channel 2 as the Y-direction representing the vertical direction. All measured vibration data will be sent to the SCADA system. Figure 2a,b shows the historical gearbox vibration data from X-direction and Y-direction, respectively during the period of 1–31 December 2013, which contains a total number of 117,530 data records.
3. Proposed Health Monitoring Framework for Wind Turbine Gearboxes
3.1. Overview of the Proposed Framework
The proposed health monitoring method for wind turbine gearboxes based on SCADA vibration data mainly consists of two phases: offline modeling and online monitoring, as shown in Figure 3. The key part of this framework is to build a vibration normal behavior model to capture the nonlinear and temporal dynamics of vibration data. To this end, the ESN algorithm is adopted in this paper. A typical advantage of the proposed framework is only requiring normal vibration data collected from historical SCADA data, which can be easily implemented in practical applications where faulty data is difficult and even impossible to obtain. The main idea behind this framework is based on the evaluation of the residuals between the actual measured values and the model predicted values from the well trained normal behavior model. The changes of the residual will give an indication of possible anomaly or faults. Usually, normal test samples will produce a low residual since they can well satisfy the learned vibration normal behavior model; whereas the faulty samples will produce a high residual and therefore be identified as faults. Notably, different from those traditional residual-based fault detection approaches relying on a predefined static threshold, in our proposed framework, a dynamic threshold monitoring scheme is further designed to improve the reliability of fault detection results. Herein, the detailed procedures of each phase in the proposed framework can be summarized as follows.
- (1)
- Offline modeling phase: Normal vibration data are first selected from historical SCADA data for normal behavior modeling. To eliminate the effect of noise on prediction performance, some necessary processing steps, including data smoothing will be adopted. Then, the preprocessed data are reconstructed to determine the input and output variables required for modeling. Then, the ESN algorithm is used to capture the normal vibration behaviors of the gearbox. Finally, in order to detect the abnormal behavior of the gearbox effectively, an abnormal ratio indicator is calculated based on residuals and then an alarm threshold is determined for subsequent fault detection and warning.
- (2)
- Online monitoring phase: The online monitored vibration data is first preprocessed using the same preprocessing steps described in the offline modeling phase, and then input to the well trained ESN-based normal behavior model to produce the predicted outputs and the corresponding residuals. Next, the residuals are analyzed step by step using the sliding window technique to dynamically update the threshold. Furthermore, an abnormal ratio indicator within a certain time period is calculated for fault detection. If the abnormal ratio exceeds the predefined alarm threshold , a failure warning signal will be issued.
3.2. Vibration Normal Behavior Modeling with ESN
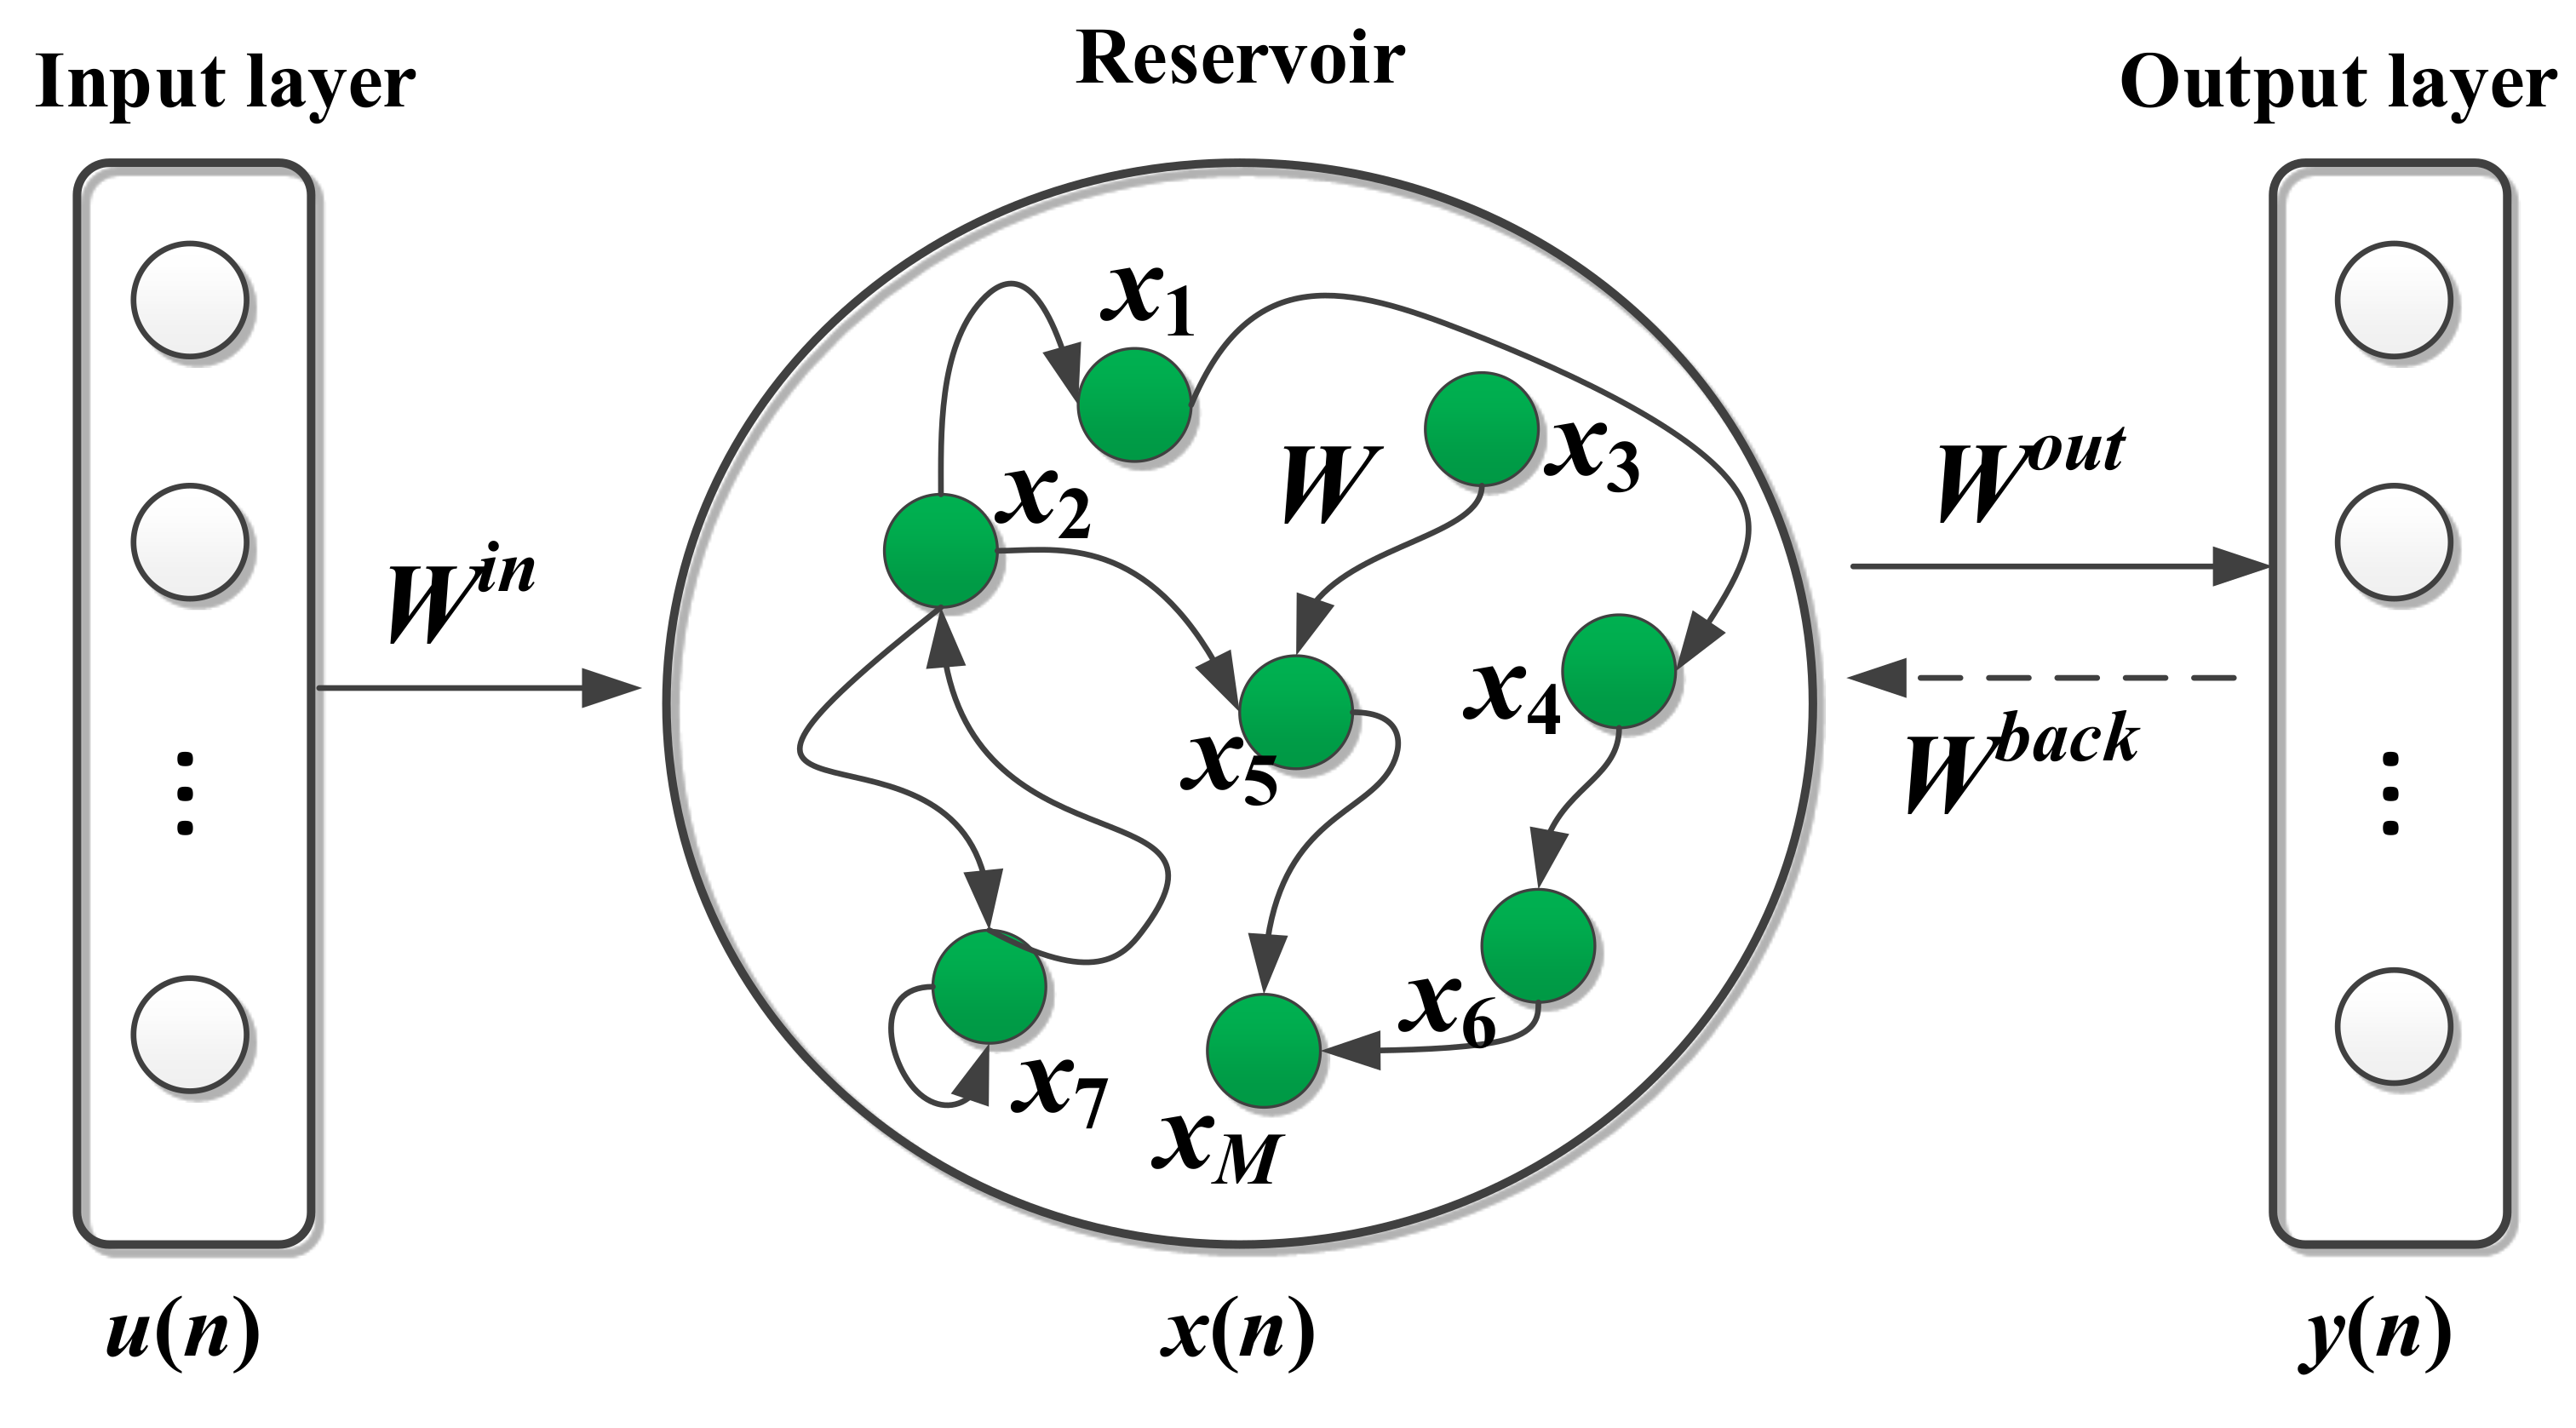
In nature, wind turbine gearbox vibration data are time series containing strong temporal dynamics. To this end, ESN is adopted to model vibration data. ESN is a novel recurrent neural network, typically consisting of an input layer, a dynamic reservoir, and an output layer [26], as shown in Figure 4. The dynamic reservoir is the core of the ESN and is located between the input layer and the output layer, which consists of a large number of sparsely connected neurons and has strong nonlinear mapping capabilities. Each layer is connected by input connection weights and output connection weights.
An ESN network with K input neurons, M dynamic reservoir neurons, and L output neurons is shown in Figure 4. Assume that the input, the dynamic reservoir and the output vectors are , and respectively, where , and . Then the state equation and the output equation of the ESN network are expressed as
where and represent the activation functions of neurons in the dynamic reservoir and the output layer, respectively. , , , and denote the connection weight matrices from the input layer to the internal reservoir, from the output layer to the reservoir and from the reservoir to the output layer, respectively. It is worth noting that the connection weight matrices , , and are randomly initialized and remain unchanged during the training process, while is the only parameter that needs to be trained and optimized.
In the training process of the ESN, the internal reservoir is driven by input and output samples to realize the short-term memory of relevant information. After the training, the connection weight matrix from the reservoir to the output layer is determined through the linear regression. To eliminate the influence of random initialization on the state of the reservoir, let be the starting time for collecting the state of the reservoir, then the reservoir state vector can be denoted as , where . Meanwhile, the output signal of the inverse output activation function at the corresponding time is collected to form an output state matrix, which can be expressed as . The least square method is used to compute the output weight matrix , which can be described as
That is
From the above description, it can be concluded that ESN has two major advantages for dynamic system/signal modeling. One is its high nonlinear modeling capability due to the adoption of the dynamic reservoir with a complex structure, and the other one is its fast and easy training procedure since only the output layer of the ESN is optimized by a linear regression, resulting in a time reduced training phase. These unique features of the ESN motivate us to model and analyze the vibration data using the ESN algorithm. ESN can provide an efficient solution for health monitoring model building thanks to its powerful ability of dynamic modeling and efficient training procedure.
In this study, the ESN model is designed to build a vibration normal behavior model using the historical normal vibration data, which can learn and capture the nonlinear dynamics of gearbox vibration from the measured vibration data. The model is trained offline. After training, the weights of ESN are fixed and tested. Then the trained ESN-based vibration normal behavior model is used to predict the vibration signal in real time in the subsequent online monitoring phase. As a result, the ESN will predict normal data accurately while faulty samples will produce a high residual, which will be discussed in detail in Section 4.
3.3. Dynamic Threshold Monitoring Scheme
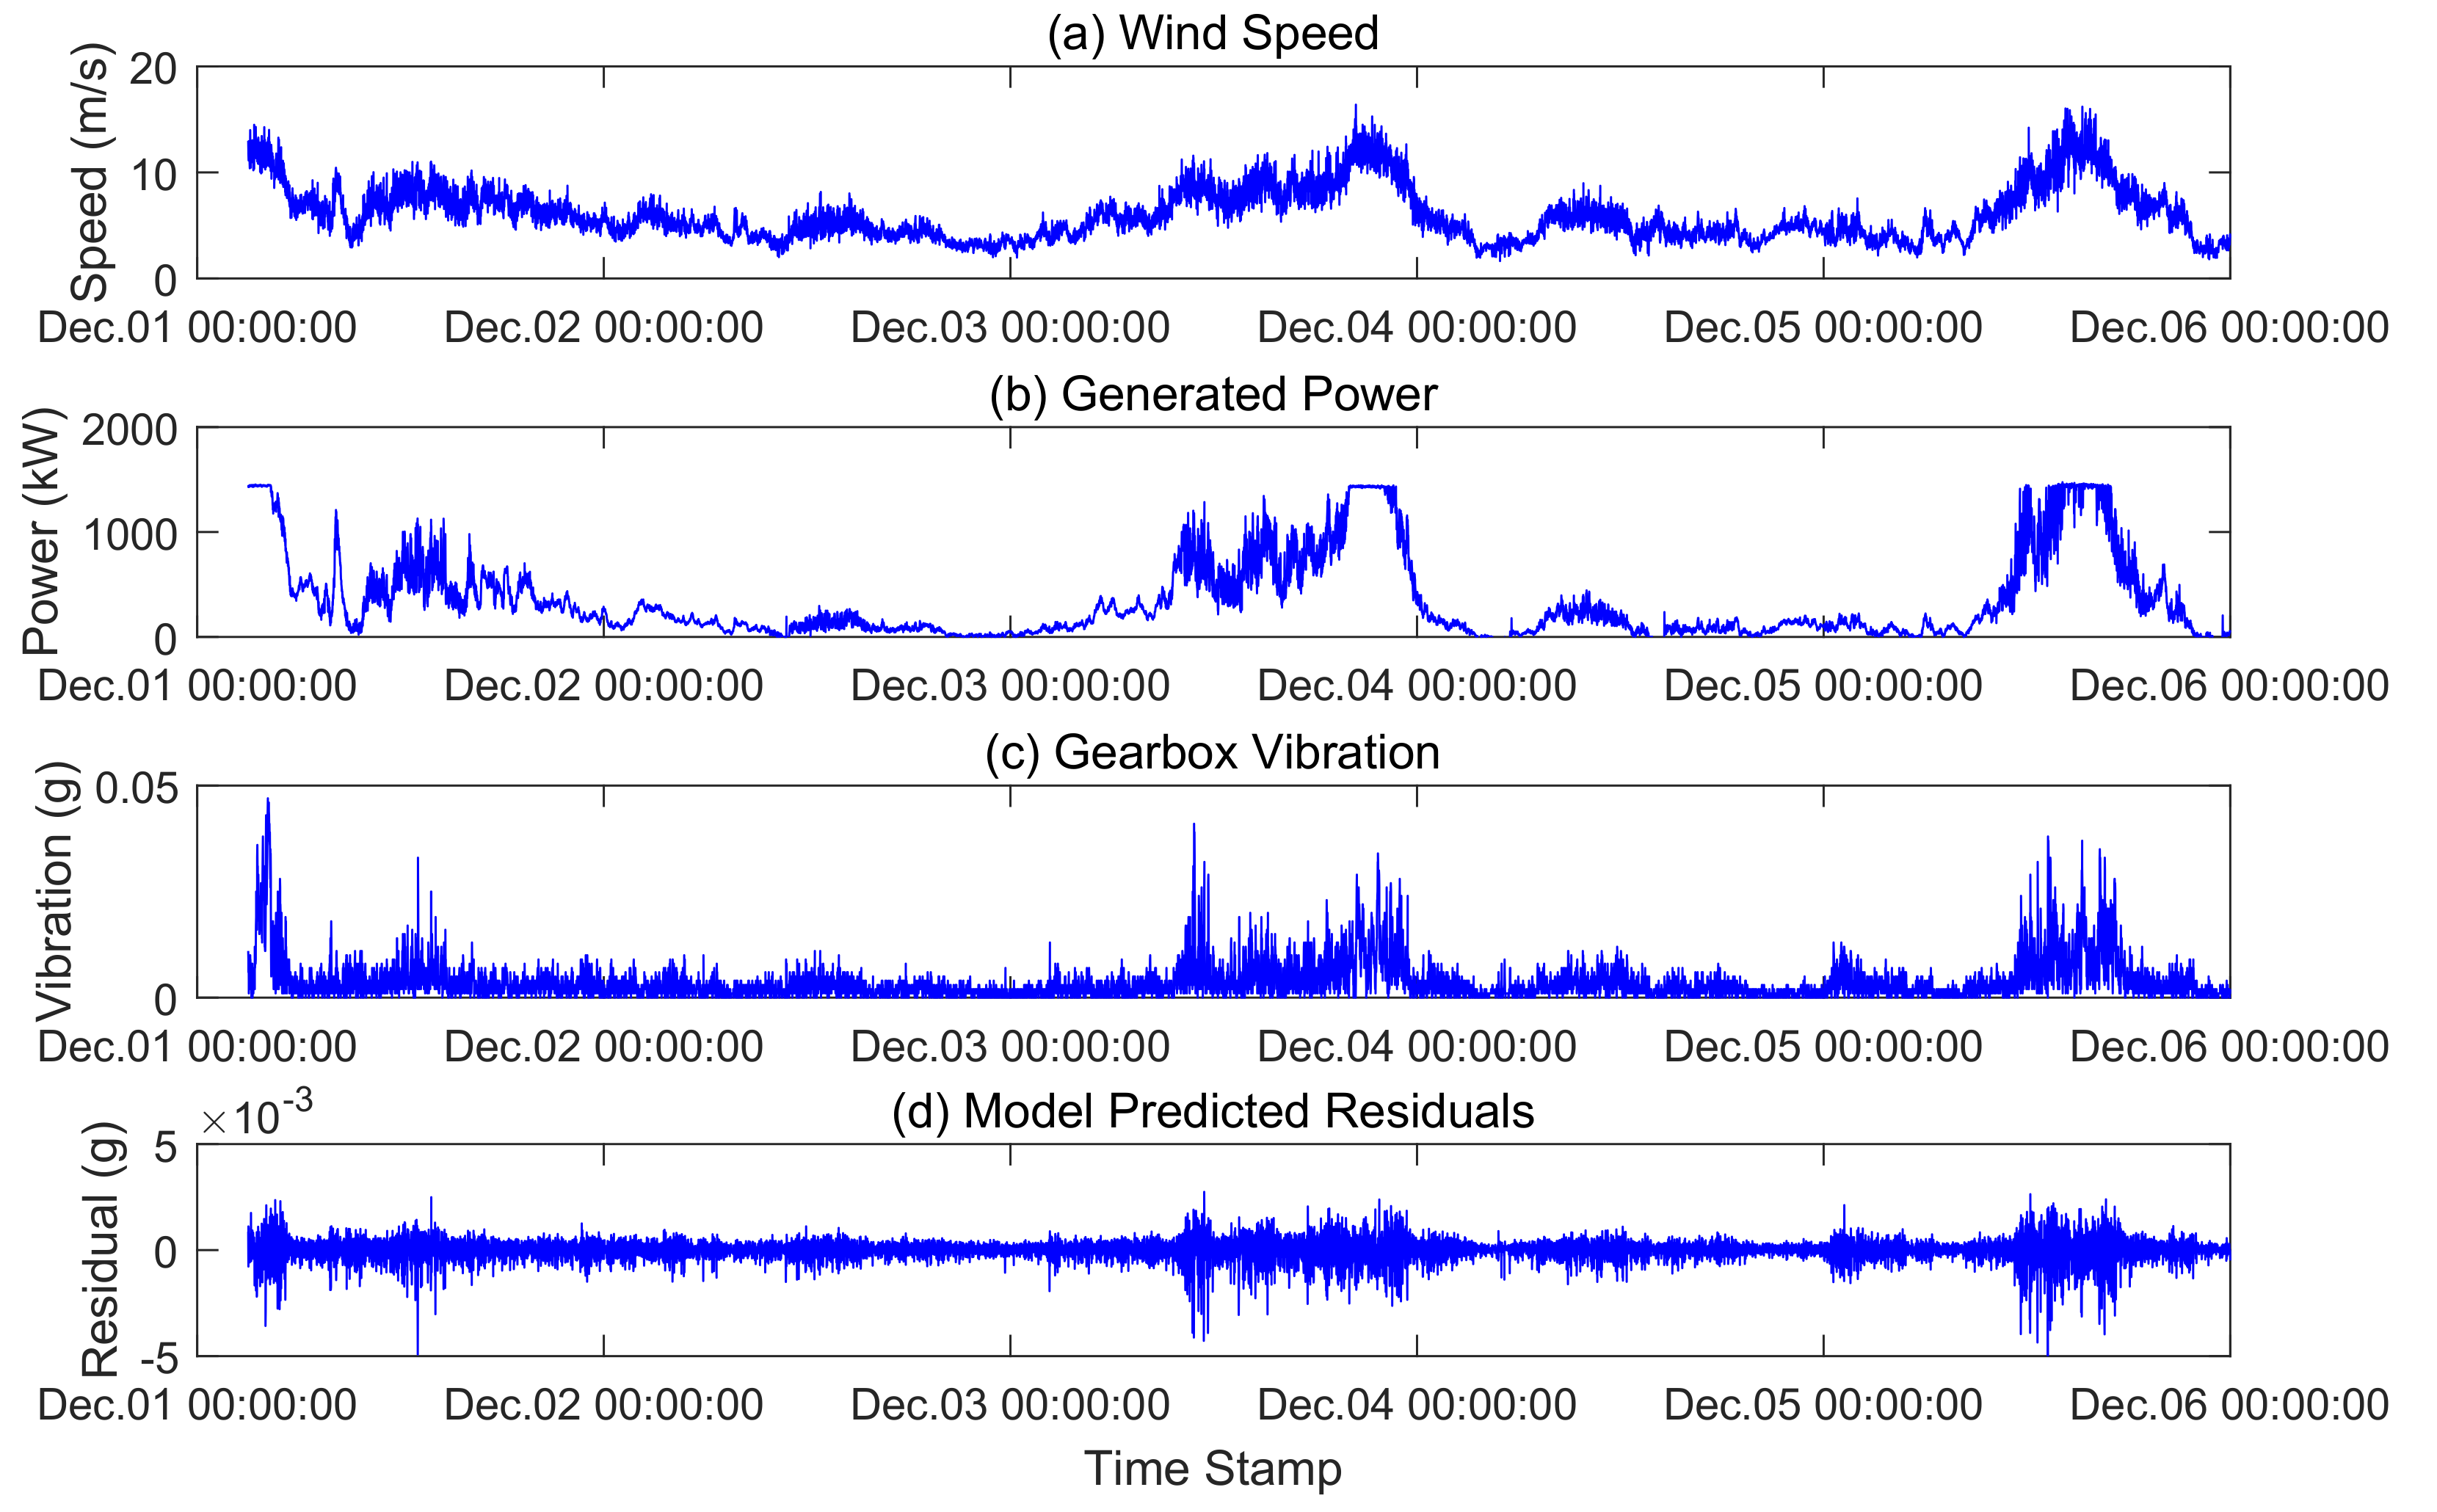
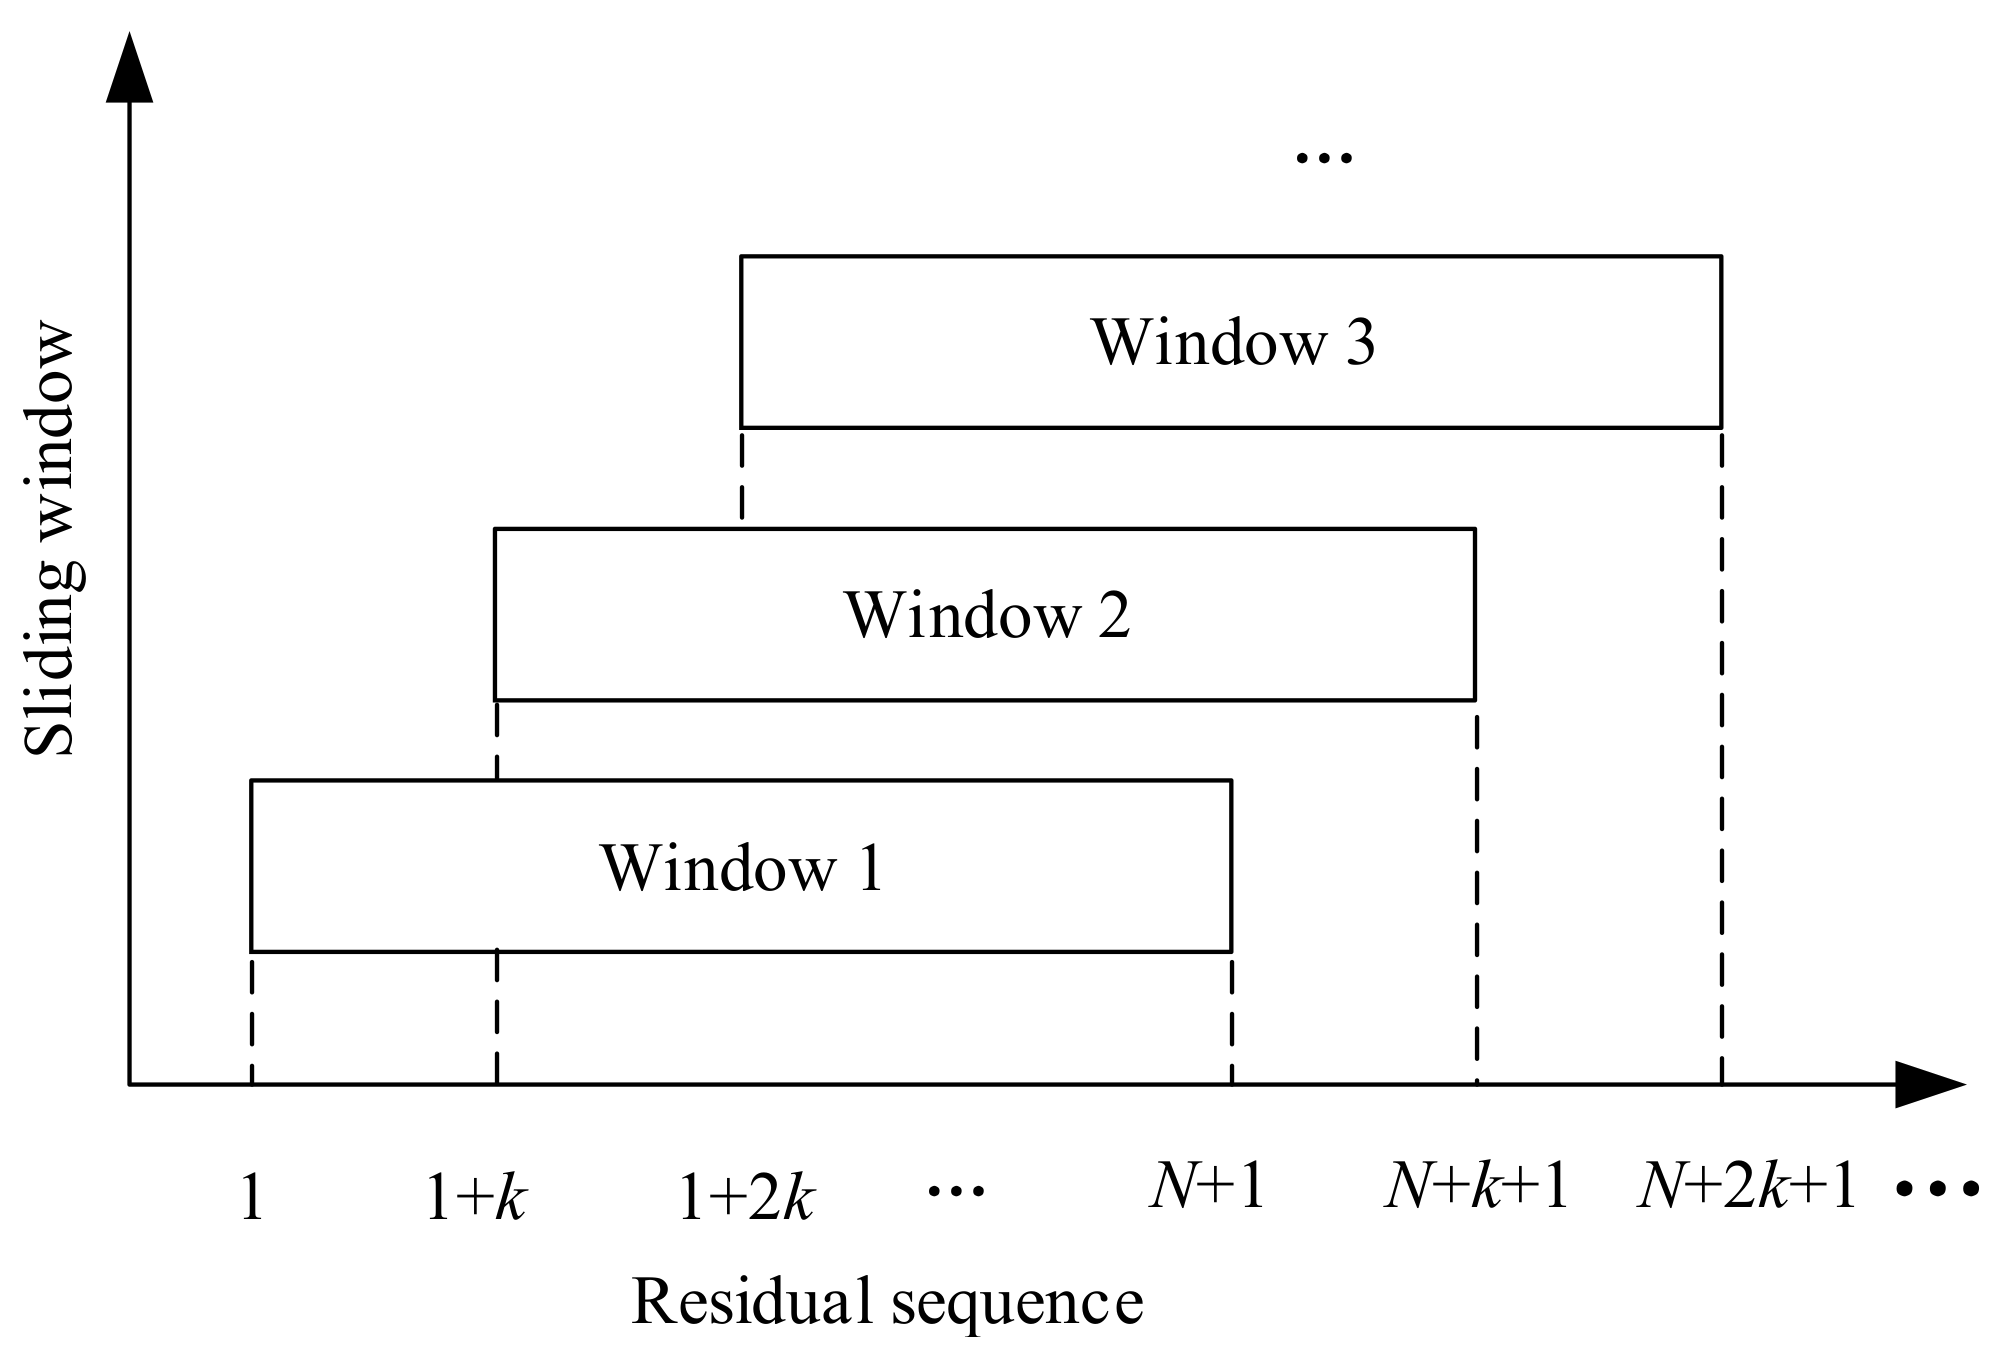
Through the vibration normal behavior model trained offline, the residuals can be calculated as the difference between the model predicted values and the actual measured values. The residuals can reflect vibration signal change and trend during the operation of the wind turbine gearbox and can describe the overall behavior of the monitored gearbox. In previous studies, residuals-based methods have been widely used to identify possible faults of wind turbine components from the residual deviations from the normal behavior model [33,34]. These studies adopted the static threshold monitoring scheme, where the abnormal or fault patterns will be detected if the residual value exceeds a predefined constant threshold. However, it is well-known that wind turbines are usually in the complex and harsh operating environments, and thus the gearbox is subjected to the variable operating conditions caused by the random changes of the external wind speed or loads. As a result, the values of vibration data from SCADA system change with wide ranges in varying operational conditions. Figure 5 shows an example of the measured vibration data and the calculated residuals along with the wind speed and generated power in the period from 1 December 2013 to 5 December 2013. It can be seen that the vibration residuals present different values at different wind speeds; the residual values at high wind speeds are larger than that at low wind speeds. Therefore, the residual is non-stationary caused by the changes of the external operating conditions even when the wind turbine runs normally, and a deterioration condition of the gearbox cannot be detected adequately through residual analysis with a static threshold. The traditional static threshold evaluation criteria keep unchanged in the process of monitoring the gearbox operating states, resulting in frequent false alarms. While the dynamic threshold can adjust the fault control limits adaptively according to the changes of the gearbox vibration. In our study, the sliding window is used in a dynamic monitoring way to adjust the threshold by using a fixed length of samples. With the monitoring time goes by, the locations of samples involving threshold adjustment also keep moving. This method is adopted to achieve the real-time dynamic update of the monitoring threshold, and its principle is shown in Figure 6, where N is the length of each sliding window, and is the number of overlapping samples of two adjacent sliding windows. In addition, k is the number of samples corresponding to the threshold update, that is, for every k samples monitored, the window slides and the threshold is updated accordingly. The proposed dynamic threshold monitoring scheme is simple and easy to implement in real time and online.
Meanwhile, in order to be able to detect the abnormal variations of the gearbox effectively, it is necessary to determine the abnormal detection thresholds. For a sliding window with a width of N, the prediction residual sequence of the gearbox vibration from the ESN model is denoted as
Then, the mean value and the standard deviation for the N consecutive residual values in the window can be calculated as follows
In this paper, to derive the anomaly detection thresholds of this window, the Chebyshev inequality [38] is used, which is expressed as
where m is the threshold tolerance and is set to be 3 here. For a given confidence level , the control limits can be denoted as . The expression in (8) means that the probability of is less than . Similarly, the alarm thresholds of each sliding window can be calculated.
Due to the complex and variable operating environments of the wind turbine, the residuals will contain much noise and other disturbances [33]. If abnormal detection is simply performed in a point-to-point way under the dynamic thresholds, frequent alarms will be produced and result in unreliable detection results and even the wrong maintenance activities. To reduce the effects of noise and improve the reliability of detections, in this study, an abnormal ratio over a fixed length window of k is defined as an indicator to describe the the possibility of the fault occurrence, which refers to the the percentage of the number Q of data points identified as abnormal to the total number of data points within a time interval, which is expressed as
If the abnormal ratio during this period exceeds a predefined threshold value, a fault alarm signal will be triggered to notify the operator to pay attention to the operating states of the gearbox at any time and take corresponding measures.
4. Case Study
In this section, SCADA vibration data described in Section 2 are used to evaluate the performance of the proposed health monitoring framework for wind turbine gearboxes. Specifically, SCADA vibration data from the X-direction as shown in Figure 2a are used in this study. The data are partitioned into three datasets for training, validation and testing, respectively. The training set contains 18,955 data points collected from 00:00:08 on 1 December 2013 to 23:59:40 on 5 December 2013. The validation set contains 15,165 data points acquired from 00:00:10 on 6 December 2013 to 23:59:43 on 9 December 2013. By checking the operation status logs and the maintenance documents of the turbine during the two time periods, there are no fault alarm records and maintenance activities, and it suggests that the turbine operated in normal conditions. Both the training set and the validation set will be used for training and validation of the normal behavior model of the gearbox vibrations, respectively. For the testing set, there are 18,957 data points measured in the period between 00:00:24 on 25 December 2013 and 23:59:55 on 29 December 2013. According to the status logs of the SCADA system, two alarms were reported in December 2013, which will be discussed in the following subsections for further model testing. The description of three datasets is summarized as in Table 1.
4.1. Model Development and Validation
As described in Section 3, normal behavior model for the wind turbine gearbox vibration in our proposed framework is trained only by using normal vibration data without the need for the faulty data. However, it should be noted that in order to ensure the effectiveness and generalization of the built ESN-based vibration normal behavior model, enough normal vibration data are necessary to cover the normal working space of the underlying wind turbine. It is well known that a wind turbine principally operates in different zones depending on the external wind speed [39]. The boundary limits of these zones are marked by the cut-in wind speed , the rated wind speed , and the cut-out wind speed , as shown in Figure 7. It is still worth noting that we should collect much more data to contain different combinations of normal operations, thus covering a complete regime of wind turbines to train a more accurate health monitoring model with better generalization ability and improved performance. However, much more data will in turn increase the computational burden of the model training, and further will lead to a higher cost of the health monitoring system development. Therefore, for practical applications, in order to comprehensively consider the computational efficiency and the reliability and precision of the model, it is suggested to choose a reasonable amount of available normal vibration data covering a complete normal operational regime of wind turbines as shown in Figure 7. Figure 8 gives the power curve for the training set used in this study from a health wind turbine. For the turbine selected, the cut-in, rated and cut-out wind speeds are 3.5 m/s, 12 m/s, and 25 m/s, respectively. From Figure 8, it can be seen that the training dataset mainly cover the three operational zones bounded with the wind speed of about 16 m/s as shown in Figure 7 due to the limited available data in hand. Notice that all three datasets listed in Table 1 used in our case study contains the same operation region. When much more data covering all four operational zones are available, a more general health monitoring model can be trained.
In this section, the training set is used to train the health monitoring model of the gearbox vibration with the ESN algorithm. However, prior to establishing the health monitoring model, the selected data needs to be preprocessed due to the detrimental effects on model performance of noise and high-frequency excitations [40]. First, the training set is smoothed with a 5-point moving average filter, and then the preprocessed data are used for the ESN-based vibration normal behavior model development. The ESN uses the vibration signal at the previous time instant to predict the vibration at the current time instant. Herein, the training set is reconstructed to form the inputs and the outputs of the ESN model. The dynamic reservoir as the core of the ESN algorithm, its state greatly affected the performance of the model. Thus, it is necessary to select the appropriate key parameters of the dynamic reservoir to improve the prediction performance. In this paper, the parameters of the reservoir are experimentally determined, and the final parameters are listed in Table 2.
In previous studies, neural networks (NN) algorithms have been widely employed for modeling the normal behavior of turbine components using the monitored sensor variables (e.g., temperature or pressure) [19,23,41]. In this study, the nonlinear autoregressive neural network (NAR-NN) used in [19] is employed for comparison with ESN. Similar to ESN, the NAR-NN model also used the vibration signal at the previous time instant to predict the vibration at the current time instant t. The number of neurons in the input layer and the output layer is 1. The number of neurons in the hidden layer is experimentally determined as 100. The Levenberg–Marquardt back-propagation (LM) training algorithm is used for training the NAR-NN. The vibration prediction results for the training set using the ESN and the NAR-NN are shown in Figure 9 and Figure 10, respectively. Results show that both methods are able to correctly predict the normal gearbox vibration signals.
To quantitatively compare the performance of the ESN and the NAR-NN, two commonly used metrics, the mean absolute error (MAE) and mean square error (MSE) are calculated, which are defined below
where n is the total number of data points in the dataset, and and y are the predicted value, the actual value, respectively.
In addition, to demonstrate the advantage of ESN in computation efficiency, we also evaluate the training time for comparison. In this study, all calculations are performed with the MATLAB R2017b environment on a 64-bit windows operation system installed on a computer with an Inter Core i7-6600U CPU with 2.60 GHz.
Table 3 presents the comparative results produced by the ESN and the NAR-NN based on the training set in terms of three metrics. The results show that the ESN achieved better prediction performance with a lower value in terms of MAE and MSE metrics, suggesting a stronger learning ability than the NAR-NN model. Thus, the ESN model can better capture the normal behavior of the wind turbine gearbox vibration. Moreover, the ESN takes less training time than the NAR-NN, which means that the ESN has a simpler training process and less computational burden since only the output weights need to be updated. Such a faster training speed means a shorter development cycle of health monitoring systems and faster releases of updates, which can lower the cost of the system development, especially when a huge amount of training data (e.g., covering the time period of one year) are used. Therefore, the ESN is promising for real-time health monitoring in practical applications.
After the ESN-based vibration normal behavior model is well trained offline, the next step is to validate its effectiveness in our proposed health monitoring framework for wind turbine gearboxes. Herein, the validation set is used for this purpose. Similarly, the smoothing preprocessing steps are first performed on the validation set. Then, the preprocessed validation data are input to the trained vibration normal behavior model to obtain the validation residuals, which are shown in Figure 11. In this figure, the corresponding wind speed, generated power, gearbox vibration are also given in Figure 11a–c, respectively. Obviously, there are larger fluctuations in residual values during the time period from 8 December to 9 December, which are mainly caused by the high wind speed and the corresponding high generated power.
Next, we perform the health monitoring performance analysis based on the validation residuals. Herein, the dynamic threshold monitoring scheme described in Section 3.3 is used. To determine the dynamic threshold control limits, the window length N of the sliding window is set as 474 (corresponding to a time span of three hours) and the sample length k to update the threshold is 79 (corresponding to half an hour). As the window slides, we can update detection thresholds based on the calculation of the abnormal ratio in a fixed length () of samples. If the abnormal ratio within a window of half an hour is lower than 0.2, the residual detection threshold will be updated; otherwise, the detection threshold keeps unchanged. Herein, the traditional static threshold monitoring method is also adopted for comparison. In contrast to dynamic thresholds, the static threshold scheme uses a constant control limit with a predefined threshold value [34]. In this study, the static thresholds are calculated using Equations (6)–(8) based on the training residuals obtained from the trained normal behavior model.
Figure 12 shows the monitoring results of the validation residuals under the dynamic threshold scheme and the static threshold scheme. We can observe that the dynamic thresholds are adaptively adjusted with the changes of the residuals. Whereas, for the static threshold, the residual values during the time period from December 8 to December 9 significantly exceed the predefined static threshold, which may lead to some false alarms and unreliable detection results. False alarms may cause extra unscheduled maintenance activities and even result in the replacement of the wrong parts [42].
It can be seen that from Figure 12, if abnormal detection is performed in a point-to-point way under the static and dynamic thresholds, frequent alarms will be produced since the derived model predicted validation residuals contain much noise. To obtain more reliable results, a fixed length (corresponding to a time span of half an hour) of samples are used to calculate the abnormal ratio indicator using Equation (9) at an interval of half an hour. The results of abnormal ratio indicators under the dynamic and static thresholds are shown in Figure 13. It can be clearly found that the abnormal ratio values under the dynamic thresholds are distributed between 0 and 0.05, while the abnormal ratio values under the static thresholds present large variations above the value of 0.1 from a certain time period from 02:00 on 8 December 2013 and 12:00 on 9 December 2013, which is in accordance with results presented in Figure 12. This result indicates that the health monitoring model with the dynamic threshold monitoring scheme proposed in this paper can accurately evaluate the health conditions of the gearbox and will not produce false alarms if a proper alarm threshold (such as 0.2 or larger) is set. As a result, the traditional static monitoring method will produce false alarms at the same alarm threshold. Therefore, the proposed health monitoring model with the dynamic threshold monitoring scheme can achieve more reliable monitoring results at a preset alarm threshold.
4.2. Model Testing
In this section, the testing set containing the alarm records is further used for performance evaluation. By checking the status logs of the wind turbine SCADA system, the turbine experienced two alarms in December 2013, and the corresponding alarm records are listed in Table 4. It should be noted that the operational condition of the turbine is monitored mainly based on simple limit sensing in the SCADA system, which manually determines thresholds for each monitored sensor variable, including the gearbox vibration signal studied in this paper. For this reason, the SCADA system will also produce some false alarms due to inaccurate threshold settings. This suggests that an issued alarm of a wind turbine does not mean that a fault event has occurred. Although two gearbox alarm events were identified by the SCADA system in December, no report of malfunction maintenance was found in the maintenance records in December and the following months. This means that the two recorded alarms listed Table 4 are false, which have also been confirmed with the operators and the experts in the wind farm. In the following study, we will test the performance of our proposed health monitoring model.
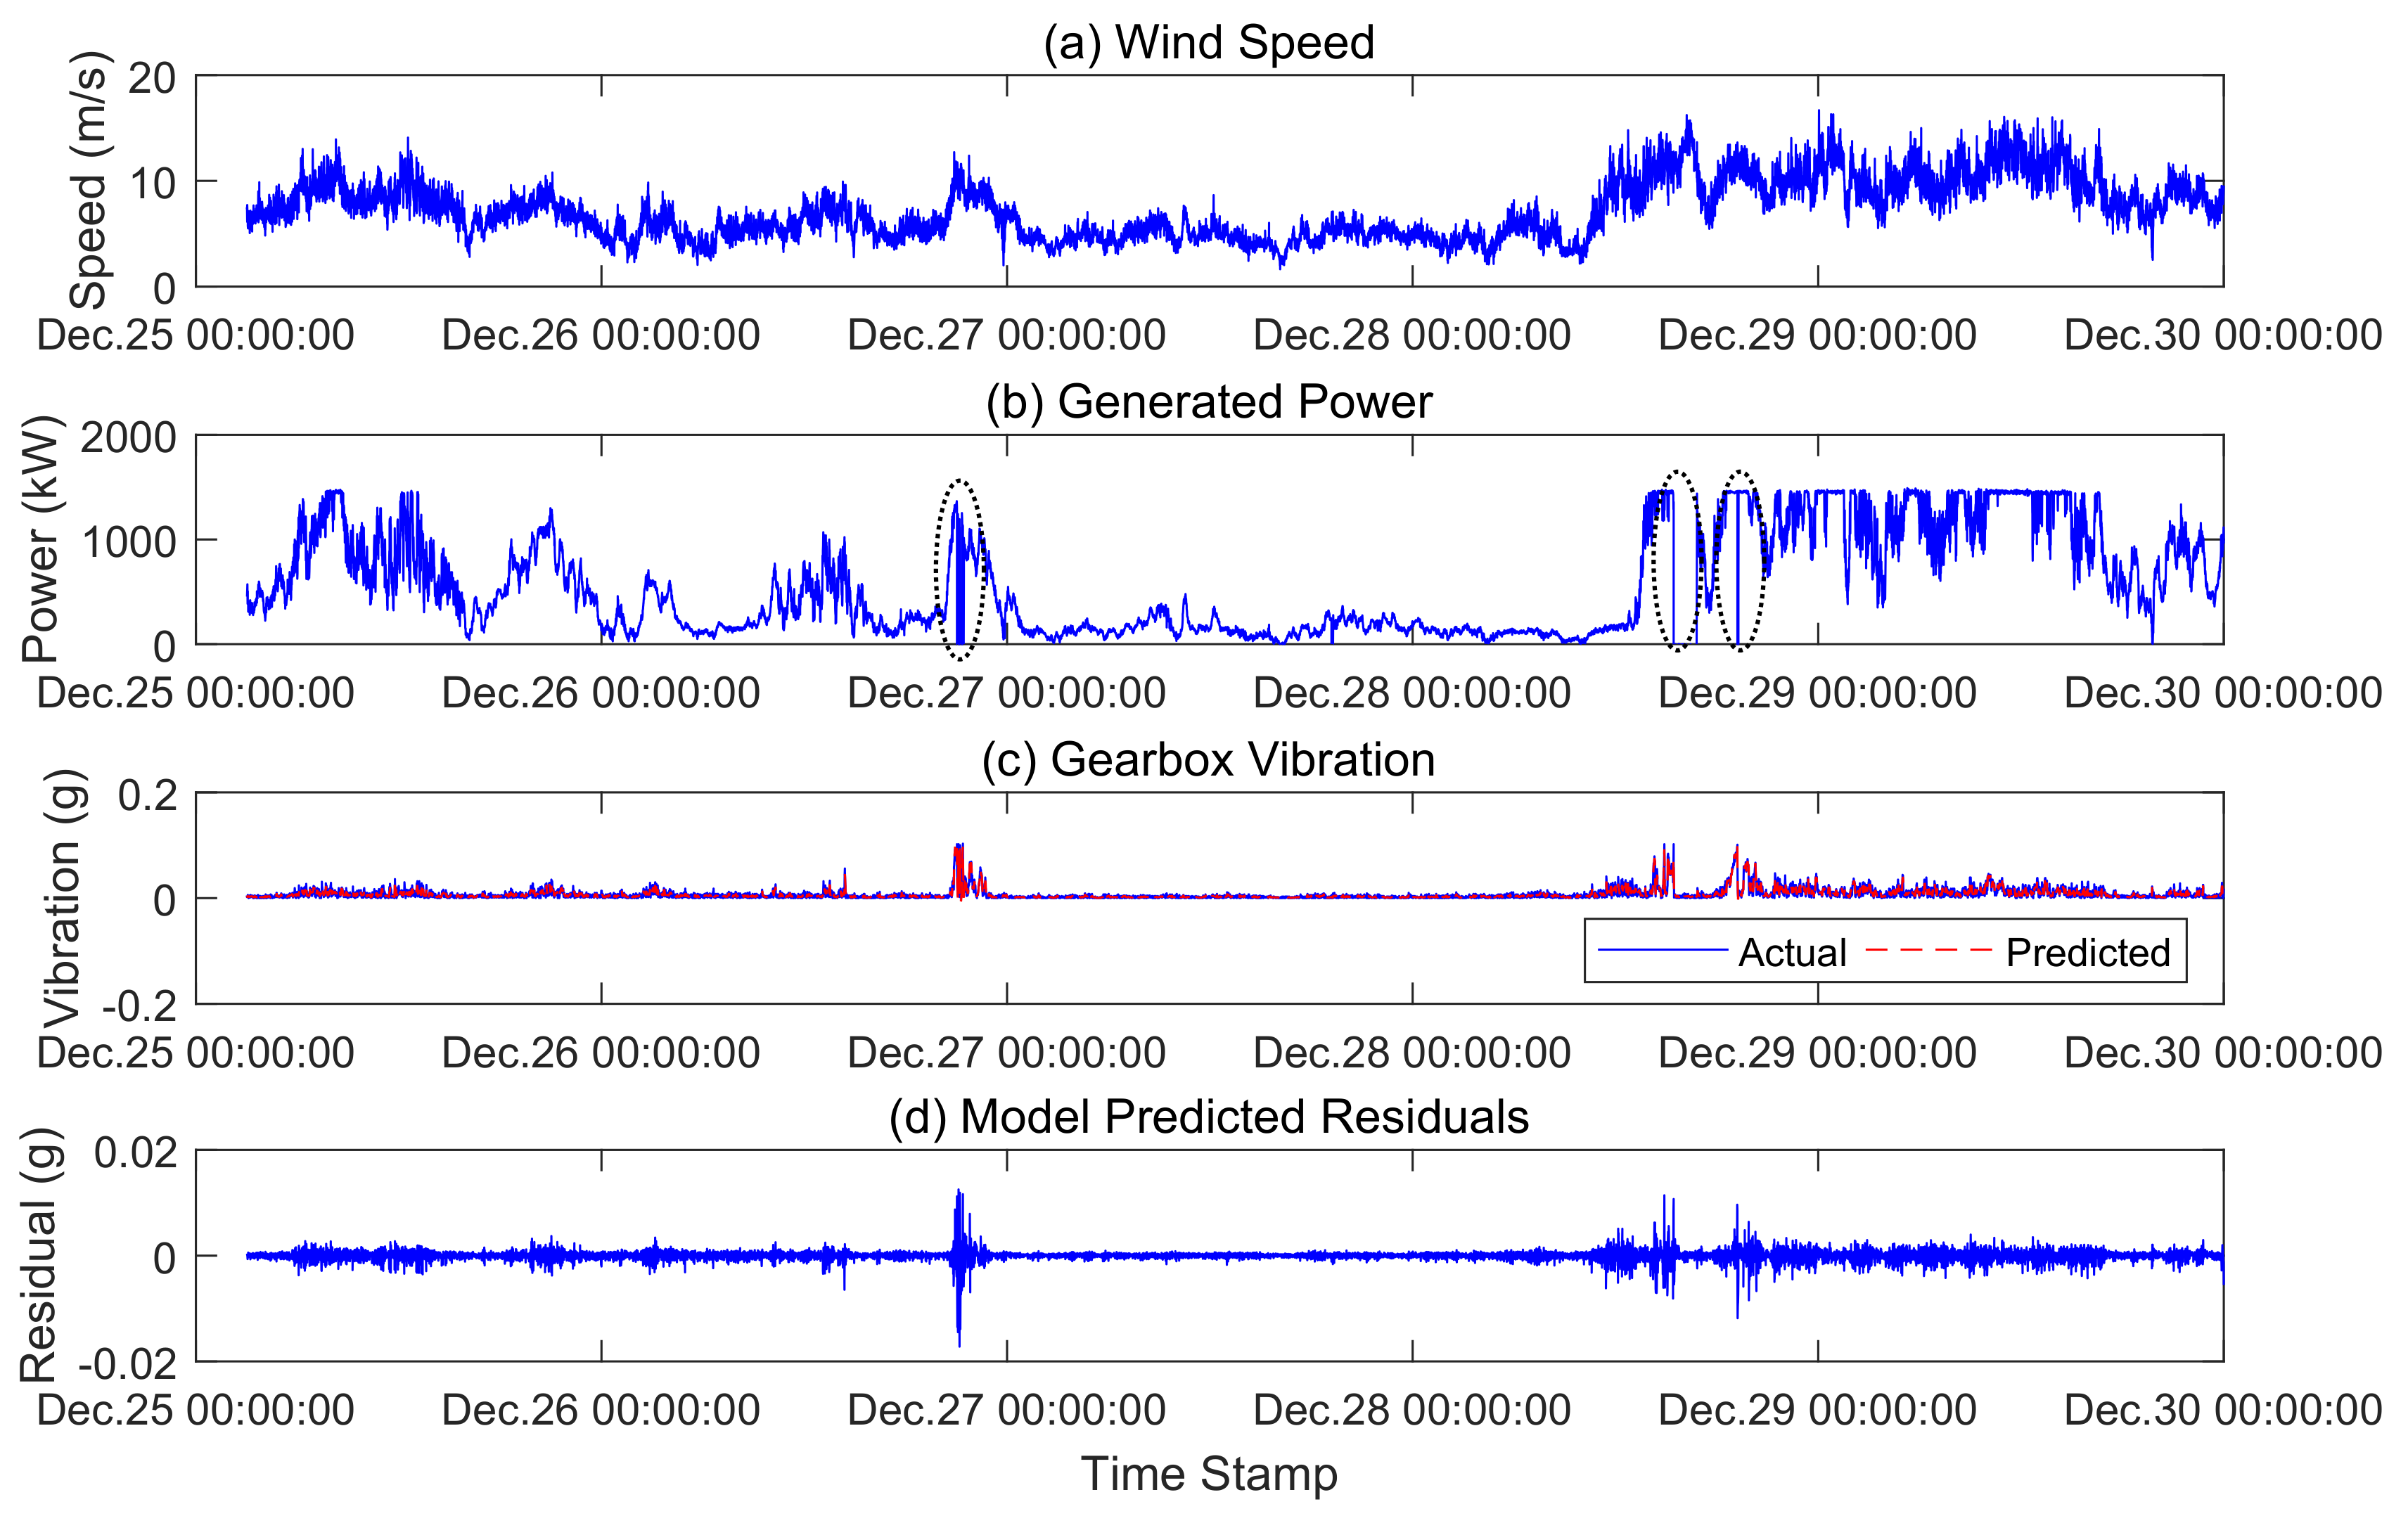
Figure 14 shows the testing residuals obtained from the trained vibration normal behavior model, and the corresponding wind speed, generated power, gearbox vibration are also given in Figure 14a–c, respectively. It can be seen that there are several shutdowns and starups of the turbine, corresponding to the zero power value shown in Figure 14b. These sudden shutdown and startup events will cause the significant fluctuation of the measured vibration signal and therefore the predicated residuals will also present large variations.
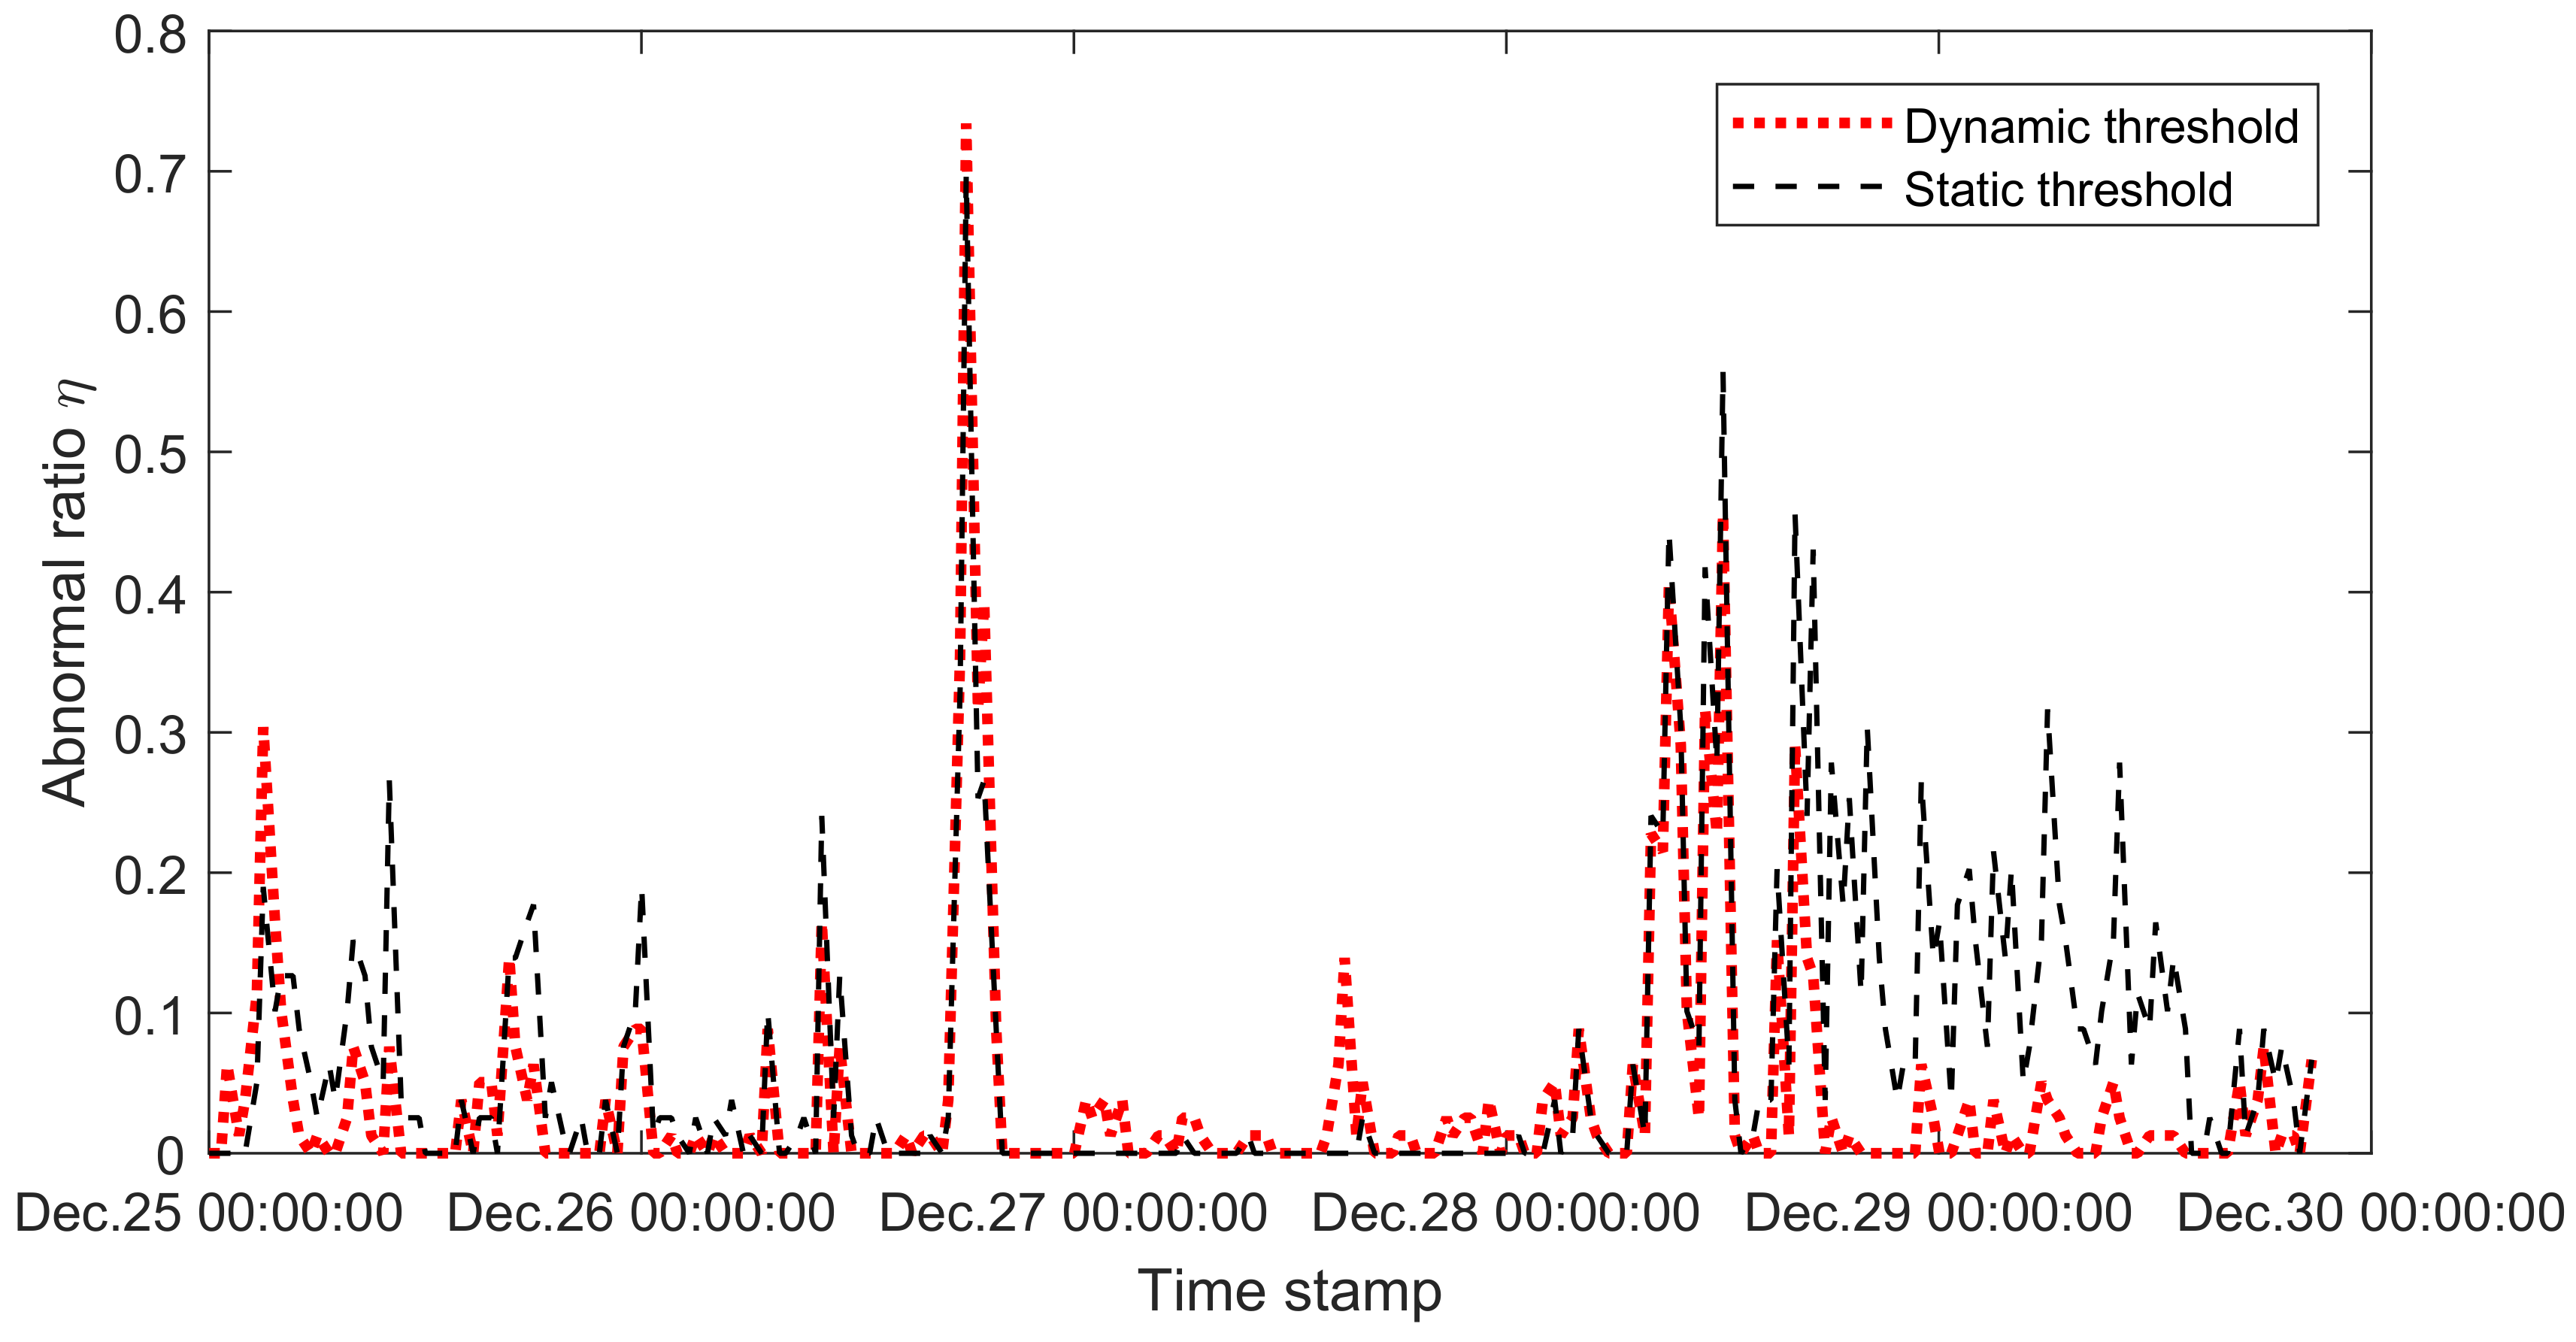
We calculate the dynamic thresholds and static thresholds to monitor the changes of the testing residuals and the corresponding the abnormal ratio indicators, and the results are given in Figure 15 and Figure 16, respectively. The similar results can be seen that from Figure 15 the dynamic thresholds can better track the changes of the testing residuals despite that several abnormal points are identified when the residuals exceed the dynamic control limits. For the static thresholds, a large number of abnormal points are identified, which will lead to frequent false alarms. We can further observe from Figure 16 that for both threshold monitoring schemes there are several abnormal ratio values above 0.4 at several time moments, thus the fault alarm signals of the gearbox will be issued when the alarm threshold is set as 0.4. Compared with the fault alarm information recorded in the SCADA system described in Table 4, the first alarm duration from 26 December to 28 December 2013 was 154,724 s. The alarm duration refers to the time range from the alarm start time 21:47:38 on December 26, 2013 to the alarm end time 16:46:22 on 28 December 2013 described in Table 4. This means that the SCADA system will continue to give alarm signals in this time period. In contrast, our proposed monitoring method will trigger alarms only at the time moments when the abnormal ratio values are greater than the predefined alarm threshold. This will largely reduce the duration of false alarms and provide a more reliable monitoring result. Moreover, comparing the result difference between the threshold monitoring schemes, the dynamic thresholds will produce a fewer number of false alarms, which further demonstrates the superiority of the proposed dynamic threshold monitoring scheme.
5. Conclusions
A reliable health monitoring model for the wind turbine gearbox using SCADA vibration data has been developed in this paper based on the ESN modeling and the dynamic threshold monitoring scheme. In the proposed monitoring framework, ESN can well capture nonlinear temporal dynamics inherent in the vibration time series data and is used to build the vibration normal behavior model of the underlying wind turbine gearbox, only relying on normal monitoring SCADA data. A dynamic threshold monitoring scheme with the sliding window is designed to overcome the shortcomings of the traditional static monitoring methods to improve the reliability and accuracy of fault detection. The proposed dynamic monitoring model has been verified using the gearbox vibration data from a wind turbine in a real wind farm. In the model development phase, the comparative results between the ESN and the NAR-NN show that the ESN has better model learning and prediction ability and higher training computation efficiency. A higher training speed means a shorter development cycle of health monitoring systems and faster releases of updates, thus lowering the cost of the system development. This also suggested that the ESN will be promising for real-time health monitoring in practical applications. Compared with the traditional static threshold monitoring scheme, the proposed monitoring framework can more accurately monitor the changes of vibration residuals with no or fewer false alarms in the validation phase and the testing phase. Moreover, in the testing phase, the proposed dynamic health monitoring model performed better than that of the wind turbine SCADA system, which presents more reliable and accurate monitoring results in accordance with the practical cases. A reliable monitoring result is of great importance for operators in wind farms in circumstances to timely take the right actions to reduce the downtime of the turbine.
It should be noted that this study focuses on modeling and prediction of the vibration signal itself, without considering the effects of the external conditions, such as wind speed and wind direction on model performance. In our future work, we will take the wind speed and other relevant sensor variables as model input to enhance the model performance.
Author Contributions
X.W., H.W. and G.J. carried out most of the work presented here; P.X. and X.L. supervised the proposed research, revised the contents and reviewed the manuscript. All authors have approved the submitted manuscript.
Acknowledgments
This research was supported by the Natural Science Foundation of China (Grant No. 61803329), the Natural Science Foundation of Hebei Province of China (Grant No. F2018203413 and F2016203421), China, the China Postdoctoral Science Foundation (Grant No. 2018M640247), the Key Research and Development Program of Qinhuangdao (201805A005), and the Doctoral Foundation of Yanshan University (Grant No. BL18040).
Conflicts of Interest
The authors declare no conflict of interest.
References
- Tchakoua, P.; Wamkeue, R.; Ouhrouche, M.; Slaoui-Hasnaoui, F.; Tameghe, T.A.; Ekemb, G. Wind turbine condition monitoring: State-of-the-art review, new trends, and future challenges. Energies 2014, 7, 2595–2630. [Google Scholar] [CrossRef]
- Fitzgerald, B.; Basu, B. A monitoring system for wind turbines subjected to combined seismic and turbulent aerodynamic loads. Struct. Monit. Maint. 2017, 4, 175–194. [Google Scholar]
- Liu, W.; Tang, B.; Han, J.; Lu, X.; Hu, N.; He, Z. The structure healthy condition monitoring and fault diagnosis methods in wind turbines: A review. Renew. Sustain. Energy Rev. 2015, 44, 466–472. [Google Scholar] [CrossRef]
- Qiao, W.; Lu, D. A Survey on Wind Turbine Condition Monitoring and Fault Diagnosis—Part I: Components and Subsystems. IEEE Trans. Ind. Electron. 2015, 62, 6536–6545. [Google Scholar] [CrossRef]
- Feng, Y.; Qiu, Y.; Crabtree, C.J.; Long, H.; Tavner, P.J. Monitoring wind turbine gearboxes. Wind Energy 2013, 16, 728–740. [Google Scholar] [CrossRef]
- Hossain, M.L.; Abu-Siada, A.; Muyeen, S. Methods for Advanced Wind Turbine Condition Monitoring and Early Diagnosis: A Literature Review. Energies 2018, 11, 1309. [Google Scholar] [CrossRef]
- Jiang, G.; He, H.; Xie, P.; Tang, Y. Stacked multilevel-denoising autoencoders: A new representation learning approach for wind turbine gearbox fault diagnosis. IEEE Trans. Instrum. Meas. 2017, 66, 2391–2402. [Google Scholar] [CrossRef]
- Teng, W.; Zhang, X.; Liu, Y.; Kusiak, A.; Ma, Z. Prognosis of the remaining useful life of bearings in a wind turbine gearbox. Energies 2016, 10, 32. [Google Scholar] [CrossRef]
- Igba, J.; Alemzadeh, K.; Durugbo, C.; Eiriksson, E.T. Analysing RMS and peak values of vibration signals for condition monitoring of wind turbine gearboxes. Renew. Energy 2016, 91, 90–106. [Google Scholar] [CrossRef] [Green Version]
- Coronado, D.; Wenske, J. Monitoring the Oil of Wind-Turbine Gearboxes: Main Degradation Indicators and Detection Methods. Machines 2018, 6, 25. [Google Scholar] [CrossRef]
- Gómez Muñoz, C.Q.; García Márquez, F.P. A new fault location approach for acoustic emission techniques in wind turbines. Energies 2016, 9, 40. [Google Scholar] [CrossRef]
- Zhang, Y.; Lu, W.; Chu, F. Planet gear fault localization for wind turbine gearbox using acoustic emission signals. Renew. Energy 2017, 109, 449–460. [Google Scholar] [CrossRef]
- Lu, D.; Qiao, W.; Gong, X. Current-based gear fault detection for wind turbine gearboxes. IEEE Trans. Sustain. Energy 2017, 8, 1453–1462. [Google Scholar] [CrossRef]
- Kusiak, A.; Li, W. The prediction and diagnosis of wind turbine faults. Renew. Energy 2011, 36, 16–23. [Google Scholar] [CrossRef]
- Yang, W.; Court, R.; Jiang, J. Wind turbine condition monitoring by the approach of SCADA data analysis. Renew. Energy 2013, 53, 365–376. [Google Scholar] [CrossRef]
- Guo, P.; Infield, D.; Yang, X. Wind Turbine Generator Condition-Monitoring Using Temperature Trend Analysis. IEEE Trans. Sustain. Energy 2012, 3, 124–133. [Google Scholar] [CrossRef]
- Guo, P.; Bai, N. Wind turbine gearbox condition monitoring with AAKR and moving window statistic methods. Energies 2011, 4, 2077–2093. [Google Scholar] [CrossRef]
- Yang, H.H.; Huang, M.L.; Yang, S.W. Integrating Auto-Associative Neural Networks with Hotelling T2 Control Charts for Wind Turbine Fault Detection. Energies 2015, 8, 12100–12115. [Google Scholar] [CrossRef] [Green Version]
- Bangalore, P.; Tjernberg, L.B. An Artificial Neural Network Approach for Early Fault Detection of Gearbox Bearings. IEEE Trans. Smart Grid 2015, 6, 980–987. [Google Scholar] [CrossRef]
- Bangalore, P.; Letzgus, S.; Karlsson, D.; Patriksson, M. An artificial neural network-based condition monitoring method for wind turbines, with application to the monitoring of the gearbox. Wind Energy 2017, 20, 1421–1438. [Google Scholar] [CrossRef]
- Vidal, Y.; Pozo, F.; Tutivén, C. Wind Turbine Multi-Fault Detection and Classification Based on SCADA Data. Energies 2018, 11, 3018. [Google Scholar] [CrossRef]
- Yang, C.; Liu, J.; Zeng, Y.; Xie, G. Real-time condition monitoring and fault detection of components based on machine-learning reconstruction model. Renew. Energy 2019, 133, 433–441. [Google Scholar] [CrossRef]
- Wang, L.; Zhang, Z.; Long, H.; Xu, J.; Liu, R. Wind turbine gearbox failure identification with deep neural networks. IEEE Trans. Ind. Inform. 2017, 13, 1360–1368. [Google Scholar] [CrossRef]
- Jiang, G.; Xie, P.; He, H.; Yan, J. Wind turbine fault detection using a denoising autoencoder with temporal information. IEEE/ASME Trans. Mechatron. 2018, 23, 89–100. [Google Scholar] [CrossRef]
- Jaeger, H. The “echo state” Approach to Analysing and Training Recurrent Neural Networks-with an Erratum Note; Technical Report; German National Research Center for Information Technology (GMD): Bonn, Germany, 2001; Volume 148, p. 13. [Google Scholar]
- Jaeger, H.; Haas, H. Harnessing nonlinearity: Predicting chaotic systems and saving energy in wireless communication. Science 2004, 304, 78–80. [Google Scholar] [CrossRef]
- Wang, L.; Hu, H.; Ai, X.Y.; Liu, H. Effective electricity energy consumption forecasting using echo state network improved by differential evolution algorithm. Energy 2018, 153, 801–815. [Google Scholar] [CrossRef]
- Liu, D.; Wang, J.; Wang, H. Short-term wind speed forecasting based on spectral clustering and optimised echo state networks. Renew. Energy 2015, 78, 599–608. [Google Scholar] [CrossRef]
- López, E.; Valle, C.; Allende, H.; Gil, E.; Madsen, H. Wind Power Forecasting Based on Echo State Networks and Long Short-Term Memory. Energies 2018, 11, 526. [Google Scholar] [CrossRef]
- Badoni, M.; Singh, B.; Singh, A. Implementation of echo-state network-based control for power quality improvement. IEEE Trans. Ind. Electron. 2017, 64, 5576–5584. [Google Scholar] [CrossRef]
- Lapira, E.; Brisset, D.; Ardakani, H.D.; Siegel, D.; Lee, J. Wind turbine performance assessment using multi-regime modeling approach. Renew. Energy 2012, 45, 86–95. [Google Scholar] [CrossRef]
- Guo, P.; Infield, D. Wind turbine tower vibration modeling and monitoring by the nonlinear state estimation technique (NSET). Energies 2012, 5, 5279–5293. [Google Scholar] [CrossRef]
- Kusiak, A.; Verma, A. Analyzing bearing faults in wind turbines: A data-mining approach. Renew. Energy 2012, 48, 110–116. [Google Scholar] [CrossRef]
- Schlechtingen, M.; Santos, I.F.; Achiche, S. Wind turbine condition monitoring based on SCADA data using normal behavior models. Part 1: System description. Appl. Soft Comput. 2013, 13, 259–270. [Google Scholar] [CrossRef]
- Agarwal, D.; Kishor, N. A fuzzy inference-based fault detection scheme using adaptive thresholds for health monitoring of offshore wind-farms. IEEE Sens. J. 2014, 14, 3851–3861. [Google Scholar] [CrossRef]
- Antoniadou, I.; Worden, K. Use of a spatially adaptive thresholding method for the condition monitoring of a wind turbine gearbox. In Proceedings of the EWSHM-7th European Workshop on Structural Health Monitoring, Nantes, France, 8–11 July 2014. [Google Scholar]
- Artigao, E.; Martín-Martínez, S.; Honrubia-Escribano, A.; Gómez-Lázaro, E. Wind turbine reliability: A comprehensive review towards effective condition monitoring development. Appl. Energy 2018, 228, 1569–1583. [Google Scholar] [CrossRef]
- Xue, L.; Li, N.; Lei, Y.; Li, N. Incipient fault detection for rolling element bearings under varying speed conditions. Materials 2017, 10, 675. [Google Scholar] [CrossRef]
- Odgaard, P.F.; Stoustrup, J.; Kinnaert, M. Fault-tolerant control of wind turbines: A benchmark model. IEEE Trans. Control Syst. Technol. 2013, 21, 1168–1182. [Google Scholar] [CrossRef]
- Badihi, H.; Zhang, Y.; Hong, H. Wind turbine fault diagnosis and fault-tolerant torque load control against actuator faults. IEEE Trans. Control Syst. Technol. 2015, 23, 1351–1372. [Google Scholar] [CrossRef]
- Schlechtingen, M.; Santos, I.F. Comparative analysis of neural network and regression based condition monitoring approaches for wind turbine fault detection. Mech. Syst. Signal Process. 2011, 25, 1849–1875. [Google Scholar] [CrossRef] [Green Version]
- Hyers, R.; McGowan, J.; Sullivan, K.; Manwell, J.; Syrett, B. Condition monitoring and prognosis of utility scale wind turbines. Energy Mater. 2006, 1, 187–203. [Google Scholar] [CrossRef]
Figure 1.
Wind turbine gearbox vibration monitoring with SCADA systems.

Figure 2.
Wind turbine gearbox vibration signals from (a) X direction (b) Y direction.

Figure 3.
Flowchart of the proposed gearbox vibration monitoring framework.

Figure 4.
ESN architecture.

Figure 5.
An example of gearbox vibration and its residuals along with the corresponding operational parameters, wind speed and generated power.
Figure 5.
An example of gearbox vibration and its residuals along with the corresponding operational parameters, wind speed and generated power.

Figure 6.
An illustration of the sliding window used for dynamic monitoring.

Figure 7.
Operational zones of a wind turbine depending on the wind speed [39].
Figure 7.
Operational zones of a wind turbine depending on the wind speed [39].

Figure 8.
Power curve of the training set.

Figure 9.
ESN training results for gearbox vibration data.

Figure 10.
NAR-NN training results for gearbox vibration data.
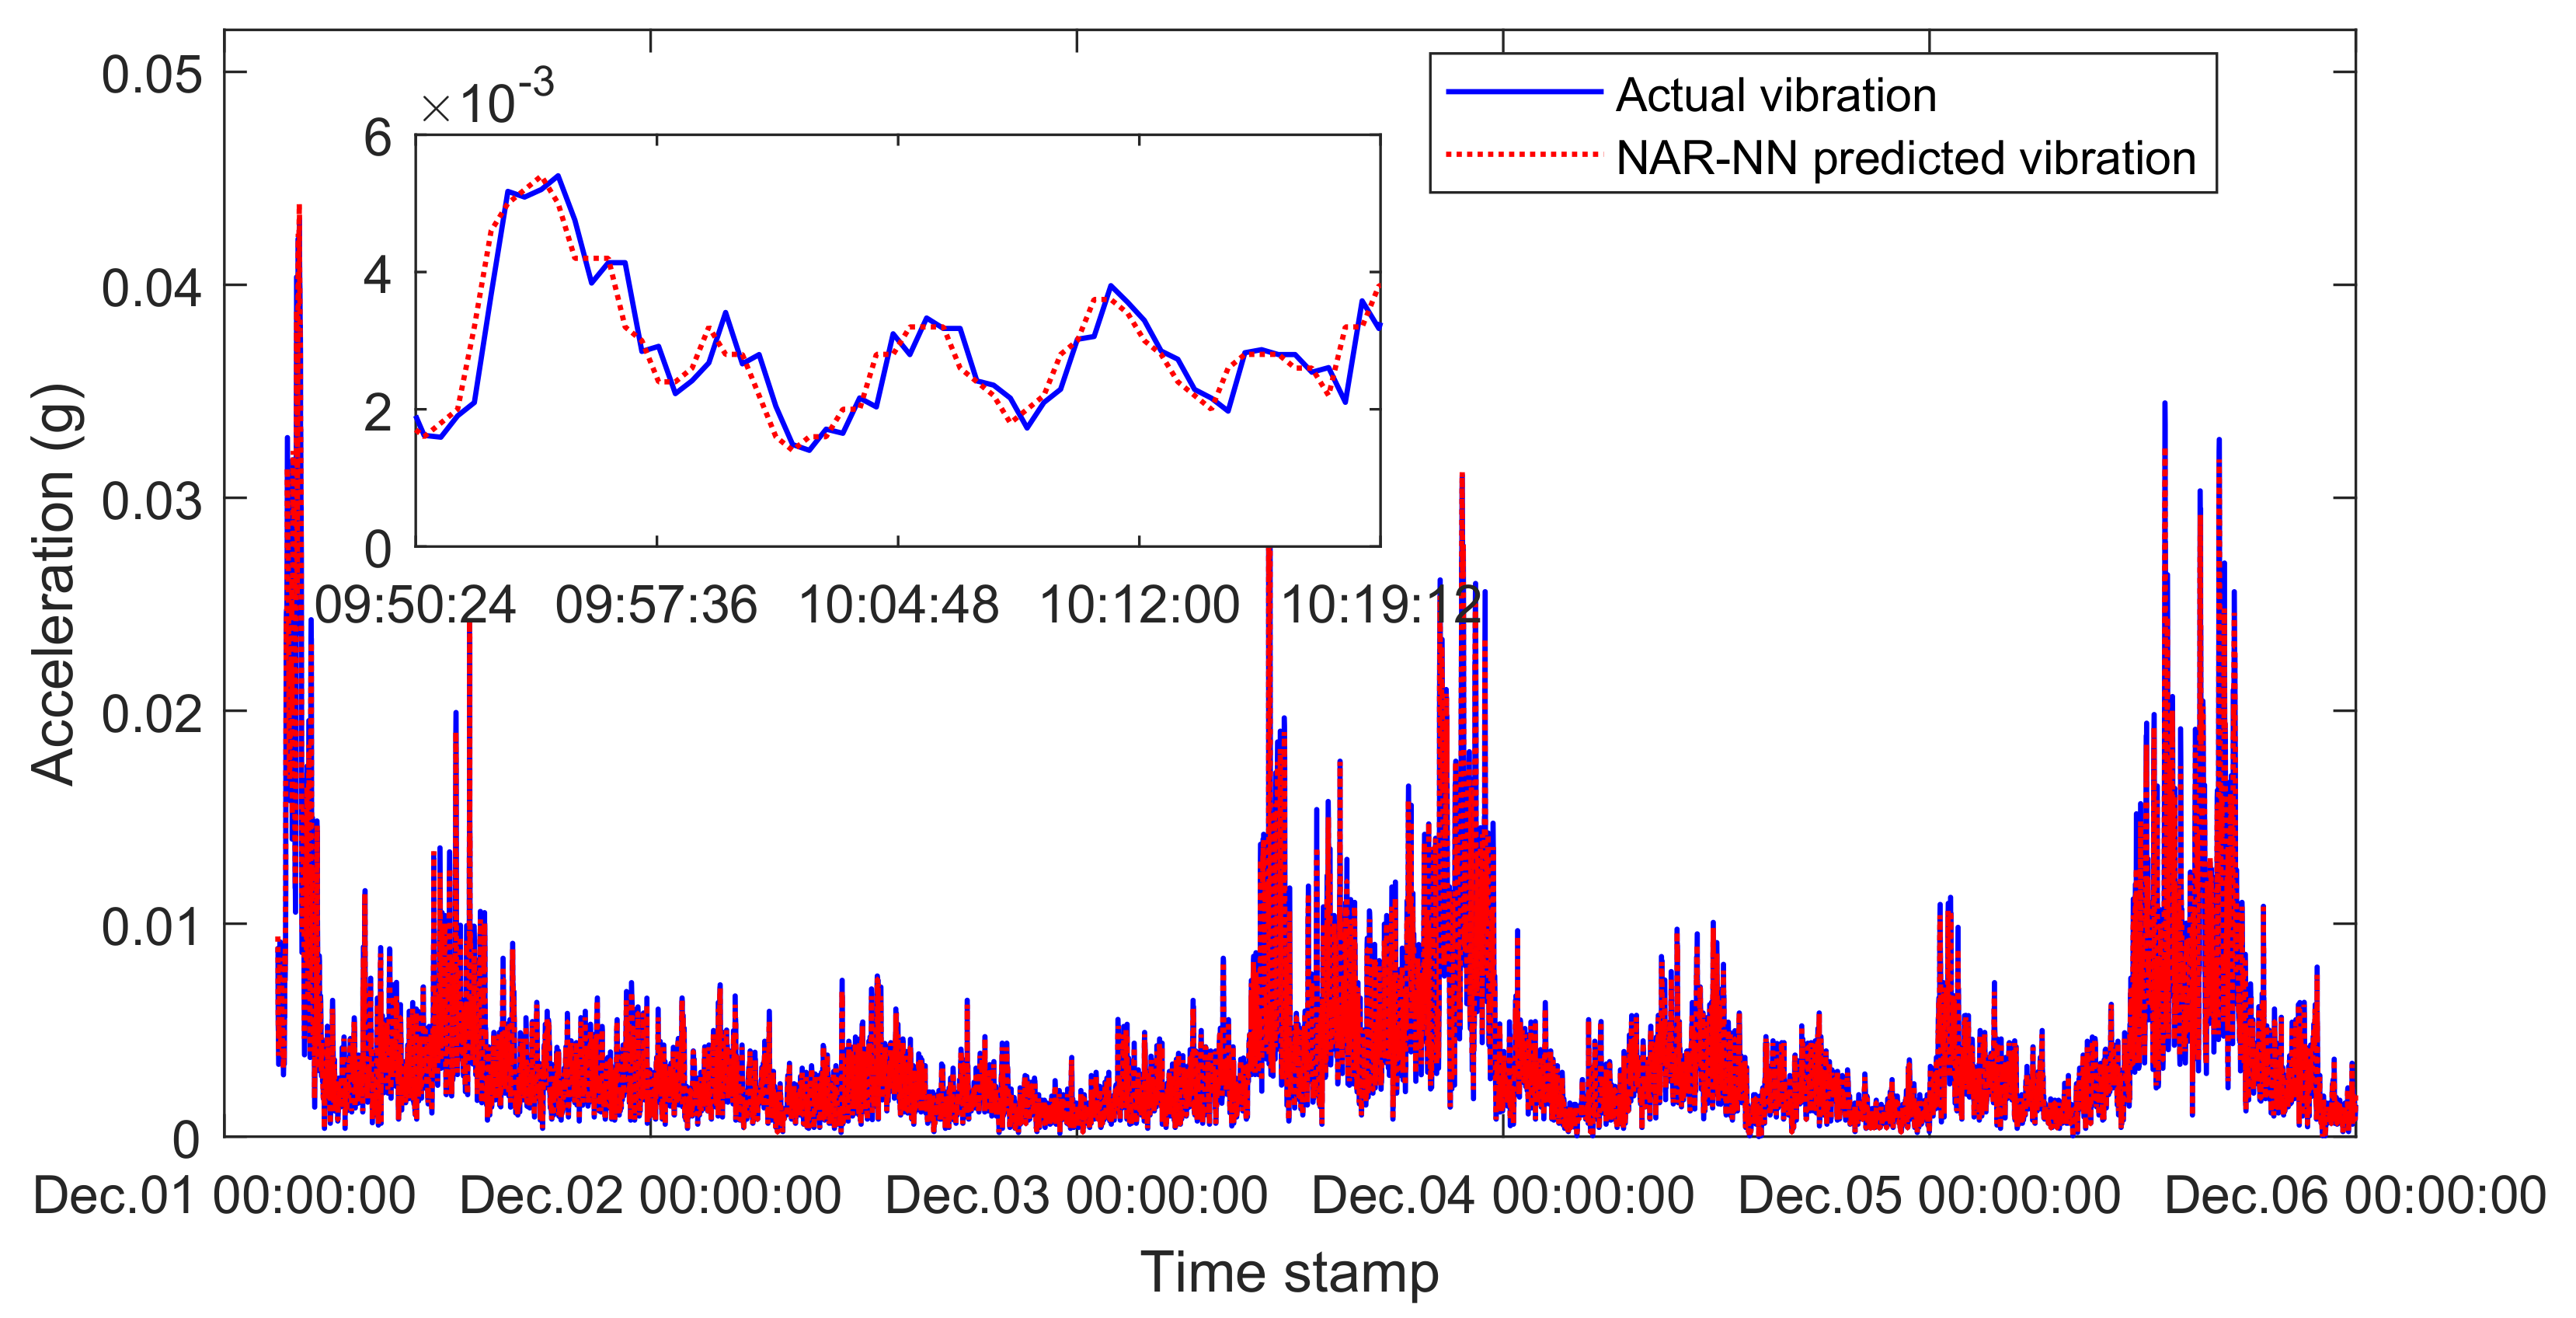
Figure 11.
Residuals of the validation set and its corresponding wind speed, active power and gearbox vibration.
Figure 11.
Residuals of the validation set and its corresponding wind speed, active power and gearbox vibration.

Figure 12.
Monitoring results of the validation residuals under the dynamic threshold scheme and the static threshold scheme.
Figure 12.
Monitoring results of the validation residuals under the dynamic threshold scheme and the static threshold scheme.
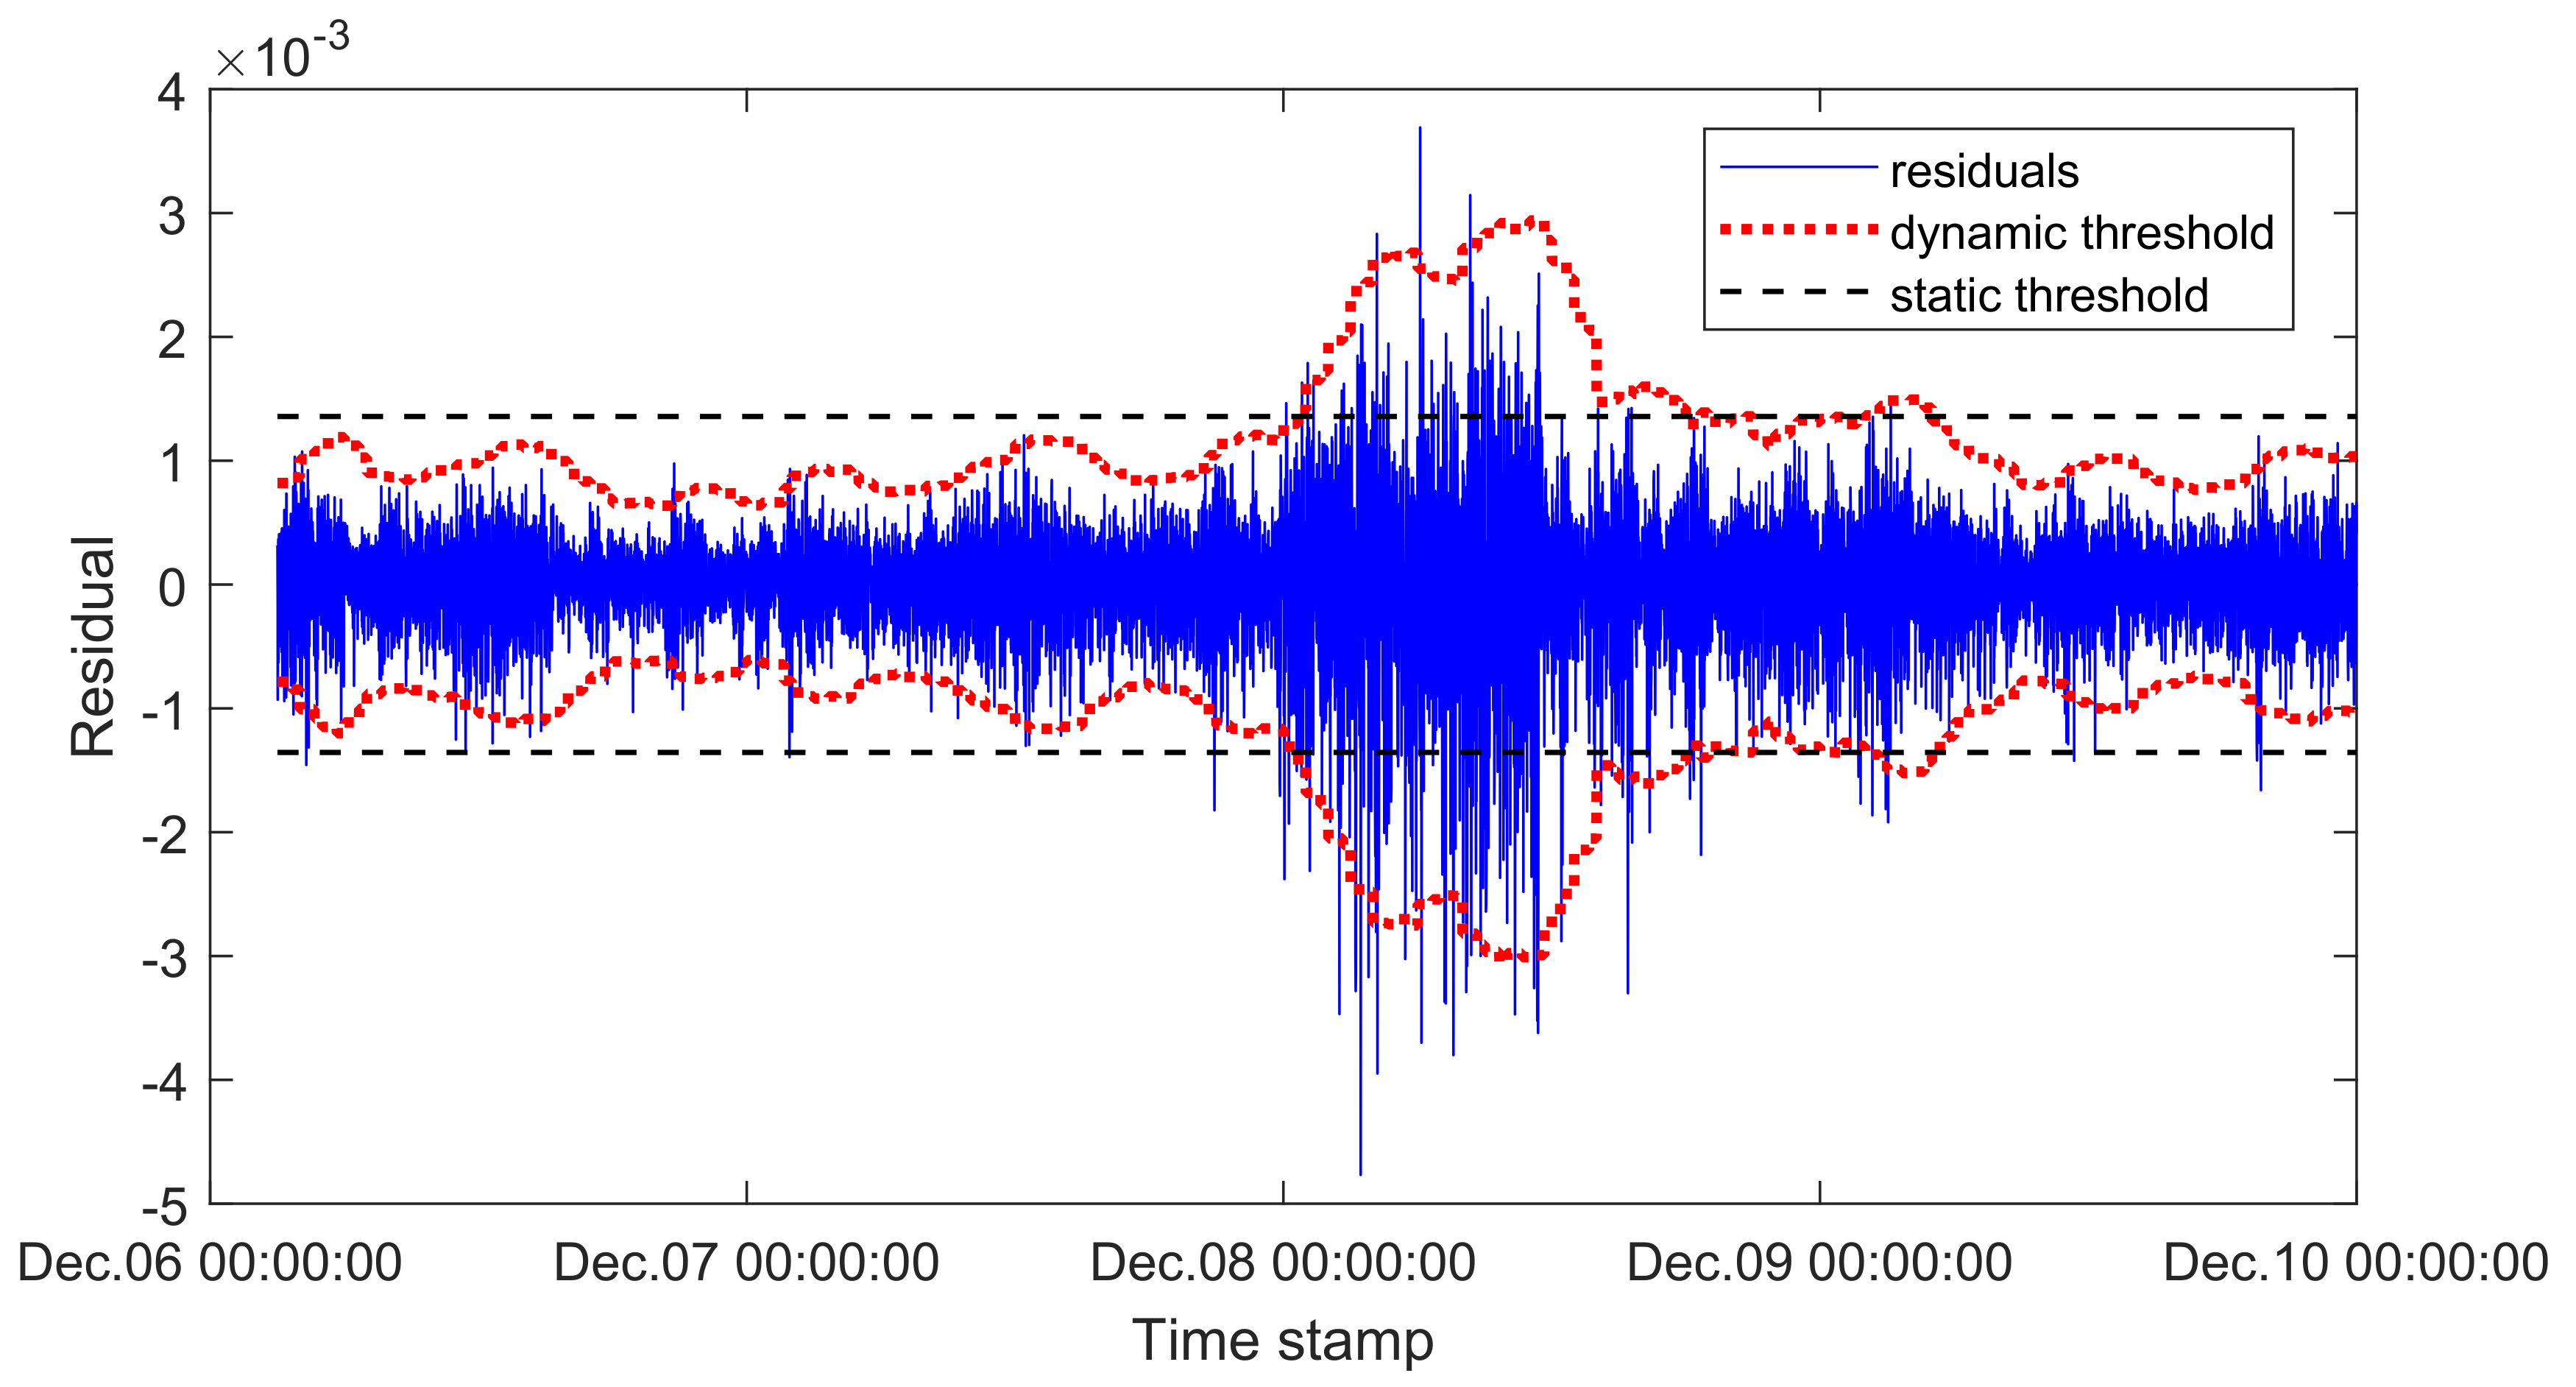
Figure 13.
Comparative results of abnormal ratio results of the validation residuals under dynamic thresholds and static thresholds.
Figure 13.
Comparative results of abnormal ratio results of the validation residuals under dynamic thresholds and static thresholds.

Figure 14.
Residuals of the validation set and its corresponding wind speed, active power and gearbox vibration.
Figure 14.
Residuals of the validation set and its corresponding wind speed, active power and gearbox vibration.

Figure 15.
Comparative motoring results for testing residuals under dynamic thresholds and static thresholds.
Figure 15.
Comparative motoring results for testing residuals under dynamic thresholds and static thresholds.
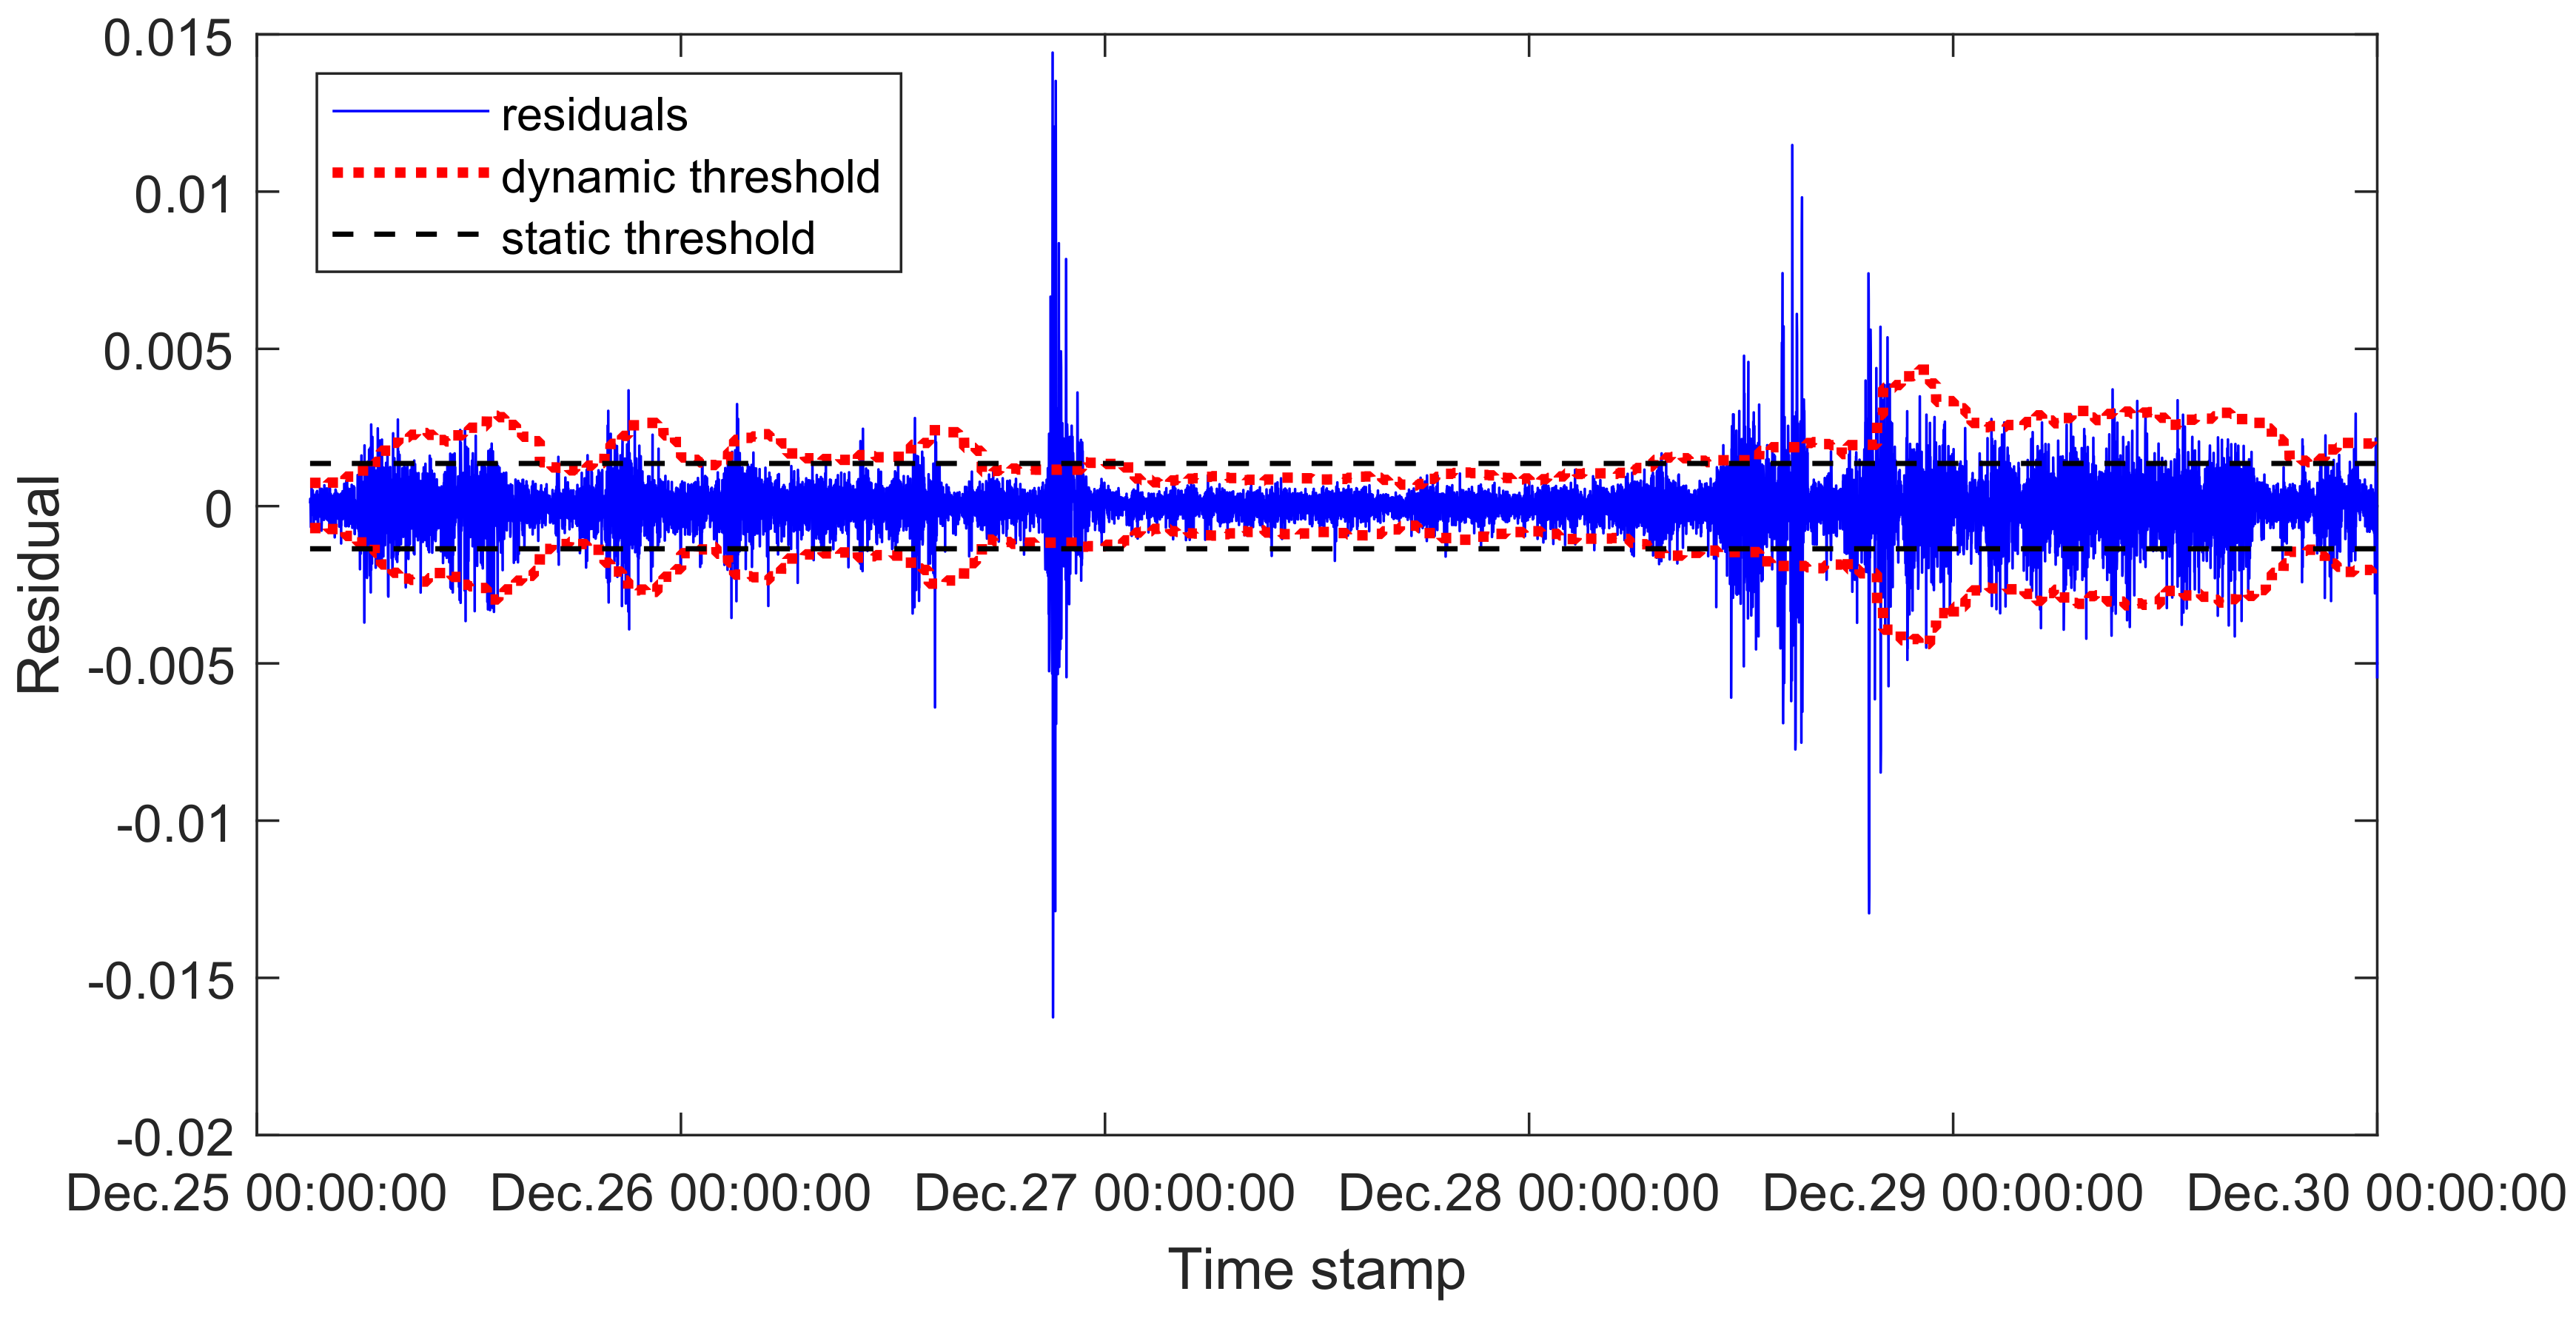
Figure 16.
Comparative results of abnormal ratio curves for the testing residuals under dynamic thresholds and static thresholds.
Figure 16.
Comparative results of abnormal ratio curves for the testing residuals under dynamic thresholds and static thresholds.


Table 1.
Dataset description.
| Dataset | Start Time Stamp | End Time Stamp | Number of Data Points |
|---|---|---|---|
| Training | 1 December 2013 00:00:08 | 5 December 2013 23:59:40 | 18,955 |
| Validation | 6 December 2013 00:00:10 | 9 December 2013 23:59:43 | 15,165 |
| Testing | 25 December 2013 00:00:24 | 29 December 2013 23:59:55 | 18,957 |
Table 2.
Parameter Settings of the Dynamic Reservoir of ESN.
| Reservoir Scale | Spectral Radius | Sparse Degree | Inputting Scale |
|---|---|---|---|
| 0.9 | 0.01 | 0.01 |
Table 3.
Comparison results between ESN and NAR-NN.
| Methods | MAE | MSE | Training Time (s) |
|---|---|---|---|
| ESN | 2.1688 | ||
| NAR-NN | 5.1632 |
Table 4.
Vibration alarm records in the SCADA system in December, 2013.
| No. | Alarm Start Time | Alarm End Time | Duration (s) | Status Description |
|---|---|---|---|---|
| 1 | 26 December 2013 21:47:38 | 28 December 2013 16:46:22 | 154,721 | Vibration sensor alarm at X direction |
| 2 | 28 December 2013 19:42:14 | 2 January 2014 08:22:39 | 391,215 | Vibration sensor alarm at X direction |
© 2019 by the authors. Licensee MDPI, Basel, Switzerland. This article is an open access article distributed under the terms and conditions of the Creative Commons Attribution (CC BY) license (http://creativecommons.org/licenses/by/4.0/).
Share and Cite
MDPI and ACS Style
Wu, X.; Wang, H.; Jiang, G.; Xie, P.; Li, X. Monitoring Wind Turbine Gearbox with Echo State Network Modeling and Dynamic Threshold Using SCADA Vibration Data. Energies 2019, 12, 982. https://doi.org/10.3390/en12060982
AMA Style
Wu X, Wang H, Jiang G, Xie P, Li X. Monitoring Wind Turbine Gearbox with Echo State Network Modeling and Dynamic Threshold Using SCADA Vibration Data. Energies. 2019; 12(6):982. https://doi.org/10.3390/en12060982
Chicago/Turabian StyleWu, Xin, Hong Wang, Guoqian Jiang, Ping Xie, and Xiaoli Li. 2019. "Monitoring Wind Turbine Gearbox with Echo State Network Modeling and Dynamic Threshold Using SCADA Vibration Data" Energies 12, no. 6: 982. https://doi.org/10.3390/en12060982
Note that from the first issue of 2016, this journal uses article numbers instead of page numbers. See further details here.