Study of the Effects of Biofuel-Oxygen of Various Origins on a CRDI Diesel Engine Combustion and Emissions


Power and Transport Machinery Engineering Institute, Vytautas Magnus University, Student Str. 15, P.O. Box LT-53362, Kaunas Academy, 53362 Kaunas, Lithuania
*
Author to whom correspondence should be addressed.
Energies 2019, 12(7), 1241; https://doi.org/10.3390/en12071241
Submission received: 11 March 2019
/
Revised: 22 March 2019
/
Accepted: 26 March 2019
/
Published: 1 April 2019
(This article belongs to the Special Issue Recent Technologies on Using Biofuels in I.C. Engines for Improved Combustion and Emissions Mitigation)
Abstract
:The paper presents the effects made by a fossil diesel–HRD (Hydrotreated Renewable Diesel) fuel blend containing Ethanol (E) or Biodiesel (B) on the combustion process, Indicated Thermal Efficiency (ITE), smoke, and pollutant emissions when running a turbocharged Common Rail Direct Injection (CRDI) engine under medium (50% of full load), intermediate (80% of full load), and full (100%) loads at maximum torque speed of 2000 rpm. These loads correspond to the respective Indicated Mean Effective Pressures (IMEP) of 0.75, 1.20, and 1.50 MPa, developed for the most common operation of a Diesel engine. The fuel-oxygen mass content was identically increased within the same range of 0 (E0/B0), 0.91 (E1/B1), 1.81 (E2/B2), 2.71 (E3/B3), 3.61 (E4/B4), and 4.52 wt% (E5/B5) in both E and B fuel groups. Nevertheless, these fuels still possessed the same blended cetane number value of 55.5 to extract as many scientific facts as possible about the widely differing effects caused by ethanol or biodiesel properties on the operational parameters of an engine. Both quantitative and qualitative analyses of the effects made by the combustion of the newly designed fuels with the same fuel-oxygen mass contents of various origins on the engine operational parameters were conducted comparing data between themselves and with the respective values measured with the reference (‘baseline’), oxygen-free fuel blend E0/B0 and a straight diesel to reveal the existing developing trends. The study results showed the positive influence of fuel-oxygen on the combustion process, but the fuel oxygen enrichment rate should be neither too high nor too low, but just enough to achieve complete diffusion burning and low emissions. The Maximum Heat Release Rate (HRRmax) was 3.2% (E4) or 3.6% (B3) higher and the peak in-cylinder pressure was 4.3% (E3) or 1.1% (B5) higher than the respective values the combustion of the reference fuel E0/B0 develops under full load operation. Due to the fuel-oxygen, the combustion process ended by 7.3° (E4) or 1.5° crank angle degrees (CADs) (B4) earlier in an engine cycle, the COV of IMEP decreased to as low as 1.25%, the engine efficiency (ITE) increased by 3.1% (E4) or decreased by 2.7% (B3), while NOx emissions were 21.1% (E3) or 7.3% (B4) higher for both oxygenated fuels. Smoke and CO emissions took advantage of fuel-oxygen to be 2.9 times (E4) or 32.0% (B4) lower and 4.0 (E3) or 1.8 times (B5) lower, respectively, while THC emissions were 1.5 times (E4) lower or, on the contrary, 7.7% (B4) higher than the respective values the combustion of the fuel E0/B0 produces under full load operation. It was found that the fuel composition related properties greatly affect the end of combustion, exhaust smoke, and pollutant emissions when the other key factors such as the blended cetane number and the fuel-oxygen enrichment rates are the same in both fuel groups for any engine load developed at a constant (2000 rpm) speed.
1. Introduction
The environment parameters have already suffered alteration over the last decades due to air pollution and rapid climate change. The pollutant emissions effect becomes more hazardous while acting in tandem with colossal energy and a massive amount of heat released from coal-driven industry and the transport sector associated with the most powerful energy units operating on the ground, on the sea, and in the sky. Increasingly often circulating disasters show that nature still has the potential to cope with human-made air pollution problems, but urgent help of the population is needed to restrain these dangerous development trends as soon as possible. To reinforce the agreement accepted three years ago at the summit in Paris, the COP24 climate change talk took place in Poland, Katowice between 10 and 14 December 2018 to limit the global temperature rise “well below” 2.0 °C [1]. Understanding how colossal and risky the climate change-induced damage can be, researchers around the world continue to work on the development of environment-friendly, renewable energy strategies to harness natural energy resources for ecological life today and the future generations as well.
The EU Directive 2009/28/EC [2], which approved a target of a 20% of European energy consumption using renewable fuels in a cost-effective way and fixed at 10% the minimum consumption of renewable fuel in transport-sector by 2020, creates a challenge for scientists and industry. A wider use of alternative fuels extracted from renewable green energy edible and nonedible biological sources such as biomass plants and vegetable oils for power generation in the agricultural sector, industry, transportation infrastructure, and marine propulsion can be one of the possible solutions to cope with fossil fuels shortage problems, prevent climate change, and save unique nature [3,4,5]. However, the differing density, viscosity, surface tension, etc. of biofuels extracted from biological or organic materials of various origins create new challenges because the adaptation of fuel systems and Diesel engines is needed to operate efficiently and environment friendly on alternative, renewable fuels, and their blends with commercial diesel fuel.
Among advantageous methods used to solve these technical challenges the most popular are improving the fuel–energy conversion efficiency and mitigating emissions by proper setting of operational parameters and using exhaust gas recirculation [6,7] in a company with fuel-related techniques [8] under steady and transient conditions [9]. The fuel system related injection characteristics also plays an important role in enhancing the air–fuel mixing rate and combustion process. The test results of a supercharged, air-cooled Diesel engine revealed that relatively bigger fuel mass portion injected into the cylinder with decreasing pressure and linear speed of running out from the nozzle’s holes fuel does not reach the active premix zone at the periphery of the spray tips. This portion of the fuel, being suspended in the ‘shadow’ near the core of the fuel jet, provides damaging effect on the air–fuel mixing rate, combustion process, engine efficiency, and exhaust smoke [10].
Effective flow area of the nozzle holes increased in proportion to the enhanced volumetric fuel delivery rate radically improved the form of the injection characteristic that was approved by the experimental tests. A front slope steeper than before the injection pressure made it possible to progressively increase both the maximum and the averaged injection pressures with the following abrupt cut off the fuel flow at the end of the injection process. This significantly reduced the relative amount of the fuel mass injected under decreasing pressures, enhanced velocity of the first fuel droplets entering the combustion chamber, the development of the fuel sprays in the compressed air charge, and the atomization quality of the fuel. While a larger initial spray cone angle and faster penetration of the fuel spray tips across the whole combustion chamber volume and near the pre-wall zone improved the air–fuel mixing rate, ignition quality, engine efficiency, and reduced black smoke of a supercharged Diesel engine [11].
Allocca et al. [12] also provided the investigation on the diesel fuel and 1st–2nd generation biodiesel (SME and GTL) spray properties by using a Bosh second-generation CR solenoid-driven fuel injection system with a 7-hole nozzle under both non-evaporative and evaporative conditions. The researchers found that the fuel injection rate profiles have a quite similar behavior in terms of rise time and slope and no differences appear versus the different densities/viscosities of the fuels. The spray tip penetration from the start of injection (SOC) for SME 100 was a bit longer at 224 µs than that of the reference diesel fuel measured at 218 µs, however it compiled about one-third of the travel distance to the combustion chamber wall. The study on 10% and 20% ethanol blended with a fossil diesel fuel in the Chalmers high-pressure spray chamber showed that differences in the fuel composition did not affect the penetration length of a liquid phase spray or initial spray cone angle under nonevaporating or evaporating conditions. While under combusting conditions, the decreased ambient temperature increased the ignition delay period and delayed the start of soot formation for all tested fuels [13].
The extended studies on the alternative fuels such as shale oil [14,15,16], KDV synthetic diesel fuel [17], natural gas/diesel, and diesel dual fuels [18] have been recently conducted to improve engine efficiency, reduce noise, exhaust smoke, and pollutant emissions. The theoretical and practical issues associated with the development, production, and the test results of turbocharged auto-tractor Diesel engines and their fuel systems with the high-pressure, electro-hydraulically controlled injectors to efficiently operate on alternative fuels such as dimethyl ester (DME) and a natural gas presents Reference [19]. The extended, comprehensive engine tests with straight vegetable oils [20,21,22] and rapeseed oil blends with diesel fuel [23,24], rapeseed biodiesel [25], and biodiesel blends with diesel fuel [26,27], ethanol–diesel [28,29], ethanol–diesel–biodiesel [30], n-butanol–diesel fuel blends [31,32,33], and binary blends of SVO or biodiesel with n-butanol or DEE [22] have been performed pursuing a wider use of renewable biofuels.
The research on biodiesel blends with a naval aviation turbine fuel JP-5 and biodiesel [34], biofuels derived from sustainable sources blended with civil aviation kerosene Jet A-1 [35], aviation turbine JP-8 fuel blended with sunflower methyl ester [36] or rapeseed biodiesel [37], as well as toxic components emitted by a marine engine [38,39] have also been provided over the recent decades to reduce ambient air pollution. As the current study intends to examine the fuel-oxygen of various origins and enrichment rates effects on the combustion process, maximum heat release rate, in-cylinder pressure, its cyclic variations in tandem with the IMEP developed, and exhaust emissions, the investigations related with variation of the air-oxygen [18] and/or the fuel-oxygen [40] enrichment rate made effects on the engine performance mentioned above are of a special importance.
1.1. The Effect of Fuel-Oxygen Enrichment Rate on Combustion and Pollutant Emissions
Adaptation of renewable biofuels to Diesel engines is promoted not only aiming to use sustainable local resources, but also to utilize the natural advantages provided by the biofuel-oxygen, which is valuable in oxidation reactions to burn the fuel completely when the air-oxygen is largely consumed during the diffusive combustion reactions in the expansion stroke. Unfortunately, there is nothing for free in the nature. Clean combustion of biofuels is paid off by the heating value reduced in proportion to the content of fuel-oxygen in the blend that finally results in a greater than before amount of biofuel mass needed per cycle to develop the same engine power under steady state conditions [41]. The increased up to a certain degree of improvement the fuel-oxygen enrichment rate seems to be one of the most attractive measures to improve the combustion quality and reduce emissions from a Diesel engine. Therefore, it is important to identify the rational fuel-oxygen enrichment rate, which can be different for the fuels involving vegetable oil, bio-diesel, ethanol, and n-butanol [9], and dependent on transient conditions of acceleration [42] or starting [43] of a turbocharged Diesel engine.
Bhardwaj et al. [44] investigated operational properties of pure HVO, petroleum diesel, and RME fuel in a high efficiency combustion system. They found that the combustion of HVO as a renewable fuel smoke reduces emissions by ~50% and gravimetric PM flow by 43%, while the decrease in pollutant species with RME was 78% and 62%, respectively. At the same time, Singh et al. [45] performed dynamometer tests of a heavy duty, DI Diesel engine powered with HRD fuel and Biodiesel extracted from Jatrophacurcas oil feedstock using 13 modes European Stationary Cycle. The researchers also achieved considerable reduction in PM, CO, and HC emissions owing to higher calorific value of HRD, and therefore less fuel consumed per unit of energy developed compared to conventional diesel. However, the NOx production was 26% higher from combustion of neat HRD and 77% higher when neat biodiesel B100 was used for Diesel engine fuelling.
Brake thermal efficiency of a naturally aspirated, unmodified engine powered with diesel–biodiesel blends was higher when running a fully loaded engine at maximum torque speed of 1400 rpm, but the fuel-oxygen enrichment rate increased beyond the rational limits worsened the combustion process and engine efficiency at the rated speed of 2200 rpm [26]. Analysis of the relevant literature shows that the fuel energy conversion efficiency and the formation of pollutant emissions are rather dependent on the amount of biofuel premixed into the diesel fuel [46], which may vary with the degree of diesel fuel oxygenation, injection timing advance and engine load. The fuel-oxygen effects above all depend on the injection characteristics affected by the widely differing properties of renewable biofuels. In spite of the fact that splitting a single-shot n-butanol injection into pilot and main injections improved the ignition and combustion timing control, they also increased NOx and soot emissions because the second injection took place in the diffusion-burning phase [47].
Rakopoulos et al. [4] conducted an original review aiming to restrain the smoke of the exhaust and other pollutant emissions from Diesel engines by increasing the oxygen content in the combustion chamber with additional oxygenation of either the intake air flow or the fuel stream. The authors have showed a large decrease in the ignition delay and soot emissions accompanied by lower both CO and HC emissions, while brake specific fuel consumption did not change greatly and the power output showed the increasing potentials. However, both BSFC and NOx emissions reasonably increased due to oxygenation of the diesel fuel. It is most likely that the measured increase in the NOx production occurred because of the presence of an extra oxygen, which reacts with the airborne nitrogen under high temperatures inside the cylinder [48].
Zannis et al. [49] conducted extended theoretical studies to reveal the potential difference between the airside and the fuelside oxygen enrichment made effects on operational parameters of an engine under the same degree of oxygenation in the mixture. The researchers found that the intake fuelside oxygenation results in higher maximum in-cylinder pressures, bulk gas temperatures, and NO emissions accompanied by lower exhaust soot values compared to the intake-airside oxygenation. They revealed that the diesel emitted pollutants can be effectively controlled not only by the amount of fuel-oxygen and the contribution of other fuel-related parameters, such as molecular structure; the physical properties of oxygenates should also be considered so that inspired researchers can continue the work on the subjects in question. It was found that oxygenation of fuel Jet A-1 has little effect on oxygen content (‘lambda’ value) of the fuel/air mixture, therefore the air-oxygen, being in higher proportions (by mass), dominates in the premixed combustion reactions.
The oxygenation of incoming air positively affected the combustion process that facilitated operational and environmental control of DI Diesel engines because of the liner correlation between intake air-oxygen fraction and engine out emissions was found. However, in the literature still lacks experimental data about how the fuel-oxygen enrichment may enhance the combustion process when running under different loads, on which the need for extra oxygen mainly depends. The matter is that the air-oxygen mass content delivered into the cylinder under various engine loads remains nearly the same when running at a constant speed, boost pressure, and temperature, while the amount of fuel-oxygen increases with engine load because more biofuel should be injected per cycle to keep the power. In result, decreases the relative (overall) air/fuel ratio ‘lambda’ and increases the need for an extra oxygen to burn the fuel completely. Thus, the higher content of fuel-oxygen may play a greater role in the diffusive combustion reactions when running under full load. This study intends to learn more about and find the answer to many intriguing questions by collecting more data about the behavior of subjects in focus with increasing fuel-oxygen enrichment rate (at CN constant).
It was revealed [30] that the ignition delay for ethanol–diesel–biodiesel blend E15B is 15.4% longer than for standard diesel fuel (EN 590) when running a naturally aspirated engine on a little richer air–fuel mixture λ = 1.5 at maximum speed of 2200 rpm. While the influence of ethanol–oxygen on maximum heat release rate seems as being ambiguous enough in the premixed combustion phase. In that study, the major fuel–oxygen made effect on the maximum heat release rate (HRRmax) was found for overall lean air–fuel mixtures (λ = 5.5), which distinguishes them as having slower flame speeds, and the smallest one for overall richer mixtures λ = 1.5, which usually burn with a faster flame speed [50]. The added 5 vol% of biodiesel to ethanol–diesel fuel blend E15 enhanced combustion and relevant angles AHRRmax, AI 50, and AI 90 shifted close to Top Dead Center (TDC) because the cetane number and other RME properties are comparable to those of the diesel fuel. The combustion of three-component blend E15B produced maximum NOx emissions relatively lower, but smoke and CO emissions did not change greatly compared to those values a fully loaded (λ = 1.5) straight diesel produces at the rated speed of 2200 rpm.
However, even with such an approach, assuming that the relative (overall) air/fuel ratio remains at the same value, leaner and fuel-rich average ‘zones’ still exist due to the nature of a Diesel engine in which heterogeneous air and fuel mixture is unevenly distributed across the whole combustion chamber volume. Also, the distribution a liquid phase of the fuel in the combustion chamber can be different for the fuels possessing the same amount of fuel-oxygen extracted from a lighter, highly volatile ethanol, or heavier, less volatile biodiesel. As might be expected, the combined effect of fuel density, viscosity and volatility (physical factor) on the combustion process in a turbocharged Common Rail Direct Injection (CRDI) engine will be less significant than in a naturally aspirated engine due to improved injection pressure, better atomization of the fuel and higher temperature inside the cylinder. Nevertheless, physical properties of the fuel will affect the formation of fuel-richer zones, heat release rate [51], engine efficiency, and thus pollutant emissions [41].
Rakopoulos et al. [40] developed a two-zone combustion model to theoretically evaluate the oxygenated fuel’s influence and its injection timing on the combustion process and emissions of a DI Diesel engine (at 2000 rpm) by preserving all the other operating parameters the same. Researchers found that the increased inlet air–oxygen concentration ratio leads to shorter liquid fuel autoignition delay periods for constant diesel fuel quantity ratio and this improvement is accompanied by an amelioration of the combustion quality of gaseous fuel. Also, the in-cylinder pressures along with the burning zone temperatures were higher with oxygenated fuel than the corresponding values a straight diesel produces. The higher temperatures of the burning zone favored the NO formation that also increased for the higher injection timing advance, while soot density decreased with increasing degree of oxygenation of diesel fuel for various injection timings at any load.
Therefore, the experimental studies with oxygenated fuels are important to detect how much and why the combustion process and emissions of the Diesel engine may change when running under various loads at a constant speed. The literature review indicates that there is a lack of knowledge about how the fuel-oxygen of various origins and its enrichment rate affect the combustion process when the blended cetane number does not change with every sequential portion of ethanol or biodiesel added to diesel–HRD fuel. The study intends to examine the ethanol–oxygen or biodiesel–oxygen made effects on the combustion process, engine efficiency, and emissions when the blended cetane number as a measure of the ignition quality of diesel fuels is high enough to eliminate the potentially negative effect of the added ethanol or biodiesel on the ignition quality and the cyclic variability of operational parameters. To improve the engineering knowledge about what the role of fuel-oxygen in the combustion reactions concerns how much the need for fuel-oxygen increases with the decreasing availability of the airborne oxygen itself, and engine tests should be performed under various loads (overall ‘lambda’ values).
1.2. The Effect of the Differing Ethanol or Biodiesel Properties on Mixing Control Combustion and Emissions
Ethanol has been widely used as a fuel for internal combustion engines, mainly in Brazil as neat ethanol (E100) or as an octane additive of 10% ethanol and 90% gasoline (E10) in the USA, Canada, and Australia [52]. Also, ethanol as an oxygenator source has been used in blends with a fossil diesel fuel to effectively reduce NOx and soot emissions. Basic knowledge about alternatives such as alcoholic fuels or biodiesel and their chemical and physical properties is provided in more detail by References [53,54], while special studies highlight biofuel-made effects on spray development [55], combustion characteristics [37,56,57,58,59], and emissions [60,61,62,63] of compression ignition (CI) engines. The combustion process, smoke, and emissions with the fuels oxygenated with ethanol or biodiesel (CN constant) have not been experimentally studied before when running under various loads. Thus, specific tests may reveal more details about the influence of fuel-oxygen on the operational parameters of an engine.
Possessing high volatility and octane number, ethanol as gasoline substitute has been effectively used to increase gasoline octane number and enhance combustion in spark-ignition engine [64]. Although, despite having higher vapor pressure, ethanol vaporizes slowly compared to gasoline because of a lower surface temperature due to its higher latent heat of vaporization. When incorporated into gasoline-ethanol fuel blends, ethanol vaporizes faster because both components attain the same temperature, at which ethanol is useful due to its higher vapor pressure. Whereas, in biodiesel–diesel fuel blends, initially the diesel fuel vaporizes faster up to 550 K, and above this temperature, the vaporization of biodiesel becomes faster due to higher vapor pressure of RME [65]. This distinguishing behavior of ethanol or biodiesel in diesel–HRD fuel blends is important for proper interpretation of the test results because the differences in physical properties may affect the ignition delay and the entire combustion process.
It is obvious that efficient and clean combustion of biofuels containing ethanol or biodiesel with different densities, viscosities, surface tensions, bulk modulus of elasticity, and initial/final boiling points depend on the vaporization curves of fuel blends and the air–fuel mixing rates in the combustion chamber. Therefore, ethanol–oxygen or biodiesel-oxygen made effects on vaporization of fuel droplets, mixture quality, ignition delay, combustion, and emissions will be dependent on engine load, speed, and the temperature conditions inside the cylinder. The differing vaporization characteristics of ethanol or biodiesel may provide additional challenge for clean combustion in the diffusive phase which can be achieved with a help of fuel-oxygen only through complete vaporization of the fuel. Therefore, more research on the subjects in focus is needed to attain a deeper knowledge about the combustion peculiarities of the fuels identically oxygenated with ethanol or biodiesel under various engine loads.
The authors of Reference [8] studied the effects of ethanol-diesel fuel blends on combustion, heat release, and emissions produced by an HSDI Diesel engine running at a speed of 2000 rpm, static injection timing of 29° crank angle degrees (CADs) before TDC, and four specific loads. Researchers found that the fuel pressure diagram was similar with that of neat diesel fuel with small displacement in the injection timing, longer ignition delay, and higher maximum heat release rate. This did not translate into higher maximum pressure due to latter combustion of a ‘leaner’ E15-D blend with slightly reduced temperature in the cylinder at each load tested. Changes in combustion resulted in lower gross heat losses and higher thermal efficiency with soot density, NOx, and the CO emitted from combustion of ethanol-diesel fuel blends slightly lower than the respective values measured in the corresponding diesel fuel case. The opposing (increasing) development trends were revealed only in BSFC and the HC emissions because of lower heating value and higher heat of evaporation of ethanol further promoted by the presence of so-called ‘lean outer flame zones’ [66].
Fuel injection characteristics play a paramount role in clean combustion of the fuel. Extremely high (3000 bar) injection pressures and cooled EGR provide the NOx and soot emissions control to abide EURO VI limits without any exhaust gas after treatment [67]. The engine efficiency characterized by low smoke, PM, CO, and THC emissions was also achieved with a modern Bosch CRI2.6 injector with the injection pressure of 300 MPa developed by using hydraulic pressure-balanced control valve and the diameter of the eight-nozzle hole of 0.08 to 0.10 mm, checked under the microscope [68,69]. These improvements in a company with the high air boost pressure reduced smoke (soot), but increased the NOx production. While the hot combustion of a pilot fuel portion produces chemically active radicals such as CH and HCO [58], the presence of which may enhance the system reactivity and alleviate autoignition of the main fuel portion injected into already preheated the in-cylinder air charge. Thus, a pilot injection will diminish the effects made by the differing properties of the fuel of various origins on the ignition delay, combustion attributes, and emissions [48,66] to be studied.
Secondly, it is difficult to separate the effects made by fuel-oxygen on the combustion attributes from inevitable changes caused by the combined contribution of differing physical and chemical properties of ethanol or biodiesel during the experimental studies. These highly interrelated and thus problematic issues can be solved only by extensive theoretical studies with the help of numerical program packages [7,70], but the verification of calculated results needs reliable experimental data to produce a conclusive answer. The purpose of the experimental study was to examine the individual effects made by diesel–HRD fuel blends containing in various proportions of ethanol–oxygen (E) or biodiesel-oxygen (B), while keeping both the blended cetane number and the fuel-oxygen mass content the same for each one of the respective fuels in both E and B fuel groups, on the combustion process, maximum (net) heat release rate, in-cylinder pressure, cyclic variability, engine efficiency, and emissions when running a turbocharged CRDI Diesel engine under specific loads at maximum torque speed of 2000 rpm.
The blended cetane number of diesel–HRD fuels oxygenated with ethanol or biodiesel was intentionally preserved at a constant value of 55.5, while the fuel-oxygen mass content was identically increased within the same range of 0 (E0/B0), 0.91 (E1/B1), 1.81 (E2/B2), 2.71 (E3/B3), 3.61 (E4/B4), and 4.52 wt% (E5/B5) in both fuel groups to determine information about the individual contribution of the fuel-oxygen enrichment rate to the development of the combustion attributes. The engine test results achieved by using the elaborated methodology have been analyzed, interpreted and presented in as much details as possible to reveal the accompanied effects made by the differing properties of the fuels by comparing the obtained results with those of the ‘baseline’ operation with the reference, oxygen-free fuel blend E0/B0 and a straight diesel as well as among the fuel groups themselves.
Changes in the ignition delay, combustion history, engine efficiency, nitrogen oxides (NOx), nitrogen dioxide (NO2), carbon monoxide (CO), total unburned hydrocarbons (THC) emissions, and exhaust smoke (soot) as a function of the fuel-oxygen enrichment rate, and the widely differing properties of the fuels were analyzed in more details for medium (50%), intermediate (80%) and full (100%) loads at maximum torque speed of 2000 rpm. As the fuel-oxygen enrichment rate and the differing properties of ethanol or biodiesel are the most important factors affecting engine efficiency, analysis of the ignition quality, combustion, and emissions combined with the evaluation of their changing trends may reveal the potential reasons why this may occur under the given test conditions.
2. Experimental Engine Test Facilities, Measuring Apparatus, and Methodology
The experimental tests were conducted with a turbocharged CRDI Diesel engine (FIAT 1.9 JTD 8V) with a displacement volume of 1.91 dm3 and the compression ratio of 18:1 when running under various loads at maximum torque speed of 2000 rpm. The moving vanes of a Garret variable geometry turbocharger GT1749V were taken under control to preserve the incoming air charge pressure and the temperature at the constant level. For this reason, the respective sensors were fitted in the center of the intake manifold-chamber to measure density of the incoming air and thus volumetric efficiency of an engine. The air-flow passed through the capacity chamber and entered into the cylinder at a constant boost pressure of 1.60 bar and the temperature of 85 °C. The air–fuel mixing rate and the combustion efficiency were improved by using an OMEGA-shaped combustion chamber in the piston head. Due to a very small 2° CAD overlap of the inlet and the exhaust valves the scavenging effect of the engine cylinders was reduced to minimum at the end of the exhaust and the beginning of the intake strokes.
This worked as an internal EGR aiming to reduce the NOx production because the external EGR system was switched off on purpose to eliminate the potential side effects on operational parameters of an engine. To make the test conditions more manageable, the electronic control unit EDC-15C7 CR governed both the fuel injection timing and duration of the injection. The general view of the engine test stand, electronic equipment, and apparatus used during the experiments are presented schematically in Figure 1. The experimental test setup consisted of a Diesel engine, an engine test bed, the AVL indicating system, the air-mass and fuel mass flow measuring equipment, an exhaust gas analyzer, and a smoke (opacity) meter. A more detailed specification of an engine and the fuel injection system is given in Table 1.
2.1. Measurement of Engine Torque, Load, and Air Mass and Fuel Mass Flows
The experiments were carried out when operating under medium (50%), intermediate (80%) and full (100%) loads corresponding to the respective Indicated Mean Effective Pressures (IMEP) of 0.75, 1.20, and 1.50 MPa developed at maximum torque speed of 2000 rpm as it is the most typical for a Diesel engine and recommended one. Load characteristics were taken with EN590 diesel fuel (DF) as a “baseline” fuel, the reference, oxygen-free diesel–HRD fuel blend E0/B0 and the ten experimental fuel blends containing as oxygenator source ethanol–oxygen (E) or biodiesel-oxygen (B) in various proportions (by mass), but still maintaining the same fuel-oxygen enrichment rates in both E and B fuel groups. While the incoming air mass into the cylinder remained almost the same for constant boost pressure, air temperature and engine speed. Changes in the combustion process, heat release characteristics, engine efficiency, cyclic variability, smoke, and emissions produced with oxygenated fuels E0–E5 or B0–B5 were compared with those values the reference fuel E0/B0 and a straight diesel develop at the respective loads.
The comparison of the test results was then carried out for identical engine loads and fuel-oxygen mass contents, while keeping the blended cetane number in the two fuel groups E0–E5 and B0–B5 essentially the same CN = 55.5, since this factor is recognized as the most responsible for the ignition quality. This comparison was extended between the using of diesel–HRD fuel blends containing the same amount (by mass) ethanol–oxygen or biodiesel-oxygen. Such an approach creates the proper conditions for direct observation of eventual changes occurred in the combustion history, engine efficiency, and emissions caused by the differing properties of the fuels of various origins.
An electric dynamometer KS-56-4 (Czech Republic) with a definition rate of ±1 Nm and the AVL crank angle encoder 365C (AVL List, Graz, Austria) with a definition rate of ±0.1% have been used to measure the engine torque and the rotation speed of the crankshaft. The AVL air mass flowmeter was used to measure a real-time air mass flow into the cylinders, while the AVL dynamic fuel balance 733S flex fuel system was switched on to record instantaneous fuel mass consumption for every load setting point. A water-type heat exchanger mounted on the return line downstream from the fuel pump was used to maintain temperature of the fuel at a constant level of about 25 °C. After every test set, fuel was drained from the system, fuel filters were cleaned up, and the engine operated for about 15 min with a new fuel-set to reach steady-state coolant temperature of nearly 88–90 °C before continuing the engine tests.
2.2. Measurement of Gas Pressure in the Cylinder and Engine Test Data
A high-speed multichannel indicating system with the AVL crank angle encoder 365C and the high-performance pressure transducer GU24D coupled to the AVL microIFEM piezoelectric amplifier and signal acquisition platform IndiModul 622 (AVL List, Graz, Austria) were used for the recording, acquisition, and processing of fast-frequency gas pressure versus crank-angle signals in the first cylinder. The most popular pressure curve method of the unfired engine was used to identify the correct position of TDC [71]. Both single cycle (individual) indicator diagrams and averaged over the 100 consecutive engine cycles reflecting the in-cylinder pressure traces versus crank angle have been in series recorded for every 0.1 crank angle degree (CAD) when running with each one of the fuels in the two fuel groups at the appointed load-setting points to improve the accuracy of evaluation.
The AVL CONCERTOTM advanced version 4.5 of the data postprocessing software was used to increase productivity and improve accuracy of the experimental test results. Then, the AVL BOOST program was employed to calculate specific burn angles corresponding to mass burn fractions (MBF) 50 and (MBF) 90, as well as the amounts of net heat release rate in the combustion process. The data of summarized over the 100 consecutive engine cycles averaged in-cylinder pressure traces, an instantaneous cylinder volume, and their first-order derivatives with respect to crank angle have been used to perform these calculations. An example of the averaged in-cylinder pressure tracers, the calculated heat release rate, and fuel-pressure change history in a high-pressure line just in front of the injector versus crank angle recorded over the 100 consecutive engine cycles with a sampling rate of 0.1° CAD is shown in Figure 2.
The Kistler piezoelectric pressure sensor ASMB 470004-1 attached to a high-pressure tube in front of the injector was used to record the start of injection (SOI) of the fuel. This pressure sensor was attached to the Kistler (Kistler Instrumente AG, Winterthur, Switzerland) 2-channel charge amplifier-module 4665 mounted on the signals conditioning platform-compact 2854A to record the high-pressure history at the injector with an accuracy of ±0.5% in the pressure range of 0 to 200 MPa.
The experimental data recorded over 100 consecutive engine cycles was used to statistically evaluate maximum standard deviations (MSD) taking place in both the Indicated Mean Effective Pressure (IMEP) and the peak in-cylinder pressure (pmax) according to the AVL methodology [72]. The cyclic irregularity was statistically evaluated by using the coefficients of variation (COV) of maximum pressure pmax in the cylinder and the IMEP developed. The raw data values of IMEP and maximum pressure pmax enclosed in a time record of the 100 consecutive engine cycles were used for detailed analysis. The main statistical quantities were used such as mean (average) values of the studied parameters, maximum standard deviations, and the coefficients of variation, where COV is the quotient of standard deviation by the corresponding mean value, normally expressed in percentages.
2.3. Measurement of the Autoignition Delay Period for a Pilot Fuel Portion
The experimental diagrams demonstrating the history of the fuel high-pressure pulses in a tube (pipe) in front of the injector, the time-averaged gas pressure in the cylinder, and the calculated (net) heat release characteristics versus crank angle are shown in Figure 2. The ignition delay time, as a period expressed in CADs between start of injection (SOI) and start of combustion (SOC) of a pilot fuel portion, was assessed with an accuracy of ±0.1°. As the start of injection was taken crank angle at which the fuel pressure in a high-pressure tube drops down because the nozzle needle valve of the injector opens at that point. As the start of combustion was taken crank angle at which the curve of heat release-rate crosses the zero line and changes its value from the minus side to the plus side. The (net) heat release characteristics were calculated by using a single-cycle diagram of the in-cylinder pressure versus crank angle as the input data averaged over 100 consecutive combustion cycles, instantaneous cylinder volume, and their first-order derivatives with respect to crank angle.
The data postprocessing software AVL CONCERTOTM advanced edition was introduced to enhance productivity and accuracy of the test results. The combustion process related parameters such as mass burn fraction values for 50% and 90% of the burned fuel mass, heat release rate versus crank angle, and the total amount of heat released over an engine cycle were calculated by using the AVL BOOST simulation software that improved accuracy of the calculated results.
2.4. Measurement of Engine Emissions and Exhaust Smoke
Temperature of the exhaust gases was measured with a nickel–chromium (K type) thermocouple installed just in front of the exhaust manifold. The exhaust emissions of nitric oxide (NO), nitrogen dioxide (NO2), carbon monoxide (CO), and total unburned hydrocarbons (THC) expressed in parts per million (ppm) were measured with electrochemical cells built-in the Testo 350 XL flue gas analyzer (Testo AG, Lenzkirch, Germany). The total NOx emissions were evaluated as a sum of both NO and NO2 components. Exhaust smoke (soot) was measured by using a “Bosch” RTT 110/RTT 110 opacity-meter (Robert Bosch, Stuttgart, Germany), the readings of which are provided as Hartridge units (% opacity) in a scale range of 0 to 100%. The measurement accuracies of the experimental data related with the combustion process, engine performance and exhaust emissions as well as the uncertainties of the calculated experimental results are listed in Table 2.
3. Experimental Procedures and Analysis of Basic Parameters of Oxygenated Diesel–HRD Fuel Blends
3.1. Chemical Composition of a Fossil Diesel, Fuel Blends Containing Ethanol or Biodiesel, and Their Blending Methodology
Conventional automotive fossil-origin diesel fuel (class 1) produced at the refinery “Orlen Lietuva” and satisfying the specifications of standard EN-590:2009 + A1 was used as the reference fuel. Its composition consisted of C/H = 0.8608/0.1299 and the remaining behind residue of 0.0093 included some traces of water, sulfur, and other species as measured at the refinery.
The renewable NExBTL fuel satisfying the high quality diesel fuel standards EN-590 approved by the certificate of analysis TT-15-000229 and therefore referred as Hydrotreated Renewable Diesel (HRD) was brought directly from the Finish NESTE Oil Ltd., Porvoo, Finland. The composition of oxygen-free HRD fuel was C/H = 0.8480/0.1520 and biomass source used in renewable diesel production was primarily rapeseed oil.
Rapeseed oil methyl ester (biodiesel) was brought from the company “Rapsoila”, Mažeikiai, Lithuania and consisted of C/H/O = 0.7720/0.1190/0.1084, thus its quality parameters satisfied the specifications of standard EN 14214:2012. While anhydrous ethanol (CH3CH2OH—99.9 vol%) as oxygenator source was produced Sigma-Aldrich, Seelze, Germany and its quality satisfied the specifications of standard EN 15376:2015. Chemical and physical properties of commercial diesel fuel, biodiesel, and ethanol were determined at the respective producers’ laboratories according the EU standards and the most important features were analyzed and approved by the quality certificates. Whereas the most important parameters such as the cetane number, acid value, cloud point, and (net) heating value of renewable HRD fuel were measured at the Company Nestle Oil Ltd. in Finland according ASTM standards. The measured data of commercial diesel fuel, renewable HRD fuel, anhydrous ethanol, and biodiesel are listed in Table 3.
The composition of diesel–HRD fuel blends containing in the increasing order 0 (E0/B0), 0.91 (E1/B1), 1.81 (E2/B2), 2.71 (E3/B3), 3.61 (E4/B4), and 4.52 (E5/B5) wt% the same ethanol (E) or biodiesel (B) oxygen mass contents is shown in Figure 3. Well-balanced binary and ternary fuel blends designed from commercial diesel fuel, renewable HRD fuel, and biofuels derived from biomass of various origins suggest proper preconditions for detailed analysis and comparison of the test results aiming to reveal the role of fuel-oxygen on the ignition delay and the combustion phenomenon. To make the analysis of changing trends in the combustion process and the engine efficiency more informative both the blended cetane number and the fuel-oxygen enrichment rates were maintained as identical as possible. Specified test conditions are essential for accurate analysis to find out what eventual changes in the ignition delay period and the combustion history occurred, what potentially triggered off them as well as to study the existing trends and interrelationships between control factors to understand why the obtained results are possible.
Although, having the same blended cetane number and the fuel-oxygen mass content in the oxygenated fuel blends did not assure that the premixed combustion reactions preceded under identical pressure and temperature conditions inside the cylinder. This is because the main properties such as density, viscosity, iodine number, latent heat of vaporization, surface tension, C/H atoms ratio, amounts of sulfur, and polycyclic aromatics along with the differing distillation characteristics, initial/final boiling points and adiabatic flame temperatures are all dependent on the fuel composition. Dissimilar evaporative cooling effects of ethanol or biodiesel involved into fuel blends will cause temperature variations and, subsequently, density differences that may have impact on the engine efficiency and emissions because of the dissimilarities occurred in the local air/fuel ratio in some ‘zones’ of the combustion chamber.
The differences in the injection, atomization, and vaporization characteristics of the fuels oxygenated with the components of various origins will create dissimilar the fuel-oxygen-made effects on the compression ignition delay of a pilot fuel portion, the combustion reactions, and thus exhaust emissions. This, in turn, may intervene into the planed test conditions to overshadow the effects made by the fuel-oxygen itself on the combustion process. Nonetheless, more in-depth study on the subjects, analysis, and the comparison of the results obtained with fuel blends containing ethanol or biodiesel with those values the combustion of the reference, oxygen-free fuel blend E0/B0 emits, and straight diesel produces and findings of other researchers is of essential importance to properly interpret the resulting changing trends in the combustion history and pollutant emissions to withdraw sound conclusions.
3.2. The Engine Test Strategy, Methodology, and Apparatus used for Experiments
The experiments started with neat diesel fuel to estimate the combustion characteristics, in-cylinder pressure and the cycle-to-cycle irregularity establishing the ‘baseline’ level that was used to evaluate the potential developing trends in parameters measured with diesel–HRD fuel blends oxygenated with ethanol or biodiesel under the same test conditions. At first, the HRD fuel was premixed with commercial diesel fuel in the precalculated proportions by mass because Finnish scientists recommend this sequence in the mixing technique [73]. After that, the two experimental fuel groups were prepared by pouring the needed amounts (wt%) of ethanol or biodiesel to already premixed diesel and HRD fuels to get the designed fuel-oxygen mass contents and, simultaneously, to preserve the blended cetane number of the same value. The three-component fuel blends combined the benefits from renewable HRD fuel and contributed to better solubility of ethanol when using the HRD fuel as cosolvent.
The developed research methodology made it possible to perform the engine tests with the fuels containing various amounts of ethanol or biodiesel, while an extra quality, high-cetane, renewable, biomass-based, and oxygen-free HRD was an excellent fuel chosen on purpose to start up the experiments on the subjects listed below.
- (1)
- To evaluate the fuel-oxygen enrichment-made effects on the ignition delay, combustion characteristics, maximum heat release rate, indicated thermal efficiency, the coefficient of cyclic variation (COV), and emissions when running with the fuels oxygenated with ethanol E0–E5 or biodiesel B0–B5 components under three specific loads at maximum torque speed of 2000 rpm. The fuel-oxygen mass content has been increased within the range of 0–4.52 wt% by using the same fuel-oxygen enrichment rates in both E and B fuel groups. At the same time, a newly designed fuel blends were premixed in such percentages by mass to preserve the same cetane number, which is recognized as the most important factor affecting the ignition quality in a Diesel engine [74]. The blended cetane number of the fuels was high enough to assure the highest ignition quality and thus minimize the potential rise of unstable engine functioning with cycle-to-cycle irregularity of the combustion parameters at high blending ratios of low-cetane ethanol [75].
- (2)
- To learn more about how the widely differing properties of oxygenated fuels of various origins contribute to eventual changes in the ignition delay, combustion process, and cyclic variability (COV) when the cetane number of the respective fuels E0–E5 and B0–B5 is preserved of the same value, as shown in nomenclature. However, the blended fossil diesel and HRD fuel mass ratios changed in a different way with every next portion of ethanol or biodiesel added to the blend that affected the composition of the fuels and their chemical-physical properties. This unscheduled factor interfered into the planned testing methodology, but its contribution probably was not significant because both commercial diesel and HRD fuels are of a high quality, oxygen-free energy sources satisfying requirements defined by the EU standards for automotive fuels.
Hydrotreated Vegetable Oil (HVO) fuel reduces exhaust emissions, but this renewable, oxygen-free fuel has great potential to promote even higher emissions reductions when blending the HVO fuel with suitable oxygenate. A greater than 25% decrease in particulate mass was observed when running with a HVO and Di-N-Pentyl Ether (DNPE) blend (with 2 wt% oxygen content) compared to HVO fuel, while the production of NOx emissions increased less than by 5%. However, the hygroscopic growth of exhaust particles originating from combustion of HVO + DNPE fuel was higher than that from HVO fuel [76]. Novel HVOs are made from straight chain paraffinic hydrocarbons and, therefore, practically do not include aromatics, oxygen, nitrogen, and sulfur. Moreover, these second-generation biofuels distinguish as having the highest among other liquid fuels cetane numbers ranging from 75 to 95 and this exceptional feature is established by the nature of n- and isoparaffins mixture [62]. The HRD fuel fits into the same group of hydrocarbons, which are miscible with a hydrocarbon matrix of a fuel blend. Therefore, it mixes well with commercial diesel fuel, while Hydrotreated Vegetable Oil (HVO) does not have such good solvency features as a fossil diesel fuel because it is a mixture of straight chain paraffinic hydrocarbons [73].
Therefore, it is recommended to prepare the mixture of diesel and HVO fuels first before pouring the precalculated amounts of ethanol or biodiesel into the same canister. Anhydrous ethanol was added to diesel–HRD fuel blends just before starting the experimental tests to minimize absorption of humidity from ambient air and avoid phase separation. Rakopoulos et al. [32] used n-butanol and DEE to tackle the poor miscibility of ethanol with a diesel fuel; however, straight blending of anhydrous (200 proof) ethanol with a fossil diesel is also possible. In contrast to the ethanol case, biodiesel (RME) mixes well with diesel–HRD fuel blends and does not create any problems [61].
Density and viscosity of the fuels have been measured with a laboratory device Anton Paar GmbH density/viscosity meter SVM 3000 (Courtyard AL4, Albans, UK) with an accuracy of ±0.0002 g/cm3 and 0.1%, respectively, at the temperature of 40 ± 0.001 °C. Whereas, the surface tension measurements for biofuel droplets were taken by using mobile bubble pressure tension meter Krüss BP 2100 (Hamburg, Germany) with an accuracy ±0.1 mN/m.
At first, load characteristics of an engine powered with commercial diesel fuel EN 590 were taken to have the reference data for maximum torque speed of 2000 rpm, while keeping the air boost pressure at 1.6 bar to eliminate the potential effect caused by the variation in the air temperature. Then, the engine operated with binary (E0/B0) and the ternary diesel–HRD fuel blends oxygenated with ethanol E1–E5 or rapeseed biodiesel B1–B5 in such percentages by mass to have a wide fuel-oxygen range of 0 to 4.5 wt%, which is needed for the experimental tests. As in previous investigations [63,77], the lubricity of fuel blends and solubility [78], autoignition [79], and cetane number improvers [28,60], phase stability-improving additives [29], and/or emulsifiers [80] in ethanol–diesel fuel blends have not been used in this study. The absence of high tech additives excludes modification of the tested fuels and thus their potential influence on the ignition quality and the combustion attributes. To extract more evidential clues, each one of the respective fuels series E and B possessed the same blended cetane number value and identical fuel-oxygen enrichment rates, even though these blends possessed biofuel components derived from biomass of various origins.
The ignition delay time along with the combustion process, maximum heat release rate, cyclic variations of IMEP and maximum in-cylinder pressure, indicated thermal efficiency, and exhaust emissions measured with oxygenated fuels are compared with the corresponding values obtained with the reference, oxygen-free (‘baseline’) fuel E0/B0 and a straight diesel. The fuel-oxygen mass (wt%) contents, overall stoichiometric air/fuel ratios, and net heating values of fuel blends E0–E5 or B0–B5 were estimated bearing in mind the mixing percentages of each component involved and the respective data of the diesel fuel, HRD fuel, ethanol, or rapeseed biodiesel as listed in Table 3. Having information about the tested fuels, the qualitative and quantitative evaluation of the respective operational parameters of an engine was provided to reveal their changing trends developed when running under various loads at a constant (2000 rpm) speed.
The test methodology allows a wide variation range of fuel properties and, simultaneously, preserving key factors such as cetane number and/or fuel-oxygen mass content as planned to fulfill the intended tasks. Qualitative and quantitative evaluation of eventual changes in autoignition delay time and the combustion characteristics within the range of variation of the fuel-oxygen enrichment rate in the same fuel group, between oxygenated fuel blends of various origins, and with those measured with a straight diesel provided essential help in revealing the potential reasons leading to eventual developing trends. The differing properties of ethanol or biodiesel will contribute to the changes occurring in fuel atomization, the air–fuel mixing rate, ignition delay, combustion history, heat release rate, engine efficiency, the cycle-to-cycle irregularity, and exhaust emissions that may get a chance to make a difference.
Net heating value, fuel-oxygen mass content, C/H atoms ratio, stoichiometric air/fuel ratio, and the blending percentages of diesel–HRD fuels with ethanol or biodiesel are all major factors that were taken into account to estimate the resulting properties of oxygenated fuels at which the planned test conditions are satisfied (Table 4). Knowing cetane number values of each fuel component, a blending cetane number of the tested fuels was calculated by using methodology developed in the U.S. at the National Renewable Energy Laboratory [74]. This methodology assumes that the cetane number of fuel blend is a linear combination of the cetane numbers of the included original components. The Finnish scientists verified that the cetane number increases linearly with blending ratio of HVO fuel [73]. In contrast to this, in case of blending the vegetable oils and DEE the ‘lever’ low cannot be applied [22].
The evaluation of changes in combustion attributes, maximum heat release rate, engine efficiency, and exhaust emissions with ethanol–oxygenated or biodiesel-oxygenated fuels was made comparing of them with the respective values the combustion of the reference, oxygen-free fuel E0/B0, and a straight diesel (DF), developed under medium (50% of full), intermediate (80% of full) and full (100%) load conditions. The respective loads correspond to the IMEP = 0.75, 1.20 and 1.50 MPa developed by the combustion of fuel blends E1–E5 or B1–B5, oxygen-free blend E0/B0, and the normal diesel fuel were calculated with the AVL BOOST program by using the averaged indicator diagrams reflecting the in-cylinder pressure traces summarized over the 100 consecutive engine cycles versus crank angle.
Because the effect of the fuel-oxygen enrichment rate on the ignition delay, heat release rate, and the in-cylinder pressure traces may vary with engine load, the cyclic irregularity was estimated statistically by using the coefficients of variability (COVs) of both maximum pressure inside the cylinder and IMEP. The same research group of the study [75] also noted that, apart from COV, higher-order statistical parameters can assess the “cause-and-effect relationship”, such as the probability density, autocorrelation, and power spectral density functions of the various parameters. The researchers revealed the randomness (stochastic nature) of the fluctuation phenomena—that is, the cause of peak pressure fluctuation and maximum pressure rise rate—to be random and not to depend on their actual values of any other cycle.
4. Results and Analysis
Chemical and Physical Properties of Commercial Diesel, Renewable HRD Fuel, Ethanol or Biodiesel and Their Blends
The density of HRD fuel is 6.4% lower and the kinematic viscosity ~37.0% higher than the respective values of diesel fuel (class 1) measured at the temperatures of 15 °C and 40 °C. Oxygen-free HRD fuel has the highest calorific value among the prevailing biofuels as well as the highest rational distillation range due to the absence of high boiling fractions in its composition (Table 3). These operational features suggest real advantages compared to the normal diesel fuel or rapeseed biodiesel. The high energy content per unit of mass compensates for the detrimental effect caused by its low density on volumetric fuel delivery scale. This advantageous feature of the fuel rests on the paraffinic nature of HRD and the fact that undesirable elements such as oxygen, nitrogen, and almost all the sulfur containing species are removed to replace all of them by highly calorific hydrogen, the content of which is 16.9% higher than that of 13.0 wt% of the diesel fuel. Therefore, relatively less HRD fuel will be needed per engine cycle to develop the same power output.
A lighter HRD fuel added to the blend not only enhanced the cetane number and net heating value of the fuel, but also increased H/C atoms ratio, reduced acid value, polycyclic aromatics, sulfur, water, ash contents, and autoignition temperature, deepened both cloud and cold filter plugging points of the blend. It is important for reliable operation of an engine, and according to High Frequency Reciprocating Ring (RFRR) tests the lubricity of HRD fuel is 43.4% better than that of the normal diesel fuel. This advantageous feature tolerates its planned blending with the normal diesel fuel and in rational proportions with ethanol to achieve the desirable cetane numbers without a risk to damage the fuel system. Although, more airborne oxygen will be needed for complete combustion of HRD fuel because of its high stoichiometric air/fuel ratio and thus better calorific value as listed in Table 3.
The developed methodology allows for the comparison of the operational parameters obtained with the reference fuel E0/B0 with the respective values a straight diesel (DF) develops under identical loading conditions. This way it will be possible to extract more evidential facts about how much the differing properties of HRD fuel added to the normal diesel affect the engine parameters in question. It can be expected that high cetane number of HRD fuel further supported by lower density, higher hydrogen-to-carbon atoms ratio, and net heating value of the fuel will positively affect the ignition quality, combustion characteristics, and engine out emissions.
Ethanol as promising alternative fuel has been widely used in spark ignition (SI) engines to alleviate the fossil fuel shortage problems, enhance combustion, reduce exhaust smoke (soot), and pollutant emissions owing to the highest oxygen content in its composition [81,82]. Solubility of ethanol in the diesel fuel depends on the hydrocarbon composition, contents of water and wax in the blend, and ambient temperature and humidity [61]. Anhydrous ethanol normally mixes well with the diesel fuel and does not need any emulsifying agent to transform into a transparent solution, but these blends can tolerate up to only 0.5% water [83]. Therefore, solubility improving agents have not been used in this study that excluded modification of the tested fuels and thus potential side effects on the ignition delay, combustion, and exhaust emissions.
Also, it should be noted that ethanol differs as having the lowest C/H atoms ratio, which is essential for clean combustion to effectively reduce smoke under critically high loads with a lack of airborne oxygen in the cylinder. Secondly, due to lower stoichiometric air/fuel ratio less fresh airborne oxygen will be consumed to burn the fuel completely, which certainly contributes to a better ambient air quality in densely populated metropolitan cities. These beneficial features of ethanol in a company with its well-known cooling effect can be utilized in practice bearing in mind that the NOx formation relies (primary) on the in-cylinder temperature, local oxygen concentration, the residence time limited by the combustion reactions, and relative (overall) air/fuel ratio [82], but depends less on the availability of the local oxygen [18]. As a result, using of the fuels oxygenated with ethanol has the potential to reduce the amount of time needed for clean combustion and to a certain degree of improvement contribute to production of less nitric oxides (NO) when running under the most common loading conditions.
The viscosity of ethanol is 34.3% lower than that of the normal diesel and 52.0% lower than HRD fuel at the temperature of 40 °C. This feature combined with high volatility, saturated vapor pressure, and low surface tension of ethanol improves the atomization quality of fuel blends containing ethanol and the air–fuel mixing rate. The lost cetane number of ethanol–oxygenated fuel blends was restored by high-cetane HRD fuel added in proper proportions to diesel fuel. Also, the potential danger exists that low-viscosity ethanol may reduce lubricity of fuel blend. This, in turn, may increase the wear of sensitive nozzle needle valve units and thus reduce reliability of the fuel system. Nevertheless, reliability of the fuel system will not be exposed to a risk because the lubricity properties of the HRD fuel are much more suitable for the CRDI engine than those of the normal diesel fuel.
The wear scar diameter on ball became by only 10.0%, 5.5%, and 2.1% greater than before due to the respective 5 vol.%, 10 vol.%, and 15 vol.% ethanol additions to diesel fuel at the temperature of 60 °C [30]. Torres-Jimenez et al. [29] also showed that the addition of ethanol to diesel fuel slightly improved lubricity, as the wear scar was lower. Therefore, from an engine durability point of view, blends with up to 15 vol.% ethanol in diesel fuel can be considered relatively safe [70]. Operational problems caused by application of vegetable oils and their esters in various types of electric power stations have been studied by MAN Diesel Corporation and the diagnostic tests results presented by picturesque illustrations in Reference [84]. The test results show that the alternative fuels obtained from fatty acid esters of vegetable oils and their blends with diesel fuel should be carefully evaluated not only from ecological aspects, but also from durability and reliability points of view of such vital units as injectors, crankshafts and piston–cylinder systems.
Vegetable-derived biodiesel as an additive is good diesel fuel quality enhancement due to its excellent lubricity, viscosity, and high cetane number. Biodiesel does not contain polycyclic aromatics and delivers fuel-oxygen that may increase oxygen availability in the fuel-rich zones. The presence of extra fuel-oxygen accelerates the combustion process and reduces smoke and pollutant emissions under near-stoichiometric conditions [85]. In addition, double bounds containing biodiesel-oxygen with a hydroxyl –OH group proved to be a more active contributor to the combustion reactions than ethanol having strong single bonds with the carbon and the hydrogen atoms [53]. However, more biodiesel-oxygen will be needed to compensate (pay off) for its advantageous features and efficiently improve the combustion reactions because of higher unsaturation of RME. What is more, the Ball On-Cylinder, or BOCLE, test results illustrate that RME provides superior lubricity compared to the commercial low-sulfur diesel fuels [46]. Consequently, a small biodiesel portion premixed with the diesel–HRD fuels suggests advantages in terms of reliability of the fuel system.
Knothe et al. [54] noticed that the lubrication properties of biodiesel mostly depend on ingredients such as “polycyclic aromatic types with sulfur, oxygen, and nitrogen content”. Therefore, the added biodiesel fraction compensates for lower density of HRD fuel suggesting much higher viscosity and excellent lubricity that is essential for its intended mixing with diesel–HRD fuels. The HFRR lubricity tests for the ULSD and GTL biased blends (both fixed at 70% v/v) showed that as little as 5% RME improves lubricity of ULSD/GTL blends dramatically [86]. Also, biodiesel is biodegradable, nontoxic, free of sulfur, renewable, and typically produced from the local oil–plant resources and agricultural residues.
Unfortunately, RME contains much heavier hydrocarbons and differs as having the highest flash and initial/final boiling points with a very narrow of only 20 °C temperature interval in between these critical temperature points. This fact along with having lower volatility of a larger in diameter biodiesel droplets and the highest autoignition temperature among other alternative fuels, may affect the ignition quality, combustion duration, and related emissions. The higher total contamination and the presence of water in RME composition may additionally stimulate the impact of these detrimental conditions. Net heating values of well-oxygenated ethanol and biodiesel are 37.3% and 13.4% lower than that of the diesel fuel, respectively. Nevertheless, most of the fuels used in internal combustion engines today include alcohols or biodiesel with such heating values due to their renewable nature [87].
The biofuel portions injected by mass, and especially by volume, should be correspondingly bigger to compensate for the resulting lower stoichiometric air/fuel ratio and heating value of the fuel, and thus maintain the needed energy inputs per engine cycle. The 6.1% higher density of biodiesel compared to the normal diesel fuel compensates to some degree of improvement for its lower heating value. On the contrary, the lowest energy density possessing ethanol does not ready to contribute with an essential help to avoid the engine power losses that may result in a larger than before volumetric fuel delivery per cycle and thus longer injection duration. The C/H atoms ratio of ethanol is the lowest among others, but its net heating value is also low because ethanol contains 3.2 times more oxygen than biodiesel. Since stoichiometric air/fuel ratios for biodiesel and especially ethanol are much lower compared to a fossil diesel and HRD fuels, less airborne oxygen will be needed to burn the fuel completely and thus the reduction in smoke and CO emissions may occur.
Ethanol–oxygen enrichment rate increased within the range of 0 to 4.52 wt%, which resulted in a density, C/H atoms ratio, and viscosity of 2.0%, 8.6%, and 8.0%, respectively, relatively lower for fuel blend E5 compared to the respective values of the reference fuel E0/B0. On the contrary, the biodiesel–oxygen mass content increased within the same range (B5), the C/H atoms ratio reduced by 1.1%, while the other parameters such as density and viscosity increased by 2.5% and even 35.6%, respectively. The opposing developing trends of main parameters of the fuels create a new challenge to be considered how the differences in physical properties may affect the injection characteristics, development of the fuel sprays, atomization and vaporization quality, SOC, and the combustion attributes. The net heating value of the fuels containing ethanol decreased more intensively due to the low energy content of ethanol added to the blend compared to the respective values of biodiesel counterparts (Table 4). Despite of the widely differing net heating values of ethanol and biodiesel, the heating energy in MJ/kg of the fuels E0–E5 and B0–B5 remained essentially the same for overall identical ‘lambda’ ratio of λ = 1.25 corresponding to a fully loaded engine operation.
On the one part, the added ethanol reduces flash point and improves volatility of the fuel that increases the local air/fuel ratios in very fuel-rich chamber zones that may lead to clean combustion and less smoke produced under high load operation. This is because the evaporation process of ethanol proceeds at a temperature ~ 100 °C lower than that of the diesel fuel. Low molecular weight and the absence of sulfur in ethanol composition may contribute to production of less soot, PM and smoke for the same engine loads. On the other part, low cetane number of ethanol, affected by high autoignition temperature and latent heat of evaporation between 840 kJ/kg [59] and 880 kJ/kg [57], along with cooling effect of the fuel sprays, may have a negative impact on the ignition quality and cyclic variability of operational parameters. Therefore, relatively more renewable HRD fuel than into the respective biodiesel-oxygenated fuels was added to restore lost cetane number, compensate for the low net heating value, viscosity, and other detrimental features of ethanol.
It is important for analysis that the amount of heat energy released from combustion of diesel fuel and the fuels E0–E5 or B0–B5 identically oxygenated with ethanol or biodiesel was almost the same as 2.232 MJ/kg (DF) and 2.242–2.226 or 2.242–2.229 MJ/kg for relative (overall) air/fuel ratio of λ = 1.25. While the decrease (more observable in biodiesel case) of stoichiometric air/fuel ratio with increasing fuel-oxygen enrichment rate shows that then less atmospheric airborne oxygen will be consumed to complete burning of the fuel. Because the stoichiometric air/fuel ratio of the most oxygenated fuels E5 or B5 is approximately 14.0 or 13.8, respectively, and that of the diesel fuel is ~14.5, this means that the respective air/E5 or air/B5 biofuel mixtures will reach stoichiometric conditions nearly 3.4% or 4.7% faster than the air/diesel fuel mixture.
The relative differences in reaching stoichiometric conditions for the most oxygenated fuels E5 and B5 will be even greater, 4.0% and 5.3%, if compared to the reference air/E0/B0 fuel mixture that will affect the combustion process and emissions. The cetane number of RME is high, which means biodiesel addition to fuel blends does not create any autoignition problems. However, low-volatility and high-viscosity of biodiesel will affect physical phase of compression ignition delay (physical factor) through potentially higher heterogeneity of the air/fuel mixture, which is prone to autoignition under lower load and thus temperature inside the cylinder. On the contrary, the air/fuel mixture prepared with the involvement of ethanol will be more homogeneous because ethanol is highly volatile, but its cetane number is extremely low that in a company with high autoignition temperature may contribute to production of more NOx due to harsher combustion when running under near-stoichiometric conditions.
5. The Engine Test Results, Analysis and Discussions
5.1. Autoignition of Fuel Blends of Various Origins and Oxygenation Rates, but Still Possessing the Same Cetane Number
The effects made by the differing properties of ethanol, n-butanol, and diethyl ether in blends with the normal diesel fuel, neat biodiesel, rapeseed oil, cottonseed oil, and various concentrations with the diesel fuel and biodiesels of various origins on the start of injection (SOI), start of combustion (SOC), ignition delay period, combustion characteristics, cyclic variability, engine efficiency, exhaust smoke, and emissions have been studied by many researchers [31,32,33]. Special investigation of distributor-type fuel injection pumps disclosed that biodiesel with higher velocity of sound and the lower bulk (compression) modulus differs as having a faster pressure rise (steeper slope) and earlier injection timing compared to petroleum [88]. While the injection timing of biodiesel retarded with bioethanol addition and injection delay increased due to lower density of bioethanol [89]. The above findings are important because as variations in the SOI occur, the ignition delay period reacts respectively.
It should be noted, that the injection timing of a pilot fuel portion was computer-controlled to occur at ~30° CADs BTDC when running under medium load at a constant speed of 2000 rpm with its following advance by 2.0° and 8.0° CADs, respectively, after transition to intermediate and full loads. Therefore, the SOI occurred earlier in an engine cycle BTDC to attain well-timed autoignition and complete combustion of bigger fuel portions injected and develops maximum power. The earlier SOI provides more time needed to improve quality of the air–fuel mixture before it catches on fire. This is the answer to the potential question why the ignition delay did not decrease with engine load increased from intermediate to its full value (Figure 4), as could be expected with traditional fuel system. The ignition delay occurred relatively later in the cycle because the oxidation reactions of the fuel started well before TDC at a lower pressure (temperature) inside the cylinder when running under full load.
The SOI of a pilot fuel portion occurred 0.5° (E5) or 0.3° CADs (B5) later in the cycle than that the value of 38.3° for CADs BTDC measured with oxygen-free fuel E0/B0 under full load at constant (2000 rpm) speed. The resulting difference in SOI was equal to only 0.9° or 0.7° CADs if compared to a straight diesel operation. In result, the SOC of a main fuel portion occurred 0.3° CADs earlier (E5) in the cycle or did not change (B5) at all due to fuel-oxygen mass content increased from zero to maximum value of 4.52 wt%. Once there was a difference in SOC, the following combustion was also changed [50], but small variations in the air temperature inside the cylinder probably did not significantly affect the ignition delay. Although the present research does not analyze the computer’s control system effects, while focusing mainly on the fuel-oxygen and/or the fuel property-related effects on the ignition quality and the combustion process.
Apart from cetane number, the ignition delay is predominantly controlled by the temperature, total air excess ratio in the cylinder at the SOC and chemistry of the fuel. Because CN is a key factor responsible for reliable compression ignition in a Diesel engine [74], the fuels were designed in such a way to preserve the blended cetane number of a constant value, even though these fuels possessed identical ethanol–oxygen or biodiesel-oxygen mass contents. The solution of this task was challenging but possible because the designed fuels were produced from different biomass resources and included the original components with the widely differing cetane ratings and fuel-bound oxygen contents. The eleven experimental fuel blends were produced by pouring the precalculated quantities of ethanol or biodiesel to fuel blends as can be seen in Figure 3. Changes in the ignition delay of a pilot fuel portion revealed with the experimental fuels are compared with those values the combustion of the fuel E0/B0 and/or a straight diesel produces for the respective loading conditions.
Analysis of the columns in Figure 4 shows that the ignition delay period progressively increased by 3.9%, 4.5%, 7.1%, 9.0%, and 12.9% for ethanol–oxygenated fuels E1–E5 against 7.75° CADs, over which the reference blend E0/B0 catches on fire under medium load. Such unusual ignition’s behavior would be ascribed to the lost cetane number of the blended fuel as in the most common diesel–ethanol fuel tests, but in the current study, the attempt was made to rule out the influence of a major ignition quality control factor from consideration. While, simultaneously, the ignition delay increased with a lesser than before degree of extension in response to biodiesel–oxygen enrichment within the same 0–4.52 wt% range probably due to higher heterogeneity of combustible mixture. The ignition delay period (in CADs) initially was 0.4% shorter (B1), then concerted to be relatively 3.2%, 4.5%, 4.5%, and 7.1% longer for the respective biodiesel-oxygenated fuels B2–B5. In general, the ignition delay was always longer for each one of the tested fuels, the higher was ethanol–oxygen or biodiesel-oxygen enrichment rate when running under medium (50% of full) load at least.
Despite the blended cetane number was kept of a constant value with increasing ethanol–oxygen or biodiesel-oxygen mass content, the ignition delay of a pilot fuel portion was always somewhat longer for ethanol–oxygenated fuels E1–E5 than for their respective biodiesel counterparts B1–B5. The extremely low cetane number of ethanol further aggravated by nearly four times higher specific latent heat of vaporization and high autoignition temperature of ~363 °C extended the preignition reactions, including oxidation and cracking of some fuel components. As a result, the ignition delay of homogeneous air–fuel mixture was almost always relatively longer when running with fuel blends containing ethanol under medium loading conditions. This finding rests on the fact that the higher the homogeneity of the air–ethanol fuel mixture, the less likely it would be ready to self-ignition, especially when the temperature inside the cylinder is relatively low.
Marinov [90] revealed that OH radical’s primary role is to oxidize the ethanol. Hence, the added ethanol decreases the amount of –OH radicals and therefore retards the ignition time. Du [13] also noted that blends E10 and E20 have longer ignition and soot formation delays than pure diesel. This finding matches well with the results obtained in this study because the ignition delay also was relatively longer for each one of the ethanol–oxygenated fuel than those values of 8.15° and 7.32° CADs a straight diesel exhibits operating under medium and intermediate loads (Figure 4). Although, the ignition delay period has changed in a different way with increasing fuel-oxygen enrichment rate than in the most common studies when the blended cetane number suffers modification with every next portion of ethanol or biodiesel added to the diesel fuel. While the ignition delay’s measurements taken from a light-duty DI Diesel engine powered with alternative diesel and jet fuels showed no discernible dependence on engine load or other fuel properties that are independent of DCN, within the reproducibility of ignition delay [91].
The ignition delay changed to be relatively 8.4% and 10.2% shorter for oxygen-free blend E0/B0 and the normal diesel fuel because of the increased pressure in the cylinder after transition from medium (50%) to intermediate (80%) load. The higher temperature as a major the oxidation reactions influencing factor shortened the ignition delay for both fuels containing ethanol or biodiesel. Again, the increased fuel-oxygen enrichment rate caused dissimilar effects on the ignition delay. To be precise, the ignition delay was approximately 2.8%/7.0%, 5.6%/5.6%, 9.9%/12.7%, 7.0%/11.3%, and 8.5%/19.7% longer due to ethanol/biodiesel-oxygen content gradually increased from zero level (E0/B0) to maximum of 4.52 wt% (E5/B5) than that value of 7.10° CADs over which the reference blend E0/B0 autoignites under intermediate load. Because the in-cylinder temperature was higher than before, the ignition delay time for fuel blends containing ethanol converted to be relatively shorter with the difference between the two E and B fuel groups being higher, the higher the fuel-oxygen enrichment rate. The biggest ignition delays of 7.8° and 8.5° CADs exhibited the fuels E3 (2.71 wt%) and B5 (4.52 wt%) compared to that, 7.1° CADs, over which the fuel E0/B0 catches on fire under intermediate load.
Since the SOI was considerably advanced, the preignition oxidation reactions shifted towards a lower temperature region before TDC, and therefore the autoignition delay became relatively longer. This, in turn, provided more time to vaporize the fuel droplets completely and establish proper mixing of the air and the fuel vapors, which is vital for the higher fuel delivery rate after transition from intermediate to full load operation. In result, the ignition delay increased by 19.7% and 11.3% for the reference fuel E0/B0 and the normal diesel, respectively, against the corresponding values, 7.10° and 7.32° CADs, measured under intermediate load. The ignition delay was 7.6% (E1) shorter or slightly 1.8% (B1) longer, then converted to be relatively 7.1%/8.2%, 2.4%/1.2%, 6.5%/7.1%, and 8.2%/10.6% shorter due to ethanol/biodiesel-oxygen gradual enrichment from zero level (E0/B0) to a maximum value of 4.52 wt% (E5/B5) against 8.50° CADs, over which the fuel E0/B0 autoignites.
It should be noted that the ignition delay converted to be relatively 4.1% shorter for the diesel fuel compared to that value of 8.5° CADs over which the reference fuel E0/B0 catches on fire under high load. This fact demonstrates that the higher heterogeneity of the air–fuel mixture seems as being more vigorous the ignition promoting factor than the cetane number of the fuel if or when the in-cylinder temperature is high enough to contribute with an essential help (Figure 4.). The fuel-oxygen-activated effects on the duration of ignition period are fundamentally reliant on the engine loading conditions and the in-cylinder temperature at which the widely differing properties of ethanol or biodiesel can be most significant, but nevertheless remain dependent on how much the blended cetane number itself contributes with to autoignite the fuel. Otherwise, when the blended cetane number decreases (as in the most common cases) with every next portion of ethanol added into the diesel fuel, then would be completely different (hi)story about the fuel-oxygen effects on the combustion process and the NOx production [30].
After the ignition delay has reached certain degree of extension of 8.3° (E3) or 8.4° CADs (B3), it did not longer increase neither with the addition of ethanol nor biodiesel to the blend, but rather decreased for both E and B fuel groups with the fuel-oxygen enrichment rate increased beyond the rational 2.71 wt% degree of improvement. Kulmanakov et al. [92] showed that the presence of biodiesel in fuel blends increases the heterogeneity of the fuel jets, thereby causing relatively shorter ignition delay over the entire range of injection pressures of 60 to 160 MPa. A dissimilar (opposing) response of the ignition delay to the increased ethanol–oxygen or biodiesel-oxygen enrichment rate under various engine loads may affect the combustion process, variations of IMEP, and the peak in-cylinder pressure at higher blending ratios.
While the ignition delay of a main fuel portion did not change greatly neither with the fuel-oxygen enrichment rate nor with the fuel properties, the SOC changed by +(1.72–1.20°) for blends E1–E5 or +(1.50–1.30° CADs After Top Dead Center—ATDC) for blends B2–B5 when running at medium load, and −(0.90–1.25°) for blends E1–E5 or −(1.15–1.20° CADs BTDC) for blends B2–B5 when running under full load. The only minor, 0.33° CADs (+) ATDC (E2) to 0.25° CADs (−) BTDC (B5), variations in the SOC emerged under intermediate load as well. Thus, the added ethanol or biodiesel to the fuel does not affect significantly the SOC when high-pressure CRDI system is used to increase the efficiency of an engine. Therefore, it is important to consider if the blended cetane number naturally changes with every next portion of ethanol or biodiesel added to the fuel or is intentionally kept at the same level.
5.2. Combustion of the Fuels of Various Origins and Oxygenation Rates, but Still Possessing the Same Cetane Number
Figure 5a,b presents the changing trends in maximum heat release rate (a) and its location angle ATDC (b) depending on the ethanol–oxygen or biodiesel-oxygen enrichment rate in diesel–HRD fuel blends when running an engine under medium (50%), intermediate (80%), and full (100%) loads corresponding to IMEPs of 0.75, 1.20, and 1.50 MPa developed at a speed of 2000 rpm. The fuel-oxygen mass content for the two fuel groups was identically increased within the same range of 0 to 4.52 wt% to make the study more educational. Analysis of columns in Figure 5a shows that the fuel-oxygen mass content increased up to a certain degree of improvement and positively affected the development of heat release rate from combustion of oxygenated fuel blends of both origins at all engine loads.
In both cases, the fuel-oxygen enrichment increased up to a certain degree of improvement 3.61 wt% (E4 or B4), which resulted in a relatively small 1.3% increase in maximum heat release rate against the respective value of 47.8 J/deg. the combustion of the reference fuel E0/B0 develops under medium load. Although, the improvement of HRRmax was relatively better (3.4%) if compared to that value of 46.8 J/deg., a straight diesel produces for considered loading conditions. This fact shows that the fuel-oxygen enrichment rate does not play an important role in the premixed combustion reactions and thus the development of maximum heat release rate when in the cylinder still is a plenty of air-oxygen as indicates overall high relative air/fuel ratio of 2.40 corresponding to the normal diesel operation at medium load.
The fuel-oxygen showed another advantage supporting the combustion reactions of overall richer air/fuel mixtures characterized by λ = 1.63 and 1.23 typical for the normal diesel operation under intermediate and full loads. The combustion of ethanol–oxygenated fuel E4 maximum heat release rate increased by the same percentage of 3.2% for both intermediate and full loads. While the relative increase of HRRmax from combustion of the fuel B3 was equal to 3.3% and 3.6%, respectively, compared with the respective values of 63.0 J/deg. and 76.0 J/deg., the combustion of fuel E0/B0 develops under considered loads. It is important to note that the combustion of the fuels E3 or B4 developed HRRmax 15.9% higher than that value of 67.9 J/deg. belonging to a fully loaded straight diesel operation. Hence rationally acceptable oxygenation of the fuels of both origins not only positively affected the premixed combustion reactions, but also the respective angle AHRR shifted by 0.9–0.6° (E3) or 1.1–0.1° CADs (B4) closer to constant cylinder volume thus reducing the heat transfer to the cylinder walls and the cooling system (Figure 5b).
As can be seen in Figure 6a,b, eventual changes in burn angle mass burn fraction MBF 50 (a) and the end of combustion representing burn angle MBF 90 value for 90% of the mass burned fuel (b), caused by the combustion of the fuels containing various percentages (wt%) of the fuel-oxygen of different E or B origins, are observable under medium (50%), intermediate (80%), and full (100%) loads. The columns in the center of the figures represent the respective burn angles MBF 50 and MBF 90 belonging to the reference blend E0/B0 and a straight diesel (DF) to have observable catch at a first glance making the comparative analysis of the changing trends more convenient. These loads correspond to the respective values of IMEP = 0.75, 1.20 and 1.50 MPa were calculated by using the AVL BOOST program and the single (averaged) indicator diagrams reflecting the in-cylinder individual pressure traces over the 100 engine cycles versus crank angle.
Analysis of the data in Figure 6a shows that the ethanol–oxygen enrichment rate increased within the range of 0 to 4.52 wt% (E1–E5) and did not produce any (positive or negative) effect on the location distance from TDC of burn angle MBF 50 when running under medium load. While biodiesel-oxygen mass content increased within the same range (B1–B5) resulted in a small delay of the premixed combustion and the location of burn angle MBF 50 shifted by 0.4° CADs away from the constant volume combustion because probably the temperature was not high enough to vaporize the biodiesel components as quickly as possible. It is important to remember that the crank angle consistent with the 50% of mass burned fraction specifies the center of a gravity of the heat release characteristics and thus strongly affects fuel–energy conversion efficiency. Thus, the location with regard to TDC of burn angle MBF 50 almost did not respond to the increased fuel-oxygen enrichment rate for this particular (50%) load. This fact remains in agreement with a late response of the maximum heat release rate HRRmax and its location angle AHRR (Figure 5a,b) because content of the air-oxygen available in the cylinder still was high for the premixed combustion reactions.
The higher ethanol–oxygen or biodiesel-oxygen enrichment rates gained more advantageous impetus after transition to intermediate and the high load operation. The decreasing relative (overall) air/fuel ratio with engine load and increasing the in-cylinder temperature enhanced the role of the fuel-oxygen, which seems to have resulted in an earlier occurrence of maximum heat release rate compared to the respective values developed by the combustion of the fuel E0/B0 and a straight diesel (Figure 5b). Because a lack of the air-oxygen was compensated by the fuel-oxygen, the burn angle MBF 50 occurred earlier in the engine cycle, with its location taking place close to constant volume combustion because the increased fuel-oxygen concentration promoted the combustion reactions. In result, burn angle MBF 50 shifted by 1.2° (E4) or 0.7° (B3) and 1.0° (E5) or 0.4° CADs (B3) close to TDC against the respective values of 17.1° and 15.1° CADs ATDC the combustion of the fuel E0/B0 suggests for the respective loads. Unfortunately, the fuel-oxygen contribution was not as significant as could be expected to intensify the premixed combustion reactions and relocate burn angle MBF 50 much closer to constant cylinder volume.
Despite the fuel-oxygen-induced effect on the development of the premixed combustion was relatively small, its contribution to diffusive combustion reactions was not small at all. In result, the specific angle MBF 90, which corresponds to 90% of the mass burned fuel fraction, occurred earlier in the engine cycle that seems to be one of the most beneficial features, especially recognizable under intermediate and full loading conditions (Figure 6b). Again, the improvement (reduction) of the end of combustion was more substantial when running under identical loads with fuel blends oxygenated with ethanol rather than rapeseed biodiesel. The fuel-oxygen enrichment rate increased up to the reasonable degree of improvement of 3.61 wt% resulted in the end of combustion taking place 0.9° and 3.0° (E4) or 0.1° or 2.2° CADs (B4) earlier in an engine cycle. These advantageous changes occurred compared to the combustion of the fuel E0/B0 (33.7°) and the normal diesel fuel (35.8° CADs) ending up after TDC under medium load operation. This means that the combustion process of oxygenated fuels of both origins proceeds much faster and on average with higher flame speeds than that of the normal diesel fuel actually for any engine load.
As soon as an engine started to run with a richer air–fuel mixture under intermediate (80% of full) load, the positive development trends in the combustion process caused by the fuel-oxygen enrichment gained more advantageous perspectives. Because momentary deficiency of the airborne oxygen in some combustion chamber ‘zones’ became limiting factor, fuel blends E3 or B4 took advantage of proper fuel-oxygen mass content. In result, the end of combustion shifted by 3.0° and 4.0° or 2.1° and 3.1° CADs closer to the TDC with regard to the respective values of 40.5° and 41.5° CADs the ATDC combustion of the fuel E0/B0 and the normal diesel fuel ends up under high-load conditions. As could be expected, the end of combustion took place at 6.4° and 12.1° (E4) or 0.6° and 6.3° CADs (B4) earlier in an engine cycle than the respective values of 46.4° and 52.1° CADs; for ATDC, an engine powered with the reference fuel E0/B0 and the normal diesel fuel develops under full (100%) load operation as well. Hence, even though the fuel-oxygen mass content is relatively small, its exclusive role in promoting the diffusive burning controlled reactions and the end of combustion is not small at all.
This engine efficiency improving strategy took advantage because the fuel-oxygen always is right on the spot ready to compensate for the deficiency of the air-oxygen, which normally dominates (by mass) in the combustion process [49]. However, the fuel-oxygen enrichment rate increased beyond the revealed (3.61 wt%) limits did not longer result in a sooner combustion of the fuels neither oxygenated with ethanol nor biodiesel. Instead of providing a help in combustion, the higher than needed fuel-oxygen enrichment rate rather tends to extend the end of diffusive burning that is especially obvious under full load operation with a higher than before fuel delivery rate per engine cycle. This can be attributed to low volatility of biodiesel with a bigger in diameter fuel droplets further aggravated by the highest among the tested fuels both initial and final boiling points that negatively affects the vaporization characteristics of RME and extends the diffusive combustion reactions during the expansion stroke.
In the considered circumstances, the widely differing chemical structures and physical properties of the added ethanol or biodiesel to fuel blends caused the most evidential and dissimilar effects on specific angle MBF 90 associated with the end of combustion (MBF 90), namely when running under full load. These important changes in the combustion process were revealed even though the blended cetane numbers and the fuel-oxygen enrichment rates both highly influencing factors were identical for both fuel groups tested at a constant speed of 2000 rpm (Figure 6). It was found that the injection delay and the total injection duration of biodiesel (B100) increased against the respective values the diesel fuel exhibits at the same delivery rate (by volume) and injection pressure of 100 MPa [93]. Therefore, it is most likely that the respective changes in the fuel injection parameters contributed to the end of combustion occurring later in the cycle (MBF 90) when operating with the most biodiesel-oxygenated fuel B5 under full load conditions.
In contrast to with the biodiesel case, ethanol, as a highly volatile liquid with the highest H/C atoms ratio, improved the injection and atomization quality of the fuel, which, to a certain degree, compensated for its negative properties associated with high autoignition temperature, low cetane number, and heating value. Special tests conducted with a Diesel engine disclosed that the initial spray cone angle converts to a wider and smaller Sauter Mean Diameter (SMD) when using a lighter GTL fuel with lower values of density, final boiling point, and viscosity [94]. The test results of an optically accessible, Diesel engine also showed that the spray length of a lighter JP-8 fuel is 16% shorter, but this drawback is compensated by the 15.9° wider initial cone angle compared to the normal diesel fuel at the injection pressure of 30 MPa [95]. The shorter liquid fuel spray penetration of ethanol–oxygenated blends probably was compensated by a wider initial cone angle of the fuel sprays and faster evaporation of fuel droplets. This way of improvement ethanol–oxygenated fuels took advantage in the combustion process through higher than before the air/fuel vapors mixing rate and a larger accessible surface area of the fuel patterns exposed to the high-temperature environment.
In brief, the combustion of the tested fuel blends ended up earlier in an engine cycle when using as fuel oxygenator a lighter ethanol rather than heavier biodiesel with the difference in the ends of combustion higher, the higher the fuel-oxygen enrichment rate and engine load. Higher density, viscosity, C/H ratio, surface tension, and initial/final boiling points of RME combined with other biodiesel composition-dependent parameters worsened the quality of the air–fuel mixture and contributed to slower combustion of the fuel in the diffusive phase. However, the attempt to separate the effects made by the differing chemical composition and physical properties of the fuels to get a deeper knowledge about how much each of the above factors affects the combustion process and identify the contribution margins is too difficult task to be realized by the experimental practice.
The columns in Figure 7 show the changing trends of the coefficient of variation (COV) of the Indicated Mean Effective Pressure (IMEP) developed over the 100 consecutive engine cycles in respond to ethanol–oxygen or biodiesel-oxygen enrichment rate increased within the same range of 0–4.52 wt% for medium (50%), intermediate (80%), and full (100%) loads at a constant speed of 2000 rpm. The investigation of the coefficient of variation of IMEP as a parameter representing the cycle-to-cycle variability is an important optional task because its analysis provides sensitive information about how the cyclic irregularity in the indicated power developed can vary under different loading conditions depending on the fuel-oxygen enrichment rate and properties of the fuels when the blended cetane number value remains the same.
The observed changing trends in the coefficient of variation (COV) of IMEP show that the engine indicated power did not change greatly with increasing fuel-oxygen mass (wt%) content with neither the fuels containing ethanol E1–E5 nor their respective biodiesel counterparts B1–B5 when running under medium load. Actually, the COV of indicated pressure sustained at the levels below 1.25% or 1.20% when using the rationally ethanol–oxygenated (E4) or biodiesel-oxygenated (B3) fuels. The cycle-to-cycle variability of IMEP increased to maximum value of 4.3% (6.6 times) or slightly less 2.6% (4.0 times) in response to the smallest portion (0.91 wt%) of ethanol (E1) or the biggest portion (4.52 wt%) of biodiesel (B5) added to the fuel mainly after transition to intermediate load. Because the randomness (stochastic nature) of the fluctuation phenomena, it is difficult to point out what reasons are hidden beyond this not-so-simple phenomenon. Analysis of Figures 7 and 9 suggests that it would be not a good idea to run an engine on oxygenated fuels involving only a small fraction of ethanol or, on the contrary, containing too big volume (or mass) of biodiesel. This is because the cycle-to-cycle irregularity of operational parameters has tendency to increase when using these blends even though the blended cetane number is high enough to cope with the ignition problems.
Analysis of the figures shows that the fuel possessing the biggest ethanol–oxygen enrichment rate (E5) effectively reduces the cyclic variation of the indicated power (IMEP), while, on the contrary, biodiesel-oxygen enrichment within the same range of 0–4.52 wt% tends to increase the cycle-to-cycle irregularity of IMEP. This is especially obvious for a slightly more than 2.71 wt% (B3) biodiesel-oxygen-treated air–fuel mixtures used under intermediate (80%) loading conditions (Figure 7). The dissimilar development trends in the COVs of IMEP probably contributed the fact that these fuels contained relatively about threefold more (by mass) biodiesel needed to achieve the same fuel-oxygen enrichment rate as in the ethanol case. In result, the combustion of plenty biodiesel-oxygenated fuels proceeded, more likely, under evaporation controlled conditions rather than under air–fuel mixing controlled conditions as determined in Reference [27]. It is difficult to predict how the cyclic variations of IMEP (Figure 7) and pressure pmax (Figure 9) could be developed if the blended cetane number of the fuels would not be intentionally preserved of a high value to alleviate the fuel ignition.
The higher in-cylinder pressure (temperature) contributed to the reduction of COVs of the IMEP values and led to more stable combustion reactions typical for full load operation under near-stoichiometric conditions. Since ethanol-bound oxygen gained more advantages owing to higher temperature in the chamber, the highest 1.9% COV of IMEP suggested the combustion of ethanol–oxygenated fuel E2 (1.81 wt%), but the cycle-to-cycle irregularity of IMEP gradually decreased with every next percentage of ethanol–oxygen in the fuel blend and reached minimum value of 1.25% for the case of E5—the most oxygenated blend. On the contrary, the COV of IMEP tended to increase with every next portion of biodiesel added to the fuel and reached maximum value of 1.40% (B4) which is similar to that its counterpart blend E4 suggests for a fully loaded engine. In general, the combustion of the fuels of both origins proceeded in a stable manner without any indications of erratic operation accompanied by the COVs of IMEP comparable with those values the normal diesel produces under full load conditions. Thus, the fuel-oxygen enrichment rate with ethanol or biodiesel can be increased to as much as 4.52 wt% without any negative impact on operational parameters of an engine.
5.3. Maximum In-Cylinder Pressure Developed by the Combustion of the Fuels of Various Origins and Oxygenation Rates
It can be seen in Figure 8a,b that the increased fuel-oxygen mass content did not have measureable effect neither on maximum in-cylinder pressure pmax (a) nor on its location angle Apmax with regard to TDC (b) when running an engine with E or B series fuels under medium load. The obtained results are coherent with the relatively small changes that occurred in HRRmax and its location angle ATDC because both parameters are strongly interconnected, while the role of the fuel-oxygen seems to be less important as long as in the cylinder still is plenty of the air-oxygen (λ ≈ 2.40–2.43) available for premixed combustion. Therefore, maximum in-cylinder pressure was 3.2% (E5) or 3.8% (B5) lower than that of 91 bar the combustion of the fuel E0/B0 develops at medium load. The reduction in pmax occurred primarily due to the resulting increase the in-cylinder volume because specific angle Apmax moved by 0.5 to 0.6° CADS away from TDC against that value of 13.1° ATDC the combustion of the fuel E0/B0 develops under medium load. At the same time, the respective maximum in-cylinder pressure still was slightly (1.0% (E5) or 0.3% (B5)) higher than the value of 87.2 bar that a straight diesel develops under medium load operation.
The fuel-oxygen gained more advantages in the combustion reactions because more oxygen was needed to burn bigger than before fuel portions injected to keep the engine power. However, the contribution of fuel-oxygen to the premixed combustion remains dependent on the quality of mixing and vaporization of the liquid fuel, its composition and oxidation chemistry, temperature inside the cylinder, and the presence of strong single (E) or weak double (B) bonds of the carbon and the oxygen atoms in the molecules. The combined contribution of many factors resulted in maximum gas pressure 4.6% (E3) and 4.3% (E3) or 3.9% (B4) and 1.1% (B5) higher than the respective values of 99.6 and 119.8 bars; the combustion of the fuel E0/B0 develops under intermediate and full loads. Maximum pressure and thus the temperature increased with a slightly higher than before intensity due to the increased fuel-oxygen enrichment rate because the mixtures were relatively richer when running under high load and, therefore, fuel-bound oxygen was more combustion effective [40]. At the same time, the combustion characteristics of the fuels containing ethanol or biodiesel caused dissimilar quantitative effects on the development of HRRmax (Figure 5a,b), and therefore in a different way affected maximum gas pressure in the cylinder.
Analysis of the data shows (Figure 8a) that ~2.71 wt% of ethanol–oxygen (E3) was consumed to developed maximum pressure of the gasses in the cylinder, while for complete combustion of fuel blends B4 and B5 containing biodiesel, more fuel-oxygen (3.61 and 4.52 wt%) was needed to develop relatively lower than before maximum in-cylinder pressure under intermediate and full loads. The specific angle Apmax changed erratically with increasing fuel-oxygen enrichment rate showing a tendency to increase up to a certain degree of extension when running under medium and intermediate loads. While the combustion of fuel blends oxygenated with ethanol or biodiesel the location of specific angle Apmax changed only a little ±0.1° or 0.2° CADs against that value of 12.5° CADs ATDC at which the burning of the reference fuel E0/B0 maximum in-cylinder pressure develops under full load operation.
The differing properties of the fuels combined with the dissimilar accessibility of fuel-oxygen in the combustion process caused the noted differences in maximum pressure pmax in the cylinder and its location angle Apmax after TDC developed under near-stoichiometric conditions. Apart of the mixture quality, the combustion reactions depend on the presence of strong (ethanol) or week (biodiesel) the carbon atoms bounds with –OH radicals in the molecular. Besides, both specific angles AHRR (Figure 5b) and Apmax (Figure 8b) were found to be slightly bigger when running with each one of the fuels used herein, i.e., both E and B fuel groups under intermediate load compared with their respective values measured under medium and full load operation. This intriguing behavior of specific angles, representing the combustion history, matches well with the computer settings and by the ECU-made relatively small (2° CADs) advance in the SOI thus establishing the shortest ignition delay (Figure 4) measured under intermediate load conditions.
Diagrams in Figure 9 present dependencies of the coefficient of variation (COV) of maximum gas pressure developed over the 100 consecutive engine cycles as a function of ethanol–oxygen or biodiesel-oxygen mass content (wt%) for medium (50%), intermediate (80%) and full (100%) loads at maximum torque speed of 2000 rpm. This coefficient of variation characterizes the cyclic irregularity of maximum in-cylinder pressure and provides valuable information about how much the combustion of fuel blends of various origins affected operational parameters under various loads when ethanol–oxygen or biodiesel-oxygen mass contents and the blended cetane numbers are essentially the same.
In general, the cyclic variation of maximum in-cylinder pressure sustained well below the value of 1.0% without almost any response to the increased fuel-oxygen enrichment rate when operating under medium load. A low level of COVs of pmax was measured when running under intermediate load as well, except for the two columns sticking out for combustion of slightly ethanol–oxygenated fuels E1 (7.8%) and E3 (4.5%) or too highly biodiesel-oxygenated fuels B4 (5.3%) and B5 (5.6%). Thus, the combustion of the fuels containing ethanol or biodiesel proceeded smoothly, and COVs of pmax were more or less comparable with that value of 2.4%, which a straight diesel exhibits under full load operation. However, the COV of maximum pressure values of the gasses boosted up to 3.4–3.8% or 3.0–3.8% when running with slightly ethanol-oxygenated fuels E1–E2 or, on the contrary, too highly biodiesel-oxygenated fuels B4–B5 under near-stoichiometric conditions.
As one of the goals of the research is to find out how the cycle-to-cycle variation of maximum in-cylinder pressure depends on the fuel properties, it can be seen in Figure 9 that there is a significant difference between the values of COVs measured with fuel blends containing ethanol and their respective biodiesel counterparts. The biggest cyclic variation (COV) of maximum in-cylinder pressure pmax (HRRmax as well) produced the combustion of slightly ethanol–oxygenated (0.91–2.71 wt%) fuels, while, on the contrary, the biggest COVs of the main operational parameters generated the combustion of the most biodiesel-oxygenated (3.61–4.52 wt%) fuels when running under full load. The noted differences in pressure pmax and coefficient of variation COV of pmax can be ascribed to the differing densities, viscosities, surface tensions, and the evaporation rates of the tested fuels. Both interrelated combustion parameters such as maximum heat release rate HRRmax in the premixed combustion stage (Figure 5a) and maximum in-cylinder pressure pmax (Figure 8a) were relatively higher with ethanol–oxygenated fuel blends than the combustion of the normal diesel fuel that develops under full load operation. The noted differences in maximum pressure of the gasses and the coefficient of the cyclic variation of pressure values will affect indicated thermal efficiency developed by an engine, fuel economy, smoke, and exhaust emissions.
6. The Engine Performance Efficiency, Exhaust Smoke, Pollutant Emissions, and Discussions
6.1. Dependencies of Specific Fuel Consumption and Engine Efficiency on the Fuel-Oxygen Mass Content of Various Origins
The fuel-oxygen-induced effects on Indicated Specific Fuel Consumption (ISFC) and Indicated Thermal Efficiency (ITE) of an engine have not been experimentally investigated before with the fuels of various origins, while, at the same time, preserving the blended cetane number to effectively improve the ignition quality and the combustion process for each one of the engine loads. The 100 consecutive engine cycles averaged pressure-data of the in-cylinder gasses, the measured fuel mass flow rate, and the net heating values of the tested fuel blends have been used to estimate eventual changes occurring in the indicated specific fuel consumption. As Figure 10 shows, the ISFC values were found to be reasonably higher because the fuel-oxygen mass content increased up to a certain degree of improvement, which was mainly because of the reduced net heating value of the fuel; however the increment rate of ISFC was different for each one of the fuels tested under various engine loads.
As can be seen in Figure 10, the overall level of ISFC was relatively higher for the fuels containing ethanol (E) because more less calorific fuel has to be consumed to achieve the same (50% of full) load. While, on the contrary, ISFC increased more intensively when operating with fuel blends involving biodiesel (B) under the high load with the increment rate being higher, the higher biodiesel-oxygen enrichment rate. The ISFC was relatively 8.4%, 3.5%, and 2.0% higher for the most (4.52 wt%) ethanol–oxygenated fuel E5, while the relative increase in ISFC was more extensive, 9.7%, 5.8%, and 7.7%, than before for the identical biodiesel counterpart B5 compared to the respective values of 205.5, 192.8, and 201.4 g(kWh)−1 of the reference fuel E0/B0 measured under medium, intermediate, and full load conditions.
Bearing in mind that net heating values of the most oxygenated fuels were relatively 4.4% (E5) or 5.6% (B5) lower, it becomes clear that the obtained increase in ISFC was not the only reason leading to more fuel consumed per unit of energy developed. The noted difference specific fuel consumption was higher, the higher fuel-oxygen enrichment rate and load, which was especially noticeable when operating with biodiesel-oxygenated fuels at a full engine power. While the indicated specific fuel consumption almost did not change with every next portion of ethanol added to the blend and, therefore, the ISFC values look highly similar when running a fully loaded engine with the fuels E1 and E5 containing different amounts of ethanol. This intriguing (unusual) result was possible because the increased Indicated Thermal Efficiency (ITE) with ethanol–oxygen enrichment compensated for the lowest heating value of a lighter ethanol that did not happen in the biodiesel case (Figure 11) under these test conditions (CN constant).
At the same time, the ISFC values for the most oxygenated fuels containing ethanol or biodiesel varied within less extensive limits of ±2.3–3.3% (E5) or ±4.6–0.9% (B5) compared to a straight diesel operation under each one of the tested loads. The increase in ISFC occurred because the net heating value was reduced by the presence of ethanol–oxygen or biodiesel-oxygen in the composition of fuel blends (Table 4). Taking into account collective contribution of many influencing factors may provide an essential help in searching for the answer why the same fuel-oxygen enrichment rate of the fuel series E or B produced the dissimilar effects on ISFC. The matter is that the ignition quality, combustion history, HRRmax, and the end of diffusive combustion were additionally affected by the differing densities, viscosities, surface tensions (physical factor), C/H atoms ratios, hydrogen mass (wt%) contents, stoichiometric air/fuel ratios, and net heating values (chemical factor), on which the effective help of the fuel-oxygen largely depends. In any case, the lower is ISFC, the less fuel will be consumed to produce the engine power and less harm will be done to the environment.
As can be seen in Figure 11, the Indicated Thermal Efficiency (ITE) has also experienced positive or negative changes, while being relatively 4.7% (E1) to 1.7% (E4) higher or 0.5% (B2) higher to even 3.4% (B5) lower than that efficiency value of 0.406 the combustion of the reference fuel E0/B0 develops under medium load operation. Special attention should be cast to the fact that an extra fuel-oxygen seems does not seem to be as important as could be expected, if or when in the cylinder still has enough airborne oxygen (λ = 2.40–2.43) to burn the fuel completely with practically invisible smoke (Figure 14) and CO emissions (Figure 15). This is especially a case for the fuels oxygenated with biodiesel because after reaching the maximum efficiency value of 0.408 developed by the combustion of the fuel B2 (1.81 wt%) the ITE of an engine deteriorates with every next portion of biodiesel added to the blend when running under medium (50% of full) engine load.
In such a case, the side effects created by specific compositions of ethanol or biodiesel added to the blend may cause more damage to the air–fuel mixture quality and combustion attributes, and thus the engine efficiency than the combustion process related benefits made by the fuel-oxygen enrichment would be able to compensate completely. Nevertheless, the combustion of the reasonably oxygenated fuel blends of E and B origins produced the ITE 8.4% (E4) or 10.9% (B2) higher than that value of 0.368 a straight diesel develops under medium load operation. It seems that the only way to withdraw more efficiency as much as possible from an engine powered with the fuels containing biodiesel is to operate with a relatively small (B2) fuel-oxygen enrichment rate of ~1.81 wt% with overall leaner air–fuel mixture under medium load, while acceptable (helpful) ethanol–oxygen enrichment rate 3.61 wt% seems to be twice as much higher (E4) for the same (medium) loading conditions.
Fuel-oxygen seems to more positively affect the combustion process, engine efficiency, CO, THC, and smoke (soot) emissions when running under intermediate and full loads with overall richer air–fuel mixtures as well. As shown in Figure 11, the engine efficiency was decreased by 2.1% (E1)/1.8% (B1) for the lowest fuel-oxygen enrichment rate of 0.91 wt%, then was converted to be relatively 1.8%/0.2%, 2.3%/0.0%, 2.8%/1.4%, and 0.9%/0.0% higher when using the respective fuels of E2/B2-E5/B5 than that efficiency value of 0.434 the combustion of the fuel E0/B0 develops under intermediate load conditions. This load appears to provide the most suitable the air–fuel ratio (λ ≈ 1.65) at which the fuel-oxygen enrichment up to the reasonable (3.61 wt%) degree of improvement is the most helpful in promoting the oxidation reactions of the hydrogen and the carbon suggesting the highest ITE values of 0.446 (E4) or 0.440 (B4) developed by the combustion of the respective fuels. The obtained results match well with the shortest (within the tested range) premixed combustion (MBF 50) and the diffusive combustion (MBF 90) ended earlier in an engine cycle under intermediate loading conditions (Figure 6a,b). In general, the engine efficiency was always higher to a certain degree of fuel-oxygen enrichment when running with the fuels containing ethanol rather than biodiesel under intermediate and full load conditions.
Although, the fuel-oxygen enrichment, up to the reasonable degree of improvement, compensates for the potential damage done by the differing properties of the two fuel groups and improves the combustion process reducing burn angle MBF 50 and especially the duration of the diffusive burning (MBF 90), and consequently causes heat losses of the cooling system. Positive changes in the combustion history slightly increased maximum pressure inside the cylinder (Figure 8a) and the respective angle Apmax (Figure 8b) shifted closer to fuel–energy saving constant volume combustion that is important for the engine efficiency. Due to clean combustion of oxygenated fuels E4 or B4, exhaust smoke (Figure 14) and CO emissions (Figure 15) decreased to nearly the ground level thus contributing to the highest engine efficiency developed under intermediate load. The fact that the burned ethanol forms relatively more moles of the exhaust, which gives higher pressure and more power in the expansion stroke [50], also contributed to achieve the highest ITE of an engine. Giakoumis et al. [31] also reported that, in spite of the specific fuel consumption owing to the alcohol’s lower calorific value, the engine efficiency is slightly greater.
However, the ITE converted to be lower than before for each one of the fuels tested after transition to full load operation conditions because (overall) relative air/fuel ratio decreased to the most critical fuel enrichment value of λ ≈ 1.25–1.21. Once a major reduction in the overall air/fuel ratio occurred, the engine efficiency increased with increasing ethanol-oxygen enrichment to remain relatively at 0.7% (E2), 1.4% (E3), 3.1% (E4), and 2.4% (E5) higher levels than the reference value of 0.415 the combustion of the fuel E0/B0 develops under full load conditions. In contrast to ethanol case, biodiesel as oxygenator source proved itself as less effective measure to advance the combustion process (Figure 6b), reduce heat losses to the cooling system, and improve the engine efficiency when it is the mostly needed. Therefore, the ITE converted to be even 2.7% (B3) and 0.7% (B4) lower due to biodiesel added to the fuel against that value of 0.415 the combustion of the fuel E0/B0 suggests, but still sustained at 2.5% (B3) to 4.6% (B4) higher levels than that of 0.394, which a straight Diesel engine develops under full load operation.
Not as worthy as could be expected the impact of biodiesel-oxygen on the engine efficiency raised the question why this may happen at all if there in the cylinder was a lack of the airborne oxygen to burn the fuel completely under near-stoichiometric conditions. Most likely, the answer is hidden beyond the differing (specific) properties of biodiesel those proved themselves as an important contributing factor which may positively or negatively affect the combustion history of the fuel depending on the temperature conditions in the cylinder. In considered case, the relatively lower ITE developed by the combustion of biodiesel-containing fuel blends was escorted by higher exhaust smoke (Figure 14) and CO emissions (Figure 15) produced under near-stoichiometric conditions. Analysis of the test results shows how the differing properties of fuel blends can efficiently contribute with an essential help when using ethanol as oxygenator source or maybe without any observable help if biodiesel is added to the diesel fuel aiming to enhance the oxidation reactions, engine efficiency, and emissions running up from a fully loaded engine. This conclusion remains in value if or when both key factors such as the fuel-oxygen enrichment rate and the blended cetane number are identical in both E and B fuel groups tested.
The need for fuel-oxygen depends on the deficiency or surplus of the air-oxygen in the cylinder. As an engine runs under full load, the mixture becomes too rich in some combustion chamber ‘zones’ because of a lack of oxygen to react with all the carbon. In such a case, the help of an extra fuel-oxygen is very acceptable. However, after the fuel-oxygen enrichment rate reaches ~3.61 wt%, which seems to be just enough to burn the fuel completely, it no longer efficiently supports the combustion process. Therefore, the maximum values of heat release rate (Figure 5a) and pressure of the gases within the cylinder (Figure 8a), both the most important parameters affecting engine efficiency, did not increase any more as well. Thus, the combustion reactions are strongly dependent on the vaporization and its vapors mixing rate with residual air-oxygen in the cylinder that seems to affect more positively when fuel blends containing ethanol are used rather than biodiesel due to their higher both H/C atoms ratios and heating values of the fuels as listed in Table 4.
The air-inlet oxygen enrichment seems to be one of the most attractive combustion technologies to control pollution and improve combustion quality in a compression ignition environment at any load, while the role of the fuel-oxygen in promoting the diffusive combustion reactions gained more advantages to burn the fuel completely, reduce smoke, and pollutant emissions mainly for a fully loaded engine [18]. This is because even after the mixture leaves the combustion chamber, additional reactions take place in the exhaust (and after-treatment) system, further reducing the amount of solid carbon. Despite the fact, the fuel-oxygen enrichment beyond the revealed rational limits does not longer offer any appreciable benefits in engine efficiency and fuel economy; nevertheless, this strategy seems to have a positive influence on defeating the traditionally problematic Diesel engine smoke-NOx trade-off [32].
6.2. Dependencies of Total Nitrogen Oxide NOx Emissions on the Ethanol–Oxygen or Biodiesel–Oxygen Enrichment Rate
Nitrogen oxides produced from combustion in the Diesel engine are among the most harmful gasses because they contribute to the formation of photochemical smog and acid rain that can have significant effect on the environment and human health. The biggest contribution (90%) in total NOx production provides nitric oxide (NO), next is nitrogen dioxide (NO2) (5–10% of NO), and what is left belongs to nitrous oxide N2O—a colorless gas with a pleasant odor known as ‘laughing’ gas. Due to uneven fuel distribution in the cylinder, nitric oxide is usually formed in close to stoichiometric combustion ‘zones’ beyond the flame front under high temperature above 2000 K in the oxidation reactions of airborne molecular nitrogen (N2) [48] with the contribution of crude fuel-nitrogen if it was not properly processed at the refinery [15,16,17].
McCormick et al. [3] showed that the production of NOx from a heavy duty engine fuelled with a group of seven biodiesels increased with increasing number of double bonds, fuel density, or decreasing cetane number. Since the fuels with larger fractions of unsaturated species have higher density and lower H/C ratio, their combustion may produce more NO emissions. The research on the combustion of biodiesel and second-generation biofuels showed that the NOx production has tendency to increase with increasing biodiesel blend level, but the magnitude of this effect differs for different feed-stacks, engines, and cycles [5]. The injection pressure increased up to 300 MPa and the creation of a very small nozzle holes in combination with the high boost pressure reduced smoke (soot), but the production of nitrogen oxides NOx increased with increasing injection pressure of the fuel [68]. Since the combustion temperature plays a key role in the NOx production, these species can be radically reduced only in homogeneous charge compression ignition (HCCI) engines operating at the low temperature utilizing a lean, premixed homogeneous air/fuel mixture [96,97,98].
A review of the biodiesel chemical properties made effects on total nitrogen oxides showing that NOx emissions increased with increasing unsaturation, but emissions decreased with increasing chain length [25]. In contrast to ethanol, the chemical structure CH3(CH2)nCOOCH3 of RME predicts that some part of oxygen is in double bounds with radicals that increases oxidation chances and leads to cleaner combustion and fewer CO and THC exhaust emissions [53]. However, the presence of double bounds in a company with the dissimilar ignition delays and adiabatic flame temperatures affects the production of NOx as well. The heterogeneous air–fuel mixture contributes to uneven temperature distribution in the cylinder, and therefore stimulates the formation of nitric oxide NO, which always dominates in NOx production. It was shown that the increased engine load is escorted by a higher the peak burning zone temperature, a fact that enforces the NO formation mechanism [18]. Since pressure and temperature of the gases inside the cylinder increased with engine load, the production of NO reasonably increased as well, but its increment rate still depended on whether the tested fuel blends were oxygenated with ethanol or biodiesel [41].
As concerns the effect of the fuel-oxygen enrichment rate of NOx production, it can vary depending on the origin of biomass and technology used for extraction of biodiesel from biomass. Therefore, the changing trends in the NOx emissions behavior were found as being somewhat dissimilar, even though each one of the two fuel groups possessed the same blended cetane number and identical fuel-oxygen mass content. In general, the maximum values of NOx emissions always were higher when running with the fuels containing ethanol E1–E5 rather than with their respective biodiesel counterparts B1–B5, oxygen-free fuel E0/B0, and straight diesel. Faster vaporization of liquid ethanol fraction combined with higher HRRmax and gas pressure (temperature) increment rates inside the cylinder contributed to the production of more NOx emissions. On the contrary, the combustion of the fuels containing ethanol E1–E5 produced about the same NOx emissions than their biodiesel-counterparts B1–B5, but with rather opposing development trends due to probably too low temperature inside the cylinder typical for medium load.
At the same time, the combustion of identically (1.81 wt%) ethanol–oxygenated or biodiesel-oxygenated fuels produced NOx emissions of 9.5% or 2.4%, much more than that of 635 ppm for the combustion of the reference fuel E0/B0 under medium load. Again, for the same fuel-oxygen enrichment rate, NOx emissions were 5.3% higher than for the combustion of ethanol–oxygenated fuel (E2) or, on the contrary, 1.5% lower from biodiesel-oxygenated fuel (B2) than a straight Diesel engine produces. The NOx emissions significantly increased for both fuel groups with any fuel-oxygen enrichment rate and the normal diesel fuel only after transition to intermediate and full loads (Figure 12). An almost linear increase in NOx production occurred due to the increased up to a certain degree of improvement of fuel-oxygen mass content, with a slightly higher increment rate measured when operating under full load rather than an intermediate one because of relatively richer mixtures and higher temperatures where fuel-oxygen is more active in NO production.
The potential causes of the increased emissions could be attributed to non-stoichiometric combustion, dissociation of nitrogen, impurities in the fuel and air, and the high temperature inside the cylinder [50]. Therefore, the combustion of the fuel E0/B0 produced NOx emissions 59.8% and 2.3 times as much more after transition from mediate to intermediate and full load conditions, while the normal diesel transition within the same load-ranges the NOx production increased by 58.3% and twice as much, respectively. Despite the combustion ended (MBF 90) earlier in the cycle and thus the exposure time to high-temperature environment for the fuels containing ethanol was relatively shorter, the increase in NOx emissions was more intensive than for their respective biodiesel-counterparts. The NOx production was 10.3% (E2) and 21.1% (E3), or 12.3% and 7.3% (B4) higher than the respective values of 1015 and 1445 ppm the combustion of the fuel E0/B0 produces under intermediate and full loads. Fortunately, the NOx emissions sustained at the acceptable level and did not exceed 1120 ppm (E2) or 1140 ppm (B4) when the engine operated with the highest efficiency under intermediate loading conditions (Figure 11). For this way of analyses, critical limits of fuel-oxygen enrichment rates were revealed beyond which the combustion of biofuels does not longer produce the maximum values of total nitrogen oxides higher neither with every next portion of ethanol nor biodiesel added to the blend (CN constant) under high load conditions at maximum torque speed of 2000 rpm (Figure 12).
The mechanisms (pathways) through which the fuel-oxygen enrichment rate comes into the action to effectively slow down the NOx production with every next portion of ethanol or biodiesel added to diesel–HRD fuel blend seem to be completely different and intriguing ones. Bringing pieces of all the evidential clues together provides a wider view of the studied subject and helps to solve this advanced phenomenon. It seems that the high volatility and low single-boiling point of ethanol improved the air/ethanol mixing rate and the homogeneity of the in-cylinder charge that in a company with the high evaporative cooling effect reduced the NOx production for higher than before (2.71 wt%) ethanol blending ratios. While, on the contrary, both the low volatility and the high initial/final boiling points of biodiesel increased the heterogeneity of the combustible mixture to shorten the ignition delay (Figure 4), reduce the maximum pressure of the gases inside the cylinder (Figure 8a), and the temperature-related NOx emissions for higher than before (3.61 wt%) biodiesel blending ratios.
This was a key piece of the puzzle that allowed for a major breakthrough in searching for the answer of why and how the widely differing properties of the fuels series E and B eventually worked in a very similar way regarding turning the NOx production back into gradual slowdown after the fuel-oxygen enrichment rate increased beyond the rational (from engine efficiency point of view) limits. The revealed phenomenon rests hidden (undetected) for a while due to too low temperature of the gases in the cylinder typical for medium load. However, its contributing effect in reducing NOx emerges after transition to full load operation together with the increased fuel delivery rate per engine cycle, relative amount of ethanol–oxygen or biodiesel-oxygen participating in the combustion reactions, and the temperature inside the cylinder.
Hence, in terms of the stimulating role of ethanol or biodiesel in the NOx production, both oxygenators are equally important if or when they are used in the rational quantities in the diesel fuel under specified loading conditions. Bearing in mind that the end of combustion is very sensitive to physical properties of the fuel (Figure 6b), it would be better to use ethanol as oxygenator source to enhance combustion when operating at a higher speed because the time of the cycle available for the combustion reactions is extremely limited. While, on the contrary, biodiesel as a fossil fuel substitute can be regarded as a more effective measure to increase the blended cetane number and provide an extra fuel-oxygen for efficient combustion when operating under full load conditions at a lower speed and, thus, allow more time to perform the engine cycle.
Because of a higher stoichiometric air/fuel ratio and thus net heating value, the combustion of ethanol–oxygenated fuels E1–E5 proceeded at somewhat higher relative (overall) air/fuel ratios of λ ≈ 1.25–1.28, while their respective biodiesel counterparts B1–B5 were imposed to burn at relatively lower ‘lambda’ values of λ ≈ 1.19–1.21, and presumably suffered a lack of airborne oxygen for the NOx production under full load conditions. Therefore, an engine powered with the fuel E3 containing 2.71 wt% of ethanol–oxygen, the NOx emitted 32.6% more than that value of 1320 ppm a fully loaded straight diesel produces. At the same time, a greater amount of biodiesel-oxygen was consumed (3.61 wt%) to increase the NOx production by 17.4% for the same engine load. Fortunately, the fuel-oxygen enrichment rate increased beyond the revealed critical limits caused the decrease of NOx emissions with the deceleration rate still dependent on the deficiency or surplus of the airborne oxygen and the temperature inside the cylinder [56,99].
Nitrogen dioxide NO2 is a reddish-brown gas with a pungent odor, which creates ozone and acid rains in the atmosphere; therefore, its reduction is an important task to improve both the environment and standards of human living. In contrast to the behavior of NO (NOx), NO2 emissions showed, with some exceptions for blends’ E3 and B5 cases, declining tendencies with increasing load. The NO2 production progressively decreased with engine load demonstrating 29.3, 29.2, and 26.9 ppm from combustion of the fuel E0/B0 and 31.2, 28.6, and 19.8 ppm for a straight diesel as well (Figure 13). Again, maximum NO2 emissions were relatively higher when running with ethanol–oxygenated fuel E2 (27.3%) rather than identically oxygenated biodiesel counterpart B2 (17.4%) under medium load. Fortunately, NO2 emissions converted to be lower for both E and B fuel groups due to fuel-oxygen enrichment rate increased beyond the revealed critical limit of about 1.81 wt% for any load, with an exception for the most biodiesel-oxygenated fuel B5 the combustion of which produces the biggest amount of NO2 emission namely under full load operation.
As load increased, it created higher gas temperature inside the cylinder and the exhaust system as well that contributed to conversion of NO2 into N2 and O2, thus reducing the measured nitrogen dioxide emissions. Despite the fact, NO2 emissions showed the declining tendencies with engine load, their maximum values still were relatively 32.3% (E2) or 75.8% (B5) higher than the combustion of the fuel E0/B0 produces under full load operation. The respective emissions were significantly 79.8% or nearly 2.4 times higher than the value of 19.8 ppm that a straight diesel develops as well. Higher NO2 emissions produced by the combustion of the most (4.52 wt%) biodiesel-oxygenated fuel B5 match well with (compensate for) the lower total NOx emissions (Figure 12) emitted over relatively longer period of the diffusive combustion (Figure 6b).
The production of exhaust smoke, CO, and THC emissions in the Diesel engine is a complex process. Therefore, the numerical investigations have been conducted in the HCCI process [100,101] and the normal Diesel engines using a single-zone [75] or two-zone advanced combustion models [18] to put more light on the potential effects made by the fuel composition and the fuel-oxygen enrichment rate on this complex phenomenon. Through comparison of the collected quantitative and qualitative data, reflecting the changing trends in exhaust smoke and the other emissions with the computational results obtained under identical loads or relative air/fuel ratios ‘lambda’, it is possible to achieve the most conclusive results. Therefore, the experimental data can be used in the computational models for approving comparisons of numerical studies.
Soot appears in a Diesel engine at the temperatures between 1000 and 2800 K and pressures of 50 to 100 bars, and with enough air overall to burn the fuel [48]. This occurs because the fuel and air first react in a fuel-rich mixture, leading to soot formation then this rich mixture burns out in a high-temperature diffusion flame at the jet periphery, leading to NOx formation [58]. Since exhaust smoke was controlled with a ”Bosch” RTT 110/RTT 110 opacity-meter in Hartridge units (%), the obtained opacity measurements include both paths of production a black soot formed from pyrolysis of a carbon and bright-colored vapors with a very small fuel droplets emerging from incomplete combustion of hydrocarbons. This is the circumstance to be taken for consideration when evaluating the smoke opacity measurements from combustion of the fuels containing a lighter, highly volatile ethanol or heavy, less volatile biodiesel.
The fuel-oxygen enrichment rate increased up to a certain degree of improvement proved itself as an effective measure to reduce exhaust smoke when running with the fuels of both origins under any load, but the measured opacity of the exhaust decreased in a different way because of the differing chemical composition and physical properties of the tested fuels. As can be seen in Figure 14, smoke opacity was exclusively low and varied within the measurement accuracy limits when running under medium (50% of full) load. The amount of exhaust smoke did not exceed 2–3% opacity limits from combustion of the fuels of both origins and a straight diesel when operating under intermediate load as well. For this reason, no substantial differences in smoke (soot) production were found neither between the tested fuel groups nor between each of the above fuel blends within the same fuel group when running an engine under medium and intermediate loads. Significant reduction in exhaust smoke was achieved due to innovative design of a turbocharged CRDI Diesel engine, its good technical state, and high quality of the fuel.
Smoke of the exhaust increased only after transition to full load operation, but still remained far below the critical limits allowable by the EU emissions standards. Because relative (overall) air/fuel ratio decreased for close to stoichiometric conditions, the positive fuel-oxygen effects on the end of combustion (Figure 6b), smoke reduction in the diffusive burning, and the other related emissions gained more advantages. This is because increased the need for additional fuel-oxygen to compensate for the resulting deficiency of the air-oxygen in the fuel-rich combustion chamber zones where unburned fuel vapors may convert into solid soot particles at elevated temperatures. In such circumstances, the fuel-oxygen enrichment with ethanol or biodiesel turned into a rapid positive response resulting in significant reduction of smoke (soot), since the engine suffered a lack of the air-oxygen. Nevertheless, the effects made by the differing properties of the fuels are clearly observable, even though the fuel-oxygen enrichment rate was identically increased in both fuel groups while keeping the blended cetane number of a constant value.
As Figure 14 shows, exhaust smoke from a fully loaded engine progressively decreased by 17.0% and 52.1%, then as much as 2.4, 2.9, and 2.8 times in response to the ethanol–oxygen enrichment rate increased within the range of 0 to 4.52 wt% in the respective fuels of E1–E5. The reduction in smoke was higher, the higher the percentage of ethanol involved into the blend. The main benefit from the use of ethanol during (steady-state) Diesel engine operation is the significant reduction of PM/smoke, due to the highest oxygen content of the fuel [102]. This advantageous feature of ethanol suggests further benefits because about three times as much lower amount of ethanol will be consumed to achieve the fuel-oxygen enrichment rate identical as that in the biodiesel case (Figure 3). Apart from the noted positive features of ethanol as oxygenator source, to the reduction of exhaust opacity also contributed the absence of sulfur and aromatics those are prone to create soot precursors [31].
On the contrary, the opacity of the exhaust was relatively (compared to ethanol case) higher when powering an engine under full load with the fuels containing biodiesel. The biodiesel-oxygen-induced effects on the combustion process, indicated thermal efficiency, and thus soot emissions were found as being dissimilar compared to the ethanol case. Advantages associated with the lower NOx emissions (Figure 12) converted into disadvantages escorted, as a trade-off, by higher smoke density streaming up from combustion of slightly 0.91 wt% (B1) and the most (4.54 wt%) biodiesel-oxygenated B5 fuels (Figure 14). This fact is coherent with the end of combustion taking place latter in the cycle (Figure 6b), relatively lower maximum pressure in the cylinder (Figure 8a) and ITE (Figure 11) affected by incomplete combustion of the fuel. Putting the facts all together indicates that predominates the mechanism of premixed combustion control the role of which is higher, the higher the blending ratio (fuel-oxygen increment rate) of the fuel containing biodiesel. Although, the soot emitted from incomplete combustion of the fuels containing biodiesel was always lower than 19.4%, which a straight diesel produces under near-stoichiometric conditions.
The second potential reason why the reduction in smoke opacity was more prominent for the fuels containing ethanol can be ascribed to slightly dissimilar coefficients of the stoichiometric conditions. The matter is that the mixture was a bit leaner with overall air/fuel ratio value of λ ≈ 1.28 for the most ethanol–oxygenated fuel E5 than that of λ ≈ 1.21 measured when operating with its biodiesel counterpart B5 under full load (Table 4). High density, viscosity, and C/H ratio in company with high boiling points of RME further impeded by limited temperature-interval between critical temperature points caused higher opacity of the exhaust (including unburned fuel vapors), even though the fuel-oxygen mass content was identically increased in both fuel groups. The smoke production initially was 69.1% (B1) higher, then converted to be relatively 14.9%, 27.8%, and 32.0% lower due to biodiesel-oxygen enrichment up to the rational (3.61 wt%) degree of improvement (within B2-B4) than that value of 9.7% measured with the fuel E0/B0 to increase ones again to the maximum value of 9.0% (B5) under full load operation. Lower smoke verifies the “beneficial effect of fuel-bound oxygen of both fuel-origins on soot oxidation than formation at crucial (rich) places” [40].
As concerns the potential effect of CO2 emissions on global warming and the climate change, the achieving of carbon neutrality in France and the rest of the EU requires unprecedented efforts in finding the proper solutions to guarantee high leaving standards for the future generations by the year 2050. The Finnish scientists have already made a major step ahead developing the innovative second-generation production technology of renewable hydrocarbon biofuels, including HRD fuel also called as “green” diesel to offset the carbons and slow down the global warming. The greenhouse emissions can be reduced by 40 to 60% over the entire life cycle by using renewable HRD fuel in agricultural, industrial, and transport sectors [62]. Gowdagiri et al. [91] noted that the combustion of alternative diesel and jet fuels produced by advanced hydroprocessing technology suggests the reduction in CO emissions as well.
Analysis of the test results shows that the combustion process, and thus makeup of CO2 and CO emissions, can be dissimilar for each one of the tested fuels and dependent on the original fuel components involved and the combustion peculiarities, even though these blends possess identical both the blended cetane number and the fuel-oxygen concentration. The combustion of oxygenated fuel blends the production of CO emissions reduced to a very low level, which varied between 25–35 ppm (E) or 15–85 ppm (B) when running under medium-intermediate loads, while the burning of the reference, oxygen-free fuel E0/B0 and the normal diesel fuel produced 42–46 ppm and 28–42 ppm, respectively. As ethanol has a lighter nature, CO emissions from the combustion of fuel blends containing ethanol were significantly lower than their respective biodiesel counterparts produce under high load operation as well (Figure 15). The reduction of CO emissions seems a normal and expected outcome caused by lower density, viscosity, C/H ratio, and faster evaporation of ethanol that, combined with the improved homogeneity of the air and the fuel mixture, resulted in a cleaner combustion.
As engine load increased to the highest level, the most obvious differences in CO emissions between the two fuel groups emerged under near-stoichiometric combustion conditions. Because the air-oxygen concentration became critically low, the ethanol–oxygen enrichment, up to the reasonable degree of improvement (2.71 wt%), effectively reduced the CO production by a fully loaded engine. These emissions were 20.1% (E1), 51.8% (E2), and even 4.0 times lower (E3), and then increased again, but were still sustained at 3.0 (E4) and 2.3 (E5) times lower levels when operating with more ethanol–oxygenated fuels than 1640 ppm, the value that the combustion of the fuel E0/B0 produces. The CO production from combustion of ethanol–oxygenated fuels was reduced as much as 2.0 (E1) to 6.3 times (E3) against that value of 2630 ppm a fully loaded straight diesel produces. Unfortunately, lower exhaust smoke and CO emissions were escorted by higher maximum values of NOx emitted from combustion of the fuels containing ethanol. The higher NOx emissions can be associated with relatively premixed combustion, which probably prevailed when operating with ethanol–oxygenated blends as in the JP-8 fuel case [103].
On the contrary, ~3.2 times as much richer biodiesel concentration (by mass) was needed to obtain the fuel-oxygen mass contents identical to their respective ethanol–oxygenated counterparts. This formed a fuel-richer mixture in some zones, the combustion of which produced relatively less NOx (Figure 12), but generated more NO2 emissions (Figure 13) and exhaust smoke (Figure 14) under near-stoichiometric conditions. As in the ethanol-case, the highest (2350 ppm) CO emission values were measured from combustion of the fuel B1 possessing the smallest (0.91 wt%) biodiesel-oxygen fraction (Figure 15). However, CO emissions progressively decreased by 12.2%, 17.7%, 27.4%, and 45.1% when running with the fuels containing more biodiesel B2–B5 against that value of 1640 ppm, which the combustion of the fuel E0/B0 produces. These emissions were from 10.6% (B1) to nearly 3.0 times (B5) lower than 2630 ppm, the value that a straight diesel produces under full load operation. The lower smoke and CO emissions emitted from combustion of the rationally oxygenated fuels of both origins are coherent with the test results of studies [9,32] and findings of other researchers [59,77].
The numerical studies take advantage of an opportunity to solve the problem associated with side effects, while by the experimental tests it is almost impossible to separate the effect made by the fuel-oxygen itself from those results produced by the total combined contribution of many accompanying factors. However, one unique feature is obvious: the combustion of the fuels containing ethanol or biodiesel in their composition always produces more THC emissions than the reference, oxygen-free fuel E0/B0 and the normal diesel fuel for medium and intermediate loads (Figure 16). The combustion of oxygenated fuels of both origins produced THC more under full load operation as well, only ethanol–oxygenated fuels E1 and E4 suggested THC emissions approximately 23.4% and 34.4% less than that value of 1045 ppm the combustion of the reference fuel E0/B0 produces under these conditions.
In general, the combustion of the fuels E2, E3, and E5 produced THC emission levels comparable with that value of 955 ppm a straight diesel emits under full load operation. At the same time, THC emissions boosted up erratically with increasing biodiesel-oxygen enrichment rate because of the negative impact caused by specific properties of biodiesel (mentioned above) that contributed to the formation of fuel-rich zones in some combustion chamber parts. This can be one of the potential reasons why the maximum values of THC emissions were in the biodiesel-oxygen enrichment order (B1–B5) 25.8%, 28.2%, 9.1%, 7.7%, and 20.6% higher than the combustion of the fuel E0/B0 produces under full load conditions. In fact, the noted differences in the THC emissions are even greater if compared of them to a straight diesel operation.
One of the reasons why the combustion of biodiesel-oxygenated fuels formed relatively more smoke, CO, and THC emissions can be attributed to richer mixtures because overall air/fuel ratios were slightly lower than those values their respective ethanol–oxygenated counterparts have had opportunity to realize in practice. Even a small difference in the mixture quality can have significant effect on the formation of soot particles under near-stoichiometric conditions [48]. The combustion of ethanol–oxygenated fuel E4 produced THC emissions relatively 34.4% and 28.3% less, while, on the contrary, for its identically oxygenated (3.61 wt%) biodiesel counterpart B4, the THC production increased by 7.7% and 17.8% against the respective values of 1045 and 955 ppm for the combustion of E0/B0 and straight diesel under full load operation. Hence, the collective contribution of the differing properties of the fuels dominates over the fuel-oxygen-made effects on the combustion attributes and thus THC emissions under given test conditions at least.
The potential side effects caused by the differing physical properties of the fuels containing ethanol or biodiesel were suppressed to a certain degree of improvement by a modern high-pressure CRDI fuel system and intensive the air–fuel mixing rate in an OMEGA-shaped combustion chamber in the piston head of a turbocharged Diesel engine. These beneficial features of an engine have been achieved through advanced production technology that made it possible to smooth up to a certain degree of improvement the fuel physical properties-created side effects on the combustion process and exhaust emissions. This has greatly facilitated the investigation of fuel-oxygen made effects on the engine operational parameters when other contributing factors such as the cetane number, engine load and speed were taken under control to realize the planned tasks of the study.
7. Conclusions
The paper presents the effects made by diesel–HRD fuel blends containing ethanol or biodiesel on the ignition delay, combustion history, cyclic variations of maximum in-cylinder pressure and IMEP, exhaust smoke, and emissions of a turbocharged CRDI Diesel engine operating under medium (50% of full load), intermediate (80% of full load), and full (100%) engine loads at maximum torque speed of 2000 rpm. The effects caused by the fuel-oxygen enrichment rate and the differing properties of the fuels on the engine operational parameters were investigated, while preserving the blended cetane number value at the high (55.5) level to assure reliable autoignition of the fuels. At the same time, the fuel-oxygen mass content was identically increased within the same range of 0 (E0/B0), 0.91 (E1/B1), 1.81 (E2/B2), 2.71 (E3/B3), 3.61 (E4/B4), and 4.52 wt% (E5/B5) for both E and B fuel groups to make the study more informative.
The evaluation on a comparative bases the fuel-oxygen-made effects on the combustion process, the cyclic variability (irregularity), exhaust smoke, and emissions is a difficult task because adding ethanol or biodiesel to traditional fuels leads to dissimilar changing trends in densities, viscosities, vaporization qualities, cooling effects, C/H ratios, stoichiometric air/fuel ratios, combustion intensities and related emissions. Nevertheless, the revealed qualitative changing trends in combustion and heat release characteristics in a company with the experimentally collected quantitative data related with the contribution of the fuels of various origins and oxygenation rates to the combustion process and emissions can be useful for validating of computerized packages used in theoretical and advanced time-saving numerical studies.
The high-pressure CRDI fuel system improved atomization of the fuel bringing it to the highest quality limits that smoothed the potential effects made by the differing physical properties of ethanol or biodiesel on the combustion process and engine out emissions. However, the differing chemical structure and physical properties of the fuels in a different way affected autoignition and the combustion processes when running under various loads and thus availability of the airborne oxygen in the cylinder. The study results demonstrate the increased significance of the fuel-oxygen with increasing engine load. Even though the fuel-oxygen mass content and its contribution to the premixed combustion seem as being relatively small compared to that of the air-oxygen, its role in advancing diffusive controlled reactions and the end of combustion is not small at all. This is because the fuel-oxygen is always ready to burn the fuel completely when there a major part of airborne oxygen about to be consumed over the premixed combustion stage.
The engine test results show that fuel-oxygen mass content increased from zero to maximum value of 4.52 wt% in diesel–HRD fuel blends containing ethanol (E) or biodiesel (B), but still retaining the same blended cetane number, led to the following changes in the combustion history and emissions when running under medium (50% of full), intermediate (80% of full) and full (100%) loads at constant speed of 2000 rpm:
- The ignition delay increased with a higher increment rate for the fuels containing ethanol E5 (12.9%) than biodiesel B5 (7.1%) when running under medium load, while the delay converted to be relatively 19.7% longer for the fuel B5 and 8.5% longer for identical fuel E5 when running under intermediate load. After the ignition delay period has reached certain degree of extension 8.3° (E3) or 8.4° CADs (B3), it becomes shorter with every next fuel-oxygen enrichment percentage in both E and B fuel groups when running under full load.
- Maximum heat release rate was 3.2% and 15.5% (E4), or 3.6% and 15.9% (B3) higher than the respective values of 76.0 and 67.9 J/deg. the combustion of the fuel E0/B0 and a straight diesel develop. Burn angle MBF 50 shifted by 1.0° (E5) or 0.5° CADs (B3) closer to TDC against that value of 15.1° CADs ATDC measured with the fuel E0/B0. The combustion ended 6.4° (E4) or 0.6° (B4) and 12.1° (E4) or 6.3° CADs (B4) earlier in the cycle than those values of 46.4° and 52.1° CADs ATDC measured with the fuel E0/B0 and a straight diesel under full load.
- Maximum in-cylinder pressure was 4.3% (E3) or 1.1% (B5) higher than that value of 119.8 bar the combustion of the reference fuel E0/B0 develops. The COVs of IMEP compiled 1.25% when running with both the most oxygenated (4.52 wt%) fuels E5 or B5, while the COV of maximum pressure (pmax) was equal to only 0.85% (E5) or was 1.6 times as much higher (B5) than the value of 2.4% that a straight diesel produces under full load.
- Indicated Specific Fuel Consumption (ISFC) was 2.0% (E5) or 7.7% (B5) higher than, 201.4 g(kWh)−1, the reference fuel E0/B0 suggests under full load operation conditions. While Indicated Thermal Efficiency (ITE) compensated for this drawback suggesting 0.7% (E2), 1.4% (E3), 3.1% (E4), and 2.4% (E5) higher efficiency than that of 0.415 the combustion of the fuel E0/B0 develops, while the engine efficiency converted to be relatively 2.7% (B3) and 2.0% (B5) lower due to biodiesel-oxygen enrichment increased beyond these critical limits.
- The NOx production was 10.3% (E2) and 21.1% (E3), or 12.3% (B4) and 7.3% (B4) higher than the respective values of 1015 and 1445 ppm for the combustion of the reference fuel E0/B0 under intermediate (80% of full) and full (100%) loads. On the contrary, smoke of the exhaust was 2.9 times as much (E4) or 32.0% (B4) lower due to the fuel-oxygen enrichment rate increased up to the rational (3.61 wt%) degree of improvement than that value of 9.7% the combustion of the reference fuel E0/B0 produces under full load operation.
- The combustion of the fuel E3 produced CO emissions 4.0 and 6.3 times as much lower, while the most biodiesel-oxygenated fuel B5 proved itself as being less helpful in the CO emissions reduction 1.8 and 2.9 times against 1640 and 2630 ppm, the values of fuel E0/B0 and straight diesel. THC emissions were 34.4% and 28.3% lower with ethanol–oxygenated fuel E4, or converted to be 7.7% and 17.8% higher with its identical-biodiesel counterpart B4 than, 1045 and 955 ppm, the fuel E0/B0 and a straight diesel produce under full load conditions.
- Finally, the ignition delay was 4.3% longer and HRRmax 10.5% higher, the combustion ended 4.8° CADs (10.1%) earlier in an engine cycle when running with oxygen-free fuel E0/B0 than the respective values that a straight Diesel engine develops under full load operation. I conclusion, the indicated thermal efficiency increased by 5.3% together with the reasonably higher NOx (9.5%), NO2 (35.9%), and THC (9.4%) from combustion of the fuel E0/B0 escorted by 2.0 times lower smoke (soot) and 1.6 times lower CO emissions to preserve the ecological balance.
Author Contributions
G.L.: Conceiving the idea, developing research methodology, data analysis, and writing the final manuscript. S.S.: Developing research methodology, data processing with the AVL BOOST programme, and graphical structure. I.K.: Data collecting and data processing with the AVL BOOST programme. All authors have been involved in the engine tests and have approved the submitted manuscript.
Funding
This research received no external funding.
Acknowledgments
The authors are thankful to the Finnish Company NESTE Oil Ltd., Finland, Porvoo for bringing of second generation HRD fuel and the Lithuanian Company “Rapsoila” Ltd., Mažeikiai for the delivering of biodiesel (RME), both fuels were needed to perform the engine tests. We also acknowledge the Company AVL-AST, Graz, Austria, which, according to the University Partnership Program, has granted to Power and Transport Machinery Engineering Institute of Vytautas Magnus University the AVL-BOOST program that enhanced the reliability and accuracy of the data obtained.
Conflicts of Interest
The authors declare no conflicts of interest.
Nomenclature
The diesel–HRD fuel blends designed in such a way to have various ethanol (E) oxygen mass contents, but still possessing the same blended cetane number value of 55.5:
| E0 | 0.850 DF/0.150 HRD wt%, O = 0.00 wt% |
| E1 | 0.974 (0.804 DF/0.196 HRD)/0.026 E wt%, O = 0.91 wt% |
| E2 | 0.948 (0.755 DF/0.245 HRD)/0.052 E wt%, O = 1.81 wt% |
| E3 | 0.922 (0.704 DF/0.296 HRD)/0.078 E wt%, O = 2.71 wt% |
| E4 | 0.896 (0.650 DF/0.350 HRD)/0.104 E wt%, O = 3.61 wt% |
| E5 | 0.870 (0.592 DF/0.408 HRD)/0.130 E wt%, O = 4.52 wt% |
Diesel–HRD fuel blends designed in such a way to have various biodiesel (B) oxygen mass contents, but still possessing the same blended cetane number value of 55.5:
| B0 | 0.850 DF/0.150 HRD wt%, O = 0.00 wt% |
| B1 | 0.916 (0.835 DF/0.165 HRD)/0.084 B wt%, O = 0.91 wt% |
| B2 | 0.833 (0.817 DF/0.183 HRD)/0.167 B wt%, O = 1.81 wt% |
| B3 | 0.750 (0.795 DF/0.205 HRD)/0.250 B wt%, O = 2.71 wt% |
| B4 | 0.667 (0.768 DF/0.232 HRD)/0.333 B wt%, O = 3.61 wt% |
| B5 | 0.583 (0.733 DF/0.267 HRD)/0.417 B wt%, O = 4.52 wt% |
| DF | fossil-origin diesel fuel (class 1) |
| CO | carbon monoxide, ppm |
| (dp/dφ)max | maximum pressure gradient in the cylinder, bar/deg. CA |
| HRRmax | maximum heat release rate, kJ/(m3∙deg) |
| IMEP | indicated mean effective pressure, MPa |
| ISFC | indicated specific fuel consumption, g(kWh)-1 |
| ITE | indicated thermal efficiency |
| MBF 50 | crank angle corresponding to 50% of mass burned fraction, CADs |
| MBF 90 | crank angle corresponding to 90% of mass burned fraction, CADs |
| NO | nitric oxide, ppm |
| NO2 | nitrogen dioxide, ppm |
| NOx | total emission of nitrogen oxides, ppm |
| pmax | maximum pressure inside the cylinder, MPa |
| SOC | start of combustion, CADs |
| SOI | start of injection, CADs |
Abbreviations
| AHRR | crank angle corresponding to maximum heat release rate, CADs |
| Apmax | crank angle corresponding to maximum pressure in the cylinder, CADs |
| ABDC | after bottom dead center, CADs |
| ATDC | after top dead center, CADs |
| BMEP | brake mean effective pressure |
| BSFC | brake specific fuel consumption |
| BBDC | before bottom dead center, CADs |
| BTDC | before top dead center, CADs |
| BTL | biomass to liquid |
| CAD | crank angle degree |
| COV | coefficient of variation |
| CR | common rail |
| CRDI | common rail direct injection |
| FAME | Fatty Acid Methyl Ester |
| GTL | gas to liquid technology |
| HFRR | high frequency reciprocating rig |
| HRD | hydrotreated renewable diesel |
| HVO | hydrotreated vegetable oil |
| ISFC | indicated specific fuel consumption |
| OHC | over-head camshaft |
| TDC | top dead center |
| THC | total unburned hydrocarbons, ppm |
| SOHC | single over-head camshaft |
References
- Paris Climate Change Deal—Ministers Adopt Historic Agreement to Keep Global Warming “Well below” 2 °C. Available online: http://www.telegraph.co.uk/news/earth/parisclimate-change-conference/12047133/Final-text-of-climate-deal-to-bereleased-imminently.html#update-20151212-1310 (accessed on 15 January 2019).
- Directive 2009/28/EC of the European Parliament and of the Council of 23 April 2009 on the Promotion of the Use of Energy from Renewable Sources and Amending and Subsequently Repealing Directives 2001/77/EC and 2003/30/EC. Available online: Eur-lex.europa.eu (accessed on 15 January 2019).
- McCormick, R.L.; Graboski, M.S.; Alleman, T.L.; Herring, A.M.; Tyson, K.S. Impact of biodiesel source material and chemical structure on emissions of criteria pollutants from a heavy-duty engine. Environ. Sci. Technol. 2001, 35, 1742–1747. [Google Scholar] [CrossRef] [PubMed]
- Rakopoulos, C.D.; Hountalas, D.; Zannis, T.; Levendis, Y. Operational and Environmental Evaluation of Diesel Engines Burning Oxygen-Enriched Intake Air or Oxygen-Enriched Fuels: A Review. SAE Trans. 2004. [Google Scholar] [CrossRef]
- Hajbabaei, M.; Johnson, K.C.; Okamoto, R.A.; Mitchell, A.; Pullman, M.; Durbin, T.D. Evaluation of the Impacts of Biodiesel and Second Generation Biofuels on NOx Emissions for CARB Diesel Fuels. Environ. Sci. Technol. 2012, 46, 9163–9173. [Google Scholar] [CrossRef] [PubMed]
- Tsolakis, A.; Megaritis, A.; Wyszynski, M.L.; Theinnoi, K. Engine performance and emissions of a diesel engine operating on diesel-RME (rapeseed methyl ester) blends with EGR (exhaust gas recirculation). Energy 2007, 32, 2072–2080. [Google Scholar] [CrossRef]
- Rakopoulos, D.C.; Rakopoulos, C.D.; Mavropoulos, G.C.; Kosmadakis, G.M. Investigating the EGR rate and temperature impact on diesel engine combustion and emissions under various injection timings and loads by comprehensive two-zone modeling. Energy 2018, 157, 990–1014. [Google Scholar] [CrossRef]
- Rakopoulos, C.D.; Antonopoulos, K.A.; Rakopoulos, D.C. Experimental heat release analysis and emissions of a HSDI diesel engine fueled with ethanol-diesel fuel blends. Energy 2007, 32, 1791–1808. [Google Scholar] [CrossRef]
- Rakopoulos, D.C.; Rakopoulos, C.D.; Giakoumis, E.G. Impact of properties of vegetable oil, bio-diesel, ethanol and n-butanol on the combustion and emissions of turbocharged HDDI diesel engine operating under steady and transient conditions. Fuel 2015, 156, 1–19. [Google Scholar] [CrossRef]
- Khatchiyan, A.S.; Labeckas, G.S. Effect of Fuel Injection and Diffusion Characteristics on the Heat Release and Supercharged Diesel Engine Parameters; Mashinostroenie: Sankt-Peterburg, Russia, 1982; pp. 7–11. ISSN 0202-1633. (In Russian) [Google Scholar]
- Astakhow, I.V.; Golubkow, L.N.; Trusow, V.I.; Khatchiyan, A.S.; Ryabikin, L.M. Fuel Systems and Efficiency of Diesel Engines; MADI (Moscow Automobile and Highway Institute—State Technical University): Moscow, Russia, 1990; 288p. (In Russian) [Google Scholar]
- Allocca, L.; Mancauso, E.; Montanaro, A.; Sequino, L.; Vaglieco, B.M. (Istituto Motori CNR Via G. Marconi 8—80125 Napoli—Italy). Spray properties of alternative fuels: A comparative analysis of mineral and 1st–2nd generation biodiesel. In Proceedings of the DIPSI Workshop 2010 on Droplet Impact Phenomena & Spray Investigation, Bergamo, Italy, 28 May 2010; pp. 1–8. [Google Scholar]
- Du, C. (Institutionen för tillämpad mekanik, Förbränning). Spray and Spay Combustion Characteristics of Diesel-Ethanol Fuel Blends; Chalmers University of Technology: Göteborg, Sweden, 2015; 43p. [Google Scholar]
- Abu-Qudais, M.; Al-Widyan, M.I. Performance and emissions characteristics of a Diesel engine operating on shale oil. Energy Convers. Manag. 2002, 43, 673–682. [Google Scholar] [CrossRef]
- Labeckas, G.; Slavinskas, S. Performance and exhaust emission characteristics of direct-injection Diesel engine when operating on shale oil. Energy Convers. Manag. 2005, 46, 139–150. [Google Scholar] [CrossRef]
- Labeckas, G.; Slavinskas, S. Influence of Fuel Additives on Performance of Direct-Injection Diesel Engine and Exhaust Emissions When Operating on Shale Oil. Energy Convers. Manag. 2005, 46, 1731–1744. [Google Scholar] [CrossRef]
- Labeckas, G.; Slavinskas, S. Performance and emission characteristics of a direct injection diesel engine operating on KDV synthetic diesel fuel. Energy Convers. Manag. 2013, 66, 173–188. [Google Scholar] [CrossRef]
- Papagiannakis, R.G.; Rakopoulos, D.C.; Rakopoulos, C.D. Evaluation of the air-oxygen enrichment effects on combustion and emissions of natural gas/diesel dual fuel engines at various loads and pilot fuel quantities. Energies 2018, 11, 3028. [Google Scholar] [CrossRef]
- Shatrow, M.G.; Khatchiyan, A.S.; Golubkov, L.N.; Dunin, A.Y. Improvement of the Performance Processes of Auto-Tractor’s Diesel Engines and Their Fuel Systems Operating on Alternative Fuels (Monography); MADI (Moscow Automobile and Highway Institute—State Technical University): Moscow, Russia, 2012; p. 220. (In Russian) [Google Scholar]
- Labeckas, G.; Slavinskas, S. Performance of direct-injection off-road diesel engine on rapeseed oil. Renew. Energy 2006, 31, 849–863. [Google Scholar] [CrossRef]
- Corsini, A.; Marchegiani, A.; Rispoli, F.; Sciulli, F.; Venturini, P. Vegetable oils as fuels in diesel engine. Engine performance and emissions. Energy Procedia 2015, 81, 942–949. [Google Scholar] [CrossRef]
- Rakopoulos, D.C.; Rakopoulos, C.D.; Kyritsis, D.C. Butanol or DEE blends with either straight vegetable oil or biodiesel excluding fossil fuel: Comparative effects on diesel engine combustion attributes, cyclic variability and regulated emissions trade-off. Energy 2016, 115 Pt 1, 314–325. [Google Scholar] [CrossRef]
- Labeckas, G.; Slavinskas, S. Performance and exhaust emissions of direct-injection Diesel engine operating on rapeseed oil and its blends with Diesel fuel. Transport 2005, 20, 186–194. [Google Scholar] [CrossRef]
- Labecki, L.; Cairns, A.; Xia, J.; Megaritis, T.; Zhao, H.; Ganippa, L. Combustion and emission of rapeseed oil blends in diesel engine. Appl. Energy 2012, 95, 139–146. [Google Scholar] [CrossRef]
- Hoekman, S.K.; Robbins, C. Review of the effects of biodiesel on NOx emissions. Fuel Process. Technol. 2012, 96, 237–249. [Google Scholar] [CrossRef]
- Labeckas, G.; Slavinskas, S. The effect of rapeseed oil methyl ester on direct injection Diesel engine performance and exhaust emissions. Energy Convers. Manag. 2006, 47, 1954–1967. [Google Scholar] [CrossRef]
- Rakopoulos, C.D.; Antonopoulos, K.A.; Rakopoulos, D.C.; Hountalas, D.T.; Giakoumis, E.G. Comparative performance and emissions study of a direct injection diesel engine using blends of diesel fuel with vegetable oils or bio-diesel of various origins. Energy Convers. Manag. 2006, 47, 3272–3287. [Google Scholar] [CrossRef]
- Xing-Cai, L.; Jian-Guang, Y.; Wu-Gao, Z.; Zhen, H. Effect of cetane number improver on heat release rate and emissions of high-speed diesel engine fuelled with ethanol-diesel blend fuel. Fuel 2004, 83, 2013–2020. [Google Scholar] [CrossRef]
- Torres-Jimenez, E.; Jerman, M.S.; Gregorc, A.; Lisec, I.; Dorado, M.P. Physical and chemical properties of ethanol-diesel fuel blends. Fuel 2011, 90, 795–802. [Google Scholar] [CrossRef]
- Labeckas, G.; Slavinskas, S.; Mažeika, M. The effect of ethanol-diesel-biodiesel blends on combustion, performance and emissions of a direct injection diesel engine. Energy Convers. Manag. 2014, 79, 698–720. [Google Scholar] [CrossRef]
- Giakoumis, E.; Rakopoulos, C.D.; Dimaratos, A.M.; Rakopoulos, D.C. Exhaust emissions with ethanol or n-butanol diesel fuel blends during transient operation: A review. Renew. Sustain. Energy Rev. 2013, 17, 170–190. [Google Scholar] [CrossRef]
- Rakopoulos, D.C.; Rakopoulos, C.D.; Giakoumis, E.G.; Komninos, N.P.; Kosmadakis, G.M.; Papagiannakis, R.G. Comparative evaluation of ethanol, n-butanol, and diethyl ether effects as biofuel supplements on combustion characteristics, cyclic variations, and emissions balance in light-duty diesel engine. J. Energy Eng. 2017, 143, 04016044. [Google Scholar] [CrossRef]
- Labeckas, G.; Slavinskas, S.; Rudnicki, J.; Zadrąg, R. The effect of oxygenated diesel-n-butanol fuel blends on combustion, performance, and exhaust emissions of a turbocharged CRDI diesel engine. Pol. Marit. Res. 2018, 25, 108–120. [Google Scholar] [CrossRef]
- Korres, D.M.; Karonis, D.; Lois, E.; Linck, M.B.; Gupta, A.K. Aviation fuel JP-5 and biodiesel on a diesel engine. Fuel 2008, 87, 70–78. [Google Scholar] [CrossRef]
- Chuck, C.J.; Donnelly, J. The compatibility of potential bioderived fuels with Jet A-1 aviation kerosene. Appl. Energy 2014, 118, 83–91. [Google Scholar] [CrossRef] [Green Version]
- Uyumaz, A.; Solmaz, H.; Yılmaz, E.; Yamık, H.; Polat, S. Experimental examination of the effects of military aviation fuel JP-8 and biodiesel fuel blends on the engine performance, exhaust emissions and combustion in a direct injection engine. Fuel Process. Technol. 2014, 128, 158–165. [Google Scholar] [CrossRef]
- Labeckas, G.; Slavinskas, S. Combustion phenomenon, performance, and emissions of a diesel engine with aviation turbine JP-8 fuel and rapeseed biodiesel blends. Energy Convers. Manag. 2015, 105, 216–229. [Google Scholar] [CrossRef]
- Rudnicki, J.; Zadrąg, R. Problems of Modelling Toxic Compounds Emitted by a Marine Internal Combustion Engine in Unsteady States. Pol. Marit. Res. 2014, 21, 57–65. [Google Scholar] [CrossRef]
- Rudnicki, J.; Zadrąg, R. Technical State Assessment of Charge Exchange System of Self-Ignition Engine, Based on the Exhaust Gas Composition Testing. Pol. Marit. Res. 2017, 24, 203–212. [Google Scholar] [CrossRef]
- Rakopoulos, D.C.; Rakopoulos, C.D.; Giakoumis, E.G.; Papagiannakis, R.G. Evaluating oxygenated fuel’s influence on combustion and emissions in diesel engines using a two-zone combustion model. ASCE J. Energy Eng. 2018, 144, 04018046. [Google Scholar] [CrossRef]
- Labeckas, G.; Slavinskas, S.; Kanapkienė, I. The individual effects of cetane number, oxygen content or fuel properties on performance efficiency, exhaust smoke and emissions of a turbocharged CRDI diesel engine—Part 2. Energy Convers. Manag. 2017, 149, 442–466. [Google Scholar] [CrossRef]
- Rakopoulos, C.D.; Dimaratos, A.M.; Giakoumis, E.G.; Rakopoulos, D.C. Investigating the emissions during acceleration of a turbocharged diesel engine operating with bio-diesel or n-butanol diesel fuel blends. Energy 2010, 35, 5173–5184. [Google Scholar] [CrossRef]
- Rakopoulos, C.D.; Dimaratos, A.M.; Giakoumis, E.G.; Rakopoulos, D.C. Study of turbocharged diesel engine operation, pollutants emissions and combustion noise radiation during starting with bio-diesel or n-butanol diesel fuel blends. Appl. Energy 2011, 88, 3905–3916. [Google Scholar] [CrossRef]
- Bhardwaj, O.P.; Lüers, B.; Holderbaum, B.; Körfer, T.; Pischinger, S.; Honkannen, M. Utilization of HVO fuel properties in a high efficiency combustion system SAE Research Paper 20154062. Int. J. Automot. Eng. 2015, 6, 75–82. [Google Scholar]
- Singh, D.; Subramanian, K.A.; Singal, S.K. Emissions and fuel consumption characteristics of a heavy duty diesel engine fuelled with Hydroprocessed Renewable Diesel and Biodiesel. Appl. Energy 2015, 155, 440–446. [Google Scholar] [CrossRef]
- Graboski, M.S.; McCormick, R.L. Combustion of fat and vegetable oil derived fuels in diesel engines. Prog. Energy Combust. Sci. 1998, 24, 125–164. [Google Scholar] [CrossRef]
- Zheng, M.; Li, T.; Han, X. Direct injection of neat n-butanol for enabling clean low temperature combustion in a modern engine. Fuel 2015, 142, 28–37. [Google Scholar] [CrossRef]
- Heywood, J.B. Internal Combustion Engine Fundamentals; McGraw-Hill: New York, NY, USA, 1988; 930p. [Google Scholar]
- Zannis, T.C.; Pariotis, E.G.; Hountalas, D.T.; Rakopoulos, D.C.; Levendis, Y.A. Theoretical study of DI diesel engine performance and pollutant emissions using comparable air-side and fuel-side oxygen addition. Energy Convers. Manag. 2007, 48, 2962–2970. [Google Scholar] [CrossRef]
- Pulkrabek, W.W. Engineering Fundamentals of the Internal Combustion Engine; Prentice Hall: Upper Saddle River, NJ, USA, 2009; Volume 07458, p. 411. [Google Scholar]
- Labeckas, G.; Slavinskas, S.; Kanapkienė, I. The individual effects of cetane number, oxygen content or fuel properties on the ignition delay, combustion characteristics, and cyclic variation of a turbocharged CRDI diesel engine—Part 1. Energy Convers. Manag. 2017, 148, 1003–1027. [Google Scholar] [CrossRef]
- Noh, H.K.; No, S.-Y. Effect of bioethanol on combustion and emissions in advanced CI engines: HCCI, PPC, and GCI mode—A review. Appl. Energy 2017, 208, 782–802. [Google Scholar] [CrossRef]
- Minteer, S. Alcoholic Fuels; CRC Press: Boca Raton, FL, USA, 2006; p. 270. [Google Scholar]
- Knothe, G.; Gerpen, J.V.; Krahl, J. The Biodiesel Handbook; AOCS Press: Champaign, IL, USA, 2005; p. 312. [Google Scholar]
- Du, C. Spray and Spray Combustion Characteristics of Diesel-Ethanol Fuel Blends; Technical Report; Department of Applied Mechanics: Göteborg, Sweden, 2015; 43p. [Google Scholar]
- Rakopoulos, C.D.; Antonopoulos, K.A.; Rakopoulos, D.C. Development and application of a multi-zone model for combustion and pollutants formation in a direct injection diesel engine with vegetable oil or its bio-diesel. Energy Convers. Manag. 2007, 48, 1881–1901. [Google Scholar] [CrossRef]
- Li, W.; Ren, Y.; Wang, X.-B.; Miao, H.; Jiang, D.-M.; Huang, Z.-H. Combustion characteristics of compression ignition engine fuelled with diesel-ethanol blends. Proc. Inst. Mech. Eng. Part D J. Automob. Eng. 2008, 222, 265–274. [Google Scholar] [CrossRef]
- Dec, J.E. Advanced compression-ignition engines—Understanding the in-cylinder processes. Proc. Combust. Inst. 2009, 32, 2727–2742. [Google Scholar] [CrossRef]
- Park, S.H.; Youn, I.M.; Lee, C.S. Influence of ethanol blends on the combustion performance and exhaust emission characteristics of a four-cylinder diesel engine at various engine loads and injection timings. Fuel 2011, 90, 748–755. [Google Scholar] [CrossRef]
- Yuan, W.; Gratten, M.R.; Hansen, A.C. Parametric investigation of NOx emissions from biofuels for compression-ignition engines. In Proceedings of the 2005 ASAE Annual International Meeting Presentation, Tampa, FL, USA, 17–20 July 2005; p. 21. [Google Scholar]
- Kwanchareon, P.; Luengnaruemitchai, A.; Jai-In, S. Solubility of a diesel–biodiesel-ethanol blend, its fuel properties, and its emission characteristics from diesel engine. Fuel 2007, 86, 1053–1061. [Google Scholar] [CrossRef]
- Aatola, H.; Larmi, M.; Sarjovaara, T.; Mikkonen, S. Hydrotreated Vegetable Oil (HVO) as a Renewable Diesel Fuel: Trade-off between NOx, Particulate Emission, and Fuel Consumption of a Heavy Duty Engine. SAE Int. J. Engines 2008, 1, 1251–1262. [Google Scholar] [CrossRef]
- Lapuerta, M.; Armas, O.; Herreros, J.M. Emissions from a diesel-bioethanol blend in an automotive diesel engine. Fuel 2008, 87, 25–31. [Google Scholar] [CrossRef]
- Stone, R. Introduction to Internal Combustion Engines, 3rd ed.; Palgrave MacMillan: London, UK, 1999; p. 641. [Google Scholar]
- Saha, A. Vaporization Characteristics of Pure and Blended Biofuel Droplet Injected into Hot Stream of Air. Master’s Thesis, The College of Engineering and Computer Science at the University of Central Florida, Orlando, FL, USA, 2010; 52p. [Google Scholar]
- Stone, R. Internal Combustion Engines, 4th ed.; Macmillan: London, UK, 2012; 494p. [Google Scholar]
- Pflaum, S.; Wloka, J.; Wachtmeister, G. Emission reduction potential of 3000 bar Common Rail Injection and development trends. International council on combustion engines. In Proceedings of the CIMAC Congress 2010, Bergen, Norway, 14–17 June 2010; pp. 1–12. [Google Scholar]
- Dunin, A.Y.; Dushkin, P.V. Test Results of Common Rail Fuel Injection System for Diesel Engines with Fuel Pressure Up to 3000 Bar; Herald of the Bauman Moscow State Technical University: Moscow, Russia, 2016; pp. 80–88. (In Russian) [Google Scholar]
- Dushkin, P.V. Increase of Efficiency of the Accumulator Fuel System Working Process with Injection Pressure Up to 300 MPa; Abstract of Dissertation for the Degree of Candidate of Technical Sciences; MADI (Moscow Automobile and Highway Institute—State Technical University): Moscow, Russia, 2017; 18p. (In Russian) [Google Scholar]
- Rakopoulos, C.D.; Antonopoulos, K.A.; Hountalas, D.T. Multi-zone modeling of combustion and emissions formation in DI diesel engine operating on ethanol-diesel fuel blends. Energy Convers. Manag. 2007, 48, 389–399. [Google Scholar] [CrossRef]
- Rogers, D.R. Engine Combustion: Pressure Measurement and Analysis; SAE International: Warrendale, PA, USA, 2010; 322p. [Google Scholar]
- Cevallos, F.; Wang, X.; Chen, Z.; Gan, A. Using AVL Data to Improve Transit On-Time Performance. J. Public Transp. 2011, 14, 21–40. Available online: https://www.nctr.usf.edu/wp-content/uploads/2011/10/JPT14.3Cevallos-.pdf (accessed on 18 January 2019).[Green Version]
- Engman, A.; Hartikka, T.; Honkanen, M.; Kiiski, U.; Kuronen, M.; Mikkonen, S.; Saikkonen, P. Hydro-Treated Vegetable Oil (HVO)—Premium Renewable Biofuel for Diesel Engines; Neste Oil Proprietary Publication: Espoo, Finland, March 2014; p. 55. [Google Scholar]
- Yanowitz, J.; Ratcliff, M.A.; McCormick, R.L.; Taylor, J.D.; Murphy, M.J. Compendium of Experimental Cetane Numbers; Technical Report NREL/TP-5400-61693; National Renewable Energy Laboratory (NREL): Golden, CO, USA, 2017; p. 62.
- Rakopoulos, C.D.; Rakopoulos, D.C.; Giakoumis, E.G.; Kyritsis, D.C. The combustion of n-butanol/diesel fuel blends and its cyclic variability in a DI diesel engine. Proc. Inst. Mech. Eng. Part A J. Power Energy 2011, 225, 289–308. [Google Scholar] [CrossRef]
- Happonen, M.; Heikkilä, J.; Aakko-Saksa, P.; Murtonen, T.; Lehto, K.; Rostedt, A.; Sarjovaara, T.; Larmi, M.; Keskinen, J.; Virtanen, A. Diesel exhaust emissions and particle hygroscopicity with HVO fuel-oxygenate blend. Fuel 2013, 103, 390–396. [Google Scholar] [CrossRef]
- Sayin, C. Engine performance and exhaust gas emissions of methanol and ethanol-diesel blends. Fuel 2010, 89, 3410–3415. [Google Scholar] [CrossRef]
- Hansen, A.C.; Gratton, M.R.; Yuan, W. Diesel engine performance and NOx emissions from oxygenated biofuels and blends with Diesel fuel. Trans. ASABE 2006, 49, 589–595. [Google Scholar] [CrossRef]
- Hansen, A.C.; Zhang, Q.; Lyne, P.-W.L. Ethanol-diesel fuel blends—A review. Bioresour. Technol. 2005, 96, 277–285. [Google Scholar] [CrossRef]
- Bhattacharya, T.K.; Chatterjee, S.; Mishra, T.N. Performance of a Constant Speed CI Engine on Alcohol-Diesel Microemulsions. Appl. Eng. Agric. ASAE 2004, 20, 253–257. [Google Scholar] [CrossRef]
- Can, Ő.; Çelikten, Ì.; Usta, N. Effects of ethanol addition on performance and emissions of a turbocharged indirect injection Diesel engine running at different injection pressures. Energy Convers. Manag. 2004, 45, 2429–2440. [Google Scholar] [CrossRef]
- Shahir, S.A.; Masjuki, H.H.; Kalam, M.A.; Imran, A.; Ashraful, A.M. Performance and emission assessment of diesel–biodiesel–ethanol/bioethanol blend as a fuel in diesel engines: A review. Renew. Sustain. Energy Rev. 2015, 48, 62–78. [Google Scholar] [CrossRef]
- Rakopoulos, C.D.; Rakopoulos, D.C.; Kakaras, E.C.; Giakoumis, E.G. Effect of ethanol diesel fuel blends on the performance and exhaust emissions of heavy-duty DI diesel engine. Energy Convers. Manag. 2008, 49, 3155–3162. [Google Scholar] [CrossRef]
- Girtler, J.; Korczewski, Z.; Mańczak, J. Operational problems of large power diesel engines combusting biofuels, considered together with assessment of their operation. Pol. Marit. Res. 2010, 17, 36–43. [Google Scholar] [CrossRef]
- Rakopoulos, C.D.; Rakopoulos, D.C.; Hountalas, D.T.; Giakoumis, E.G.; Andritsakis, E.C. Performance and emissions of bus engine using blends of diesel fuel with bio-diesel of sunflower or cottonseed oils derived from Greek feedstock. Fuel 2008, 87, 147–157. [Google Scholar] [CrossRef]
- Sukjit, E.; Dearn, K.D.; Tsolakis, A. Interrogating the Surface: The Effect of Blended Diesel Fuels on Lubricity. SAE Int. J. Fuels Lubr. 2011, 5, 154–162. [Google Scholar] [CrossRef]
- Demirbas, A. Biofuels sources, biofuel policy, biofuel economy and global biofuel projections. Energy Convers. Manag. 2008, 49, 2106–2116. [Google Scholar] [CrossRef]
- Tat, M.E.; Gerpen, J.V. Measurement of Biodiesel Speed of Sound and Its Impact on Injection Timing, Final Report: Report 2 in a Series of 6; NREL/SR-510-31462; National Renewable Energy Laboratory: Golden, CO, USA, 2003; 114p.
- Torres-Jimenez, E.; Dorado, M.P.; Kegl, B. Experimental investigation on injection characteristics of bioethanol-diesel fuel and bioethanol-biodiesel blends. Fuel 2011, 90, 1968–1979. [Google Scholar] [CrossRef]
- Marinov, N.M. A detailed chemical kinetic model for high temperature ethanol oxidation. Int. J. Chem. Kinet. 1999, 31, 183–220. [Google Scholar] [CrossRef]
- Gowdagiri, S.; Cesari, X.M.; Huang, M.; Oehlschlaeger, M.A. A diesel engine study of conventional and alternative diesel and jet fuels: Ignition and emissions characteristics. Fuel 2014, 136, 253–260. [Google Scholar] [CrossRef]
- Kulmanakov, S.; Lebedevas, S.; Kulmanakov, S.; Lazereva, N.; Rapalis, P. Comparative studies of the biodiesel fuel jet development dynamics in common rail and conventional design fuel systems. Transport 2019, 34, 67–74. [Google Scholar] [CrossRef]
- Slavinskas, S.; Labeckas, G.; Mickevičius, T. Experimental study on injection characteristics of diesel and biodiesel fuel blends with common rail injection system. In Proceedings of the 17th International Scientific Conference, Jelgava, Latvia, 23–25 May 2018; Volume 17, pp. 2134–2140. [Google Scholar]
- Kitano, K.; Sakata, I.; Clark, R. Effects of GTL fuel properties on DI diesel combustion. SAE Trans. 2005. [Google Scholar] [CrossRef]
- Lee, J.; Bae, C. Application of JP-8 in a heavy-duty diesel engine. Fuel 2011, 90, 1762–1770. [Google Scholar] [CrossRef]
- Saxena, S.; Bedoya, I. Fundamental phenomena affecting low temperature combustion and HCCI engines, high load limits and strategies for extending these limits. Prog. Energy Combust. Sci. 2013, 39, 457–488. [Google Scholar] [CrossRef]
- Gowthaman, S.; Sathivagnanam, A.P. A review of homogeneous charge compression ignition (HCCI) engine. Int. J. Sci. Eng. Res. 2015, 6, 779–798. [Google Scholar]
- Labeckas, G.; Slavinskas, S.; Laurinaitis, K. Effect of jet A-1/ethanol fuel blend on HCCI combustion and exhaust emissions. J. Energy Eng. 2018, 144, 04018047. [Google Scholar] [CrossRef]
- Stradling, R.; Gadd, P.; Singer, M.; Operti, C. The influence of fuel properties and injection timing on the exhaust emissions and fuel consumption of an Iveco heavy-duty diesel engine. SAE Trans. 1997. [Google Scholar] [CrossRef]
- Komninos, N.P. Assessing the effect of mass transfer on the formation of HC and CO emissions in HCCI engines, using a multi-zone model. Energy Convers. Manag. 2009, 50, 1192–1201. [Google Scholar] [CrossRef]
- Komninos, N.P.; Rakopoulos, C.D. Numerical investigation into the formation of CO and oxygenated and nonoxygenated hydrocarbon emissions from isooctane- and ethanol-fuelled HCCI engines. Energy Fuels 2010, 24, 1655–1667. [Google Scholar] [CrossRef]
- Kowalewicz, A. Eco-diesel engine fuelled with rapeseed oil methyl ester and ethanol. Part 1: Efficiency and emissions. Inst. Mech. Eng. Part D J. Automob. Eng. 2005, 219, 715–723. [Google Scholar] [CrossRef]
- Lee, J.; Oh, H.; Bae, C. Combustion process of JP-8 and fossil Diesel fuel in a heavy-duty diesel engine using two-colour thermometry. Fuel 2012, 102, 264–273. [Google Scholar] [CrossRef]
Figure 1.
Schematic view of the engine test stand: (1) AVL (Graz, Austria) crank-angle encoder; (2) piezoelectric in-cylinder pressure transducer; (3) fuel high-pressure line transducer attached in front of the injector; and (4) air boost pressure sensor mounted inside the intake manifold. MAF—Mass Air Flow; SCP—Signal Conditioning Platform.

Figure 2.
Definition of the ignition delay for a pilot fuel portion: as period in crank angle degrees (CADs) between the start of injection (SOI) and the start of combustion (SOC).
Figure 2.
Definition of the ignition delay for a pilot fuel portion: as period in crank angle degrees (CADs) between the start of injection (SOI) and the start of combustion (SOC).

Figure 3.
Composition of the experimental diesel–HRD fuel blends oxygenated with ethanol (a) or biodiesel (b) and purposely designed with an aim to achieve a wide variation range of 0–4.52 wt% of fuel-oxygen mass content (as listed in nomenclature), but still preserving the same blended cetane number value of 55.5.

Figure 4.
The ignition delay as a function of ethanol–oxygen or biodiesel–oxygen mass content (wt%) in fuel blends for a turbocharged CRDI engine running under medium (50%), intermediate (80%), and full (100%) loads corresponding to the respective IMEPs of 0.75, 1.20, and 1.50 MPa developed at maximum torque speed of 2000 rpm.

Figure 5.
Maximum heat release rate (a) and its location angle ATDC (b) as a function of ethanol–oxygen or biodiesel-oxygen mass content (wt%) in fuel blends when running under medium (50%), intermediate (80%), and full (100%) loads corresponding to the respective IMEP = 0.75, 1.20, and 1.50 MPa developed at maximum torque speed of 2000 rpm.

Figure 6.
Crank angles of mass burn fractions MBF 50 (a) and MBF 90 (b) as a function of ethanol–oxygen or biodiesel-oxygen mass content (wt%) in fuel blends measured when running under medium (50%), intermediate (80%), and full (100%) loads corresponding to IMEPs of 0.75, 1.20, and 1.50 MPa developed at speed of 2000 rpm.

Figure 7.
Coefficient of the cyclic variation (COV) of IMEP as a function of ethanol–oxygenated or biodiesel-oxygen mass content (wt%) in fuel blends for medium (50%), intermediate (80%), and full (100%) loads corresponding to respective IMEPs of 0.75, 1.20, and 1.50 MPa, developed at maximum torque speed of 2000 rpm.

Figure 8.
Maximum in-cylinder pressure pmax (a) and its location angle ∆pmax ATDC (b) as a function of ethanol–oxygen or biodiesel-oxygen mass content (wt%) in fuel blends for medium (50%), intermediate (80%), and full (100%) loads corresponding to respective IMEPs of 0.75, 1.20, and 1.50 MPa, developed at a speed of 2000 rpm.

Figure 9.
Coefficient of the cyclic variation (COV) of maximum in-cylinder pressure over the 100 consecutive engine cycles as a function of ethanol–oxygen or biodiesel-oxygen mass content in fuel blends for medium (50%), intermediate (80%), and full (100%) loads corresponding to the respective IMEPs of 0.75, 1.20, and 1.50 MPa, developed at a speed of 2000 rpm.

Figure 10.
Indicated Specific Fuel Consumption (ISFC) as a function of ethanol–oxygen or biodiesel-oxygen mass content (wt%) in fuel blends for medium (50%), intermediate (80%), and full (100%) loads corresponding to the respective IMEPs of 0.75, 1.20, and 1.50 MPa, developed at maximum torque speed of 2000 rpm.

Figure 11.
Indicated thermal efficiency (ITE) as a function of ethanol–oxygen or biodiesel-oxygen mass content (wt%) in fuel blends for medium (50%), intermediate (80%) and full (100%) loads corresponding to the respective IMEPs of 0.75, 1.20, and 1.50 MPa developed at maximum torque speed of 2000 rpm.

Figure 12.
The changing trends in total nitrogen oxide (NOx) emissions as a function of ethanol–oxygen or biodiesel-oxygen mass content (wt%) in fuel blends for medium (50%), intermediate (80%), and full (100%) loads corresponding to the respective IMEPs of 0.75, 1.20, and 1.50 MPa developed at maximum torque speed of 2000 rpm.

Figure 13.
The changing trends in nitrogen dioxide (NO2) emissions as a function of ethanol–oxygen or biodiesel-oxygen mass content (wt%) in fuel blends for medium (50%), intermediate (80%), and full (100%) loads corresponding to the respective IMEPs of 0.75, 1.20, and 1.50 MPa, developed at maximum torque speed of 2000 rpm.

Figure 14.
Effect of ethanol–oxygen or biodiesel-oxygen mass content (wt%) in fuel blends on exhaust smoke when running under medium (50%), intermediate (80%), and full (100%) loads corresponding to the respective IMEPs of 0.75, 1.20, and 1.50 MPa, developed at maximum torque speed of 2000 rpm.
Figure 14.
Effect of ethanol–oxygen or biodiesel-oxygen mass content (wt%) in fuel blends on exhaust smoke when running under medium (50%), intermediate (80%), and full (100%) loads corresponding to the respective IMEPs of 0.75, 1.20, and 1.50 MPa, developed at maximum torque speed of 2000 rpm.

Figure 15.
Effect of ethanol–oxygen or biodiesel-oxygen mass content (wt%) in fuel blends on the CO production when running under medium (50%), intermediate (80%), and full (100%) loads corresponding to the respective IMEPs of 0.75, 1.20, and 1.50 MPa, developed at maximum torque speed of 2000 rpm.
Figure 15.
Effect of ethanol–oxygen or biodiesel-oxygen mass content (wt%) in fuel blends on the CO production when running under medium (50%), intermediate (80%), and full (100%) loads corresponding to the respective IMEPs of 0.75, 1.20, and 1.50 MPa, developed at maximum torque speed of 2000 rpm.

Figure 16.
Effect of ethanol–oxygen or biodiesel-oxygen mass content (wt%) in fuel blends on the production of total unburned hydrocarbons (THC) when running under medium (50%), intermediate (80%), and full (100%) loads corresponding to the respective IMEPs of 0.75, 1.20, and 1.50 MPa developed at maximum torque speed of 2000 rpm.


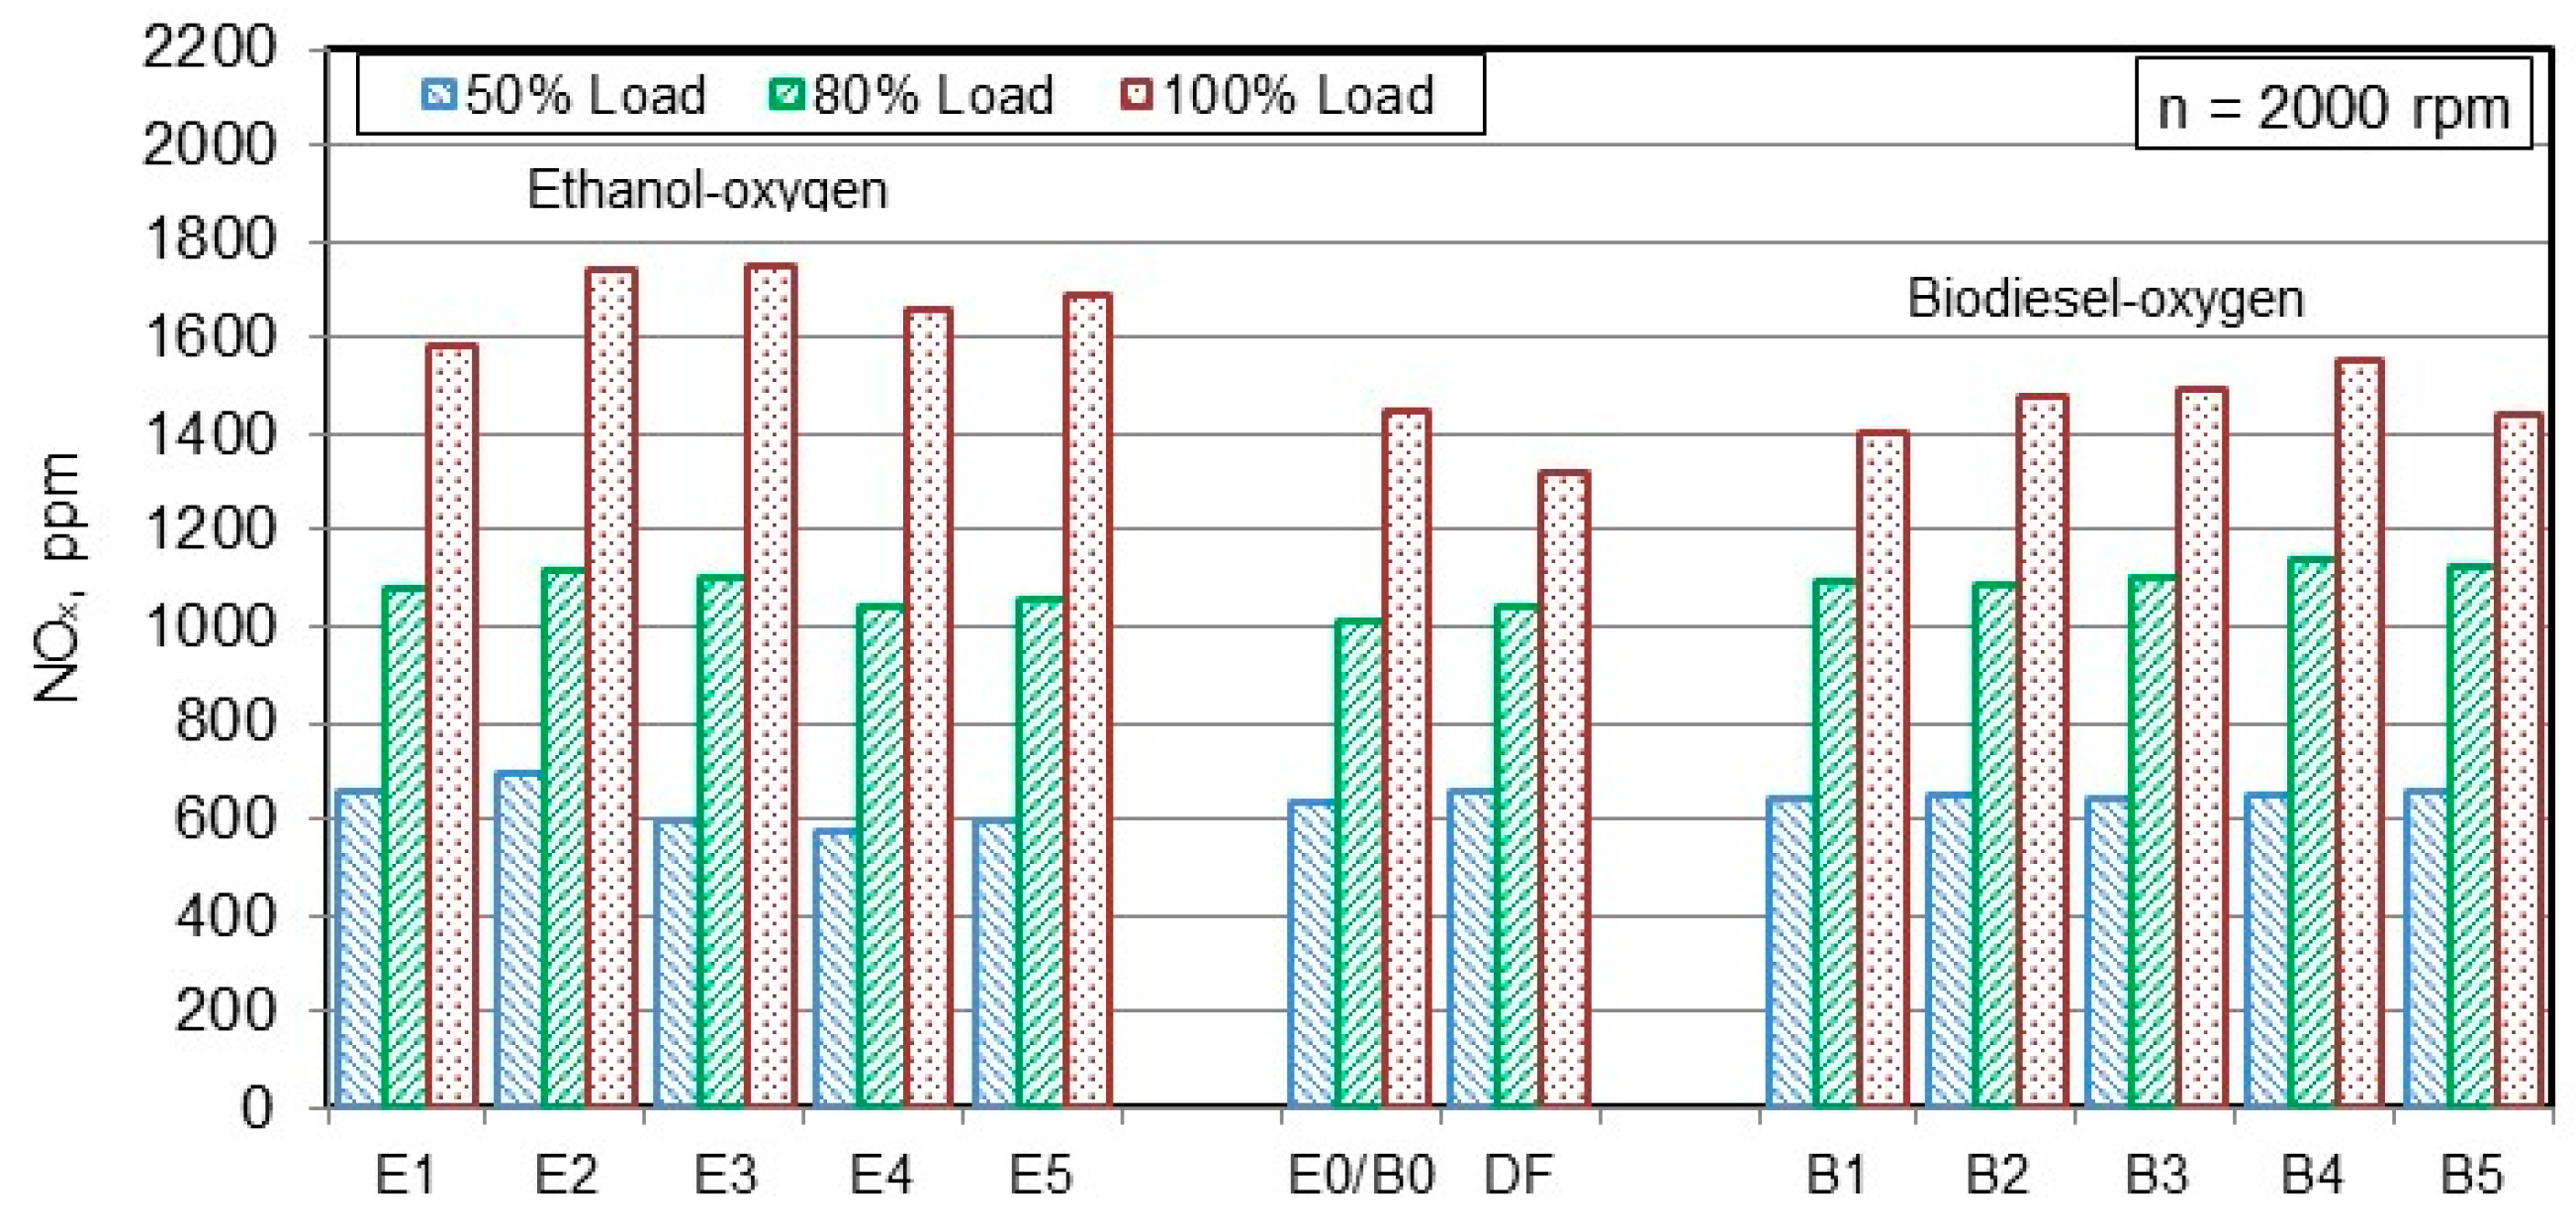
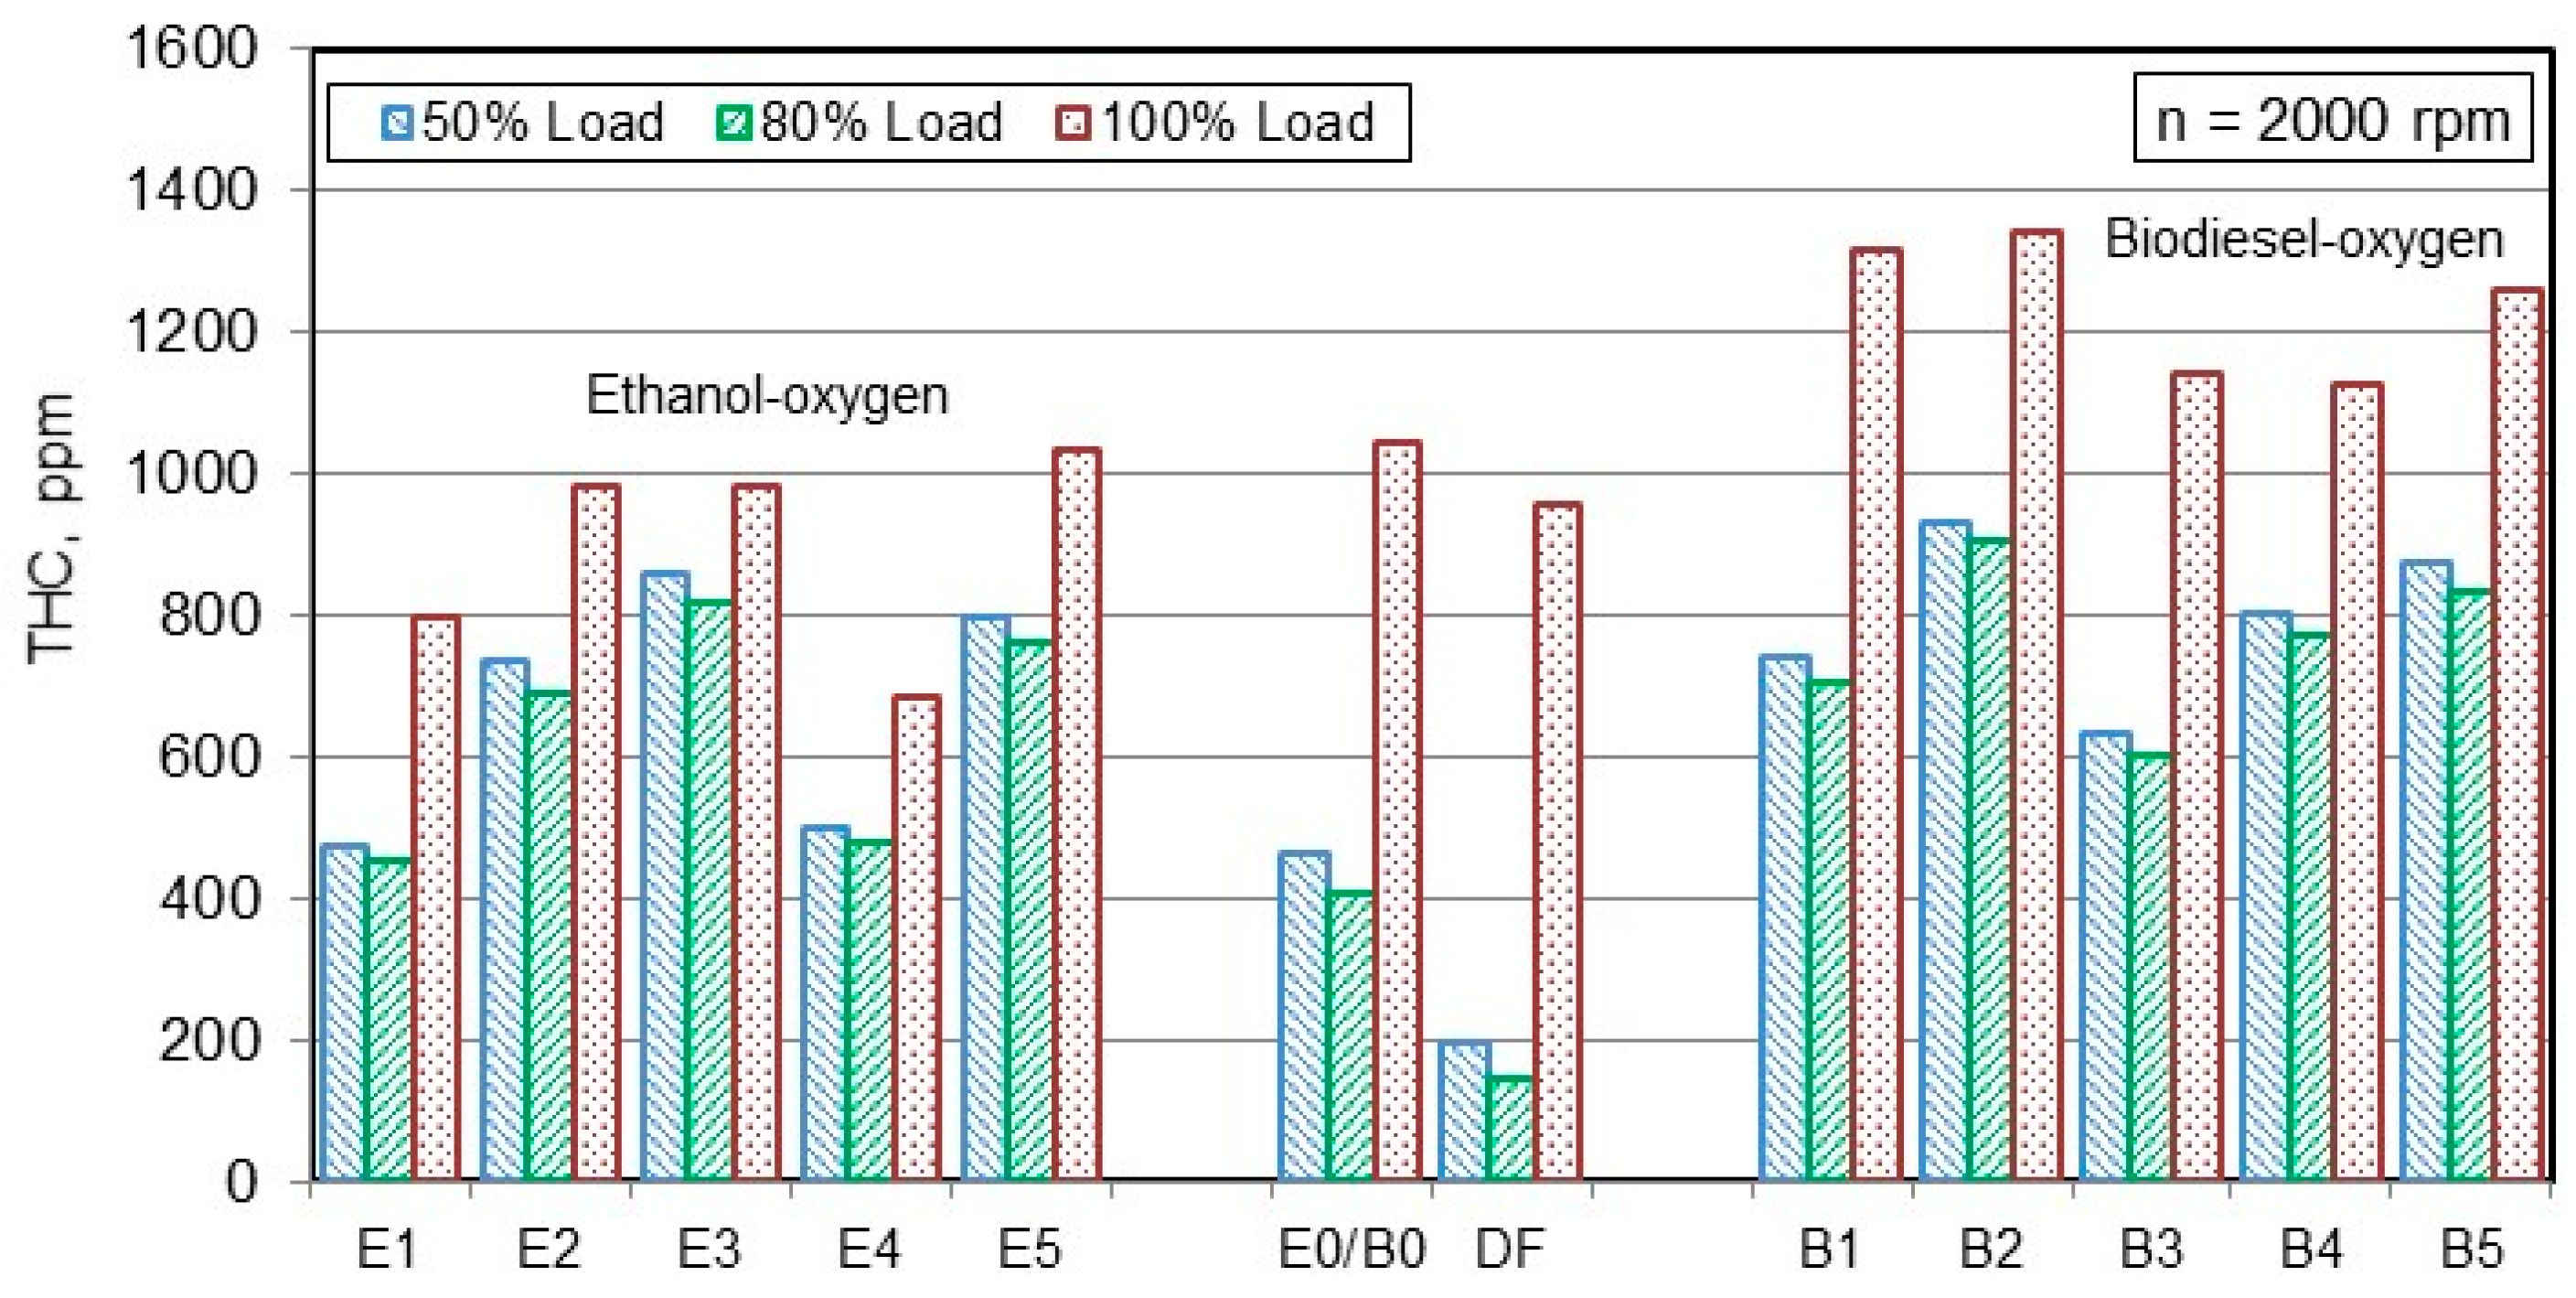
Table 1.
Specifications of an engine and its fuel system.
| Engine Parameters | Engine Operating Conditions |
|---|---|
| Engine Code | 192A1000 |
| Engine brand/model | FIAT 1.9JTD 8v 115 HP (85 kW) |
| Engine type | Four-cylinder, in line, turbocharged, JTD |
| Turbine code | 712766-1 |
| Type of turbocharger | A variable geometry Garret GT1749V |
| Fuel injection system | Common Rail Direct Injection (CRDI), Bosch |
| Cylinder bore | 82 mm |
| Piston stroke | 90.4 mm |
| Connecting rod length | 144.5 mm |
| Total displacement volume | 1910 cc |
| Engine compression ratio | 18.0 ± 0.45:1 |
| Combustion chamber design | The OMEGA-shaped in a piston head |
| Rated power of an engine | 85 kW (115 HP) developed at 4000 rpm (BMEP = 1.335 MPa) |
| Maximum torque | 255 Nm (EEC) developed at speed of 2000 rpm |
| Engine idle speed | 850 ± 20 rpm |
| SOHC - Intake timing angles | Opens at 0° BTDC; closes at 32° ABDC |
| SOHC - Exhaust timing angles | Opens at 40° BBDC; closes at 2° ATDC |
| Gas exchange system | OHC with four vertical valves per cylinder |
| Maximum injection pressure | 1400 bar (140 ± 0.5 MPa) |
| Injection pump code/injectors code, nozzle holes number × diameter | 0445010007/0445110119, 6 × ∅ 0.170 mm |
Table 2.
The accuracy of the measured engine performance and emission parameters and the uncertainty of the computed experimental results.
Table 2.
The accuracy of the measured engine performance and emission parameters and the uncertainty of the computed experimental results.
| Measurements | Accuracy |
|---|---|
| Engine speed | ±0.1% |
| Engine torque | ±1% |
| Pressure in the cylinder | ±0.1 MPa |
| Start of injection (SOI) | ±0.1° (CADs) |
| Start of combustion (SOC) | ±0.1° (CADs) |
| Nitrogen oxides (NOx) | ±5 ppm |
| Carbon monoxide (CO) | ±3 ppm |
| Carbon dioxide (CO2) | ±3 vol% |
| Total unburned hydrocarbons (THC) | ±2 ppm |
| Exhaust smoke (opacity) | ±0.1% |
| Calculated results | Total uncertainty |
| Air mass flow rate | ±1% |
| Fuel mass flow rate | ±0.1% |
| Engine power | ±1% |
| Indicated Specific Fuel Consumption (ISFC) | ±1.5% |
| Indicated Thermal Efficiency (ITE) | ±1.5% |
Table 3.
Properties of commercial diesel fuel, renewable HRD fuel, ethanol, and rapeseed biodiesel (RME).
Table 3.
Properties of commercial diesel fuel, renewable HRD fuel, ethanol, and rapeseed biodiesel (RME).
| Basic Properties of the Fuels | Test Methods | Diesel Fuel (Class 1) | Hydrotreated Renewable Diesel (HRD) | Ethanol (99.9 vol%) | Rapeseed Biodiesel (RME) |
|---|---|---|---|---|---|
| Density at 15 °C, kg/m3 (biodiesel and ethanol at 20 °C) | EN ISO 12185:1999 | 832.7 | 779.8 | 790.0 | 883.6 |
| Viscosity at 40 °C, mm2/s | EN ISO 3104 + AC:1994 | 2.13 | 2.92 | 1.40 | 4.44 |
| Surface tension at 29 °C, mN/m | - | 30.1 | 27.9 | - | 29.6 |
| Lubricity (HFRR), wear scar diameter (wsd 1.4) at 60 °C, µm | EN ISO 12156-1 | 459 | 260 | - | 205 |
| Flash point, open cup °C | EN ISO 2719:2003 | 57.0 | 79.5 | 13 | 168 |
| Initial/final boiling points, °C | EN ISO 3405:2011 | 177.8/345.0 | 209.9/301.9 | 78 | 346/366 |
| Cloud point, °C | EN ISO 23015:1999/ASTM D7689 | −16 | −36.9 | ≤−26 | −10 |
| Cold filter plugging point, °C | EN ISO 116/AC:2002 | −31 | −40.0 | ≤−38 | −15 |
| Autoignition temperature °C | - | ~250 | ~210 | ~363 | ~342 |
| Cetane number | EN ISO 5165:1999/ASTM D6890 | 51.4 | 78.9 | 8 | 51.0 |
| Iodine number, J2g/100 g | EN 14111:2003 | 6 | - | - | 110 |
| Acid value, mg KOH/g | -/ASTM D 3242-11 | 0.06 | 0.001 | ≤0.01 | 0.11 |
| Polycyclic aromatics, wt% | EN 12916 | 4.0 | ≤0.1 | - | - |
| Sulfur, total, mg/kg | EN ISO 20846:2004 | 5.6 | ≤1.0 | - | 3.9 |
| Oxygen, max wt% | - | 0.00 | 0.00 | 34.78 | 10.84 |
| Carbon, max wt% | - | 86.08 | 84.80 | 52.172 | 77.26 |
| Hydrogen, wt% | - | 12.99 | 15.200 | 13.043 | 11.90 |
| Carbon-to-hydrogen ratio (C/H) | - | 6.500 | 5.58 | 4.00 | 6.49 |
| Distillation residue, wt% | EN ISO 10370:1999 | 0.04 mass% | 0.01 | - | 0.29 mass% |
| Stoichiometric air/fuel ratio, kg/kg | - | 14.50 | 15.12 | 9.07 | 12.62 |
| Net heating value, MJ/kg | EN ISO 8217:2012/ASTM D 4809 | 43.00 | 43.82 | 26.95 | 37.23 |
| Total contamination, mg/kg | EN ISO 12662 | 4 | 3 | - | 11.6 |
| Ash, 775 °C, wt% | EN ISO 6245 | 0.01 | ≤0.001 | - | 0.005 |
| Water, mg/kg | EN ISO 12937 | 35 | 17 | ≤0.2 vol% | 420.0 |
Table 4.
Basic properties of diesel–HRD fuel blends containing ethanol (E) or biodiesel (B), but still possessing the sane blended cetane number value of 55.5.
Table 4.
Basic properties of diesel–HRD fuel blends containing ethanol (E) or biodiesel (B), but still possessing the sane blended cetane number value of 55.5.
| Code of the Blends | Density at 15 °C, kg/m3 | Kinematic Viscosity at 40 °C, mm2/s | Surface Tension, mN/m | Oxygen, max wt% | Carbon, max wt% | Hydrogen, max wt% | Carbon-to-Hydrogen ratio | Stoichiometric Air/Fuel Ratio, kg/kg | Net Heating Value, MJ/kg | Heating Energy of Combustible Mixture, MJ/kg for λ = 1.25 |
|---|---|---|---|---|---|---|---|---|---|---|
| E0 | 824.8 | 2.13 | 27.70 | 0.00 | 85.89 | 13.32 | 6.45 | 14.59 | 43.12 | 2.24 |
| E1 | 821.5 | 2.04 | 27.70 | 0.91 | 84.95 | 13.41 | 6.33 | 14.48 | 42.74 | 2.24 |
| E2 | 818.2 | 2.03 | 26.07 | 1.81 | 84.02 | 13.51 | 6.22 | 14.36 | 42.36 | 2.24 |
| E3 | 814.9 | 1.98 | 24.87 | 2.71 | 83.09 | 13.60 | 6.11 | 14.25 | 41.97 | 2.23 |
| E4 | 811.7 | 1.97 | 25.30 | 3.61 | 82.15 | 13.69 | 6.00 | 14.13 | 41.59 | 2.23 |
| E5 | 808.4 | 1.96 | 25.60 | 4.52 | 81.22 | 13.78 | 5.89 | 14.01 | 41.21 | 2.23 |
| B0 | 824.8 | 2.13 | 27.70 | 0.00 | 85.89 | 13.32 | 6.45 | 14.59 | 43.12 | 2.24 |
| B1 | 829.0 | 2.27 | 28.73 | 0.91 | 85.14 | 13.23 | 6.43 | 14.44 | 42.64 | 2.24 |
| B2 | 833.1 | 2.45 | 29.00 | 1.81 | 84.41 | 13.15 | 6.42 | 14.28 | 42.16 | 2.24 |
| B3 | 837.3 | 2.56 | 29.30 | 2.71 | 83.67 | 13.06 | 6.41 | 14.13 | 41.68 | 2.23 |
| B4 | 841.5 | 2.75 | 29.37 | 3.61 | 82.94 | 12.98 | 6.39 | 13.97 | 41.21 | 2.23 |
| B5 | 845.7 | 2.89 | 29.50 | 4.52 | 82.19 | 12.89 | 6.38 | 13.82 | 40.72 | 2.23 |
© 2019 by the authors. Licensee MDPI, Basel, Switzerland. This article is an open access article distributed under the terms and conditions of the Creative Commons Attribution (CC BY) license (http://creativecommons.org/licenses/by/4.0/).
Share and Cite
MDPI and ACS Style
Labeckas, G.; Slavinskas, S.; Kanapkienė, I. Study of the Effects of Biofuel-Oxygen of Various Origins on a CRDI Diesel Engine Combustion and Emissions. Energies 2019, 12, 1241. https://doi.org/10.3390/en12071241
AMA Style
Labeckas G, Slavinskas S, Kanapkienė I. Study of the Effects of Biofuel-Oxygen of Various Origins on a CRDI Diesel Engine Combustion and Emissions. Energies. 2019; 12(7):1241. https://doi.org/10.3390/en12071241
Chicago/Turabian StyleLabeckas, Gvidonas, Stasys Slavinskas, and Irena Kanapkienė. 2019. "Study of the Effects of Biofuel-Oxygen of Various Origins on a CRDI Diesel Engine Combustion and Emissions" Energies 12, no. 7: 1241. https://doi.org/10.3390/en12071241
Note that from the first issue of 2016, this journal uses article numbers instead of page numbers. See further details here.