Article

Experimental Investigation of the Ventilation Performance of Different Air Distribution Systems in an Office Environment—Cooling Mode

Department of Building Engineering, Energy Systems and Sustainability Science, University of Gävle, 801 76 Gävle, Sweden
*
Author to whom correspondence should be addressed.
Energies 2019, 12(7), 1354; https://doi.org/10.3390/en12071354
Submission received: 17 March 2019 / Revised: 29 March 2019 / Accepted: 4 April 2019 / Published: 9 April 2019
(This article belongs to the Special Issue Energy Performance and Indoor Climate Analysis in Buildings)

Abstract

:
The performance of a newly designed corner impinging jet air distribution method with an equilateral triangle cross section was evaluated experimentally and compared to that of two more traditional methods (mixing and displacement ventilation). At nine evenly chosen positions with four standard vertical points, air velocity, turbulence intensity, temperature, and tracer gas decay measurements were conducted for all systems. The results show that the new method behaves as a displacement ventilation system, with high air change effectiveness and stratified flow pattern and temperature field. Both local air change effectiveness and air exchange effectiveness of the corner impinging jet showed high quality and promising results, which is a good indicator of ventilation effectiveness. The results also indicate that there is a possibility to slightly lower the airflow rates for the new air distribution system, while still meeting the requirements for thermal comfort and indoor air quality, thereby reducing fan energy usage. The draught rate was also lower for corner impinging jet compared to the other tested air distribution methods. The findings of this research show that the corner impinging jet method can be used for office ventilation.

1. Introduction

As humans spend more time indoors than outdoors, the importance of having a good indoor environment becomes crucial when designing or renovating buildings. Whether we are at home, at the office, or at school, a good indoor climate is important for several reasons, such as having fresh air, maintaining a high work performance [1] and a good cognitive function [2], and complying with state and local regulations. One of the most important systems for controlling the indoor climate is the ventilation system. This is also one of the components in a building that requires a lot of energy, which is also an important issue to address, since buildings accounted for roughly 22% of total world energy use in 2016 [3]. There are several types of air distribution systems that work in different ways. Some of these have been researched extensively, while others are still in the evaluation stage.
One of these systems is called displacement ventilation (DV). Ventilation based on this type of device enters the room at a relatively low speed and at low height, close to the floor. When used for cooling the space, the inlet air will fall to the floor level and continue flowing out in the space until it encounters heat sources. It will then start to heat up and rise as a result of buoyancy effects, moving to the upper part of the space, where it will usually exit from an extraction point located close to the ceiling. There has been a lot of research on this type of ventilation. In the early 2000s, a research group examined whether the indoor air quality (IAQ) in the breathing zone was better than the average IAQ in the occupied zone, and the results showed that there was a 35–50% improvement in the breathing zone due to the buoyancy effect around the mannequin body [4]. In a more recent publication, four different ventilation systems were compared in terms of ventilation efficiency, thermal comfort and energy-saving potential by using numerical simulations. The four systems compared were DV, mixing ventilation (MV), wall confluent jets ventilation (WCJ), and impinging jet ventilation (IJV). The comparison was done for an office environment. The results showed that DV was better than the other air delivery systems in all areas except when evaluating the vertical temperature gradient between ankle and neck levels for a standing person [5]. Other research groups have also concluded that DV is more suitable for cooling by exhibiting higher ventilation and energy effectiveness. It also creates a temperature stratification which facilitates the concentration of pollutants in the lower strata of the occupied space [6,7,8].
Another type of air distribution system is IJV, which has been the subject of much research [9,10,11,12,13]. However, very few studies have examined multiple inlet devices based on IJV. In an early study, Karimipanah and Awbi [14] compared IJV to wall displacement ventilation in a laboratory classroom. They tested several key parameters such as ventilation efficiency, local mean age of air, and other characteristic parameters both experimentally and by numerical simulations. One of the conclusions of their research was that the IJV system showed a slight improvement in mean age of air and velocity distributions due to a better balance between buoyancy and momentum forces. Similarly, Koufi et al. [15] also reached the conclusion that IJV has higher ventilation effectiveness. They conducted a numerical simulation by comparing two types of MV, DV and IJV, investigated under isothermal conditions.
In another study, numerical simulations were carried out to evaluate IJV, MV, and DV. One of the results of that study showed that IJV has an advantage over DV in that it can also be used for heating in winter time; also, IJV was found to distribute air more efficiently to the occupied zone when compared to a top–top-configured MV [16].
IJV has been classified by some researchers as a hybrid system [5,17,18] in that it combines the positive effects of both MV and DV to overcome the shortcomings of the DV system, for example the limitation in covering the entire floor area due to low velocity.
An interesting placement of an IJV device is in the corners of a room. In this study, this configuration is called corner impinging jet ventilation (CIJV). One aspect of CIJV is the possibility of having a non-intrusive supply device, i.e., the device can almost be hidden in the corner of the room. This property increases the value of this device compared to others that are installed in the middle of a wall section. To the authors’ best of knowledge, there has not been any experimental research carried out to evaluate multiple IJV devices placed in the corners of an office room.
It is also important to consider some shortcomings of this type of system. The region in front of the jet impact area must be cleared from any furniture or objects for proper operation, and the possibility of stratification discomfort and draft might occur near the supply device [19].
Finally, the most common ventilation system used in buildings today is MV. This system can be installed in various configurations. This type of ventilation has been researched extensively. In one study [20], an experimental investigation was conducted comparing MV to confluent jet ventilation and a floor-mounted underfloor air distribution system. This investigation was conducted in a medium-sized open-plan office which included six workstations. The study focused on the thermal comfort performance of these systems, and the conclusion reached was that MV had some shortcomings in terms of higher draught in the occupied zone and lower heat removal capacity compared to the other systems. Similar investigative comparisons between MV and other types of ventilation system to evaluate thermal comfort and/or ventilation effectiveness have been made by many research groups [6,21,22,23,24,25,26,27,28].
This article focuses on the experimental evaluation of the potential benefits of a newly designed impinging jet ventilation system located in the corners of an office-type environment. The CIJV system was compared to two other separate systems based on DV and MV, to evaluate heat removal effectiveness, local thermal comfort, and indoor air quality in the occupants’ breathing zone. The DV supply device used in this study was designed for relatively high momentum compared to traditional DV devices. The supply devices for MV were located high in the room corners, providing a type of ventilation hereby called corner mixing ventilation (CMV).

2. Theory and Mathematical Models

This section provides an overview and explanation of the key definitions of indoor climate indices which are used in this study. According to ISO 7730 [
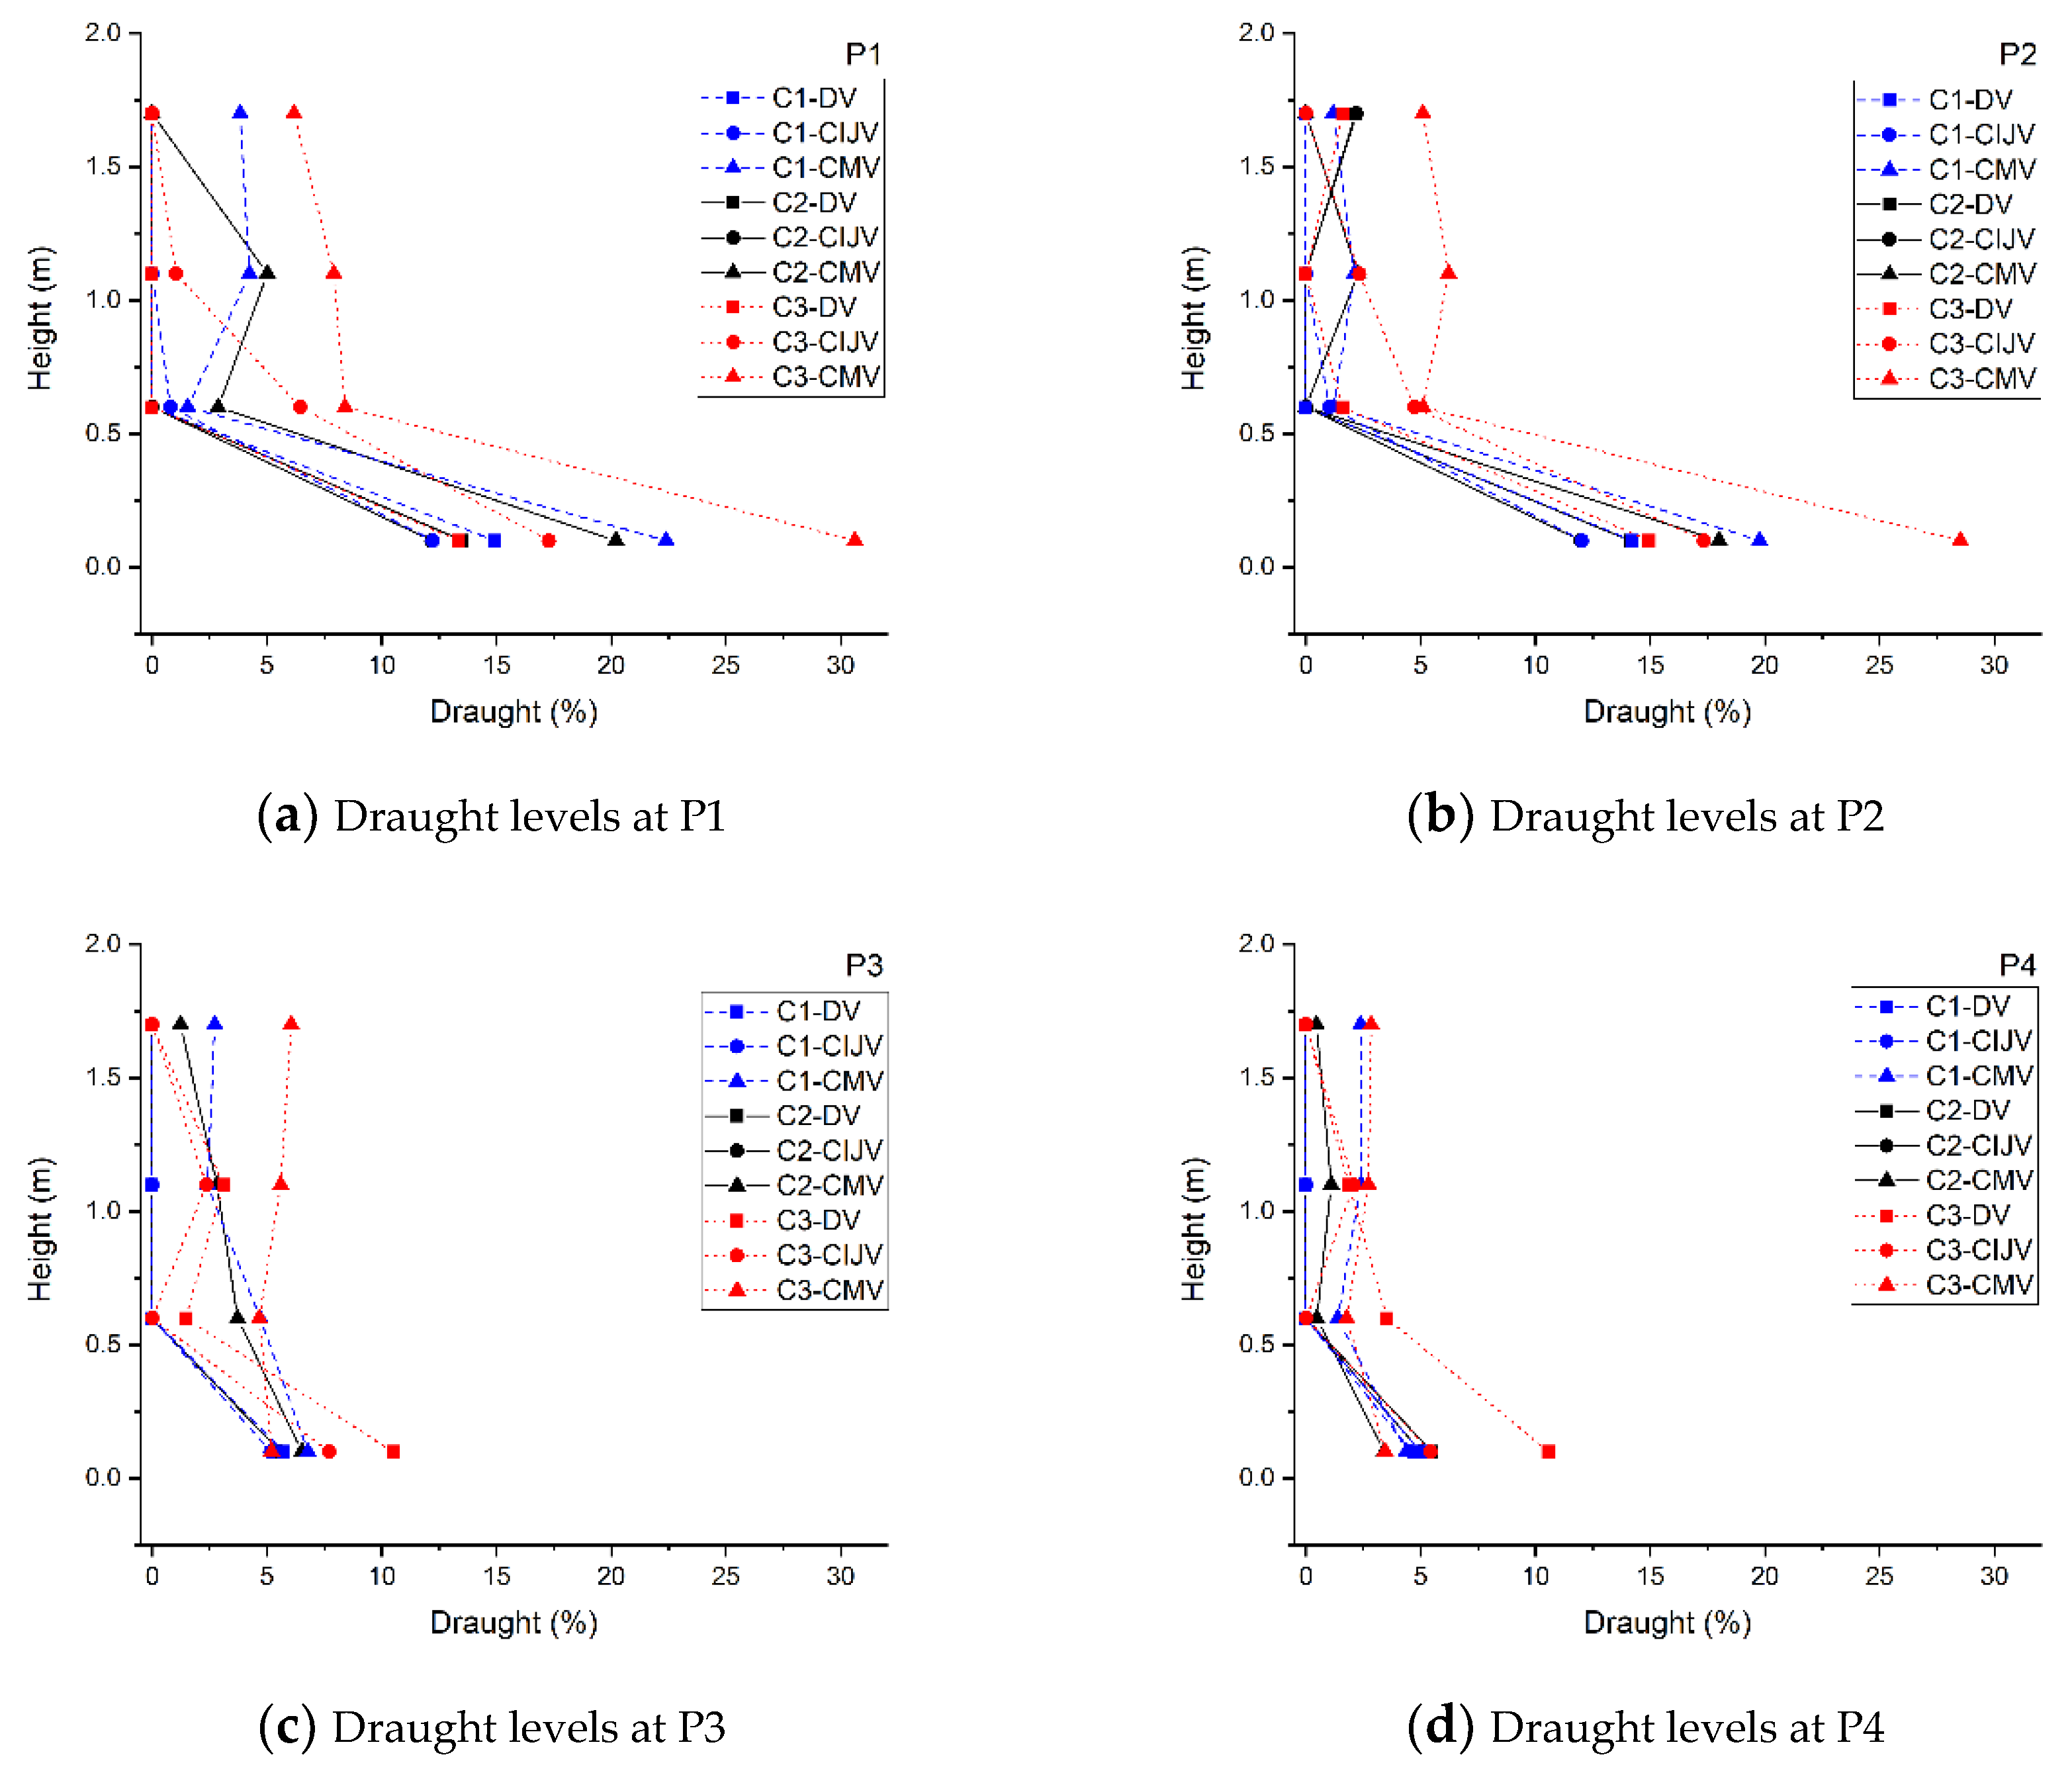
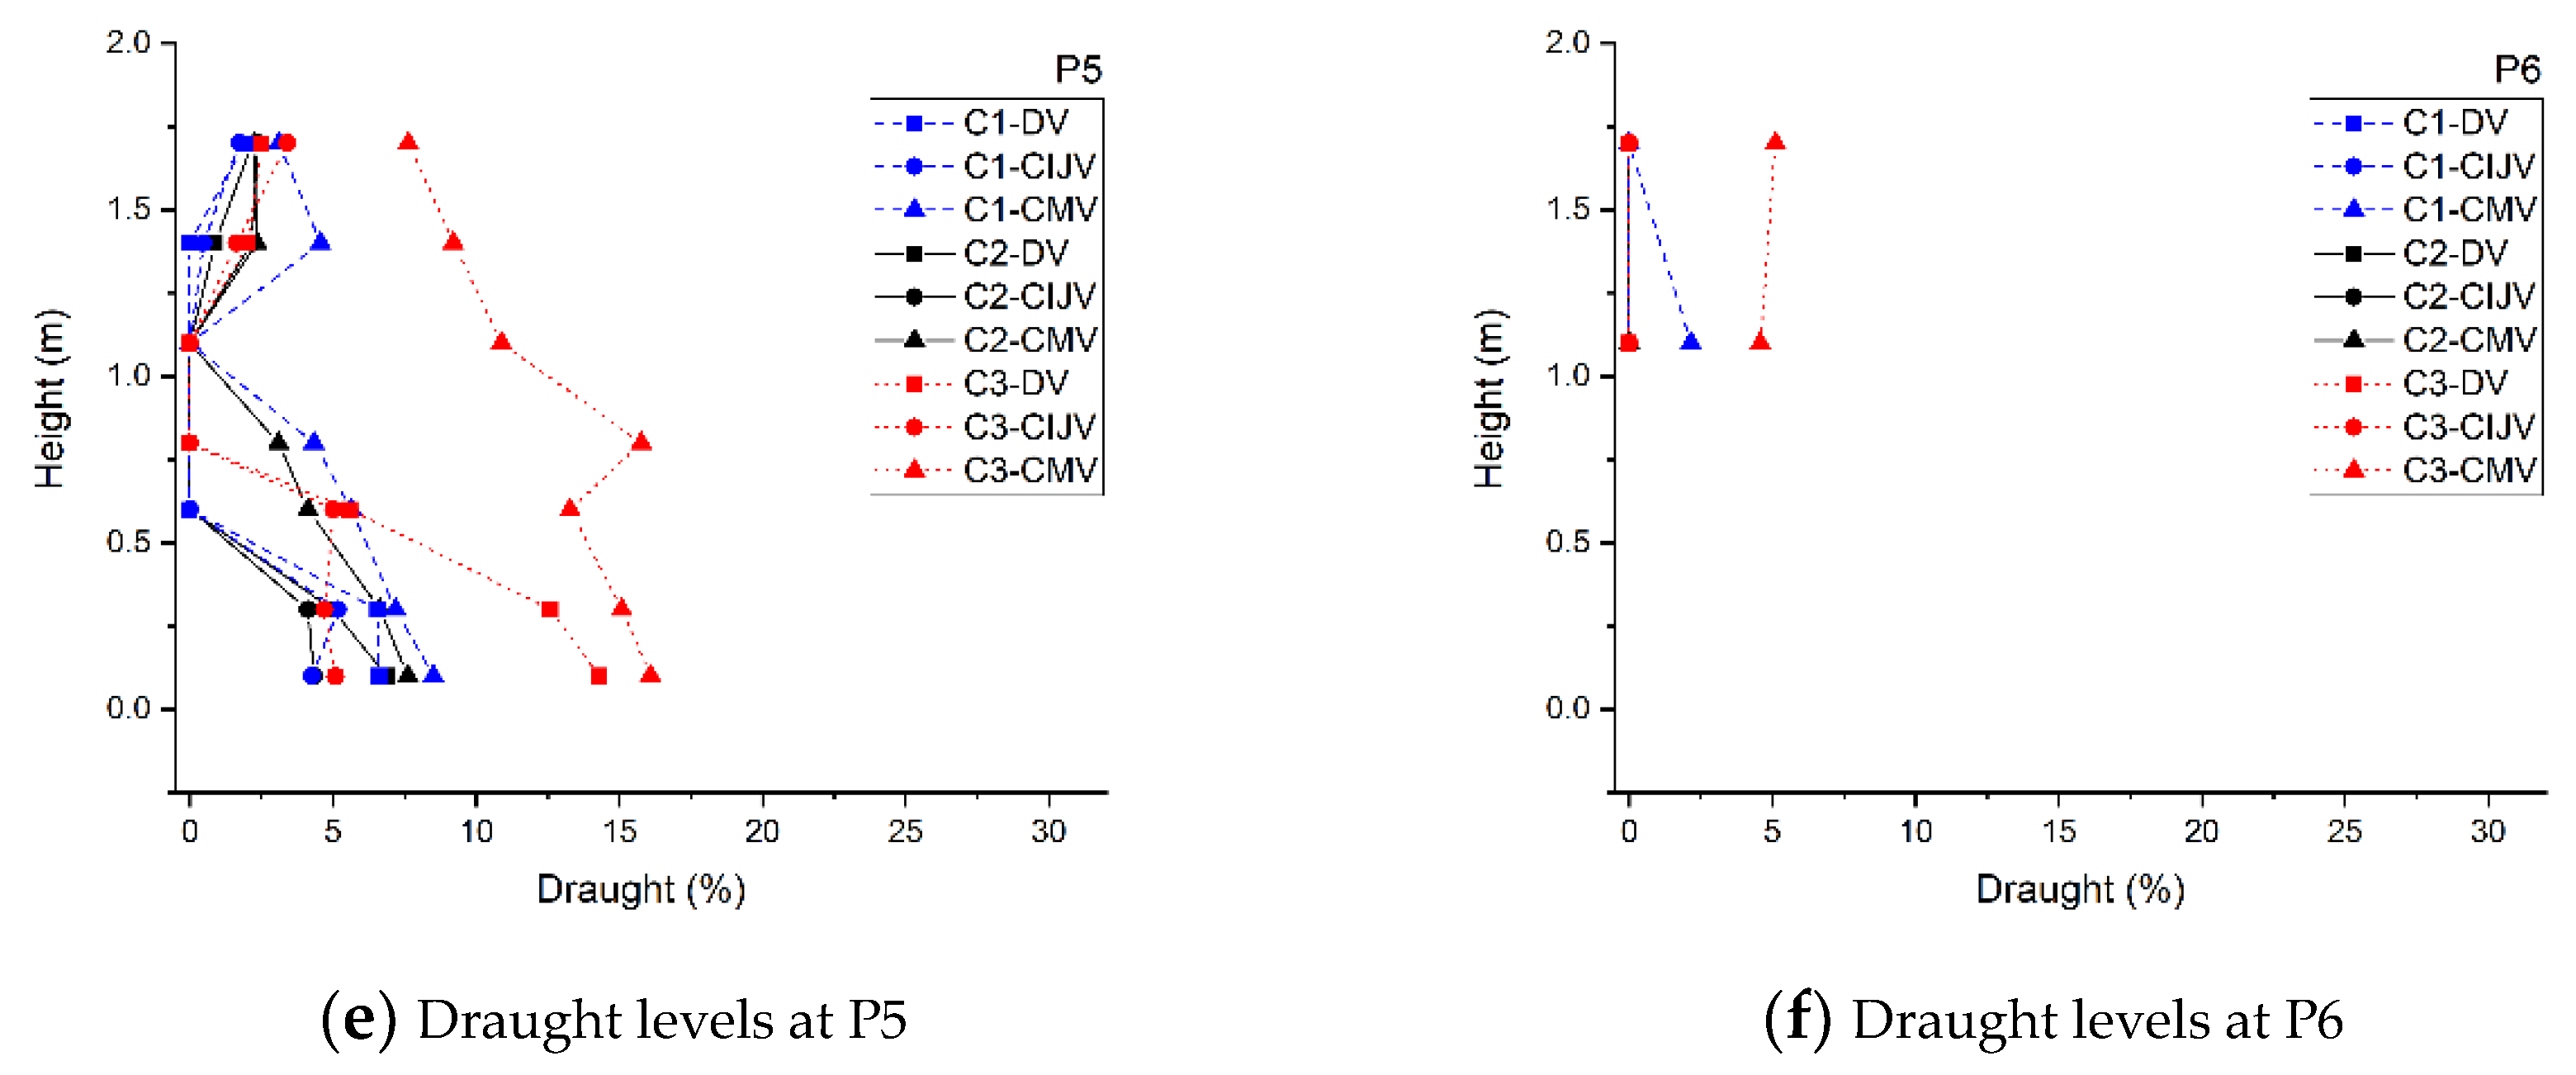
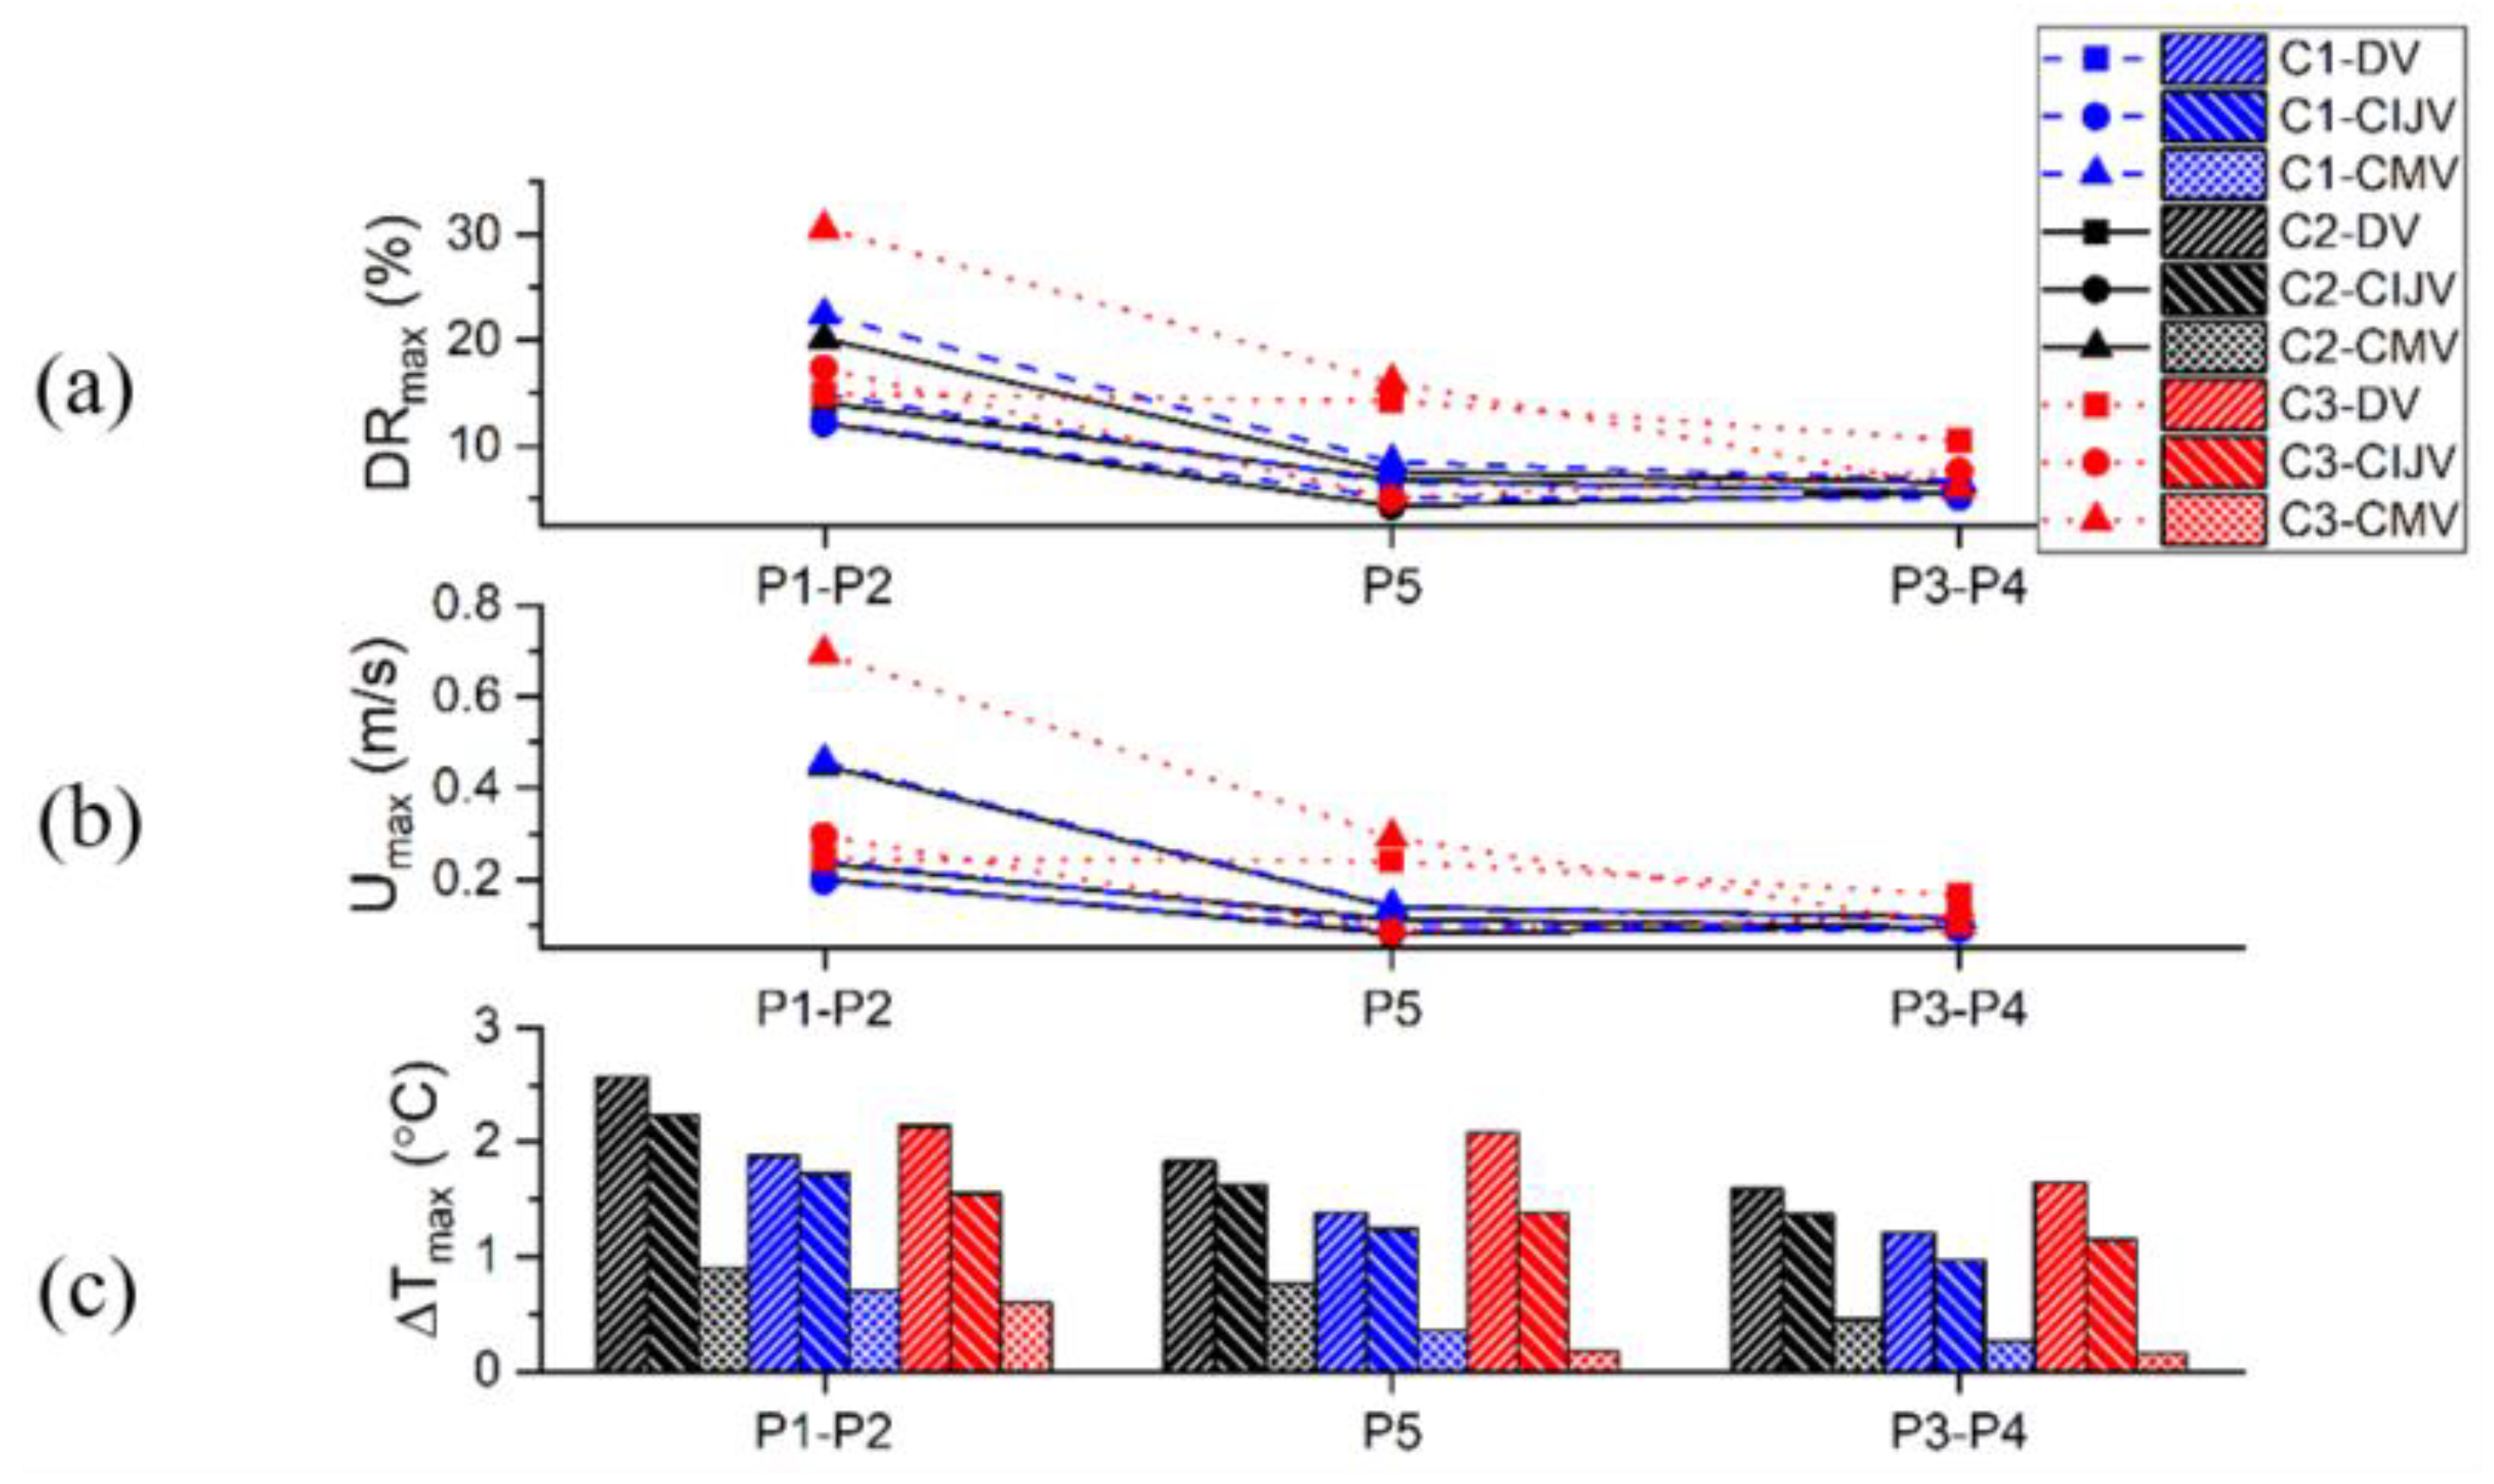
29], the draught rate (DR) describes the discomfort a person experiences due to unwanted cooling of the human body. This index is a function of air temperature, air velocity, and turbulent intensity, and predicts the percentage of dissatisfaction due to draft. This is estimated by
DR = ( 3.14 + 0.37 · u a · I p ) ( 34 T a ) ( u a 0.05 ) 0.62 For   u a < 0.05   m / s   use   u a = 0.05   m / s For   DR > 100 %   use   DR = 100 % ,
where ua is the mean air velocity, Ip is the local turbulence intensity, and Ta is the local temperature.
Another index, the percentage dissatisfied (PD), is related to the local discomfort due to a high vertical air temperature difference between head and ankle. In this study, the temperature difference, ∆T0.1–1.1 between the ankle level (0.1 m) and the neck level for a seated person (1.1 m) was used. According to ISO 7730, PD is estimated by
PD = 100 ( % ) 1 + e x p ( 5.76 0.856 · Δ T 0.1 1.1 )   .
In ISO 7730, the local thermal comfort is categorized into three levels (A, B, and C) for office environments. Table 1 shows the criteria for each category.
Temperature effectiveness ( ε T ) [30,31,32,33] is a parameter that can be used to evaluate the effectiveness of heat removal and is defined by
ε T = ( T o T i ) ( T ¯ 0.1 ,   0.6 , 1.1 T i )   ,  
where T ¯ 0.1 , 0.6 , 1.1 is the arithmetic mean air temperature of the heights 0.1, 0.6, and 1.1 m, T o is the outlet air temperature, and T i is the supply air temperature.
The evaluation of ventilation effectiveness can be done in multiple ways. Two commonly used indices related to IAQ are air exchange effectiveness (AEE) and air change effectiveness (ACE) [34,35,36]. The guidelines in ASHRAE Standard 129-1997 [34] require measuring ACE in 25% of the workstations or measuring a minimum of 10 locations throughout the evaluated space. Another way to calculate AEE is to make measurements at the exhaust location. These indices have been utilized by many researchers for evaluating indoor environments using different tracer gas techniques [21,22,37,38,39,40,41,42,43,44].
The definition of local mean age of air is the average time it takes for fresh air to travel from an inlet to any place in the room [40,45,46]. The air at the examined place is a mixture of components of the air present in the room for different lengths of time. The supply air should be distributed in such a way that the occupants are “flushed” with fresh air at the breathing level. The local mean age of air, τ ¯ p , at a specific point is calculated from sampled tracer gas concentration histories. By utilizing the step-down tracer method, the local mean age of air is obtained by
τ ¯ p = 1 C p ( 0 ) 0 C p ( t ) d t   ,
where the start of the decay corresponds to a time of zero with initial concentration C p ( 0 ) , and C p ( t ) is the tracer gas concentration at time t.
The mean age of air for the entire space, τ ¯ , is calculated by
τ ¯ = 0 t C 0 ( t ) d t 0 C 0 ( t ) d t   .
AEE is calculated by
AEE = τ n 2 τ ¯   ,
where τ n is the nominal time constant defined as the reciprocal of the nominal air exchange rate.
τ ¯ represents the mean age of air at the ventilation outlet obtained from tracer gas measurements [45]. τ n is calculated by
τ n = V q v   ,
where V is the volume of the room, and q v is the ventilation flow rate.
ACE relates to local air change effectiveness (ACEp) or average spatial air change effectiveness in a region (ACEavg) within the breathing level against the nominal time constant of the ventilation system. They are defined by
ACE p = τ n τ p
and
ACE avg = τ n τ ¯ a v g   .
Here, τ p is the local age of air in a considered point, and τ ¯ a v g is the arithmetic average age of air for several points. A reference case (ACE = 1.0) is used, which is correspond to perfect air mixing.
The inlet Archimedes number (Ari) [47,48] is a measure of the relative importance of buoyant and inertia forces. Ari is important in building airflows because it combines two important ventilation design parameters, i.e., supply air velocity and room temperature difference. Ari is defined by
Ar i = g · ( T r T i ) T r · A e ( u i n ) 2   ,
where g is the gravitational acceleration, T r [K] is the mean air temperature in the center of the room at 1.7 m above floor level, T i [K] is the mean supply air temperature, A e is the inlet supply opening area, and u i n is the nominal inlet air velocity.

3. Experimental Set-Up

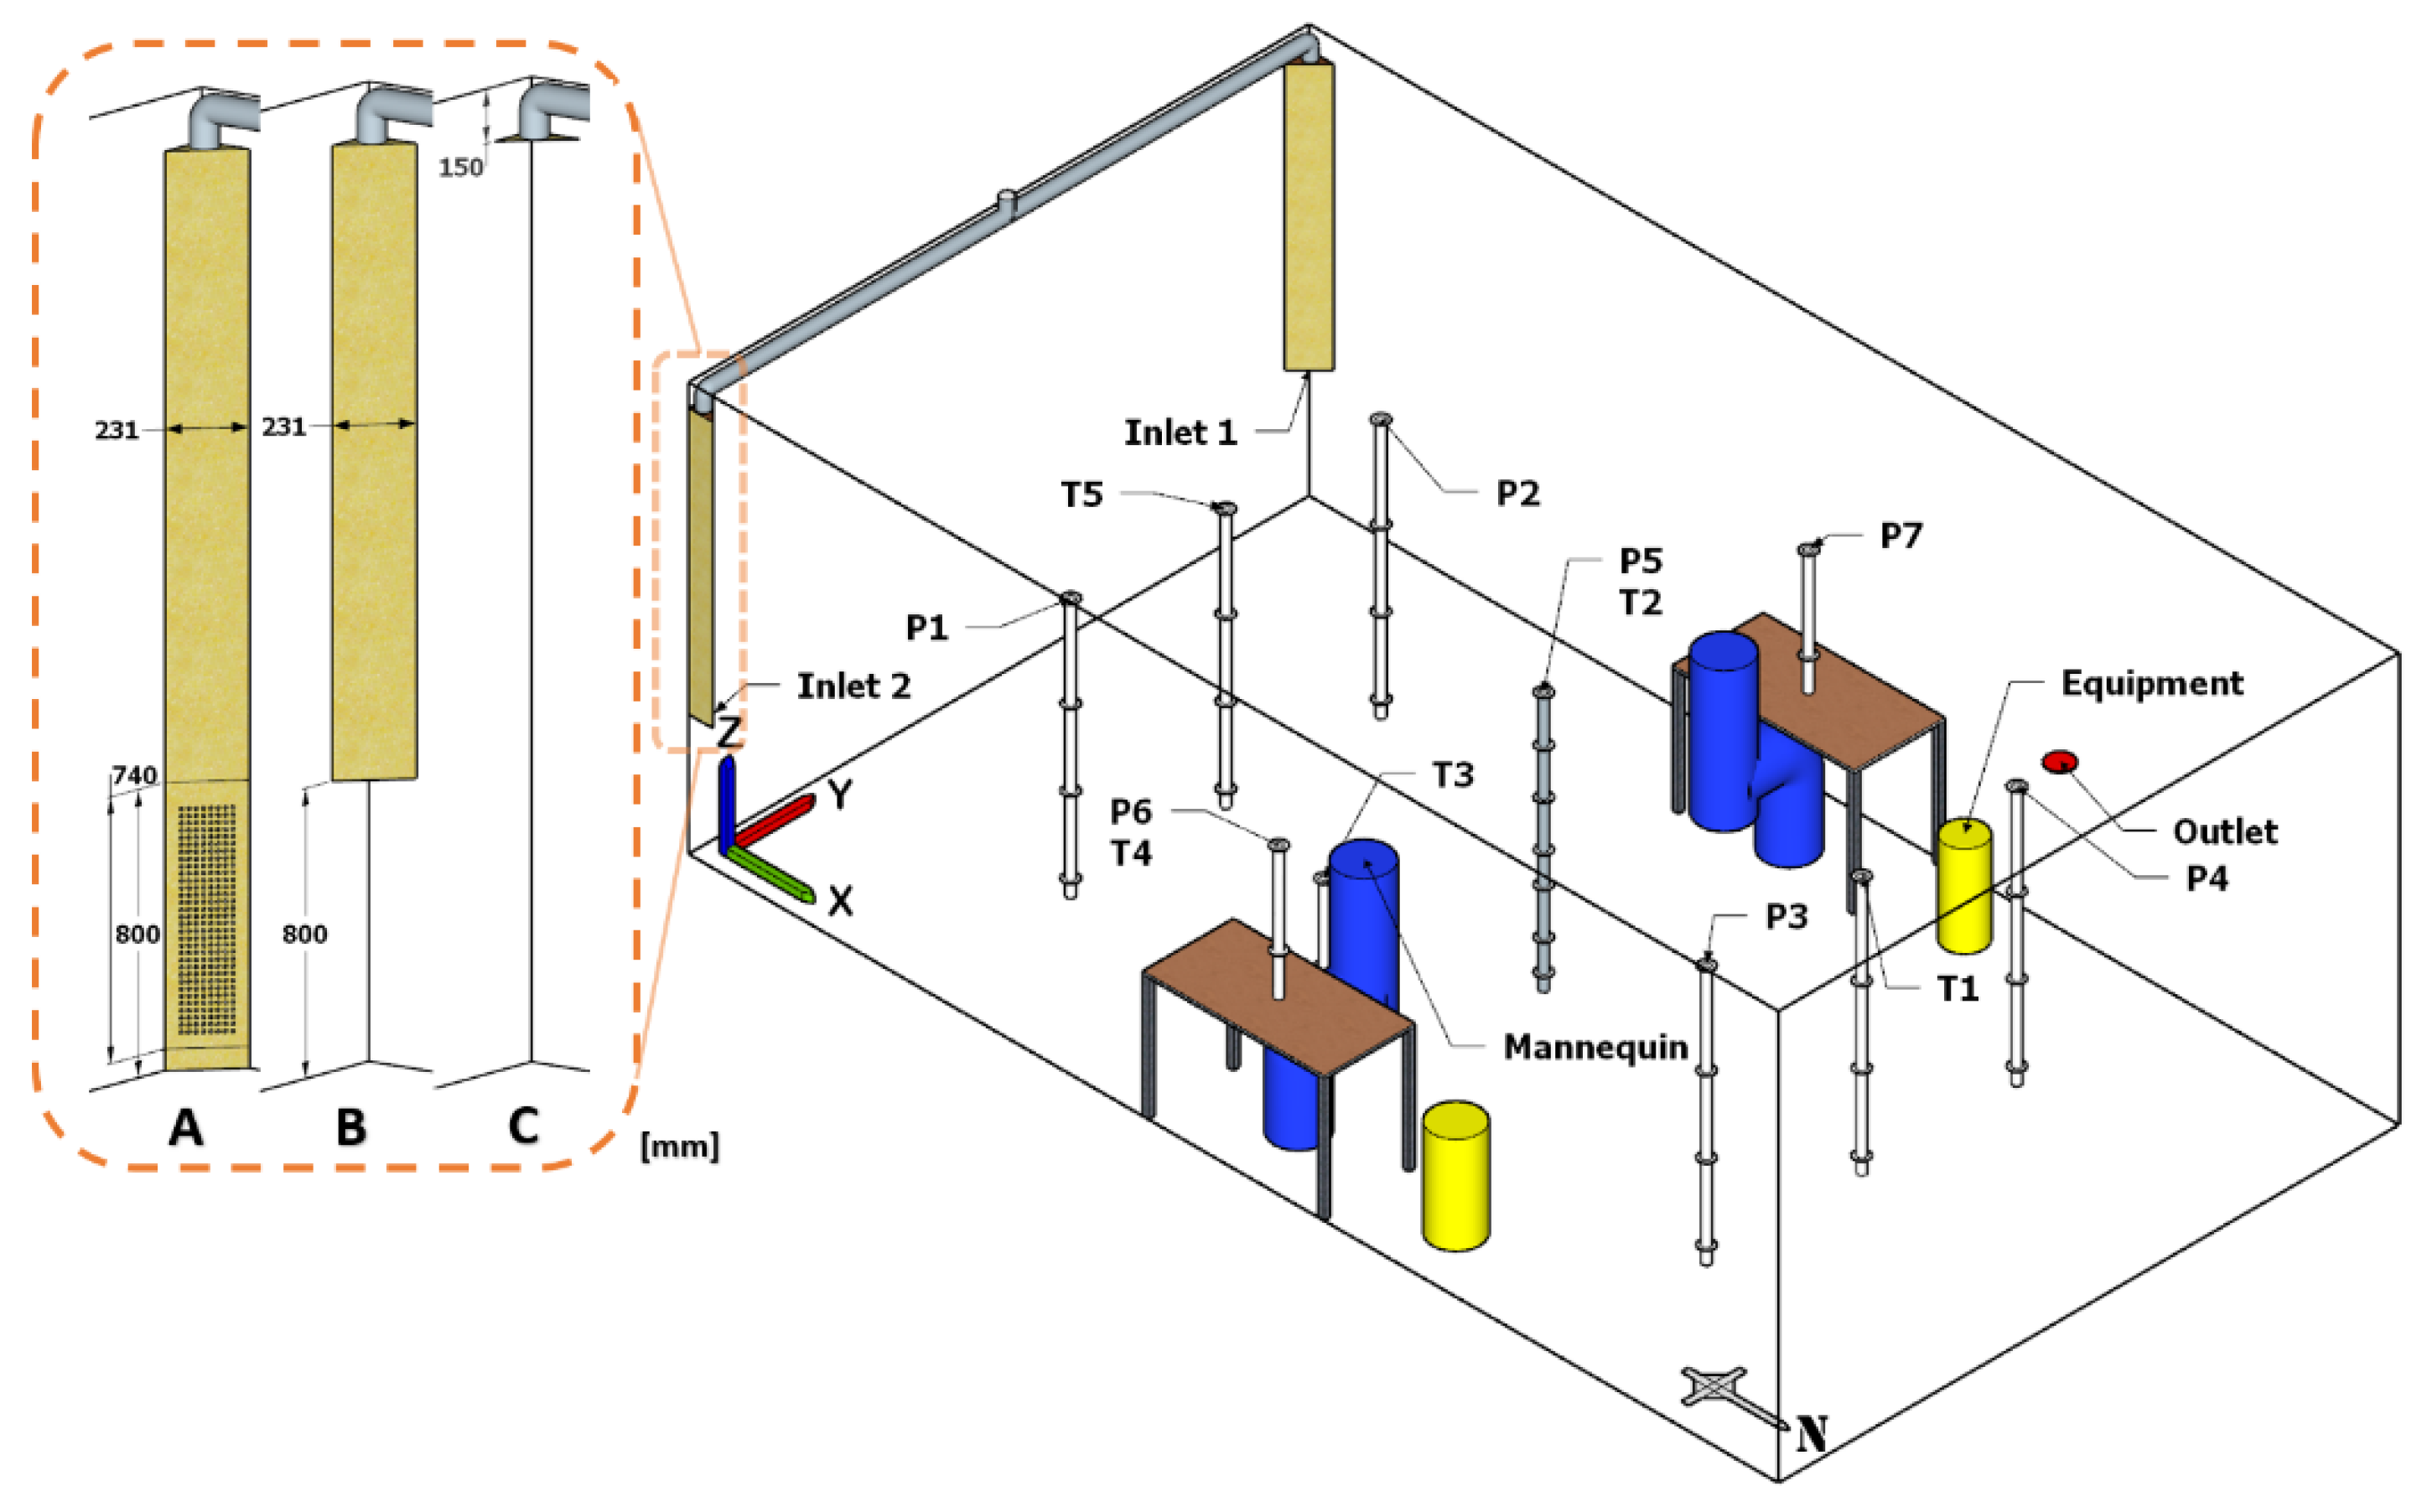
The study was carried out in a medium-sized mock-up of an open-plan office room, 7.2 (L) × 4.1 (W) × 2.67 (H) m. The room resembled a medium-sized open office space with three interior walls and one exterior wall. The room was divided into two sections that were occupied by two workstations, each containing a desk, a chair, and a seated thermal mannequin, as can be seen in Figure 1. The composition of the side walls from the inside to the outside were as follows: 15 mm wood sheet, 35 mm air gap, 15 mm wood sheet, 190 mm insulation, and 5 mm wood sheet. The floor and the main ceiling were insulated by a 150 mm-thick layer of mineral wool and covered by a layer of plastic sheet to reduce air infiltration. The suspended ceiling consisted of 60 cm × 60 cm fiberglass tiles and was located 31 cm below the main ceiling. The location of the room was inside a large laboratory hall with a steady temperature of 24.6 °C ± 0.9 °C during the measurement periods. The supply inlets were installed in the corners of the south wall. The main air inlet was in the middle of the wall section, and air was delivered to each device through well-insulated (20 mm mineral wool) ventilation tubes. The first supply devices (A) were installed in the lower section of the corners. The height location of these devices was similar to those used by many other researchers [4,8,14,17,49,50]. These devices represent DV. The second set of supply devices (B) represents CIJV. The shape of the outlet was an equilateral triangle, and the air entered the room at the height of 80 cm above the floor level. The last supply devices (C) were suspended 15 cm from the ceiling. These devices represent CMV, and the air entered the room from an inlet which had a circular shape and a diameter of 80 mm. In addition to the two mannequins, two heat sources were also placed on the side of the tables. There was only one outlet, which was located on the ceiling close to the north wall. A climate chamber was built up in connection to the north wall of the test room where three windows were located. For velocity and temperature measurements, 27 low-velocity omnidirectional thermistor anemometers were used. The thermistor and the logger system, CTA88, were designed and calibrated for velocities between 0.0 and 1.0 m/s. The turbulence intensity was calculated by the following equation
I p = u r m s U ¯   · 100 ( % )   ,
where u r m s is the root mean square of the turbulent velocity fluctuations, and U ¯ is the mean velocity. Measurements were performed at seven locations in the room. For position P1 through P4, the heights used were 0.1, 0.6, 1.1, and 1.7 m. For P5, 0.1, 0.3, 0.6, 0.8, 1.1, 1.4, and 1.7 m were used, and for P-6 and P-7, only 1.1 and 1.7 m were used. The sampling interval for all measurements was set to 600 s. The velocity was measured with an accuracy of ±0.05 m/s excluding the directional error with the response time of 0.2 s to 90% of a step change. The uncertainty of temperature measurements was ±0.2 °C with the response time of 12 s to 90% of value in still air. The temperatures of the supply inlets, exhaust, and surrounding laboratory were measured by using T-type (copper–constantan) thermocouples connected to an Agilent 34970A data logger and a computer. In order to confirm that the accuracy of the thermocouples and logger were in the expected range, all measuring devices were calibrated before and after the measurements.
Nine cases were studied which are listed in Table 2. The primary supply air temperature was maintained around 17.6 °C except for case C1-CMV which was 0.3 °C lower. It is important to mention that the comparisons were done in a non-dimensional form for all cases. The mannequins used in the experiments had the same surface area as a human, and each produced 100 W of heat in a sitting position. They were made of galvanized tube 0.32 m in diameter and covered with fabric to emit the same level of radiation as a normal person. Two black painted metal cylinders containing a halogen lamp generated 75 W of heat each when used in the experiments. There was also heat generation from the measuring equipment that amounted to 39 W. The nominal inlet air velocity and inlet Archimedes number were calculated on the basis of Ae for each supply device and case. The Ae for DV, CIJV, and CMV were 299, 133, and 50 cm2, respectively.
The measurement positions and other components of the experimental set-up are shown in Figure 2. Sulfur hexafluoride (SF6) was used as the tracer gas in this study. The measurements were performed at six locations in the room, at a height of 1.1 m. These were labeled T1 up to T5. The sixth location was at the outlet. During the experiments, the test room was exposed to about 350 ppm of SF6. Gas chromatography (GC) was used to measure the concentration of the gas in air samples. In each tracer gas test, air samples were collected via a pump connected to the GC and analyzed from five fixed locations in the room and one in the outlet. The measurements were repeated three times to ensure the validity of the results. The average deviation between the three measurements ranged between 1 to 3%. The uncertainty of measurements of mean age of air was ±2.5%, but, when including airflow variation, pressure balancing, air leakage, etc., this value might increase. The uncertainty of ACE in this study was estimated to be in compliance with Appendix E of ASHRAE Standard 129 [34].
The final estimated uncertainty of measured values of ACE was around 7% which was based on the negligible air leakage and the measuring accuracy of the equipment. This result is close to those reported by some other laboratory studies [42,43,44,45].

4. Results and Discussion

4.1. Flow Pattern and Thermal Conditions

The results of the dimensionless air temperature (DAT) for all the cases are shown in Figure 3. DAT is defined as a dimensionless value to compare the vertical air temperature profile between different cases and is defined as
DAT = T a T i T o T i   .
In position P1 (Figure 3a) and P2 (Figure 3b), which were close to the inlets, C2-DV showed the largest vertical temperate gradient, followed by C2-CIJV. The cases that showed the lowest gradient were C1-CMV and C3-CMV. The air in C2-CIJV entered the room closely attached to the wall before hitting the floor area in the corner of the room. It then moved and spread out as a layer over the floor area.
The air entrainment for C2-DV and C2-CIJV streams was lower compared to that for C2-CMV. Another observation is that the temperature profiles of C2-DV and C2-CIJV were very similar. When comparing C1 to C2 for DV and CIJV, the extra added heat in C2 generated more stratification. The results of P1 and P2 also showed a good level of symmetry.
In position P5 (Figure 3e), which was in the center of the office, the DAT values decreased compared to P1 and P2 because this area was located further away from the inlets, and the mannequins were in close proximity to this location. Although the stratification levels decreased for DV and CIJV, they were still larger than for CMV.
Positions P3 (Figure 3c) and P4 (Figure 3d) showed a similar pattern as P1 and P2 but with slightly lower gradients. The reason for this is that the temperature of the airstream along the floor increased with the distance from the supply devices.
The thermal stratification enhancement created by DV and CIJV are in agreement with other research results [5,10,51,52,53,54]. P6 (Figure 3f) location was above the table and was similar to P7.
The velocity profiles at P1 (Figure 4a) and P2 (Figure 4b) showed that the highest velocities were measured at 0.1 m above the floor level in all cases. The CMV cases showed the highest velocities, reaching 0.7 m/s for C3-CMV. This is explained by the special configuration of the CMV inlets. By being placed high up in the corner of the room and having a high supply velocity, the inlet air jets had a high level of entrainment. This created an airstream with higher momentum and higher boundary layer thickness compared to the other systems. In comparison, the airstreams for DV and CIJV had a thinner boundary layer when reaching P1 and P2. One can assume that the locations of the maximum air velocities were below 0.1 m for these systems.
In position P5 (Figure 4e), the velocities decreased in all cases compared to P1 and P2, except for C3-DV. One possible explanation for this is that the two airstreams merged at some point before reaching P5, with a combined momentum from both streams. It is also worth mentioning that P1 and P2 were not in the direct centerline of the airstreams and were not recording the center velocities of these streams.
The draught levels at P1 (Figure 5a) and P2 (Figure 5b) showed a strong connection to the velocity profiles. Because of the high velocities at P1 and P2, the draught levels were higher than normal in this part of the room. According to the ISO 7730 classifications, none of the cases was able to obtain category A. In one case, C3-CMV, it did not even pass the lowest category C. Continuing to P5 (Figure 5e), the DR decreased considerably, except for C3-DV and C3-CMV. The DR for all other cases was below 10% (category A). High levels of DR for MV compared to IJV have been shown in a previous study as well [5].
In position P3 (Figure 5c) and P4 (Figure 5d), the DR were at acceptable levels, except for C3-DV, for which it was slightly above 10% at 0.1 m.
Another way to illustrate the correlation between high velocities and high draught rates can be seen in Figure 6. Figure 6a shows the maximum draught rate (DRmax) based on all the points in each location at P1–P2, P5, and P3–P4. Figure 6b shows the maximum velocity (Umax) at the same locations, and Figure 6c shows the maximum temperature difference (∆Tmax). In the case of C3-CMV, it can be observed that ∆Tmax did not change between P5 and P3–P4 locations, but DRmax decreased considerably. This indicates a strong dependency of draught on velocity rates. Table 3 shows that PD was within category A classification for all cases.

4.2. Ventilation Effectiveness

The ACEp values presented in Table 4 show that CMV had the most uniform ACEp compared to the other systems. This indicated that the air was equally “fresh” in all the measuring locations and was well mixed. At position T3 located close to the mannequin, the best performance was achieved by DV, followed closely by CIJV. In DV and CIJV, the air was distributed as a layer over the floor area. The thickness and velocity of the layer was dependent on the shape and configuration of the supply device, and, as mentioned previously, the supply air in DV had a narrow and straightforward trajectory when entering the room, while, in CIJV, it spread out evenly across the floor when the air jet from the inlet hit the floor surface, as shown in previous studies [5,11].
The AEE values were close to each other in all cases. The reason for this is that AEE takes into account the mean age of air for the entire room. This means that it is possible to have high ACEp values in some zones, but lower values in others. C1-DV and C1-CIJV had the highest ACEavg, which were the average ACEp values for T1–T5. Higher ACEavg also led to slightly higher AEE values, as seen in Table 4.
Table 5 shows that ε T was lower for the CMV cases compared to the other systems at P1–P5. DV and CIJV performed best in the occupied zone (P5), excluding P6–P7. This result followed the same pattern as ACEp results, when comparing the three systems. Close to the heat sources, for example, the mannequins, DV and CIJV outperformed CMV in terms of both ACE and ε T .
To summarize the results, we found that DV and CIJV provided better heat removal efficiency and fresher air in the occupied areas of the room compared to CMV. However, DV had some shortcomings when evaluating the draught rates which were highly dependent on the velocity rates.
CMV behaved very similar to a regular mixing system, with low temperature stratification and even levels of ACE and ε T in the evaluated locations, compared to the other systems.

5. Conclusions

The findings show that the corner impinging jet air distribution system behaves very similar to the DV system and performs slightly better considering the draught rate. This study also shows that CIJV is a viable option when choosing an air distribution system for a medium-sized office room. The draught rates for this system were within the required levels in ISO 7730 for the occupied zone. Since CIJV obtained high values for both ACE and ε T , there is a possibility to slightly lower the supply rates in order to reduce fan energy usage, while still meeting the requirements for thermal comfort and IAQ. Although DV performed similar to CIJV, the special design of the supply inlets for this system resulted in an increase of DR in the occupied zone. It is important to note that this study was based only on one-room geometry and one configuration of workstation placement in the room. Typical DV systems are not designed for heating mode, which is believed to be a shortcoming of the system because of the dominance of thermal forces to momentum forces. In contrast, the impinging jet system, with its higher momentum, overcomes this shortcoming. Further studies have to be conducted in order to evaluate the corner impinging jet when the outside temperature is lower than the inside one (heating mode), with different room geometries, and with different set-ups of the workstations. Finally, the promising results and the simplicity of installation and design make corner impinging jet ventilation an interesting research topic for the scientific community.

Author Contributions

Main contribution was made by A.A.; The other three authors contributed equally.

Funding

Internal research funding from the University of Gävle.

Acknowledgments

The authors are grateful for the valuable help from University of Gävle’s laboratory staff and the possibility of using the university’s laboratory facilities.

Conflicts of Interest

The authors declare no conflicts of interest.

Nomenclature

ACEair change effectiveness [-]
ACEavgaverage spatial air change effectiveness in a region [-]
ACEplocal air change effectiveness [-]
AEEair exchange effectiveness [-]
Ariinlet Archimedes number [-]
CIJVcorner impinging jet ventilation
CMVcorner mixing ventilation
DATdimensionless vertical air temperature [-]
DRdraught rate [%]
DRmaxmaximum draught rate between 0.1 m and 1.7 m above floor level [%]
DVdisplacement ventilation
IAQindoor air quality
IJVimpinging jet ventilation
MVmixing ventilation
PDpercentage dissatisfied due to vertical air temperature difference [%]
WCJwall confluent jets ventilation
Aeinlet supply opening area [m2]
Cplocal tracer gas concentration [ppm]
Cotracer gas concentration at outlet [ppm]
Iplocal turbulent intensity [-]
ggravitational acceleration [m/s2]
qvventilation flow rate [m3/s]
u r m s the root mean square of turbulent velocity fluctuations [m/s]
ttime [s]
T ¯ 0.1 , 0.6 , 1.1 arithmetic mean air temperature based on the values at the heights of 0.1, 0.6, and 1.1 m [°C]
Talocal air temperature [°C]
Timean supply air temperature [°C], [K]
Tomean outlet air temperature [°C]
Trmean air temperature in the center of the room at 1.7 m above floor level [°C], [K]
Δ T 0.1 1.1 vertical air temperature gradient between 0.1 m and 1.1 m above floor level [°C]
Δ T m a x maximum air temperature gradient between 0.1 m and 1.7 m above floor level [°C]
ualocal air velocity [m/s]
uinnominal inlet air velocity [m/s]
U ¯ mean air velocity [m/s]
U m a x maximum air velocity between 0.1 m and 1.7 m above floor level [m/s]
Vvolume [m3]
ε T temperature effectiveness [-]
τ ¯ room mean age of air [s]
τ n nominal time constant [s]
τ ¯ a v g arithmetic average age of air [s]
τ ¯ p local mean age of air [s]

References

  1. Vimalanathan, K.; Babu, T.R. The effect of indoor office environment on the work performance, health and well-being of office workers. J. Environ. Health Sci. Eng. 2014, 12, 113. [Google Scholar] [CrossRef] [PubMed] [Green Version]
  2. Allen, J.G.; MacNaughton, P.; Satish, U.; Santanam, S.; Vallarino, J.; Spengler, J.D. Associations of cognitive function scores with carbon dioxide, ventilation, and volatile organic compound exposures in office workers: A controlled exposure study of green and conventional office environments. Environ. Health Perspect. 2015, 124, 805–812. [Google Scholar] [CrossRef]
  3. IEA World Energy Balances 2018: Overview. 2018, p. 24. Available online: https://webstore.iea.org/world-energy-balances-2018-overview (accessed on 12 October 2018).
  4. Xing, H.; Hatton, A.; Awbi, H. A study of the air quality in the breathing zone in a room with displacement ventilation. Build. Environ. 2001, 36, 809–820. [Google Scholar] [CrossRef]
  5. Chen, H.; Janbakhsh, S.; Larsson, U.; Moshfegh, B. Numerical investigation of ventilation performance of different air supply devices in an office environment. Build. Environ. 2015, 90, 37–50. [Google Scholar] [CrossRef]
  6. Serra, N.; Semiao, V. Comparing displacement ventilation and mixing ventilation as HVAC strategies through CFD. Eng. Comput. 2009, 26, 950–971. [Google Scholar] [CrossRef]
  7. He, G.; Yang, X.; Srebric, J. Removal of contaminants released from room surfaces by displacement and mixing ventilation: Modeling and validation. Indoor Air 2005, 15, 367–380. [Google Scholar] [CrossRef] [PubMed]
  8. Lin, Z.; Chow, T.; Fong, K.; Tsang, C.; Wang, Q. Comparison of performances of displacement and mixing ventilations. Part II: Indoor air quality. Int. J. Refrig. 2005, 28, 288–305. [Google Scholar] [CrossRef]
  9. Chen, H.; Moshfegh, B.; Cehlin, M. Numerical investigation of the flow behavior of an isothermal impinging jet in a room. Build. Environ. 2012, 49, 154–166. [Google Scholar] [CrossRef]
  10. Chen, H.; Moshfegh, B.; Cehlin, M. Investigation on the flow and thermal behavior of impinging jet ventilation systems in an office with different heat loads. Build. Environ. 2013, 59, 127–144. [Google Scholar] [CrossRef]
  11. Chen, H.; Moshfegh, B.; Cehlin, M. Computational investigation on the factors influencing thermal comfort for impinging jet ventilation. Build. Environ. 2013, 66, 29–41. [Google Scholar] [CrossRef]
  12. Haghshenaskashani, S.; Sajadi, B.; Cehlin, M. Multi-objective optimization of impinging jet ventilation systems: Taguchi-based CFD method. Build. Simul. 2018, 11, 1207–1214. [Google Scholar] [CrossRef]
  13. Cehlin, M.; Larsson, U.; Chen, H. Numerical investigation of Air Change Effectiveness in an Office Room with Impinging Jet Ventilation. In Proceedings of the 4th international Conference on Building Energy & Environment (COBEE2018), Melbourne, Australia, 5–9 February 2018; pp. 641–646. [Google Scholar]
  14. Karimipanah, T.; Awbi, H. Theoretical and experimental investigation of impinging jet ventilation and comparison with wall displacement ventilation. Build. Environ. 2002, 37, 1329–1342. [Google Scholar] [CrossRef]
  15. Koufi, L.; Younsi, Z.; Cherif, Y.; Naji, H.; El Ganaoui, M. A numerical study of indoor air quality in a ventilated room using different strategies of ventilation. Mech. Ind. 2017, 18, 221. [Google Scholar] [CrossRef] [Green Version]
  16. Ye, X.; Zhu, H.; Kang, Y.; Zhong, K. Heating energy consumption of impinging jet ventilation and mixing ventilation in large-height spaces: A comparison study. Energy Build. 2016, 130, 697–708. [Google Scholar] [CrossRef]
  17. Cao, G.; Awbi, H.; Yao, R.; Fan, Y.; Sirén, K.; Kosonen, R.; Zhang, J.J. A review of the performance of different ventilation and airflow distribution systems in buildings. Build. Environ. 2014, 73, 171–186. [Google Scholar] [CrossRef]
  18. Awbi, H.B. Ventilation for good indoor air quality and energy efficiency. Energy Procedia 2017, 112, 277–286. [Google Scholar] [CrossRef]
  19. Larsson, U. On the Performance of Stratified Ventilation; Linköping University Electronic Press: Linköping, Sweden, 2018. [Google Scholar]
  20. Arghand, T.; Karimipanah, T.; Awbi, H.B.; Cehlin, M.; Larsson, U.; Linden, E. An experimental investigation of the flow and comfort parameters for under-floor, confluent jets and mixing ventilation systems in an open-plan office. Build. Environ. 2015, 92, 48–60. [Google Scholar] [CrossRef]
  21. Wu, X.; Fang, L.; Olesen, B.W.; Zhao, J. Air distribution and ventilation effectiveness in a room with floor/ceiling heating and mixing/displacement ventilation. In Proceedings of the 8th International Symposium on Heating, Ventilation and Air Conditioning (ISHVAC2013), Xi’an, China, 19–21 October 2013; pp. 59–67. [Google Scholar]
  22. Amai, H.; Novoselac, A. Experimental study on air change effectiveness in mixing ventilation. Build. Environ. 2016, 109, 101–111. [Google Scholar] [CrossRef] [Green Version]
  23. Conceição, E.Z.; Lúcio, M.M.J.; Awbi, H.B. Comfort and airflow evaluation in spaces equipped with mixing ventilation and cold radiant floor. Build. Simul. 2013, 6, 51–67. [Google Scholar] [CrossRef]
  24. Shan, X.; Zhou, J.; Chang, V.W.-C.; Yang, E.-H. Comparing mixing and displacement ventilation in tutorial rooms: Students’ thermal comfort, sick building syndromes, and short-term performance. Build. Environ. 2016, 102, 128–137. [Google Scholar] [CrossRef]
  25. Ren, S.; Tian, S.; Meng, X. Comparison of Displacement Ventilation, Mixing Ventilation and Underfloor Air Distribution System. In Proceedings of the 2015 International Conference on Architectural, Civil and Hydraulics Engineering (ICACHE 2015), Guangzhou, China, 28–29 November 2015; pp. 79–82. [Google Scholar]
  26. Zhou, J.; Chau, H.; Kang, Y.; Hes, D.; Noguchi, M.; Aye, L. Comparing mixing ventilation and displacement ventilation in university classrooms. In Proceedings of the Zero Energy Mass Custom Home (ZEMCH2018), Melbourne, Australia, 29 January–1 February 2018; pp. 263–274. [Google Scholar]
  27. Cheng, Y.; Lin, Z. Experimental study of airflow characteristics of stratum ventilation in a multi-occupant room with comparison to mixing ventilation and displacement ventilation. Indoor Air 2015, 25, 662–671. [Google Scholar] [CrossRef]
  28. Vachaparambil, K.; Cehlin, M.; Karimipanah, T. Comparative Numerical Study of the Indoor Climate for Mixing and Confluent Jet Ventilation Systems in an Open-plan Office. In Proceedings of the 4th International Conference On Building Energy & Environment (COBEE2018), Melbourne, Australia, 5–9 February 2018; pp. 73–78. [Google Scholar]
  29. ISO 7730. Ergonomics of the Thermal Environment-Analytical Determination and Interpretation of Thermal Comfort Using Calculation of the PMV and PPD Indices and Local Thermal Comfort Criteria; ISO: Geneva, Switzerland, 2005. [Google Scholar]
  30. Nielsen, P.V. Displacement Ventilation: Theory and Design; Aalborg University: Aalborg, Denmark, 1993; p. 42. Available online: https://www.forskningsdatabasen.dk/en/catalog/2389386598 (accessed on 5 October 2018).
  31. Qingyan, C.; Van Der Kooi, J.; Meyers, A. Measurements and computations of ventilation efficiency and temperature efficiency in a ventilated room. Energy Build. 1988, 12, 85–99. [Google Scholar] [CrossRef]
  32. Artmann, N.; Jensen, R.L.; Manz, H.; Heiselberg, P. Experimental investigation of heat transfer during night-time ventilation. Energy Build. 2010, 42, 366–374. [Google Scholar] [CrossRef]
  33. Olesen, B.W.; Simone, A.; KrajcÍik, M.; Causone, F.; Carli, M.D. Experimental study of air distribution and ventilation effectiveness in a room with a combination of different mechanical ventilation and heating/cooling systems. Int. J. Vent. 2011, 9, 371–383. [Google Scholar] [CrossRef]
  34. ASHRAE Standard 129-1997 (RA 2002). Measuring Air Change Effectiveness; ASHRAE: Atlanta, GA, USA, 2002. [Google Scholar]
  35. Mundt, M.; Mathisen, H.M.; Moser, M.; Nielsen, P.V. Ventilation Effectiveness; REHVA: Brussels, Belgium, 2004; ISBN 978-29-6004-680-9. [Google Scholar]
  36. Breum, N. Ventilation efficiency in an occupied office with displacement ventilation—A laboratory study. Environ. Int. 1992, 18, 353–361. [Google Scholar] [CrossRef]
  37. Krajčík, M.; Simone, A.; Olesen, B.W. Air distribution and ventilation effectiveness in an occupied room heated by warm air. Energy Build. 2012, 55, 94–101. [Google Scholar] [CrossRef]
  38. Fisk, W.; Faulkner, D.; Pih, D.; McNeel, P.; Bauman, F.; Arens, E. Indoor air flow and pollutant removal in a room with task ventilation. Indoor Air 1991, 1, 247–262. [Google Scholar] [CrossRef]
  39. Larsson, U.; Moshfegh, B. Comparison of ventilation performance of three different air supply devices: A measurement study. Int. J. Vent. 2017, 16, 244–254. [Google Scholar] [CrossRef]
  40. Sandberg, M.; Blomqvist, C. A quantitative estimate of the accuracy of tracer gas methods for the determination of the ventilation flow rate in buildings. Build. Environ. 1985, 20, 139–150. [Google Scholar] [CrossRef]
  41. Almesri, I.; Awbi, H.; Foda, E.; Sirén, K. An air distribution index for assessing the thermal comfort and air quality in uniform and nonuniform thermal environments. Indoor Built Environ. 2013, 22, 618–639. [Google Scholar] [CrossRef]
  42. Faulkner, D.; Fisk, W.; Sullivan, D. Indoor airflow and pollutant removal in a room with floor-based task ventilation: Results of additional experiments. Build. Environ. 1995, 30, 323–332. [Google Scholar] [CrossRef] [Green Version]
  43. Buratti, C.; Mariani, R.; Moretti, E. Mean age of air in a naturally ventilated office: Experimental data and simulations. Energy Build. 2011, 43, 2021–2027. [Google Scholar] [CrossRef]
  44. Cehlin, M.; Karimipanah, T.; Larsson, U.; Ameen, A. Comparing thermal comfort and air quality performance of two active chilled beam systems in an open-plan office. J. Build. Eng. 2019, 22, 56–65. [Google Scholar] [CrossRef]
  45. Sandberg, M.; Sjöberg, M. The use of moments for assessing air quality in ventilated rooms. Build. Environ. 1983, 18, 181–197. [Google Scholar] [CrossRef]
  46. Sandberg, M. What is ventilation efficiency? Build. Environ. 1981, 16, 123–135. [Google Scholar] [CrossRef]
  47. Both, B.; Szánthó, Z. Objective investigation of discomfort due to draught in a tangential air distribution system: Influence of air diffuser’s offset ratio. Indoor Built Environ. 2018, 27, 1105–1118. [Google Scholar] [CrossRef]
  48. Cehlin, M. Visualization of Air Flow, Temperature and Concentration Indoors: Whole-Field Measuring Methods and CFD. Ph.D. Thesis, KTH, Stockholm, Sweden, 2006. [Google Scholar]
  49. Novoselac, A.; Srebric, J. A critical review on the performance and design of combined cooled ceiling and displacement ventilation systems. Energy Build. 2002, 34, 497–509. [Google Scholar] [CrossRef]
  50. Loveday, D.; Parsons, K.; Taki, A.; Hodder, S. Displacement ventilation environments with chilled ceilings: Thermal comfort design within the context of the BS EN ISO7730 versus adaptive debate. Energy Build. 2002, 34, 573–579. [Google Scholar] [CrossRef]
  51. Schiavon, S.; Bauman, F.; Tully, B.; Rimmer, J. Room air stratification in combined chilled ceiling and displacement ventilation systems. HVAC&R Res. 2012, 18, 147–159. [Google Scholar]
  52. Li, Y.; Sandberg, M.; Fuchs, L. Vertical temperature profiles in rooms ventilated by displacement: Full-scale measurement and nodal modelling. Indoor Air 1992, 2, 225–243. [Google Scholar] [CrossRef]
  53. Cermak, R.; Melikov, A.K. Air quality and thermal comfort in an office with underfloor, mixing and displacement ventilation. Int. J. Vent. 2006, 5, 323–352. [Google Scholar] [CrossRef]
  54. Yin, Y.; Xu, W.; Gupta, J.K.; Guity, A.; Marmion, P.; Manning, A.; Gulick, B.; Zhang, X.; Chen, Q. Experimental study on displacement and mixing ventilation systems for a patient ward. HVAC&R Res. 2009, 15, 1175–1191. [Google Scholar] [CrossRef]
Figure 1. Layout of the test chamber. Three supply devices are illustrated for displacement ventilation (DV, A), corner impinging jet ventilation (CIJV, B), and corner mixing ventilation (CMV, C).
Energies 12 01354 g001
Figure 2. Measurement positions and schematic top-view layout of the office room.
Energies 12 01354 g002
Figure 3. Dimensionless vertical air temperature (DAT) profiles at positions P1 (a), P2 (b), P3 (c), P4 (d), P5 (e), and P6 (f) for all cases.
Energies 12 01354 g003
Figure 4. Velocity profiles at positions P1 (a), P2 (b), P3 (c), P4 (d), P5 (e), and P6 (f) for all cases.
Energies 12 01354 g004aEnergies 12 01354 g004b
Figure 5. Draught levels at position P1 (a), P2 (b), P3 (c), P4 (d), P5 (e), and P6 (f) for all cases.
Energies 12 01354 g005aEnergies 12 01354 g005b
Figure 6. (a) Maximum draught rate, (b) maximum velocity, and (c) maximum temperature difference in positions P1–P2, P5, and P3–P4.
Energies 12 01354 g006
Table 1. Local thermal comfort category based on ISO 7730. DR: draught rate PD: percentage dissatisfied.
CategoryDRMaximum Mean Air Speed (m/s)PD
SummerWinter
A<10%0.120.10<3%
B<20%0.190.16<5%
C<30%0.240.21<10%
Table 2. Case conditions for different ventilation systems.
CaseVentilation SystemSupply Flow Rate [L/s]Occupant [W]Equipment [W]Inlet Temp. [°C]uin [m/s]Ari × 10−4
C1-DVDV2 × 202 × 100-17.60.67649
C1-CIJVCIJV2 × 202 × 100-17.61.5191
C1-CMVCMV2 × 202 × 100-17.33.988
C2-DVDV2 × 202 × 1002 × 7517.60.67787
C2-CIJVCIJV2 × 202 × 1002 × 7517.61.51104
C2-CMVCMV2 × 202 × 1002 × 7517.63.989
C3-DVDV2 × 302 × 1002 × 7517.61.00317
C3-CIJVCIJV2 × 302 × 1002 × 7517.62.2639
C3-CMVCMV2 × 302 × 1002 × 7517.65.973
Table 3. Local discomfort (PD) due to high vertical air temperature difference between head and ankle.
CasePositionC1-DVC1-CIJVC1-CMVC2-DVC2-CIJVC2-CMVC3-DVC3-CIJVC3-CMV
PDP11.2%1.1%0.6%1.9%1.3%0.5%1.0%0.7%0.5%
P21.2%1.0%0.5%1.7%1.2%0.6%1.1%0.7%0.5%
P30.7%0.5%0.3%0.9%0.7%0.4%0.6%0.4%0.3%
P40.6%0.4%0.4%0.8%0.6%0.4%0.7%0.4%0.4%
P50.8%0.7%0.3%1.3%1.0%0.3%1.2%0.5%0.3%
Table 4. Air change effectiveness (ACE), local and average, and air exchange effectiveness (AEE) for all cases.
CasePositionC1-DVC1-CIJVC1-CMVC2-DVC2-CIJVC2-CMVC3-DVC3-CIJVC3-CMV
ACEpT11.641.471.051.151.391.131.341.131.03
T21.411.461.081.091.251.151.251.211.06
T3 11.611.551.071.501.371.141.301.171.04
T41.471.541.031.321.381.111.321.141.01
T51.331.381.061.041.171.131.211.261.03
ACEavg 2 1.481.471.061.201.311.131.281.181.03
AEE 0.580.610.520.560.540.550.550.530.50
1 The location was in the occupied zone close to the mannequin, as also shown in Figure 2. 2 ACEavg is the average ACE value for the measuring points T1–T5.
Table 5. Average ε T in locations P1–P7 for all cases.
CasePositionC1-DVC1-CIJVC1-CMVC2-DVC2-CIJVC2-CMVC3-DVC3-CIJVC3-CMV
ε T   1P11.251.241.081.301.301.141.311.311.00
P21.261.241.081.321.311.151.341.321.01
P31.221.21.091.271.251.151.371.291.02
P41.211.181.081.261.231.141.361.281.01
P51.151.131.081.201.171.141.271.241.01
ε T 2P60.970.990.951.011.011.021.071.070.87
P71.001.041.011.051.061.081.121.140.92
1 calculated by using the arithmetic mean air temperature of the heights 0.1, 0.6, and 1.1 m. 2 calculated by using the arithmetic mean air temperature of the height 1.1 m only.

