The Impact of Selected Biofuels on the Skoda Roomster 1.4TDI Engine’s Operational Parameters
by
 ,
,
Martin Kotek
1,* ,
,
Jakub Mařík
1,
Petr Zeman
2,
Veronika Hartová
1,
Jan Hart
3 and
Vladimir Hönig
2 1
Faculty of Engineering, Department of Vehicles and Ground Transport, Czech University of Life Science Prague, Kamýcká 129, 6, 169 21 Prague, Czech Republic
2
Faculty of Agrobiology, Food and Natural Resources, Department of Chemistry, Czech University of Life Science Prague, Kamýcká 129, 6, 169 21 Prague, Czech Republic
3
Faculty of Engineering, Department of Technological Equipment of Buildings, Czech University of Life Science Prague, Kamýcká 129, 6, 169 21 Prague, Czech Republic
*
Author to whom correspondence should be addressed.
Energies 2019, 12(7), 1388; https://doi.org/10.3390/en12071388
Submission received: 6 March 2019
/
Revised: 27 March 2019
/
Accepted: 9 April 2019
/
Published: 10 April 2019
(This article belongs to the Special Issue Recent Technologies on Using Biofuels in I.C. Engines for Improved Combustion and Emissions Mitigation)
Abstract
:Road transport is increasing all around the globe and biofuels have come to the forefront of public interest. According to Article 3, Directive 2009/28/EC, each member state has to ensure that an energy share from renewable sources in all forms of transportation reaches at least 10% of the final consumption of energy in transportation until 2020. The blending of biofuels is one of the methods available to member states to meet this target and it might even be expected to be a main contributor. This article analyses and compares selected biofuels, their chemical properties and their influence on engine operational parameters. The operational parameters of the diesel engine of the Skoda Roomster 1.4 TDI were measured on a chassis dynamometer according to the NEDC driving cycle, and pure diesel fuel, HVO and a blend of fuels (diesel fuel, HVO and butanol) were used for comparison. Operation on biofuels shows a slight decrease in performance parameters up to 10% and an increase in emission production (especially CO in the case of D50H30B20). Positive influences of biofuels were proven with a decrease in exhaust gas opacity and particulate matter production, up to 50% in the case of D50H30B20.
1. Introduction
The consumption of fossil fuels keeps growing together with a significant increase in sales of diesel vehicles in Europe. Emissions coming from these vehicles have an impact on both human health and the environment [1,2,3,4,5,6]. The European Union (EU) regulates emissions production by introducing more strict limits. The EU is also going to implement more onerous driving cycle WLTPs (Worldwide Harmonized Light Vehicles Test Procedures).
The aim of the regulations of the EU is to increase the proportion of renewable energy up to 10% by the year 2020 in order to reduce the production of greenhouse gases, especially CO2 [7].
The blending of biofuels is one of the methods available to member states to meet this target and it might even be expected to be a main contributor. This is a real imperative because the mandatory percentage target for energy from renewable sources is likely to become increasingly difficult to achieve sustainably as the overall demand for energy in the transportation segment continues to rise.
Bioethanol and fatty-acid-methyl-ester (FAME) are the most commonly used biofuels in Europe. Vegetable oil may be processed in other ways than transesterification, which produces FAME. Raw vegetable oil can be added into the diesel in the ratio 20% oil and 80% diesel and it can be burned without modification of the engine [8], some sources state 30% of oil [9].
Another possibility is to use pure vegetable oil but it requires modification of the fuel system because it is necessary to preheat the oil to reduce viscosity [10]. The main disadvantages of FAME are the high price of the input feedstock and low storage and oxidation stability. In comparison with pure diesel, generally FAME has lower mass calorific value, higher density and higher viscosity [11].
Another way of processing the vegetable oil is hydrogenation (hydrogenated vegetable oil—HVO) [12,13]. To produce the HVO, there may also be used—besides the pure vegetable oil—other kinds of triglyceride-rich waste materials (animal fats, used cooking oil, etc.) [14]. Production of HVO from these waste fats is less difficult than production of biodiesel. Therefore, HVO is sometimes referred to as the second-generation biofuel. HVO production is based on the reaction of triglycerides with hydrogen [15].
It consists of paraffinic hydrocarbons with a linear chain, and is free from aromatics, oxygen and sulphur [16].
HVO has a lower density compared to the diesel fuel and comparable caloric value [17]. HVO also has a low content of sulphur, which leads to the reduction of emissions of SO2, NOx, particulates and aromatics [13]. HVO has lower fuel consumption, lower loss of power and higher engine efficiency than conventional biodiesel [18].
The objective of this study is to compare pure diesel and selected biofuels—pure HVO and mixed biofuel D50H30B20 (50% vol. diesel, 30% vol. HVO and 20% vol. butanol), their chemical properties and their influence on engine performance parameters and opacity.
The mixed fuel D50H30B20 was chosen because butanol, as a second-generation biofuel, and HVO, as one and a half generation biofuel (in the case of production from the second-generation waste), will serve as a suitable fossil fuel replacement. The purpose is to maximize the utilization of biobutanol as a promising fuel that can be used in limited quantities for diesel engines. HVO positively increases the cetane number in the mixture, which butanol reduces in the mixture. Indirectly it can be said that HVO can serve as an additive in a mixture for increasing the cetane number. As shown by the fuel designation, this blend is composed of diesel (pure—without bioadditives) 50% vol., HVO 30% vol. and butanol 20% vol.
Butanol can be used up to 30% vol., but due to the lower HVO lubricity in the mixture used, the volume of butanol has been reduced to 20% vol. This blend has been designed with regard to decarbonising the EU as planned for 2020, 2030, 2050. According to this plan, new biofuels should contain 50% of RES (renewable energy sources) exclusively from plant sources that are not mutually substitutable, because alcohol-based biofuels are predominantly intended for petrol engines. The addition of butanol in diesel fuel will provide fine atomization of the fuel during injection as the resulting droplets have a larger overall surface and a higher evaporation rate. With regard to the boiling point of butanol, its quick evaporation from the mixture after injection into the cylinder and thus the irregular operation of the engine should not occur. At the same time, the presence of heavier components contained in the diesel fuel, which evaporates gradually during the compression stroke, which cools the combustion chamber walls, is also ensured in mixtures up to 30% vol. of butanol.
2. Materials and Methods
The vehicle Skoda Roomster 1.4 TDI with three-cylinder turbocharged compression ignition (CI) engine (Skoda auto a.s., Mladá Boleslav, Czech Republic) was used in this experiment. Detailed technical specifications of the car are summarized in Table 1.
Performance parameters and opacity of exhaust gases were measured using the pure diesel fuel, the HVO and the blended biofuels D50H30B20 (50% vol. diesel, 30% vol. HVO and 20% vol. butanol). Other operating parameters were measured on the chassis dynamometer under NEDC driving cycle conditions. The schema of the experiment is shown in Figure 1.
In the first stage, the vehicle’s performance parameters were measured on a chassis dynamometer. In the second stage of the experiment, the opacity of exhaust gases for each tested fuel was measured using opacimeter Atal AT–605 (ATAL, Tábor, Czech Republic) (technical specification, see Table 2). The opacimeter’s smokiness measuring method was in accordance with ECE R24 directives for measuring by free acceleration method.
In the third stage of the experiment, the operational parameters of the tested vehicle were measured under NEDC driving cycle. Classification of PM was analysed by the engine exhaust particle sizer (EEPS) TSI model 3090 whose detailed specification is shown in Table 3. The analyser enables detection of particle sizes and monitors their number. The obtained data are presented as a size range of produced particles. The measured sample was taken from the exhaust gas and then was diluted by the device. Within the experiments, only the relative changes in the production of PM in the diluted exhaust gas were evaluated.
Emission analyser VMK (manufactured by company VMK-RTG s.r.o, Prague, Czech Republic) was used to measure gaseous emissions. The analyser uses nondispersive infrared (NDIR) method to detect CO, CO2 and HC emissions and electrochemical cell for O2 and NOX emissions. Data was recorded with 1 Hz frequency on memory card. The technical data of the analyser are summarized in Table 4.
During the measurements, vehicle operating data from the engine control unit was recorded via the OBD interface (engine speed, engine load, speed, MAF, IAT). Car diagnostic system VAG–COM was used for communication and recording data from the OBD.
The fuel consumption was measured by the laboratory scale Vibra AJ 6200 (Shinko Denshi CO. LTD, Tokyo, Japan) (technical specification, see Table 5).
In the last stage of the experiment, the following chemical parameters of selected fuels were measured:
- Density at 15 °C by EN ISO 3675
- Kinematic viscosity at 40 °C by EN ISO 3104
- CFPP—Cold filter plugging point by EN 116
- Cetane number by EN ISO 5165
- Cetane index by EN ISO 4264
- Flash point by EN 22719
3. Results
3.1. Results of Chemical Properties
The density of the mixture (Table 6) is influenced by a lower density of both the HVO and butanol compared to the diesel fuel. As the fuel is dosed by volume, we can expect a slight loss of power and an increase in fuel consumption with respect to the quotient of butanol. Biobutanol as an alcohol with a short hydrocarbon chain has a lower calorific value compared to the diesel fuel and HVO, which will manifest in the mixture. Pure butanol has also a very low cetane number compared to the diesel fuel, but the presence of HVO positively compensates for this value. The amount of the HVO cetane number given by the manufacturer is >70.0 units. Therefore, HVO acts in the mixture as a suitable additive in increasing the cetane number.
Both the butanol and the HVO have very good low-temperature properties characterized by the values of cloud point and cold filter plugging point (CFPP). The CFPP value of the clean diesel fuel reached −17 °C and the cloud point parameter was −5 °C.
The use of biobutanol at low temperatures is characterized by a crystallisation temperature that is much lower than the CFPP of winter diesel fuel. The CFPP value of pure HVO normally corresponds to the value of winter diesel fuel and there are no complications at low temperatures, compared to the case of conventional biodiesel in the form of FAME. The cloud point parameter is very close to CFPP in the case of pure HVO.
The tested mixture was also stable at very low temperatures and therefore does not require the use of stabilisers. This is a very important finding as the commercially used bioethanol shows difficult stability in mixtures at low temperatures. That is why the use of biobutanol seems preferable, which is further reinforced by the fact that biobutanol is not hydroscopic compared to bioethanol.
Ingredients of biobutanol have significant impact on the flash point value. While diesel fuel is characterized as a III hazard class inflammable product with the flash point value >55 °C, the value of the flash point of the mixture was only 35 °C. Flash point, however, is used for classification in liquids hazard classes. However, the resulting blend is characterized as a II hazard class flammable product; such a decrease of flash point is irrelevant to the process of combustion.
It is necessary to take this parameter into account to ensure safety during storage and handling of the mixture.
3.2. Results of Performance Parameters
The results of performance parameters for each fuel are shown in Figure 2. It is evident that the best performance parameters have been reached by using pure diesel fuel while the other biofuels reached little bit lower values of power and torque. As shown in Table 7, diesel reached 60 kW and a torque of 188 Nm, followed by HVO, where the performance was slightly below with the value of 57 kW and the torque of 184 Nm. The lowest performance parameters were measured by the mixed fuel D50H30B20, where the power reached 56 kW and the torque 180 Nm.
3.3. Results of Emission Parameters
Table 8 shows the emission parameters of the individual fuels. In terms of CO2 emissions, the highest production was reached with D50H30B20 fuel. Both fuels based on HVO exceeded the EU4 emission limits except the CO emission.
3.4. Results of Opacity
The results of exhaust gas opacity are shown in Figure 3. The highest opacity, 36.2%, was detected for the pure diesel fuel. HVO exhibited an opacity slightly below 26.8% and the lowest opacity was measured for D50H30B20—just 15.9%.
3.5. Results of Fuel Consumption
Table 9 shows the fuel consumption of the individual fuels used. In order to partially eliminate the error in fuel mass consumption at NEDC due to the different distances travelled during the cycle, the consumption was recalculated to volume consumption per 100 kilometres. The difference in HVO and D50H30B20 between consumption mass and volume per hundred kilometres depends on a significantly lower HVO density (780 kg∙m−3) compared to mixed fuel D50H30B20 (810 kg∙m−3). The lowest consumption was exhibited by diesel fuel (4.94 L·100 km−1). On the contrary, HVO reached the highest consumption per 100 km, namely 5.64 L·100 km−1. Mixed fuel D50H30B20 had the second lowest consumption of the three measured fuels. This is due to a higher proportion (50%) of diesel fuel in the mixture and a lower proportion of HVO. Generally, changes in consumption are due to the different calorific values of the fuels: diesel fuel 45.5 MJ·kg−1, HVO 44.0 MJ·kg−1, butanol 32.5 MJ·kg−1. Thus, fuel D50H30B20 has a total calorific value of 42.45 MJ·kg−1. Hence the calorific value of these fuels is comparable and therefore the increase in consumption is relatively low.
3.6. Results of PM Production
Figure 4 shows the instantaneous flow of the whole measured particle size spectrum of the exhaust gas during UDC driving cycle. There are more pronounced PM production peaks for diesel fuel, especially at every acceleration and deceleration period.
In EUDC driving cycle (Figure 5), significant increases in particle concentration are evident at acceleration, especially at higher speeds.
Using HVO, particulate matter production in the full range of the spectrum decreases approximately 10% compared to diesel. Lower particle production in HVO is due to lower ignition, so the burning time of the fuel is longer. Other influences may be differences in the molecular structure or the absence of highly volatile components compared to diesel fuel. Mixed fuel D50H30B20 reached a significant decrease of 53% in PM production compared to diesel fuel (see Table 10). Such a difference is due to the lower kinematic viscosity of the mixture (2.35 mm2·s−1), which results in better fuel spraying and mixing with air. The second, more dominant, effect on particulate matter number reduction in D50H30B20 is a butanol component, which is more flammable and therefore supports better combustion. Better combustion of this mixture is also due to higher oxygen content in butanol. By mass, the proportion of oxygen in the fuel mix is 10.9%, while the other two fuels do not contain any.
Table 10 summarizes measured data for individual fuels and divides particulate matters according to their size. The total number of measured PM (6.4–560 nm) and the number of PM that sets the emission limits (i.e., 23–560 nm) are given. The measured vehicle fulfils the EURO 4 emission limit (6 × 10¹¹ PN∙km−1). According to results of total PM production (23–560 nm), the vehicle exceeded the Euro 4 limit. This result can be influenced by the used method of PM detection, which does not separate vaporisable particles and these are included in the total number of measured PM that current legislation does not omit.
Figure 6 shows the PM production at steady-state vehicle speed 50 km∙h−1. Axis x shows the particle diameter calculated from equivalent electrical mobility, because it is difficult to directly measure particles that do not have a spherical shape. Its diameter is thus defined as an equivalent spherical particle that behaves equally in the electric field compared to measured particles. The y-axis shows the relative concentration of PM in the diluted exhaust gas, that is, the number of particles per cm3.
The highest particulate concentration (25,000 PN cm−3) was reached on diesel fuel ranging from 55 to 60 nm. The second highest concentration (20,000 PN cm−3) was measured for HVO ranging from 45 to 55 nm. The lowest particulate concentration (15,000 PN cm−3) was for mixed fuel D50H30B20, from 45 to 50 nm.
The course of the curves shows that the use of diesel fuel produces the highest number of particles larger than 40 nm. The opposite effect is for particles smaller than 30 nm, where diesel fuel emits the least. Based on the magnitude spectrum, the positive effect of the butanol component in the mixed fuel can be attributed to a reduction in total particle number production.
4. Discussion
The aim of this study was to analyse and compare selected biofuels, their chemical properties and their influence on engine operational parameters. The operational parameters of the diesel engine Skoda Roomster 1.4 TDI were measured on a chassis dynamometer according to the NEDC driving cycle and pure diesel fuel, HVO and a blend of fuels (diesel fuel, HVO and butanol) were used for the comparison. The comparison of performance parameters is presented in external speed characteristics. Emission parameters and PM production during driving cycle were quantified.
Diesel appears to be the best fuel in terms of fuel consumption, followed by HVO, and the worst fuel consumption was reached by fuel D50H30B20. In contrast, [19] showed that fuel consumption "Neste Pro Diesel" (9.15% HVO in diesel) is lower than regular diesel. However, the NEDC driving cycle was not used in this study.
The highest opacity of 36.2% was detected for the pure diesel fuel. HVO exhibited an opacity slightly below 26.8% and the lowest opacity was measured for D50H30B20—only 15.9%.
The results of our study are in agreement with studies of [20,21] which state that higher reduction of smoke opacity is shown in alternative fuels.
The values of instantaneous smoke opacity for alternative fuels were notably lower than those for reference fuel. These reductions were more important in cases of alternative fuels because, besides polyaromatics (a common characteristic of both fuels), the presence of oxygen in this fuel also favours lower soot generation [22].
Measured emission parameters of HVO and D50H30B20 were very similar in all parts of NEDC, presented in the study [23,24].
The results of the study [25] also show that biofuels significantly affect the combustion engine pollutants. In particular, biofuels containing HVO or butanol exhibit lower smokiness and up to 40% less NO production.
CO emissions were reduced with HVO alternative fuel especially during the first urban cycle where these emissions were very high. These trends suggest that the composition of alternative fuels supports a cleaner combustion [26]. In the case of our study, the highest concentration was measured in D50H30B20 fuel and HVO fuel showed a lower concentration of CO. The results of NOx and CO emissions in the study [27], dealing with the influence of HVO blends on emissions, report these results: NOx for diesel fuel 0.136 g∙km−1 and for HVO 0.325 g∙km−1, CO for diesel fuel 0.147 g∙km−1 and for HVO 0.153 g∙km−1. This study shows these numbers: NOx for diesel fuel 0.151 g∙km−1 and for HVO 0.251 g∙km−1, CO for diesel fuel 0.173 g∙km−1 and HVO 0.050 g∙km−1.
The PM production had a significant peak by acceleration mode during the cycle. The lower mass concentration at steady speeds may partly be explained by higher amounts of air (higher relative air-to-fuel ratio) available for combustion: higher air concentration provides better burnout of the fuel particles, thus leading to lower mass concentrations [28].
The measured values of the performance parameters in this study shows that the ingredients of HVO and butanol reduces power and torque. The same conclusion was reached in the study [29], where the performance parameters also decreased with the addition of HVO and butanol (e.g., their fuel nBu30-HVO70 reduced engine power by 6–8%).
The disadvantage of alternative fuel D50H30B20 is lower lubrication ability. That is why it is necessary to use the lubricant additives. According to the prescribed minimum lubricity of 460 µm for fuels to diesel engines, the addition of lubricant additives was not required, because the lubricity of mixture D50B20 (70% vol.) reaches about 420 µm and lubricity of HVO (30% obj.) is 560 µm [30].
The advantage of using D50H30B20 is displayed in the cleaning of the fuel system and also in the ability to use it without any technical modification of the engine (most of the engines are ready to use D50H30B20).
5. Conclusions
The objective of the experiment was to analyse the D50H30B20 fuel mixture, which consists of biofuels by 50%. Selected biofuels are in the case of both HVO and butanol characterized as II generation biofuels. Also in the case of combination of HVO and biobutanol, it is possible to use materials from different renewable sources.
The study demonstrated that the HVO exhibits 26% less opacity compared to the diesel fuel. The blended D50H30B20 fuel exhibits even lower opacity, by 56% lower than pure diesel. A similar situation can be observed in PM production, where a decrease of more than 50% in the case of D50H30B20 was reached. Biofuels proved slightly lower power parameters (10% lower) than pure diesel, but depending on the production of emission parameters, the power difference is minimal. In the case of emission production, the results of tested biofuels proved slightly worse. The emission of CO, CO2 and CO reached higher values compared to diesel fuel. Both fuels based on HVO exceeded the EU4 emission limits except the CO and HC emissions.
The potential of the mixture is also in maximizing the use of alcohol, which is more suitable for gasoline engines, but in terms of environmental sustainability, production of harmful emissions and biodiversity, it is a promising and reliable energy source.
Author Contributions
M.K., J.M., P.Z. and V.H. (Vladimír Hönig) conceptualization & methodology; M.K., J.M. and V.H. (Veronika Hartová) data analysis & writing original draft paper; M.K., J.M., V.H. (Veronika Hartová), J.H. and V.H. (Vladimír Hönig) writing review & editing.
Funding
This research was funded by the Grant Agency of Czech University of Life Sciences Prague grant number IGA 2017: 31150/1312/3120.
Conflicts of Interest
The funders had no role in the design of the study; in the collection, analyses or interpretation of data; in the writing of the manuscript; or in the decision to publish the results.
References
- European Automobile Manufacturers Association. Share of Diesel in New Passenger Cars. ACEA. 2015. Available online: http://www.acea.be/statistics/tag/category/share-of-diesel-in-new-passenger-cars (accessed on 1 March 2019).
- Dockery, D.W.; Schwartz, J.; Spengler, J.D. Air pollution and daily mortality: Associations with particulates and acid aerosols. Environ. Res. 1992, 59, 362–370. [Google Scholar] [CrossRef]
- Pourazar, J.; Frew, A.J.; Blomberg, A.; Helleday, R.; Kelly, F.J.; Wilson, S. Diesel exhaust exposure enhances the expression of IL-13 in the bronchial epithelium of healthy subjects. Respir. Med. 2004, 98, 821–825. [Google Scholar] [CrossRef]
- Goyal, P.; Jaiswal, N.; Kumar, A.; Dadoo, J.K.; Dwarakanath, M. Air quality impact assessment of NOx and PM due to diesel vehicles in Delhi. Transp. Res. Part D Trans. Environ. 2010, 15, 298–303. [Google Scholar] [CrossRef]
- Jacobson, M.Z. Global direct radioactive forcing due to multicomponent anthropogenic and naturals aerosols. J. Geophys. Res. 2001, 106, 1551–1568. [Google Scholar] [CrossRef]
- Koch, D. Transport and direct radiative forcing of carbonaceous and sulphate aerosols in the GSISS GCM. J. Geophys. Res. 2011, 106, 11–32. [Google Scholar]
- European Union. Directive 28/2009/CE of the European Parliament and of the Council; European Union: Brussels, Belgium, 2009. [Google Scholar]
- Yilmaz, N.; Morton, B. Effects of preheating vegetable oils on performance and emission characteristics of two diesel engines. Biomass Bioenergy 2011, 35, 2028–2033. [Google Scholar] [CrossRef]
- Masjuki, H.H.; Kalam, M.A.; Maleque, M.A.; Kubo, A.; Nonaka, T. Performance, emissions and wear characteristics of an indirect injection diesel engine using coconut oil blended fuel. Proc. Inst. Mech. Eng. Part D J. Automob. Eng. 2001, 215, 393–404. [Google Scholar] [CrossRef]
- Pexa, M.; Mařík, J. The Impact of biofuels and technical condition to its smoke–Zetor 8641 Forterra. Agron. Res. 2014, 12, 367–372. [Google Scholar]
- Hönig, V.; Hromádko, J. Possibilities of using vegetable oil to power diesel engines as well as their impact on engine oil. Agron. Res. 2014, 12, 323–332. [Google Scholar]
- Stumborg, M.; Wong, A.; Hogan, E. Hydroprocessed vegetable oils for diesel fuel improvement. Bioresour. Technol. 1996, 56, 13–18. [Google Scholar] [CrossRef]
- Kuronen, M.; Mikkonen, S.; Aakko, P.; Murtonen, T. Hydrotreated Vegetable Oil as Fuel for Heavy Duty Diesel Engines; SAE Technical Paper 2007-01-4031; SAE International: Warrendale, PA, USA, 2007. [Google Scholar]
- Huber, G.W.; O’Connor, P.; Corma, A. Processing biomass in conventional oilrefineries: Production of high quality diesel by hydrotreating vegetable oils in heavy vacuum oil mixtures. Appl. Catal. A 2007, 329, 120–129. [Google Scholar] [CrossRef]
- Da Rocha Filho, D.N.; Brodzki, D.; Djéga-Mariadassou, G. Formation of alkanes, alkylcykloalkanes and alkylbenzenes during the catalytic hydrocracking of vegetable oils. Fuel 1993, 72, 543–549. [Google Scholar] [CrossRef]
- Aatola, H.; Larmi, M.; Sarjovaara, T.; Mikkonen, S. Hydrotreated Vegetable Oil (HVO) as a Renewable Diesel Fuel: Trade Off between NOx, Particular Emission, and Fuel Consumption of a Heavy Duty Engine; SAE Technical Paper 2008-01-2500; SAE International: Warrendale, PA, USA, 2008. [Google Scholar]
- Lapuerta, M.; Armas, O.; Hernandez, J.J.; Tsolakis, A. Potential for reducing emissions in a diesel engine by fuelling with conventional biodiesel and Fisher-Tropsch diesel. Fuel 2010, 89, 3106–3113. [Google Scholar] [CrossRef]
- Duckhan, K.; Seonghwan, K.; Sehun, O.; No, S.-Y. Engine performance and emission characteristics of hydrotreated vegetable oil in light duty diesel engines. Fuel 2014, 125, 36–43. [Google Scholar] [CrossRef]
- Birzietis, G.; Pirs, V.; Dukulis, I.; Gailis, M. Effect of commercial diesel fuel and hydrotreated vegetable oil blend on automobile performance. Agron. Res. 2017, 15, 964–970. [Google Scholar]
- Lapuerta, M.; Villajos, M.; Agudelo, J.R.; Boehman, A.L. Key properties and blending strategies of hydrotreated vegetable oil as biofuel for diesel engines. Fuel Process Technol. 2011, 92, 2406–2411. [Google Scholar] [CrossRef]
- Yehliu, K.; Boehman, A.L. Effect of alternative fuels on exhaust emissions during diesel engine operation with matched combustion phasing. Fuel 2012, 89, 438–456. [Google Scholar] [CrossRef]
- Armas, O.; García-Contreras, R.; Ramos, A. Impact of alternative fuels on performance and pollutant emissions of light duty engine tested under the new European driving cycle. Appl. Energy 2013, 107, 183–190. [Google Scholar] [CrossRef]
- Li, X.; Huang, Z.; Wang, J.; Zhang, W. Diesel particle size distribution estimation from digital image analysis. Aerosol Sci. Technol. 2007, 37, 369–381. [Google Scholar] [CrossRef]
- Chuepeng, S.; Xu, H.; Tsolakis, A.; Wyszynski, M.; Price, P. Particulate Matter size distribution in the exhaust gas of a modern diesel Engine fuelled with biodiesel blend. Biomass Bioenergy 2011, 35, 4280–4289. [Google Scholar] [CrossRef]
- Pexa, M.; Čedík, J.; Pražan, R. Smoke and NOx emission of combustion engine using biofuels. Agron. Res. 2016, 14, 547–555. [Google Scholar]
- Millo, F.; Debnath, B.K.; Vlachos, T.; Ciaravino, C.; Postrioti, L.; Buitoni, G. Effects of different biofuels blends on performance and emissions of an automotive diesel engine. Fuel 2015, 159, 614–627. [Google Scholar] [CrossRef]
- Ricardo, S.-B.; Kousoulidou, M.; Clairotte, M.; Giechaskiel, B.; Nuottimäki, J.; Sarjovaara, T.; Lonza, L. Impact of HVO blends on modern diesel passenger cars emissions during real world operation. Fuel 2019, 235, 1427–1435. [Google Scholar]
- Sarvi, A.; Lyyranen, J.; Jokiniemi, J.; Zevenhoven, R. Particulate emissions from large-scale medium-speed diesel engines: 1. Particle size distribution. Fuel Process. Technol. 2011, 92, 1855–1861. [Google Scholar] [CrossRef]
- Vojtisek-Lom, M.; Beránek, V.; Mikuška, P.; Křůmal, K.; Coufalík, P.; Sikorová, J.; Topinka, J. Blends of butanol and hydrotreated vegetable oil as drop-in replacement for diesel engines: Effects on combustion and emissions. Fuel 2017, 197, 407–421. [Google Scholar] [CrossRef]
- Hönig, V.; Hromádko, J.; Orsák, M. Využití biobutanolu ve vznětových motorech a jeho vliv na parametry motorové nafty (In Czech). Chemické Listy 2015, 109, 722–725. [Google Scholar]
Figure 1.
Schema of experiment.

Figure 2.
Engine performance parameters for each fuel.
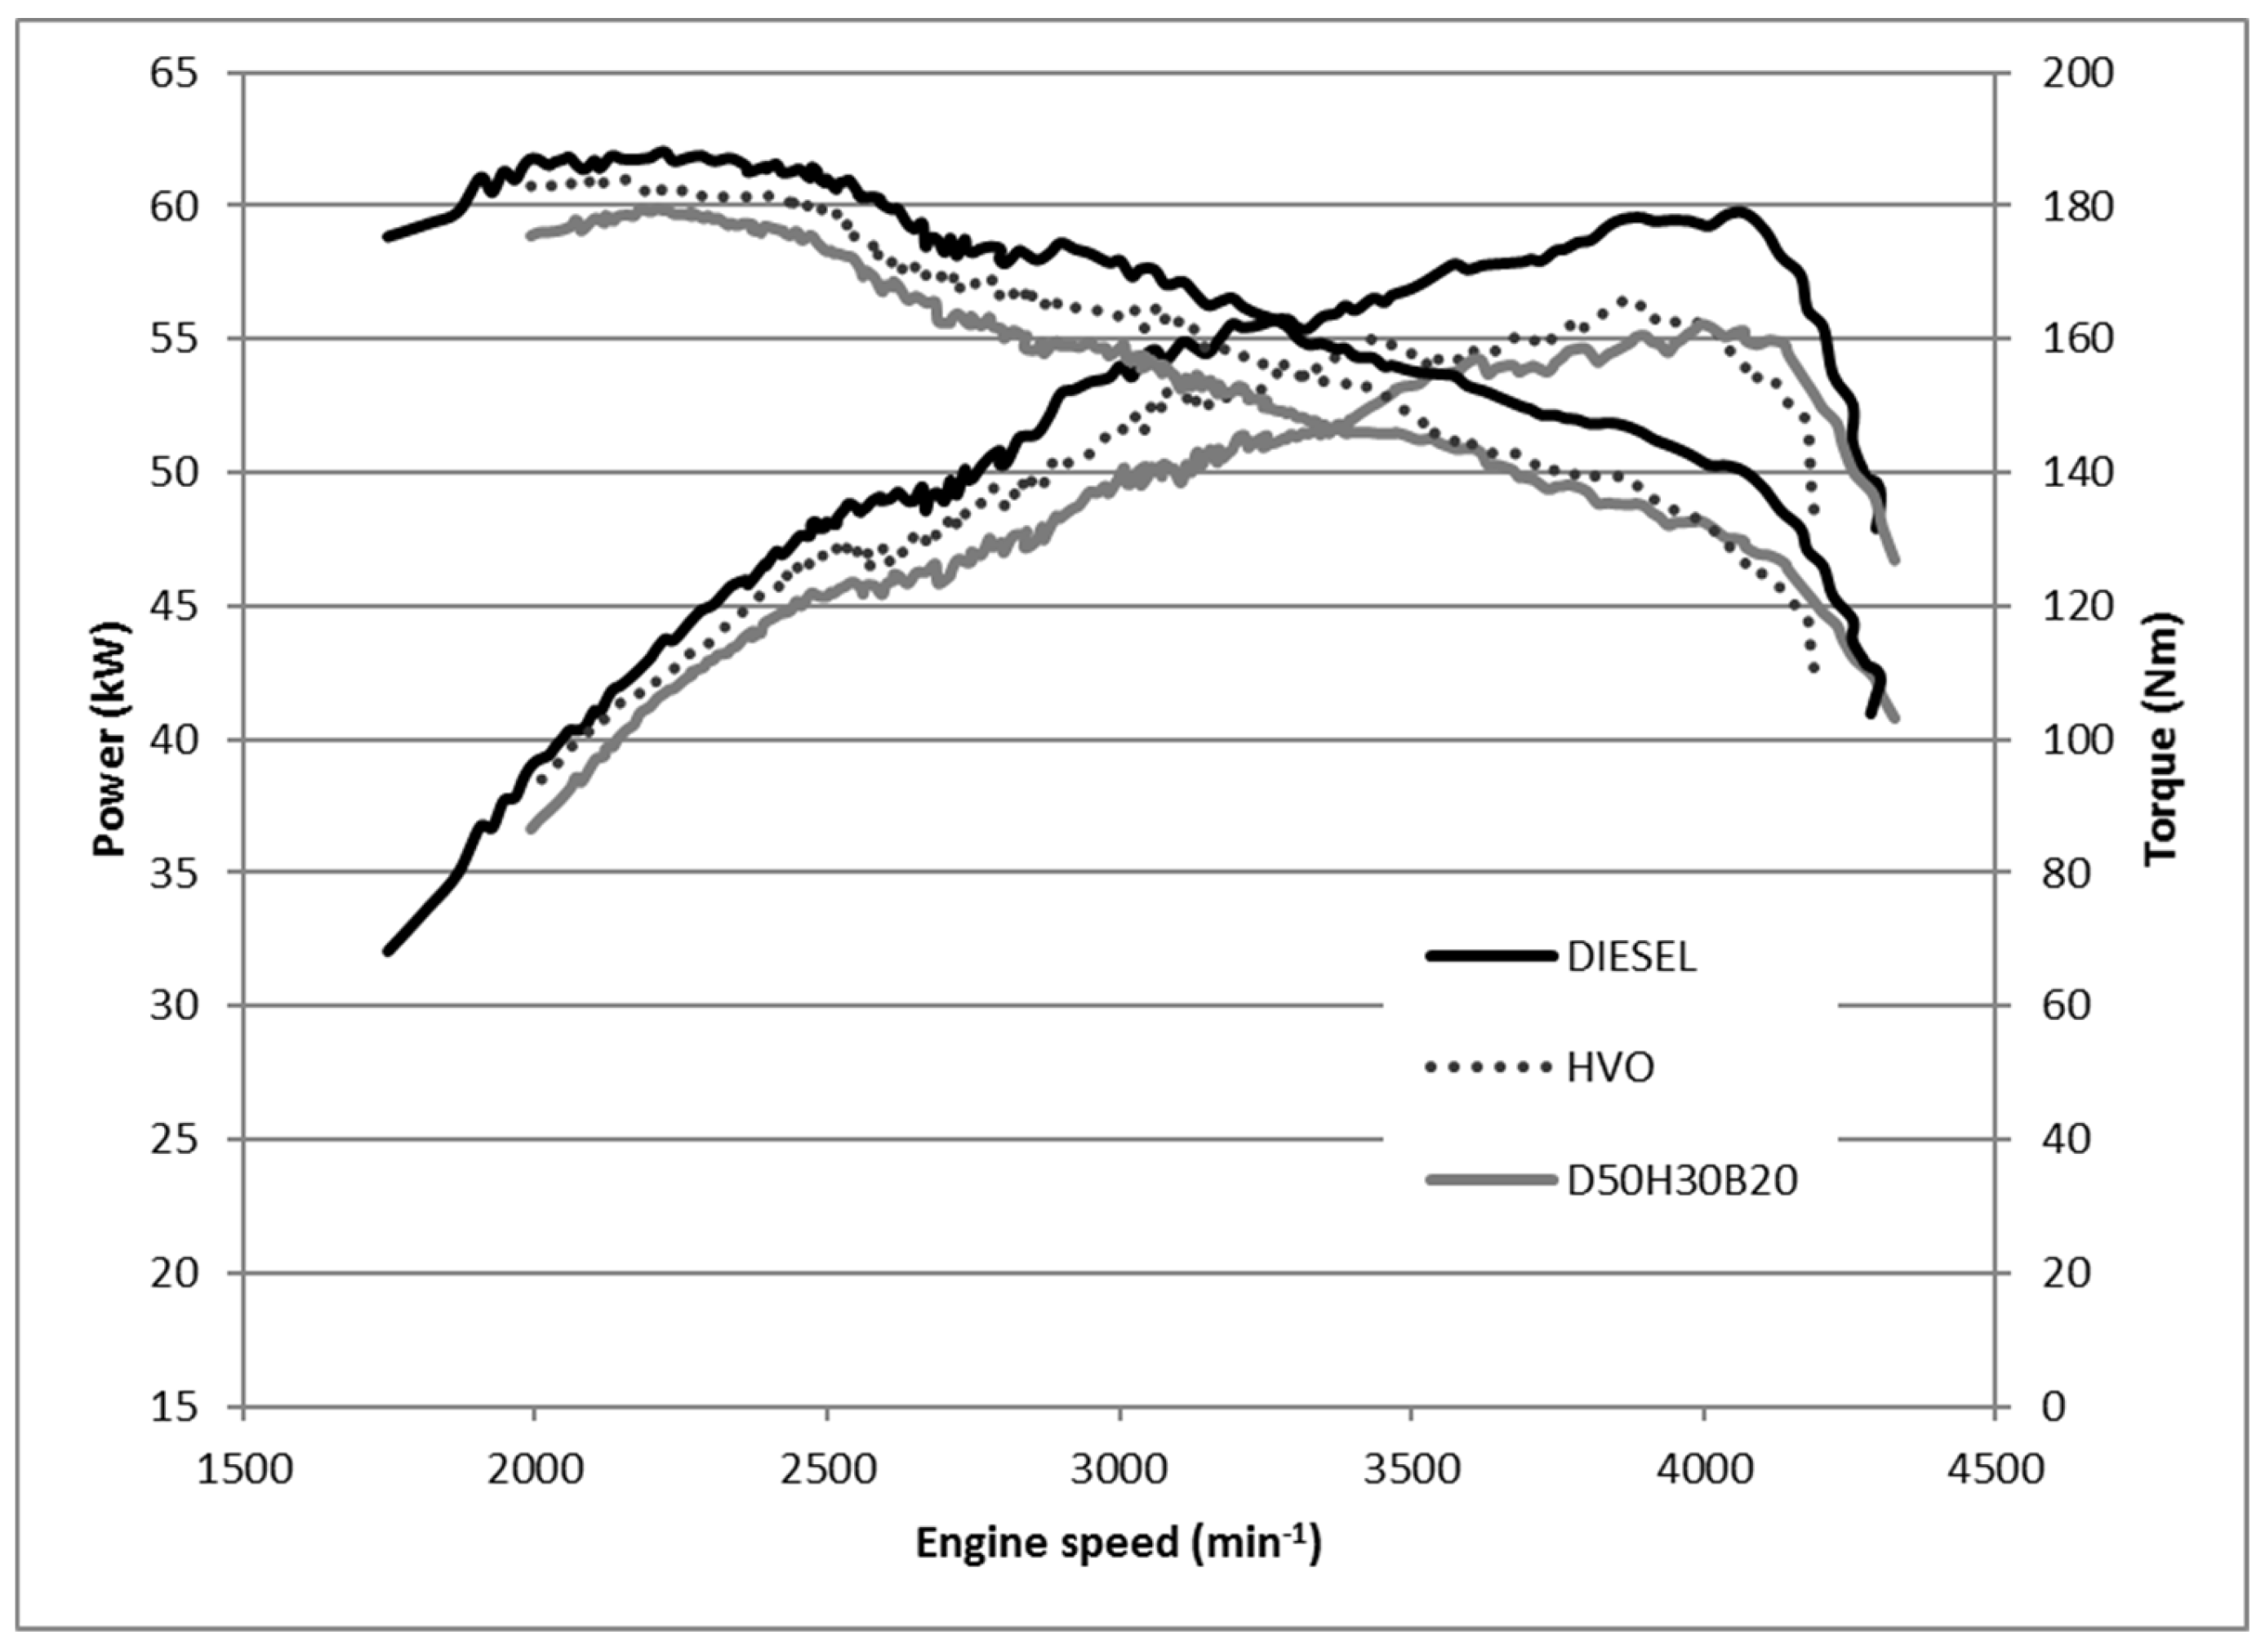
Figure 3.
Exhaust gas opacity of tested fuels.
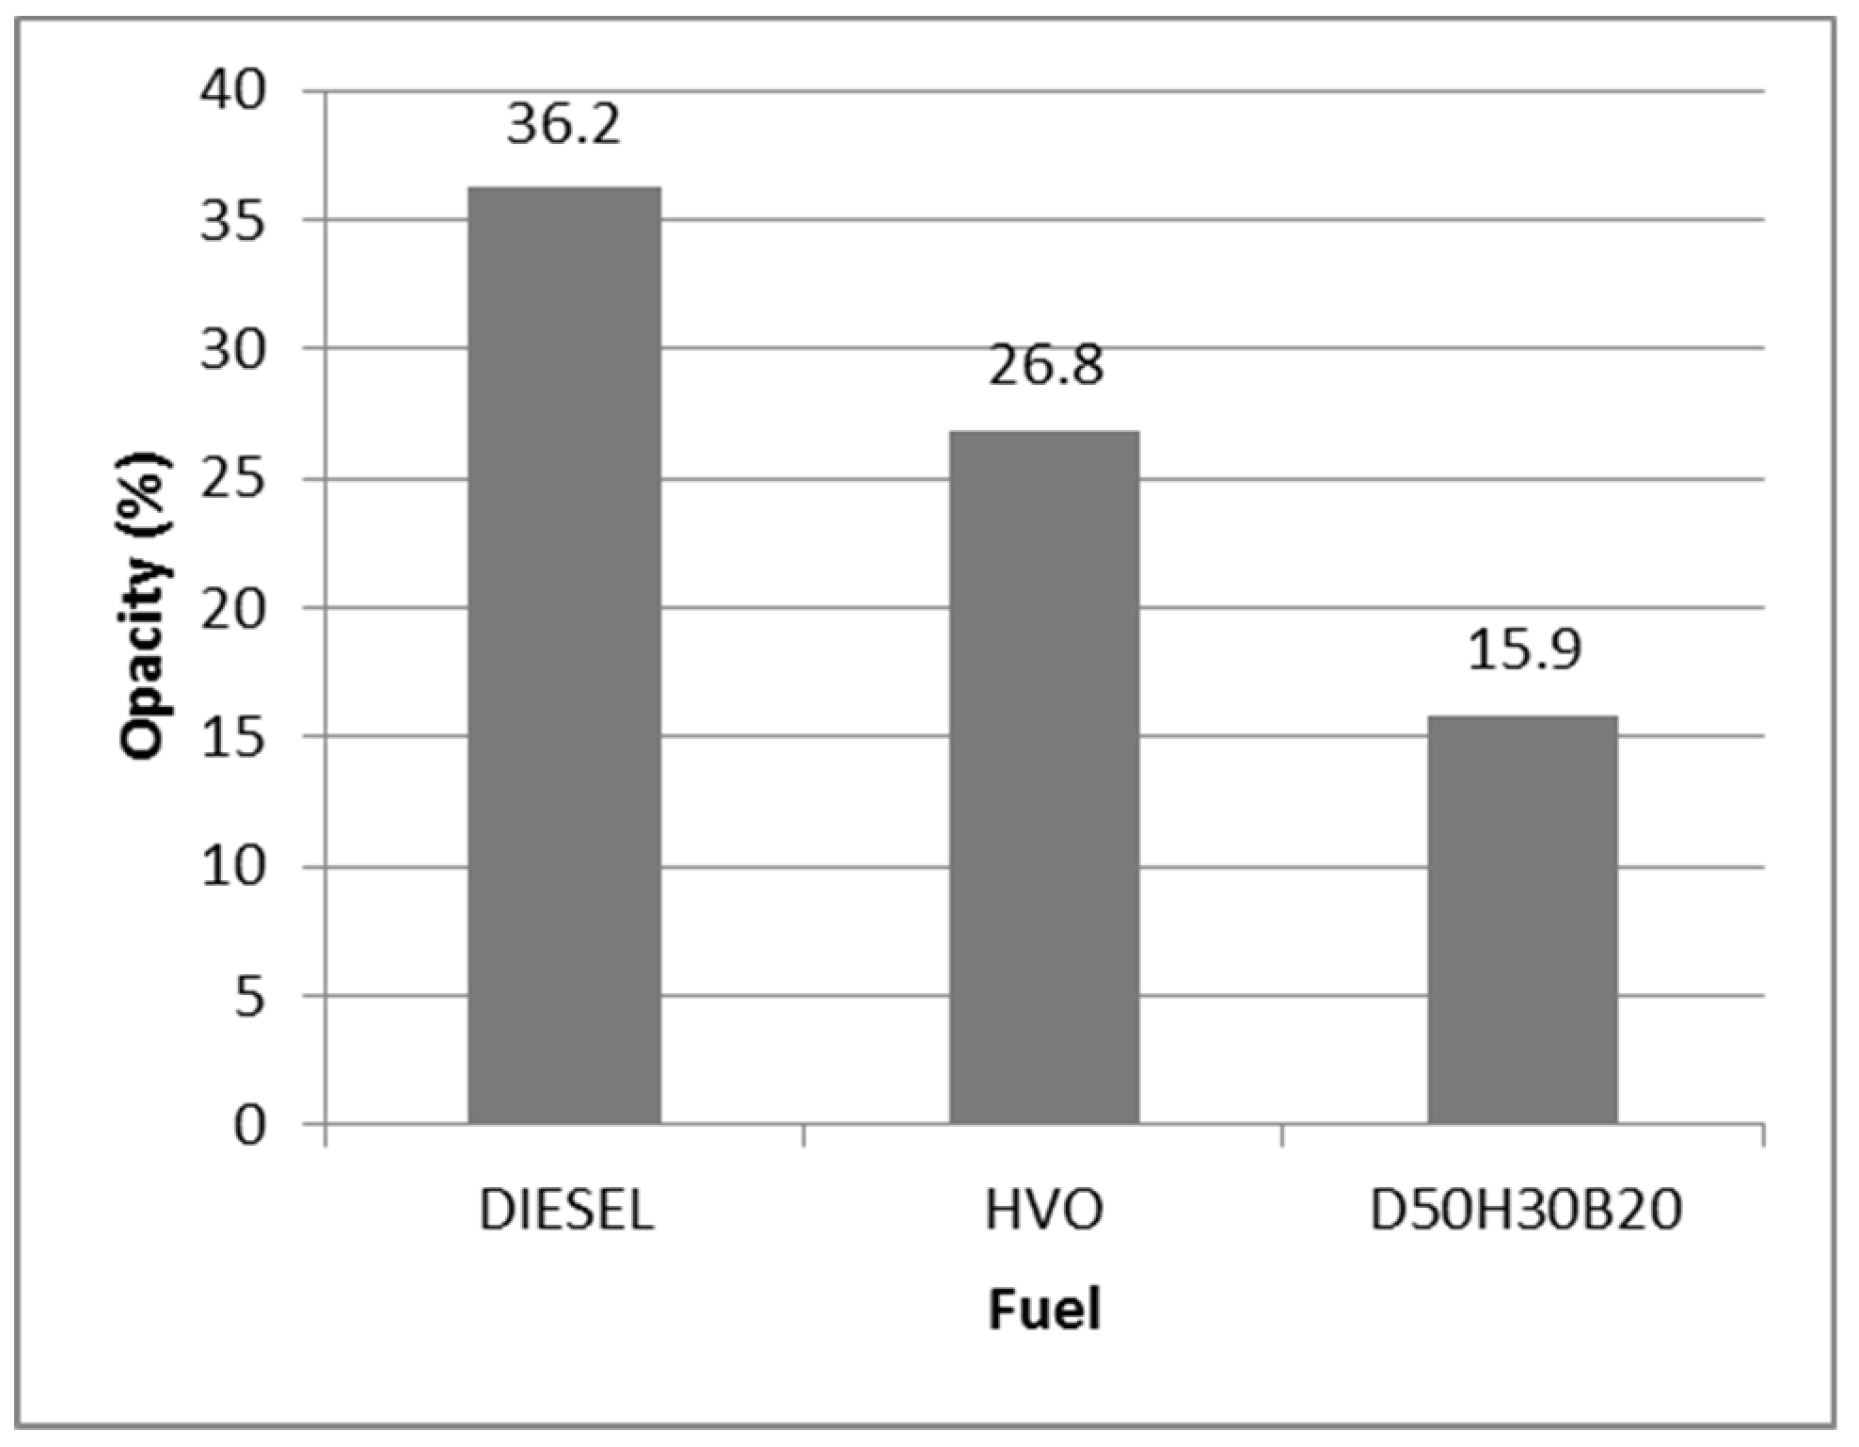
Figure 4.
PM production in UDC driving cycle.

Figure 5.
PM production in EUDC driving cycle.
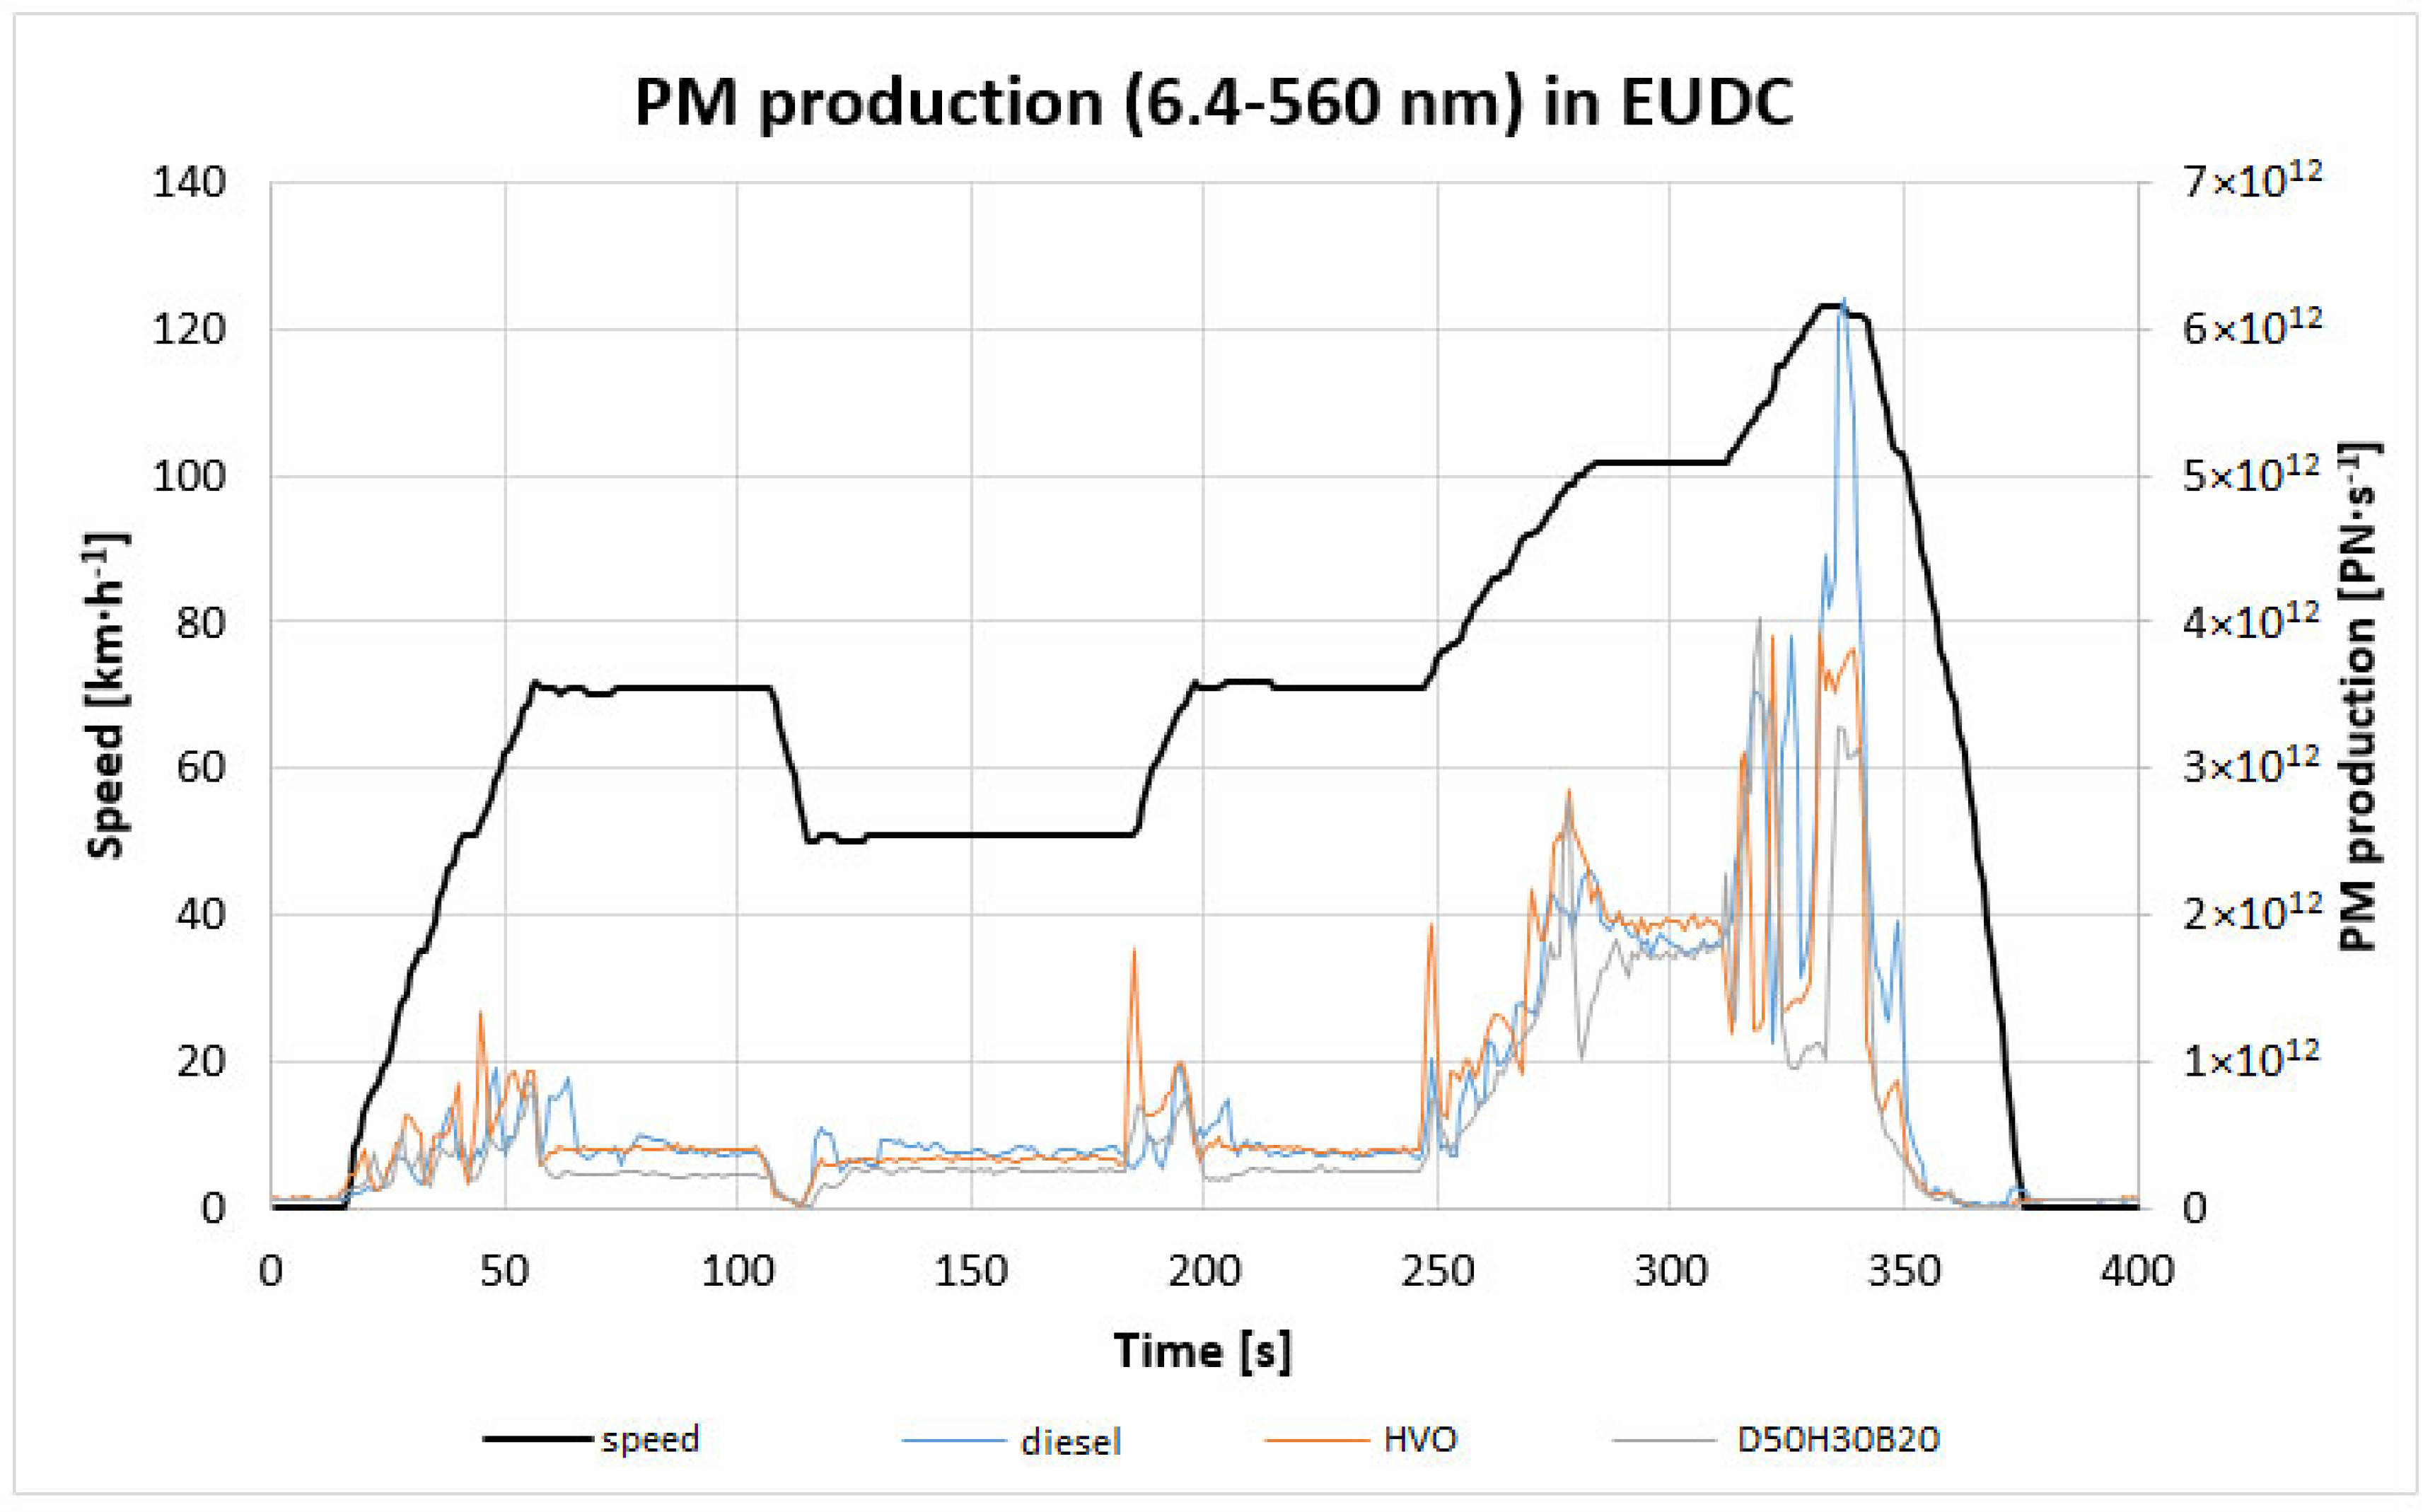
Figure 6.
PM production at steady-state speed 50 km∙h−1.


Table 1.
Information of Skoda Roomster 1.4 TDI.
| Combustion Engine | |
|---|---|
| Design | compression ignition, turbo charged |
| Fuel System | unit injector system |
| Number of Cylinders and Valves | 3 in row, 6 valves |
| Fuel | diesel |
| Volume of Cylinders | 1422 ccm |
| Power | 59 Kw at 4000 rpm |
| Torque | 195 Nm at 2200 rpm |
| EU Limit | EU4 |
| Manufacture Year | 2006 |
| Mileage | 102,000 km |
| Car Body | |
| Service Weight | 1240 kg |
| Total Weight | 1755 kg |
| Drive Performance | |
| Max. Speed | 165 km·h−1 |
| Acceleration 0–100 km·h−1 | 14.7 s |
| Declared Fuel Consumption (Urban/Extra-Urban/Combination) | 5.1/3.76/4.26 (liter·100 km−1) |
Table 2.
Technical specification of Opacimeter Atal AT–605.
| Measured Quantity | Range | Resolution | Accuracy |
|---|---|---|---|
| Absorption coefficient (k) | 0–16 m−1 | 0.01 m−1 | ± 0.15 m−1*); ± 0.30 m−1**) |
| Opacity (N) | 0–100% | 0.1% | ± 2% absolute |
| Temperature | 0–150 °C | 1 °C | ± 2 °C |
| RPM | 400–2000 min−1 | 10 min−1 | ± 20 min−1 |
| 2001–9999 min−1 | ± 2% RV | ||
| Acceleration time | 0–99.99 s | 0.1 s | ± 0.2 s |
RV = of reading value; *) in range 0.0 to 2.5 m−1; **) in range 2.5 to 4.0 m−1.
Table 3.
Specification of PM analyser TSI EEPS 3090.
| Particle Size Range | 5.6–560 nm |
| Particle Size Resolution | 16 channels per decade (32 total) |
| Electrometer Channels | 20 |
| Time Resolution | 10 size distribution per second |
| Sample Flow | 10 L·min−1 |
| Dilution Accessories | Rotation disk thermodilution |
Table 4.
Technical parameters of mobile emission analyser.
| Measured Values | Measurement Range | Resolution | Accuracy |
|---|---|---|---|
| CO | 0 … 10 % Vol. | 0.001 % Vol. | 0 … 0.67%: 0.02% absolute, 0.67% … 10%: 3% of measured value |
| CO2 | 0 … 16 % Vol. | 0.01 % Vol. | 0 … 10%: 0.3% absolute, 10 … 16%: 3% m.v. |
| HC | 0 … 20, 000 ppm | 1 ppm | 10 ppm or 5% m.v. |
| NOX | 0 … 5 000 ppm | 1 ppm | 0 … 1000 ppm: 25 ppm, 1000 … 4000 ppm: 4% m.v. |
| O2 | 0 … 22 % Vol. | 0.1 % Vol. | 0 … 3%: 0,1% 3 … 21%: 3% |
Table 5.
Technical specification of Vibra AJ 6200.
| Maximum Capacity | 6200 g |
| Unit(d)/Accuracy | 0.01 g |
| Verifiable Unit | 0.1 g |
| A Class of Accuracy | I |
| Acceptable Measurement Temperature | 0–35 °C |
| Standard Communication Interface | RS 232 |
Table 6.
Measured parameters of the fuel blends.
| Measured Parameter | Units | Diesel | D50H30B20 | HVO |
|---|---|---|---|---|
| Density at 15 °C | kg∙m−3 | 839 | 810 | 780 |
| Kinematic viscosity at 40 °C | mm2∙s−1 | 2.64 | 2.35 | 2.82 |
| Flash point | °C | 68 | 35 | 97 |
| Cloud point | °C | −5 | −18 | −28 |
| Cold filter plugging point | °C | −17 | −30 | −30 |
| Cetane number | - | 51.8 | 54.1 | >70.0 |
| Cetane index | - | 50.9 | 53.2 | 75.2 |
Table 7.
Maximal values of performance parameters.
| Fuel | Max. Power (kW) | Max. Torque (Nm) |
|---|---|---|
| Diesel | 60 | 188 |
| HVO | 57 | 184 |
| D50H30B20 | 56 | 180 |
Table 8.
Emission parameters under NEDC driving cycle.
| Fuel | CO (g∙km−1) | CO2 (g∙km−1) | NOx (g∙km−1) | HC (g∙km−1) |
|---|---|---|---|---|
| DIESEL | 0.173 | 122 | 0.151 | 0.031 |
| HVO | 0.050 | 147 | 0.251 | 0.033 |
| D50H30B20 | 0.234 | 155 | 0.301 | 0.046 |
| EU 4 limit | 1 | 127 | 0.08 | 0.1 |
Table 9.
Summary of fuel consumption and distance travelled during NEDC.
| Fuel | Consumption per NEDC (g) | Distance (m) | Consumption (L·100·km−1) |
|---|---|---|---|
| Diesel | 459 | 11074 | 4.94 |
| HVO | 489 | 11117 | 5.64 |
| D50H30B20 | 494 | 11140 | 5.47 |
Table 10.
Total PM production in NEDC driving cycle.
| Fuel | PN (6.4–560 nm) per NEDC (PN∙NEDC−1) | PN per 1 km (PN∙km−1) | Procentual Difference (%) |
|---|---|---|---|
| Diesel (6.4–560 nm) | 4.86 × 10¹⁴ | 4.39 × 10¹⁴ | 100.00 |
| Diesel (23–560 nm) | 4.16 × 10¹⁴ | 3.76 × 10¹⁴ | 100.00 |
| HVO (6.4–560 nm) | 4.39 × 10¹⁴ | 3.95 × 10¹⁴ | 90.42 |
| HVO (23–560 nm) | 3.76 × 10¹⁴ | 3.38 × 10¹⁴ | 90.32 |
| D50H30B20 (6.4–560 nm) | 2.28 × 10¹⁴ | 2.04 × 10¹⁴ | 46.89 |
| D50H30B20 (23–560 nm) | 1.98 × 10¹⁴ | 1.78 × 10¹⁴ | 47.69 |
© 2019 by the authors. Licensee MDPI, Basel, Switzerland. This article is an open access article distributed under the terms and conditions of the Creative Commons Attribution (CC BY) license (http://creativecommons.org/licenses/by/4.0/).
Share and Cite
MDPI and ACS Style
Kotek, M.; Mařík, J.; Zeman, P.; Hartová, V.; Hart, J.; Hönig, V. The Impact of Selected Biofuels on the Skoda Roomster 1.4TDI Engine’s Operational Parameters. Energies 2019, 12, 1388. https://doi.org/10.3390/en12071388
AMA Style
Kotek M, Mařík J, Zeman P, Hartová V, Hart J, Hönig V. The Impact of Selected Biofuels on the Skoda Roomster 1.4TDI Engine’s Operational Parameters. Energies. 2019; 12(7):1388. https://doi.org/10.3390/en12071388
Chicago/Turabian StyleKotek, Martin, Jakub Mařík, Petr Zeman, Veronika Hartová, Jan Hart, and Vladimir Hönig. 2019. "The Impact of Selected Biofuels on the Skoda Roomster 1.4TDI Engine’s Operational Parameters" Energies 12, no. 7: 1388. https://doi.org/10.3390/en12071388
Note that from the first issue of 2016, this journal uses article numbers instead of page numbers. See further details here.