A Healthy, Energy-Efficient and Comfortable Indoor Environment, a Review


1
Faculty of Civil Engineering, Slovak University of Technology in Bratislava, Radlinského 11, 810 05 Bratislava, Slovakia
2
A&Z Acoustics s.r.o., Letisko M.R. Štefánika 63, 820 01 Bratislava, Slovakia
3
Faculty of Architecture, KU Leuven, Hoogstraat 51, 9000 Gent/ Paleizenstraat 65, 1030 Brussels, Belgium
4
Transport Phenomena Research Centre, Engineering Faculty of Porto University, Rua Dr. Roberto Frias, 4200-465 Porto, Portugal
5
Vesalius College Brussels, Boulevard de la Plaine 5, 1050 Brussels, Belgium
*
Author to whom correspondence should be addressed.
Energies 2019, 12(8), 1414; https://doi.org/10.3390/en12081414
Submission received: 28 February 2019
/
Revised: 1 April 2019
/
Accepted: 3 April 2019
/
Published: 12 April 2019
(This article belongs to the Special Issue Distributed Energy Resources Management 2018)
Abstract
:Design strategies for sustainable buildings, that improve building performance and avoid extensive resource utilization, should also promote healthy indoor environments. The following paper contains a review of the couplings between (1) building design, (2) indoor environmental quality and (3) occupant behavior. The paper focuses on defining the limits of adaptation on the three aforementioned levels to ensure the energy efficiency of the whole system and healthy environments. The adaptation limits are described for measurable physical parameters and the relevant responsible human sensory systems, evaluating thermal comfort, visual comfort, indoor air quality and acoustical quality. The goal is to describe the interactions between the three levels where none is a passive participant, but rather an active agent of a wider human-built environment system. The conclusions are drawn in regard to the comfort of the occupant. The study reviews more than 300 sources, ranging from journals, books, conference proceedings, and reports complemented by a review of standards and directives.
1. Introduction
On average, people spend around 80–90% of their lives inside buildings [1]. Therefore, buildings have to provide a healthy and comfortable environment for humans. Buildings account for approximately 19% of all global greenhouse gas (GHG) emissions in the world [2], and about 31% of global final energy demand [3]. In recent years, much effort has been put into the development of efficient and cost-effective technologies, to ensure sustainability of the built environment [4,5]. Reduction of energy demand and the increase of energy efficiency is considered to provide a dominant contribution to tackle global climate change [6]. However, the amount of energy consumed depends not only on the criteria set for the indoor environment and applied technology but also on the behavior of occupants [7]. This may create a conflict between strategies that focus on the reduction of energy consumption and those to maintain a healthy and comfortable indoor environment. To achieve a balance between comfort and efficiency, synergies between building design, building climate control and occupant needs have to be established. Future buildings have to be able to quickly react and adapt themselves to immediate requirements (weather, occupancy, function) [8].
In this paper, we will describe the process of adaptation, that can take place in the human-built environment system, at three different levels (Figure 1):
- at the building design and construction level (passive and active designs),
- at the indoor environmental quality control level (management of indoor environment controls),
- and at the occupant level.
The goal is to raise awareness about the importance of the interdependencies between these levels, which is done by defining limits for each identified adaptation level. The paper is organized in six sections (Figure 2). In Section 2 a short description of the used research methods is presented along with a holistic analysis of selected review papers. In Section 3 we focus on the indoor environmental factors (IEQ). We start with a description of healthy environments and continue with standard requirements for IEQ performance. This is followed by a description of requirements for occupants’ well-being. The section ends with a description of the negative impact of poor IEQ on occupants’ health and performance. In Section 4 we focus on human physical, behavioral and physiological limits in relation to the ability to react to environmental conditions. In Section 5 a short introduction in building energy efficiency policy is given before a research review summary is presented focused on operational and technological limits of building design and building climate control system that lead to healthy, energy efficient and comfortable indoor environments. The section concludes with the description of factors influencing the quality of interactions between the occupant and the building environment.
2. Methods
2.1. Research Methods Used
The text of this paper is drafted based on a literature review, presenting results of studies on healthy indoor environment and energy efficiency. This was achieved using an internet-based search on relevant scholarly articles in the databases of Web of Science, Scopus and Google Scholar. In these databases a search for identifiable keywords was performed, to identify articles within the scope of our literature review, whereas the goal was to gain more knowledge about the relationship between occupant, indoor environment and energy efficiency. The search terms used were, “indoor environmental quality, thermal comfort, visual comfort, air quality, acoustic quality, healthy environment, energy efficiency, nearly zero energy buildings, occupant comfort, human sensory system, adaptive behavior, building climate control, building management systems and predictive technologies”. The articles found were then briefly scanned for relevancy, and articles considered unfit for the purpose of this study were removed from the created collection. This resulted in a database of journal articles and conference proceedings, that were further uploaded to a reference management system and checked for duplicates. Further, the search results were briefly scanned and divided into groups to identify potential patterns. When necessary the review was complemented by adding references to directives, standards, and databases. As a result, we present in this paper a review of more than 212 journal articles, 17 conference proceedings, 32 reports, 17 books, six directives, 15 standards, four declarations, six web-pages, four databases and one constitution published between 1960 and 2019 (Figure 3).
2.2. Holistic Analysis of Review Papers
To check whether or not there was already a review paper on the topic of the present work, and to find out trends in the current publications, we made a holistic analysis of the identified review papers focusing on defining the relationship between the occupant and the indoor environment, and further about the technological approaches to ensure the IEQ. We have identified 93 such papers published between 1998 and 2019. The identified review papers focused on the human-built environment relationship, describing IEQ and its effect on health, well-being and comfort, occupant productivity, and user satisfaction [9,10,11,12,13,14]. In addition to that, the papers described factors influencing human comfort and health [15,16,17,18,19,20], driving factors for occupant behaviors in buildings [21,22,23,24], occupant productivity [25], effect of behavior on energy consumption [7,26,27], and links between user satisfaction and adaptive behavior [28,29]. Literature reviews describing technological aspects of indoor environment control focus on advances in energy and environmental performance of buildings [6,30,31,32,33,34,35,36,37,38,39], principles of smart buildings [40,41,42], passive and green buildings design [43,44,45], intelligent control systems [46,47,48,49,50,51,52,53], building and façade design [8,54,55,56,57,58,59], and effects of climate change on indoor environmental quality [60]. Further reviews have addressed occupant behavior modeling [61,62] and occupancy based model predictive control for building indoor climate control [63,64]. Lastly, papers focused on indoor environmental quality factors in general [65,66,67], and individually on thermal comfort [68,69,70,71,72,73,74,75,76,77,78], visual comfort [79,80,81,82,83,84], acoustic comfort [85,86,87,88], indoor air quality [89,90,91,92,93,94,95,96,97,98].
These previous reviews show a trend in increased technologization of indoor environment control, whereas a predominance in studies focused on thermal comfort and indoor air quality was observed. It has to be noted, that in the reviews it was repeatedly stated that occupant satisfaction with one physical parameter of IEQ is strongly dependent on satisfaction with all other IEQ indicators and that it is necessary to take into account all IEQ factors when evaluating indoor comfort otherwise the evaluation could lead to false assumptions. While reviewing literature surveys on building climate control, these focus on thermal comfort, visual comfort, indoor air quality, and energy efficiency, while neglecting acoustic comfort, and the overall impact on the health of the occupants. Furthermore, there is a gap in describing the connections between user, indoor environment quality and building design. Studies generally focus on each aspect individually, but a comprehensive definition of the couplings is not provided. Therefore, we have decided to focus on these couplings, with the aim of providing a framework within which the factors that limit the interactions between occupants, IEQ and building design are identified.
On these identified review papers, a data-driven analysis on bibliographic data, such as keyword analysis was performed. This enables the visualization of trends in research publications via analysis of co-occurrence of field-specific terms. This was done using a freely available software tool for analyzing bibliographic data, VOSviewer [99]. The mapping approach employed was keyword network visualization on co-occurrence and link strength of terms extracted from abstracts of the identified review papers (Figure 3). Out of a total of 2331 terms identified occurring in the abstracts, the terms with a minimum of five occurrences and the top 52 according to relevance were extracted, whereas unrelated words were eliminated (e.g., generic terms such as review, field, literature) and abbreviations were replaced by full terms with the use of a self-defined thesaurus file. This resulted in a network visualization of terms, where the size of the label and circle of a term determines its importance (the higher the importance the larger the label and circle), the link represents a connection between two terms and its strength represents the strength of co-occurrence, and the distance between two terms is representative of their relative co-occurrence. Lastly, the network was color-overlaid (see a legend in Figure 4) where the color assigned represents the average publication year of a term, enabling the analysis of trends in the publications.
We can observe a shift in trends in the topics on which the publications focus. Firstly, before 2010 the publications focused mainly on the health effects of the indoor environment. More recent publications, published in 2014 or later, focus on control strategies and connections between energy use and occupant comfort. After a detailed analysis, a strong link between the terms energy use and human dimension can be observed with increasing occurrence of these terms in more recent publications, indicating a rise in awareness of the importance of this coupling. The term with the highest number of links can be found for the term indoor environment (42).
3. Definition of Indoor Environmental Quality
3.1. Healthy Environment
The World Health Organization (WHO) defines the environment, as it relates to health, as “all the physical, chemical, and biological factors external to a person, and all the related behaviours” [100]. The WHO report also confirms that “approximately one-quarter of the global disease burden is due to modifiable environmental factors.“ In our research, we will focus only on the information about building environmental performance.
The research of the last 20 years has identified a direct link between building design, human health, and well-being. It has been established, that the IEQ has a direct impact on the human health and work and/or study performance [10,14,101] and might even influence the development of learning disorders such as dyslexia, or voice problems, due to insufficient acoustic conditions [102]. Recent research on improved building environments is focused on the development of appropriate actions to reduce or eliminate harmful health effects [103]. The concept of a “healthy building“ was identified by the WHO which established first guidelines to ensure well-being [104]. To assess the performance of the building environment, various approaches have been developed [43,105] but interactions occurring at different levels (at the building design level, IEQ control level, and occupant level) are still largely ignored [16,106].
According to HOPE [107], Health Optimization Protocol for Energy-efficient buildings, a building is defined as “healthy and energy efficient” if:
“it does not cause or aggravate illnesses in the building occupants; it assures a high level of comfort for the building occupants; it minimises the use of energy used to achieve desired internal conditions, taking into account available state-of-the art technology and non-technical measures.”
The criteria include a set of measurable physical parameters, called indoor environmental factors, evaluating thermal comfort, visual comfort, indoor air quality, and acoustical quality.
3.2. General Definition of IEQ and Approaches of Standardization
IEQ refers to the quality of a building’s indoor environment whereas the health and well-being of building occupants should be promoted. Subjective perception of comfort of occupants in a room depends on many factors. According to Sarbu and Sebarchievici these are [108]: “temperature, humidity and air circulation, smell and respiration, touch and touching, acoustic factors, sight and colours effect, building vibrations, special factors (solar gain, ionization), safety factors, economic factors, unpredictable risks and design.“ This review paper will focus only on measurable physical parameters, evaluating thermal comfort, visual comfort, indoor air quality and acoustical quality, Table 1. Further, the connection between these physical parameters and the human physiology will be described. A detailed overview of performance criteria of buildings for health and comfort can be found in [15,109,110].
3.2.1. Thermal Comfort
According to ASHRAE 55 [111] thermal comfort is “that state of mind which expresses satisfaction with the thermal environment“. Thermal comfort comprises parameters, such as temperature, humidity, and air velocity (see Table 1). The recommended criteria are specified by international standards such as ASHRAE 55 [111], ISO 17772-1 [112], EN ISO 7730 [113]. These documents specify methods for the measurement and evaluation of thermal environments and provide calculation tools that enable prediction of the overall satisfaction of occupants with the indoor thermal conditions (i.e., predicted mean vote, predicted percentage of dissatisfied and adaptive predicted mean vote).
The thermal comfort parameters can be controlled via heating, cooling and air conditioning systems. It has to be mentioned that all of the technologies controlling thermal comfort are slow-reacting technologies, meaning their adaptation to requirements (e.g., new air temperature) takes some time.
3.2.2. Visual Comfort
Visual comfort is defined according to EN 12665 [114] as “the subjective condition of visual well-being induced by the visual environment”. A well-designed lighting system must provide adequate illumination to ensure safety and enable movement, contribute to visual comfort and facilitate visual performance and color perception. Monitored parameters include quantitative physical measures of the luminous environment (illuminance, luminance, daylight provision and glare) and qualitative aspects of vision (distribution, uniformity, color rendering, the spectral composition of radiation). A significant part of the illumination of spaces should be provided by daylight with daylight openings, which provide a view to the outside, contributing to the psychological well-being of the occupants [115].
The lighting properties are based on photopic requirements, psychological and photobiological stimulation influencing the health of the occupant. The research of the last 30 years in the field of daylighting has proven a direct relationship between natural light and health. It has been proven that the luminous environment has to ensure visual as well as biophysical human well-being [116,117,118]. Insufficient or inappropriate light can lead to distortions of internal biological rhythms. This may have an impact on performance, safety, and health. Exposure to adequate light promotes the synchronization of the internal human circadian rhythms linked to hormone secretion.
It should be noted that current international standards are based only on photopic (diurnal) sensitivity of the human eye, ignoring scotopic (nocturnal) vision and non-visual effects of light [119]. A review of daylighting and lighting control strategies can be found in [81,119,120,121].
Lighting systems and solar shading systems belong to the fast-reacting systems. Consequentially the change in conditions can take place nearly immediately after a change of requirements. They also belong to the low-energy consumption systems. Nevertheless, it can account for up to 25% of the total building energy consumption [122]. Here, the use of daylight sensors and photocells leads to a major reduction of the energy consumption for lighting [123].
3.2.3. Indoor Air Quality
Standards related to IEQ define ventilation rates, humidity and exposure limits for air pollutants. Measurements of indoor air quality are based on an indirect approach of measuring the intensity of the ventilation, whereas the recommended ventilation rates can be found in ISO 1772-1 [112]. Only when the requirements for ventilation rates are reached, the measurements for specific pollutants can be made. Some recommended values according to the type of building can be found in Guidelines for indoor air quality for selected air pollutants [124]. EN 16798-3 [125] provides performance requirements for non-residential buildings. ASHRAE 62.1 and 62.2 and CR 1752 [126,127,128] describe general ventilation requirements for acceptable indoor air quality, further complemented by a guide for design, construction and commissioning [129]. In all current ventilation standards, only two methods of evaluation are described, a “prescriptive method” and an “analytical procedure” [110]. Indoor air quality is closely related to thermal comfort. Thus, some recommendations such as humidity can be found in standards defining thermal comfort.
Indoor air quality can be controlled in natural ways (windows, wall openings), and artificial ways (air conditioning system). Meaning that the change of air can be either supplied naturally through windows, or it can be introduced by an air conditioning system. Ventilation belongs to the fast reacting systems, so the adaptation to changed requirements can take place immediately.
3.2.4. Acoustic Quality
Acoustic comfort is often understood to be a situation where there is an acceptable level of noise. However, the perception of sound is a much more complex issue, that depends not only on sound intensity and its temporal and spectral features, but also on the activity of a person, state of mind, and expectations among other factors. Special attention to the perception of complex sounds in this context is paid to by the so-called Soundscape research [130].
Noise is clearly defined in DIN 1320 [131] as “the sound occurring within the frequency range of the human hearing which disturbs silence or an intended sound perception and results in annoyance or endangers the health”. Sound can be defined as a wave motion from a sound-producing object. It varies according to frequency and pressure.
According to Genuit [132], acoustic quality “is the degree to which the totality of the individual requirements made on an auditory event are met”. It comprises three different kinds of influencing variables: physical (sound field), psychological (auditory evaluation) and psychoacoustic (auditory perception), so it is multidimensional. Navai and Veitch [86] defined acoustic satisfaction “as a state of contentment with acoustic conditions; it is inclusive of annoyance, loudness, and distraction”. However, there is no standard definition neither for acoustic quality nor acoustic comfort/satisfaction. A good acoustic environment is typically associated with the isolation of unwanted sounds and presence of pleasant sound.
In general, acoustic quality in buildings can be influenced and reached by (1) sound insulation and (2) sound absorption [133]. (1) The sound insulation of a building façade, roof and windows is important in terms of the protection of the building interior from unwanted outdoor noise (such as traffic noise). Sound insulation of floors, wall partitions and doors needs to be considered once indoor sources (neighbours’ noise, air-conditioning units) are present. (2) Once a room is well insulated, room acoustic aspects come into attention. Sound produced inside a room (such as restaurant ambiance, classes at school) can be enhanced due to multiple reflections, causing deterioration of speech intelligibility and the presence of unacceptable noise levels from sources in the interior [85]. In such cases, volume, shape and the total amount of sound absorption play a role. There are many standards that describe sound insulation and sound absorption measurement and simulation procedures. To mention just a few, guidelines can be found in the ISO 10140 series [134], ISO 717 series [135], ISO 3382 series [136], and ISO 12354 series [137].
3.3. Occupant Satisfaction/ Well-Being
Standards set the minimum requirements for the IEQ. However, well-being and occupant satisfaction cannot be achieved just by meeting these minimum requirements. The overall well-being does not depend only on physical factors but also on psychological factors in which social and cultural context plays a big role. While there are several definitions for well-being [17], there is not a generally acknowledged definition. The authors have therefore decided to use and adopt the WHO definition of health [138]:
“Health is a state of complete physical, mental and social well-being and not merely the absence of disease or infirmity.”
This means that well-being, consists of physical, mental and social factors, and their overall satisfaction promotes health. It also means that solely the absence of detrimental influences does not lead to well-being, as the later depends on the overall perception of the surrounding environment and other conditions. However, factors unrelated to the IEQ influence the overall comfort perception. These include climate and weather conditions, building related factors as design, disposition and control, and individual characteristics of the occupants (gender, age, type of work).
Several studies highlighted the differences between the IEQ factors and the overall comfort perception and emphasize the multidimensional nature of comfort perception [11,16]. The results of different studies on the relative impact of different IEQ conditions on the overall satisfaction have brought mixed results [139,140]. A number of studies have tried to create a ranking of importance of IEQ factors for overall satisfaction with the IEQ. An overview of the results of 12 studies and their assigned ranking is given in Table 2 and Figure 5. The studies have resulted in different ranking orders of IEQ factors. This might be due to the fact that factors such as age [141,142,143,144], socio-cultural factors [145] and space-type [67,143] might have an impact on the evaluation of the perceived importance concerning satisfaction with a certain IEQ factor. For example in studies done by Chiang et al. [141], Zalejska-Jonsson and Wilhelmsson [142], and Frontczak et al. [143] the importance of satisfaction with the noise level was reported to be higher for elderly people. Further, out of the 12 studies, a maximum of two have resulted in the same ranking order, and studies focusing on the same building type came to different conclusions. Eleven of the studies based their research on questionnaire survey answers (QS) among occupants and one compares measured data to the requirements of EN 15 251. The use of weighting schemes for IEQ evaluation models was criticized multiple times. Moreover, the relevance of the use of QS to measure effects of IEQ was concluded to be unreliable [25,65,67]. Current IEQ weighting schemes should be, therefore, used with caution.
More research is required to apply IEQ weighting schemes for the evaluation of the quality of the indoor environment and for benchmarking. Multiple studies have revealed that other parameters, such as the amount of space, visual privacy, working environment, and addition of “personal control” leads to increased satisfaction [65,153,154,155,156], whereas the absence of adjustment mechanisms or their ineffectiveness can lead to discomfort and frustration [157,158]. Similar results can be found in the aforementioned HOPE project [107,159], where a significant relationship between combinations of view type, view quality, and social density and perceived discomfort was found. Further, studies focused on the relationship between occupant productivity and IEQ identified temperature, noise level and air quality as the most significant for job performance [11,143].
3.4. Adverse Impacts of Poor IEQ
Poor IEQ can have an adverse impact on human health and performance. Poor building design and management, as well as the presence of harmful substances (in furniture, carpets, and air), can cause the occurrence of related comfort complaints, which can result in decreased performance and increased amounts of sick leave [160,161,162]. Symptoms characterizing poor IEQ are throat, nose and eye irritations, eczema, headaches, fatigue and lack of concentration. These are commonly referred to as sick building syndrome (SBS) [18,101]. The first reports of SBS date back to the 1970s as a result of mechanically ventilated buildings where ventilation and stress-related factors were identified as the main causes of sickness absence [163]. Among additional risk factors are moisture in buildings, higher air temperature, and a high concentration of specific volatile compounds [14]. Some of the causes can be quickly eliminated (old carpets and furniture) while others connected to the building construction involve major investments. There was not yet defined an exact cause for SBS, but in general, the SBS symptoms only occur when there are more than two causing factors [12].
3.4.1. Thermal Comfort
A study on the relationship between performance and interior temperature [164], showed a decrease in performance by 2% per °C increase for temperature ranging between 25 and 35 °C, and no effect on the performance for temperature ranging between 21 and 25 °C. In a different study, Seppänen and Fisk [14] observed an increase in performance for temperature reaching up to 20–23 °C, and a decrease in performance with temperature above 23–24 °C. Nicol and Humphreys [165] identified three contextual variables which influence the thermal comfort perception. The first is the climate (with the corresponding culture and thermal attitudes), the second is the nature of a building (and its services) and the third is time (defining the rate at which the changes occur to which the occupants have to adapt). A relationship between the overall indoor temperature and the SBS was shown in a study published by Wyon [166]. In this study, it was observed that by systematically increasing the temperature from 20 °C to 24.5 °C complains related to the SBS increased from 10% to 60%. The increased temperature led to a higher concentration of harmful substances in the air originating from fixtures. This indicates that there is a high dependency between temperature and air quality.
The link between temperature and performance is particularly relevant in occupational settings because the overall output of workers and their productivity may be strongly affected by increasing workplace temperature and extreme weather events (e.g., heat-waves). This problematic paradigm is receiving increasing attention from different members of society, as the detrimental impact of climate change becomes more evident for the research community, industrial actors, policymakers, and health providers. It is thus not surprising to see a growing number of international initiatives to address these problems and minimize their effect on the population [167].
3.4.2. Visual Comfort
Studies have shown a positive effect of daylighting on health [83]. Discomfort glare belongs to one of the most reported complaints, while blinds operation, its limited functionality, or disturbance by automated operation lead to frustration [168]. A statistically significant relationship between view type, view quality, social density, and perceived discomfort has been reported in Aries, Veitch and Newsham [169]. This is also supported by findings of the HOPE project of positive statistical correlation between view and comfort [159]. These have been identified, to have a positive effect on human psychology, sleep quality and mood. Some other relationships between luminous conditions and occupant satisfaction can be found in [81,84,119].
3.4.3. Indoor Air Quality
To the well-known building-related illnesses attributable to the indoor air quality belong among others CO intoxication, allergic diseases such as rhinitis and asthma, and sensitivity to chemicals in indoor air [170,171]. The effect of poor indoor air quality further depends on intensity, length, and source of noxious exposure. However, risk characterization for air pollutants is mostly done on a single chemical basis, whereas exposures are always a complex mixture of substances [172]. The link between poor indoor air quality and productivity losses has been summarized in [14,108]. In a recent report on noncommunicable diseases WHO explicitly singled out indoor air quality as a cause for 3.7 million deaths in 2012 [173].
3.4.4. Acoustic Comfort
Noise might cause distraction, stress, annoyance, leading to fatigue or it may even damage our hearing. It is well known that a single sound event with a high level, such as 130 dB will render one deaf and that continuous exposure to sound levels higher than 85 dB may lead to a gradual hearing loss. Moreover, much lower sound levels might affect human health once a person is exposed to inappropriate sound levels for a long time. Teachers, for instance, might develop cardiovascular problems or voice disorders if they have to teach in environments with increased sound levels, and even very low levels of 35 dB can paradoxically affect our health in terms of insomnia if they appear in periods of silence and disturb sleep patterns. Studies have shown that not only the difference in sound pressure level but also frequency characteristics affect the resulting degree of annoyance and thus discomfort [174]. For the indoor sound environment in general, sound level and speech intelligibility, and in particular speech privacy belong to be the most important quantifiers [85,175,176]. Finally, in terms of noise and health issues, WHO LARES (Large Analysis and Review of Housing and Health) analysis based on a survey about European housing in 2002–2003 concluded that neighbor noise might also cause health problems [177]. The noise effects have been associated in the past only with damages to hearing. Nowadays it is also established that chronic exposure to noise can cause a variety of health problems, such as hearing impairments, hypertension, cardiovascular problems, sleep disturbances and annoyance. Noise exposure can also have psychological effects such as stress, but there are also detrimental effects on cognitive performance and attention [178].
4. Human Factors in Adaptation
“If a change occurs such as to produce discomfort, people react in ways which tend to restore their comfort.” This definition of adaptive principle, originally formulated for occupant behavior in regard to thermal discomfort [165], is also applicable for all other measurable physical parameters defining IEQ. On the user level, this adaptation can be represented by performing “adaptive actions”. Enabled through technology “adaptive actions” can take place also on building indoor climate control and on the building design level.
Other than the natural/technological limits of adaptation available on each of the three levels of adaptation (the building design and construction level, the IEQ control, the occupant level), time can be identified as one of the decisive factors determining the level on which the adaptation should take place. The time factor could be defined as how fast the environment is able to change, or the period necessary for occupant adaptation/acclimatization, or the time between last two adaptations (in certain cases the frequency of change). This should theoretically follow the natural principle of least resistance, where actions with smaller overall impact and lower energy input should take precedence. Whereas this can be guaranteed for the adaptations at the building indoor climate control level and also on the building design level, the occupant behavior introduces significant uncertainty, because “occupants adapt their environment and personal characteristics to achieve their comfort in ways that are convenient to them rather than being necessarily energy-conserving” [61]. Occupants can adapt to their environment through [19,179]:
- physical adaptive actions (e.g., increase their physical activity, change their clothes, altering their environment);
- behavioral adjustment (e.g., change of habits or tolerance limits);
- physiological adaptation (e.g., accommodation of the eye); where limits of the adaptation are imposed by the human physiology in it of itself.
These adaptive actions can take place consciously (most of the physical adaptive actions), subconsciously (some of the behavioral changes) or be automatically steered by the peripheral nervous system (physiological adaptation). These are defined by their natural limits ranging from ability limits to perception thresholds.
4.1. Limits of Human Physical Adaptive Actions
When talking about physical adaptative actions in the framework of human adaptation to the indoor environmental conditions we refer to all the adaptive actions that require physical activity. The goal of the actions performed by the occupants is to alter their immediate environment to achieve comfort. According to Nikolopulou et al. [179] we distinguish reactive (referring to personal changes such as clothes) and interactive adaptive actions (referring to interactive actions with the environment, such as the closing of curtains). Physical adaptive actions are therefore limited by occupants’ abilities [180] and the accessibility to environmental altering control tools but can take place only while respecting the human behavioral limits and physiological limits.
4.2. Human Behavioral Limits
The necessity of behavioral change has been identified as a significant barrier when taking actions related to the mitigation of climate change, such as a change in energy consumption habits. The required change is perceived to be only reachable if discomfort, the sacrifice of living standards and social image is involved [181]. The indoor environment should provide conditions in which people can function effectively, efficiently and comfortably. However, human global experience of comfort does not solely depend on physiological limits but also psychological factors influencing behavior patterns. These patterns depend on a person’s attitude, initiative, motivation and so on, and are based on the needs and expectations of the individual [182,183]. Environmental stressors impact human psychology and human physiology. A psychological stressor can exceed the limits of tolerance and disturb the psychological equilibrium of an individual, whereas the stressor may occur in the form of over- and under-stimulation [184]. Each act of perception (sensory trigger) followed by a reaction is a hypothesis based on prior experience and any new sensory event is perceived in relation to a former experience. Based on the demands of the environment, a shift in the distribution of the responses can take place. This process is called adaptation (Figure 6). Behavioral adjustment enables people to actively maintain their own comfort, and it plays a crucial role in energy conservation. This, for example, can be observed bet the change of clothing during different seasons. Behavior plays a significant role in long-term changes in consumption patterns and attitudes towards the environment, but psychological barriers hinder this process of behavioral adaptation. These barriers, according to Gifford include [185]: limited cognition of the problem, ideological worldviews, comparisons with other people (i.e., why should I if they do not?), sunk cost and behavioral momentum (e.g., it is cheaper to ignore than to change, and its simpler to repeat than to change), disregard towards experts and authorities (i.e., mistrust to other people leads to ignorance of advice), perceived risk of change (i.e., uncertainty of investment into energy efficient technologies), and positive but inadequate behavior change (i.e., installing solar panels, but increasing overall energy consumption). There are three critical factors determining successful behavioral adaptation when it comes to energy saving and indoor environment [35]:
- means in the form of knowledge about how to or which technology to use,
- motive for change in form of reason or incentive,
- and opportunity in form of available resources such as time and money, further strengthened by the ease of use, general acceptance of changed behavior by other people and maintenance of comfort and health.
Further, the process of adaptation can only take place in between physiological limits of the human sensory system, particularly the limits of human capacity to experience temperature and touch, light and color, sound and smell.
4.3. Human Physiological Limits
4.3.1. Physiological Limits of Human Somatosensory System
The somatosensory system is responsible for the sensation experience labeled as temperature. It governs other than the sense of touch, also the sensation of pain, movement, and posture, pressure, vibration and temperature. Through mechanoreceptors in the skin, low vibrations with 5–250 Hz frequency can be perceived [186]. For the perception of the temperature, the responsibility lies with cold- and warm- sensitive sensory fibres in the skin, responding to changes in skin temperature, whereas the first only respond to cooling, and the latter only to warming. The cool and cold sensitive fibers respond to temperatures lower than 17 °C to a maximum of 34 °C, while warm receptors respond to a range of 33 °C to 46 °C. The temperature of 32 °C (approximate temperature of human skin in thermal-neutral condition) produces no sensation at all (known as physiological zero). Temperatures above and around 43 °C will begin to cause skin damage if the skin contact is of prolonged duration, and temperatures under 17 °C are reported as painfully cold by humans [187]. The upper limit for thermal radiation exposure is defined at approximately 3500 W/m2 for exposure shorter than 10 seconds, before the onset of skin burn [188], Figure 7. However, the perception of thermal comfort does not depend only on temperature (air, radiant, surface) but also on air humidity, air velocity and individual human parameters like clothing, and metabolic rate which depends on age and activity level [189]. It has to be mentioned that continued exposure to warm or cold stimuli, leads to a gradual desensitization and an increase in the threshold values. The theoretical limit is in this case presented by the core body temperature. If the body temperature exceeds 40 °C, an acute risk of heat stroke arises and if the core temperature falls under 35 °C a person is at risk of hypothermia [190].
Several studies suggested using the thermal sensation instead of the temperature per se to ensure the well-being of occupants [191]. A contemporary state-of-the-art on thermal comfort approaches, physiological basis of comfort and mathematical modeling of heat exchanged between the human body and its environment can be found in [69].
4.3.2. Physiological Limits of Human Vision
Visual perception is the ability to interpret information from light in the visible spectrum reflected by the objects in the environment, that reach the human eye. The optical performance of the human eye decreases with age. The human visual system (of a young and healthy individual) perceives visible radiation (light) in the range of wavelengths between 370 and 730 nm, with the highest sensitivity for photopic sight at 555 nm [192]. The normal visual acuity, based on the smallest separation at which two parallel lines can be discriminated, for human vision, corresponds to ~1 arc-minute of visual angle (a 2 Euro coin subtends an angle of 1 arc-minute at a distance of ~10 m) [193]. The range of light levels perceptible spans over 11 orders of magnitude from an absolute threshold of 3,10 × 10⁻⁶ cd/m2 for “scotopic” vision, to 3 × 10⁵ cd/m2 for “photopic” vision [194]. The flicker fusion threshold at which an intermittent light stimulus appears to be completely steady lies between 50 and 90 Hz, but visual flicker artifacts can be in certain cases observed at rates over 500 Hz [195]. The theoretical maximal resolution is estimated to be approximately 15 million variable resolution pixels per eye [196]. Depending on the bone structure, the maximum human stereoscopic field of view can be up to 180–200° horizontally and up to 135° vertically, although objects can be seen in detail only within the central area of the visual field (near periphery) [197].
The eye is able to refocus and sharpen the image within a certain range, through an effect known as accommodation of the eye. Further to maintain visual acuity, the human visual system is capable to adapt to degraded visual conditions, such as low illumination and glare. In order to adapt (or avoid damage) to the radiant flux that reaches the retina, regulating mechanisms take place in the eye, ranging from a variation of the pupil diameter, to neuronal and chemical processes in the pigments within the retina. A full sensitivity adaption can take up to 20 minutes (a dark adaptation of the rods) [192]. Adaptation can also take place through eye movement and neck rotation (change of focus point, gaze diversion) and a change of position. Human eyes can pitch 20° upward and 25° downward, while eye yaw is symmetric by allowing 35° to the left or right. Beginning in a neutral position the normal neck range of motion equals 60° for neck flexion up and down, 45° for lateral neck flexion to the right and left and 80° for neck rotation, turning head to the right and to the left [198].
4.3.3. Physiological Limits of Human Auditory System
Hearing is the first sense to be developed in a human fetus, this takes place in the 12th week after conception. The ears have not been formed yet at that time, but the fetus is already able to perceive different vibrations and resonances. Sound can be perceived through air and bone conduction. The frequency spectrum of hearing lies between 20 Hz to 20 kHz, whereas the upper hearing limit decreases with age (most adults do not hear over 16 kHz). The human hearing system can sense a sound pressure ranging from 10−5 Pa to 100 Pa, defined by 0 dB as the threshold of hearing and 130 dB as the threshold of pain. Further, we are able to distinguish around 1300 tones, with the ability to distinguish intervals, defined as the difference between two audible frequencies, such as an octave (factor of 2). The auditory system is capable, aside from the perception of loudness, pitch, and timbre, to evaluate the spatial position of a sound source in terms of direction and distance [199]. Based on the physiology of the ear and head, the ability to localize a source of sound starts at 500 Hz, corresponding to 69 cm of wavelength, which is four times the diameter of an average human head. At 4 kHz, with a wavelength below 10 cm, the head and especially its details (outer ear, especially pinna) start to cast a shadow and will scatter sound waves [200].
4.3.4. Physiological Limits of Human Sensitivity to Inhalation of Pollutants
The human perception of the air quality involves two human senses: the general chemical sense (somesthesia), located all over the mucous membranes, in the eyes and nose sensitive to irritants, whereas the olfactory sense, located in the nose, is responsible for odor detection and pheromone detection [201]. These senses interact, therefore substances can evoke odor and an irritating sensation, while odor sensitivity decreases with time, discomfort from irritation will normally increase with time [110,202]. Further, all the chemical substances that enter the nose (or mouth) while breathing then continue further down the respiratory tract to the lungs. Olfactory receptor cells contain more than 1000 receptor proteins, making humans capable of detecting around one trillion odors [203]. Inhaled toxins represent a health risk and can result in i.e., in chemically induced nasal lesions, sensory irritation, olfactory and trigeminal nerve toxicity [204]. The exposure limits for substances are based on their overall effects on health, defined as the concentration of the pollutants over time [205,206].
5. Built Environment
In Section 3 we have described the minimum performance requirements for the IEQ defined in standards. These represent a basic framework for occupants’ well-being. In Section 4 a description of human physical, behavioral and physiological limits for adaptation to environmental conditions were discussed. These all have to be taken into consideration while designing an energy efficient and healthy building environment, as the overall goal is not just the deployment of such environments but also their overall acceptance by their occupants [207]. Design principles, initiatives, and tools that encourage the culture of energy efficiency [208] and active engagement of occupants should be employed [209], otherwise the potential of an innovative build environment remains largely untapped [24]. The main purpose of more energy efficient buildings is to increase the sustainability of the built environment while ensuring the long-term well-being of occupants. Ignorance of the before described “human factors” and requirements for well-being can reduce the adoption and use of energy efficient measures and can lead to disinterest and disenchantment of building occupants [40,41,210].
5.1. Sustainability of the Built Environment
Whereas the quality of the indoor environment is noticeable within a short period of time (immediately or after a few days), its impact is not limited solely on the human sensory system. The means with which the level of comfort has been achieved plays a significant role in the consumption and distribution of resources. These have an impact on the overall sustainability of the built environment as well as the resulting energy efficiency. The sustainability concept as we know it first appeared in 1987 in the Burtland Report, which was a result of a paramount need to study and identify what impact human activity has on the environment, and was defined as [211]:
“Sustainable development is development that meets the needs of the present without compromising the ability of future generations to meet their own needs.”
The report further continues with:
“…sustainable development is not a fixed state of harmony, but rather a process of change in which the exploitation of resources, the direction of investments, the orientation of technological development, and institutional change are made consistent with future as well as present needs.”
The built environment dominates humanity‘s impact on climate change, results in resource depletion, loss of biodiversity, contributes directly to health and well-being, and has socio-economical underlining consequences. The issues of human environmental impact and the natural footprint are approached by two major international agreements that address climate change: United Nations Framework Convention on Climate Change (UNFCCC), and the Kyoto Protocol, with its follow-up agreement at COP21 in Paris 2015 which entered into force on 4 November, 2016 [212]. Based on these agreements the signatory countries have developed their own climate and energy policies, with the aim of holding warming well below 2 °C, and striving to limit warming to 1.5 °C [213].
5.2. Energy Efficiency of the Built Environment
The building sector accounts for approximately 19% of all global greenhouse gas (GHG) emissions in the world, whereas most of GHG emissions belong to indirect CO2 emissions from electricity use in buildings. These also show a dynamic growth in the last four decades (quintupled for residential, and quadrupled for commercial), and it is estimated that the global building energy use, may double or triple by the mid-century. Buildings embody the biggest unmet need for basic energy services and represent a critical piece for low-carbon future [2].
The reduction of energy demand and the increase of energy efficiency is considered to be a dominant contribution to tackle global climate change. However, caution is advised against the oversimplification of the problematics of energy demand reduction [36]. The decoupling of energy consumption from global economic growth is proving to be challenging, and could negatively influence economic growth [214,215].
Energy consumption represents the total amount of energy used for a certain work during certain time periods. In the context of the final energy consumption of countries, or sectors, their yearly energy consumption is described in terms of million tons of oil equivalent (Mtoe). Energy consumption can be reduced by the inference of improving the energy efficiency. Energy efficiency is a measure that represents the amount of energy output for a given energy input, it is strongly connected to the technological advancement. The overall goal is to reduce the amount of inputs and to maintain the same outputs and achieve a more energy efficient state. To evaluate how efficiently an economy consumes energy we use energy intensity. It is a measure that represents the amount of energy used to produce a unit of output, and most commonly refers to the ratio between gross energy consumption and gross domestic product. A reduction of energy intensity can be achieved via structural changes and overall technological advancement. Technological advancement resulting in higher energy efficiency is more important for countries with higher income per capita, while structural change, denoting sectoral shifts within a country, proves to be more important for all income levels [216,217]. Despite the fact that global energy intensity has been constantly decreasing [218], the global energy demand grew by 2% in 2017 [219].
The climate policy is in the EU represented by the “20-20-20“ climate and energy targets [220], by the Directive 2010/31/EU [221] on the energy performance of buildings and by Directive 2012/27/EU [222] on energy efficiency. The Directive 2010/31/EU set a strict goal of “all new buildings being nearly zero energy buildings by 31 December 2020 (public buildings by 31 December 2018)“ [221]. To enable the delivery of the Paris Agreement commitments [223], the European Commission has presented a new package of measures, with milestones to ensure “a sustainable, competitive, secure and decarbonised energy system by 2050”, which introduces a necessity for long-term renovation strategies, necessity for skills development and education in the construction and energy efficiency sectors, promotion of smart technologies, and promotion of health and well-being of building users, defined in the revised energy performance of buildings Directive 2018/844/EU [224]. However, even if these existing policies and announced intentions would come to full force, the International Energy Agency (IEA) predicts that the global energy need would expand by 30% between today and 2040. This is due to the fact that even though the energy efficiency improves, the global floor area continues to grow, causing an increase of energy consumption of the building sector of 0.8% a year [225]. Strict regulation of the building sector is necessary to achieve the limit increase in the global average temperature under 2 °C [226].
Energy consumption in the building sector is especially high in developed countries (up to 40% of the total consumption, Table 3) [231]. The high potential of energy savings triggers the development of energy conservation technologies. The global building envelope performance (its capacity to minimize energy demand for heating and cooling) has improved by approximately 1.4% a year from 2010 [232]. The global investment in energy efficiency of buildings reached €108.5 billion in 2016 [233], but still represents only a fraction of the total €4 trillion spent on buildings and construction globally [225]. In the EU the renewables cover, approximately 15% of energy demand for residential buildings, and 4% for non-residential buildings [234]. Through the announced “Smart financing for smart buildings” the EU plans to unlock €10 billion between 2018 and 2020 to fund energy efficiency and renewables in buildings [235], to support the development of technologies to lower the final energy consumption of buildings (Figure 8). However, to reach the 2 °C scenario [212,236], according to IEA, an investment of €25 trillion in the building sector in the following 40 years (until 2050) is needed in technology development [237], p. 43. Investment in digitalization of buildings, such as the introduction of smart controls could lead to lowering of buildings energy consumption by as much as 10% globally [225,238].
Energy use is considered to be the most reliable indicator of the successful implementation of a sustainable building design [239]. Contemporary rating systems for newly built high-performance buildings base their certification on predicted energy performance, acquired with the use of simulation tools based on proposed design [240]. However, studies show that there is a gap between actual and predicted energy consumption (simulated energy consumption) [105,239,241,242,243]. The use of actual energy performance in certification could further stimulate the development of the building and construction sector and result in higher energy efficiency and lower energy consumption. Among the identified socio-technical factors influencing the gap between the predicted and actual energy performance there are:
5.3. Building Design Level
Systematic approaches to building design, which account for interactions between different building functions, have the potential to increase energy efficiency and result in an optimized building performance [248]. This is achieved by an integrated building design process, based on the cooperation of all the actors involved in the project, that agree on far-reaching decisions jointly, to ensure building performance [249]. The challenges of reducing the fragmentation of the design process, the increased complexity and necessity for the involvement of various professions during building design, construction and operation, has resulted in the innovation of collaborative techniques for storing, sharing and analysis of project data [250,251]. The most prominent is Building information modeling (BIM), which in recent years has seen one of the highest increases in the engagement of architecture, engineering, and construction (AEC) professionals, and has undergone one of the most promising developments in the industry. BIM modeling supports the cooperation of professionals involved in project drafting and realization and supports the development of sustainable building facilities. The final model is data rich, representing a full virtual 3D model of the developed construction, storing parametric data including dimensions, design, costs, physical properties of elements, description of relationships between objects, as well as life-cycle information. BIM modeling has the potential to minimize the fragmentation of the building design process, enabling inclusive involvement of large groups of stakeholders ranging from design, construction, operation, and maintenance, having a beneficial impact on clash detection, cost-effectiveness and overall sustainability [252,253].
Buildings’ energy efficiency can be achieved through the application of passive or active design strategies. Passive building design, refers to the use of the potential available in the local climate and site conditions, benefiting from passive use of solar radiation and natural ventilation [44,57,58], whereas the design solution leads to energy savings [59]. Active technology solutions refer to onsite energy generation, heat-pumps, and automated control of the indoor environment [54,254]. Maximization of passive features such as orientation, daylighting, cooling and heating, enhanced by location-specific systems covering the remaining gap in energy loads (such as heat pumps and solar panels) lead to more energy and emission conscious designs with higher indoor environmental quality [39]. Further, implementation of passive design measures increases the resiliency of buildings, where in case of a prolonged power outage during extreme weather conditions, the buildings remain habitable and provide shelter passively [255].
The development of all these designing methods is also supported by the Energy Performance of Building Directive (EPBD) [221] with the nZEB requirement. In the EPBD, nZEB is defined as follows:
“…a building that has a very high energy performance, … The nearly zero or very low amount of energy required should be covered, to a very significant extent, by energy from renewable sources, including energy from renewable sources produced on/site or nearby.”
5.4. Building Technology Level
Building technology development is focused on increasing energy efficiency, which is done not only by developing the technology per se, but by making the technologies more responsive to immediate conditions. This includes local weather conditions, requirements on functionality and IEQ as well as adaptation to individual occupant needs. Implementation of energy efficient technologies, in particular, focused on the retrofitting of buildings, is considered to be one of the main strategies to address energy poverty in households. Worldwide 13% of the population lacks access to modern electricity [258,259], and in the EU only, nearly 11% of citizens are considered energy-poor, and not able to keep their homes adequately warm [260]. The main reasons for energy poverty are considered the rise in prices, low income and poor energy performance of households [260,261,262]. To energy-efficient building technologies belong (1) high-performance building envelopes (HPBE) [263], (2) efficient appliances such as lighting, heating, ventilation and air-conditioning [264], (3) building automation and control systems (BACS) [265] and more [266].
It is important to mention that contemporary building design process is strongly dependent on information and communication technologies (ICTs) [267], depending on predictive methods and on building simulation [266,268]. This enables a new systematic approach to building design, with increased added value through integrated building design [248]. Because of this high technologization of building design, the term “intelligent building” is used with contemporary building design [49]. The impact of building design on energy consumption and IEQ can be evaluated through simulation programs (e.g., ESPr, EnergyPlus, Comsol). This type of prediction enables quick design optimization to take place before construction [269].
Conventional building constructions are static, and once built the adaptation to surrounding conditions, or to current occupants’ requirements, takes place in a very limited form. The adaptation of the whole building performance is based on a simple “on-off” switch with limited variability of the system (e.g., ventilation, blinds and heating system), whereas no system is available to resolve and account for the interdependence of the performance indicators. Advanced building technologies, such as HPBE and BACS, enable real-time response to environmental conditions as they do maintain high adaptation capabilities after construction, expanding the performance abilities of buildings [54,270]. This transformation ability can be used to maintain the IEQ, and therefore can be a part of the building automation and climate control systems [271].
5.4.1. High-Performance Building Envelopes
An HPBE is considered an external layer of building, that is able to change its properties in order to provide comfort, as a reaction to the change of external or internal conditions, or requirements. HPEBs can be found under multiple names in literature, including responsive, adaptive, kinetic, intelligent and similar. The core concept is based on the imitation of processes native to the organism, that enable adaptation to conditions in order to provide comfort and equilibrium, whereas stress is put on the reversibility and the ability to repeat the process of adaptation [54,263]. The changes can take place at different scales, ranging from molecular changes to structural changes in the whole system. The adaptation is enabled through a system of sensors, processors, and actuators, or based on the physical properties of the materials used where changes occur at the molecular and composition level (e.g., phase change materials) [8].
5.4.2. Efficient Appliances
Energy policies support the uptake of improved energy conservation practices as well as the adoption of energy efficient appliances and technologies (e.g., heating systems, household appliances, and office equipment). The changeover to energy efficient appliances leads to lower energy consumption (reduction of up to 23% in households) and lower instantaneous electric demand [272]. Appliances equipped with motion sensors, or connected to an automatic centralized control system based on occupancy or utilization, bring higher reduction than conventional appliances and can result in a 10% reduction in energy consumption compared to appliances without any power control system, or equipped with a standby mode [273,274].
5.4.3. Building Automation and Climate Control Systems
When referring to IEQ control a building can be free-running (without automated control), with climate control, or use a mixed strategy. The IEQ of a free-running building is solely dependent on occupant operation. While this approach is the most innate, when comparing buildings with and without climate control, the latter may have higher energy loses [275].
Buildings with integrated room automation (IRA) represent a technical counterpart to free-running buildings. IRA is based on data collection and controls lighting, blinds, heating, cooling, and ventilation [276]. This includes the use of advanced IEQ control strategies using non-predictive control or predictive control, set-back plans and automated adaptation according to occupancy information. The efficiency of an adaptation depends on the processed relevant data and the prediction of the adaptation outcome. The internal microclimate of a building is then a result of the “computation of multicriterial optimization, taking into account technical and psychological comfort and energy savings” [108]. For this, systems for the collection of data and processing have to be applied. A non-predictive control system can lead to energy savings of 1–15% while predictive control has an energy saving potential of 16–41% [277].
Current advanced IEQ control systems use different approaches: learning-based methods, rule-based control (RBC), model-based predictive control (MPC) and agent-based control systems [50,51]. Selection of building climate control strategy is highly dependent on the available computational capacity. Intelligent control systems, especially MPC, involve high initial investments in building modeling, simulation, data collection, and processing.
RBC is a “condition-action” based system and belongs to the non-predictive systems. It relays on databases of pre-set numerical thresholds of indoor environmental factors (for example temperature threshold for cooling/heating) and corresponding reaction of building climate control technologies (heating system, ventilation, lighting …) [278,279,280]. Currently it is probably the most commonly used control practice. The system reacts on ad hoc conditions and is dependable on pre-set parameters.
Progressive building climate control techniques are based on artificial intelligence, using probabilistic models to predict the optimum control strategy [281]. They solve probabilistic relations between variable processes represented by weather, building operation and occupant interference and compute the probabilistic outcome of their relations. The MPC approach solves over a finite horizon a number of optimization problems to determine optimal control outputs [265]. The process is continuously repeated over a pre-set time period (ca. 10 minutes sampling rate). A collection of literature references can be found in the databases of the project Opti-control [282]. The MPC can be used to increase energy efficiency in building simulation [281,283,284,285,286], to create weather forecasts [265] and for occupancy modeling [276,287,288]. All these studies show that predictive strategies are more efficient than non-predictive conventional strategies when it comes to building climate control, especially for thermal regulation. In a study comparing predictive control with conventional control [289] savings of 15%, 24% and 35% were obtained for cold, mild and warm days respectfully. It has to be mentioned that, currently, only a small fraction of buildings have implemented this kind of building climate control.
To gather information used to operate these smart environments, sensors are used to collect data on environmental conditions [53]. These are distributed through the monitored spaces to collect relevant data. Currently they have to be installed in a fixed position and connected directly to the operating computer. However, wireless sensor networks (WSNs) are a promising technology [290]. This means that currently, static nodes for data collection will become mobile. The sensors are coupled with actuators which are responsible for the system operation (blinds, lightings and heaters).
Indoor environmental climate controls can be linked to immediate occupancy information. There is a big potential in using occupancy information to achieve a more energy efficient and healthy building climate control [63,288]. IRA has a savings potential of up to 34% that can be reached by adjusting lighting and especially ventilation to instantaneous measurements [288]. Scheduled temperature plans can lead to energy savings of up to 18% [277]. Further, artificial intelligence systems are able to learn user preferences and also recognize and make use of space properties (time needed to heat, energy needed) [287].
5.5. Interactions Between Occupant and Building
The occupant preferences determine the ergonomics of designed environments, so it can be said that user is the scale of design and the success of each design is dependable on occupant acceptance and successful operation [61,291]. To main factors that influence energy consumption on the occupant level scale, besides behavioral constraints discussed in Section 4.1, belong:
There is a high dependency between energy consumption and criteria set for the IEQ and building design. However, it has to be noted that reducing energy consumption while compromising the IEQ will have an adverse impact on health and will lead to a decrease in productivity.
5.5.1. Income Level of Building Occupants
Independent surveys agree that socioeconomic characteristics such as income level and ownership are significant drivers for energy consumption [298,299]. Low-income level is one of the factors negatively influencing the overall energy efficiency of consumers, and these consumers are also at risk of energy poverty [260]. Studies investigating the probability of investment of consumers in energy efficient technologies have shown that owners of households with a high-income level are more likely to invest in these technologies. However, for these households, other factors, such as age composition and education, are more determining [299,300,301].
5.5.2. Age Composition and Education of Building Occupants
The age of building occupants is considered to be a good indicator for energy-conscious behavior, such as the adoption of renewable energy practices [301], energy conservation and adoption of energy efficient technologies [292,300]. The studies suggest that younger and middle-aged building occupants are more likely to adopt energy- and climate-conscious behavior, while older occupants place more importance on financial savings. Elderly occupants are further less informed about energy-saving measures available. Lastly, the level of education seems to play a significant role for energy-conscious behavior, where better-educated occupants understand better the environmental problems and have more knowledge how to engage in energy-conscious behaviors [292,302,303].
5.5.3. Available and Perceived Control
While occupant behavior can negatively affect energy consumption [304] and automated control leads to significant energy savings as reported in several studies [39,51,265,283,288,305,306], the difference between available a perceived control can have a major impact on user satisfaction. The lack to effective IEQ control leads to dissatisfaction [15,84,154,295]. However, several studies report higher forgiveness for IEQ factors if occupants have more access to the building controls [28,159,165,295,307]. In line with this, a study made by de Dear and Bragger [308] suggests that occupants in naturally-ventilated buildings are more responsive to indoor building climate (e.g., clothing adjustment) and more satisfied than occupants of buildings with centralized HVAC. Karjalainen and Lappalainen stated that [287]: ”the automated systems should provide conditions that satisfy the average person but also give occupants the opportunity to alter the conditions based on personal wishes”.
5.5.4. Training on Building System Control Operation
Personal control generally refers to the possibility to manipulate blinds, lighting, open a window or use a fan. It can also refer to the possibility to adjust the automated control. Through sensor data collection the user has access to a vast amount of information. This can lead to frustration and dissatisfaction. The “rule of simplicity” should be applied in the user interface [287].
While the conventional design is based on manual operation and most adjustments are intuitive and backed up by experience, contemporary design is highly technical, and thus demanding on user operation. In research by Day and Gunderson [296] importance of effective training on building system control operation (system overrule, impact on energy consumption) was studied. Users that received effective training were more likely satisfied with their indoor environment. On the contrary users with no, or ineffective training, reported discomfort with their working environment. This can have an impact on their overall productivity and health performance.
Further, the technical limitations of indoor environmental controls have to be taken into consideration. If the effective change does not take place in a notable time-period, this will also lead to increased dissatisfaction [154]. This must be taken into consideration mainly for the heating system [309].
One of the indicators of a good indoor environment is the perceived productivity of the occupants. The improvement of productivity through successful design is a subject to a number of studies [157,191,310]. This only confirms the conclusion of [311] that “the economic benefits of energy-efficient design may be significantly greater than just the energy cost savings”. This brings the argument of the economic feasibility of improved IEQ [312].
6. Discussion and Conclusions
A comprehensive description of the limits and adaptation opportunities regarding the relationship between an occupant and the built environment was presented in this paper. We have defined the factors that limit the interactions between occupants, IEQ and building design. It is crucial to respect the interdependencies in a human-built environment system for a successful design of healthy, energy efficient and comfortable indoor environment.
The review paper was drafted based on an analysis of more than 300 scientific publications, published between 1960 and 2019, that dealt with the topics concerning IEQ, energy efficiency, occupant comfort, and health, sustainability and adaptability of the built environment. A holistic analysis of selected review papers was presented, showing an increase in publications focusing on the technologization of the built environment, whereas in recently published papers the occurrence of terms such as smart home and model-based predictive control is more frequent.
In this paper, we have reviewed the current requirements on IEQ performance codified in contemporary standards. In conclusion, it can be said that in all respective fields of IEQ standardization, there is a lack of guidelines for the design of non-static building environments. The future of the building design is in the ability of the built environment to adapt to instant performance requirements and environmental conditions, and this is an upcoming challenge for future standardization. A necessity to shift the focus from measurable physical parameters used to evaluate the IEQ performance (thermal comfort, visual comfort, indoor air quality and acoustical quality), was highlighted within this review paper, as scientific evidence proves that other performance parameters such as type of space, building design, and working conditions have an impact on the overall satisfaction of occupants with the building environment.
The review highlights the necessity of a human-centric design of the built environment, where the efficiency of technology can be measured only if it is successfully implemented and used by the building occupants. In here the limiting human factors, defining the boundaries of occupants’ physical actions, behavioral adjustment, and physiological adaptation, while interacting with the built environment have to be taken into account.
Energy consumption, conservation, and the impact of climate change are the upcoming challenges for the future IEQ research. The importance of flexibility and adaptability is highlighted by these issues, both of which can be achieved through an automated adaptive building climate control. However, substantial uncertainties when it comes to the set-up, operation, ease of use, maintenance and security still exist. There is a need to create a structure enabling continuous training in the field of building technology and operation for users. The future building environment will be highly automated, based on artificial intelligence and prediction methods. To ensure occupant comfort the basic operational knowledge, opportunity to overrule the system has to be provided, and attention has to be drawn to the user interface and simplicity.
The development of the built environment towards sustainability with the development of energy efficient and healthy technologies has to be broadly recognized, while cost-effectiveness of these technologies has to be preserved. This review can be used as a guide while preparing campaigns to improve the information provided to stakeholders, to raise awareness about energy-efficient building technologies and popularize conservation practices among occupants. We believe that these recommendations will be relevant, especially concerning the emerging markets when it comes to building automatization and that they will contribute to more human-centric and environmentally-conscious building initiatives.
Author Contributions
Conceptualization P.S.; methodology and formal analysis, P.S. and A.H.; writing—original draft preparation, P.S. and A.H.; writing—review and editing, M.R., T.S.M. and A.H.; supervision, M.R. and T.S.M.; funding acquisition, M.R.
Funding
This work was carried out in the framework of the “PaPaBuild” project under the action H2020-MSCA-RISE-2015–grant 690970, COST Action TU1303: Novel Structural Skins and VEGA 1/0050/18: Photovoltaic facades of nearly zero energy buildings.
Conflicts of Interest
The authors declare no conflict of interest.
Abbreviations
| CABS | climate adaptive building shell |
| IEQ | indoor environment quality |
| HOPE | Health Optimization Protocol for Energy-efficient building |
| WHO | World Health Organization |
| LARES | Large Analysis and Review of Housing and Health |
| QS | questionnaire survey |
| SBS | sick building syndrome |
| UNFCCC | United Nations Framework Convention on Climate Change |
| GHG | greenhouse gas |
| IEA | International Energy Agency |
| HPBE | high-performance building envelopes |
| BACS | building automation and control systems |
| ICT | information and communication technologies |
| IRA | integrated room automation |
| RBC | rule-based control |
| MPC | model-based predictive control |
| WSN | wireless sensor networks |
References
- Klepeis, N.E.; Nelson, W.C.; Ott, W.R.; Robinson, J.P.; Tsang, A.M.; Switzer, P.; Behar, J.V.; Hern, S.C. The National Human Activity Pattern Survey (NHAPS): A resource for assessing exposure to environmental pollutants. J. Expos. Anal. Environ. Epidemiol. 2001, 11, 231–252. [Google Scholar] [CrossRef] [PubMed]
- Lucon, O.; Ürge-Vorsatz, D.; Ahmed, A.Z.; Akhbari, H.; Bertoldi, P.; Cabeza, L.F.; Eyre, N.; Gadgil, A.; Harvey, L.D.D.; Jiang, Y.; et al. Buildings. In Climate Change 2014: Mitigation of Climate Change. Contribution of Working Group III to the Fifth Assessment Report of the Intergovernmental Panel on Climate Change; Cambridge University Press: Cambridge, UK, 2014. [Google Scholar]
- Ürge-Vorsatz, D.; Eyre, N.; Graham, P.; Harvey, L.D.D.; Hertwich, E.; Jiang, Y.; Kornevall, C.; Majumdar, M.; McMahon, J.E.; Mirasgedis, S.; et al. Energy End-Use: Buildings. In Global Energy Assessment—Toward a Sustain. Future; Cambridge University Press: Cambridge, UK; New York, NY, USA, 2012; pp. 649–760. [Google Scholar]
- United Nations. Sustainable Development Goals Report 2018; United Nations: New York, NY, USA, 2018. [Google Scholar]
- Lamb, W.F.; Creutzig, F.; Callaghan, M.W.; Minx, J.C. Learning about urban climate solutions. Nat. Clim. Chang. 2018, 9, 279–287. [Google Scholar] [CrossRef]
- Anderson, J.E.; Wulfhorst, G.; Lang, W. Energy analysis of the built environment—A review and outlook. Renew. Sustain. Energy Rev. 2015, 44, 149–158. [Google Scholar] [CrossRef]
- Paone, A.; Bacher, J. The impact of building occupant behavior on energy efficiency and methods to influence it: A review of the state of the art. Energies 2018, 11, 953. [Google Scholar] [CrossRef]
- Taveres-Cachat, E.; Grynning, S.; Thomsen, J.; Selkowitz, S. Responsive building envelope concepts in zero emission neighborhoods and smart cities—A roadmap to implementation. Build. Environ. 2019, 149, 446–457. [Google Scholar] [CrossRef]
- Hauge, Å.L.; Thomsen, J.; Berker, T. User evaluations of energy efficient buildings: Literature review and further research. Adv. Build. Energy Res. 2011, 5, 109–127. [Google Scholar] [CrossRef] [Green Version]
- Al Horr, Y.; Arif, M.; Katafygiotou, M.; Mazroei, A.; Kaushik, A.; Elsarrag, E. Impact of indoor environmental quality on occupant well-being and comfort: A review of the literature. Int. J. Sustain. Built Environ. 2016, 5, 1–11. [Google Scholar] [CrossRef] [Green Version]
- Al Horr, Y.; Arif, M.; Kaushik, A.; Mazroei, A.; Katafygiotou, M.; Elsarrag, E. Occupant productivity and office indoor environment quality: A review of the literature. Build. Environ. 2016, 105, 369–389. [Google Scholar] [CrossRef] [Green Version]
- Mitchell, C.S.; Zhang, J.; Sigsgaard, T.; Jantunen, M.; Lioy, P.J.; Samson, R.; Karol, M.H. Current State of the Science: Health Effects and Indoor Environmental Quality. Environ. Health Pers. 2007, 115, 958–964. [Google Scholar] [CrossRef] [Green Version]
- Bluyssen, P.M.; Janssen, S.; Van den Brink, L.H.; De Kluizenaar, Y. Assessment of wellbeing in an indoor office environment. Build. Environ. 2011, 46, 2632–2640. [Google Scholar] [CrossRef]
- Seppänen, O.; Fisk, W.J. Some Quantitative Relations between Indoor Environmental Quality and Work Performance or Health. ASHRAE Res. J. 2006, 12, 957–973. [Google Scholar] [CrossRef] [Green Version]
- Frontczak, M.; Wargocki, P. Literature survey on how different factors influence human comfort in indoor environments. Build. Environ. 2011, 46, 922–937. [Google Scholar] [CrossRef]
- Ortiz, M.A.; Kurvers, S.R.; Bluyssen, P.M. A review of comfort, health, and energy use: Understanding daily energy use and wellbeing for the development of a new approach to study comfort. Energy Build. 2017, 152, 323–335. [Google Scholar] [CrossRef]
- Dodge, R.; Daly, A.P.; Huyton, J.; Sanders, L.D. The challenge of defining wellbeing. Int. J. Wellbeing 2012, 2, 222–235. [Google Scholar] [CrossRef] [Green Version]
- Rostron, J. Sick building syndrome: A review of causes, consequences and remedies. J. Retail Leis. Prop. 2008, 7, 291–303. [Google Scholar] [CrossRef]
- Coccolo, S.; Kämpf, J.; Scartezzini, J.-L.; Pearlmutter, D. Outdoor human comfort and thermal stress: A comprehensive review on models and standards. Urban Clim. 2016, 18, 33–57. [Google Scholar] [CrossRef]
- Rashid, M.; Zimring, C. A Review of the Empirical Literature on the Relationships Between Indoor Environment and Stress in Health Care and Office Settings. Environ. Behav. 2008, 40, 151–190. [Google Scholar] [CrossRef]
- O’Brien, W.; Gunay, H.B. The contextual factors contributing to occupants’ adaptive comfort behaviors in offices—A review and proposed modeling framework. Build. Environ. 2014, 77, 77–88. [Google Scholar] [CrossRef]
- Stazi, F.; Naspi, F.; D’Orazio, M. A literature review on driving factors and contextual events influencing occupants’ behaviours in buildings. Build. Environ. 2017, 118, 40–66. [Google Scholar] [CrossRef]
- Hong, T.; Yan, D.; D’Oca, S.; Chen, C. Ten questions concerning occupant behavior in buildings: The big picture. Build. Environ. 2017, 114, 518–530. [Google Scholar] [CrossRef]
- Balta-Ozkan, N.; Davidson, R.; Bicket, M.; Whitmarsh, L. Social barriers to the adoption of smart homes. Energy Policy 2013, 63, 363–374. [Google Scholar] [CrossRef]
- Rasheed, E.O.; Byrd, H. Can self-evaluation measure the effect of IEQ on productivity? A review of literature. Facilities 2017, 35, 601–621. [Google Scholar] [CrossRef] [Green Version]
- D’Oca, S.; Hong, T.; Langevin, J. The human dimensions of energy use in buildings: A review. Renew. Sustain. Energy Rev. 2018, 81, 731–742. [Google Scholar] [CrossRef] [Green Version]
- Delzendeh, E.; Wu, S.; Lee, A.; Zhou, Y. The impact of occupants’ behaviours on building energy analysis: A research review. Renew. Sustain. Energy Rev. 2017, 80, 1061–1071. [Google Scholar] [CrossRef]
- Keyvanfar, A.; Shafaghat, A.; Abd Majid, M.Z.; Bin Lamit, H.; Warid Hussin, M.; Binti Ali, K.N.; Dhafer Saad, A. User satisfaction adaptive behaviors for assessing energy efficient building indoor cooling and lighting environment. Renew. Sustain. Energy Rev. 2014, 39, 277–295. [Google Scholar] [CrossRef]
- Brager, G.S.; De Dear, R.J. Thermal adaptation in the built environment: A literature review. Energy Build. 1998, 27, 83–96. [Google Scholar] [CrossRef]
- Soares, N.; Bastos, J.; Pereira, L.D.; Soares, A.; Amaral, A.R.; Asadi, E.; Rodrigues, E.; Lamas, F.B.; Monteiro, H.; Lopes, M.A.R.; et al. A review on current advances in the energy and environmental performance of buildings towards a more sustainable built environment. Renew. Sustain. Energy Rev. 2017, 77, 845–860. [Google Scholar] [CrossRef] [Green Version]
- Lu, Y.; Wang, S.; Shan, K. Design optimization and optimal control of grid-connected and standalone nearly/net zero energy buildings. Appl. Energy 2015, 155, 463–477. [Google Scholar] [CrossRef]
- Zuo, J.; Zhao, Z.Y. Green building research-current status and future agenda: A review. Renew. Sustain. Energy Rev. 2014, 30, 271–281. [Google Scholar] [CrossRef]
- Martínez-Molina, A.; Tort-Ausina, I.; Cho, S.; Vivancos, J.L. Energy efficiency and thermal comfort in historic buildings: A review. Renew. Sustain. Energy Rev. 2016, 61, 70–85. [Google Scholar] [CrossRef]
- Vásquez-Hernández, A.; Restrepo Álvarez, M.F. Evaluation of buildings in real conditions of use: Current situation. J. Build. Eng. 2017, 12, 26–36. [Google Scholar] [CrossRef]
- Raw, G.J.; Littleford, C.; Clery, L. Saving energy with a better indoor environment. Arch. Sci. Rev. 2017, 60, 239–248. [Google Scholar] [CrossRef]
- Sorrell, S. Reducing energy demand: A review of issues, challenges and approaches. Renew. Sustain. Energy Rev. 2015, 47, 74–82. [Google Scholar] [CrossRef] [Green Version]
- Pérez-Lombard, L.; Ortiz, J.; Pout, C. A review on buildings energy consumption information. Energy Build. 2008, 40, 394–398. [Google Scholar] [CrossRef]
- Marjaba, G.E.; Chidiac, S.E. Sustainability and resiliency metrics for buildings—Critical review. Build. Environ. 2016, 101, 116–125. [Google Scholar] [CrossRef]
- Pacheco, R.; Ordóñez, J.; Martínez, G. Energy efficient design of building: A review. Renew. Sustain. Energy Rev. 2012, 16, 3559–3573. [Google Scholar] [CrossRef]
- Sintov, N.D.; Schultz, P.W. Adjustable green defaults can help make smart homes more sustainable. Sustainability 2017, 9, 622. [Google Scholar] [CrossRef]
- Marikyan, D.; Papagiannidis, S.; Alamanos, E. A systematic review of the smart home literature: A user perspective. Technol. Forecast. Soc. Chang. 2019, 138, 139–154. [Google Scholar] [CrossRef]
- Kylili, A.; Fokaides, P.A. European Smart Cities: The Role of Zero Energy Buildings. Sustain. Cities Soc. 2015, 15, 86–95. [Google Scholar] [CrossRef]
- GhaffarianHoseini, A.; Dahlan, N.D.; Berardi, U.; GhaffarianHoseini, A.; Makaremi, N.; GhaffarianHoseini, M. Sustainable energy performances of green buildings: A review of current theories, implementations and challenges. Renew. Sustain. Energy Rev. 2013, 25, 1–17. [Google Scholar] [CrossRef]
- Stevanović, S. Optimization of passive solar design strategies: A review. Renew. Sustain. Energy Rev. 2013, 25, 177–196. [Google Scholar] [CrossRef]
- Zhao, X.; Zuo, J.; Wu, G.; Huang, C. A bibliometric review of green building research 2000–2016. Arch. Sci. Rev. 2018, 62, 74–88. [Google Scholar] [CrossRef]
- Song, Y.; Wu, S.; Yan, Y.Y. Control strategies for indoor environment quality and energy efficiency-a review. Int. J. Low Carbon Technol. 2013, 10, 305–312. [Google Scholar] [CrossRef]
- Wang, Y.; Kuckelkorn, J.; Liu, Y. A state of art review on methodologies for control strategies in low energy buildings in the period from 2006 to 2016. Energy Build. 2017, 147, 27–40. [Google Scholar] [CrossRef]
- Rockett, P.; Hathway, E.A. Model-predictive control for non-domestic buildings: A critical review and prospects. Build. Res. Inform. 2017, 45, 556–571. [Google Scholar] [CrossRef]
- Wong, J.K.W.; Li, H.; Wang, S.W. Intelligent building research: A review. Autom. Construct. 2005, 14, 143–159. [Google Scholar] [CrossRef]
- Dounis, A.I.; Caraiscos, C. Advanced control systems engineering for energy and comfort management in a building environment—A review. Renew. Sustain. Energy Rev. 2009, 13, 1246–1261. [Google Scholar] [CrossRef]
- Shaikh, P.H.; Nor, N.B.M.; Nallagownden, P.; Elamvazuthi, I.; Ibrahim, T. A review on optimized control systems for building energy and comfort management of smart sustainable buildings. Renew. Sustain. Energy Rev. 2014, 34, 409–429. [Google Scholar] [CrossRef]
- Kolokotsa, D. Artificial intelligence in buildings: A review of the application of fuzzy logic. Adv. Build. Energy Res. 2007, 1, 29–54. [Google Scholar] [CrossRef]
- Singh, A.; Gaur, A.; Kumar, A.; Singh, M.K.; Kapoor, K.; Mahanta, P.; Kumar, A.; Mukhopadhyay, S.C. Sensing Technologies for Monitoring Intelligent Buildings: A Review. IEEE Sens. J. 2018, 18, 4847–4860. [Google Scholar] [CrossRef]
- Loonen, R.C.G.M.; Trčka, M.; Cóstola, D.; Hensen, J.L.M. Climate adaptive building shells: State-of-the-art and future challenges. Renew. Sustain. Energy Rev. 2013, 25, 483–493. [Google Scholar] [CrossRef] [Green Version]
- Rezaei, S.D.; Shannigrahi, S.; Ramakrishna, S. A review of conventional, advanced, and smart glazing technologies and materials for improving indoor environment. Sol. Energy Mater. Sol. Cells 2017, 159, 26–51. [Google Scholar] [CrossRef]
- Casini, M. Active dynamic windows for buildings: A review. Renew. Energy 2018, 119, 923–934. [Google Scholar] [CrossRef]
- Quesada, G.; Rousse, D.; Dutil, Y.; Badache, M.; Hallé, S. A comprehensive review of solar facades. Opaque solar facades. Renew. Sustain. Energy Rev. 2012, 16, 2820–2832. [Google Scholar] [CrossRef]
- Quesada, G.; Rousse, D.; Dutil, Y.; Badache, M.; Hallé, S. A comprehensive review of solar facades. Transparent and translucent solar facades. Renew. Sustain. Energy Rev. 2012, 16, 2643–2651. [Google Scholar] [CrossRef]
- Sadineni, S.B.; Madala, S.; Boehm, R.F. Passive building energy savings: A review of building envelope components. Renew. Sustain. Energy Rev. 2011, 15, 3617–3631. [Google Scholar] [CrossRef]
- Fisk, W.J. Review of some effects of climate change on indoor environmental quality and health and associated no-regrets mitigation measures. Build. Environ. 2015, 86, 70–80. [Google Scholar] [CrossRef] [Green Version]
- Gunay, H.B.; O’Brien, W.; Beausoleil-Morrison, I. A critical review of observation studies, modeling, and simulation of adaptive occupant behaviors in offices. Build. Environ. 2013, 70, 31–47. [Google Scholar] [CrossRef]
- Yan, D.; O’Brien, W.; Hong, T.; Feng, X.; Burak Gunay, H.; Tahmasebi, F.; Mahdavi, A. Occupant behavior modeling for building performance simulation: Current state and future challenges. Energy Build. 2015, 107, 264–278. [Google Scholar] [CrossRef] [Green Version]
- Mirakhorli, A.; Dong, B. Occupancy behavior based model predictive control for building indoor climate—A critical review. Energy Build. 2016, 129, 499–513. [Google Scholar] [CrossRef]
- Foucquier, A.; Robert, S.; Suard, F.; Stéphan, L.; Jay, A. State of the art in building modelling and energy performances prediction: A review. Renew. Sustain. Energy Rev. 2013, 23, 272–288. [Google Scholar] [CrossRef]
- Sakhare, V.V.; Ralegaonkar, R.V. Indoor environmental quality: Review of parameters and assessment models. Arch. Sci. Rev. 2014, 57, 147–154. [Google Scholar] [CrossRef]
- Peretti, C.; Schiavon, S. Indoor environmental quality surveys. A brief literature review. In Indoor Air 2011; Center for the Built Environment: Dallas, TX, USA, 2011. [Google Scholar]
- Heinzerling, D.; Schiavon, S.; Webster, T.; Arens, E. Indoor environmental quality assessment models: A literature review and a proposed weighting and classification scheme. Build. Environ. 2013, 70, 210–222. [Google Scholar] [CrossRef] [Green Version]
- Guan, Y.D.; Hosni, M.H.; Jones, B.W.; Gielda, T. Literature Review of the Advances in Thermal Comfort Modeling. ASHRAE Trans. 2003, 109, 908–916. [Google Scholar]
- Djongyang, N.; Tchinda, R.; Njomo, D. Thermal comfort: A review paper. Renew. Sustain. Energy Rev. 2010, 14, 2626–2640. [Google Scholar] [CrossRef]
- Park, J.Y.; Nagy, Z. Comprehensive analysis of the relationship between thermal comfort and building control research—A data-driven literature review. Renew. Sustain. Energy Rev. 2018, 82, 2664–2679. [Google Scholar] [CrossRef]
- Rupp, R.F.; Vásquez, N.G.; Lamberts, R. A review of human thermal comfort in the built environment. Energy Build. 2015, 105, 178–205. [Google Scholar] [CrossRef]
- Zhang, H.; Arens, E.; Zhai, Y. A review of the corrective power of personal comfort systems in non-neutral ambient environments. Build. Environ. 2015, 91, 15–41. [Google Scholar] [CrossRef] [Green Version]
- Yang, L.; Yan, H.; Lam, J.C. Thermal comfort and building energy consumption implications—A review. Appl. Energy 2014, 115, 164–173. [Google Scholar] [CrossRef]
- Peffer, T.; Pritoni, M.; Meier, A.; Aragon, C.; Perry, D. How people use thermostats in homes: A review. Build. Environ. 2011, 46, 2529–2541. [Google Scholar] [CrossRef] [Green Version]
- De Dear, R.J.; Akimoto, T.; Arens, E.A.; Brager, G.; Candido, C.; Cheong, K.W.D.; Li, B.; Nishihara, N.; Sekhar, S.C.; Tanabe, S.; et al. Progress in thermal comfort research over the last twenty years. Indoor Air 2013, 23, 442–461. [Google Scholar] [CrossRef]
- Karjalainen, S. Thermal comfort and gender: A literature review. Indoor Air 2012, 22, 96–109. [Google Scholar] [CrossRef]
- Taleghani, M.; Tenpierik, M.; Kurvers, S.; Van Den Dobbelsteen, A. A review into thermal comfort in buildings. Renew. Sustain. Energy Rev. 2013, 26, 201–215. [Google Scholar] [CrossRef]
- Enescu, D. A review of thermal comfort models and indicators for indoor environments. Renew. Sustain. Energy Rev. 2017, 79, 1353–1379. [Google Scholar] [CrossRef]
- Carlucci, S.; Causone, F.; De Rosa, F.; Pagliano, L. A review of indices for assessing visual comfort with a view to their use in optimization processes to support building integrated design. Renew. Sustain. Energy Rev. 2015, 47, 1016–1033. [Google Scholar] [CrossRef] [Green Version]
- Van Den Wymelenberg, K.G. Visual comfort, discomfort glare, and occupant fenestration control: Developing a research agenda. LEUKOS 2014, 10, 207–221. [Google Scholar] [CrossRef]
- Altmonte, S. Daylight for Energy Savings and Psycho-Physiological Well-Being in Sustainable Built Environments. J. Sustain. Dev. 2008, 1, 3–16. [Google Scholar] [CrossRef]
- Todorovic, M.S.; Kim, J.T. Beyond the science and art of the healthy buildings daylighting dynamic control’s performance prediction and validation. Energy Build. 2012, 46, 159–166. [Google Scholar] [CrossRef]
- Aries, M.B.C.; Aarts, M.P.J.; Van Hoof, J. Daylight and health: A review of the evidence and consequences for the built environment. Light. Res. Technol. 2015, 47, 6–27. [Google Scholar] [CrossRef]
- Galasiu, A.D.; Veitch, J.A. Occupant preferences and satisfaction with the luminous environment and control systems in daylit offices: A literature review. Energy Build. 2006, 38, 728–742. [Google Scholar] [CrossRef]
- Reinten, J.; Braat-Eggen, P.E.; Hornikx, M.; Kort, H.S.M.; Kohlrausch, A. The indoor sound environment and human task performance: A literature review on the role of room acoustics. Build. Environ. 2017, 123, 315–332. [Google Scholar] [CrossRef]
- Navai, M.; Veitch, J.A. Acoustic Satisfaction in Open-Plan Offices: Review and Recommendations; Research Report; NRC Institute for Research in Construction: Ottawa, ON, Canada, 2006. [Google Scholar]
- Vardaxis, N.G.; Bard, D.; Persson Waye, K. Review of acoustic comfort evaluation in dwellings—Part I: Associations of acoustic field data to subjective responses from building surveys. Build. Acoust. 2018, 25, 151–170. [Google Scholar] [CrossRef]
- Vardaxis, N.G.; Bard, D. Review of acoustic comfort evaluation in dwellings: Part II—impact sound data associated with subjective responses in laboratory tests. Build. Acoust. 2018, 25, 171–192. [Google Scholar] [CrossRef]
- Chua, K.J.; Chou, S.K.; Yang, W.M.; Yan, J. Achieving better energy-efficient air conditioning—A review of technologies and strategies. Appl. Energy 2013, 104, 87–104. [Google Scholar] [CrossRef]
- Sundell, J.; Levin, H.; Nazaroff, W.W.; Cain, W.S.; Fisk, W.J.; Grimsrud, D.T.; Gyntelberg, F.; Li, Y.; Persily, A.K.; Pickering, A.C.; et al. Ventilation rates and health: Multidisciplinary review of the scientific literature. Indoor Air 2011, 21, 191–204. [Google Scholar] [CrossRef]
- Bornehag, C.G.; Sundell, J.; Bonini, S.; Custovic, A.; Malmberg, P.; Skerfving, S.; Sigsgaard, T.; Verhoeff, A. Dampness in buildings as a risk factor for health effects, EUROEXPO: A multidisciplinary review of the literature (1998–2000) on dampness and mite exposure in buildings and health effects. Indoor Air 2004, 14, 243–257. [Google Scholar] [CrossRef]
- Destaillats, H.; Maddalena, R.L.; Singer, B.C.; Hodgson, A.T.; McKone, T.E. Indoor pollutants emitted by office equipment: A review of reported data and information needs. Atmos. Environ. 2008, 42, 1371–1388. [Google Scholar] [CrossRef] [Green Version]
- Wang, S.; Ma, Z. Supervisory and Optimal Control of Building HVAC Systems: A Review. HVAC Res. 2011, 14, 3–32. [Google Scholar] [CrossRef]
- Lai, C.K. Particle deposition indoors: A review. Indoor Air 2002, 12, 211–214. [Google Scholar] [CrossRef]
- Yu, B.F.; Hu, Z.B.; Liu, M.; Yang, H.L.; Kong, Q.X.; Liu, Y.H. Review of research on air-conditioning systems and indoor air quality control for human health. Int. J. Refrig. 2009, 32, 3–20. [Google Scholar] [CrossRef]
- Mendell, M.J.; Fisk, W.J.; Kreiss, K.; Levin, H.; Alexander, D.; Cain, W.S.; Girman, J.R.; Hines, C.J.; Jensen, P.A.; Milton, D.K.; et al. Improving the health of workers in indoor environments: Priority research needs for a national occupational research agenda. Am. J. Public Health 2002, 92, 1430–1440. [Google Scholar] [CrossRef]
- Persily, A.K.; Emmerich, S.J. Indoor air quality in sustainable, energy efficient buildings. HVAC Res. 2012, 18, 4–20. [Google Scholar] [CrossRef]
- Tham, K.W. Indoor air quality and its effects on humans—A review of challenges and developments in the last 30 years. Energy Build. 2016, 130, 637–650. [Google Scholar] [CrossRef]
- Van Eck, N.J.; Waltman, L. Software survey: VOSviewer, a computer program for bibliometric mapping. Scientometrics 2010, 84, 523–538. [Google Scholar] [CrossRef]
- Prüss-Üstün, A.; Corvalán, C. Preventing Disease Through Healthy Environs; World Health Organization: Genève, Switzerland, 2006. [Google Scholar]
- Redlich, C.A.; Sparer, J.; Cullen, M.R. Sick-building syndrome. Lancet 1997, 349, 1013–1016. [Google Scholar] [CrossRef]
- Bottalico, P.; Astolfi, A. Investigations into vocal doses and parameters pertaining to primary school teachers in classrooms. J. Acoust. Soc. Am. 2012, 131, 2817–2827. [Google Scholar] [CrossRef] [Green Version]
- Srinivasan, S.; O’Fallon, L.R.; Dearry, A. Creating Healthy Communities, Healthy Homes, Healthy People: Initiating a Research Agenda on the Built Environment and Public Health. Am. J. Public Health 2003, 93, 1446–1450. [Google Scholar] [CrossRef] [Green Version]
- World Health Organization (WHO); Regional Office for Europe. Declaration: fourth Ministerial Conference on Environment and Health, Budapest, Hungary, 23–25 June 2004; WHO Regional Office for Europe: Copenhagen, Denmark, 2004. [Google Scholar]
- Berardi, U. Sustainability Assessment in the Construction Sector: Rating Systems and Rated Buildings. Sustain. Dev. 2012, 20, 411–424. [Google Scholar] [CrossRef]
- Bluyssen, P.M. Towards new methods and ways to create healthy and comfortable buildings. Build. Environ. 2010, 45, 808–818. [Google Scholar] [CrossRef]
- Cox, C. Health Optimisation Protocol for Energy-Efficient Buildings Pre-Normative and Socio-Economic Res. to Create Healthy and Energy-Efficient Buildings; TNO: Delft, The Netherlands, 2005. [Google Scholar]
- Sarbu, I.; Sebarchievici, C. Aspects of indoor environmental quality assessment in buildings. Energy Build. 2013, 60, 410–419. [Google Scholar] [CrossRef]
- Bronsema, B.; Bjorck, M.; Clausen, G.; Firzner, K.; Flatheim, G.; Follin, T.; Haverinen, U.; Jamriska, M.; Kurnistki, J.; Maroni, M.; et al. Performance Criteria of Buildings for Health and Comfort; CIB General Secretariat: Rotterdam, The Netherlands, 2004; ISBN 90-6363-038-7. [Google Scholar]
- Bluyssen, P.M. The Indoor Environ. Handbook: How to Make Buildings Healthy and Comfortable; Earthscan: London, UK, 2009. [Google Scholar]
- ASHRAE. Thermal Environmental Conditions for Human Occupancy; ANSI/ASHRAE Standard 55-2017; American Society of Heating, Refrigerating and Air-Conditioning Engineers: Atlanta, GA, USA, 2017. [Google Scholar]
- ISO 17772-1. Energy Performance of Builds—Indoor Environmental Quality—Part 1: Indoor Environmental Input Parameters for the Design and Assessment of Energy Performance of Builds; ISO: Genève, Switzerland, 2017. [Google Scholar]
- ISO 7730. Ergonomics of the Thermal Environ.—Analytiacl Determination and Interpretation of Thermal Comfort Using Calculation of the PMV and PPD Indices and Local Thermal Comfort Criteria; ISO: Genève, Switzerland, 2005. [Google Scholar]
- CEN. Light and Lighting—Basic Terms and Criteria for Specifying Lighting Requirements; European Standard EN 12665:2011; European Committee for Standardisation: Brussels, Belgium, 2011. [Google Scholar]
- CEN. Dayligh in Buildings; European Standard EN 17037:2018; European Committee for Standardisation: Brussels, Belgium, 2018. [Google Scholar]
- Bellia, L.; Bisegna, F.; Spada, G. Lighting in indoor environments: Visual and non-visual effects of light sources with different spectral power distributions. Build. Environ. 2011, 46, 1984–1992. [Google Scholar] [CrossRef]
- Hraška, J. Chronobiological aspects of green buildings daylighting. Renew. Energy 2014, 73, 109–114. [Google Scholar] [CrossRef]
- Van Bommel, W.J.M. Non-visual biological effect of lighting and the practical meaning for lighting for work. Appl. Ergon. 2006, 37, 461–466. [Google Scholar] [CrossRef]
- Alrubaih, M.S.; Zain, M.F.M.; Alghoul, M.A.; Ibrahim, N.L.N.; Shameri, M.A.; Elayeb, O. Research and development on aspects of daylighting fundamentals. Renew. Sustain. Energy Rev. 2013, 21, 494–505. [Google Scholar] [CrossRef]
- IES. 100 Significant Papers. Available online: http://www.ies.org/edoppts/100papers.cfm (accessed on 28 January 2018).
- IESNA. The IESNA Lighting Handbook, 9th ed.; IESNA: New York, NY, USA, 2000. [Google Scholar]
- U.S. Department of Energy. Energy Efficiency Trends in Residential and Commercial Buildings; United States Department of Energy: Washington, DC, USA, 2008.
- VonNeida, B.; Maniccia, D.; Tweed, A. An analysis of the energy and cost savings potential of occupancy sensors for commercial lighting systems. J. Illum. Eng. Soc. 2000, 30, 11–125. [Google Scholar] [CrossRef]
- WHO. WHO Guildelines for Indoor Air Quality: Selected Polutants; WHO Regional Office for Europe: Bonn, Switzerland, 2010. [Google Scholar]
- CEN. Energy performance of buildings – Ventilation for buildings – Part 3: For non-residential buildings - performance requirements for ventilation and room-conditioning systems (Modules M5-1. M5-4); European Standard EN 16798-3:2017; European Committee for Standardisation: Brussels, Belgium, 2017. [Google Scholar]
- ASHRAE. Ventilation for Acceptable Indoor Air Quality; ANSI/ASHRAE Standard 62.1-2016; American Society of Heating, Refrigerating and Air-Conditioning Engineers: Atlanta, GA, USA, 2016. [Google Scholar]
- ASHRAE. Ventilation and Acceptable Indoor Air Quality in Low-Rise Residential Buildings; ANSI/ASHRAE Standard 62.2-2016; American Society of Heating, Refrigerating and Air-Conditioning Engineers: Atlanta, GA, USA, 2016. [Google Scholar]
- CEN. Ventilation for buildings—Design Criteria for the Indoor Environment; European Prestandard CR 1752:1998; European Committee for Standardisation: Brussels, Belgium, 1998. [Google Scholar]
- ASHRAE. Indoor Air Quality Guide; American Society of Heating, Refrigerating and Air-Conditioning Engineers: Atlanta, GA, USA, 2009; ISBN 978-1-933742-59-5. [Google Scholar]
- Brown, A.L.; Kang, J.; Gjestland, T. Towards standardization in soundscape preference assessment. Appl. Acoust. 2011, 72, 387–392. [Google Scholar] [CrossRef]
- DIN. Akustik—Begriffe; German National Standard DIN 1320:2009; Deutsches Institut Fur Normung E.V.: Berglin, Germany, 2009. [Google Scholar]
- Genuit, K. Objective Evaluation of Acoustic Quality Based on a Realtive Approach. In Proceedings of the Inter-Noise’96, 25th Anniversary Congress Liverpool, Liverpool, UK, 30 July–2 August 1996; pp. 1061 p1–1061 p6. [Google Scholar]
- Gramez, A.; Boubenider, F. Acoustic comfort evaluation for a conference room: A case study. Appl. Acoust. 2017, 118, 39–49. [Google Scholar] [CrossRef]
- ISO 10140. Acoustics: Building Elements Sound Insulation Measurements. Sound and Vibration Standards. Available online: http://www.acoustic-standards.co.uk/bs-10140.htm (accessed on 8 February 2015).
- ISO 717. Acoustics—Rating of Sound Insulation in Buildings and of Build. Elements; ISO: Genève, Switzerland, 2013. [Google Scholar]
- ISO 3382. Acoustics—Measurement of Room Acoustic Parameters; ISO: Genève, Switzerland, 2012. [Google Scholar]
- ISO 12354. Build. Acoustics—Estimation of Acoustic Performance of Buildings from the Performance of Elements; ISO: Genève, Switzerland, 2017. [Google Scholar]
- World Health Organization (WHO). Constitution of the World Health Organization; WHO: Geneva, Switzerland, 2006. [Google Scholar]
- Jamrozik, A.; Ramos, C.; Zhao, J.; Bernau, J.; Clements, N.; Vetting Wolf, T.; Bauer, B. A novel methodology to realistically monitor office occupant reactions and environmental conditions using a living lab. Build. Environ. 2018, 130, 190–199. [Google Scholar] [CrossRef]
- Lai, A.C.K.; Mui, K.W.; Wong, L.T.; Law, L.Y. An evaluation model for indoor environmental quality (IEQ) acceptance in residential buildings. Energy Build. 2009, 41, 930–936. [Google Scholar] [CrossRef]
- Chiang, C.M.; Chou, P.C.; Lai, C.M.; Li, Y.Y. A methodology to assess the indoor environment in care centers for senior citizens. Build. Environ. 2001, 36, 561–568. [Google Scholar] [CrossRef]
- Zalejska-Jonsson, A.; Wilhelmsson, M. Impact of perceived indoor environment quality on overall satisfaction in Swedish dwellings. Build. Environ. 2013, 63, 134–144. [Google Scholar] [CrossRef]
- Frontczak, M.; Schiavon, S.; Goins, J.; Arens, E.; Zhang, H.; Wargocki, P. Quantitative relationships between occupant satisfaction and satisfaction aspects of indoor environmental quality and building design. Indoor Air 2012, 22, 119–131. [Google Scholar] [CrossRef]
- Wargocki, P.; Frontczak, M.; Schiavon, S.; Goins, J.; Arens, E.; Zhang, H. Satisfaction and self-estimated performance in relation to indoor environmental parameters and building features. In Proceedings of the 10th International Conference on Healthy Builds 2012, Brisbane, Australia, 8–12 July 2012. [Google Scholar]
- Humphreys, M.A. Quantifying occupant comfort: Are combined indices of the indoor environment practicable? Build. Res. Inform. 2005, 33, 317–325. [Google Scholar] [CrossRef]
- Chiang, C.M.; Lai, C.M. A study on the comprehensive indicator of indoor environment assessment for occupants’ health in Taiwan. Build. Environ. 2002, 37, 387–392. [Google Scholar] [CrossRef]
- Wong, L.T.; Mui, K.W.; Hui, P.S. A multivariate-logistic model for acceptance of indoor environmental quality (IEQ) in offices. Build. Environ. 2008, 43, 1–6. [Google Scholar] [CrossRef]
- Astolfi, A.; Pellerey, F. Subjective and objective assessment of acoustical and overall environmental quality in secondary school classrooms. J. Acoust. Soc. Am. 2008, 123, 163–173. [Google Scholar] [CrossRef]
- Lai, J.H.K.; Yik, F.W.H. Perception of importance and performance of the indoor environmental quality of high-rise residential buildings. Build. Environ. 2009, 44, 352–360. [Google Scholar] [CrossRef]
- Cao, B.; Ouyang, Q.; Zhu, Y.; Huang, L.; Hu, H.; Deng, G. Development of a multivariate regression model for overall satisfaction in public buildings based on field studies in Beijing and Shanghai. Build. Environ. 2012, 47, 394–399. [Google Scholar] [CrossRef]
- Marino, C.; Nucara, A.; Pietrafesa, M. Proposal of comfort classification indexes suitable for both single environments and whole buildings. Build. Environ. 2012, 57, 58–67. [Google Scholar] [CrossRef]
- Ncube, M.; Riffat, S. Developing an indoor environment quality tool for assessment of mechanically ventilated office buildings in the UK—A preliminary study. Build. Environ. 2012, 53, 26–33. [Google Scholar] [CrossRef]
- Gayathri, L.; Perera, B.A.K.S.; Sumanarathna, D.M.G.A.N.M. Factors Affecting the Indoor Environmental Quality in Sri Lanka: Green vs. Conventional Hotel Buildings. In Proceedings of the 5th World Construction Symposium 2016: Greening Environment, Eco Innovations & Entrepreneurship, Colombo, Sri Lanka, 29–31 July 2016; pp. 210–220. [Google Scholar]
- Leaman, A.; Bordass, B. Productivity in buildings: The “killer” variables. EcoLibrium 2005, 4, 16–20. [Google Scholar] [CrossRef]
- Bakker, L.G.; Hoes-van Oeffelen, E.C.M.; Loonen, R.C.G.M.; Hensen, J.L.M. User satisfaction and interaction with automated dynamic facades: A pilot study. Build. Environ. 2014, 78, 44–52. [Google Scholar] [CrossRef] [Green Version]
- Castaldo, V.L.; Pigliautile, I.; Rosso, F.; Cotana, F.; De Giorgio, F.; Pisello, A.L. How subjective and non-physical parameters affect occupants’ environmental comfort perception. Energy Build. 2018, 178, 107–129. [Google Scholar] [CrossRef]
- Heerwagen, J. Green buildings, organizational success and occupant productivity. Build. Res. Inform. 2000, 28, 353–367. [Google Scholar] [CrossRef]
- Fisk, W.J. Health and Productivity Gains from Better Indoor Environments and their Relationship with Building Energy Efficiency. Annu. Rev. Energy Environ. 2000, 25, 537–566. [Google Scholar] [CrossRef]
- Bluyssen, P.M.; Aries, M.; Van Dommelen, P. Comfort of workers in office buildings: The European HOPE project. Build. Environ. 2011, 46, 280–288. [Google Scholar] [CrossRef]
- Molina, C.; Pickering, A.C.; Valjbjorn, O.; De Bartoli, M. Sick Build Syndrome A practical Guide; Office for Publications of the European Communities: Luxembourg City, Luxembourg, 1989. [Google Scholar]
- Berglund, B.; Lindvall, T. Sensory reactions to “sick buildings”. Environ. Int. 1986, 12, 147–159. [Google Scholar] [CrossRef]
- Crawford, J.O.; Bolas, S.M. Sick building syndrome, work factors and occupational stress. Scand. J. Work Environ. Health 1996, 22, 243–250. [Google Scholar] [CrossRef] [Green Version]
- Preziosi, P.; Czernichow, S.; Gehanno, P.; Hercberg, S. Workplace air-conditioning and health services attendance among French middle-aged women: A prospective cohort study. Int. J. Epidemiol. 2004, 33, 1120–1123. [Google Scholar] [CrossRef]
- Seppänen, O.; Fisk, W.J. A conceptual model to estimate cost effectiveness of the indoor environment improvements. In Proceedings of the Healthy Builds 2003 Conference, Singapore; Healthy Buildings Inc.: Singapore, 2003; pp. 368–374. [Google Scholar]
- Nicol, J.F.; Humphreys, M.A. Adaptive thermal comfort and sustainable thermal standards for buildings. Energy Build. 2002, 34, 563–572. [Google Scholar] [CrossRef]
- Wyon, D. Indoor environmental effects on productivity. IAQ 1996, 96, 5–15. [Google Scholar]
- Heat-Shield. Available online: https://www.heat-shield.eu/ (accessed on 2 November 2018).
- Meerbeek, B.W.; Van Loenen, E.J.; Te Kulve, M.; Aarts, M. User Experience of Automated Blinds in Offices. In Proceedings of the Experiencing Light 2012 International Conference on the Effects of Light on Wellbeing, Eindhoven, The Netherlands, 12–13 November 2012; De Kort, Y., Aarts, A.W., Beute, M.J., Ijsselsteijn, F., Lakens, W.A., Smolders, D., An, C.H.J., Van Rijswijk, L., Eds.; Technische Universiteit Eindhoven: Eindhoven, The Netherlands, 2012; pp. 1–5. [Google Scholar]
- Aries, M.B.C.; Veitch, J.A.; Newsham, G.R. Windows, view, and office characteristics predict physical and psychological discomfort. J. Environ. Psychol. 2010, 30, 533–541. [Google Scholar] [CrossRef]
- Franchi, M.; Carrer, P.; Kotzias, D.; Viegi, G. Towards Healthy Air in Dwellings in Europe—The THADE Report; EFA Central Office: Brussels, Belgium, 2004. [Google Scholar]
- Franchi, M.; Carrer, P.; Kotzias, D.; Rameckers, E.M.A.L.; Seppänen, O.; Van Bronswijk, J.E.M.H.; Viegi, G.; Gilder, J.A.; Valovirta, E. Working towards healthy air in dwellings in Europe. Allergy 2006, 61, 864–868. [Google Scholar] [CrossRef]
- Autrup, H.; Calow, P.; Dekant, W.; Greim, H.; Hanke, W.; Janssen, C.; Jansson, B.; Komulainen, H.; Ladefoged, O.; Linders, J.; et al. Opinion on Risk Assessment on Indoor Air Quality; European Commision: Brussels, Belgium, 2007; ISBN 9789279127564. [Google Scholar]
- World Health Organization (WHO). Preventing Noncommunicable Diseases (NCDs) by Reducing Environmental Risk Factors; World Health Organisation: Geneva, Switzerland, 2017. [Google Scholar]
- Landström, U.; Åkerlund, E.; Kjellberg, A.; Tesarz, M. Exposure levels, tonal components, and noise annoyance in working environments. Environ. Int. 1995, 21, 265–275. [Google Scholar] [CrossRef]
- Jensen, K.L.; Arens, E.; Zagreus, L. Acoustical Quality in Office Workstations, as Assessed by Occupant Surveys. In Proceedings of the Indoor Air 2005, Beijing, China, 4–9 September 2005; University of California: Berkeley, CA, USA, 2005; pp. 2401–2405. [Google Scholar]
- Veitch, J.A.; Charles, K.E.; Farley, K.M.J.; Newsham, G.R. A model of satisfaction with open-plan office conditions: COPE field findings. J. Environ. Psychol. 2007, 27, 177–189. [Google Scholar] [CrossRef] [Green Version]
- Niemann, H.; Bonnefoy, X.; Braubach, M.; Hecht, K.; Maschke, C.; Rodrigues, C.; Robbel, N. Noise-induced annoyance and morbidity results from the pan-European LARES study. Noise Health 2006, 8, 63–79. [Google Scholar] [CrossRef]
- Van Kempen, E.; Van Kamp, I.; Lebret, E.; Lammers, J.; Emmen, H.; Stansfeld, S. Neurobehavioral effects of transportation noise in primary schoolchildren: A cross-sectional study. Environ. Health Glob. Access Sci. Source 2010, 9, 25. [Google Scholar] [CrossRef]
- Baker, N.; Nikolopoulou, M.; Steemers, K. Thermal comfort in urban spaces: Different forms of adaptation Proceedings Rebuild. In Proceedings of the 1999 REBUILD International Conference: The Cities of Tomorrow, Barcelona, Spain, 4–6 October 1999. [Google Scholar]
- Kenny, G.P.; Yardley, J.E.; Martineau, L.; Jay, O. Physical work capacity in older adults: Implications for the aging worker. Am. J. Ind. Med. 2008, 51, 610–625. [Google Scholar] [CrossRef]
- Lorenzoni, I.; Nicholson-Cole, S.; Whitmarsh, L. Barriers perceived to engaging with climate change among the UK public and their policy implications. Glob. Environ. Chang. 2007, 17, 445–459. [Google Scholar] [CrossRef]
- Blanchard, B.; Blyler, J.E. Human-Factors Engineering. In System Engineering Management; John Wiley & Sons: Hoboken, NJ, USA, 2016. [Google Scholar]
- Bamberg, S.; Möser, G. Twenty years after Hines, Hungerford, and Tomera: A new meta-analysis of psycho-social determinants of pro-environmental behaviour. J. Environ. Psychol. 2007, 27, 14–25. [Google Scholar] [CrossRef]
- Wohlwill, J.F. Human Adaptation to Levels of Environmental Stimulation. Hum. Ecol. 1974, 2, 127–147. [Google Scholar] [CrossRef]
- Gifford, R. The Dragons of Inaction: Psychological Barriers That Limit Climate Change Mitigation and Adaptation. Am. Psychol. 2011, 66, 290–302. [Google Scholar] [CrossRef]
- Gilman, S. Joint position sense and vibration sense: Anatomical organisation and assessment. J. Neurol. Neurosurg. Psychiatry 2002, 73, 473–477. [Google Scholar] [CrossRef]
- Patapoutian, A.; Peier, A.M.; Story, G.M.; Viswanath, V. Thermotrp channels and beyond: Mechanisms of temperature sensation. Nat. Rev. Neurosci. 2003, 4, 529–539. [Google Scholar] [CrossRef]
- EN. Directive 2006/25/EC of the European Parliament and of the Council of 5 April 2006 on the Minimum Health and Safety Requirements Regarding the Exposure of Workers to Risks Arising from Physical Agents (Artificial Optical Radiation) (19th Individual Direct. 2006. ISBN 9789279122552). Available online: http://eur-lex.europa.eu/legal-content/EN/TXT/?uri=CELEX%3A02006L0025-20140101 (accessed on 6 February 2018).
- Bernstein, J.A.; Alexis, N.; Bacchus, H.; Bernstein, I.L.; Fritz, P.; Horner, E.; Li, N.; Mason, S.; Nel, A.; Oullette, J.; et al. The health effects of nonindustrial indoor air pollution. J. Allergy Clin. Immunol. 2008, 121, 585–591. [Google Scholar] [CrossRef]
- Noonan, B.; Bancroft, R.W.; Dines, J.S.; Bedi, A. Heat- and Cold-induced Injuries in Athletes: Evaluation and Management. J. Am. Acad. Orthop. Surg. 2012, 20, 744–754. [Google Scholar] [CrossRef]
- Toftum, J.; Andersen, R.V.; Jensen, K.L. Occupant performance and building energy consumption with different philosophies of determining acceptable thermal conditions. Build. Environ. 2009, 44, 2009–2016. [Google Scholar] [CrossRef]
- Gross, H.; Blechinger, F.; Achtner, B. Human Eye. In Handbook of Optical Systems, Volume 4, Survey of Optical Instruments; Herbert, G., Ed.; Wiley: Hoboken, NJ, USA, 2008; pp. 1–88. [Google Scholar]
- Curry, D.G.; Martinsen, G.L.; Hopper, D.G. Capability of the human visual system. Cockpit Disp. X 2003, 5080, 58–69. [Google Scholar] [CrossRef]
- Boff, K.R.; Lincoln, J.E. Eng. Data Compendium. Human Perception and Performance; Wiley and Sons: New York, NY, USA, 1988. [Google Scholar]
- Davis, J.; Hsieh, Y.H.; Lee, H.C. Humans perceive flicker artifacts at 500 Hz. Sci. Rep. 2015, 5, 7861. [Google Scholar] [CrossRef] [Green Version]
- De Valois, R.L.; De Valois, K.K. Spatial Vision; Oxford University Press: Oxford, UK, 1990. [Google Scholar]
- Ruch, T.C.; Fulton, J.F. Medical Physiology and Biophysics; W.B. Saunders: Philadelphia, PA, USA, 1960. [Google Scholar]
- Lind, B.; Sihlbom, H.; Nordwall, A.; Malchau, H. Normal range of motion of the cervical spine. Arch. Phys. Med. Rehab. 1989, 70, 692–695. [Google Scholar]
- Xie, B. Virtual Auditory Display and Spatial Hearing. In Head-Related Transfer Function and Virtual Auditory Display, 2nd ed.; Ross Publishing, Inc.: Richmond, VA, USA, 2013; pp. 1–42. [Google Scholar]
- Hartmann, W.M. How we localize sound. Phys. Today 1999, 52, 24–29. [Google Scholar] [CrossRef]
- McQueen, C.A.; Bond, J.; Ramos, K.; Lamb, J.; Guengerich, F.P.; Lawrence, D.; Walker, M.; Campen, M.; Schnellmann, R.; Yost, G.S.; et al. Comprehensive Toxicology, Volumes 1-14, 2nd ed.; Elsevier: Amsterdam, The Netherlands, 2010. [Google Scholar]
- Butcher, K.J. Health Issues. In CIBSE Guide A—Environ.al Design; CIBSE: Norwich, UK, 2006. [Google Scholar]
- Bushdid, C.; Magnasco, M.O.; Vosshall, L.B.; Keller, A.; Mixture, M. 1 Trillion Olfactory Stimuli. Science 2016, 343, 1370–1373. [Google Scholar] [CrossRef]
- Feron, V.; Arts, J.; Kuper, C.; Slootweg, P.; Woutersen, R. Health risks associated with inhaled nasal toxicants. Crit. Rev. Toxicol. 2001, 31, 313–347. [Google Scholar] [CrossRef]
- World Health Organization (WHO). Indoor Air Quality Guidelines: Household Fuel Combustion; World Health Organization: Geneva, Switzerland, 2014; ISBN 978 92 4 154887 8. [Google Scholar]
- World Health Organization (WHO). Ambient Air Pollution: A Global Assessment of Exposure and Burden of Disease; World Health Organization: Geneva, Switzerland, 2016; ISBN 978 92 4 151135 3. [Google Scholar]
- Nakano, S.; Washizu, A. Acceptance of energy efficient homes in large Japanese cities: Understanding the inner process of home choice and residence satisfaction. J. Environ. Manag. 2018, 225, 84–92. [Google Scholar] [CrossRef]
- Altenburg, T.; Assmann, C. Green Industrial Policy: Concept, Policies, Country Experiences; UN Environment; German Development Institute: Bonn, Germany, 2014. [Google Scholar]
- Hafer, M.; Howley, W.; Chang, M.; Ho, K.; Tsau, J.; Razavi, H. Occupant engagement leads to substantial energy savings for plug loads. In Proceedings of the 2017 IEEE Conference on Technologies for Sustainability, SusTech 2017, Phoenix, AZ, USA, 12–14 November 2017. [Google Scholar]
- Kahma, N.; Matschoss, K. The rejection of innovations? Rethinking technology diffusion and the non-use of smart energy services in Finland. Energy Res. Soc. Sci. 2017, 34, 27–36. [Google Scholar] [CrossRef]
- WCED. Report of the World Commision on Environ. and Dev.: Our Common Future; Oxford University Press: New York, NY, USA, 1987. [Google Scholar]
- United Nations. Paris Agreement; United Nations: Paris, France, 2015. [Google Scholar]
- Climate Action Tracker. Rating Countries. Available online: http://climateactiontracker.org/countries.html (accessed on 29 March 2018).
- Marques, L.M.; Fuinhas, J.A.; Marques, A.C. Augmented energy-growth nexus: Economic, political and social globalization impacts. Energy Procedia 2017, 136, 97–101. [Google Scholar] [CrossRef]
- Shahbaz, M.; Zakaria, M.; Shahzad, S.J.H.; Mahalik, M.K. The energy consumption and economic growth nexus in top ten energy-consuming countries: Fresh evidence from using the quantile-on-quantile approach. Energy Econ. 2018, 71, 282–301. [Google Scholar] [CrossRef] [Green Version]
- Deichmann, U.; Reuter, A.; Vollmer, S.; Zhang, F. Relationship between Energy Intensity and Economic Growth New Evidence from a Multi—Country Multi—Sector Data Set. World Bank Work. Pap. 2018. [Google Scholar] [CrossRef]
- Croner, D.; Frankovic, I. A Structural Decomposition Analysis of Global and National Energy Intensity Trends. Energy J. 2018, 39, 219–231. [Google Scholar] [CrossRef]
- The World Bank. Energy intensity level of primary energy (MJ/$2011 PPP GDP) Data. Sustain. energy for all. Available online: https://data.worldbank.org/indicator/EG.EGY.PRIM.PP.KD?view=chart (accessed on 6 February 2018).
- IEA. Energy Efficiency 2018—Analysis and outlooks to 2040. Market Rep. Ser. 2017, 1–143. [Google Scholar] [CrossRef]
- European Commission. A Roadmap for Moving to a Competitive Low Carbon Economy in 2050; European Commission: Brussels, Belgium, 2011. [Google Scholar]
- EN. Directive 2010/31/EU of the European Parliament and of the Council of 19 May 2010 on the energy performance of buildings. Off. J. Eur. Union 2010, 153, 13–35. [Google Scholar]
- EN. Directive 2012/27/EU of the European Parliament and of the Councilof 25 October 2012 on energy efficiency. Off. J. Eur. Union 2012, 315, 1–56. [Google Scholar]
- European Union. Intended Nationally Determined Contribution of the EU and its Member States; European Union: Brussels, Belgium, 2015. [Google Scholar]
- En. Directive (EU) 2018/844 of the European Parliament an of the Council of 30 May 2018 amending Directive 2010/31/EU on the energy performance of buildings and Directive 2012/27/EU on energy efficiency. Off. J. Eur. Union 2018, 156, 17. [Google Scholar]
- UN Environment. Towards a Zero-Emission, Efficient, and Resilient Buildings and Construction Sector; UN Environment: Nairobi, Kenya, 2017. [Google Scholar]
- Fekete, H.; Luna, L.; Sterl, S.; Hans, F.; Gonzales, S.; Hohne, N.; Wong, L.; Deng, Y.; Ur, G.U.R.; Berg, T.; et al. Improvement in Warming Outlook as India and China Move Ahead, but Paris Agreement Gap Still Looms Large; Climate Action Tracker: Cologne/Berlin, Germany, 2017. [Google Scholar]
- Eurostat. Energy Balances. Energy Balances in the MS Excel File Format (2018 Edition). Available online: http://ec.europa.eu/eurostat/web/energy/data/energy-balances (accessed on 29 March 2018).
- U.S. Department of Energy. Use of Energy in the United States Explained. U.S. Energy Information Administration. Available online: https://www.eia.gov/energyexplained/index.php?page=us_energy_use (accessed on 30 January 2019).
- National Bureau of Statistics of China. China Statistical Yearbook 2016. Available online: http://www.stats.gov.cn/tjsj/ndsj/2018/indexeh.htm (accessed on 30 January 2019).
- Ministry of Statistics and Programme Implementation Government of India. ENERGY—Statistical Year Book India 2018. Statistical Year Book India 2018. Available online: http://www.mospi.gov.in/statistical-year-book-india/2018/185 (accessed on 30 January 2019).
- United Nations Environment Programme. Why Buildings. Sustain. Buildings and Climate Initiative. 2015. Available online: http://www.unep.org/sbci/AboutSBCI/Background.asp (accessed on 12 February 2015).
- International Energy Agency. Tracking Clean Energy Progress 2017; International Energy Agency: Paris, France, 2017. [Google Scholar]
- International Energy Agency. Energy Efficiency 2017; International Energy Agency: Paris, France, 2017. [Google Scholar]
- European Commission. Energy. EU Building Database. Available online: https://ec.europa.eu/energy/en/eu-buildings-database (accessed on 31 January 2019).
- European Commission. Annex. Accelerating Clean Energy in Buildings to the Communication from the Commision to the European Parliament, the Council, the European Economic and Social Committee, the Committee of the Regions and the European Investment Bank. Clean Energy For All; European Commission: Brussels, Belgium, 2016. [Google Scholar]
- RIJSBERMAN, F.R.; SWART, R.J. (Eds.) Targets and Indicators of Climatic Change; The Stockholm Environment Institute: Stockholm, Sweden, 1990; ISBN 9188116212. [Google Scholar]
- International Energy Agency. Transition to Sustain. Buildings. Strategies and Opportunities to 2050; OECD/IEA: Paris, France, 2013. [Google Scholar]
- Anda, M.; Temmen, J. Smart metering for residential energy efficiency: The use of community based social marketing for behavioural change and smart grid introduction. Renew. Energy 2014, 67, 119–127. [Google Scholar] [CrossRef]
- Li, C.; Hong, T.; Yan, D. An insight into actual energy use and its drivers in high-performance buildings. Appl. Energy 2014, 131, 394–410. [Google Scholar] [CrossRef] [Green Version]
- Vierra, S. Green Building Standards and Certification Systems|WBDG—Whole Building Design Guide. WHole Building Design Guide. 2016. Available online: https://www.wbdg.org/resources/green-building-standards-and-certification-systems (accessed on 6 February 2019).
- Liang, J.; Qiu, Y.; Hu, M. Mind the energy performance gap: Evidence from green commercial buildings. Resour. Conserv. Recycl. 2019, 141, 364–377. [Google Scholar] [CrossRef]
- Shrubsole, C.; Hamilton, I.G.; Zimmermann, N.; Papachristos, G.; Broyd, T.; Burman, E.; Mumovic, D.; Zhu, Y.; Lin, B.; Davies, M. Bridging the gap: The need for a systems thinking approach in understanding and addressing energy and environmental performance in buildings. Indoor Built Environ. 2018, 28, 100–117. [Google Scholar] [CrossRef] [Green Version]
- Mcelroy, D.J.; Rosenow, J. Policy implications for the performance gap of low-carbon building technologies. Build. Res. Inform. 2018, 47, 611–623. [Google Scholar] [CrossRef]
- Gill, Z.M.; Tierney, M.J.; Pegg, I.M.; Allan, N. Low-energy dwellings: The contribution of behaviors to actual performance. Build. Res. Inform. 2010, 38, 491–508. [Google Scholar] [CrossRef]
- Gerarden, T.; Newell, R.; Stavins, R. Assessing the energy-efficiency ga. J. Econ. Lit. 2017, 55, 1486–1525. [Google Scholar] [CrossRef]
- Borgstein, E.H.; Lamberts, R.; Hensen, J.L.M. Mapping failures in energy and environmental performance of buildings. Energy Build. 2018, 158, 476–485. [Google Scholar] [CrossRef]
- Costa, A.; Keane, M.M.; Torrens, J.I.; Corry, E. Building operation and energy performance: Monitoring, analysis and optimisation toolkit. Appl. Energy 2013, 101, 310–316. [Google Scholar] [CrossRef]
- Baudains, P.; Bishop, S.; Duffour, P.; Marjanovic-Halburd, L.; Psarra, S.; Spataru, C. A systems paradigm for integrated building design. Intel. Build. Int. 2014, 6, 201–214. [Google Scholar] [CrossRef]
- Reed, W.G.; Gordon, E.B. Integrated design and building process: What research and methodologies are needed? Build. Res. Inform. 2000, 28, 325–337. [Google Scholar] [CrossRef]
- Eastman, C.; Teicholz, P.; Sacks, R.; Liston, K. BIM Handbook: A Guide to Build. Information Modeling for Owners, Managers, Designers, Enginners, and Contractors; John Wiley & Sons, Inc.: New Jersey, NJ, USA, 2008. [Google Scholar]
- Hetherington, R.; Laney, R.; Peak, S.; Oldham, D. Integrated building design, information and simulation modelling: The need for a new hierarchy. In Build. Simulation 2011; IBPSA: Sydney, Australia, 2011. [Google Scholar]
- Ghaffarianhoseini, A.; Tookey, J.; Ghaffarianhoseini, A.; Naismith, N.; Azhar, S.; Efimova, O.; Raahemifar, K. Building Information Modelling (BIM) uptake: Clear benefits, understanding its implementation, risks and challenges. Renew. Sustain. Energy Rev. 2017, 75, 1046–1053. [Google Scholar] [CrossRef]
- Reizgevicius, M.; Kutut, V.; Cibulskiene, D.; Nazarko, L. Promoting Sustainability through Investment in Building Information Modeling (BIM) Technologies: A Design Company Perspective. Sustainability 2018, 10, 21. [Google Scholar] [CrossRef]
- Hernandez, P.; Kenny, P. From net energy to zero energy buildings: Defining life cycle zero energy buildings (LC-ZEB). Energy Build. 2010, 42, 815–821. [Google Scholar] [CrossRef]
- Ozkan, A.; Kesik, T.; Yilmaz, A.Z.; O’Brien, W. Development and visualization of time-based building energy performance metrics. Build. Res. Inform. 2019, 47, 493–517. [Google Scholar] [CrossRef]
- Boermans, T.; Hermelink, A.; Schischar, S.; Grözinger, J.; Offermann, M.; Thomsen, K.E.; Jorsen, R.; Aggerholm, S.O. Principles for Nearly Zero-Energy Buildings. Paving the Way for Effective Implementation of Policy Requirements; Buildings Performance Institute Europe: Brussels, Belgium, 2011. [Google Scholar]
- Torcellini, P.; Pless, S.; Deru, M.; Crawley, D. Zero Energy Buildings: A critical Look at the Definition. In ACEEE Summer Study; American Council for and Energy-Efficient Economy: Pacific Grove, CA, USA, 2006. [Google Scholar]
- United Nations. Transforming Our World: The 2030 Agenda for Sustainable Develeopment; United Nations: New York, NY, USA, 2015. [Google Scholar]
- United Nations. Ensure Access to Affordable, Reliable, Sustainable and Modern Energy. Sustainable Development Goals. Available online: https://www.un.org/sustainabledevelopment/energy/ (accessed on 26 February 2019).
- Pye, S.; Dobbins, A.; Baffert, C.; Brajković, J.; Grgurev, I.; De Miglio, R.; Deane, P. Energy poverty and vulnerable consumers in the energy sector across the EU: Analysis of policies and measures. Policy Rep. 2015, 2, 91. [Google Scholar] [CrossRef]
- Scarpellini, S.; Alexia Sanz Hernández, M.; Moneva, J.M.; Portillo-Tarragona, P.; Rodríguez, M.E.L. Measurement of spatial socioeconomic impact of energy poverty. Energy Policy 2019, 124, 320–331. [Google Scholar] [CrossRef]
- Schleich, J. Energy efficient technology adoption in low-income households in the European Union—What is the evidence? Energy Policy 2019, 125, 196–206. [Google Scholar] [CrossRef]
- Capeluto, G.; Ochoa, C. Intelligent Envelopes for High-Performance Buildings: Design and Strategy. In Green Energy and Technology; Springer International Publishing: Cham, Germany, 2017; pp. 1–134. [Google Scholar]
- Bilton, M.; Woolf, M.; Djapic, P.; Aunedi, M.; Carmichael, R.; Strbac, G.; Woolf, M.; Djapic, P.; Aunedi, M.; Carmichael, R.; et al. Impact of Energy Efficient Appliances on Network Utilisation; Imperial College London: London, UK, 2014. [Google Scholar]
- Oldewurtel, F.; Parisio, A.; Jones, C.N.; Gyalistras, D.; Gwerder, M.; Stauch, V.; Lehmann, B.; Morari, M. Use of model predictive control and weather forecasts for energy efficient building climate control. Energy Build. 2012, 45, 15–27. [Google Scholar] [CrossRef] [Green Version]
- Loonen, R.C.G.M.; Singaravel, S.; Trčka, M.; Cóstola, D.; Hensen, J.L.M. Simulation-based support for product development of innovative building envelope components. Autom. Constr. 2014, 45, 86–95. [Google Scholar] [CrossRef]
- Kramers, A.; Svane, Ö. ICT Applications for Energy Efficiency in Buildings; Centre for Sustainable Communications: Stockholm, Sweden, 2011. [Google Scholar]
- Crawley, D.B.; Hand, J.W.; Kummert, M.; Griffith, B.T. Contrasting the Capabilities of Build. Energy Performance Simulation Programs. Build. Environ. 2008, 43, 661–673. [Google Scholar] [CrossRef]
- Xu, J.; Kim, J.-H.; Hong, H.; Koo, J. A systematic approach for energy efficient building design factors optimization. Energy Build. 2015, 89, 87–96. [Google Scholar] [CrossRef]
- Upadhyay, K.; Ansari, A.A. Intelligent and Adaptive Facade System—The Impact on the Performance and Energy Efficiency of Buildings. J. Civil Eng. Environ. Technol. 2017, 4, 295–300. [Google Scholar]
- Kasinalis, C.; Loonen, R.C.G.M.; Cóstola, D.; Hensen, J.L.M. Framework for assessing the performance potential of seasonally adaptable facades using multi-objective optimization. Energy Build. 2014, 79, 106–113. [Google Scholar] [CrossRef] [Green Version]
- Borg, S.P.; Kelly, N.J. The effect of appliance energy efficiency improvements on domestic electric loads in European households. Energy Build. 2011, 43, 2240–2250. [Google Scholar] [CrossRef]
- Hakim, H.; Martini; Hindarto, D.; Riyanto, I.; Margatama, L. Motion Sensor Application on Building Lighting Installation for Energy Saving and Carbon Reduction Joint Crediting Mechanism. Appl. Syst. Innov. 2018, 1, 23. [Google Scholar] [CrossRef]
- Garg, V.; Bansal, N.K. Smart occupancy sensors to reduce energy consumption. Energy Build. 2000, 32, 81–87. [Google Scholar] [CrossRef]
- De Groote, M.; Lefever, M. Reaching the Untapped Potential Driving Transformational Change in the Construction Value Chain; Building Performance Institute Europe: Brussels, Belgium, 2015. [Google Scholar]
- Lehmann, B.; Gyalistras, D.; Gwerder, M.; Wirth, K.; Carl, S. Intermediate complexity model for Model Predictive Control of Integrated Room Automation. Energy Build. 2013, 58, 250–262. [Google Scholar] [CrossRef]
- Gyalistras, D.; Gwerder, M.; Oldewurtel, F.; Jones, C.N.; Morari, M.; Lehmann, B.; Wirth, K.; Stauch, V. Analysis of Energy Savings Potentials for Integrated Room Automation. In Proceedings of the 10th REHVA World Congr. Clima, Antalya, Turkey, 9–12 May 2010; p. 8. [Google Scholar]
- Gwerder, M.; Gyalistras, D.; Oldewurtel, F.; Lehmann, B.; Stauch, V.; Tödtli, J. Potential Assessment of Rule-Based Control for Integrated Room Automation. In Proceedings of the 10th REHVA World Congress, Sustain. Energy Use in Buildings-CLIMA 2010, Antalya, Turkey, 9–12 May 2010; pp. 9–12. [Google Scholar]
- Tamani, N.; Ahvar, S.; Santos, G.; Istasse, B.; Praca, I.; Brun, P.E.; Ghamri, Y.; Crespi, N.; Becue, A. Rule-based model for smart building supervision and management. In Proceedings of the 2018 IEEE Int. Conference on Services Computing, SCC 2018—Part of the 2018 IEEE World Congress on Services, San Francisco, CA, USA, 2–7 July 2018; pp. 9–16. [Google Scholar]
- Mainetti, L.; Mighali, V.; Patrono, L.; Rametta, P. A novel rule-based semantic architecture for IoT building automation systems. In Proceedings of the 2015 23rd Int. Conference on Software, Telecommunications and Computer Networks, SoftCOM 2015, Split, Croatia, 16–18 September 2015; pp. 124–131. [Google Scholar]
- Kolokotsa, D.; Pouliezos, A.; Stavrakakis, G.; Lazos, C. Predictive control techniques for energy and indoor environmental quality management in buildings. Build. Environ. 2009, 44, 1850–1863. [Google Scholar] [CrossRef]
- OptiControl. OptiControl Project—Literature. Available online: http://www.opticontrol.ethz.ch/07E-Literature.html#top (accessed on 2 February 2015).
- Ma, Y. Model Predictive Control for Energy Efficient Buildings; UC Berkeley: Berkeley, CA, USA, 2012. [Google Scholar]
- Široký, J.; Oldewurtel, F.; Cigler, J.; Prívara, S. Experimental analysis of model predictive control for an energy efficient building heating system. Appl. Energy 2011, 88, 3079–3087. [Google Scholar] [CrossRef]
- Oldewurtel, F.; Sturzenegger, D.; Andersson, G.; Morari, M.; Smith, R.S. Towards a standardized building assessment for demand response. In 52nd IEEE Conference on Decision and Control; IEEE: Florence, Italy, 2013; pp. 7083–7088. ISBN 0743-1546. [Google Scholar]
- Tanaskovic, M.; Sturzenegger, D.; Smith, R.; Morari, M. Robust Adaptive Model Predictive Building Climate Control. IFAC Pap. 2017, 50, 1871–1876. [Google Scholar] [CrossRef]
- Karjalainen, S.; Lappalainen, V. Integrated control and user interfaces for a space. Build. Environ. 2011, 46, 938–944. [Google Scholar] [CrossRef]
- Oldewurtel, F.; Sturzenegger, D.; Morari, M. Importance of occupancy information for building climate control. Appl. Energy 2013, 101, 521–532. [Google Scholar] [CrossRef]
- Cho, S.; Zaheer-uddin, M. Predictive control of intermittently operated radiant floor heating systems. Energy Conv. Manag. 2003, 44, 1333–1342. [Google Scholar] [CrossRef]
- Rawi, M.; Al-Anbuky, A. Passive House sensor networks: Human centric thermal comfort concept. In Proceedings of the 2009 5th Int. Conference Intelligent Sensors, Sensor Networks and Information Processing (ISSNIP), Melbourne, Australia, 7–10 December 2009; pp. 255–260. [Google Scholar]
- Owens, S.; Driffill, L. How to change attitudes and behaviours in the context of energy. Energy Policy 2008, 36, 4412–4418. [Google Scholar] [CrossRef]
- Mills, B.; Schleich, J. Residential energy-efficient technology adoption, energy conservation, knowledge, and attitudes: An analysis of European countries. Energy Policy 2012, 49, 616–628. [Google Scholar] [CrossRef]
- Niamir, L.; Filatova, T.; Voinov, A.; Bressers, H. Transition to low-carbon economy: Assessing cumulative impacts of individual behavioral changes. Energy Policy 2018, 118, 325–345. [Google Scholar] [CrossRef]
- Lee, S.Y.; Brand, J.L. Effects of control over office workspace on perceptions of the work environment and work outcomes. J. Environ. Psychol. 2005, 25, 323–333. [Google Scholar] [CrossRef] [Green Version]
- Boerstra, A.; Beuker, T.; Loomans, M.; Hensen, J. Impact of available and perceived control on comfort and health in European offices. Arch. Sci. Rev. 2013, 56, 30–41. [Google Scholar] [CrossRef] [Green Version]
- Day, J.K.; Gunderson, D.E. Understanding high performance buildings: The link between occupant knowledge of passive design systems, corresponding behaviors, occupant comfort and environmental satisfaction. Build. Environ. 2014, 84, 114–124. [Google Scholar] [CrossRef]
- Lazowski, B.; Parker, P.; Rowlands, I.H. Towards a smart and sustainable residential energy culture: Assessing participant feedback from a long-term smart grid pilot project. Energy Sustain. Soc. 2018, 8, 27. [Google Scholar] [CrossRef]
- Girod, B.; Stucki, T.; Woerter, M. How do policies for efficient energy use in the household sector induce energy-efficiency innovation? An evaluation of European countries. Energy Policy 2017, 103, 223–237. [Google Scholar] [CrossRef]
- Baldini, M.; Trivella, A.; Wente, J.W. The impact of socioeconomic and behavioural factors for purchasing energy efficient household appliances: A case study for Denmark. Energy Policy 2018, 120, 503–513. [Google Scholar] [CrossRef]
- Ameli, N.; Brandt, N. Determinants of households’ investment in energy efficiency and renewables: Evidence from the OECD survey on household environmental behaviour and attitudes. Environ. Res. Lett. 2015, 10, 044015. [Google Scholar] [CrossRef]
- Sardianou, E.; Genoudi, P. Which factors affect the willingness of consumers to adopt renewable energies? Renew. Energy 2013, 57, 1–4. [Google Scholar] [CrossRef]
- Dieu-Hang, T.; Grafton, R.Q.; Martínez-Espiñeira, R.; Garcia-Valiñas, M. Household adoption of energy and water-efficient appliances: An analysis of attitudes, labelling and complementary green behaviours in selected OECD countries. J. Environ. Manag. 2017, 197, 140–150. [Google Scholar] [CrossRef]
- Thøgersen, J. Frugal or green? Basic drivers of energy saving in European households. J. Clean. Prod. 2018, 197, 1521–1530. [Google Scholar] [CrossRef]
- Masoso, O.T.; Grobler, L.J. The dark side of occupants’ behaviour on building energy use. Energy Build. 2010, 42, 173–177. [Google Scholar] [CrossRef]
- David, D. On the Adaptation of Build. Controls to the Envelope and the Occupants; École Polytechnique fédérale de Laussane: Laussane, Switzerland, 2010. [Google Scholar]
- Papantoniou, S.; Kolokotsa, D.; Kalaitzakis, K. Building optimization and control algorithms implemented in existing BEMS using a web based energy management and control system. Energy Build. 2015, 98, 44–55. [Google Scholar] [CrossRef]
- Ackerly, K.; Brager, G. Window signalling systems: Control strategies and occupant behaviour. Build. Res. Inform. 2013, 41, 342–360. [Google Scholar] [CrossRef]
- De Dear, R.J.; Brager, G.S. The adaptive model of thermal comfort and energy conservation in the built environment. Int. J. Biometeorol. 2001, 45, 100–108. [Google Scholar] [CrossRef] [Green Version]
- Luo, M.; De Dear, R.J.; Ji, W.; Lin, B.; Ouyang, Q.; Zhu, Y. The Dynamics of Thermal Comfort Expectations. Build. Environ. 2016, 95, 322–329. [Google Scholar] [CrossRef]
- Jensen, K.L.; Toftum, J.; Friis-Hansen, P. A Bayesian Network approach to the evaluation of building design and its consequences for employee performance and operational costs. Build. Environ. 2009, 44, 456–462. [Google Scholar] [CrossRef]
- Romm, J.J.; Browning, W.D. Greening the Building and the Bottom Line. In Proceedings of the Second International Green Buildings Conference and Exposition; Whitter, M., Cohn, T.B., Eds.; Rocky Mountain Institute: Snowmass Village, CO, USA, 1995. [Google Scholar]
- Hanie, O.; Aryan, A.; MohammadReza, L.; Elham, L. Understanding the Importance of Sustainable Buildings in Occupants Environmental Health and Comfort. J. Sustain. Dev. 2010, 3, 194–200. [Google Scholar] [CrossRef]
Figure 1.
Connections between three levels (Building-Indoor environmental factors (IEQ)-Occupant) of a healthy and energy efficient building concept.
Figure 1.
Connections between three levels (Building-Indoor environmental factors (IEQ)-Occupant) of a healthy and energy efficient building concept.

Figure 2.
Organization and sections of the review paper.

Figure 3.
Number of publications analyzed according to publication year (based on publications used in the presented paper).
Figure 3.
Number of publications analyzed according to publication year (based on publications used in the presented paper).

Figure 4.
Keyword network visualization on co-occurrence and link strength of terms extracted from abstracts of review papers, color scale based on the average year of publication.
Figure 4.
Keyword network visualization on co-occurrence and link strength of terms extracted from abstracts of review papers, color scale based on the average year of publication.

Figure 5.
Ranking according to the importance of individual IEQ factors and their contribution towards overall satisfaction with the IEQ. The higher the number, the higher the importance.
Figure 5.
Ranking according to the importance of individual IEQ factors and their contribution towards overall satisfaction with the IEQ. The higher the number, the higher the importance.

Figure 6.
The processing of sensory triggers and subsequent human response.

Figure 7.
Limit values for radiation exposure for skin burn protection based on [188].
Figure 7.
Limit values for radiation exposure for skin burn protection based on [188].

Figure 8.
Final energy consumption in buildings for EU28 in 2013. Data according to [230].
Figure 8.
Final energy consumption in buildings for EU28 in 2013. Data according to [230].


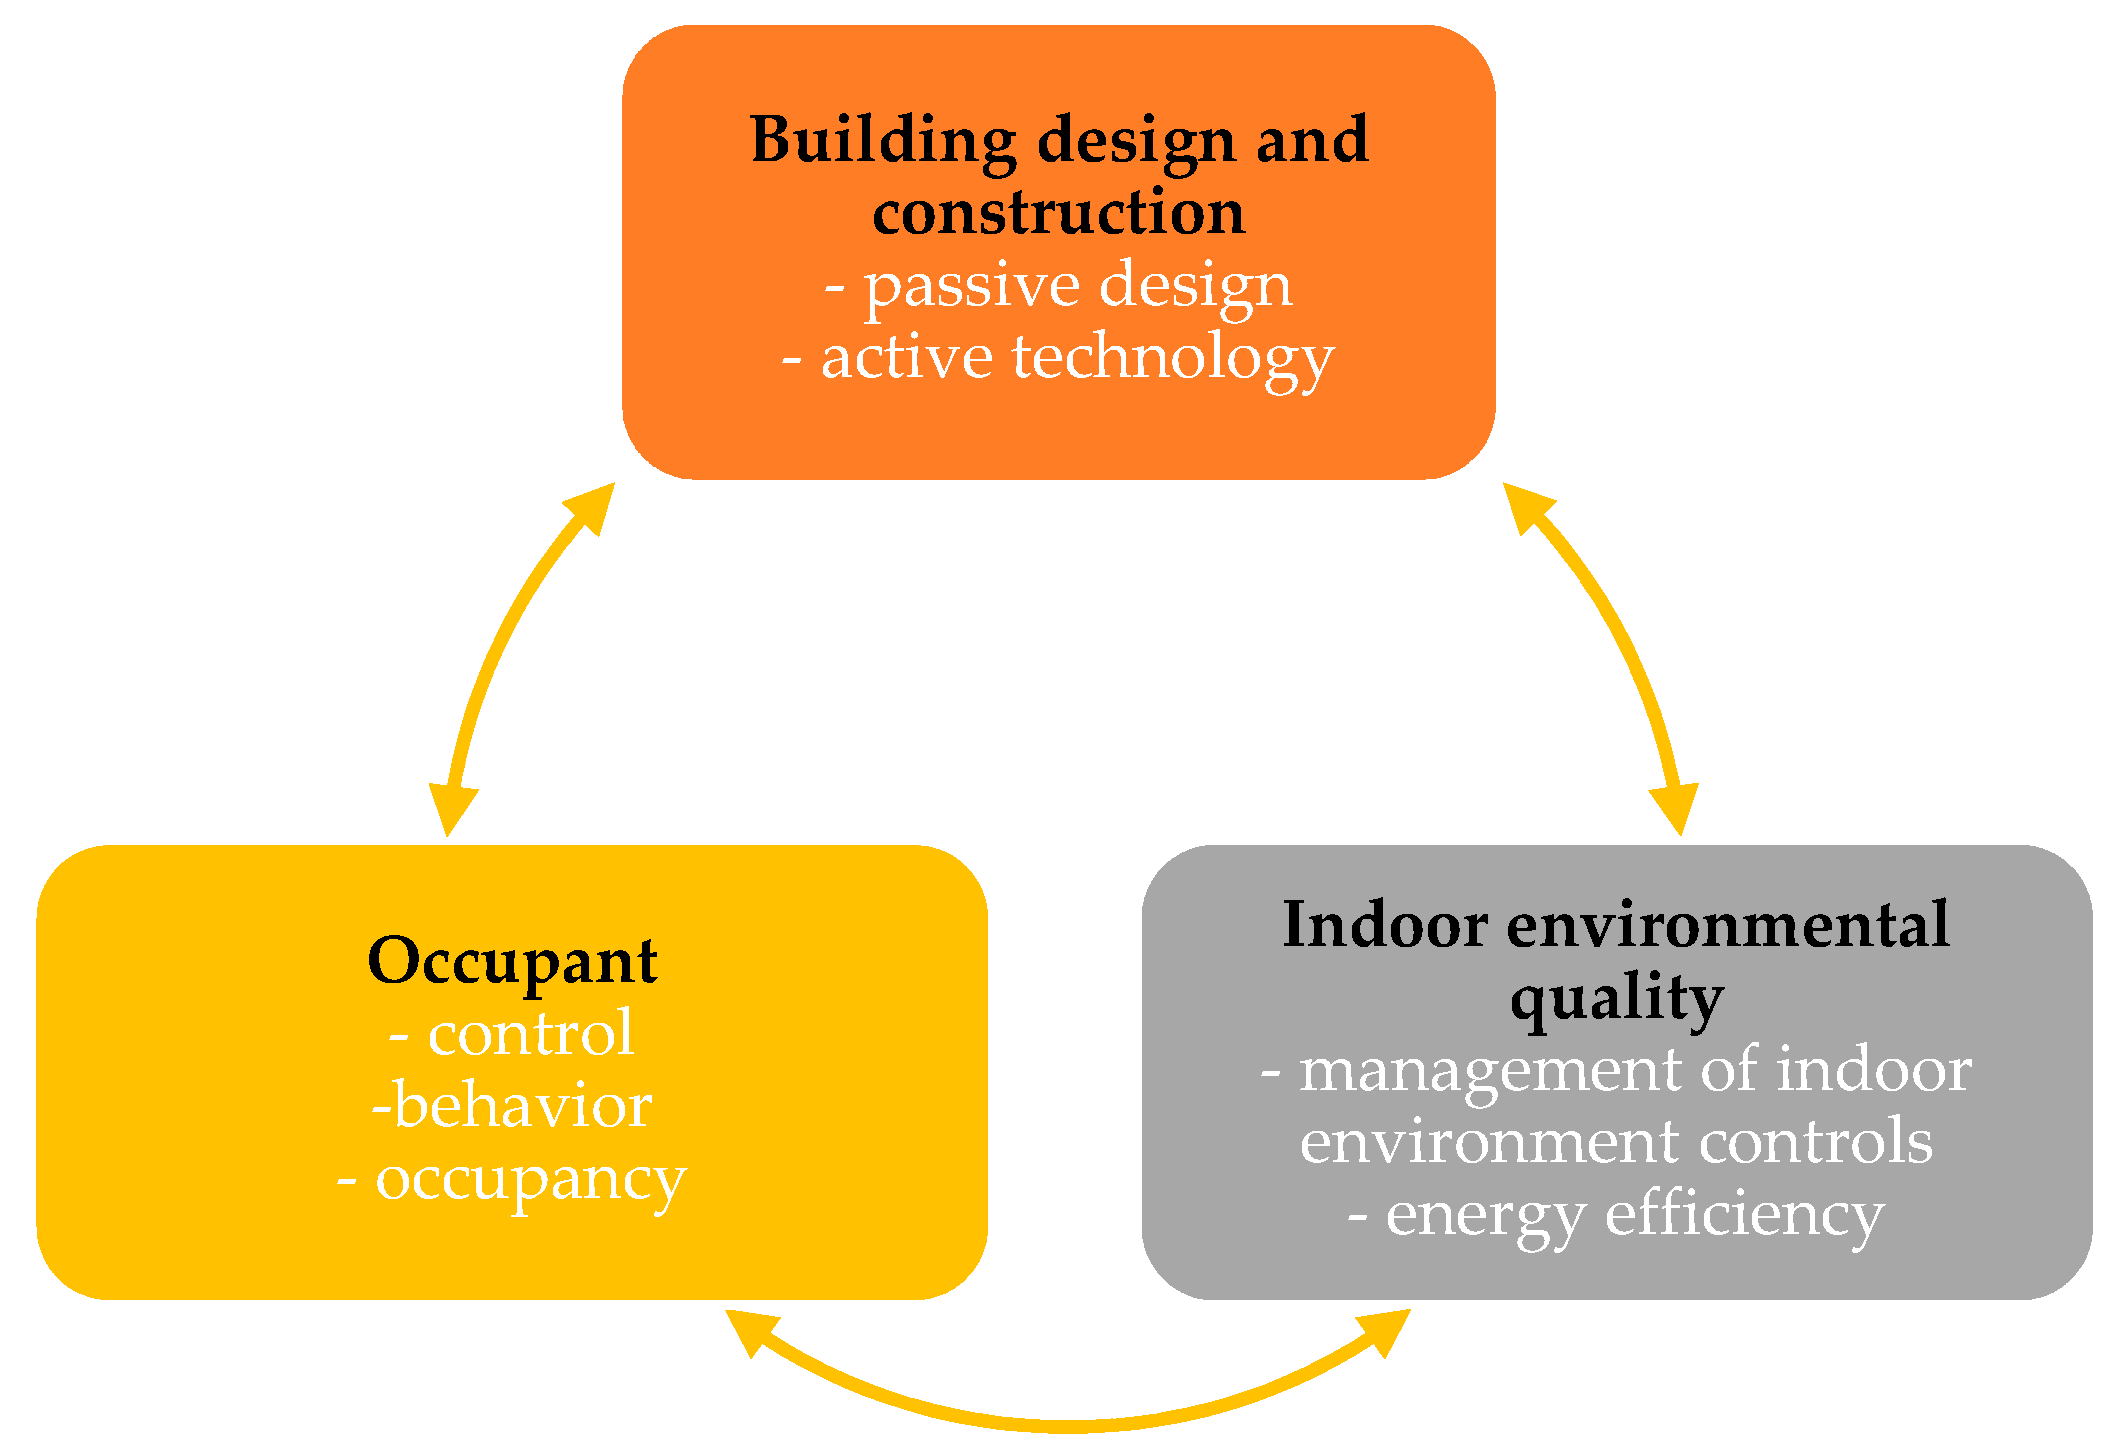
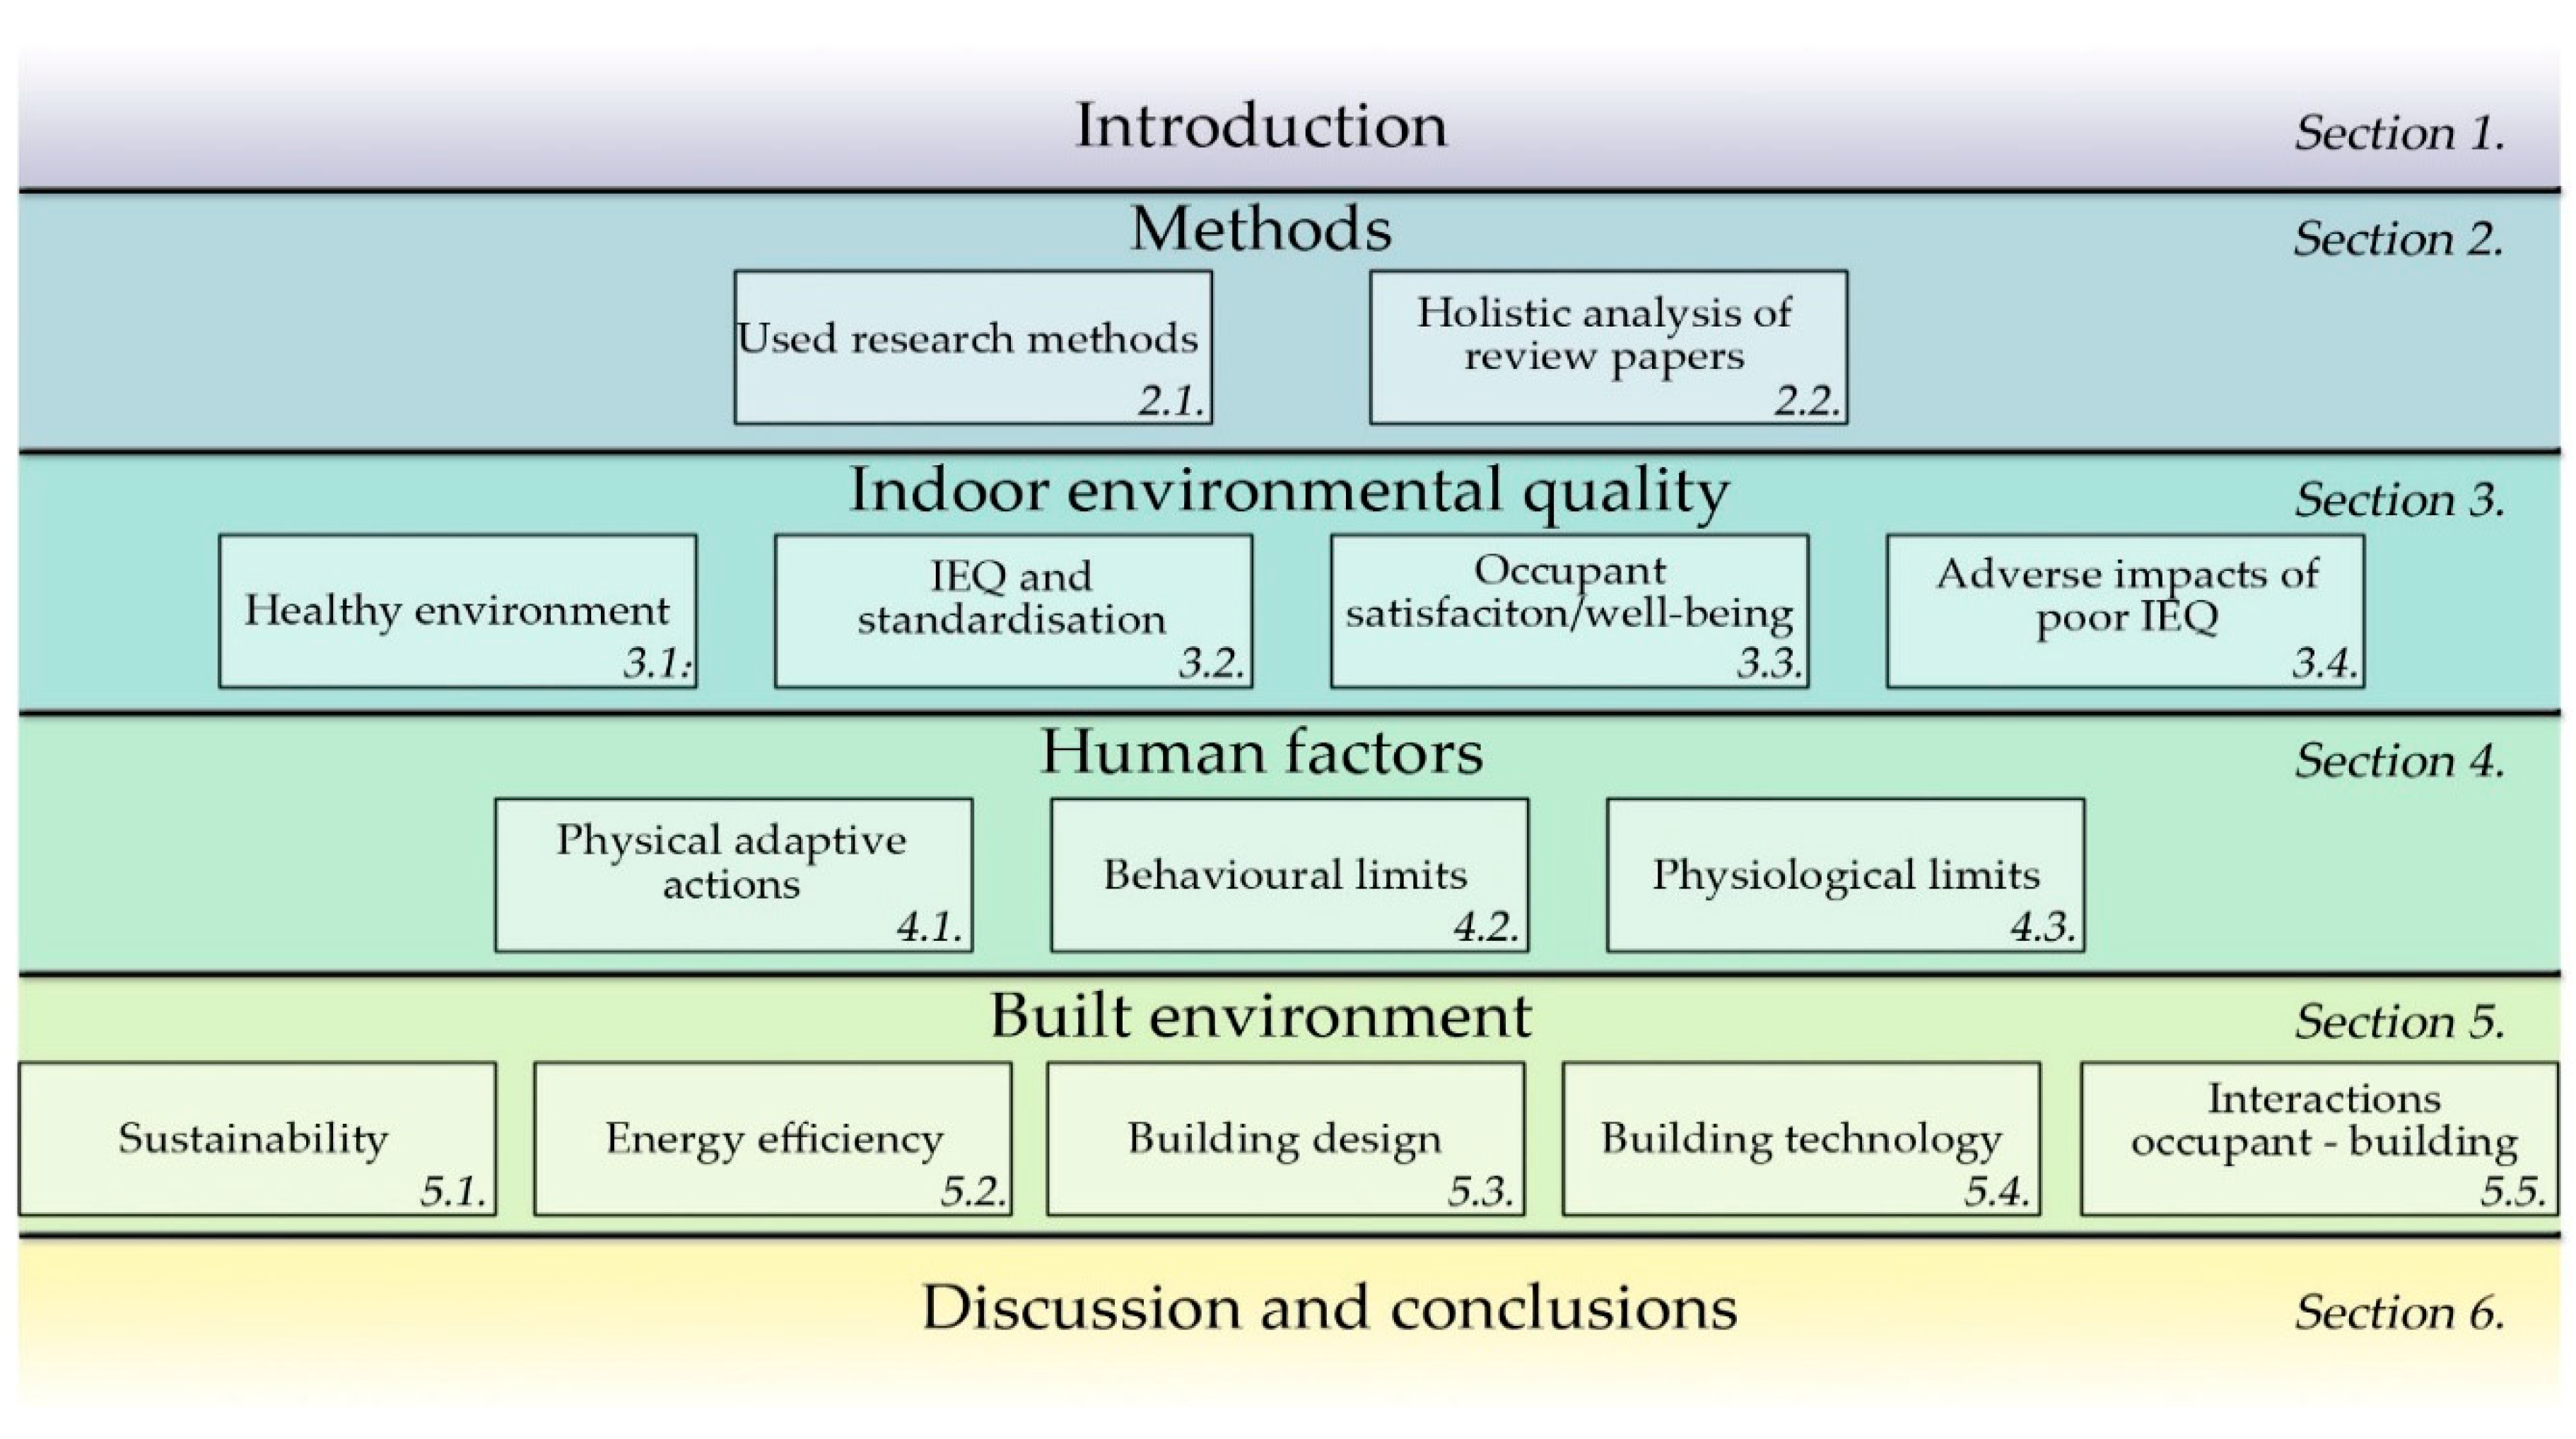
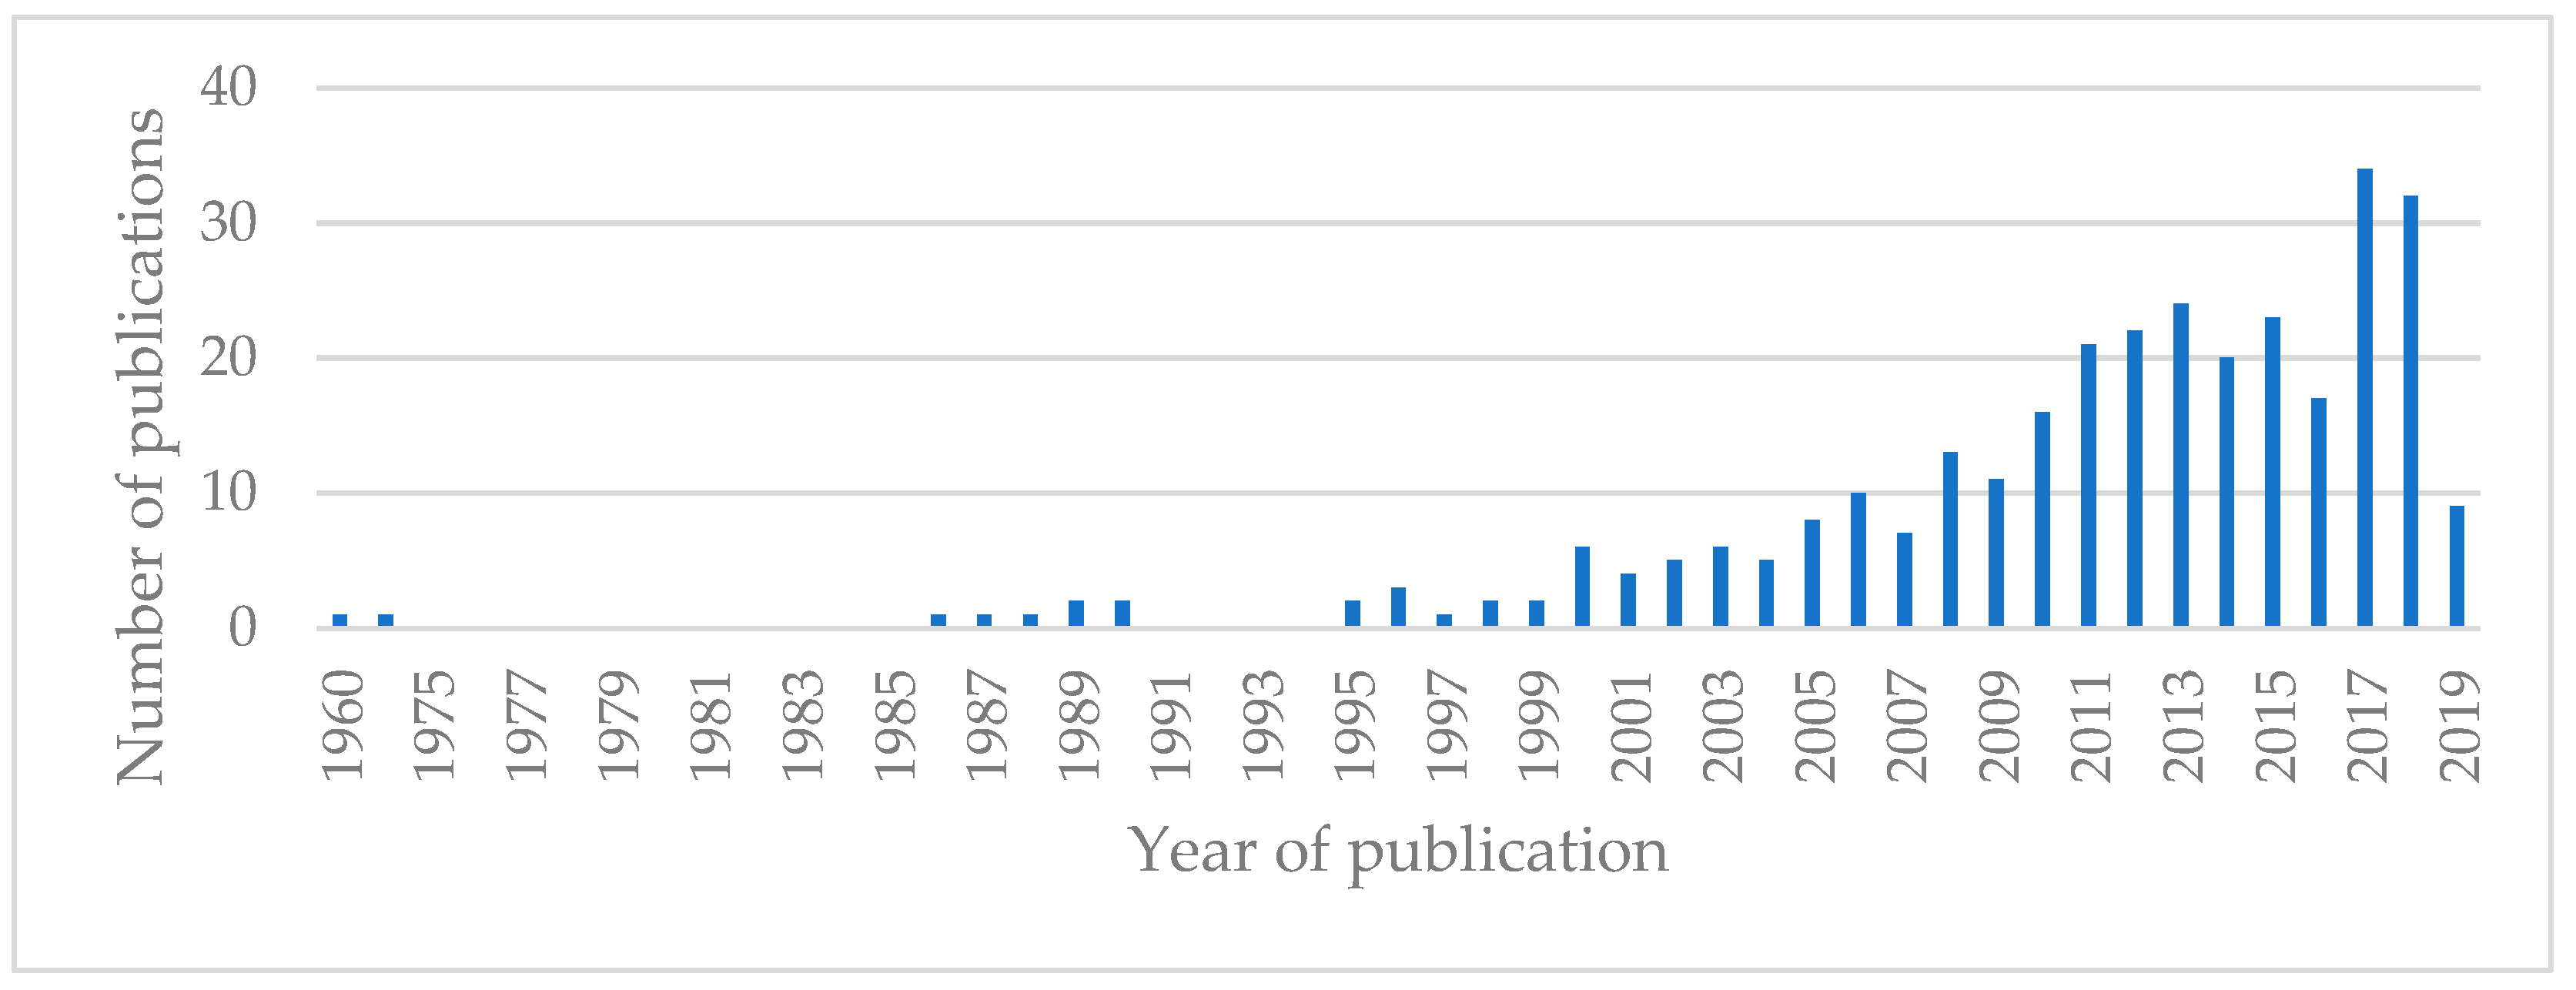
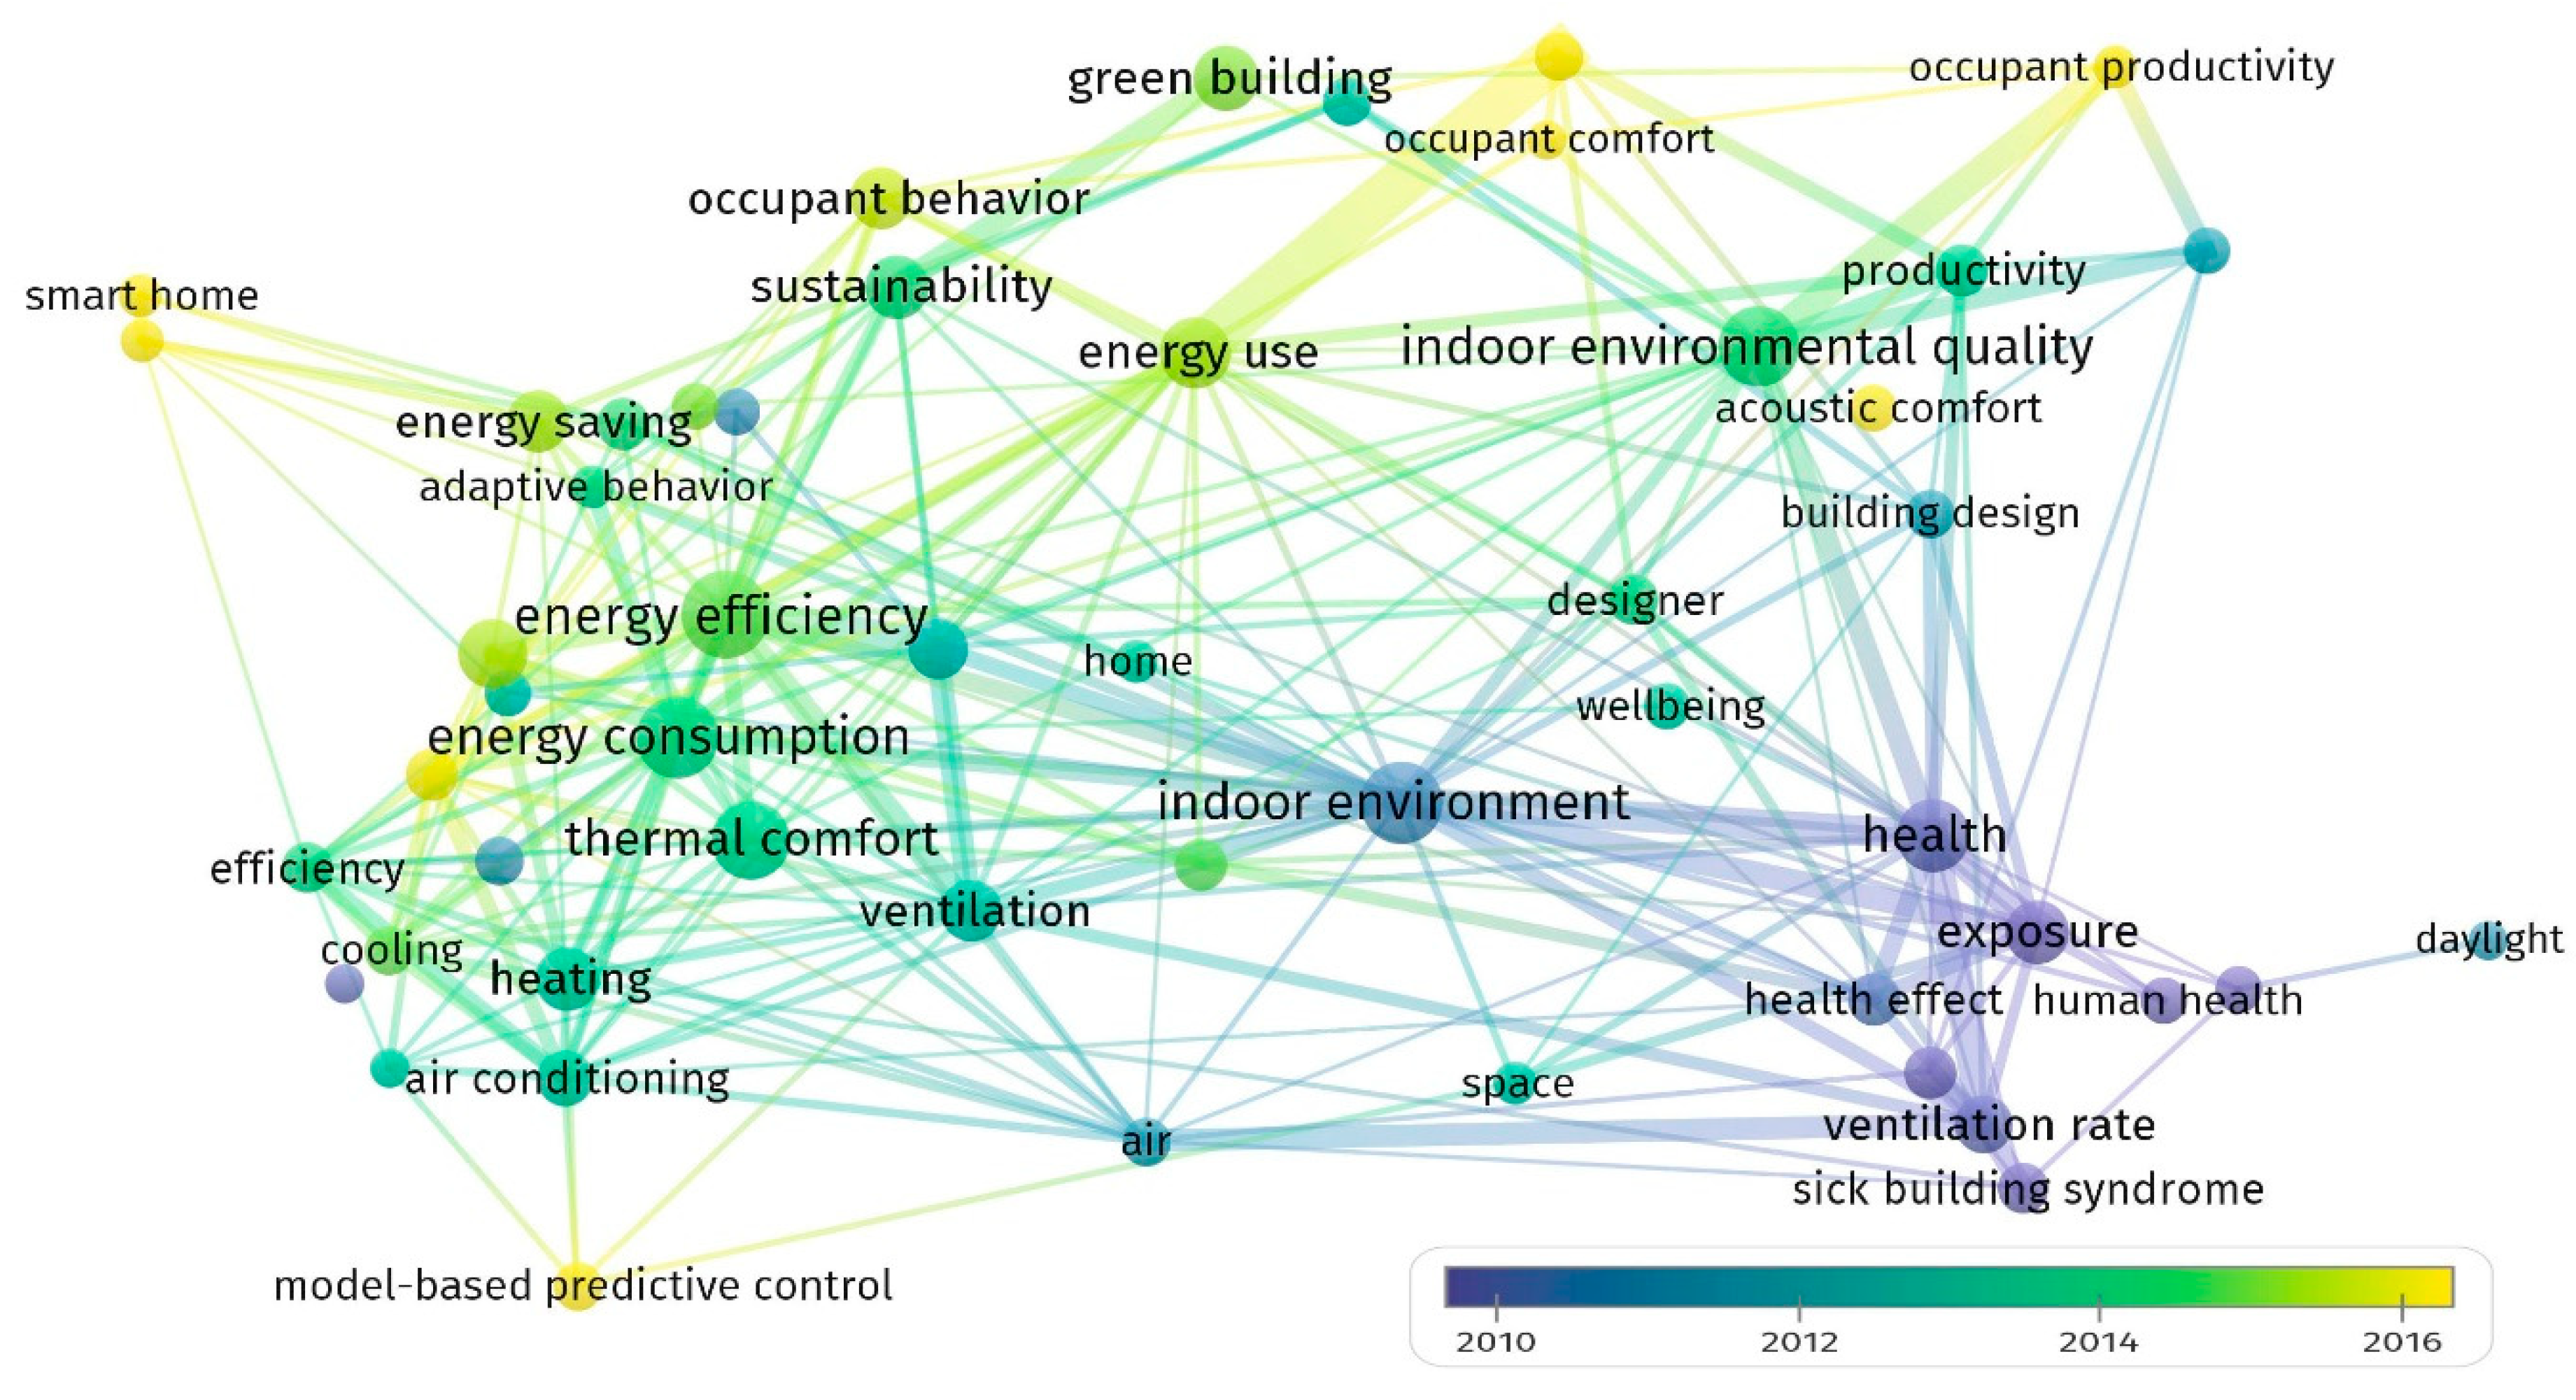
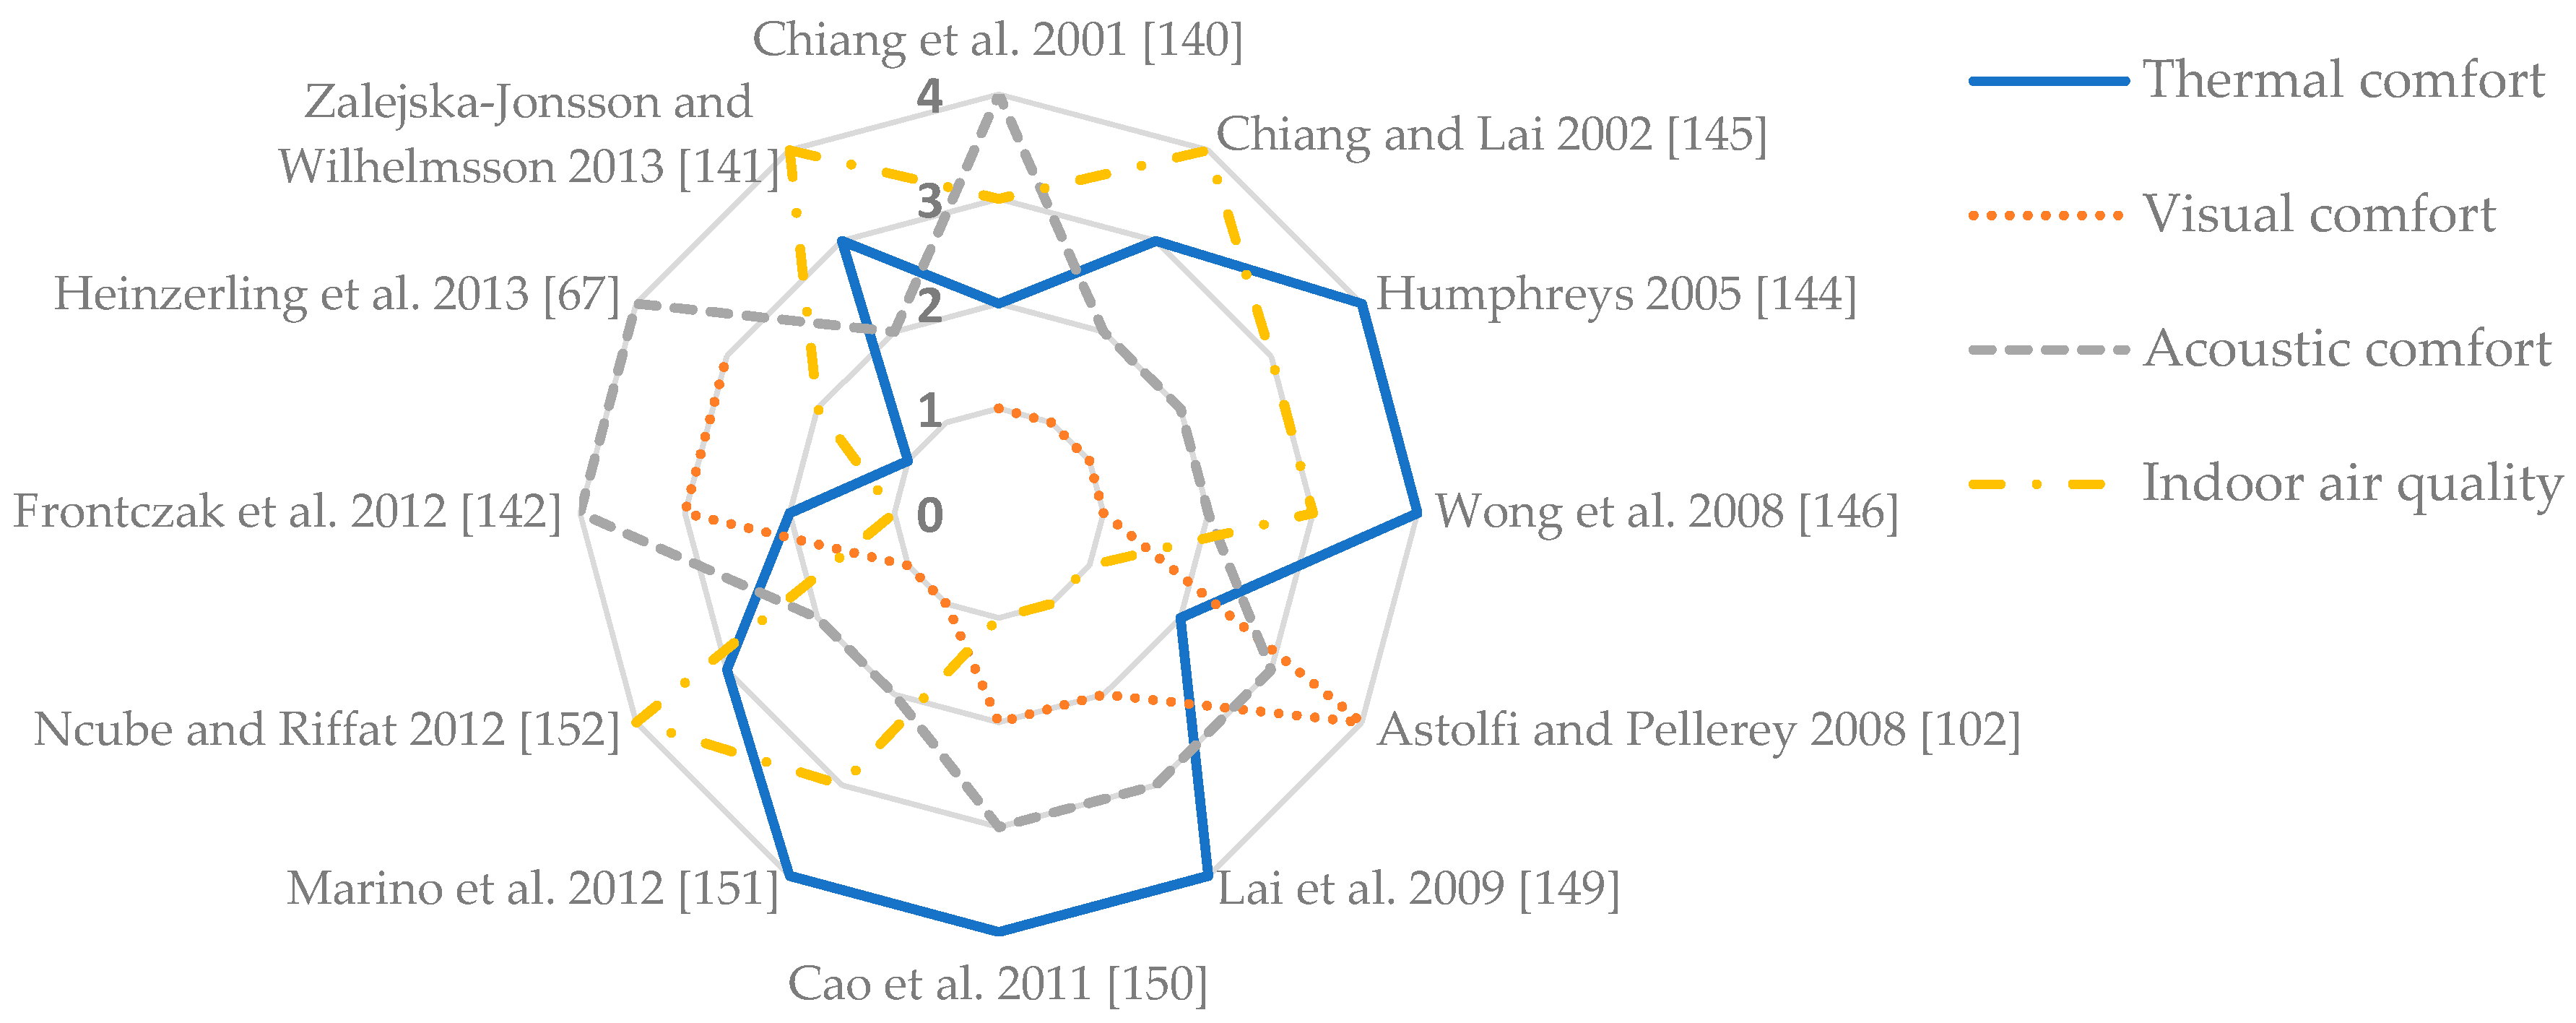
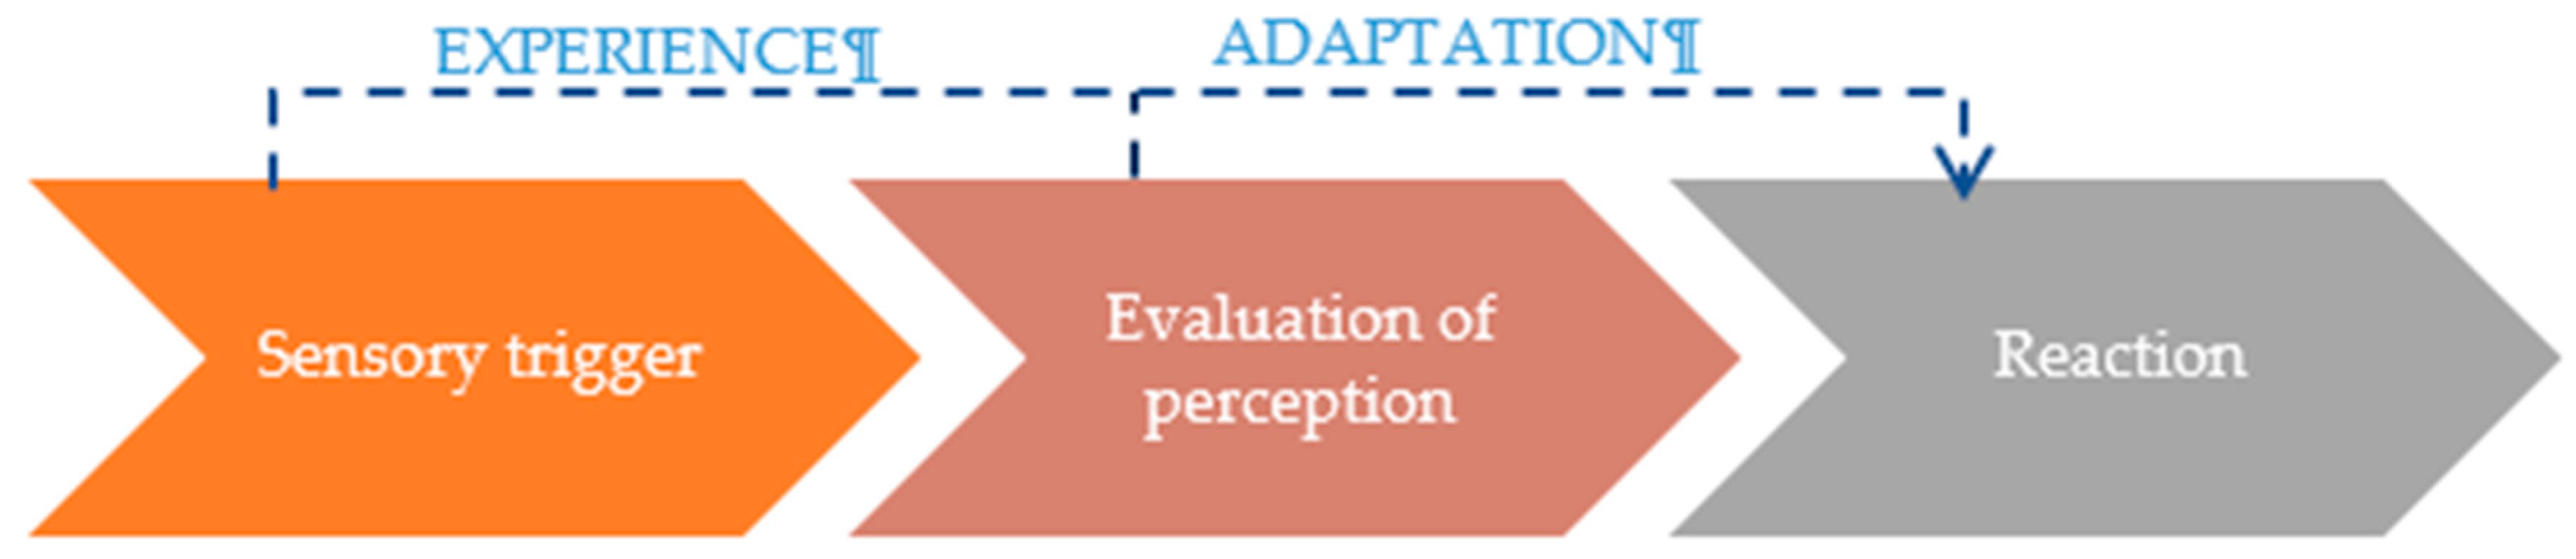
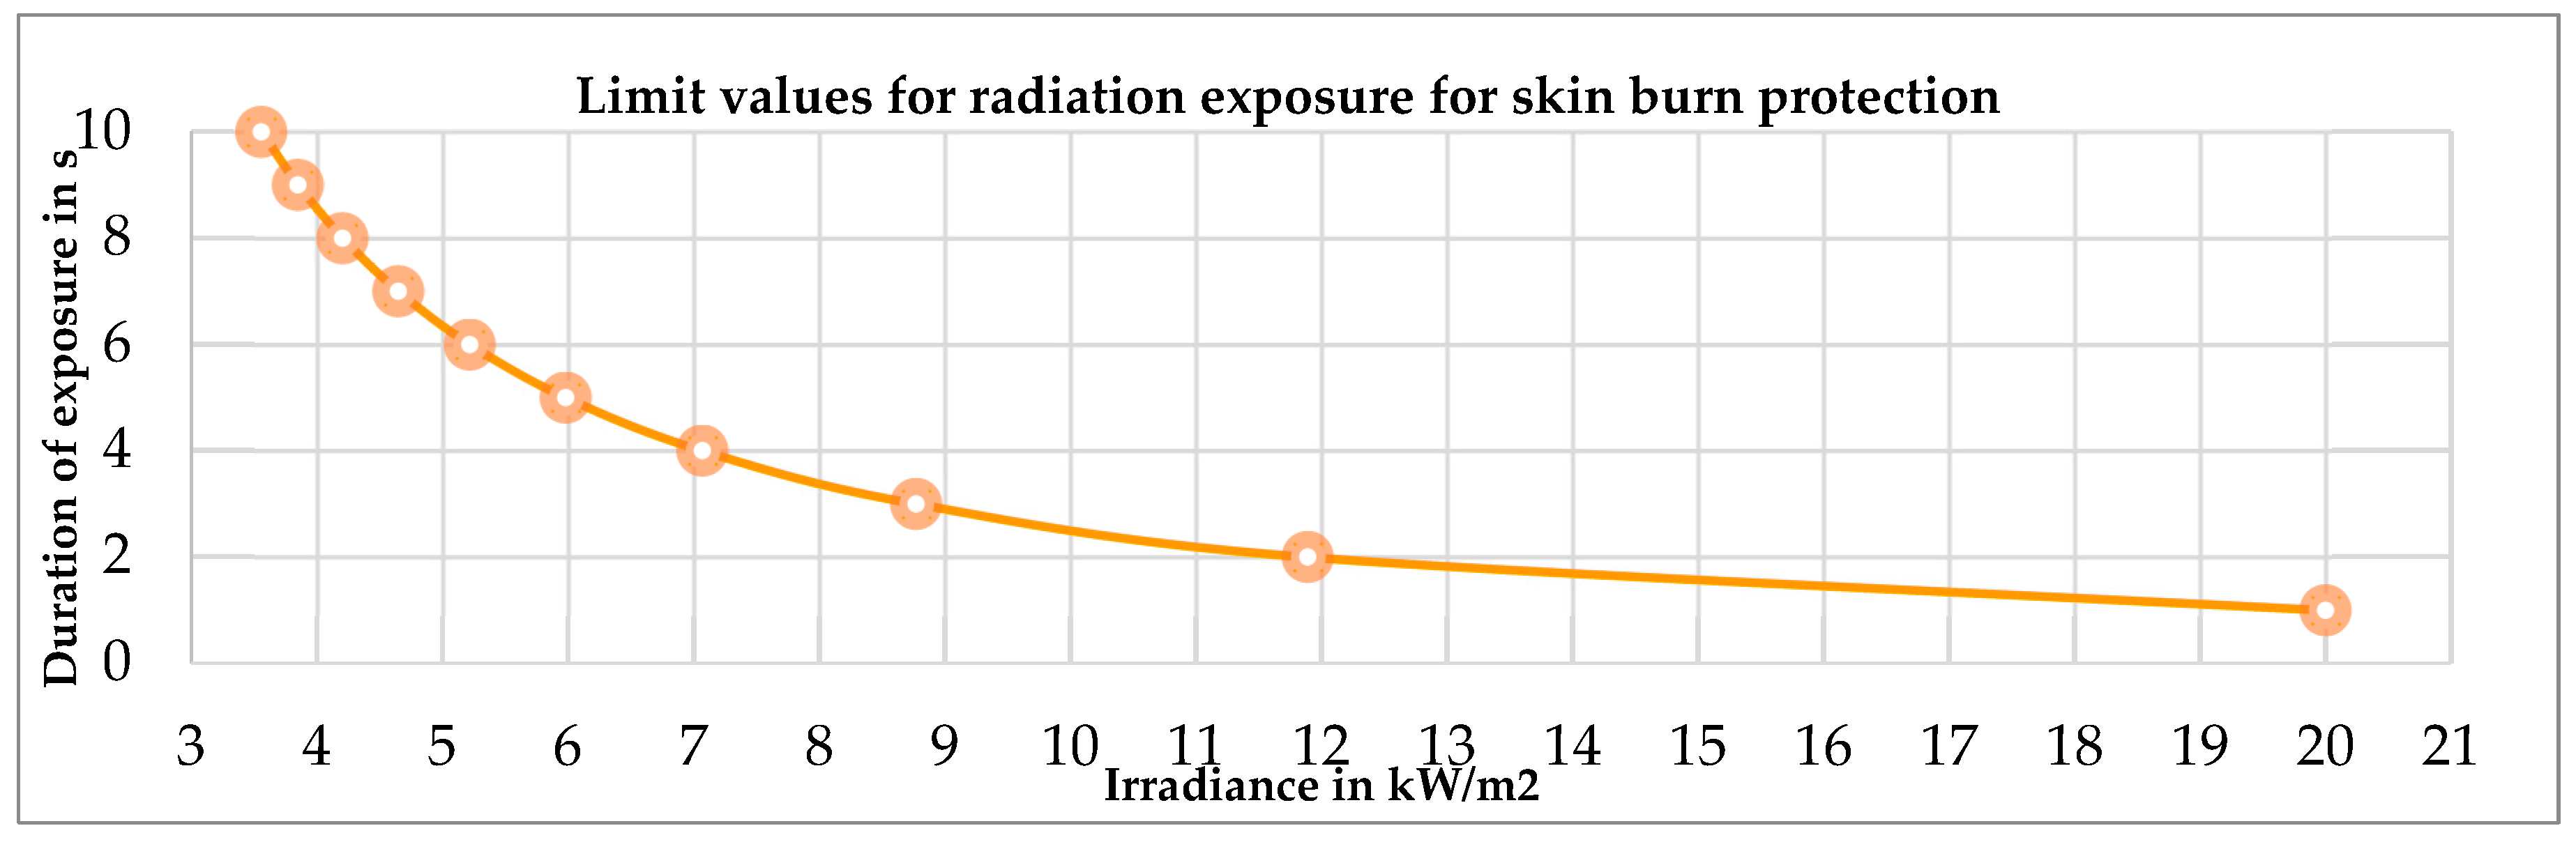
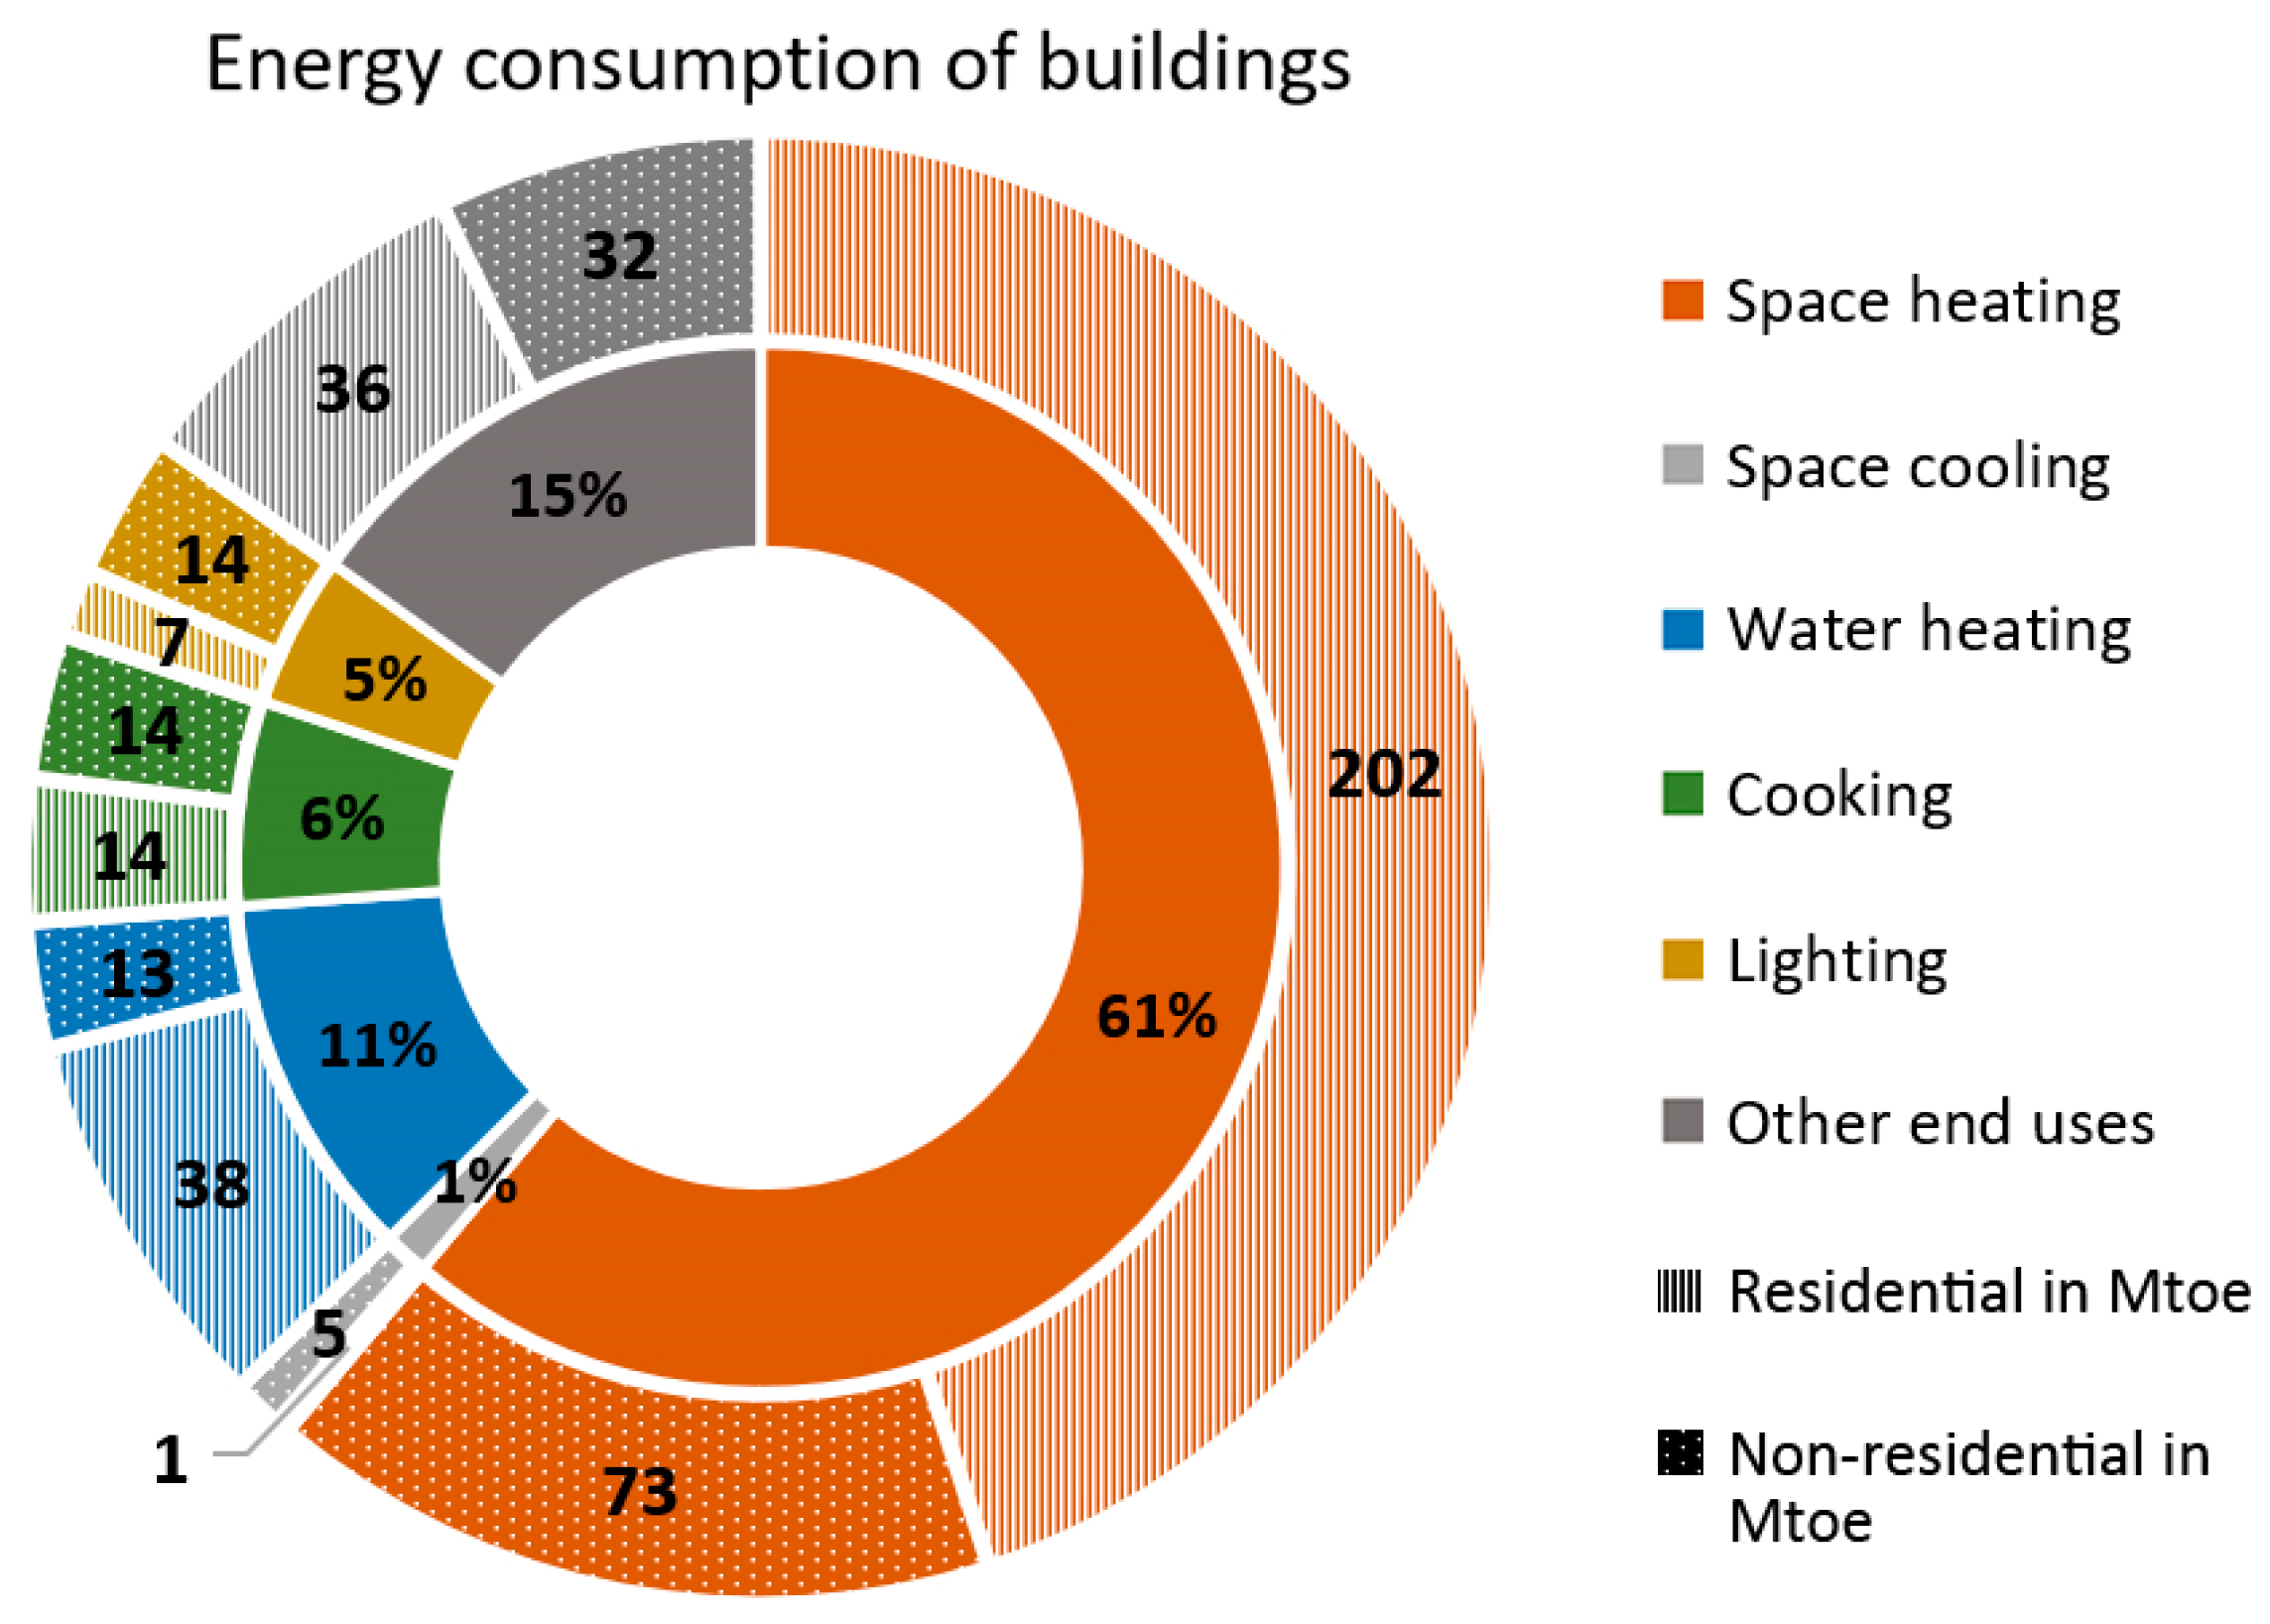
Table 1.
Indoor environment quality factors and their parameters.
| Thermal Comfort | Visual Comfort | Acoustic Comfort | Indoor Air Quality | |
|---|---|---|---|---|
| Note | Requirements for lighting and daylighting | Close connection to thermal environment | ||
| Parameters | PMV/PPD or operative temperature; Humidity; Air velocity; Draught; Vertical air temperature differences; Radiant temperature asymmetry; Surface temperature of the floor. | Daylight provision; View out; Exposure to sunlight, Illuminance; Luminance; Light uniformity; Glare; Color (color rendering, light source color); | Sound level difference; Sound insulation; Sound absorption; Noise level(s) Frequency; Reverberation time. | Indoor sources of pollution; Outdoor sources of pollution; Ventilation parameters; Airflow patterns and pressure relationships; Air filtration system. |
| Influence factors | Clothing; Activity | Light source, Visual task; Use of room | Sources of heat gains; Outdoor conditions and outdoor air ventilation rate |
Table 2.
List of studies that have created a ranking of importance of IEQ factors.
| Study | Building Type | Type of Survey |
|---|---|---|
| Chiang et al., 2001 [141] | Senior house | QS among occupants of 12 senior houses |
| Chiang and Lai, 2002 [146] | General dwelling and office buildings | 12 QS on experts |
| Humphreys, 2005 [144] | Offices | 4655 QS among occupants |
| Wong et al., 2008 [147] | Offices | 293 QS among occupants |
| Astolfi and Pellerey, 2008 [148] | Classrooms | 1006 QS among occupants |
| Lai et al., 2009 [149] | Residential buildings | 125 QS among occupants |
| Cao et al., 2012 [150] | Public buildings | 500 QS among occupants |
| Marino et al., 2012 [151] | Offices | Measured values compared to EN 15251 |
| Ncube and Riffat, 2012 [152] | Offices | 68 QS among occupants |
| Frontczak et al., 2012 [142] | Offices | 50000 QS among occupants |
| Heinzerling et al., 2013 [67] | Offices | 52980 QS among occupants |
| Zalejska-Jonsson and Wilhelmsson, 2013 [141] | Residential buildings | 5756 QS among occupants |
Table 3.
Energy consumption of the building sector.
| Final Energy Consumption | Year | Commercial in Mtoe | Residential in Mtoe | Total in Mtoe | % Share of the Building Sector |
|---|---|---|---|---|---|
| EU – 28 1 | 2016 | 150 | 285 | 1108 | 39 |
| USA 2 | 2017 | 456 | 504 | 2467 | 39 |
| China 3 | 2017 | 84 | 379 | 3052 | 15 |
| India 4 | 2015 | 7.4 | 52 | 519 | 11.4 |
© 2019 by the authors. Licensee MDPI, Basel, Switzerland. This article is an open access article distributed under the terms and conditions of the Creative Commons Attribution (CC BY) license (http://creativecommons.org/licenses/by/4.0/).
Share and Cite
MDPI and ACS Style
Šujanová, P.; Rychtáriková, M.; Sotto Mayor, T.; Hyder, A. A Healthy, Energy-Efficient and Comfortable Indoor Environment, a Review. Energies 2019, 12, 1414. https://doi.org/10.3390/en12081414
AMA Style
Šujanová P, Rychtáriková M, Sotto Mayor T, Hyder A. A Healthy, Energy-Efficient and Comfortable Indoor Environment, a Review. Energies. 2019; 12(8):1414. https://doi.org/10.3390/en12081414
Chicago/Turabian StyleŠujanová, Paulína, Monika Rychtáriková, Tiago Sotto Mayor, and Affan Hyder. 2019. "A Healthy, Energy-Efficient and Comfortable Indoor Environment, a Review" Energies 12, no. 8: 1414. https://doi.org/10.3390/en12081414
Note that from the first issue of 2016, this journal uses article numbers instead of page numbers. See further details here.