Static Operational Impacts of Residential Solar PV Plants on the Medium Voltage Distribution Grids—A Case Study Based on the Danish Island Bornholm


Center for Electric Power and Energy (CEE), Technical University of Denmark (DTU), 2800 Kgs. Lyngby, Denmark
*
Author to whom correspondence should be addressed.
Energies 2019, 12(8), 1458; https://doi.org/10.3390/en12081458
Submission received: 14 March 2019
/
Revised: 11 April 2019
/
Accepted: 15 April 2019
/
Published: 17 April 2019
(This article belongs to the Special Issue Integration of PV in Distribution Networks)
Abstract
:Driven by the Energy Strategy 2050 of Denmark, renewable energy sources (RESs) are increasingly integrated into the Danish power grid. Solar photovoltaic (PV) plants play an important role in this process. This paper conducted a study to investigate the impacts of residential solar PV integration in the distribution grid on voltage security and grid loss based on the 10 kV distribution grid in Bornholm. Three case studies are performed to test three different reactive power control methods, i.e., PF(P), constant PF and constant Q, at different penetration levels. The assessment of the impacts of PV integration and different control methods are done in the DIgSILENT PowerFactory. It was found that PV integration can contribute to reducing the loss of the system, increased overvoltage in buses and overload in transformers, and 40% penetration at the low voltage is considered to be an optimal level based on the result. PF(P) control gives the best performance among all three methods under the current grid codes. With constant PF control, it was found that the system loss can be significantly reduced if the PV systems operate with a power factor of 0.9 leading, which is not the norm of the current Danish grid code.
1. Introduction
1.1. Background
Due to the global concern of climate change, there is an increasing demand for integrating renewable energy into power systems. Renewable energy sources (RESs) such as wind, solar and hydro are widely implemented worldwide because of their abundant resources in nature. Denmark has set the goal of achieving 100% independence of conventional fossil fuels by 2050 [1,2].
Thanks to the decreasing cost of solar photovoltaic (PV) technology, the competitiveness of solar PV has been increasing. Solar PV has now become the second most implemented RES in Denmark, with a total installed capacity of 927.6 MW by January 2019, equivalent to about 2.5% of the total consumption in Denmark, and it is expected to reach 1.75 GW by 2020 (about 5% of the total consumption) and 3 GW by 2025 (about 8% of the total consumption) according to the forecasting made by the Danish Energy Agency in early 2016 [3].
Reliable PV generation can provide considerable electric energy to the grid and loads, and modern power electronic technology enables solar PV inverters to provide different grid support functions at the same time. Solar PV power plants in Denmark are integrated into the distribution grids, most of which are installed as roof-top modules in residential areas at the low voltage (LV, 0.4 kV) level. The residential PV systems are usually smaller in size compared to other renewable energy generation units in the grid-like wind turbines, and LV networks are mostly located at the deep end of the distribution grids. These situations make the system operators hold doubts about having a large amount of PV systems integrated into the grid because the controllability and benefits of the PV systems are difficult to be harnessed by the operators. On the other hand, due to the decreasing price and development of related technology, system operators, including both transmission system operators (TSOs) and distribution system operators (DSOs), have realized the opportunities to use solar PV systems to provide ancillary services to the grids. There are many different projects working on increasing the penetration level and utilization of PV systems [4,5].
1.2. State-of-the-Art
Upon the conclusions drawn from previous studies, it is found that the integration of solar PV can cause increased power loss and voltage rises. Furthermore, due to the intermittent nature of solar energy, the increasing share of solar PV systems and other types of RESs in modern electric power systems can introduce other challenges in operation and supply security, stability and protection aspects. A sudden change in either demand or generation can likely cause severe frequency deviations and voltage fluctuations, and frequency and voltage stability problem may occur, causing blackouts in the worst case. Because peak generation from solar PV usually happens around noon and the demand is usually low during this period, power surplus must be exported, which potentially causes congestion. Besides, during fault situations, fault current contribution from PV systems is also crucial to the protection scheme operation. The harmonics from PV systems have also been widely studied. Given this situation, different projects, such as PVIB, PVNET.dk, and MetaPV, and many other studies worldwide like programmes organized by PVPS and CIGRE are devoted to investigating PV integration in the distribution grid from both the technical and economic aspects. These researchers have investigated the challenges of large-scale PV integration in the distribution grid, and multiple feasible solutions and recommendations are given from the perspective of grid operators [6,7,8,9,10,11,12,13,14,15,16,17].
From the previous studies in PV integration, it is found that voltage rise at buses is the key problem. Different strategies are proposed as valid and feasible solutions to solve relevant problems, including grid reinforcement [14,18,19], active power curtailment [20,21,22], reactive power control [23,24,25] and implementation of electric energy storage systems (EESSs) [26,27,28].
Grid reinforcement or reconfiguration is a conventional solution to the voltage fluctuation and congestion problem, especially when the thermal limit of system components is hit. However, gird reinforcements can result in high costs and low efficiency, and it is therefore suggested to avoid this solution if alternatives are applicable [12,17]. Active power curtailment means that some of the PV systems deviate from their maximum generation or disconnect from the grid, and it is less economical and efficient for the owners. It is the option when it is the most economical solution or when other options are not sufficient to regulate the voltage [12,28]. Reactive power control or volt-var control (as named in some of the literature), has been proved to be beneficial and efficient in both the technical and economical perspectives [29,30,31,32,33]. In some countries, including Denmark, PV power plants are required to provide reactive power even during the night for the purpose of voltage profile regulation (e.g., the Q@night function). Commonly adopted reactive power control methods include (1) constant reactive power (constant Q) control, (2) constant power factor (constant PF) control and (3) dynamic power factor (PF(P)) control [34]. PV power plants above 11 kW should also be capable of providing dynamic reactive power support (Q(U)) [35]. However, for the PV systems close to the transformer stations, Q(U) control is not as effective as the other two methods because the voltage at such locations is normally very stable. The PV-storage system, i.e., the hybrid system consisting of PV and an EESS-like battery is another efficient solution. Many studies such as PVST are conducted to investigate the grid connectivity of batteries and the interoperability between PV and batteries, such as charging/discharging strategies of batteries, reactive power support from batteries and performance during faults. Such PV-storage systems have been implemented worldwide for power grid regulation, peak shaving, increasing self-consumption and backup power supply. Currently, in Denmark, many Li-ion battery manufacturers have shown interests in the PV market. However, the trade-off between the contribution to grid regulation and the cost should be taken into consideration, and different battery materials and technologies also affect the effectiveness of PV-storage systems and the market operation [3,36,37,38,39,40]. Besides the stationary EESS-like-battery, the electric vehicle (EV) is also an option. Thanks to smart charging solutions developed for EV chargers such as “Vehicle to Grid (V2G)”, EVs can actively participate in grid voltage and frequency regulation [41,42].
1.3. The Scope of the Case Study
In other previous research, such as References [43,44,45,46,47,48,49] and the literature referred to above, the studies are mainly focused on the impacts of PV integration within LV networks because most PV systems are directly connected to the LV grid. There are also studies investigating the operation at the MV level, but with PV systems integrated directly at the MV level or with systems in the small scale like IEEE multiple nodes system (up to 2 to 3 hundred buses), or a practical local LV feeder of a few communities, or PV power plants directly connected to the MV grid. However, large-scale PV integration and increasing penetration in multiple LV feeders within the distribution grid can inevitably influence the distribution grid operation at the MV level and the impacts may differ when the system is large in size. Therefore, this paper has performed a case study on the impact of small-scale residential PV systems connected to the LV feeders on the MV level based on the actual distribution grid model (60/10 kV) of Bornholm in Denmark. The system consists of about 4000 MV buses and 1000 MV/LV transformers, covering the entire island of Bornholm. The results are, therefore, more robust since individual LV feeder specialties are eliminated when a large system is used for the test. Besides, both different reactive power control methods and different PV penetration levels are tested.
2. Methods
2.1. The Bornholm Power System
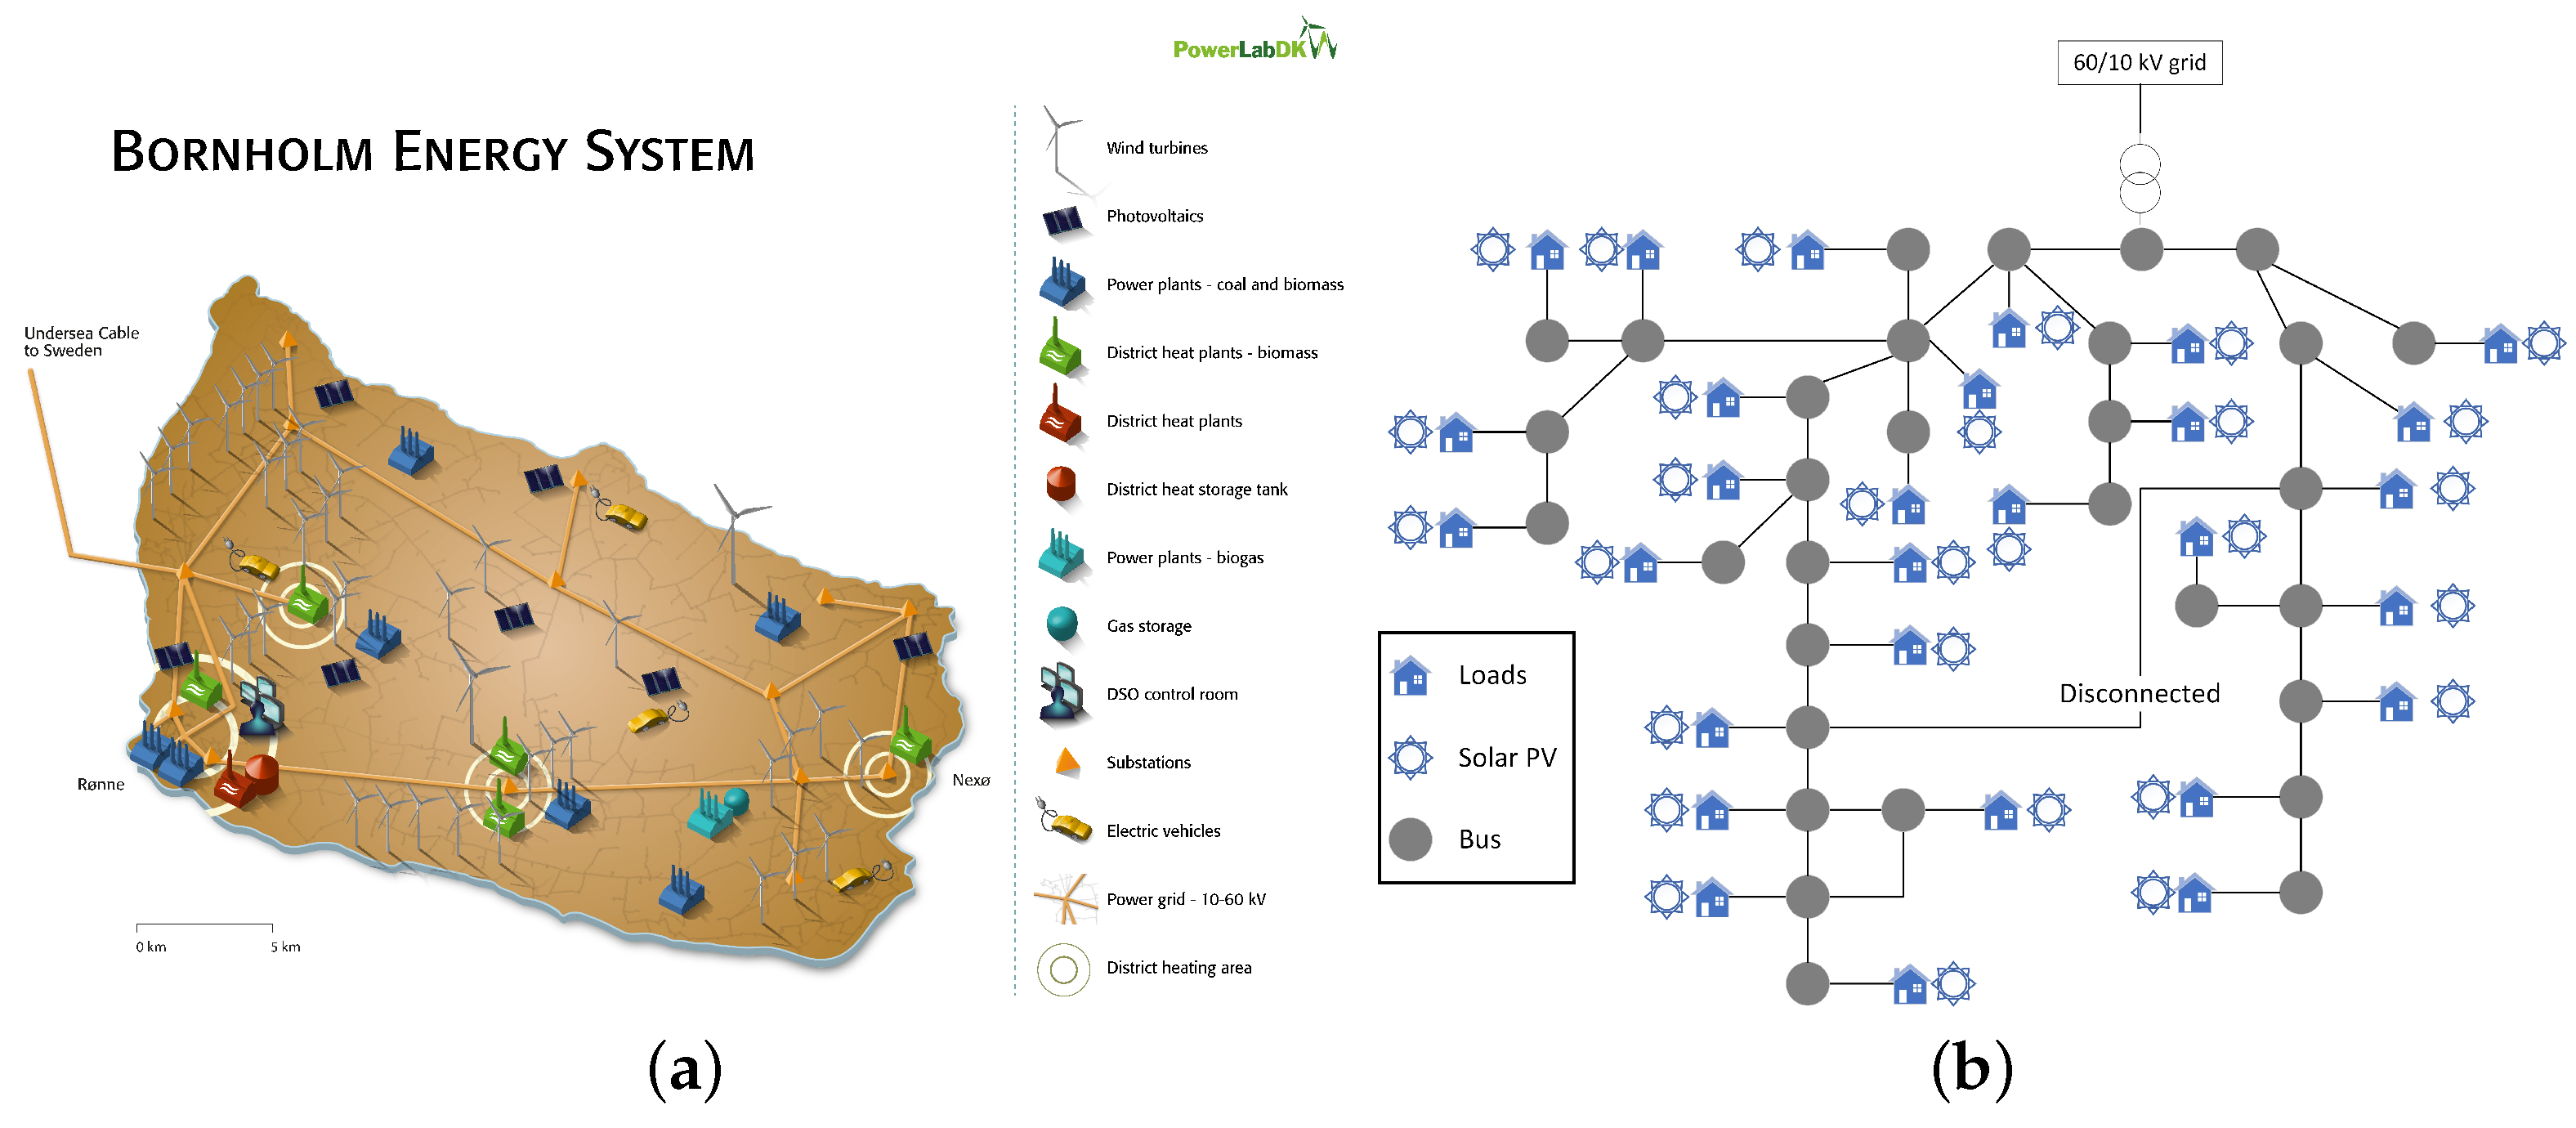
Bornholm is located to the south of Sweden surrounded by the Baltic Sea. The Bornholm power system is connected with the Swedish power system in Hasle via a sea cable but operates in the islanded mode once a year for cable maintenance. Besides the power supply, the Bornholm power system also acts as a full-scale renewable energy laboratory for testing and demonstrating new technologies [50]. A demonstration of the 60/10 kV distribution grid of the Bornholm power system and an example LV feeder in the Bornholm power system are given in Figure 1a,b, respectively.
A comparison of the basic information of the entirety of Denmark and Bornholm and the electric power system parameters is in Table 1 [50,51,52]. By comparing the number of transformer stations, the Bornholm power system is about 1.4% (about ) of the Danish power system in “size”.
By 2018, the total installed capacity of solar PV systems in the Bornholm power system is approximately 22 MW, including 2 centralized PV power plants connected to the MV grid, each with a capacity of 7.5 MW and medium-scale PV system (above and including 6 kW) distributed in multiples LV feeders with a total capacity of about 2.4 MW. The rest are residential systems in the small scale (below 6 kW) installed at the LV level.
In addition to the solar PV power plants, there are also over 30 MW of wind turbines installed on Bornholm [50]. The majority of the wind turbines is connected to 60/10 kV substations in Bornholm through dedicated transformers, which means the wind production will first go on the 60 kV network then to the 10 kV and 0.4 kV networks if PV production is not sufficient to supply the local loads. Otherwise, the flow will be exported to the external grid. The cases causing overvoltage and congestions are mostly in the 0.4 kV and 10 kV grids when PV generation is high. Therefore, the impact of the wind is not considered significant and the configuration of wind farms is seen as constant. Furthermore, the main objective is to observe the tendency of grid performance when more PVs are connected to the grid. The tendency is believed to remain the same if the wind farms are included in the grid model.
2.2. Assessment of the Reactive Power Provision
A study conducted by Aarhus University in 2013 has suggested an optimal energy mix of wind and solar energy of 80% wind energy and 20% solar energy, corresponding to approximately 7000 MW of wind turbines and 7000 MW of PV power plants [53]. An installation capacity of 7000 MW is considered as the 100% PV penetration. Considering the ratio of the “size” of Bornholm to the entirety of Denmark, i.e., 1.4%, the 100% penetration of PV in the Bornholm power system is 100 MW.
The impacts with different PV penetration levels are assessed. There are mainly three ways of defining the RES penetration level in the power system, i.e., (1) the ratio of rated RES power to the local fault level, (2) the ratio of rated RES power to the transformer rating, and (3) the ratio of the RES generation to the total power of the local load [47]. In this paper, the PV penetration level in the Bornholm power system is defined as the ratio of the actual installation capacity to 100 MW. Therefore, the current PV penetration level in the Bornholm power system is 22%, which is the base case in the study.
Different reactive power control methods including PF(P), constant PF and constant Q control are tested. The configurations of the methods are based on Technical Regulation 3.2.1 (TR 3.2.1) and Technical Regulation 3.2.2 (TR 3.2.2), the Danish grid code for power plants up to and including 11 kW and PV power plants above 11 kW, respectively. The demonstration of the methods is shown in Figure 2 [34,35]. The PV inverters usually operate with two types of PF, i.e., lagging and leading PF. From the generator convention, they are defined as
- Lagging PF: equivalent to the over-excited synchronous generator, inverter exports both P and Q, operation in the first quadrant;
- Leading PF: equivalent to the under-excited synchronous generator, inverter exports P and imports Q, operation in the fourth quadrant.
The assessment of the impacts is done by a load flow simulation in the DIgSILENT PowerFactory (Version 2018 SP5, DIgSILENT, Gomaringen, Germany), a power system modeling and simulation software. The load flow is conducted for one complete year with a step of 1 h and there are a total of 8760 calculations (24 h/day × 365 days) for each penetration level. The penetration level increases from the base case to 100%, with increments of 10%. The main observations of the studies include the maximum number of overloaded transformers, the maximum number of overvoltage buses and the power loss of the entire grid (including the loss of cables and transformers in the grid). Overload of transformers is defined as the loading rate higher than 100% and overvoltage in the buses is defined in compliance with the Danish grid codes, where the thresholds for LV (0.4 kV) and MV (10 kV and 60 kV) buses are 1.1 p.u. and 1.2 p.u., respectively [34,35].
In the MV grid model, the LV feeders are represented by aggregated models at the 0.4 kV buses in the MV grid as a constant PF load with a PF of 0.95 lagging [54] instead of using the actual models or the example model given in Figure 1b. Therefore, via the load flow simulation with the MV grid, the loss in the LV feeders cannot be evaluated when the loss of the entire grid is assessed. However, the loss in the LV feeders is not ignorable because of the large number of LV feeders (about 1000). To consider the loss of the LV feeders, the loss of the LV feeders is estimated by running a load flow simulation with the example LV grid model in Figure 1b, which is connected to a 100 kVA transformer, and then added onto the loss obtained from the MV grid model. Because of various transformer capacities, the loss of the LV feeders connected to transformers with a capacity other than 100 kVA is evaluated by scaling the loss obtained from the given example model with the ratio of the actual transformer capacity at the transformer station Sstot to 100, i.e.,
The loss of the feeders connected to transformers with a capacity other than 100 kVA is multiplied by the ratio, rtrans. For instance, the rtrans value of a transformer station of 700 kVA is 7 and the loss of the LV feeder connected to this station is thus calculated by multiplying the loss of the 100 kVA feeder by 7. Only the cable loss in the LV feeder is calculated. The PV systems are treated in the same way, i.e., modeled as aggregated systems at the 0.4 kV buses.
2.3. Load and PV Generation Profile Modeling
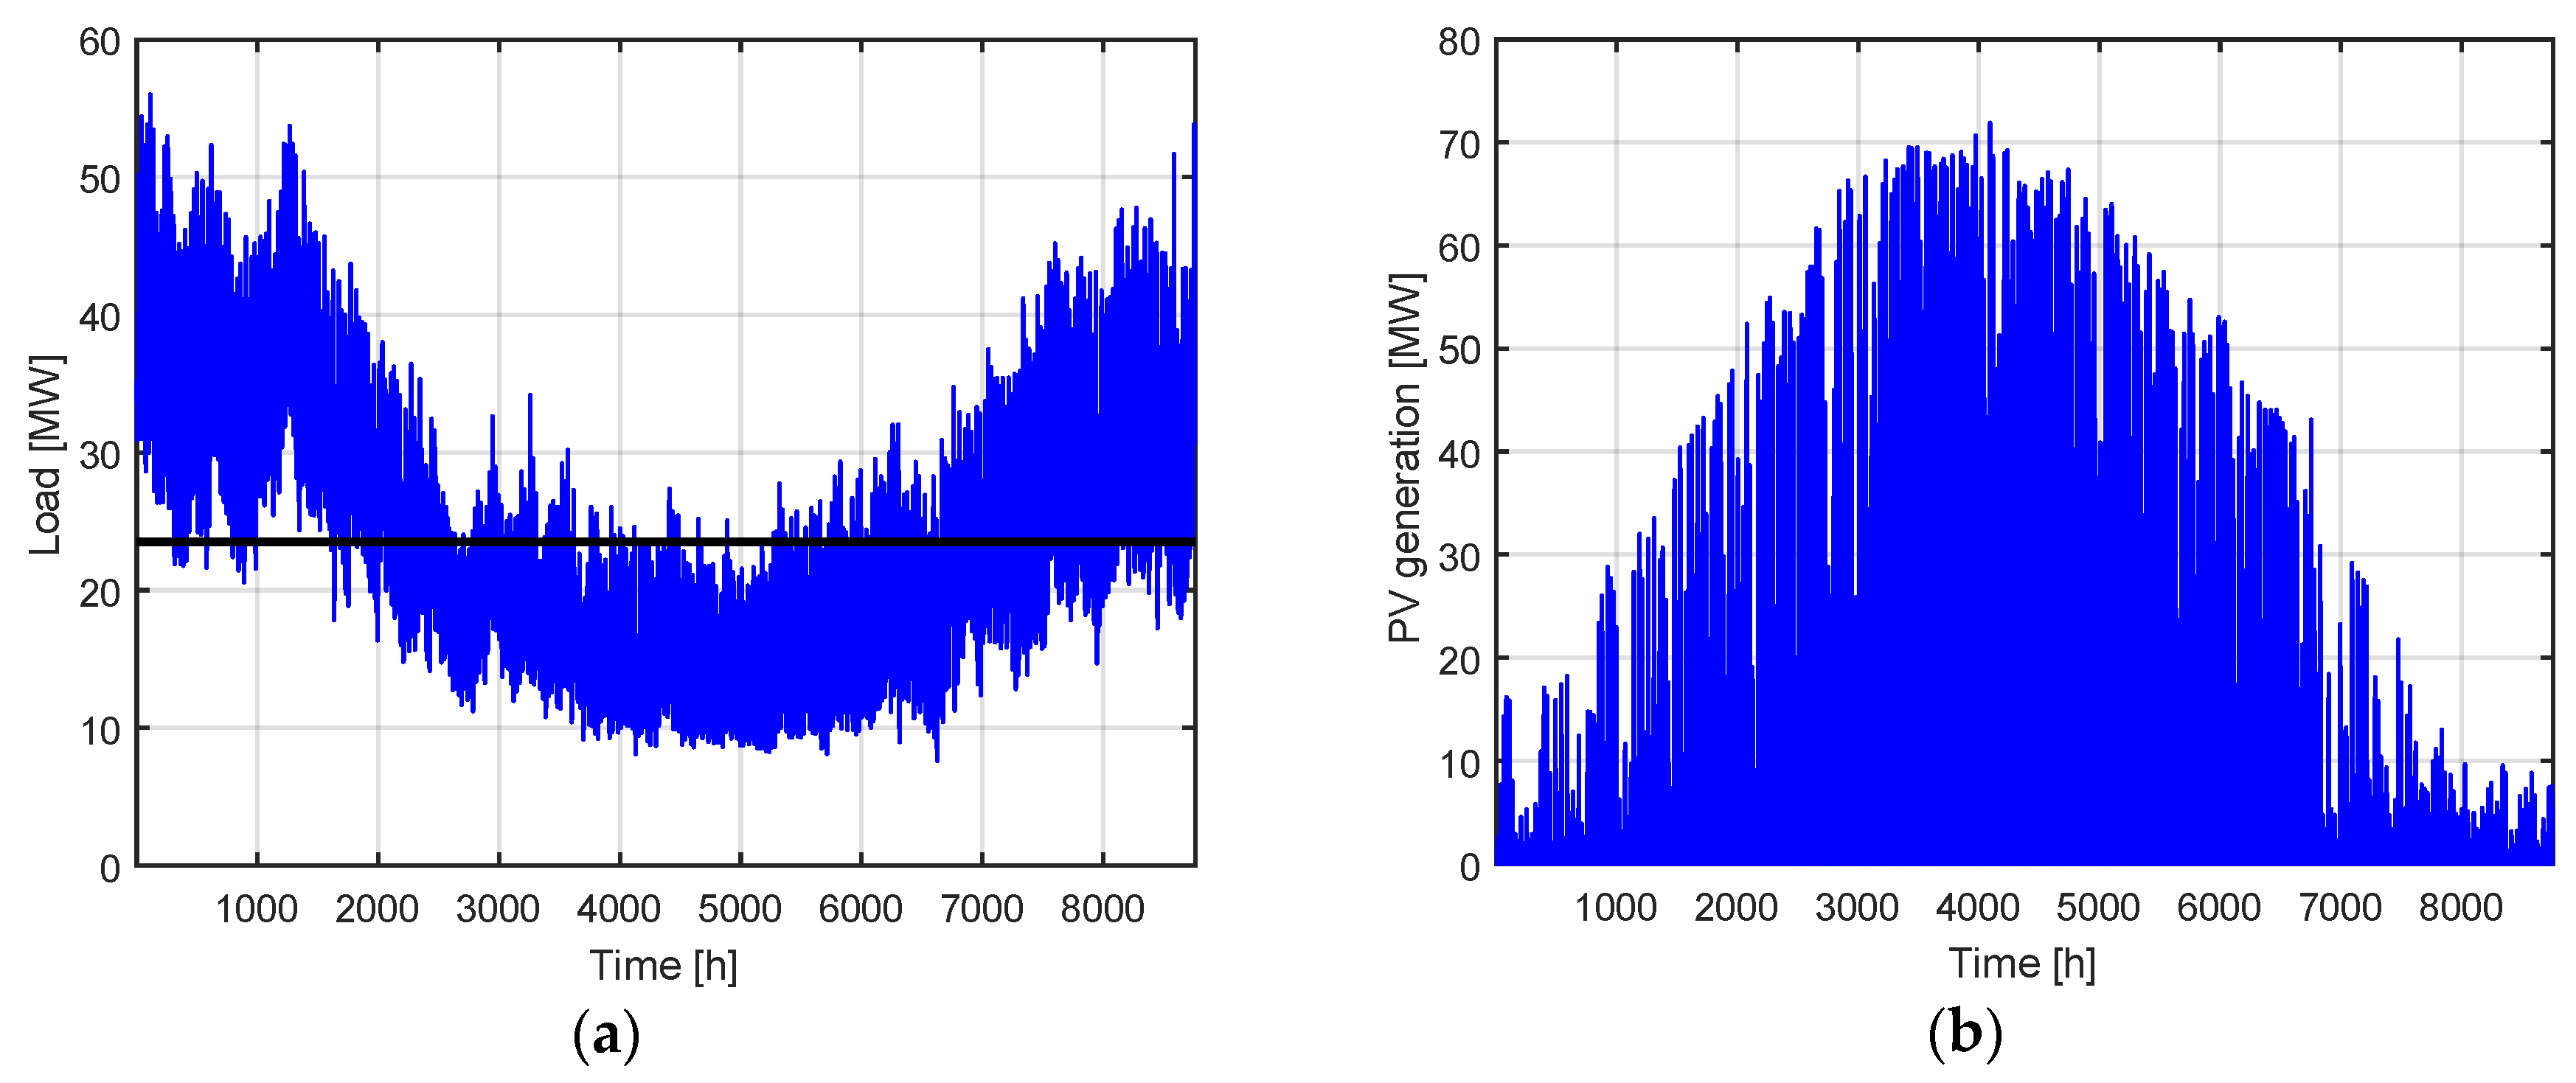
The total load and the PV generation profile of the Bornholm power system are shown in Figure 3a,b, respectively. The black line in Figure 3a is the yearly average load. The load profile is estimated based on the load data from 20 customers of a random LV feeder and the capacities of 10/0.4 kV transformers. Known from Table 1, the peak load of Bornholm, PBp, is 55 MW. This value is then distributed to the load of each transformer station based on the ratio of the total transformer capacity, Sstot, at a specific station to the total capacity of 10/0.4 kV transformers, SBtot. Hence, the peak load of each transformer station, Psp, is
and the corresponding Sstot value of the feeder with the 20 customers can be estimated by its Psp value and Equation (2). By using the ratio calculated by Equation (1), the load profile of a 100 kVA transformer can be obtained and the load profile of the total grid given in Figure 3a, as well as the load profiles of other LV feeders, can be obtained.
Since the total PV installation capacity at each penetration level, PPV tot inst, is specified, the installation capacity at each transformer station is determined in a similar way as the load, i.e., by
The actual PV generation of each PV system is estimated based on the actual weather information, i.e., solar irradiance Gact and ambient temperature Tact, and the standard experiment conditions (SEC), i.e., solar irradiance Gstd = 1000 W/m2 and temperature Tstd = 25 °C, i.e., by
where α is the temperature coefficient of the solar PV panel material, which is assumed to be crystalline silicon (c-Si) in this study. The α value of the commercial c-Si material under the SEC is 0.45% °C−1 [55]. The value of PPV std gen is selected as the full capacity of the PV inverter.
3. Results and Discussion
Three cases are studied corresponding to three reactive power control methods. In the case with PF(P) control applied to all the PV systems in the grid, letting the inverters adjust the reactive power output automatically based on their actual active power generation and with the penetration level increasing from 22% (the base case) to 100%, an optimal penetration is determined based on the main observations. This penetration level is applied to the rest two cases, i.e., cases with constant PF and constant Q control. Different PF and Q setpoints are tested.
3.1. PF(P) Control
The power loss of the entire system at different PV penetration levels is presented in Figure 4. The loss is evaluated by its yearly average, namely, calculated by taking the average of the loss over the complete (8760 h). It is seen from Figure 4 that the loss first decreases and then increases as the PV penetration level increases from the base case (22%) to 100%, and the lowest power loss, in this case, appears when the penetration level is between 40% and 50%. By comparing it with the yearly average load in Figure 3a (around 23.5 MW), the loss is generally lower than 5% of the yearly average load which is at an acceptable level. From this result, it can be verified that having certain penetration levels of PV systems in the grid can contribute to reducing the loss in the grid.
The loss decrease at the beginning is because of the increasing self-sufficiency of the load from the installed local PV systems, meaning that the PV generation can partly or even fully meet the load demand and less power is required from the grid. The loss is thus reduced. The power loss increase after 50% penetration is because of the power surplus from PV generation injected into the grid. As the penetration increases, the power exported to the grid increases and the loss increases.
The overvoltage situations of all buses (including 0.4 kV, 10 kV and 60 kV buses) are presented in Figure 5, reflecting the worst situation at each penetration level within one year by giving the maximum number of buses with the overvoltage problem and the maximum voltage magnitude among all buses during the year. It is seen from Figure 5 that the overvoltage problem only occurs to the 0.4 kV buses within the grid. The results in Figure 5b indicate that although the voltage rise at the 10 kV and 60 kV buses become more and more severe as the penetration level increases, the voltage magnitude is still within the tolerance. The overvoltage problem mostly occurs when the PV generation is much higher than the demand from the load. The overload issues of all the transformers (including both the 60/10 kV and 10/0.4 kV transformers) are depicted in Figure 6, presenting the worst situation at different penetration levels by giving the maximum number of overloaded transformers and the highest loading rate among all the transformers during the year.
From Figure 6, it is seen that although the maximum loading rate of transformers keeps growing as the PV penetration level increases, the maximum number of overloaded transformers remains the same. The overloading problem mainly occurs when there is a big difference between PV generation and demand, where power surplus exists and the needs are exported, or extra power needs are imported.
By combining the results in Figure 4, Figure 5 and Figure 6, it is determined that 40% is an optimal penetration level because the grid has the lowest loss with this penetration level and the maximum number of overvoltage buses and the maximum loading rate of transformers increase more rapidly when the penetration level is above 40%. This penetration level is applied to the next two case studies.
3.2. Constant PF Control
This case is done with the comparison between the base case and the 40% PV penetration, i.e., the optimal penetration level determined from the previous case. Although residential PV systems with constant PF control only operate in the first quadrant with lagging and unity PF, i.e., exporting P and Q, according to TR 3.2.1 [34], the operation in the fourth quadrant, i.e., exporting P and importing Q, is tested because of the large number of cables in the grid. Cables are capacitive components and consume capacitive reactive power. The setpoint of PF ranges from 0.8 (lagging) to unity and to 0.8 (leading), with a step of 0.1, corresponding to the inverter exporting and importing reactive power.
The power loss of the entire system, in this case, is shown in Figure 7, calculated by taking the average of the loss in the year. The lagging and leading PF are labeled as “lg” and “ld” on the x-axis, respectively, in the figure, and this representation applies for the rest of the figures in this section. From the comparison between the base case and the 40% penetration in Figure 7, it is seen that the loss is generally lower with 40% penetration and that the effects on the system power loss by different PF setpoints are less effective with a relatively lower PV penetration level. The loss is generally below 5% of the yearly average load, which is an acceptable level. With 40% PV penetration, the loss keeps decreasing in the leading PF zone and reaches its minimum when the PF is 0.9 (leading). The loss, in this case, with a PF of 0.9 (leading) is lower than the loss in the previous case on average at the same PV penetration level.
Because of the large number of cables in the Bornholm power system, the grid is more capacitive and consumes more capacitive reactive power. Seen from the average power loss, as a general trend, it is implied that PV systems operating with leading PF, i.e., importing reactive power, can help reduce the loss of grids with a large number of cables. Under some specific circumstances, it can still be beneficial to operate with lagging PF even with many cables.
The overvoltage situation, in this case, is plotted in Figure 8, reflecting the worst situation with different PF setpoints by giving the maximum number of overvoltage buses and the maximum voltage magnitude within this year. A comparison between the base case and 40% penetration is also included in Figure 8. Identical to the previous case, the overvoltage problem only occurs to the LV buses. The voltage rise problem gets improved as the PF setpoint changes from lagging to unity and then to leading. Likewise, the overvoltage problems normally occur when the PV generation is higher than the demand from the load.
In the previous case, the PV systems with PF(P) control operate between the unity PF and 0.95 (leading), i.e., absorbing reactive power. With PF values in this range, the overvoltage problem, in this case, is more improved than the previous one. However, on the other hand, the overvoltage problem with lagging PF is fairly severe.
The overloading situations of the transformers are presented in Figure 9. The results in Figure 9 reflect the worst situation in this case. According to the complete result dataset, only very few (2 to 3) transformers are in the extremely severe overloading state (over 200%) for a very short period. A similar situation can also be found in the next case with a constant Q control in the next section. By comparing Figure 9 and Figure 6 from the previous case, the overloading situations in these two cases are close to each other at the same penetration level. The overload problem usually takes place when there is a big mismatch between the PV generation and the load demand.
3.3. Constant Q Control
Because the constant Q support is not required for residential PV systems in the small scale [35], in this case, the constant Q control is only implemented to the medium-scale PV systems and the two large centralized PV power plants. The rest, namely, the small-scale residential PV systems, are set to constant PF control with a unity power factor. In this way, the impact of a constant Q control can be assessed more intuitively. From the correlation between active, reactive and apparent power, i.e., , the maximum reactive power, in theory, can be provided by a PV system without affecting the normal generation of approximately 70% of its apparent power. The Q setpoint, in this case, ranges from 10% to 70% of the apparent power, with an increment of 20%. In this case, only the operation within the first quadrant, i.e., exporting P and Q, is tested.
The power loss of the entire grid is presented in Figure 10. It is directly seen that the loss increases as the Q setpoint increases, which is caused by the mismatch between the reactive power provided by the PV systems and the reactive power demanded from the grid. Compared with the power loss from the previous two cases, the loss, in this case, is the highest, equivalent to 6% to 7% of the average load.
The overvoltage situations of all the buses, in this case, are presented in Figure 11 where the worst situation is given by the maximum number of overvoltage buses and the maximum voltage magnitude. Similar to the previous case, the overvoltage problem only occurs to LV buses, in this case, and the voltage rise becomes more severe as the PV penetration level and the Q setpoint increase. The overvoltage problem mostly takes place when the PV generation is higher than the load. As the Q setpoint increases, the voltage rise problem becomes more and more severe, as expected, because PV inverters export reactive power to perform upward regulation on the voltage profile when there is an undervoltage problem in the grid. By comparing with the results in Figure 5 and Figure 7, the overvoltage problem, in this case, is the most severe.
The worst overload situations of all the transformers are presented in Figure 12. Compared with the results presented in Figure 5 and Figure 9, the overall overload situation, in this case, is close to those of the previous two cases. Additionally, it can also be observed from Figure 12b that increasing the output of the reactive power can make the overload problems in the 10/0.4 kV transformers worse, regardless of the PV penetration level, which is also the cause of the increasing power loss of the system.
The same as the previous two cases, the transformers usually operate under the overload state when the PV generation is higher than the load demand where the power surplus needs to be exported or the opposite situation where more power is required by the loads.
3.4. Summary of Case Studies
The analysis and discussion regarding the results of the three case studies, including the power loss of the entire grid, the number of overvoltage buses and the number of overloaded transformers, are summarized in Table 2 and Table 3. The results of the case with PF(P) control applied are given by numbers at a specific PV penetration level, while the results of the case with constant PF control applied are given with the results corresponding to the optimal PF setpoint, i.e., 0.9 (leading). The results of the case with constant Q control applied are presented as a range aligned from the lowest to the highest value. The columns “Number of overvoltage bus” and “Maximum bus voltage” only refer to the 0.4 kV buses because the 10 kV and 60 kV buses do not have the overvoltage problem. In the columns “The maximum transformer loading rate”, the highest loading rate is listed regardless of the transformer type.
4. Conclusions
From the results summarized in Table 2 and Table 3, it can be concluded that integrating the solar PV into the distribution grid until a certain penetration level can contribute to reducing the power loss of the grid, regulating the voltage profile and relieving the transformer loading, but the situation can go towards the opposite direction if the penetration is higher than this specific level. In the point of view of the Bornholm power system in this paper, the optimal penetration level is 40%. The PV integration at the LV level has influences on the MV level in both the positive and negative aspects.
Large-scale PV integration can cause a voltage rise in both the LV and MV networks. In this case, based on the LV feeder model and MV grid model used in this study, no overvoltage problem is caused at the MV level although a voltage rise occurs. It should be noticed that this conclusion is considered “case dependent” because the overvoltage in the MV grid can be affected by the topologies of the LV feeders and the MV grid. With different LV feeder or MV grid models, the situation can be different. However, the general trends have revealed that it is beneficial to the grid operation if the reactive power control methods are appropriately implemented. In terms of the worst cases given in Table 2 and Table 3, the integration does not affect the overload of the transformers significantly. However, observed from the overload situations presented in Figure 6, Figure 9 and Figure 12, increasing the penetration can aggravate the overloading problem. The PV integration has more impacts on the 10/0.4 kV transformers than the 60/10 kV ones.
Different reactive power control methods have different effects on these problems. With the PF(P) control, the power loss and the overload problem in the transformers are the lowest among all the three cases. From this aspect, the PF(P) control shows the best performance in all three case studies. With the constant PF control, the lowest power loss of the entire grid occurs if the PV systems operate with a PF of 0.9 (leading), which is not required by the current Danish grid code for small scale residential PV plants, i.e., TR 3.2.1. Judging from the yearly average power loss condition, it can be beneficial to operate PV systems with leading PF, especially in the grid with many cables. In terms of the worst overvoltage situation, constant PF control results in the lowest maximum bus voltage. With a constant Q control applied to large-scale PV power plants, the grid has the highest loss and experiences the most severe overvoltage problem among all three cases.
Author Contributions
Z.W. contributed to the simulation and writing of the manuscript. G.Y. contributed to the conceptualization and the methodology formulation.
Funding
This research was funded by Danish ForskEL project “A Live PV Testing Platform for Larger Adaption (PVTP)”, grant no. 12421.
Conflicts of Interest
The authors declare no conflict of interest.
References
- The Danish Ministry of Climate, Energy and Building. Energy Strategy 2050—From Coal, Oil and Gas to Green Energy; The Danish Ministry of Climate, Energy and Building: Copenhagen, Denmark, 2011. [Google Scholar]
- International Energy Agency (IEA). Energy Policies of IEA Countries: Denmark—2017 Review; International Energy Agency (IEA): Fribourg, Switzerland, 2017. [Google Scholar]
- International Energy Agency (IEA). Photovoltaic Power System Program PVPS Annual Report 2017; International Energy Agency (IEA): Fribourg, Switzerland, 2018. [Google Scholar]
- Alet, P.-J.; Baccaro, F.; De Felice, M.; Efthymiou, V.; Mayr, C.; Graditi, G.; Juel, M.; Moser, D.; Petitta, M.; Tselepis, S.; et al. Quantification, challenges and outlook of PV integration in the power system: A review by the European PV Technology Platform. In Proceedings of the 31st European Photovoltaic Solar Energy Conference and Exhibition (EU PVSEC 2015), Hamburg, Germany, 14–18 September 2015. [Google Scholar]
- Alet, P.-J.; Baccaro, F.; De Felice, M.; Efthymiou, V.; Mayr, C.; Graditi, G.; Juel, M.; Moser, D.; Petitta, M.; Tselepis, S.; et al. Photovoltaics Merging with the Active Integrated Grid: Grid Integration White Paper of the EU PV Technology Platform, Working Group on Grid Integration; European Technology and Innovation Platform Photovoltaics: Neuchâtel, Switzerland, 2015. [Google Scholar]
- Singh, S.N.; Østergaard, J.; Jain, N. Distributed Generation in Power Systems: An Overview and Key Issues. In Proceedings of the 24th Indian Engineering Congress, Kerale, India, 10–13 December 2009. [Google Scholar]
- Adefarati, T.; Bansal, R.C. Integration of renewable distributed generators into the distribution system: A review. IET Renew. Power Gener. 2016, 10, 873–884. [Google Scholar] [CrossRef]
- Zsiborács, H.; Vincze, A.; Csányi, S.; Vincze, A.; Pintér, C. Economic Analysis of Grid-Connected PV System Regulations: A Hungarian Case Study. Electronics 2019, 8, 149. [Google Scholar] [CrossRef]
- Yang, G.; Hou, P.; Sera, D.; Martins, J.P.R.; Douglass, P.J.; Martens, S.; Johansen, P.M.; Svendsen, D.K.; Moth, K. Integration of PV+Storage—Technical and Economic Evaluation at Distribution Grids. In Proceedings of the 8th Integration Workshop on the Integration of Solar Power into Power Syatems, Stockholm, Sweden, 15–16 October 2018. [Google Scholar]
- Dierckxsens, C.; Woyte, A.; Bletterie, B.; Zegers, A.; Deprez, W.; Dexters, A.; Van Roey, K.; Lemmens, J.; Lowette, J.; Nulens, K.; et al. Cost-Effective Integration of Photovoltaics in Existing Distribution Grids: Results and Recommendations; MetaPV: Brussels, Belgium, 2015. [Google Scholar]
- Project PV Island Bornholm (PVIB). Available online: https://ses.jrc.ec.europa.eu/pv-island-bornholm (accessed on 22 January 2019).
- Mateo, C.; Frías, P.; Cossent, R.; Sonvilla, P.; Barth, B. Overcoming the barriers that hamper a large-scale integration of solar photovoltaic power generation in European distribution grids. Sol. Energy 2017, 153, 574–583. [Google Scholar] [CrossRef]
- Katiraei, F.; Agüero, J.R. Solar PV Integration Challenges. IEEE Power Energy Mag. 2011, 9, 62–71. [Google Scholar] [CrossRef]
- Hashemi, S.; Østergaard, J. Methods and strategies for overvoltage prevention in low voltage distribution systems with PV. IET Renew. Power Gener. 2017, 11, 205–214. [Google Scholar] [CrossRef] [Green Version]
- Comello, S.; Reichelstein, S.; Sahoo, A. The road ahead for solar PV power. Renew. Sustain. Energy Rev. 2018, 92, 744–756. [Google Scholar] [CrossRef]
- Yang, G.; Kjær, S.B.; Frederiksen, K.H.B.; Ipsen, H.H.; Refshauge, R.H. PVNET Final Report—PV Integration Studies; DTU Library: Kgs. Lyngby, Denmark, 2016. [Google Scholar]
- Kjær, S.B.; Lazar, R.D.; Constantin, A.; Ballegaard, H.P.; Yang, G.; Østergaard, J.; Ipsen, H.H.; Frederiksen, K.H.B. Voltage control in low voltage networks by Photovoltaic Inverters—PVNET.dk. In Proceedings of the 28th European Photovoltaic Solar Energy Conference and Exhibition (EU PVSEC 2013), Villepinte, France, 30 September–4 October 2013. [Google Scholar] [CrossRef]
- Steen, D.; Goop, J.; Göransson, L.; Nursbo, S. Challenges of Integrating Solar and Wind into the Electricity Grid. In Systems Perspectives on Renewable Power; Sandén, B., Ed.; Chalmers University of Technology: Göteborg, Sweden, 2015; Chapter 9; pp. 9–107. ISBN 9789198097405. [Google Scholar]
- CIGRE. CIGRE Working Group C6.24: Capacity of Distribution Feeders for Hosting DER; CIGRE: Paris, France, 2014. [Google Scholar]
- Kraiczy, M.; Fakhri, L.A.; Stetz, T.; Braun, M. Do It Locally: Local Voltage Support by Distributed Generation—A Management Summary: Management Summary of IEA Task 14 Subtask 2—Recommendations Based on Research and Field Experience; IEA Internation Energy Agency: Fribourg, Switzerland, 2017. [Google Scholar]
- Collins, L.; Ward, J.K. Real and reactive power control of distributed PV inverters for overvoltage prevention and increased renewable generation hosting capacity. Renew. Energy 2015, 81, 464–471. [Google Scholar] [CrossRef]
- Tonkoski, R.; Lopes, L.A.C.; El-Fouly, T.H.M. Coordinated Active Power Curtailment of Grid Connected PV Inverters for Overvoltage Prevention. IEEE Trans. Sustain. Energy 2011, 2, 139–147. [Google Scholar] [CrossRef]
- Juamperez, M.; Yang, G.; Kjær, S.B. Voltage regulation in LV grids by coordinated volt-var control strategies. J. Mod. Power Syst. Clean Energy 2014, 2, 319–328. [Google Scholar] [CrossRef] [Green Version]
- Molina-garcía, Á.; Mastromauro, R.A.; García-Sánchez, T.; Pugliese, S.; Liserre, M.; Stasi, S. Reactive Power Flow Control for PV Inverters Voltage Support in LV Distribution Networks. IEEE Trans. Smart Grid 2017, 8, 447–456. [Google Scholar] [CrossRef]
- Liu, X.; Cramer, A.M.; Liao, Y. Reactive power control methods for photovoltaic inverters to mitigate short-term voltage magnitude fluctuations. Electr. Power Syst. Res. 2015, 127, 213–220. [Google Scholar] [CrossRef]
- Yang, G.; Marra, F.; Juamperez, M.; JÆR, S.B.K.; Hashemi, S.; Østergaard, J.; Ipsen, H.H.; Frederiksen, K.H.B. Voltage rise mitigation for solar PV integration at LV grids: Studies from PVNET.dk. J. Mod. Power Syst. Clean Energy 2015, 3, 411–421. [Google Scholar] [CrossRef]
- Hashemi Toghroljerdi, S.; Østergaard, J.; Yang, G. Effect of reactive power management of PV inverters on need for energy storage. In Proceedings of the 39th IEEE Photovoltaic Specialists Conference, Tampa, FL, USA, 18–21 June 2013. [Google Scholar] [CrossRef]
- Karimi, M.; Mokhlis, H.; Naidu, K.; Uddin, S.; Bakar, A.H.A. Photovoltaic penetration issues and impacts in distribution network—A review. Renew. Sustain. Energy Rev. 2016, 53, 594–605. [Google Scholar] [CrossRef]
- Abdelmotteleb, I.; Gómez, T.; Chaves-Avila, J.P. Benefits of PV Inverter Volt-Var Control on Distribution Network Operation. In Proceedings of the 12th IEEE Power and Energy Society PowerTech Conference, Manchester, UK, 18–22 June 2017. [Google Scholar] [CrossRef]
- Wang, L.; Yan, R.; Saha, T.K. Voltage Management for Large Scale PV Integration into Weak Distribution Systems. IEEE Trans. Smart Grid 2018, 9, 4128–4139. [Google Scholar] [CrossRef]
- Alatrash, H.; Amarin, R.A.; Lam, C. Enabling large-scale PV integration into the grid. In Proceedings of the 2012 IEEE Green Technologies Conference, Tulsa, OK, USA, 19–20 April 2012. [Google Scholar] [CrossRef]
- Fuchs, A.; Demiray, T. Large-scale PV integration strategies in distribution grids. In Proceedings of the 2015 IEEE Eindhoven PowerTech, Eindhoven, Netherlands, 29 June–2 July 2015. [Google Scholar] [CrossRef]
- Ranaweera, I.; Midtgård, O.M.; Korpås, M. Distributed control scheme for residential battery energy storage units coupled with PV systems. Renew. Energy 2017, 113, 1099–1110. [Google Scholar] [CrossRef] [Green Version]
- Energinet. Technical Regulation 3.2.1 for Power Plants up to and Including 11 kW; Energinet: Fredericia, Denmark, 2016. [Google Scholar]
- Energinet. Technical Regulation 3.2.2 for PV Power Plants Above 11 kW; Energinet: Fredericia, Denmark, 2016. [Google Scholar]
- Tant, J.; Geth, F.; Six, D.; Tant, P.; Driesen, J. Multiobjective Battery Storage to Improve PV Integration in Residential Distribution Grids. IEEE Trans. Sustain. Energy 2013, 4, 182–191. [Google Scholar] [CrossRef] [Green Version]
- Schopfer, S.; Tiefenbeck, V.; Staake, T. Economic assessment of photovoltaic battery systems based on household load profiles. Appl. Energy 2018, 223, 229–248. [Google Scholar] [CrossRef]
- Zsiborács, H.; Baranyai, N.H.; Vincze, A.; Haber, I.; Pintér, G. Economic and Technical Aspects of Flexible Storage Photovoltaic Systems in Europe. Energies 2018, 11, 1445. [Google Scholar] [CrossRef]
- Karimi, Y.; Oraee, H.; Guerrero, J.M.; Vasquez, J.C.; Savaghebi, M. Method for Load Sharing and Power Management in a Hybrid PV/Battery Source Islanded Microgrid. In Proceedings of the IEEE 7th Power Electronics and Drive Systems Technologies Conference (PEDSTC), Tehran, Iran, 16–18 February 2016. [Google Scholar] [CrossRef]
- PV + Storage—Operation and Economics. Available online: https://energiforskning.dk/en/node/9129 (accessed on 6 April 2019).
- Marra, F.; Yang, G.; Fawzy, Y.T.; Træholt, C.; Larsen, E.; Garcia-Valle, R.; Jensen, M.M. Improvement of Local Voltage in Feeders With Photovoltaic Using Electric Vehicles. IEEE Trans. Power Syst. 2013, 28, 3515–3516. [Google Scholar] [CrossRef]
- Hannan, M.A.; Hoque, M.M.; Mohamed, A.; Ayob, A. Review of energy storage systems for electric vehicle applications: Issues and challenges. Renew. Sustain. Energy Rev. 2017, 69, 771–789. [Google Scholar] [CrossRef]
- Balamurugan, K.; Srinivasan, D.; Reindl, T. Impact of distributed generation on power distribution systems. Energy Procedia 2012, 25, 93–100. [Google Scholar] [CrossRef]
- Bayer, B.; Matschoss, P.; Thomas, H.; Marian, A. The German experience with integrating photovoltaic systems into the low-voltage grids. Renew. Energy 2018, 119, 129–141. [Google Scholar] [CrossRef] [Green Version]
- Chattopadhyay, R.; Bhattacharya, S.; Foureaux, N.C.; Pires, I.A.; de Paula, H.; Moraes, L.; Cortizio, P.C.; Silva, S.M.; Filho, B.C.; de S. Brito, J.A. Low voltage PV power integration into medium voltage grid using high voltage SiC devices. In Proceedings of the 2014 International Power Electronics Conference (IPEC-Hiroshima 2014—ECCE ASIA), Hiroshima, Japan, 18–21 May 2014. [Google Scholar] [CrossRef]
- Hanser, P.; Lueken, R.; Gorman, W.; Masha, J.; Group, T.B. The practicality of distributed PV-battery systems to reduce household grid reliance. Util. Policy 2017, 46, 22–32. [Google Scholar] [CrossRef]
- Schwaegerl, C.; Bollen, M.H.J.; Karoui, K.; Yagmur, A. Voltage control in distribution systems as a limitation of the hosting capacity for distributed energy resources. In Proceedings of the 18th International Conference and Exhibition on Electricity Distribution, Turin, Italy, 6–9 June 2005. [Google Scholar] [CrossRef]
- Sarabia, A.F. Impact of Distributed Generation on Distribution System. Master’s Thesis, Aalborg University, Aalborg, Denmark, 2011. [Google Scholar]
- Mustafa, G. Control and Protection in Low Voltage Grid with Large Scale Renewable Electricity Generation. Ph.D. Thesis, Aalborg University, Aalborg, Denmark, 2014. [Google Scholar]
- Østergaard, J.; Nielsen, J.E. The Bornholm Power System—An Overview; DTU Library: Kgs. Lyngby, Denmark, 2010. [Google Scholar]
- Yang, G.; Oleson, O.J. Secure Operation of Sustainable Power System (SOSPO) WP1: Future Scenario Description, System in Dontext and Specifications; DTU Library: Kgs. Lyngby, Denmark, 2013. [Google Scholar]
- Area of Danish Municipalities. Available online: https://www.dst.dk/en/Statistik/emner/geografi-miljoe-og-energi/areal/areal (accessed on 6 April 2019).
- Andresen, G.B.; Rodriguez, R.A.; Becker, S.; Greiner, M. The potential for arbitrage of wind and solar surplus power in Denmark. Energy 2014, 76, 49–58. [Google Scholar] [CrossRef]
- CIGRE. CIGRE Task Force C6.04: Benchmark Systems for Network Integration of Renewable and Distributed Energy Resources; CIGRE: Paris, France, 2014. [Google Scholar]
- Dupré, O.; Vaillon, R.; Green, M.A. Temperature Coefficients of Photovoltaic Devices. In Thermal Behavior of Photovoltaic Devices: Physics and Engineering; Springer International Publishing AG: Cham, Switzerland, 2017; Chapter 2; pp. 29–74. ISBN 9783319494562. [Google Scholar]
Figure 1.
The demonstration of the Bornholm power system: (a) The 60/10 kV distribution grid; (b) An example low-voltage (LV) feeder in the Bornholm power system modeled in DIgSILENT PowerFactory.
Figure 1.
The demonstration of the Bornholm power system: (a) The 60/10 kV distribution grid; (b) An example low-voltage (LV) feeder in the Bornholm power system modeled in DIgSILENT PowerFactory.

Figure 2.
The demonstration of three reactive power control methods: (a) PF(P) control; (b) Constant PF control; (c) Constant Q control.
Figure 2.
The demonstration of three reactive power control methods: (a) PF(P) control; (b) Constant PF control; (c) Constant Q control.
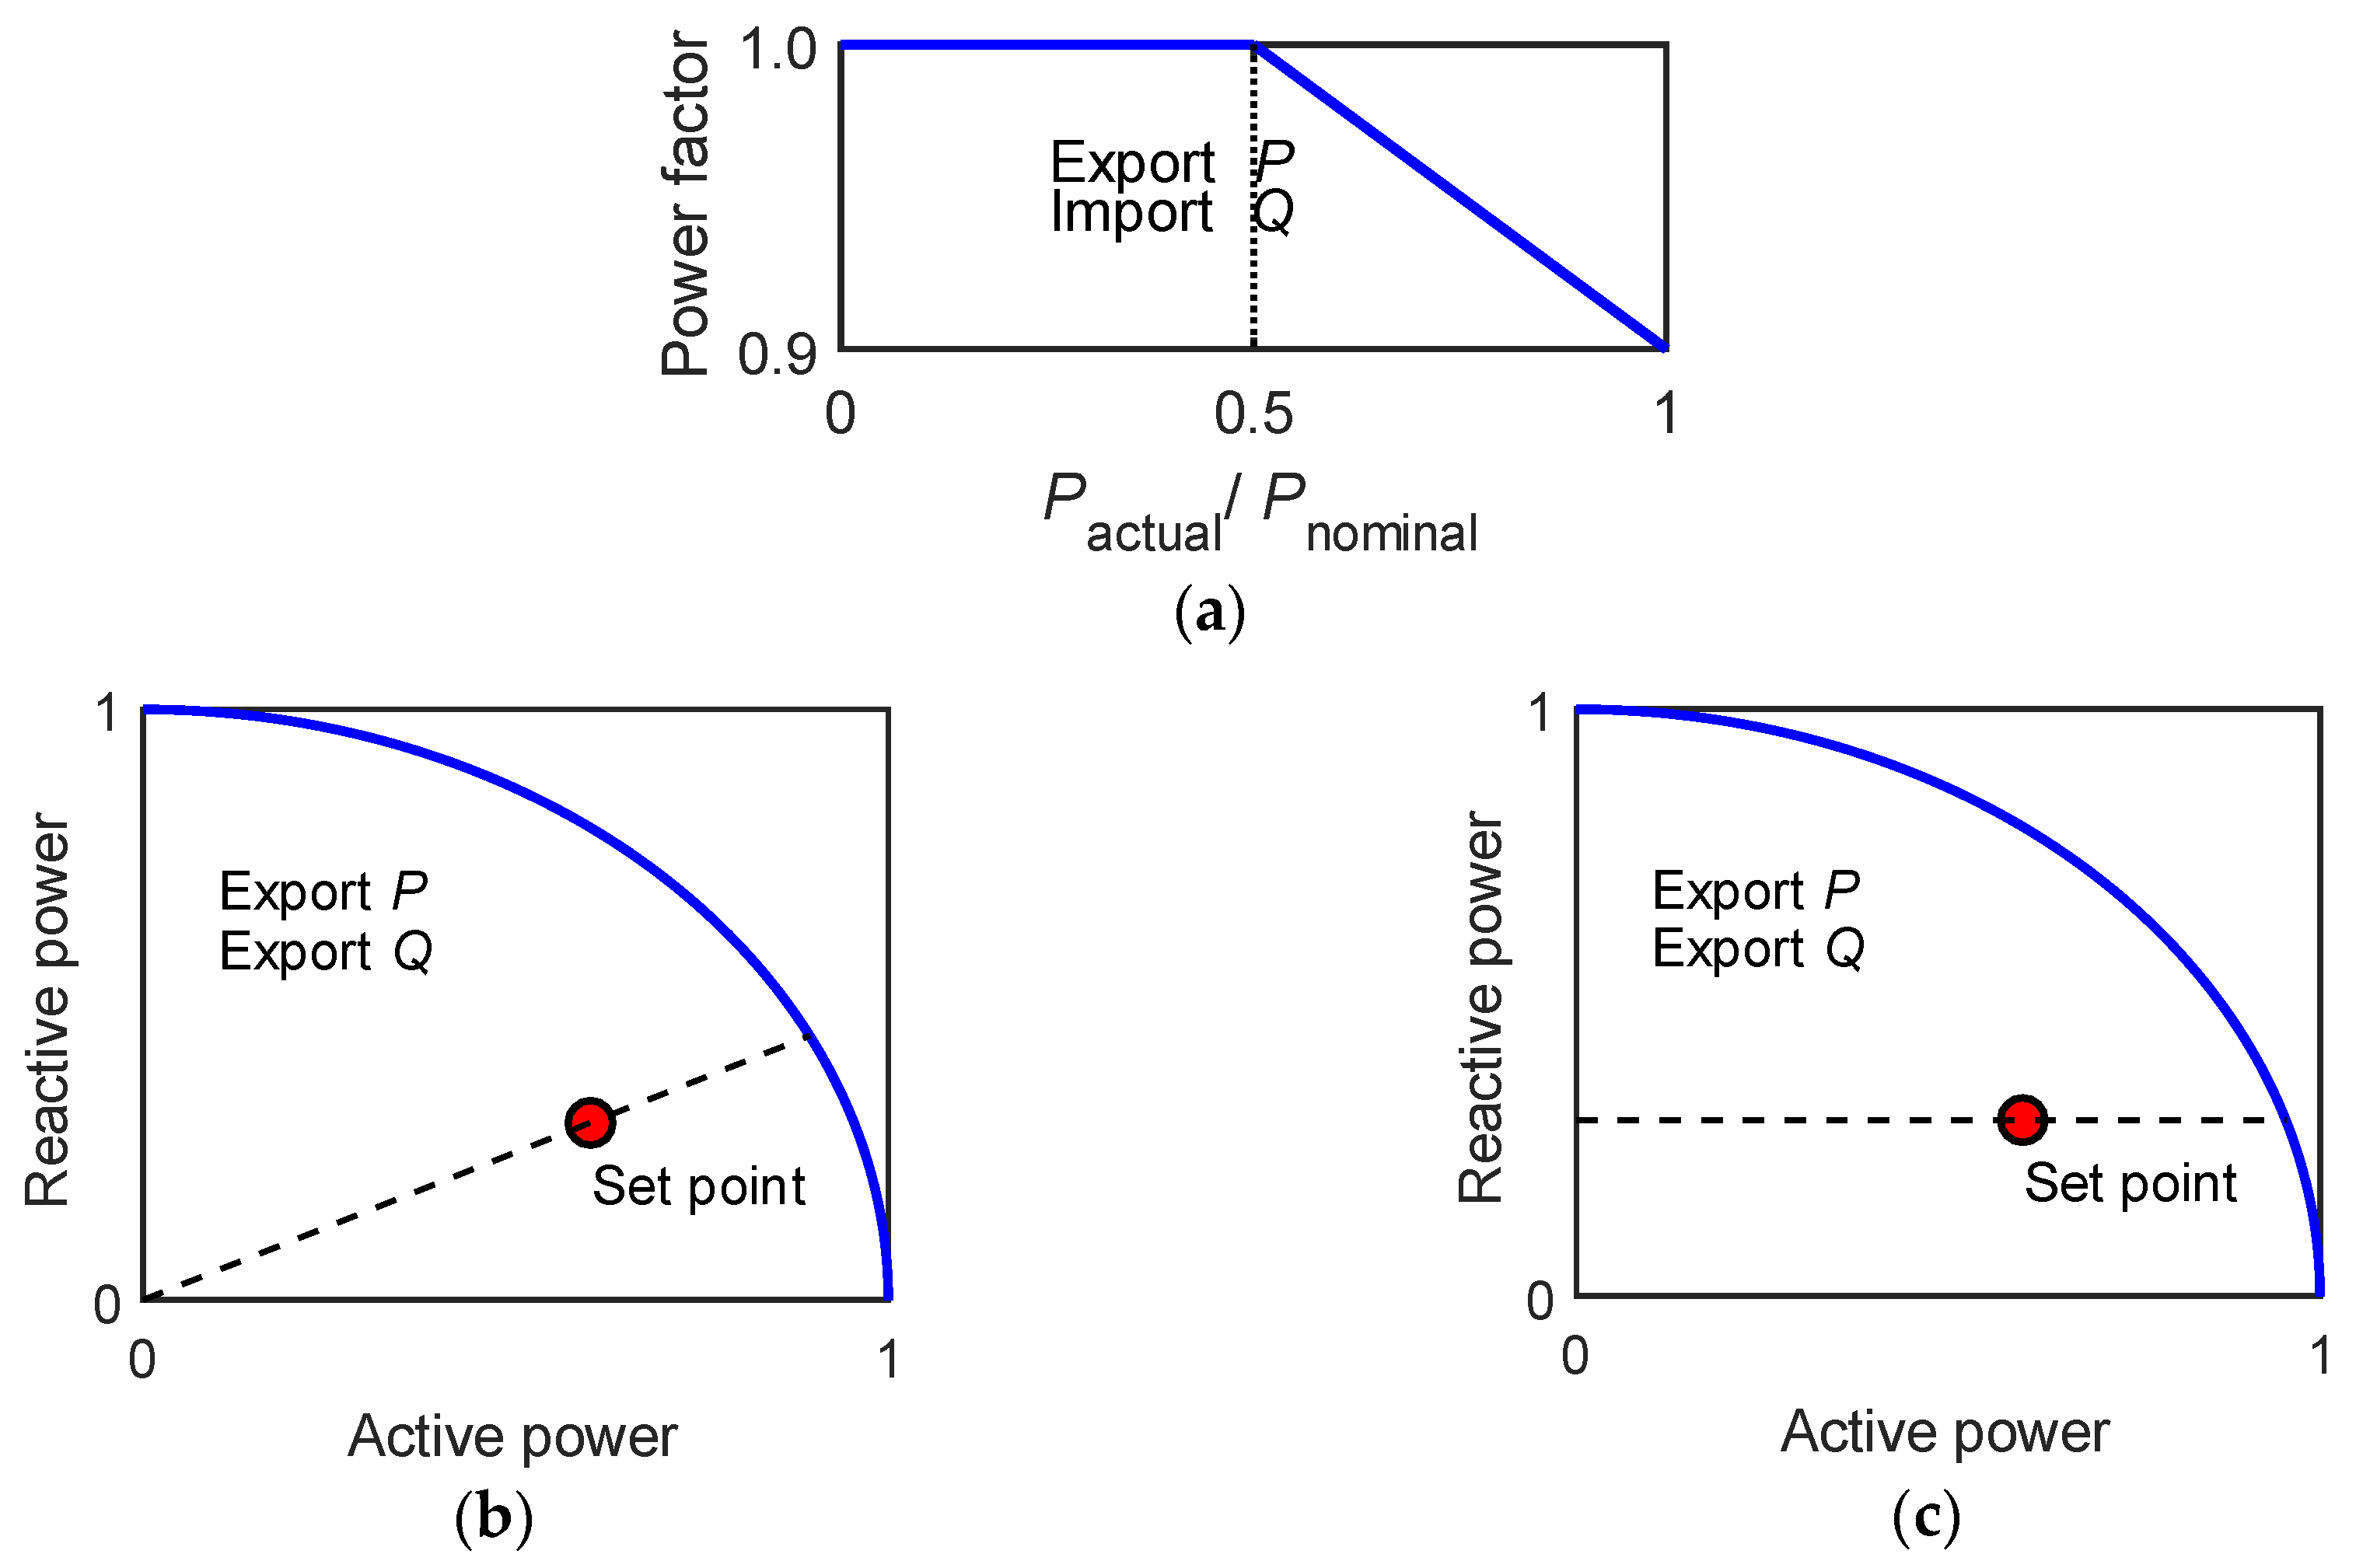
Figure 3.
The input data to the load flow simulation: (a) Load data; (b) photovoltaic (PV) generation.
Figure 3.
The input data to the load flow simulation: (a) Load data; (b) photovoltaic (PV) generation.

Figure 4.
The yearly average power loss of the entire grid at different PV penetration levels (with PF(P)).
Figure 4.
The yearly average power loss of the entire grid at different PV penetration levels (with PF(P)).

Figure 5.
The worst overvoltage situations of buses at different penetration levels (with PF(P)): (a) Yearly maximum number of overvoltage buses; (b) Yearly maximum bus voltage magnitude.
Figure 5.
The worst overvoltage situations of buses at different penetration levels (with PF(P)): (a) Yearly maximum number of overvoltage buses; (b) Yearly maximum bus voltage magnitude.
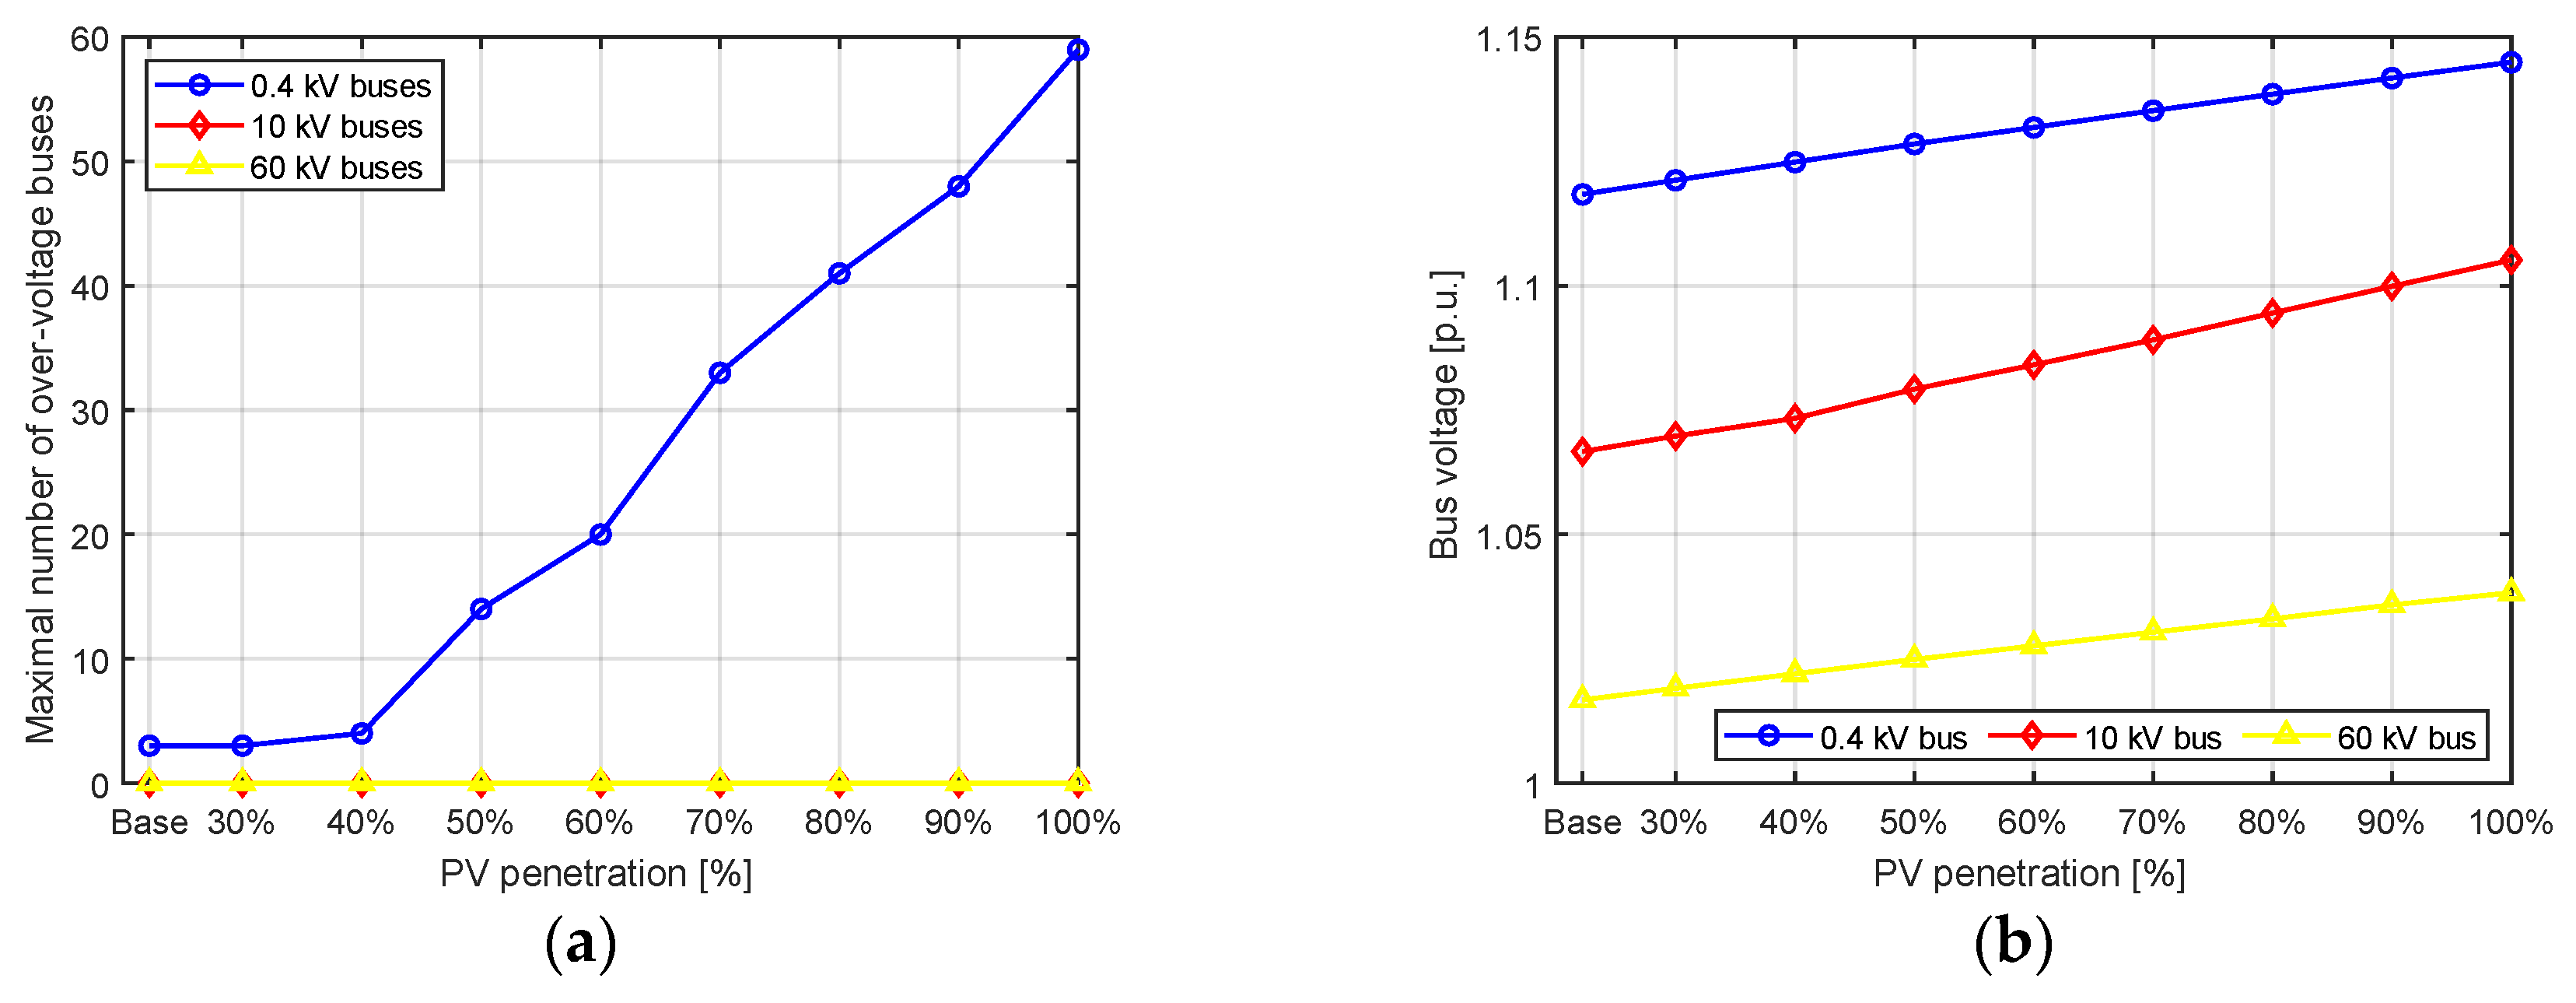
Figure 6.
The worst overload situations of transformers at different penetration levels (with PF(P)): (a) Yearly maximum number of overloaded transformers; (b) Yearly maximum transformer loading rate.
Figure 6.
The worst overload situations of transformers at different penetration levels (with PF(P)): (a) Yearly maximum number of overloaded transformers; (b) Yearly maximum transformer loading rate.

Figure 7.
The yearly average power loss of the entire grid at different PF setpoints (with constant PF).
Figure 7.
The yearly average power loss of the entire grid at different PF setpoints (with constant PF).

Figure 8.
The worst overvoltage situations of buses at different PF setpoints (with constant PF): (a) Yearly maximum number of overvoltage buses; (b) Yearly maximum bus voltages.
Figure 8.
The worst overvoltage situations of buses at different PF setpoints (with constant PF): (a) Yearly maximum number of overvoltage buses; (b) Yearly maximum bus voltages.

Figure 9.
The worst overload situations of transformers at different PF setpoints (with constant PF): (a) Yearly maximum number of overloaded transformers; (b) Yearly maximum loading rate of the transformer.
Figure 9.
The worst overload situations of transformers at different PF setpoints (with constant PF): (a) Yearly maximum number of overloaded transformers; (b) Yearly maximum loading rate of the transformer.

Figure 10.
The yearly average power loss of the entire grid at different Q setpoints (with constant Q).
Figure 10.
The yearly average power loss of the entire grid at different Q setpoints (with constant Q).
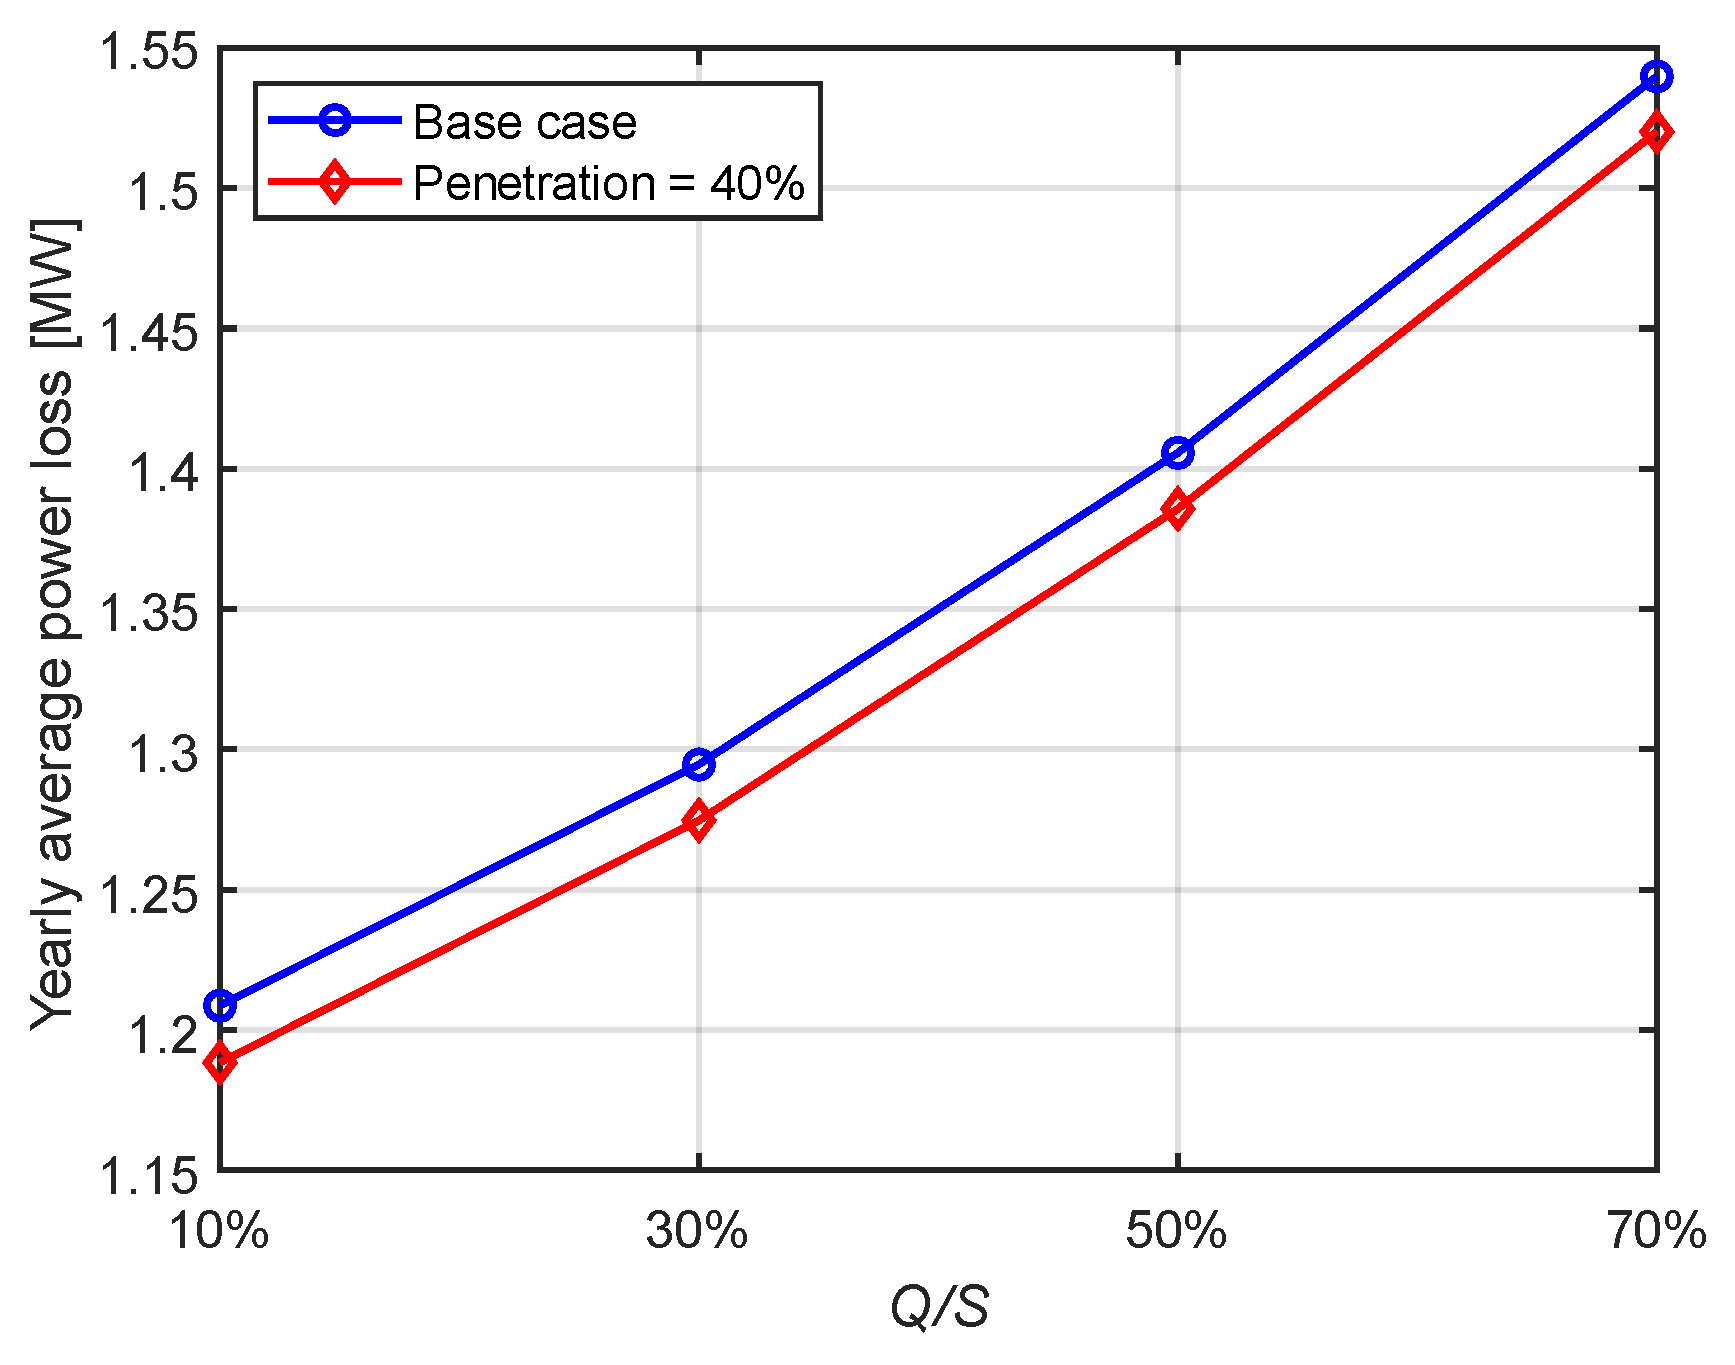
Figure 11.
The worst overvoltage situations of buses at different Q setpoints (with constant Q): (a) Yearly maximum number of overvoltage buses; (b) Yearly maximum bus voltage.
Figure 11.
The worst overvoltage situations of buses at different Q setpoints (with constant Q): (a) Yearly maximum number of overvoltage buses; (b) Yearly maximum bus voltage.

Figure 12.
The worst overloading situations of transformers at different Q setpoints (with constant Q): (a) Yearly maximum number of overloaded transformers; (b) Yearly maximum loading rate.
Figure 12.
The worst overloading situations of transformers at different Q setpoints (with constant Q): (a) Yearly maximum number of overloaded transformers; (b) Yearly maximum loading rate.


Table 1.
The comparison between the entirety of Denmark and Bornholm.
| Parameters | Entire Denmark | Bornholm |
|---|---|---|
| Population (thousand) | 5806 | 39.715 |
| Area (km2) | Approx. 42,934.10 | Approx. 588.40 |
| Peak load (MW) | Approx. 6000 | 55 |
| Annual energy consumption (GWh) | Approx. 36,000 | Approx. 262 |
| Number of transformer stations | Approx. 70,000 | Approx. 1000 |
Table 2.
The summary of the case studies with the base case (photovoltaic (PV) penetration level of 22%).
Table 2.
The summary of the case studies with the base case (photovoltaic (PV) penetration level of 22%).
| Control Methods | Power Loss of the Entire Grid (MW) | Max. Number of Overvoltage Buses | Max. Number of Overload Transformers | Max. Bus Voltage (p.u.) | Max. Transformer Loading Rate (%) |
|---|---|---|---|---|---|
| PF(P) | 1.17 | 3 | 6 | 1.118 | 218.99 |
| Constant PF | 1.16 | 309 | 6 | 1.115 | 218.9 |
| Constant Q | 1.21 to1.54 | 4 to82 | 4 to 5 | 1.157 | 219.76 |
Table 3.
The summary of the case studies with a PV penetration level of 40%.
| Control Methods | Power Loss of the Entire Grid (MW) | Max. Number of Overvoltage Buses | Max. Number of Overload Transformers | Max. Bus Voltage (p.u.) | Max. Transformer Loading Rate (%) |
|---|---|---|---|---|---|
| PF(P) | 1.15 | 6 | 6 | 1.125 | 218.96 |
| Constant PF | 1.13 | 68 | 7 | 1.115 | 218.9 |
| Constant Q | 1.19 to 1.52 | 31 to 107 | 4 to 5 | 1.166 | 219.76 |
© 2019 by the authors. Licensee MDPI, Basel, Switzerland. This article is an open access article distributed under the terms and conditions of the Creative Commons Attribution (CC BY) license (http://creativecommons.org/licenses/by/4.0/).
Share and Cite
MDPI and ACS Style
Wang, Z.; Yang, G. Static Operational Impacts of Residential Solar PV Plants on the Medium Voltage Distribution Grids—A Case Study Based on the Danish Island Bornholm. Energies 2019, 12, 1458. https://doi.org/10.3390/en12081458
AMA Style
Wang Z, Yang G. Static Operational Impacts of Residential Solar PV Plants on the Medium Voltage Distribution Grids—A Case Study Based on the Danish Island Bornholm. Energies. 2019; 12(8):1458. https://doi.org/10.3390/en12081458
Chicago/Turabian StyleWang, Ziyu, and Guangya Yang. 2019. "Static Operational Impacts of Residential Solar PV Plants on the Medium Voltage Distribution Grids—A Case Study Based on the Danish Island Bornholm" Energies 12, no. 8: 1458. https://doi.org/10.3390/en12081458
Note that from the first issue of 2016, this journal uses article numbers instead of page numbers. See further details here.