Numerical Study of the Structure and NO Emission Characteristics of N2- and CO2-Diluted Tubular Diffusion Flames


Department of Mechanical Engineering, Vanderbilt University, Nashville, TN 37235, USA
*
Author to whom correspondence should be addressed.
Energies 2019, 12(8), 1490; https://doi.org/10.3390/en12081490
Submission received: 28 February 2019
/
Revised: 10 April 2019
/
Accepted: 13 April 2019
/
Published: 19 April 2019
(This article belongs to the Special Issue Cleaner Combustion)
Abstract
:The structure of methane/air tubular diffusion flames with fuel dilution by either CO2 or N2 is numerically investigated as a function of pressure. As pressure is increased, the reaction zone thickness reduces due to decrease in diffusivities with pressure. The flame with CO2-diluted fuel exhibits much lower nitrogen radicals (N, NH, HCN, NCO) and lower temperature than its N2-diluted counterpart. In addition to flame structure, NO emission characteristics are studied using analysis of reaction rates and quantitative reaction pathway diagrams (QRPDs). Four different routes, namely the thermal route, Fenimore prompt route, N2O route, and NNH route, are examined and it is observed that the Fenimore prompt route is the most dominant for both CO2- and N2-diuted cases at all values of pressure followed by NNH route, thermal route, and N2O route. This is due to low temperatures (below 1900 K) found in these highly diluted, stretched, and curved flames. Further, due to lower availability of N2 and nitrogen bearing radicals for the CO2-diluted cases, the reaction rates are orders of magnitude lower than their N2-diluted counterparts. This results in lower NO production for the CO2-diluted flame cases.
1. Introduction
Laminar tubular flames are highly stretched and curved similar to turbulent flames and thus allow for isolating and studying stretch and curvature effects in flames [1]. In the past, tubular flames have been studied at 1 bar to understand the effect of stretch and curvature on preferential diffusion in hydrogen [2,3,4,5,6,7,8,9,10,11,12] and hydrocarbon flames [13] in premixed [2,3,4,5], non-premixed [6,7,8,9,10,11,13,14,15,16], and partially premixed configurations [12]. However, at high pressures, which are also characteristic of real-life combustors, minimal literature exists in the field of premixed tubular flames [17] and nothing in the field of non-premixed tubular diffusion flames. The authors in Nishioka et al. [17] numerically studied the structure of stoichiometric methane/air premixed tubular flames at different pressures. They observed that as the pressure was increased, the flame got thinner due to reduced thermal and species diffusivities. In addition, the peak temperature increased due to accelerated three-body reaction rates and approaches equilibrium values. In this paper, a detailed study of the structure of CH4/air tubular diffusion flames where the fuel stream is diluted with either N2 or CO2 is reported.
In high-temperature combustion, which is characteristic of the modern-day jet engine and automotive combustors, pollutants such as NO are formed. When exhausted into the atmosphere, they lead to environmentally damaging effects such as acid rain, greenhouse effect, etc. [18]. Modern aero-propulsion and power generation gas turbines operate at high pressure (10–60 atm) and the forward thermal rate of NO formation (ppm/ms) increases dramatically with pressure [19]. Pressure effects on nitric oxide formation must be accurately understood to mitigate the adverse effects of pressure. A common practice of reducing NOx emissions is exhaust gas recirculation or air dilution. This is captured in part in this study using N2 or CO2 dilution of the fuel. In the past, NO emission characteristics have been studied for opposed jet diffusion flames. See, for example, [20,21,22]. The authors in Park et al. [20] studied the effect of preheat and CO2 dilution of the oxidizer stream on NO emission rates in H2/air counterflow diffusion flames. They observed that CO2 suppresses the flame strength/temperature and thus also reduces NO emissions due to reduced thermal NO production. The researchers in Yang and Shih [23] studied NO formation in syngas flames. At low stretch rate (<10 ) where radiation loss leads to low temperature, they found that N + CO2 ↔ NO + CO was important contributor to NO formation in CO-rich zones. The authors of Lim et al. [21] also studied the effect of air preheating on the flame structure and NO emission characteristics of methane/air counterflow diffusion flames. They observed that with increase in temperature, the NO profiles showed a 70% increase which was attributed to the increased reaction rate of the prompt NO initiation reaction. Though NO production through the thermal route increased, it still remained an insignificant portion of the total NO production. The effect of fuel diluents, N2, CO2, and He, on NO profiles was studied by Rørtveit et al. [22] in H2/air diffusion flames. It was observed that CO2 and He dilution reduced the flame temperatures by large values and gave rise to lower NO emissions. However, the flames diluted with N2 showed higher temperatures and higher NO mole fractions mainly coming through the thermal route. It was also noted that CO2 reduced flame temperature largely through its dissociation. The researchers Shih and Hsu [24] have undertaken a numerical study to identify the important reaction pathways for NO production for hydrogen-lean and hydrogen-rich syngas flames. The thermal route was identified to be the most dominant and increased the NO production for hydrogen-rich syngas flames due to increased temperatures. Most of the above studies have used either quantitative reaction pathway diagrams, analysis of key reaction rates, or both to study the NO emission characteristics. In opposed non-premixed tubular flames, the flame temperature will differ from the opposed jet flame due to the effect of curvature and preferential diffusion [1,13,25]. This change of flame temperature with curvature will also affect NO production particularly through the thermally sensitive Zeldovich mechanism. In addition to the authors’ knowledge, no tubular flame study has investigated NO emission characteristics using quantitative reaction pathway diagrams (QRPDs) or reaction rate analysis and this forms the main focus of the current work. QRPDs and reaction rate analysis are employed for identifying key reaction pathways for NO production in methane/air tubular diffusion flames. The rest of the paper is organized as follows. In Section 2, the burner geometry and the numerical methods employed are discussed. In Section 3, flame structure and NO emission pathways are discussed. This is followed by the conclusions for the current work.
2. Burner Geometry and Numerical Model
A schematic of the non-premixed tubular burner used in this study is shown in Figure 1. A non-premixed tubular flame is produced through two radially opposed impinging jets emanating from the inner and outer nozzles. The inner nozzle lies at the axis of the burner. The outer nozzle is concentric to the inner nozzle and at a higher radius. Fuel with diluent are flown through the inner nozzle while oxidizer is flown through the outer nozzle. The flame surface coincides with the cylindrical stagnation surface of the burner. The resulting flame is stretched and curved allowing for isolating and examining stretch and curvature effects. As shown in the right side of Figure 1, in the current study, the opposed tubular flame is concave (“negatively” curved) to the methane diluted fuel. For the diluted CH4 mixture, the opposed tubular flame temperature will be reduced compared to an opposed jet flame or a positively curved flame [1,13]. As numerically studied in Figure 15 of Hu and Pitz [13] for opposed air vs. N2/CH4 flames, all the stretched flame temperatures decrease with stretch rate and are lower than the adiabatic flame temperature (1995 K). The highest reduction of the flame temperature due to the stretch rate is for the negatively curved (concave toward the fuel) flame considered here. The inner nozzle is 6.35 mm in diameter, the outer nozzle is 24 mm in diameter, and the height of both the inner and the outer nozzles is 8 mm. More details on the opposed tubular burner simulated in this study can be found elsewhere [12].
Three-dimensional combustion equations can be reduced to two-dimensional form in using similarity transformation ([26], pp. 95–99) and further reduced to one-dimensional form in r with azimuthal symmetry [4,13]. The authors in Hall and Pitz [3] have developed a direct numerical simulation (DNS) code for two-dimensional tubular burner problems using the aforementioned similarity transformation and finite difference modeling. The code includes radiation heat loss from CO2 and H2O in the optically thin limit. The governing equations and details of the numerical model used in this work can be found in [3] and are not repeated here for the sake of brevity.
Analytical expressions for the cold global flow stretch rate have been derived in the past [27] for premixed and non-premixed tubular burner configurations. The stretch rate is defined as where A is the differential area of the flame [28]. For the non-premixed configuration, it can be expressed as
where V indicates radial velocity, r indicates radius, and indicates mixture density. The subscripts i and o indicate inner and outer nozzle respectively.
In this study, methane/air diffusion flames are investigated at three different pressures: 1 atm, 3 atm, and 8 atm. The fuel stream is diluted by with either N2 or CO2. The global stretch rate considered in this study is 88 . The GRI 3.0 mechanism [29] was used for chemical kinetic modeling. The mechanism, thermal, and transport data are processed using the CHEMKIN package.
Quantitative Reaction Pathway Diagrams
In addition to investigating the flame structure, this study also reports findings on the most important pathways that lead to NO emissions. Four different routes are investigated: Zelodovich or thermal route, prompt route, N2O route, and NNH route. The important pathways are identified using reaction rate plots of primary NO formation reactions and quantitative reaction pathway diagrams (QRPDs). QRPDs are obtained by connecting the various species through arrows of varying thicknesses. The thickness of the arrows (or reaction paths) are proportional to the reaction rates of the various pathways integrated over the entire flame reaction zone [30,31].
3. Results
In this section, the structure of the tubular diffusion flame as a function of pressure and diluent is discussed. Following this, the various reactions that play a significant role in NO production are identified using QRPDs and sensitivity analysis.
3.1. Flame Structure
Figure 2 and Figure 3 show the temperature, major and minor species profiles for N2-diluted and CO2-diluted CH4/air flames at three different values of pressure: 1 atm, 3 atm, and 8 atm. Table 1 shows the boundary conditions used for the N2- and CO2-diluted cases at all pressures.
It is observed that the flame thickness reduces with pressure. This can be attributed to the reduced thermal diffusivity with pressure since . In diffusion flames, [32], where is the flame thickness, is the thermal diffusivity, and k is stretch rate. As the pressure is increased, the flame position as marked by temperature and species profiles (except for methane) is seen to move radially towards the nozzle. The peak values of temperature and major species remain mostly constant with pressure while that of the minor species mostly reduce with pressure. With pressure, reactions are more prone to go to completion due to reduced diffusivities (longer diffusion times). Minor/intermediate species concentrations reduce with pressure due to enhanced third-body collisions. The temperature of the flame for the CO2-diluted case is lower than that for the N2-diluted case. This is due to the fact that the specific heat of CO2 is higher than that of N2 and the radiative heat loss is higher for the CO2-diluted flame. There is more heat transfer on the fuel side for the N2-diluted flame than the CO2-diluted flame. At 1 atm, the temperature reaches 300 K at 0.35 cm for the N2-diluted flame and at 0.40 cm for the CO2-diluted flame. The thermal diffusivity is dependent on the molecular mass according to leading to reduced value of for CO2 compared to N2 dilution. NO emission is higher () for N2 diluted case than for CO2-diluted case, as is to be expected due to availability of N2 in abundance that leads to 20 times higher values of many nitrogen-bearing radicals. The temperature of the N2-diluted flame is K higher as well. N2O is formed from the third-body reaction N2 + O (+ M) ↔ N2O (+ M). Thus, its concentration increases with pressure. Concentrations of low-temperature radicals such as CH2O and HO2 are increased for the CO2-diluted case as opposed to the N2-diluted case due to reduced flame temperatures for the former. All N2-based compounds show higher concentrations for N2-diluted cases as is to be expected. For the CO2-diluted flames, the absence of N2 in the fuel leads to a change in slope for the N2O profile as N2O is formed by the reaction N2 + O + M ↔ N2O + M. NO concentration increases with pressure and then decreases. This is discussed more in the upcoming sections where the various NO formation mechanisms are discussed using QRPDs and key reaction rate diagrams.
A comparison between the adiabatic flame temperature and the maximum flame temperature obtained using the DNS code mentioned in Section 2 for fuel dilution with CO2 and N2 at different values of pressure is shown in Table 2. The researchers in Hu and Pitz [13] have studied the effect of curvature on the temperature of CH4/air flames with the fuel stream diluted by N2. It was observed that the methane flame which is convex to the fuel stream shows a decrease in temperature from that of the planar stretched flames for certain values of global stretch rate. In the stretched CH4/N2 vs. air flames, all the calculated flame temperatures were below the adiabatic flame temperature (1995 K). A similar behaviour can be observed in the current study as evident from Table 2. Due to the convex orientation of the flame front towards the fuel stream, the temperature of the tubular flame for all the cases shown in Figure 2 and Figure 3 and Table 2 is lower than the adiabatic flame temperature. Radiation heat loss from CO2 and H2O reduces the flame temperature with the CO2-diluted flame suffering the greater loss. At this time, there are no experimental measurements of tubular flames at high pressure. Experiments at high pressure imaging these non-premixed flames using the opposed tubular burner [12] are planned in the near future.
3.2. Quantitative Reaction Pathway Diagrams (QRPDs)
One of the main focuses of this study is also to analyze and identify the most important routes through which NO is produced. If NO production is not controlled, it can lead to a host of environmental problems such as acid rain, global warming, etc. A major step towards NO reduction is to identify the important routes to NO formation so that combustion chambers can be designed to target these specific routes. For example, if the thermal route contributes to the major portion of NO produced in a system, exhaust gas recirculation may be used to reduce the combustion chamber temperatures, thereby reducing NO production. Since the GRI 3.0 mechanism consists of about 350 reactions and analyzing all of them is beyond the scope of the current study, the most important reactions for NO production considered are as given in (Glassman et al. [18], pp. 403–414). These reactions are repeated in Table 3. QRPDs are a graphical representation of the reaction pathways between various species. Chemical compounds are connected with arrows indicating the direction of reaction flow. The size of the arrow is scaled proportional to the reaction rates that are integrated over the entire flame zone. Integrated reaction rates are obtained by integrating the individual reaction rates over the flame radius.
Figure 4 shows the quantitative reaction pathway diagrams for the N2-diluted cases for 88 s at three different values of pressure—1 atm, 3 atm, and 8 atm. Figure 4a shows the QRPD for 1 atm. The initiation step for the NNH route, N2 + H + M ↔ NNH + M, is the most dominant step. However, the subsequent chain propagation step, NNH + O ↔ NO + NH, is less dominant than that leading to NO production through the Fenimore prompt route. The integrated reaction rates for all the steps in the Fenimore prompt route are, at the least, an order of magnitude higher than the remaining steps (except the initiation step for NNH route). However, the steps resulting in NO formation, N + O2 ↔ NO + O and N + OH ↔ NO + H, are common to both the thermal route and the Fenimore prompt route. Nevertheless, the N radical produced from the thermal route through the reaction N2 + O ↔ NO + N is, at least, an order of magnitude less than the radical produced through the Fenimore prompt route via the reactions NH + H ↔ N + H2 and NH + OH ↔ N + H2O. This leads us to believe that the Fenimore prompt route is the most dominant route through which NO is produced. On the other hand, the N2O route is much less significant and is several orders of magnitude less than the other reactions considered.
As the pressure is increased to 3 atm (Figure 4b), the reaction rates for all the bimolecular reactions increase slightly but remain at the same order of magnitude. However, the third body reactions show order(s) of magnitude increases. Despite this, the N2O route remains insignificant compared to the other routes. Due to the increase in reaction rates, the NO mole fraction as seen from Figure 2 also increases. With further increase in pressure to 8 atm, there is only a slight increase in the bimolecular reaction rates. As a matter of fact, for some of the reactions, the reaction rates decrease such as N + OH ↔ NO + H and NH + H ↔ N + H2 (Fenimore prompt). This could explain the reduction in NO for 8 atm. Further, it may be noted that the third body reaction rates do not see a significant increase from 3 atm to 8 atm as was seen from 1 atm to 3 atm. Again, N2O route remains insignificant while the Fenimore prompt route is the most significant followed by NNH route and thermal route.
Figure 5 shows the QRPD for the CO2-diluted cases for three different values of pressure as before. The reaction rates of all the reactions are order(s) of magnitude less that their N2-diluted counterpart. This can be a result of the splitting up of CO2 into CO and O as found by Rørtveit et al. [22] and further chemical inhibition by CO. It could also be result of decreased availability of N2 for forming nitrogen compounds such as N that can lead to NO production. When comparing minor species profiles in Figure 2 and Figure 3, the CO2-diluted flame has NO producing radicals (N, NH, HCN, NCO) reduced by . This is shown in Table 4. In addition, the reduced flame temperatures for the CO2-diluted cases could also play a role. As the pressure is increased from 1 atm to 3 atm, the reaction rates increase slightly. However, similar to the N2-diluted cases, the three-body reactions show order(s) of magnitude increase. Since CO2 is a more efficient collision partner than N2, as the pressure is increased from 3 atm to 8 atm, the reaction rate for N2 + H + M ↔ NNH + M increases by an order of magnitude whereas it only increased slightly for the N2-diluted case. Further, the reaction rates for all the bimolecular reactions decrease as the pressure is increased from 3 atm to 8 atm due to reduced diffusivities and molecular mixing as pressure is increased. Thus, the amount of NO produced is decreased more drastically from 3 atm to 8 atm as opposed to the N2-diluted case. It may be noted that Fenimore prompt and NNH routes are still the most dominant followed by the thermal route whereas the N2O route still remains insignificant.
3.3. Analysis of Reaction Rates
Reaction rates of various NO producing steps given in Table 3 are shown in Figure 7 as a function of radius for 1 atm and a stretch rate of 88 s. Figure 8 and Figure 9 show the same for 3 atm and 8 atm respectively. Note that for the CO2-diluted cases, the reaction rates are multiplied by 10. It may be noticed that the radius range over which the reaction rates are non-zero decreases with pressure. This is to be expected due to the thinning of the flame zone due to reduced diffusivities. For a specific reaction, the reaction rate increases with pressure. As already indicated, Fenimore prompt appears to be the most dominant route to NO formation (Subfigures (b), (c), (f), and (g) of Figure 7, Figure 8 and Figure 9) followed by the NNH route (Subfigure (e)), thermal route (Subfigure (a)), and N2O route (Subfigure (d)). Further, it may be noticed that the ratio of reaction rates for the N2-diluted case to CO2-diluted case is approximately 1:10 except for the reactions N2O + O ↔ 2NO and NNH + O ↔ NO + NH. Both of these directly follow the third-body reactions as given under N2O route and NNH route respectively in Table 3. Since CO2 is an efficient third-body collision partner, the ratio of radicals N2O and NNH (as shown in Figure 2 and Figure 3) that are generated for the CO2- and N2-diluted cases is higher than the other radicals. This ready availability of these radicals, in turn, results in the increased reaction rates for N2O + O ↔ 2NO and NNH + O ↔ NO + NH for the CO2-diluted case when compared with the other reactions.
4. Conclusions
This paper has investigated the effect of pressure and fuel dilution on the structure of non-premixed methane/air tubular diffusion flames. It was observed that due to reduced species and thermal diffusivities, the flame thickness decreases with pressure. The flame temperature for CO2-diluted cases is lower than that for the N2-diluted cases. This can be attributed to higher value of specific heat and higher radiation loss for CO2 compared to N2. Species formed through third-body collisions show increased concentrations with pressure. When N2 dilution of the fuel is replaced by CO2, the NO-producing radicals (N, NH, HCN, NCO) reduce by a factor of 20.
Quantitative reaction pathway diagrams (QRPDs) were obtained alongside performing an analysis of key reaction rates to identify the most important pathways for NO production. Four different NO production routes were considered, namely the thermal route, Fenimore prompt route, NNH route and the N2O route. For both the CO2- and N2- diluted cases, it was found that the Fenimore prompt route is the most dominant followed by the NNH route, thermal route, and the N2O route for all values of pressure. Though the integrated reaction rates for the N2O route showed orders of magnitude increase with pressure, it remained an insignificant contributor to the overall NO production. An analysis of key reaction rates over the flame domain confirms the dominance of Fenimore prompt route in the production of NO. The NO production reaction rates for the CO2-diluted cases were observed to be lower than for the N2-diluted cases for most of the reactions. This was attributed to the greater availability of N2 for the N2-diluted cases, leading to higher peak values of many NO producing radicals.
Author Contributions
Conceptualization, H.D.; Methodology, H.D. and C.A.H.; Software, C.A.H.; Formal analysis, H.D.; Investigation, H.D.; Resources, R.W.P.; Data curation, H.D.; Writing—original draft preparation, H.D.; Writing—review and editing, R.W.P.; Visualization, H.D.; Supervision, R.W.P.; Funding acquisition, R.W.P.
Funding
This research was funded by American Chemical Society—Petroleum Research Fund grant number PRF # 56918-ND9.
Acknowledgments
Acknowledgment is made to the donors of The American Chemical Society Petroleum Research Fund for support of this research.
Conflicts of Interest
The authors declare no conflict of interest.
References
- Pitz, R.W.; Hu, S.T.; Wang, P.Y. Tubular premixed and diffusion flames: Effect of stretch and curvature. Prog. Energy Combust. Sci. 2014, 42, 1–34. [Google Scholar] [CrossRef]
- Hall, C.A.; Kulatilaka, W.D.; Gord, J.R.; Pitz, R.W. Quantitative atomic hydrogen measurements in premixed hydrogen tubular flames. Combust. Flame 2014, 161, 2924–2932. [Google Scholar] [CrossRef]
- Hall, C.A.; Pitz, R.W. Numerical simulation of premixed H2–air cellular tubular flames. Combust. Theory Model. 2016, 20, 328–348. [Google Scholar] [CrossRef]
- Mosbacher, D.M.; Wehrmeyer, J.A.; Pitz, R.W.; Sung, C.J.; Byrd, J.L. Experimental and numerical investigation of premixed tubular flames. Proc. Combust. Inst. 2002, 29, 1479–1486. [Google Scholar] [CrossRef]
- Wang, Y.; Hu, S.T.; Pitz, R.W. Extinction and cellular instability of premixed tubular flames. Proc. Combust. Inst. 2009, 32, 1141–1147. [Google Scholar] [CrossRef]
- Shopoff, S.W.; Wang, P.Y.; Pitz, R.W. The effect of stretch on cellular formation in non-premixed opposed-flow tubular flames. Combust. Flame 2011, 158, 876–884. [Google Scholar] [CrossRef]
- Shopoff, S.W.; Wang, P.Y.; Pitz, R.W. Experimental study of cellular instability and extinction of non-premixed opposed-flow tubular flames. Combust. Flame 2011, 158, 2165–2177. [Google Scholar] [CrossRef]
- Hall, C.A.; Pitz, R.W. Major species investigation of non-premixed cellular tubular flame. In Proceedings of the 54th AIAA Aerospace Sciences Meeting, San Diego, CA, USA, 4–8 January 2016. Number 1203. [Google Scholar]
- Hall, C.A.; Pitz, R.W. Experimental and numerical study of H2-air non-premixed cellular tubular flames. Proc. Combust. Inst. 2017, 36, 1595–1602. [Google Scholar] [CrossRef]
- Wang, P.Y.; Hu, S.T.; Pitz, R.W. Numerical investigation of the curvature effects on diffusion flames. Proc. Combust. Inst. 2007, 31, 989–996. [Google Scholar] [CrossRef]
- Hu, S.T.; Pitz, R.W.; Wang, Y. Extinction and near-extinction instability of non-premixed tubular flames. Combust. Flame 2009, 156, 90–98. [Google Scholar] [CrossRef]
- Tinker, D.C.; Hall, C.A.; Pitz, R.W. Measurement and simulation of partially-premixed cellular tubular flames. Proc. Combust. Inst. 2019, 37, 2021–2028. [Google Scholar] [CrossRef]
- Hu, S.T.; Pitz, R.W. Structural study of non-premixed tubular hydrocarbon flames. Combust. Flame 2009, 156, 51–61. [Google Scholar] [CrossRef]
- Li, Q.; Fernandez, L.; Zhang, P.Y.; Wang, P.Y. Stretch and curvature effects on NO emission of H2/air diffusion flames. Combust. Sci. Technol. 2015, 187, 1520–1541. [Google Scholar] [CrossRef]
- Suenaga, Y.; Kitano, M.; Yanaoka, H. Extinction of cylindrical diffusion flame. J. Thermal Sci. Technol. 2011, 6, 323–332. [Google Scholar] [CrossRef]
- Suenaga, Y.; Yanaoka, H.; Momotori, D. Influences of stretch and curvature on the temperature of stretched cylindrical diffusion flames. J. Thermal Sci. Technol. 2016, 11, JTST0028. [Google Scholar] [CrossRef]
- Nishioka, M.; Inagaki, K.; Ishizuka, S.; Takeno, T. Effects of pressure on structure and extinction of tubular flame. Combust. Flame 1991, 86, 90–100. [Google Scholar] [CrossRef]
- Glassman, I.; Yetter, R.A.; Glumac, N.G. Combustion, 5th ed.; Academic Press: Cambridge, MA, USA, 2015. [Google Scholar]
- Correa, S.M. A review of NOx formation under gas-turbine combustion conditions. Combust. Sci. Technol. 1993, 87, 329–362. [Google Scholar] [CrossRef]
- Park, J.; Kim, K.T.; Park, J.S.; Kim, J.S.; Kim, S.; Kim, T.K. A study on H2-air counterflow flames in highly preheated air diluted with CO2. Energy Fuels 2005, 19, 2254–2260. [Google Scholar] [CrossRef]
- Lim, J.; Gore, J.; Viskanta, R. A study of the effects of air preheat on the structure of methane/air counterflow diffusion flames. Combust. Flame 2000, 121, 262–274. [Google Scholar] [CrossRef]
- Rørtveit, G.J.; Hustad, J.E.; Li, S.C.; Williams, F.A. Effects of diluents on NOx formation in hydrogen counterflow flames. Combust. Flame 2002, 130, 48–61. [Google Scholar] [CrossRef]
- Yang, K.H.; Shih, H.Y. NO formation of opposed-jet syngas diffusion flames: Strain rate and dilution effects. Int. Hydrog. Energy 2017, 42, 24517–24531. [Google Scholar] [CrossRef]
- Shih, H.Y.; Hsu, J.R. Computed NOx emission characteristics of opposed-jet syngas diffusion flames. Combust. Flame 2012, 159, 1851–1863. [Google Scholar] [CrossRef]
- Hu, S.T.; Wang, P.Y.; Pitz, R.W.; Smooke, M.D. Experimental and numerical investigation of non-premixed tubular flames. Proc. Combust. Inst. 2007, 31, 1093–1099. [Google Scholar] [CrossRef]
- Schlichting, H. Boundary-Layer Theory, 7th ed.; McGraw-Hill: New York, NY, USA, 1979. [Google Scholar]
- Wang, P.Y.; Wehrmeyer, J.A.; Pitz, R.W. Stretch rate of tubular premixed flames. Combust. Flame 2006, 145, 401–414. [Google Scholar] [CrossRef]
- Matalon, M. On flame stretch. Combust. Sci. Technol. 1983, 31, 169–181. [Google Scholar] [CrossRef]
- Smith, G.P.; Golden, D.M.; Frenklach, M.; Moriarty, N.W.; Eiteneer, B.; Goldenberg, M.; Bowman, C.T.; Hanson, R.K.; Song, S.; Gardiner, W.C., Jr.; et al. GRI-Mech 3.0. 2000. Available online: http://www.me.berkeley.edu/gri_mech (accessed on 10 October 2018).
- Grcar, J.F.; Day, M.S.; Bell, J.B. Conditional and Opposed Reaction Path Diagrams for the Analysis of Fluid-Chemistry Interactions; LBNL Report No. 52164; Lawrence Berkeley National Laboratory: Berkeley, CA, USA, 2003.
- Warnatz, J.; Maas, U.; Dibble, R.W. Combustion, 4th ed.; Springer: Berlin/Heidelberg, Germany, 2006. [Google Scholar]
- Brown, T.M.; Tanoff, M.A.; Osborne, R.J.; Pitz, R.W.; Smooke, M.D. Experimental and numerical investigation of laminar hydrogen-air counterflow diffusion flames. Combust. Sci. Technol. 1997, 129, 71–88. [Google Scholar] [CrossRef]
Figure 1.
Schematic of non-premixed tubular burner.
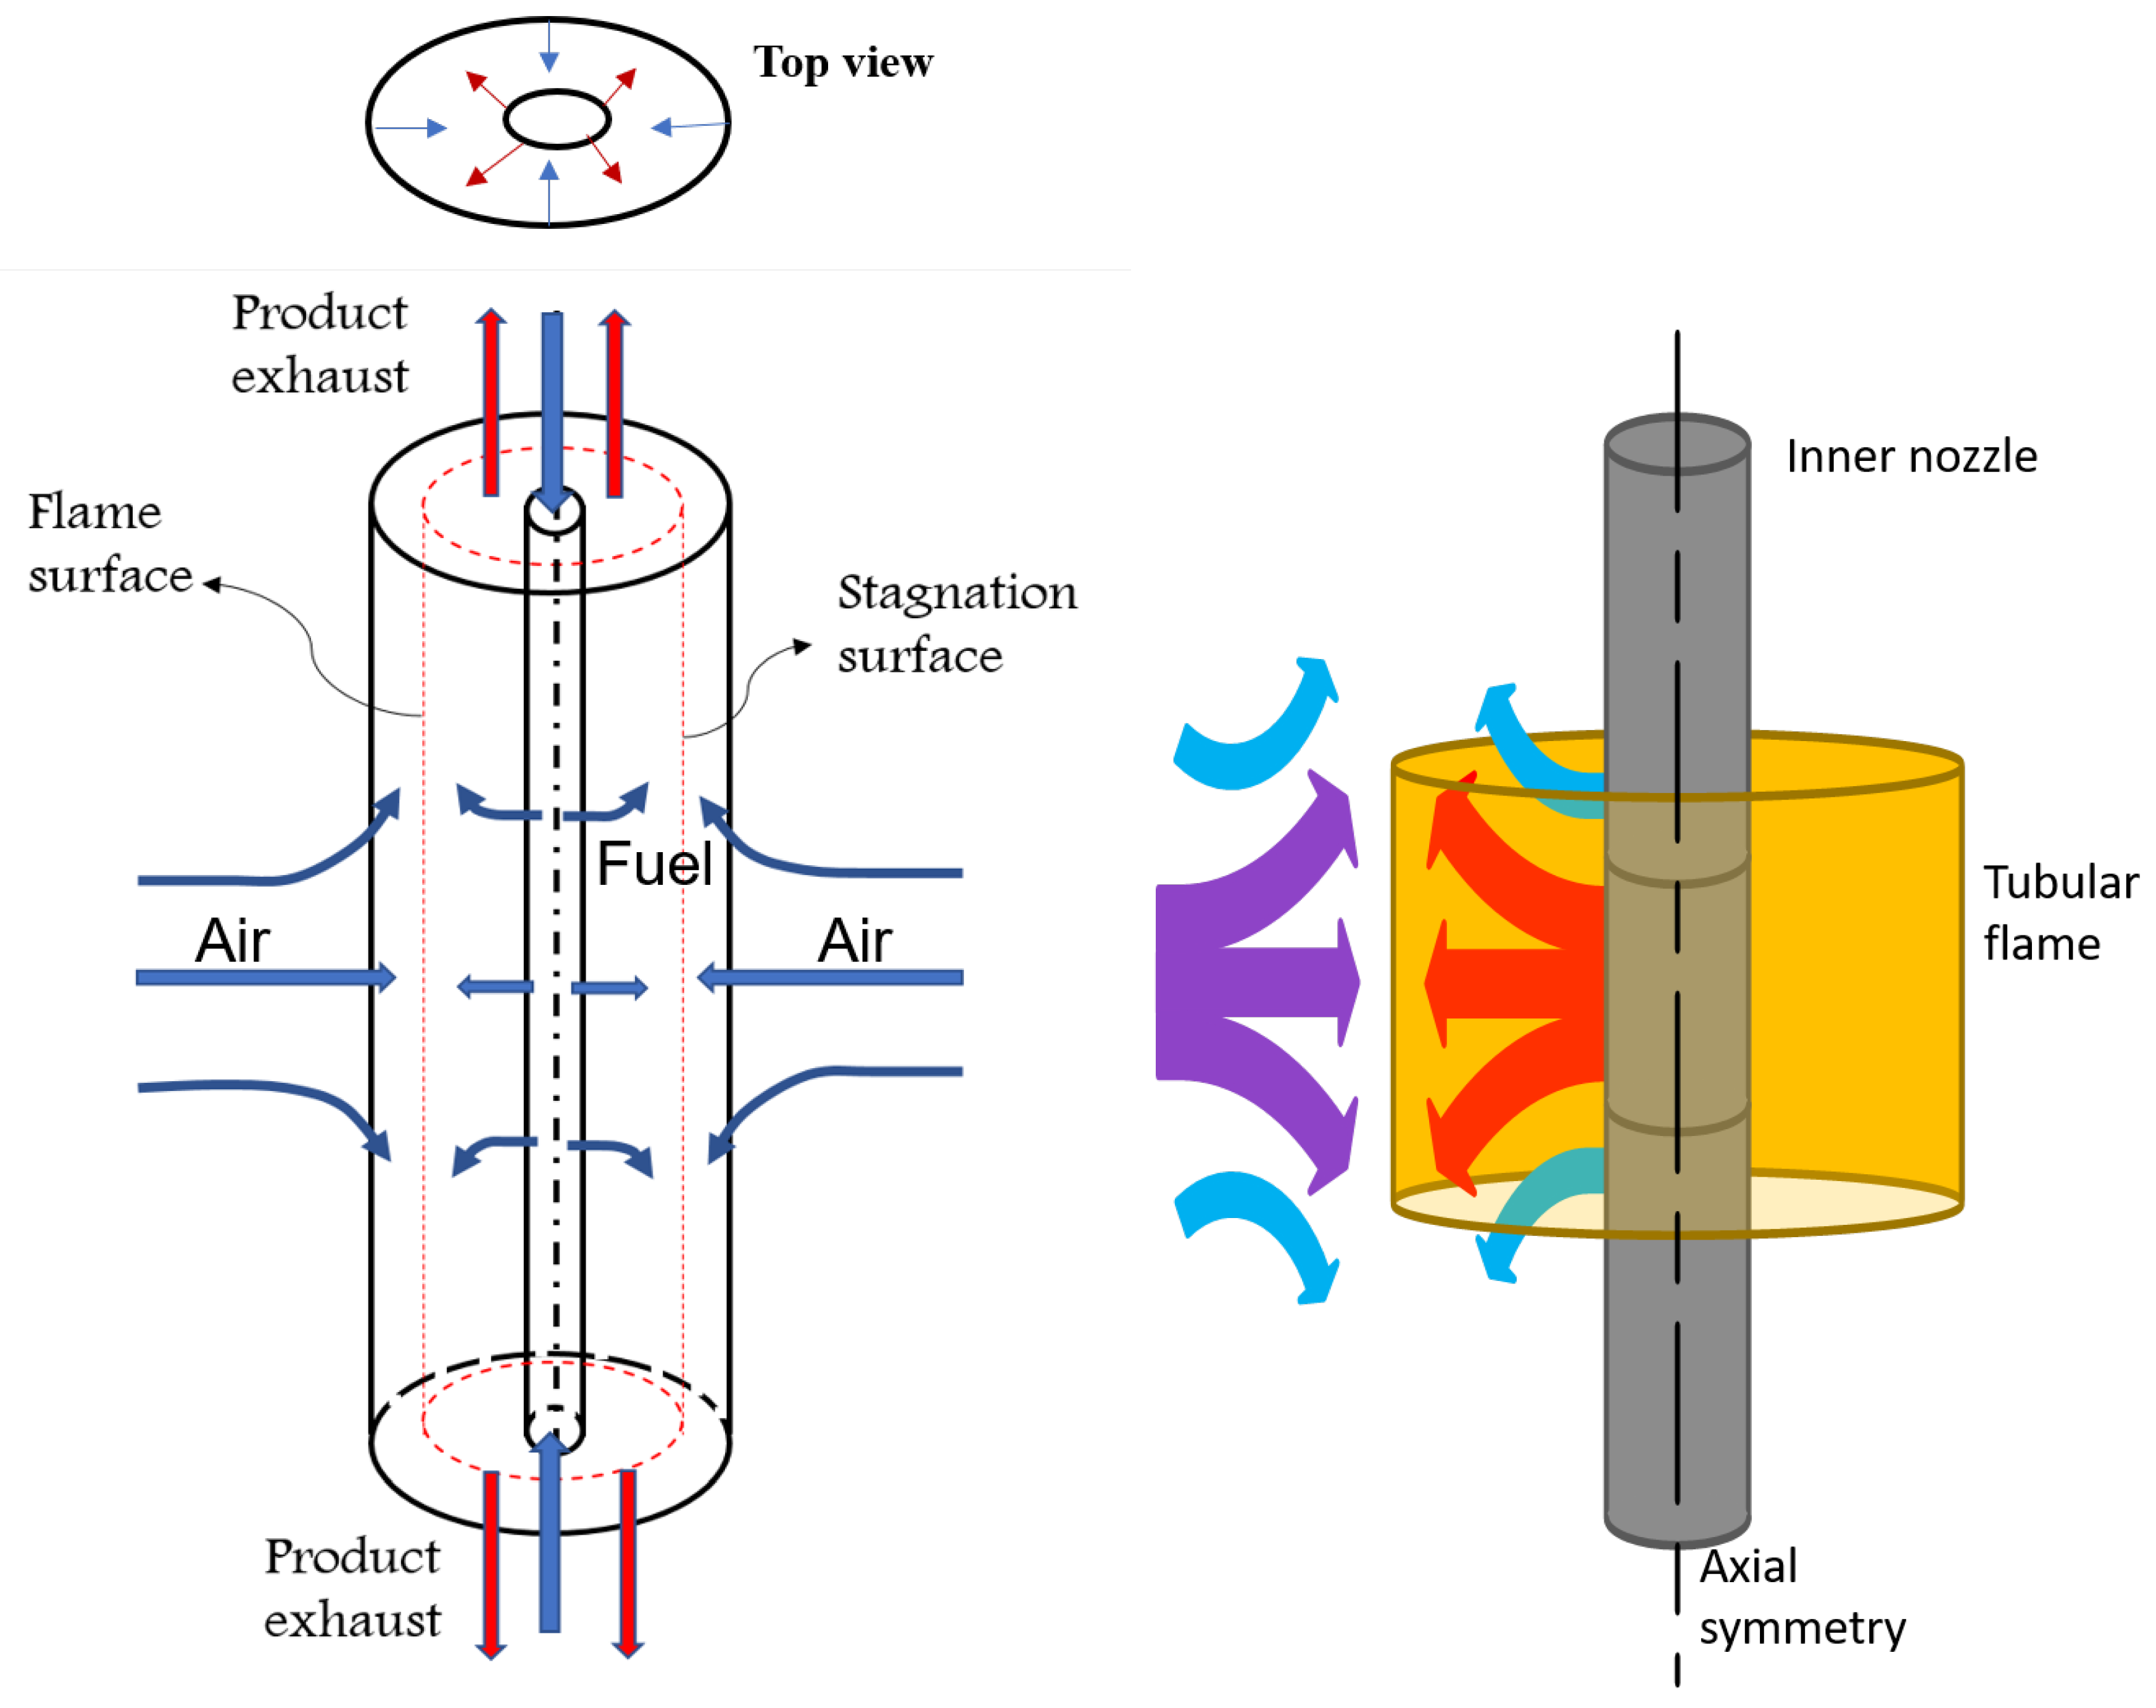
Figure 2.
Temperature, major, and minor species profiles for N2-diluted CH4/air tubular diffusion flame at 1 atm, 3 atm, and 8 atm; .
Figure 2.
Temperature, major, and minor species profiles for N2-diluted CH4/air tubular diffusion flame at 1 atm, 3 atm, and 8 atm; .

Figure 3.
Temperature, major, and minor species profiles for CO2-diluted CH4/air tubular diffusion flame at 1 atm, 3 atm, and 8 atm; .
Figure 3.
Temperature, major, and minor species profiles for CO2-diluted CH4/air tubular diffusion flame at 1 atm, 3 atm, and 8 atm; .
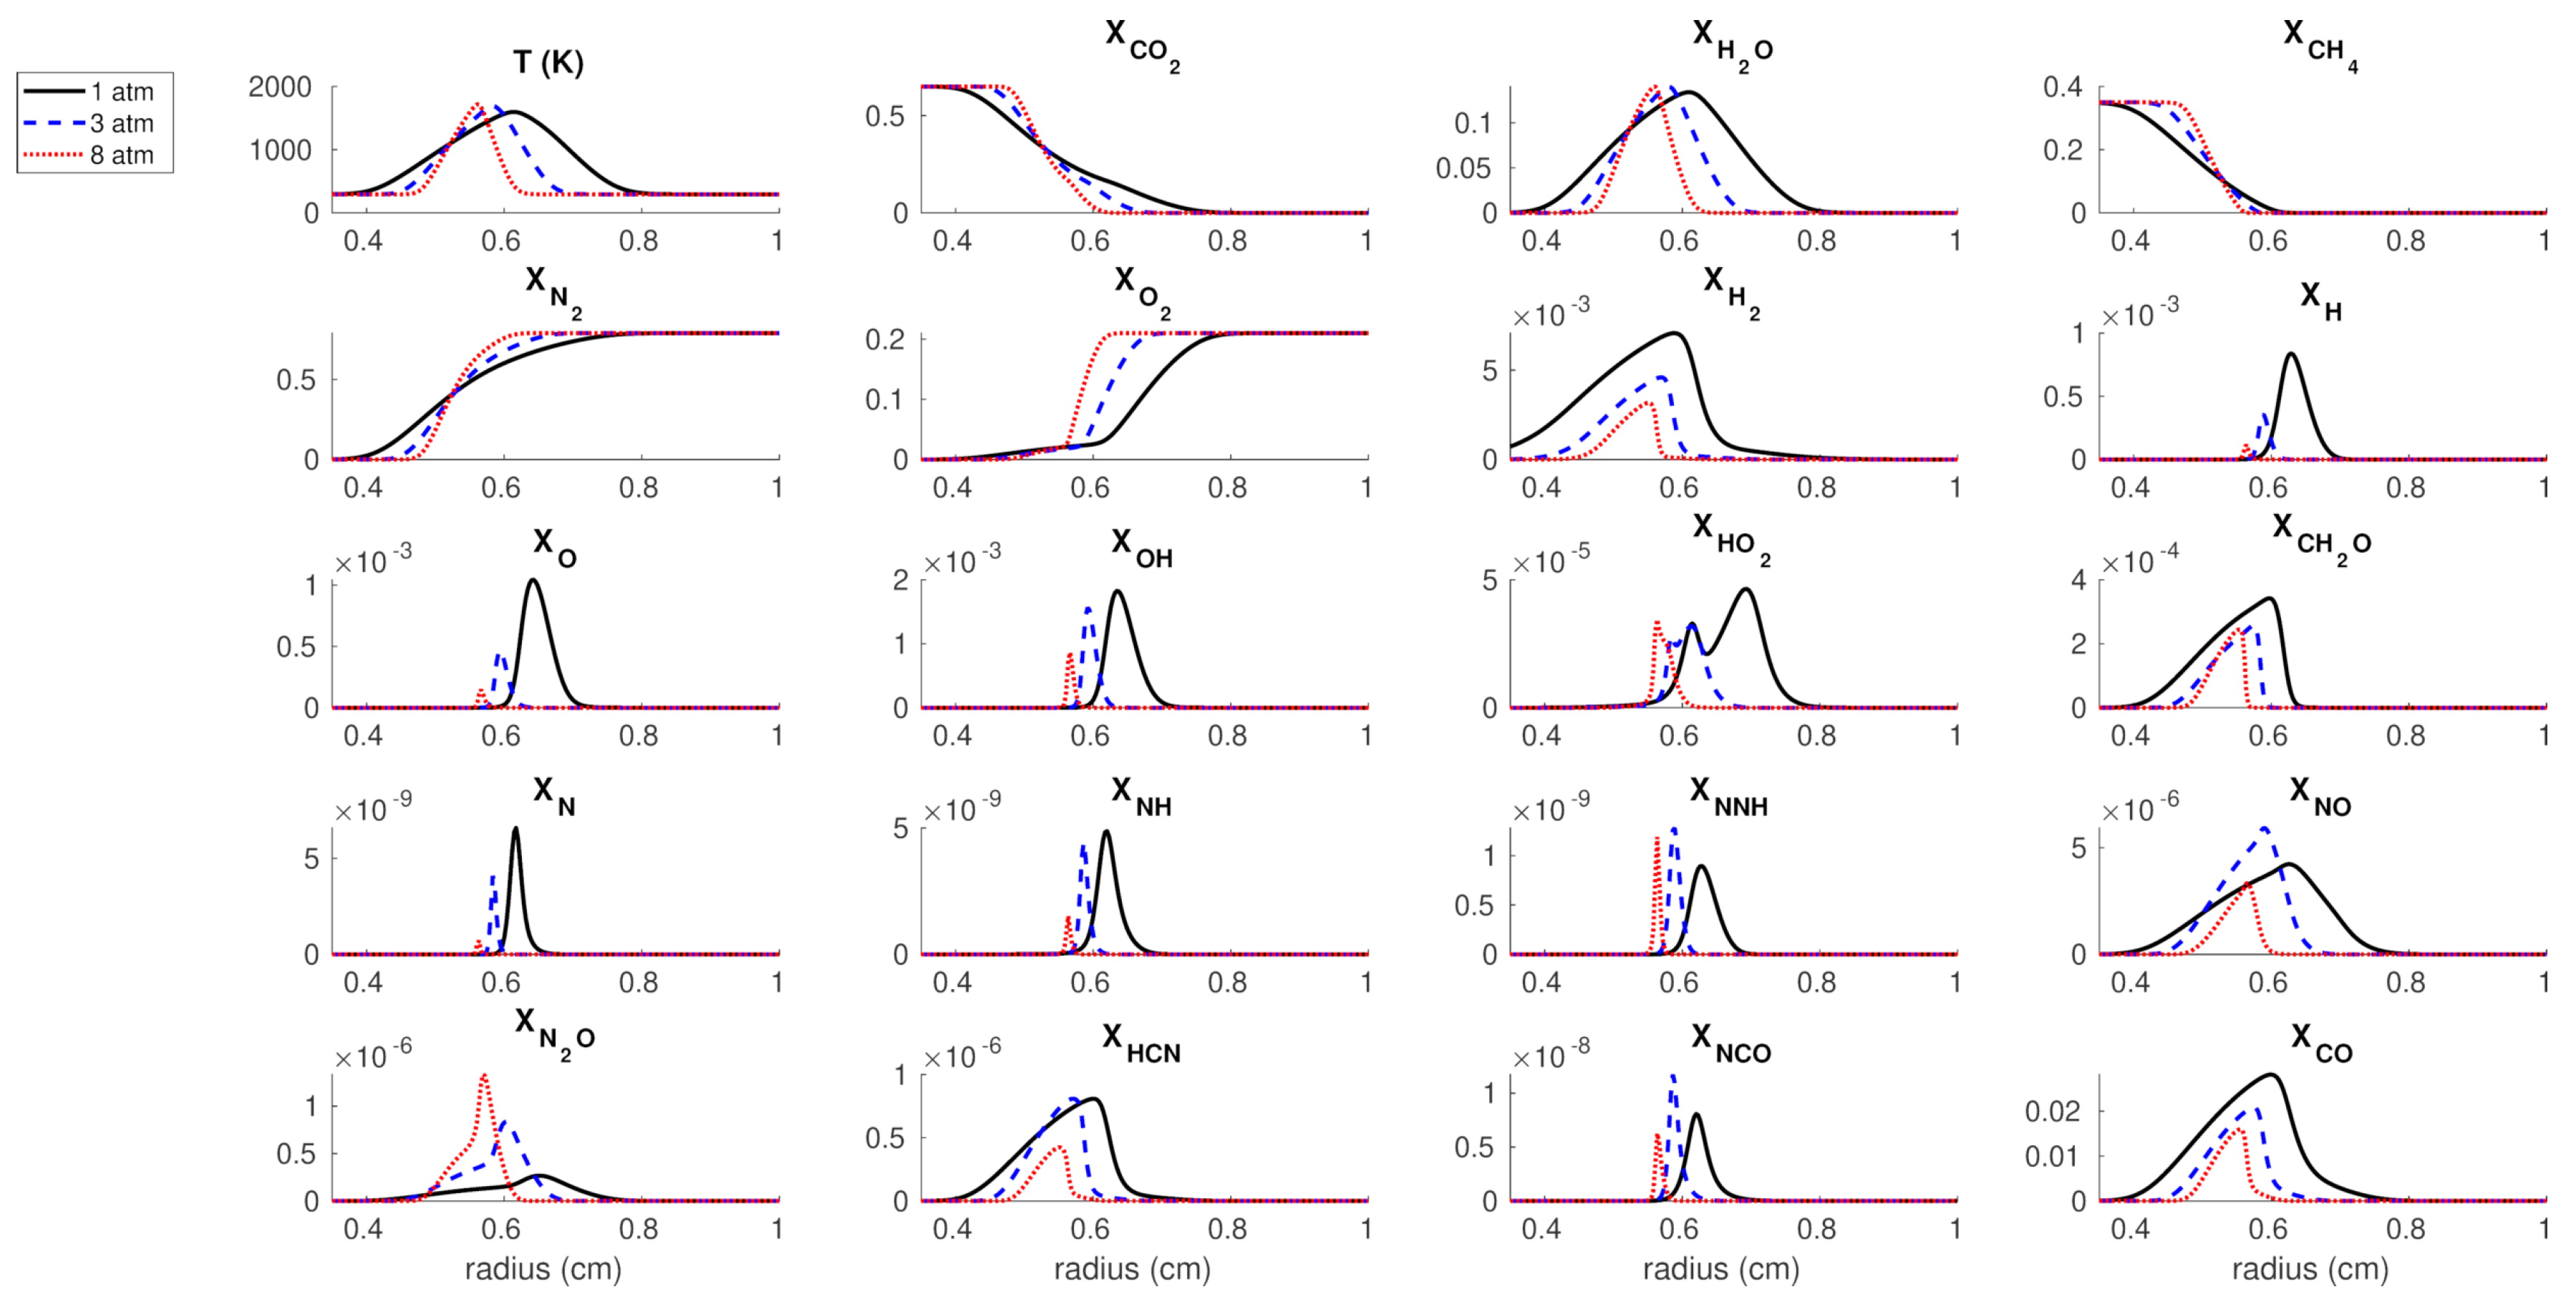
Figure 4.
Quantitative reaction pathway diagrams (QRPDs) for the N2-diluted case for at (a) 1 atm, (b) 3 atm, and (c) 8 atm. For legends, please refer to Figure 6.
Figure 4.
Quantitative reaction pathway diagrams (QRPDs) for the N2-diluted case for at (a) 1 atm, (b) 3 atm, and (c) 8 atm. For legends, please refer to Figure 6.

Figure 5.
QRPD for the CO2-diluted case for at (a) 1 atm, (b) 3 atm, and (c) 8 atm. For legends, please refer to Figure 6.
Figure 5.
QRPD for the CO2-diluted case for at (a) 1 atm, (b) 3 atm, and (c) 8 atm. For legends, please refer to Figure 6.


Figure 7.
Reaction rate profiles at 1 atm as a function of radius for (a) N2 + O ↔ N + NO, (b) N + O2 ↔ NO + O, (c) N + OH ↔ NO + H, (d) N2O + O ↔ 2NO, (e) NNH + O ↔ NO + NH, (f) NH + H ↔ N + H2, and (g) NH + OH ↔ N + H2O.
Figure 7.
Reaction rate profiles at 1 atm as a function of radius for (a) N2 + O ↔ N + NO, (b) N + O2 ↔ NO + O, (c) N + OH ↔ NO + H, (d) N2O + O ↔ 2NO, (e) NNH + O ↔ NO + NH, (f) NH + H ↔ N + H2, and (g) NH + OH ↔ N + H2O.

Figure 8.
Reaction rate profiles at 3 atm as a function of radius for (a) N2 + O ↔ N + NO, (b) N + O2 ↔ NO + O, (c) N + OH ↔ NO + H, (d) N2O + O ↔ 2NO, (e) NNH + O ↔ NO + NH, (f) NH + H ↔ N + H2, and (g) NH + OH ↔ N + H2O.
Figure 8.
Reaction rate profiles at 3 atm as a function of radius for (a) N2 + O ↔ N + NO, (b) N + O2 ↔ NO + O, (c) N + OH ↔ NO + H, (d) N2O + O ↔ 2NO, (e) NNH + O ↔ NO + NH, (f) NH + H ↔ N + H2, and (g) NH + OH ↔ N + H2O.

Figure 9.
Reaction rate profiles at 8 atm as a function of radius for (a) N2 + O ↔ N + NO, (b) N + O2 ↔ NO + O, (c) N + OH ↔ NO + H, (d) N2O + O ↔ 2NO, (e) NNH + O ↔ NO + NH, (f) NH + H ↔ N + H2, and (g) NH + OH ↔ N + H2O.
Figure 9.
Reaction rate profiles at 8 atm as a function of radius for (a) N2 + O ↔ N + NO, (b) N + O2 ↔ NO + O, (c) N + OH ↔ NO + H, (d) N2O + O ↔ 2NO, (e) NNH + O ↔ NO + NH, (f) NH + H ↔ N + H2, and (g) NH + OH ↔ N + H2O.


Table 1.
Boundary conditions for the simulated cases. and indicate radial velocity and axial velocity gradient at the outer air nozzle ( cm), is the velocity at the inner fuel nozzle ( cm), k is the global stretch rate.
Table 1.
Boundary conditions for the simulated cases. and indicate radial velocity and axial velocity gradient at the outer air nozzle ( cm), is the velocity at the inner fuel nozzle ( cm), k is the global stretch rate.
| (cm/s) | (cm/s) | (1/s) | k (1/s) | ||||||
|---|---|---|---|---|---|---|---|---|---|
| N2-diluted case | 0.35 | 0.65 | 0 | 15 | 0.21 | 0.79 | 25 | 15 | 88 |
| CO2-diluted case | 0.35 | 0 | 0.65 | 15.09 | 0.21 | 0.79 | 30.24 | 20 | 88 |
Table 2.
Peak temperature obtained using the direct numerical simulation (DNS) code versus the adiabatic flame temperature for the N2- and CO2-diluted cases at different values of pressure.
Table 2.
Peak temperature obtained using the direct numerical simulation (DNS) code versus the adiabatic flame temperature for the N2- and CO2-diluted cases at different values of pressure.
| Diluent | Pressure (atm) | (K) | (K) | |
|---|---|---|---|---|
| N2 | 1 | 2040 | 1770 | −13.2 |
| N2 | 3 | 2050 | 1851 | −9.7 |
| N2 | 8 | 2057 | 1898 | −7.7 |
| CO2 | 1 | 1923 | 1598 | −16.9 |
| CO2 | 3 | 1930 | 1692 | −13.3 |
| CO2 | 8 | 1936 | 1719 | −11.2 |
Table 3.
Various NO formation routes considered in the current study and as taken from (Glassman et al. [18], pp. 403–414).
Table 3.
Various NO formation routes considered in the current study and as taken from (Glassman et al. [18], pp. 403–414).
| Route | Reaction |
|---|---|
| Thermal | N + NO ↔ N2 + O |
| N + O2 ↔ NO + O | |
| N + OH ↔ NO + H | |
| Fenimore prompt | HCN + O ↔ NCO + H |
| NCO + H ↔ NH + CO | |
| NH + H ↔ N + H2 | |
| NH + OH ↔ N + H2O | |
| N + O2 ↔ NO + O | |
| N + OH ↔ NO + H | |
| N2O | N2 + O (+ M ) ↔ N2O (+ M ) |
| N2O + O ↔ 2NO | |
| NNH | N2 + H + M ↔ NNH + M |
| NNH + O ↔ NO + NH |
Table 4.
Effect of CO2 vs. N2 dilution on maximum molefractions of NO producing radicals and NO. N, NH, HCN, NCO mole fractions are reduced by a factor of ∼20 for the CO2-diluted case.
Table 4.
Effect of CO2 vs. N2 dilution on maximum molefractions of NO producing radicals and NO. N, NH, HCN, NCO mole fractions are reduced by a factor of ∼20 for the CO2-diluted case.
| 1 atm | 3 atm | 8 atm | |||||||
|---|---|---|---|---|---|---|---|---|---|
| N2 Case | CO2 Case | Reduce by | N2 Case | CO2 Case | Reduce by | N2 Case | CO2 Case | Reduce by | |
| N | 33 | 20 | 20 | ||||||
| NH | 20 | 17 | 15 | ||||||
| NNH | 2.5 | 2.3 | 3.3 | ||||||
| NO | 10 | 8.3 | 10 | ||||||
| N2O | 1 | 1.7 | 1.5 | ||||||
| HCN | 21 | 17 | 33 | ||||||
| NCO | 16 | 11 | 13 | ||||||
© 2019 by the authors. Licensee MDPI, Basel, Switzerland. This article is an open access article distributed under the terms and conditions of the Creative Commons Attribution (CC BY) license (http://creativecommons.org/licenses/by/4.0/).
Share and Cite
MDPI and ACS Style
Devathi, H.; Hall, C.A.; Pitz, R.W. Numerical Study of the Structure and NO Emission Characteristics of N2- and CO2-Diluted Tubular Diffusion Flames. Energies 2019, 12, 1490. https://doi.org/10.3390/en12081490
AMA Style
Devathi H, Hall CA, Pitz RW. Numerical Study of the Structure and NO Emission Characteristics of N2- and CO2-Diluted Tubular Diffusion Flames. Energies. 2019; 12(8):1490. https://doi.org/10.3390/en12081490
Chicago/Turabian StyleDevathi, Harshini, Carl A. Hall, and Robert W. Pitz. 2019. "Numerical Study of the Structure and NO Emission Characteristics of N2- and CO2-Diluted Tubular Diffusion Flames" Energies 12, no. 8: 1490. https://doi.org/10.3390/en12081490
Note that from the first issue of 2016, this journal uses article numbers instead of page numbers. See further details here.