Article

Characterization of Pore Throat Size Distribution in Tight Sandstones with Nuclear Magnetic Resonance and High-Pressure Mercury Intrusion

1
School of Geosciences, China University of Petroleum, Qingdao 266580, China
2
PetroChina Research Institute of Petroleum Exploration and Development, Beijing 100083, China
3
Research Institute of Enhanced Oil Recovery, China University of Petroleum, Beijing 102249, China
*
Author to whom correspondence should be addressed.
Energies 2019, 12(8), 1528; https://doi.org/10.3390/en12081528
Submission received: 20 February 2019 / Revised: 17 April 2019 / Accepted: 18 April 2019 / Published: 23 April 2019

Abstract

:
Characterization of pore throat size distribution (PTSD) in tight sandstones is of substantial significance for tight sandstone reservoirs evaluation. High-pressure mercury intrusion (HPMI) and nuclear magnetic resonance (NMR) are the effective methods for characterizing PTSD of reservoirs. NMR T2 spectra is usually converted to mercury intrusion capillary pressure for PTSD characterization. However, the conversion is challenging in tight sandstones due to tiny pore throat sizes. In this paper, the linear conversion method and the nonlinear conversion method are investigated, and the error minimization method and the least square method are proposed to calculate the conversion coefficients of the linear conversion method and the nonlinear conversion method, respectively. Finally, the advantages and disadvantages of these two different conversion methods are discussed and compared with field case study. The research results show that the average linear conversion coefficients of the 20 tight sandstone core plugs collected from Yanchang Formation, Ordos Basin of China is 0.0133 μm/ms; the average nonlinear conversion coefficient is 0.0093 μm/ms and the average nonlinear conversion exponent is 0.725. Although PTSD converted from NMR spectra by the nonlinear conversion method is wider than that obtained from linear conversion method, the nonlinear conversion method can retain the characteristic of bi-modal distribution in PTSD.

1. Introduction

Tight oil is an unconventional resource that has attracted substantial attention in recent years [1,2]. However, the effective exploration of unconventional oil and gas is difficult because of the ultra-low reservoir formation permeability [3,4]. The pore structures of tight sandstones have the characteristic of tiny pore throat sizes, a wide distribution of micro/nano-scale pores, complex pore structures, and various pore types [5]. As tight sandstone permeability is mainly dominated by pore throat size distribution (PTSD) [6], characterizing PTSD in tight sandstones is of significance for tight sandstone reservoirs evaluation.
Several techniques are used for PTSD characterization, including high-pressure mercury intrusion (HPMI), nitrogen gas adsorption, nuclear magnetic resonance (NMR), micro/nano X-CT, thin-section analysis, and scanning electron microscopy (SEM) [7,8,9,10,11]. HPMI is an effective technique and has been widely used for PTSD characterization [12]. However, core samples are usually destroyed during HPMI measurements. NMR is a non-destructive method for pore characterization, and has the features of low cost, fast measurement, and high precision. Compared with HPMI characterizing pore throat size distribution, NMR T2 spectra mainly reflect the characteristics of pore volumes. However, considering there is a justified correlation between pore body and pore throat sizes for the sedimentary rocks, estimating PTSD from NMR T2 spectra is feasible. Numerous studies on correlating NMR T2 with pore throat sizes were conducted. The combination of HPMI and NMR for pore structure characterization for PTSD analysis is widely applied [7,8,13,14,15,16,17,18]. The standard method of converting NMR T2 spectra to pore throat sizes is cross-correlation of the PTSD from MICP with NMR T2 spectra [18]. A simplified method is assuming there is a linear relationship between NMR T2 and pore throat sizes, and the conversion coefficient is obtained by correlating NMR T2 with the corresponding pore throat size under the same saturation [19]. According to the literature, the value of the conversion coefficient varies from 0.01 μm/ms to 0.73 μm/ms [16]. In addition to the linear relationship assumption, a nonlinear relationship between NMR T2 spectra and pore throat sizes has also been assumed in the literature [5,20,21,22].
This paper used the linear relationship and the power function relationship between NMR T2 and pore throat sizes to obtain PTSD from NMR T2 spectra. Additionally, the error minimization method and the least square method are proposed to calculate the conversion coefficients of the linear conversion method and the nonlinear conversion method, respectively. The obtained PTSD from these two different methods were compared with the PTSD derived from HPMI. Using tight sandstone core plugs collected from a tight oil reservoir located in China’s Ordos Basin, the linear and nonlinear conversion methods were tested.

2. Methodology Description

2.1. Linear Conversion Method

The capillary pressure P c can be converted to pore throat size r according to Washburn equation [23]:
P c = 2 σ cos θ r
where σ the interfacial tension and θ is the contact angle between mercury and air.
The NMR T2 spectra is the superposition of several mechanisms [24,25]:
1 T 2 = 1 T 2 B + 1 T 2 S + 1 T 2 D
where T 2 B is the bulk relaxation of fluid in pores; T 2 S is the surface relaxation due to the interaction between pore surfaces and fluids; T 2 D is the diffusion relaxation. In a uniform magnetic field, the diffusion relaxation term and the bulk relaxation term can be neglected, and NMR T2 is assumed to be only caused by the surface relaxation. The surface relaxion term can be expressed as follows:
1 T 2 = 1 T 2 S = ρ s S V
where ρ s is the surface relativity; S / V is the pore surface-to-volume ratio, and can be calculated as follows:
S V = F S r
where r is the pore throat radius; F S is the shape factor of the pore throat. For the cylindrical pore and spherical pore, its value is F S = 2 and F S = 3 , respectively. Combining Equations (3) and (4), the correlation between NMR T2 and pore throat size r can be expressed as follows:
T 2 = r ρ s F S .
Therefore, the linear correlation between NMR T 2 and pore throat size r can be identified:
r = C T 2
where C is the conversion coefficient for the linear conversion, and C = ρ S F S . With the pore throat size derived from HPMI measurement, the conversion coefficient C can be determined through linear regression [8,14,16].
The total error σ for the linear conversion can be calculated with the following equations:
σ = 2 n ω ( r ( i ) ) [ r ( i ) C T 2 ( i ) ] 2 2 n ω ( r ( i ) )
where r ( i ) is the pore throat size; ω ( r ( i ) ) is the incremental frequency of the pore throat size r ( i ) measured from HPMI. The total error σ varies with the different value of linear conversion coefficient C , and the optimal C can be determined when the total error σ is minimal. Then, NMR T2 spectra can be converted to PTSD using Equation (6).

2.2. Nonlinear Conversion Method

In addition to the linear conversion method, a nonlinear conversion method has been used by several scholars to convert NMR T2 to the pore throat size r [5,20,21]:
T 2 = r n ρ s F S
where n the exponent for the nonlinear conversion. Assuming C = ( ρ s F S ) 1 n , the pore throat size r can be calculated from the following nonlinear correlation:
r = C T 2 1 n
where C is the conversion coefficient for the nonlinear conversion. The unknown parameters C and n can be obtained from the nonlinear regression between pore throat size r and NMR T2.
Taking the logarithm operation on both sides of Equation (9):
lg r = lg C + 1 n lg T 2
The unknown nonlinear conversion coefficient C and exponent n can be determined by minimizing the total error of the converted pore size compared with the pore size derived from HPMI using least square method:
min [ lg C + 1 n lg T 2 ( i ) lg r ( i ) ] 2
After that, with the obtained C and exponent n , NMR T2 spectra can be converted to PTSD using Equation (9).

3. Experiments

3.1. Core Samples

Twenty tight sandstone core plugs collected from the Yanchang Formation, located in Ordos Basin of China, were used for the study in this paper. These 20 core plugs were collected from 5 different zones, and 4 core plugs from each zone. The detailed parameters of the core plugs are shown in Table 1. Both the helium porosity and permeability of all core plugs were determined at the beginning of the experiments. The measured porosities vary from 2.1% (B114) to 12.2% (Y75), with an average porosity of 7.79%, and the values of the permeability range from 0.003 mD (B114) to 0.262 mD (H94), with an average permeability of 0.08 mD. Reservoir quality index (RQI) and flow zone index (FZI) are widely used for identifying different flow zones [26]. RQI and FZI calculated by RQI = 0.0314 K a i r ϕ , FZI = 0.0314 ( 1 ϕ ϕ ) K a i r ϕ are shown in Table 1.

3.2. QUEMSCAN, NMR, and HPMI Measurements

Quantitative Evaluation of Minerals by Scanning Electron Microscopy (QUEMSCAN) was used to identify the type and content of minerals in tight sandstones. One core plug in each zone and total 5 core plugs were selected for QUEMSCAN measurements. The distributions of minerals are shown in Figure 1, and the detailed contents of each mineral are shown in Table 2. The resolution of QUEMSCAN image is about 25 μm. B19 and Y15 have the similar mineral composition. Quartz is the main mineral type, and occupies more than 50% of total mineral. The total contents of albite and K-feldspar are more than 20%. The remaining composites are clay, such as illite, chlorite, muscovite, biotite, and kaolinite. For the core plugs of A24, H90, and Z33, quartz and albite are the main minerals with about 30% contents, and the content of K-feldspar is the third, about 10%. Chlorite is the highest content clay, followed by illite. The sizes of quartz, albite, and K-feldspar of H90 are largest, and the mineral sizes in B19, Y15, and Z33 are very small.
The core plugs were divided into two parts, one part was used for the NMR measurements and another part was used for the HPMI measurements. NMR measurements were carried out using a 2 MHz OXFORD MARAN DRX2 spectrometer with an inter-echo spacing of 300 μs, 4096 echoes, 1024 scans, or 2048 scans, and the signal to noise ratio of around 30. The results of NMR measurements are shown in Figure 2.
HPMI measurements were conducted to derive the PTSD of 19 core plugs, except the core B114, as shown in Figure 3. The calculated average pore radii for each core plug are shown in Table 1. Although the maximum mercury saturation is more than 90% for most of core plugs, for the very tight core plug, such as Z92, the maximum mercury intrusion is less than 80%. Therefore, HPMI cannot comprehensively characterize the PTSD, especially for the nanoscale pores in the very tight sandstones. Combination of NMR and HPMI for PTSD characterization is a good approach.

4. PTSD Analysis with NMR, HPMI, and QUEMSCAN

Figure 4 compares the PTSD derived from HPMI measurements and the NMR T2 spectra of three core plugs. For A48, although there is a small peak value of PTSD around the size of 0.01 μm, the pore throat size mainly distributes around 0.2 μm, and correspondingly, the NMR T2 spectra exhibits a single peak around T2 = 16.32 ms. The permeability and porosity of H94 are the highest among these three core plugs, and the bimodal characteristic of PTSD can be identified. The first PTSD peak value appears at approximately 0.5 μm, and the second PTSD peak value appears at approximately 0.01 μm. The NMR T2 spectra of H94 also shows a bi-modal characteristic, which is different from that of A48. The permeability and porosity of Z92 are the lowest among these three core plugs, and PTSD curve shows that pore sizes mainly distribute between 0.01 μm and 0.1 μm. The NMR T2 spectra mainly distributes between 0.1 ms and 10 ms, with the peak value appearing at approximately 1 ms. Figure 4 demonstrates that the distribution of NMR T2 spectra is correlated with PTSD derived from HPMI.
Both NMR measurements and HPMI measurements are sensibly to the distributions of pore volumes which correspond to a certain pore size or a certain pore throat size, respectively. For sandstones, there is a relationship between pore sizes and pore throat sizes. In NMR measurements, the logarithmic mean T2 is a comprehensive parameter on the pore radius and the porosity. It can be considered as a characteristic parameter for the average pore radius. As Figure 5 shows, there exists a relationship between r ¯ and T 2 ML . Hence, the radius of the pore body is proportional to the radius of the pore throat. In some ways, NMR measurements and HPMI measurements reflect the same distribution. This relationship can be influenced by many factors, such as the mineral composition and their mineral content. As shown in Figure 1 and Table 2, the five core plugs can be divided into two categories. For B19 and Y15, quartz is the main mineral type, and occupies more than 50% of total mineral, while for A24, H90, and Z33, quartz and albite are the main minerals and their contents are about 30%, respectively. Albite is a kind of an unstable mineral, and it is a source of secondary pores. The secondary pores can influence the regular relationship between permeability and porosity [27]. Besides, clay minerals can influence the size of pore throats. With the highest content of kaolinite, A24 deviates from the relationship. The quantitative correlation between NMR T2 and pore throat size will be identified in this paper.

5. PTSD Conversion Results

5.1. Linear Conversion Results

Based on Equation (6), different values of the conversion coefficient for the linear conversion C was selected. NMR T2 was converted to PTSD and subsequently compared with the measured PTSD obtained from HPMI. The optimal value of C can be determined when the errors between the converted PTSD from NMR and measured PTSD from HPMI reaches the minimum. Taking the core plug Z39 as an example, Figure 6 shows a case of the linear conversion. The cumulative water saturation versus pore sizes from NMR is compared with cumulative mercury saturation versus pore sizes obtained from HPMI. The optimal conversion coefficient can be determined when the converted PTSD from NMR T2 spectra can match the measured PTSD from HPMI. As shown in Figure 7, the optimal value of linear conversion coefficient for the core plug Z39 is 0.0126 μm/ms, and the minimal total error σ is 6.908 μm. Figure 8 shows the converted PTSD from NMR T2 spectra using the linear conversion method with the optimal conversion coefficient. The converted PTSD is very close to the measured PTSD from HPMI, but the bimodal characteristic of PTSD from HPMI is missing during the converting process.
Table 3 shows the results of linear conversion for total 19 core plugs. The obtained conversion coefficients of the linear conversion vary from 0.0068 μm/ms (A48) to 0.0266 μm/ms (H66), with an average value of 0.0133 μm/ms.

5.2. Nonlinear Conversion Results

The principle of nonlinear conversion of NMR T2 spectra to PTSD is the NMR T2 and the corresponding pore throat radius under the same saturation is fitted with least square method according to Equation (11). The nonlinear conversion coefficient C and exponent n can be determined [5,21]. Core plug Z39 was selected as an example to demonstrate the process of nonlinear conversion. As shown in Figure 9, the cumulative mercury saturation with different pore throat sizes derived from HPMI and cumulative water saturation with different NMR T2. The NMR T2 and corresponding pore throat sizes with the same saturation can be determined. The power function relation is used to fit the correlation between pore throat sizes and the corresponding NMR T2 value (Figure 10). The unknown nonlinear conversion coefficient C and exponent n can be determined with least square method. For A48, the obtained nonlinear conversion coefficient and exponent is C = 0.053 μm/ms and n = 2.4834 , respectively. Then PTSD can be obtained according to Equation (9). As Figure 11 shows, the range of obtained PTSD from the nonlinear conversion is wider than that derived from HPMI, varying from 1 nm to1 μm. The fluctuations in the PTSD curve can be observed, and the characteristic bimodal distribution is retained.
Table 4 shows the obtained nonlinear conversion coefficients C and exponents n for all the core plugs. The nonlinear conversion coefficients C varies from 0.0028 μm/ms (A58) to 0.0249 μm/ms (Z47) with an average value of 0.0093 μm/ms, and the exponent n changes from 0.37 (Z92) to 0.89 (A51) with an average value of 0.725. The correlations between the nonlinear conversion coefficients and core RQI are shown in Figure 12. The correlation between RQI and nonlinear conversion coefficients are not obvious, but the exponents n increase logarithmically and approach 1 with the increase in RQI. The nonlinear conversion exponent n introduces a stretching component to NMR T2 spectra for conversion, and its value may reflect a potential change in the ratio of throat radius to the radius of pore body. The higher the core RQI is, the larger the exponent n will be. For the core plug with ultra-low permeability and porosity, the ratio of throat radius to the radius of pore body is small, which may lead to the small value of the exponent n .

5.3. Discussions

Figure 13 presents the comparisons between the PTSD obtained from HPMI and PTSD derived from linear conversion and nonlinear conversion. In general, the results of linear conversion and nonlinear conversion are both acceptable compared with PTSD obtained from HPMI. However, small differences can be observed. The PTSD range derived from nonlinear conversion is a slightly wider than that derived using linear conversion, but the maximum PTSD value of linear conversion is higher, and even greater than PTSD obtained from HPMI. However, compared with linear conversion results, nonlinear conversion results retain some special characteristics of PTSD, such as bi-modal distribution and the location of the peak value of PSD distribution. Taking the core plug A48 as an example, the PTSD obtained from HPMI reveals that pore throat size mainly distributes between 0.1 μm and 0.6 μm, and PTSD derived from the nonlinear conversion method shows the same characteristic, but the maximum pore radius distribution of PTSD derived from linear conversion is small than that derived from HPMI.
As show in Table 5, the average pore radius r ¯ converted from the linear conversion method and the nonlinear conversion method are compared with the r ¯ derived from HPMI measurements. The converted r ¯ is close to the r ¯ derived from HPMI measurements both for the linear conversion method and the nonlinear conversion method. The average error of nonlinear conversion results is 8.6%, less than that of linear conversion results, which is 11.5%. The linear conversion method converts the NMR T2 spectra to PTSD through multiplying a constant value, and the shape of the obtained PTSD curve is the same to NMR T2 spectra, but some special characteristics of PTSD, such as bimodal distribution, are missing during the process of linear conversion. The nonlinear conversion method is more flexible than the linear conversion method, and the derived PTSD is closer to that obtained from HPMI, as shown in Table 5.

6. Case Study

The linear conversion method with the conversion coefficient of 0.0099 μm/ms, is used to convert NMR T2 spectra to PTSD in a well of the Ordos Basin, China. The nonlinear method with conversion coefficient of 0.0121 μm/ms and the exponent n of 0.803, is used to convert NMR T2 spectra to PTSD in the same well. Moreover, the radii of averaged pore throats are calculated by the two methods. The results are shown in Figure 14. The gamma-ray log (GR) and caliper log (CAL) are shown in the first track. The compensated neutron log (CNL), density log (DEN), and acoustic log (AC) are shown in the second track. The resistivity logs are shown in the third track. NMR total porosity data are shown in the fourth track. T2 distributions are shown in the fifth track. The sixth track includes the PTSD converted with the nonlinear method, and the seventh track includes the PTSD converted with the linear method. The eighth track includes the results of the radii of averaged pore throats obtained by the two methods.
In Figure 14, there are several differences between the results derived from two different conversion methods. The results of the nonlinear conversion method exhibit a gentle slope in the low-pressure section and a steep slope in the high-pressure section, and this characterization is consistent with the NMR T2 distributions of this well. In contrast, the linear conversion results exhibit several large errors. In the X760m–X762m interval, the NMR porosity is the highest, and the part of the large T2 distributions holds an advantage relative to the part of the small T2 distributions. This interval is the most high-quality reservoir of this well. The shape of Pc curve obtained by the nonlinear conversion method is gentle, and the radii of averaged pore throats is big (the blue line), while the shape of Pc curve obtained by the linear conversion method is steep and the radii of averaged pore throats is small (the pink line). In conclusion, the results of the nonlinear conversion method confirm PTSD characterization in this well.

7. Conclusions

The PTSD characteristics of tight sandstones from Yanchang Formation, Ordos Basin of China are investigated with NMR and HPMI measurements in this paper. With the assumptions of the linear and the power function correlations between NMR T2 and pore throat sizes, the linear conversion method and the nonlinear conversion method are used to convert NMR T2 spectra to PTSD, respectively. Several conclusions can be drawn, as follows:
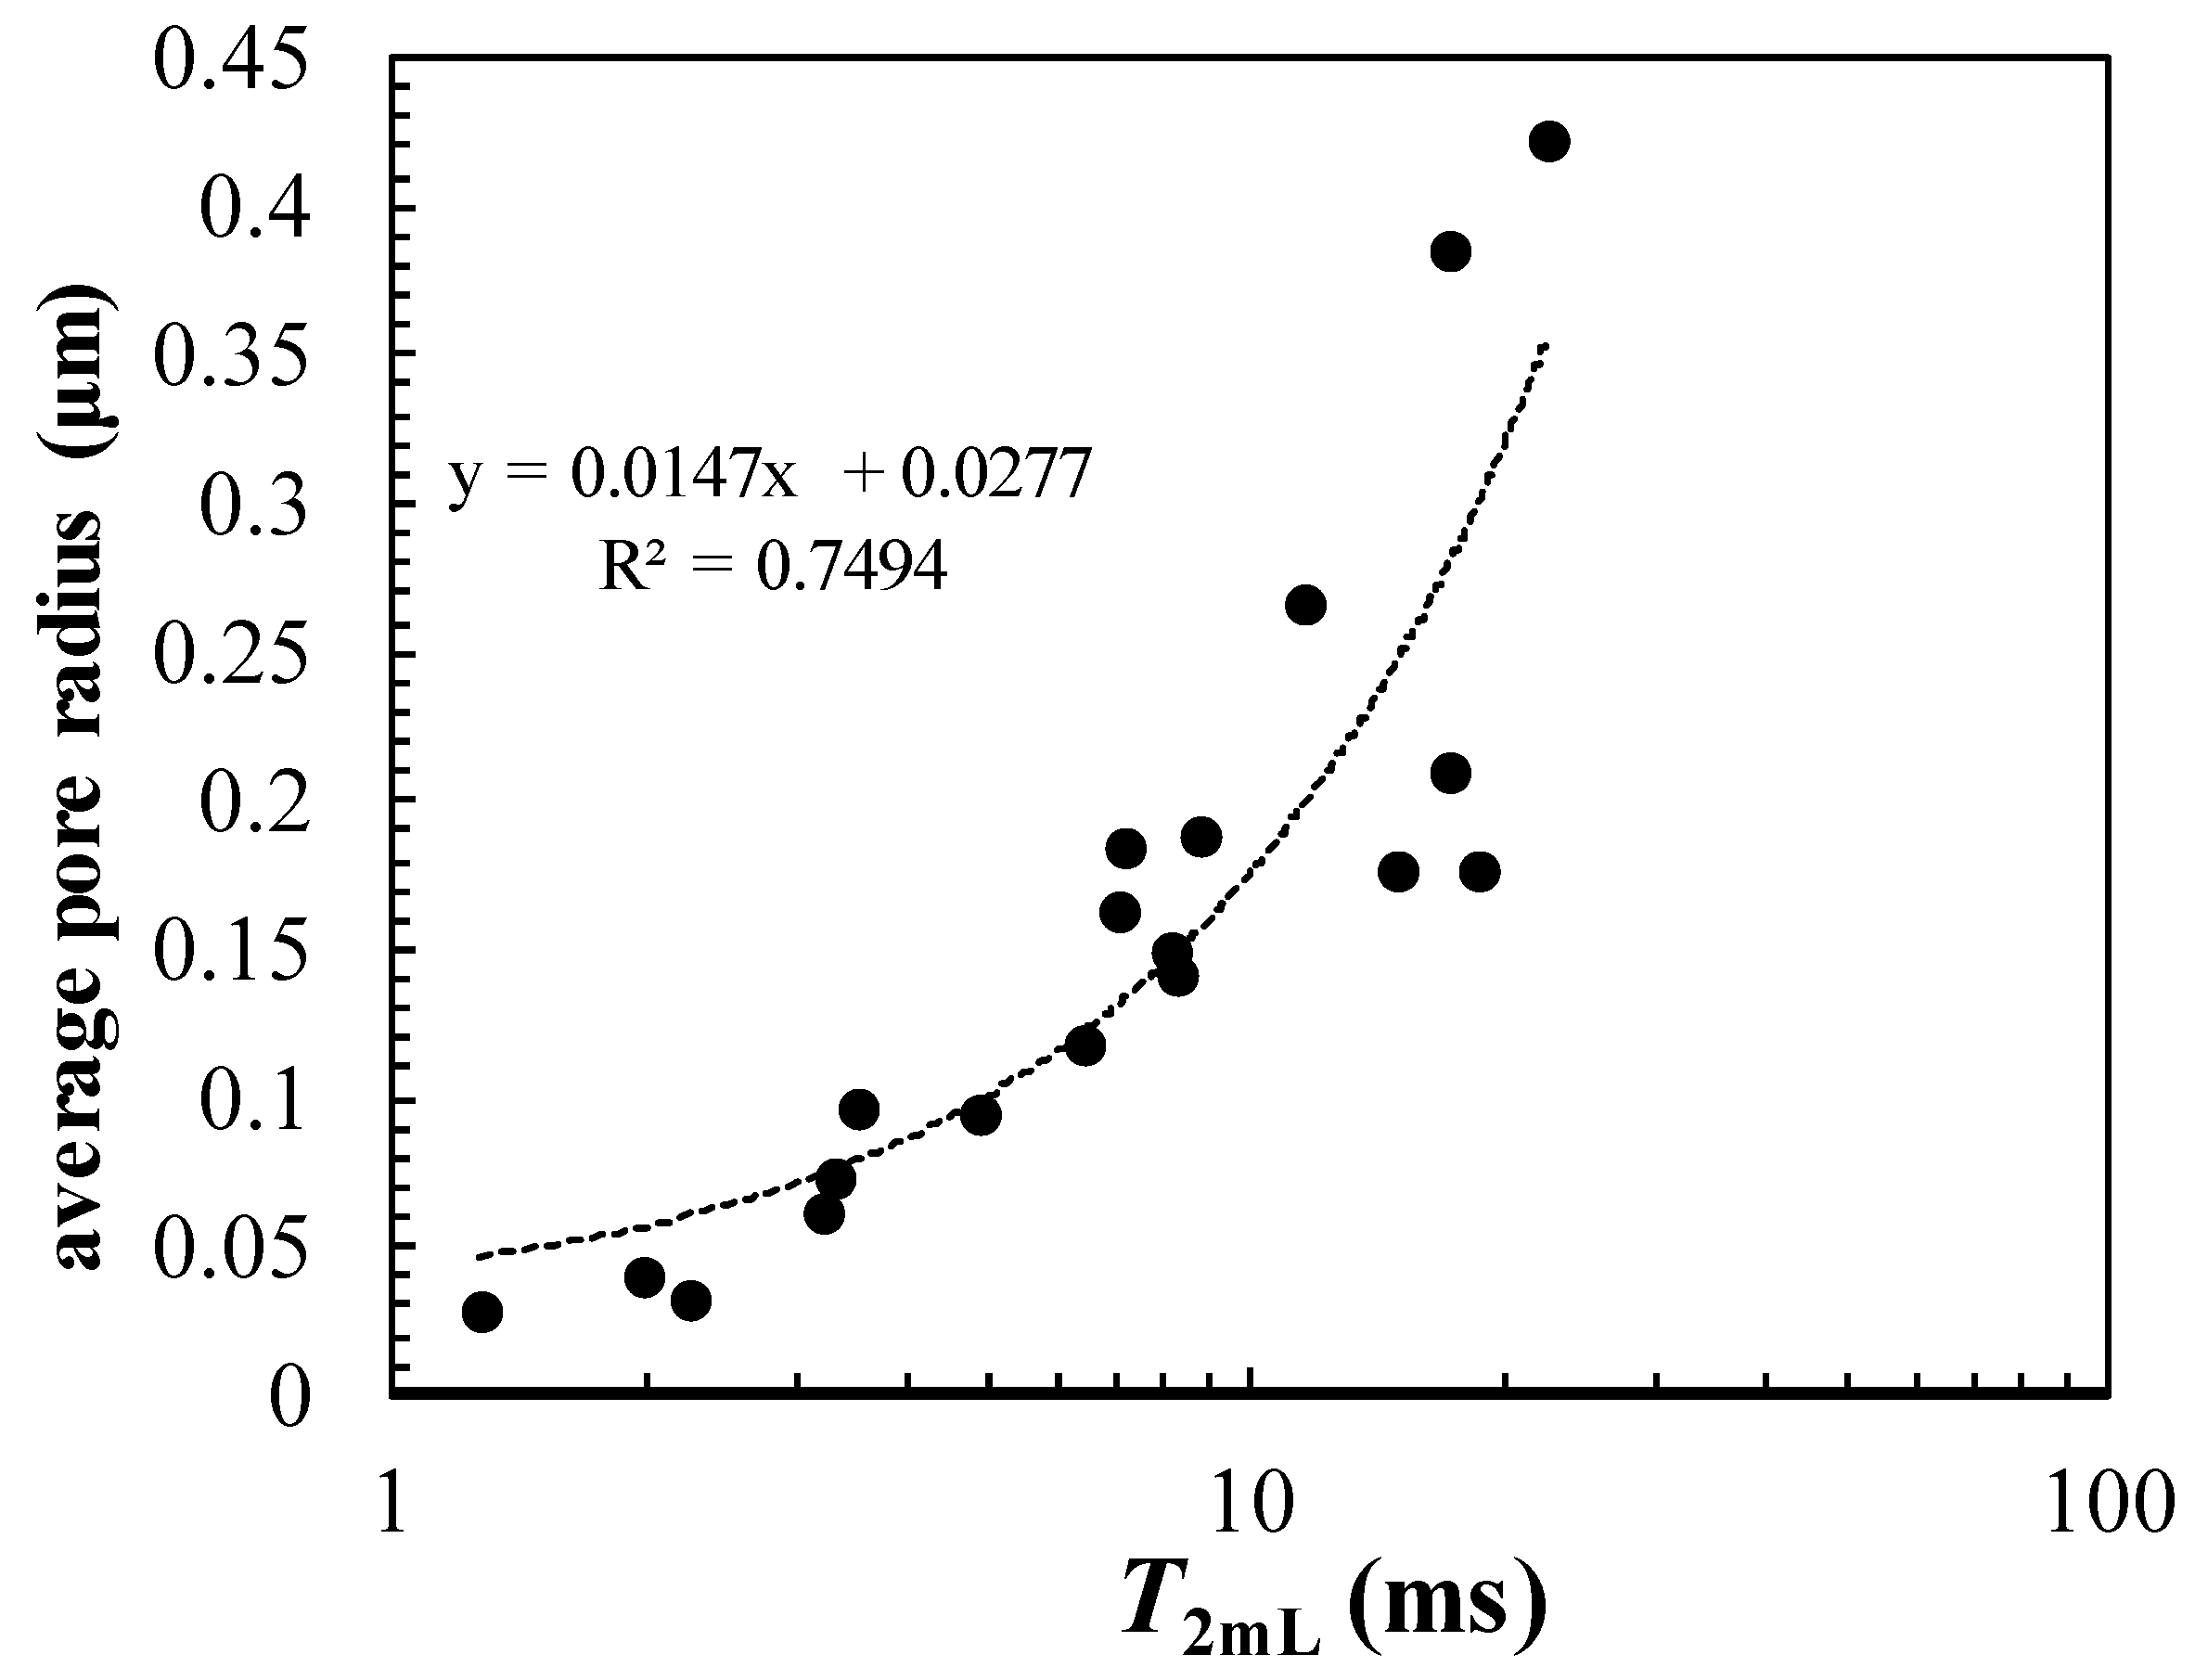
  • The obtained linear conversion coefficients for tight sandstone core plugs studied in this paper vary from 0.0068 μm/ms to 0.0266 μm/ms, with an average value of 0.0133 μm/ms.
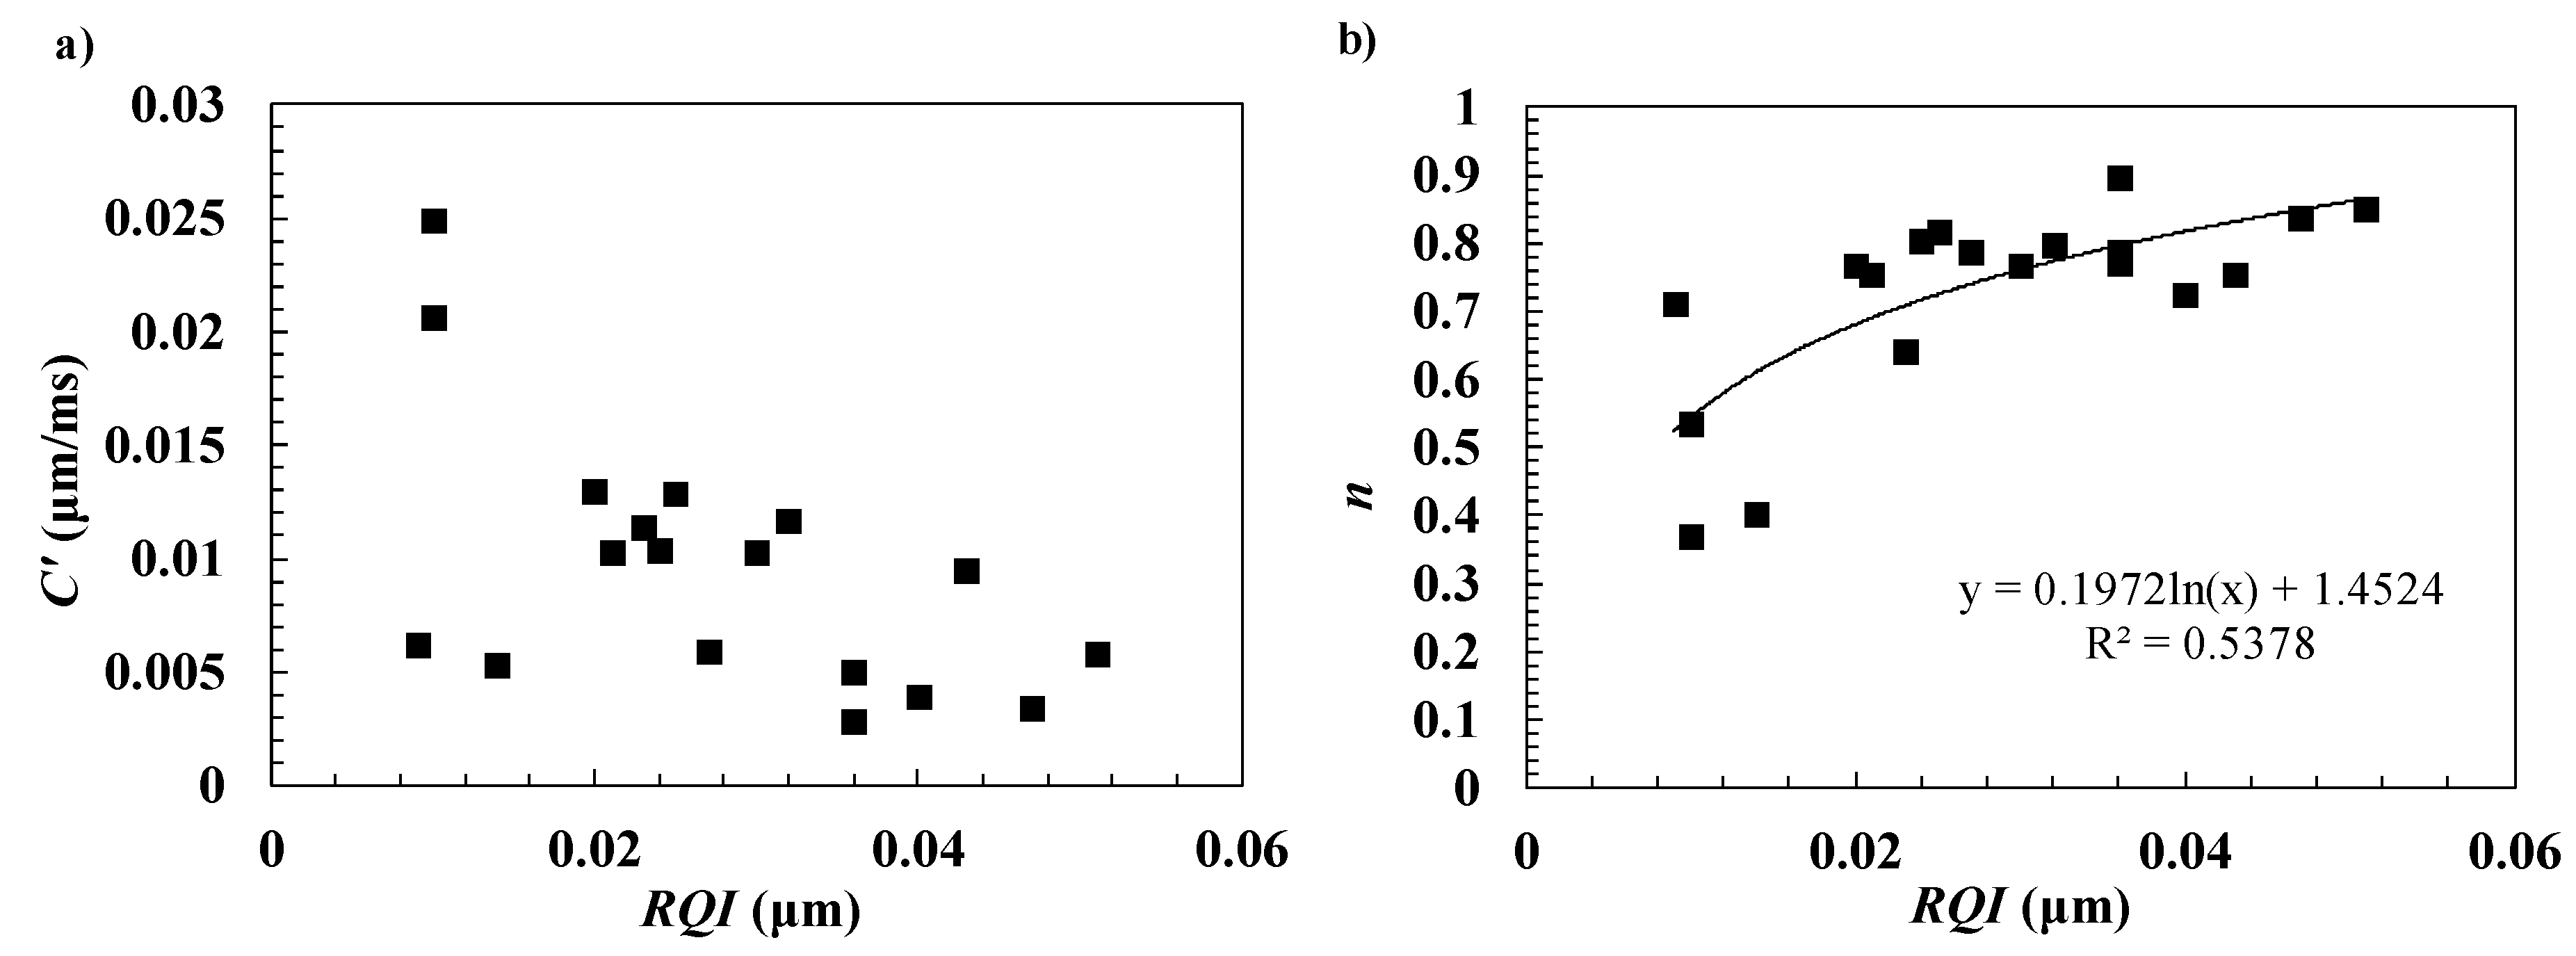
  • The nonlinear conversion coefficients vary from 0.0028 μm/ms to 0.0249 μm/ms with an average value of 0.0093 μm/ms, and the exponents change from 0.37 to 0.89 with an average value of 0.725. With RQI increasing, the exponents increase logarithmically and approach to 1.
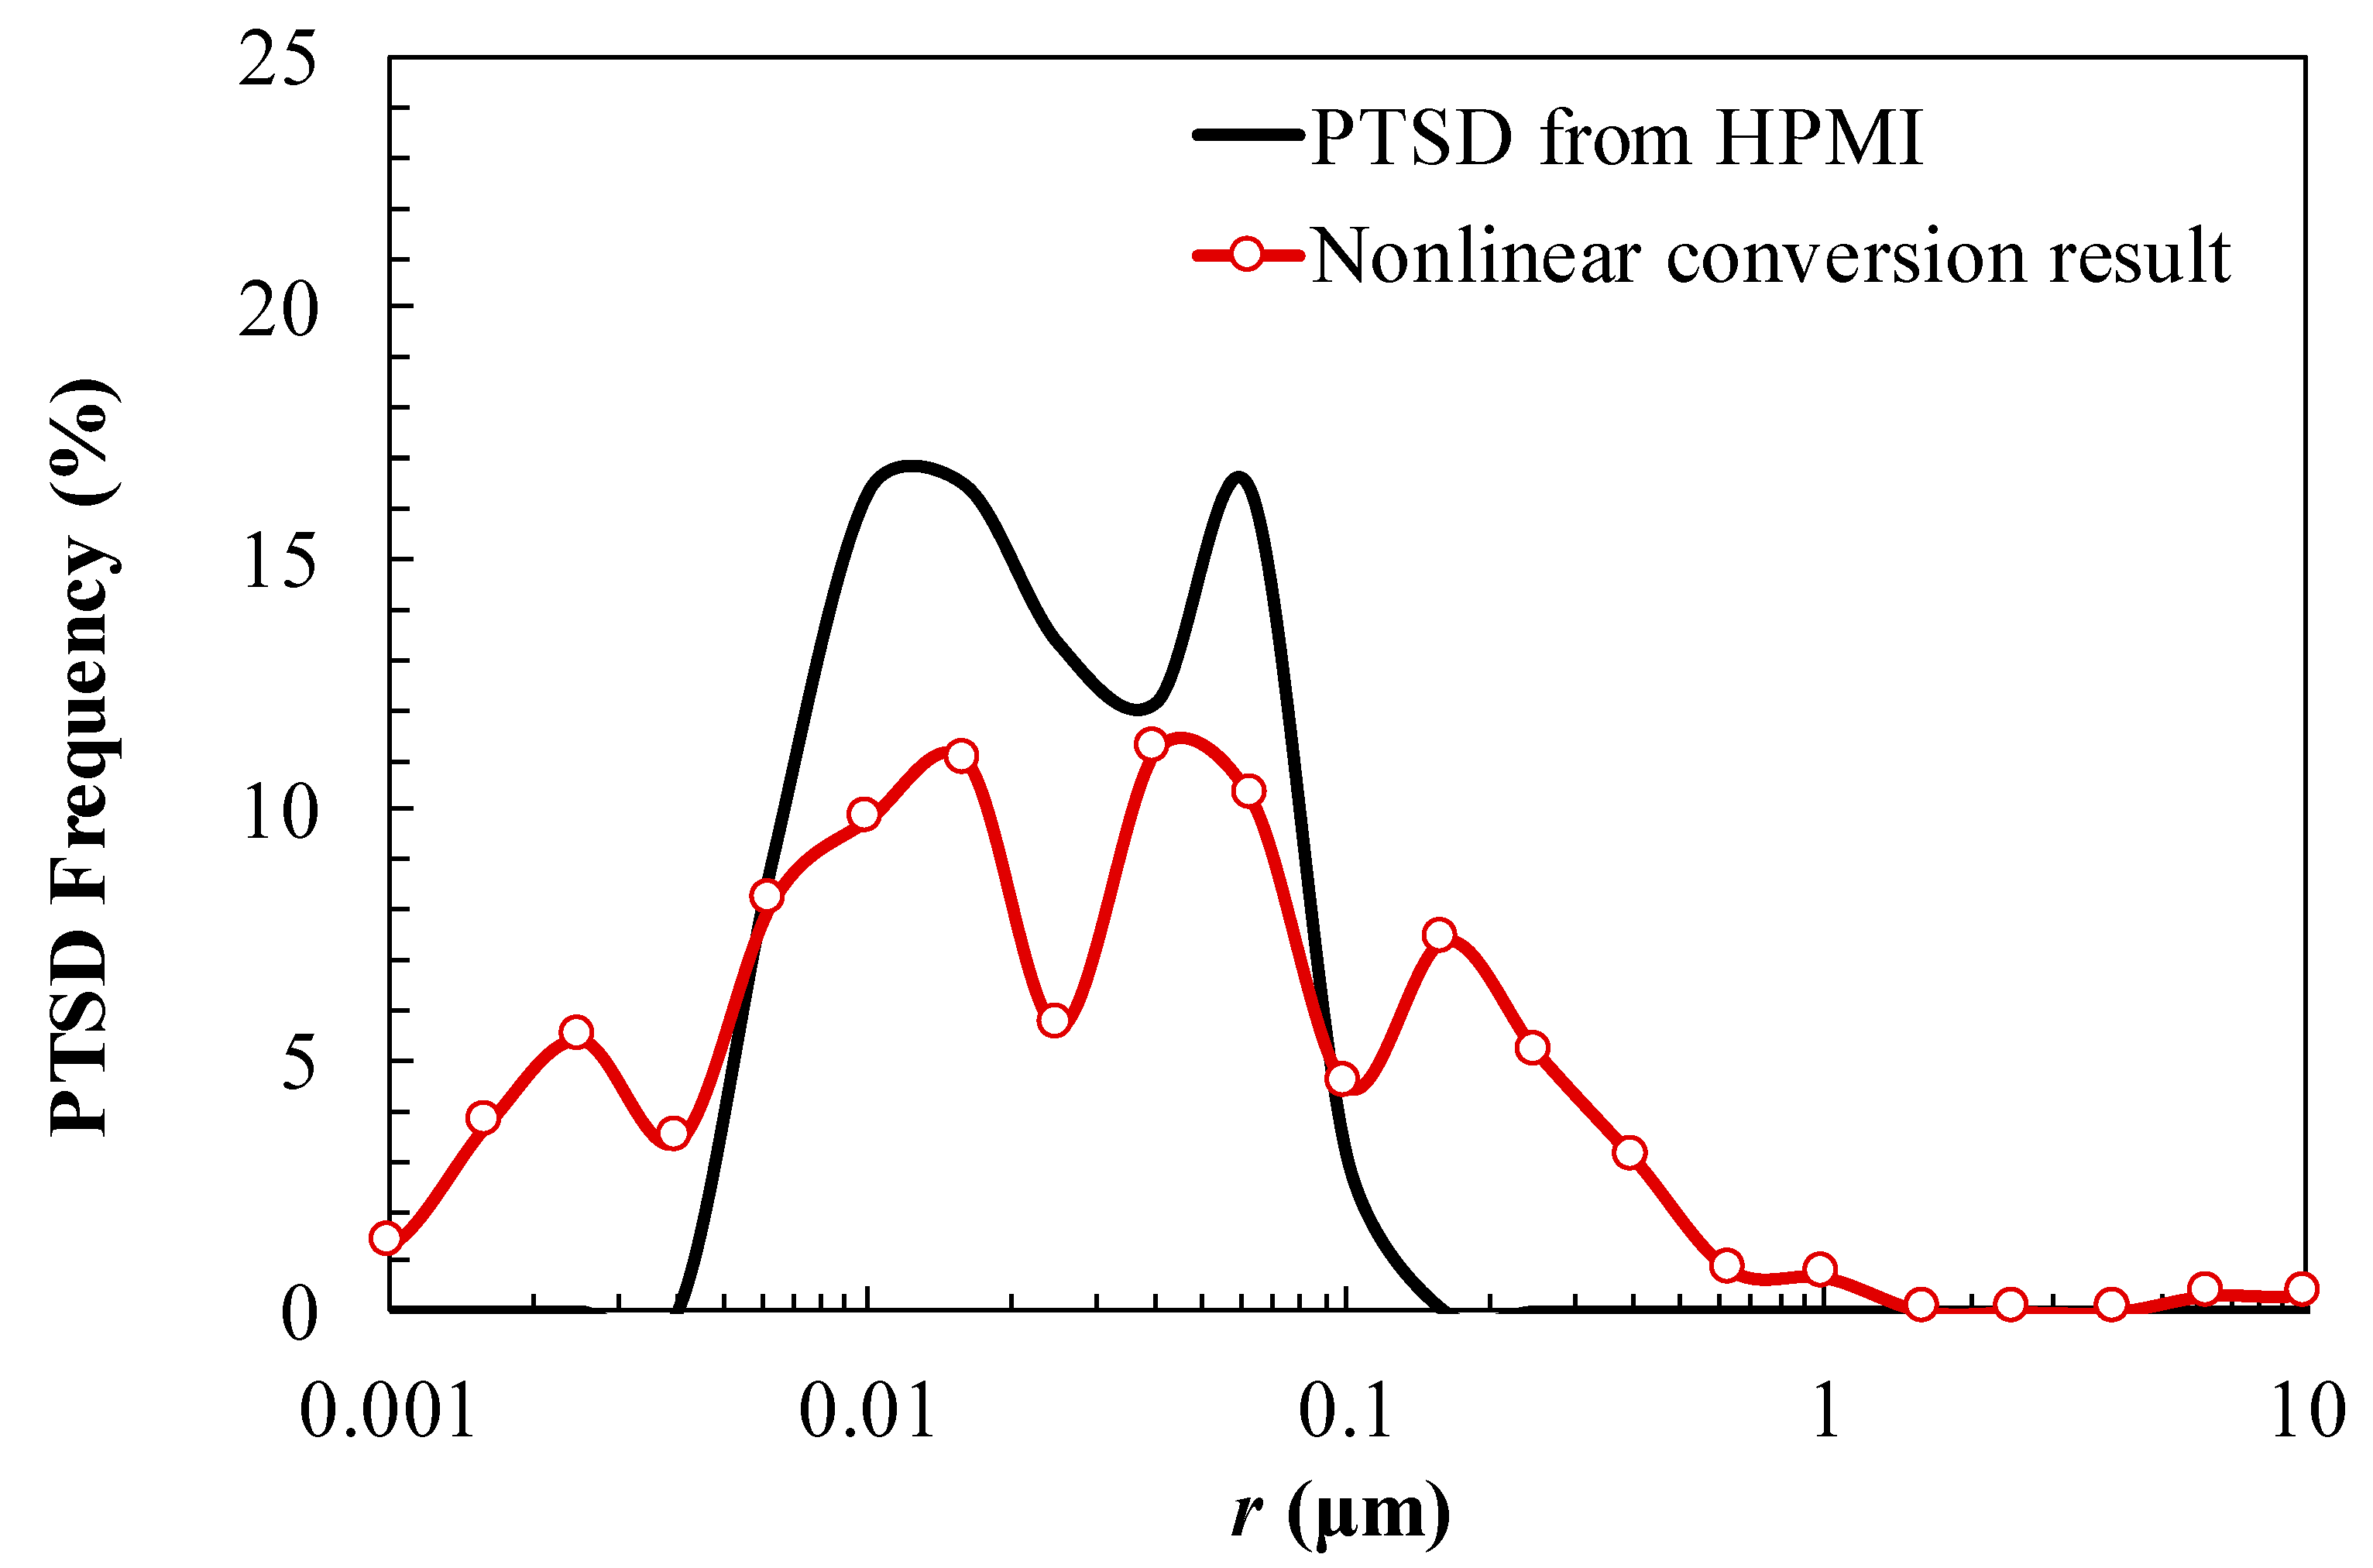
  • The PTSD obtained from NMR spectra by the nonlinear conversion method is wider than that obtained from linear conversion method, but the nonlinear conversion method can retain some special characteristics of PTSD, such as bi-modal distribution.

Author Contributions

Experiment, H.X., Y.F., F.H., C.L., and J.Y.; methodology, Z.L.; data analysis and writing, F.W.

Funding

This work was supported by the Petrochina scientific research project (No: kt2018-10-07).

Acknowledgments

We thank the company contributing the core samples used in this study and are especially grateful to Jinyu Zhou and Changsheng Wang for their help in obtaining these materials.

Conflicts of Interest

The authors declare no conflict of interest.

References

  1. Jia, C.; Zou, C.; Li, J.; Li, D.; Zheng, M. Assessment criteria, main types, basic features and resource prospects of the tight oil in China. Acta Pet. Sin. 2012, 33, 343–350. [Google Scholar]
  2. Zou, C.; Zhu, R.; Bai, B.; Yang, Z.; Hou, L.; Zha, M.; Fu, J.; Shao, Y.; Liu, K.; Cao, H.; et al. Significance, Geologic Characteristics, Resource Potential and Future Challenges of Tight Oil and Shale Oil. Bull. Mineral. Petrol. Geochem. 2015, 34, 3–17. [Google Scholar]
  3. Wang, F.; Zhao, J. A mathematical model for co-current spontaneous water imbibition into oil-saturated tight sandstone: Upscaling from pore-scale to core-scale with fractal approach. J. Pet. Sci. Eng. 2019, 17, 376–388. [Google Scholar] [CrossRef]
  4. Wanniarachchi, W.; Ranjith, P.G.; Perera, M.; Lashin, A.; Al Arifi, N.; Li, J.C. Current opinions on foam-based hydro-fracturing in deep geological reservoirs. Geomech. Geophys. Geo-Energy Geo-Resour. 2015, 1, 121–134. [Google Scholar] [CrossRef]
  5. Wang, F.; Yang, K.; Cai, J. Fractal Characterization of Tight Oil Reservoir Pore Structure Using Nuclear Magnetic Resonance and Mercury Intrusion Porosimetry. Fractals 2018, 26, 1840017. [Google Scholar] [CrossRef]
  6. Ngo, V.T.; Lu, V.D.; Le, V.M. A comparison of permeability prediction methods using core analysis data for sandstone and carbonate reservoirs. Geomech. Geophys. Geo-Energy Geo-Resour. 2018, 4, 129–139. [Google Scholar] [CrossRef]
  7. Yao, Y.; Liu, D. Comparison of low-field NMR and mercury intrusion porosimetry in characterizing pore size distributions of coals. Fuel 2012, 95, 152–158. [Google Scholar] [CrossRef]
  8. Fang, T.; Zhang, L.; Liu, N.; Zhang, L.; Wang, W.; Yu, L.; Li, C.; Lei, Y. Quantitative characterization of pore structure of the Carboniferous–Permian tight sandstone gas reservoirs in eastern Linqing depression by using NMR technique. Pet. Res. 2018, 3, 110–123. [Google Scholar] [CrossRef]
  9. Anovitz, L.M.; Cole, D.R. Characterization and Analysis of Porosity and Pore Structures. Rev. Mineral. Geochem. 2015, 80, 61–164. [Google Scholar] [CrossRef] [Green Version]
  10. Wang, F.; Jiao, L.; Liu, Z.; Tan, X.; Wang, C.; Gao, J. Fractal Analysis of Pore Structures in Low Permeability Sandstones Using Mercury Intrusion Porosimetry. J. Porous Media 2018, 21, 1097–1119. [Google Scholar] [CrossRef]
  11. Wu, H.; Zhang, C.; Ji, Y.; Liu, R.; Cao, S.; Chen, S.; Zhang, Y.; Wang, Y.; Du, W.; Liu, G. Pore throat characteristics of tight sandstone of Yanchang Formation in eastern Gansu, Ordos Basin. Pet. Res. 2018, 3, 33–43. [Google Scholar] [CrossRef]
  12. Wang, F.; Lian, P.; Jiao, L.; Liu, Z.; Zhao, J.; Gao, J. Fractal Analysis of Microscale and Nanoscale Pore Structures in Carbonates Using High-Pressure Mercury Intrusion. Geofluids 2018, 2018, 4023150. [Google Scholar] [CrossRef]
  13. Gane, P.A.C.; Ridgway, C.J.; Lehtinen, E.; Valiullin, R.; Furó, I.; Schoelkopf, J.; Paulapuro, H.; Daicic, J. Comparison of NMR Cryoporometry, Mercury Intrusion Porosimetry, and DSC Thermoporosimetry in Characterizing Pore Size Distributions of Compressed Finely Ground Calcium Carbonate Structures. Ind. Eng. Chem. Res. 2004, 43, 7920–7927. [Google Scholar] [CrossRef]
  14. Mao, Z.Q.; Yu-Dan, H.E.; Ren, X.J. An Improved Method of Using NMR T2 Distribution to Evaluate Pore Size Distribution. Chin. J. Geophys. 2005, 48, 412–418. [Google Scholar] [CrossRef]
  15. Daigle, H.; Johnson, A. Combining Mercury Intrusion and Nuclear Magnetic Resonance Measurements Using Percolation Theory. Transp. Porous Media 2016, 111, 669–679. [Google Scholar] [CrossRef]
  16. Gong, Y.; Liu, S.; Zhao, M.; Xie, H.; Liu, K. Characterization of micro pore throat radius distribution in tight oil reservoirs by NMR and high pressure mercury injection. Pet. Geol. Exp. 2016, 38, 389–394. [Google Scholar]
  17. Li, X.; Kang, Y.; Haghighi, M. Investigation of pore size distributions of coals with different structures by nuclear magnetic resonance (NMR) and mercury intrusion porosimetry (MIP). Measurement 2018, 116, 122–128. [Google Scholar] [CrossRef]
  18. Marschall, D.; Gardner, J.S.; Mardon, D.; Coates, G.R. Method for correlating NMR relaxometry and mercury injection data. In Proceedings of the Transactions of the 1995 Symposium SCA, San Francisco, CA, USA, 12–14 September 1995. Paper 9511. [Google Scholar]
  19. Volokitin, Y.; Looyestijn, W.J.; Slijkerman, W.F.J.; Hofman, J.P. A practical approach to obtain primary drainage capillary pressure curves from NMR core and log data. Petrophysics 2001, 42, 334–343. [Google Scholar]
  20. Wang, X.W.; Yang, Z.M.; Hai-Bo, L.I.; Guo, H.K. Experimental study on pore structure of low permeability core with NMR spectra. J. Southwest Pet. Univ. 2010, 32, 69–72. [Google Scholar]
  21. Li, A.; Ren, X.; Wang, G.; Wang, Y.; Jiang, K. Characterization of pore structure of low permeability reservoirs using a nuclear magnetic resonance method. J. China Univ. Pet. 2015, 6, 92–98. [Google Scholar]
  22. Xiao, L.; Zou, C.; Mao, Z.; Jin, Y.; Zhu, J. A new technique for synthetizing capillary pressure (Pc) curves using NMR logs in tight gas sandstone reservoirs. J. Pet. Sci. Eng. 2016, 145, 493–501. [Google Scholar] [CrossRef]
  23. Washburn, E.W. The dynamics of capillary flow. Phys. Rev. 1921, 17, 273. [Google Scholar] [CrossRef]
  24. Coates, G.R.; Xiao, L.; Prammer, M.G. NMR Logging: Principles and Applications; Haliburton Energy Services Houston: Houston, TX, USA, 1999. [Google Scholar]
  25. Hiller, T.; Klitzsch, N. Joint inversion of nuclear magnetic resonance data from partially saturated rocks using a triangular pore model. Geophysics 2018, 83, JM15–JM28. [Google Scholar] [CrossRef]
  26. Amaefule, J.O.; Altunbay, M.; Tiab, D.; Kersey, D.G.; Keelan, D.K. Enhanced Reservoir Description: Using Core and Log Data to Identify Hydraulic (Flow) Units and Predict Permeability in Uncored Intervals/Wells. In Proceedings of the SPE Annual Technical Conference and Exhibition, Houston, TX, USA, 3–6 October 1993. [Google Scholar]
  27. Soeder, D.J.; Randolph, P.L. Porosity, Permeability, and Pore Structure of the Tight Mesaverde Sandstone, Piceance Basin, Colorado. SPE Form. Eval. 1987, 2, 129–136. [Google Scholar] [CrossRef]
Figure 1. The types and distributions of minerals in the core plugs from five different zones.
Energies 12 01528 g001
Figure 2. Nuclear magnetic resonance (NMR) T2 spectra of 20 core plugs.
Energies 12 01528 g002
Figure 3. Mercury intrusion capillary pressure curves of 19 core plugs.
Energies 12 01528 g003
Figure 4. Comparison between pore throat size distribution (PTSD) derived from high-pressure mercury intrusion (HPMI) tests and NMR T2 spectra: (a) Mercury intrusion capillary pressure of three core plugs; (b) PTSD derived from HPMI test and NMR T2 spectra for the core plug A48; (c) PTSD derived from HPMI test and NMR T2 spectra for the core plug H94; (d) PTSD derived from HPMI test and NMR T2 spectra for the core plug Z92.
Energies 12 01528 g004
Figure 5. The relationship between average pore radius r ¯ and T 2 ML of 19 core plugs.
Energies 12 01528 g005
Figure 6. Comparison between the measured PTSD from HPMI and the converted PTSD from NMR with different linear conversion coefficient for Z39.
Energies 12 01528 g006
Figure 7. Total errors of linear conversion using different linear conversion coefficients for Z39.
Energies 12 01528 g007
Figure 8. Comparison between the converted PTSD from NMR T2 spectra and the measured PTSD from HPMI for Z39.
Energies 12 01528 g008
Figure 9. The cumulative mercury saturation with different pore throat sizes and cumulative water saturation with different NMR T2 for Z39.
Energies 12 01528 g009
Figure 10. The pore throat sizes and corresponding NMR T2 are fitted with a power function.
Energies 12 01528 g010
Figure 11. Comparison of the PTSD derived from HPMI with the PTSD obtained from nonlinear conversion.
Energies 12 01528 g011
Figure 12. The correlation between nonlinear conversion parameters and reservoir quality index (RQI) of core plugs: (a) the correlation between the nonlinear conversion coefficients C and RQI of core plugs; (b) the correlation between nonlinear conversion exponents n and RQI.
Energies 12 01528 g012
Figure 13. Comparisons of linear conversion results and nonlinear conversion results of four typical core plugs: (a) core plug A48; (b) core plug B17; (c) core plug Z33; (d) core plug Z39.
Energies 12 01528 g013
Figure 14. Comparisons of linear conversion results and nonlinear conversion results for a well from the Ordos Basin, China.
Energies 12 01528 g014
Table 1. Parameters of the core plugs.
ZoneCore No.Porosity (%) K a i r (mD) T 2 mL (ms) r ¯ (μm)RQI (μm)FZI (μm)
ϕ g ϕ NMR
AA248.5008.5000.0628.2640.1420.0270.289
A487.4006.7000.09718.6490.1760.0360.450
A517.3006.8000.09815.0520.1760.0360.462
A587.7007.1000.09917.2620.2090.0360.427
Max8.5008.5000.09918.6490.2090.0360.462
Min7.3006.7000.0628.2640.1420.0270.289
Avrg7.7257.2750.08914.8070.1760.0340.407
BB178.1008.1000.0374.8910.0950.0210.241
B197.1006.6000.0283.3110.0730.0200.258
B4511.50010.9000.2178.7720.1870.0430.332
B1142.1001.9000.0031.436-0.0120.553
Max11.50010.9000.2178.7720.1870.0430.553
Min2.1001.9000.0031.4360.0730.0120.241
Avrg7.2006.8750.0714.6030.1180.0240.346
HH665.2005.2000.0317.2500.1830.0240.442
H906.2006.0000.10311.5950.2660.0400.612
H919.4009.4000.21422.2730.4220.0470.457
H9410.0009.9000.26217.1480.3840.0510.457
Max10.0009.9000.26222.2730.4220.0510.612
Min5.2005.2000.0317.2500.1830.0240.442
Avrg7.7007.6250.15314.5670.3140.0410.492
YY1511.20010.9000.1058.1470.1490.0300.241
Y5311.00010.4000.1157.0710.1630.0320.260
Y649.7007.6000.0083.2180.0610.0090.084
Y7512.20011.8000.0756.4620.1180.0250.177
Max12.20011.8000.1158.1470.1630.0320.260
Min9.7007.6000.0083.2180.0610.0090.084
Avrg11.02510.1750.0766.2250.1230.0240.191
ZZ337.9007.7000.0443.5440.0970.0230.273
Z393.7003.1000.0072.2270.0320.0140.355
Z474.7004.3000.0051.9710.0400.0100.208
Z924.9004.6000.0051.2770.0280.0100.195
Max7.9007.7000.0443.5440.0970.0230.355
Min3.7003.1000.0051.2770.0280.0100.195
Avrg5.3004.9250.0152.2550.0490.0140.258
Table 2. Mineral content obtained from QUEMSCAN measurements.
MineralContent (%)
A24B19H90Y15Z33
quartz30.9252.0930.3753.4333.54
albite31.2214.530.0214.6325.88
illite3.079.484.367.479.2
K-feldspar8.687.1813.85.319.58
chlorite9.393.686.082.449.86
muscovite1.172.741.052.452.22
dolomite0.012.610.014.052.61
biotite1.431.242.010.781.91
siderite01.2500.970
kaolinite7.621.21.921.040.57
calcite4.142.418.251.733.06
rutile0.560.30.120.270.32
apatite0.430.230.180.180.27
smectite0.130.140.140.140.13
paragonite0.030.040.010.030.01
ankerite00.0500.070
pyrite0.030.030.020.030.03
gypsum/anhydrite0.010000
andesine00.010.010.010.01
other1.160.821.654.970.8
Table 3. The optimal conversion coefficients and total errors for the linear conversion.
Core No.Optimal C (μm/ms) Total Error (μm)
A240.01016.48
A480.00688.27
A510.00727.43
A580.00716.98
B170.01536.12
B190.01855.96
B450.01437.08
H660.02667.04
H900.01136.06
H910.00775.47
H940.00916.89
Y150.01239.78
Y530.015110.15
Y640.01056.31
Y750.01169.46
Z330.02254.4
Z390.01266.9
Z470.01987.83
Z920.01528.92
Table 4. The obtained nonlinear conversion coefficient C and exponent n .
Core No.Nonlinear Conversion Coefficient C Exponent n Determination Coefficient R 2
A240.00590.7870.91
A480.00280.7870.92
A510.00500.8960.93
A580.00280.7710.93
B170.01030.7550.90
B190.01300.7660.89
B450.00950.7540.91
H660.01040.8050.93
H900.00390.7230.95
H910.00340.8370.96
H940.00580.8520.94
Y150.01030.7670.89
Y530.01170.7970.89
Y640.00620.7100.89
Y750.01290.8190.87
Z330.01140.6430.93
Z390.00530.4030.91
Z470.02490.5340.75
Z920.02060.3700.68
Table 5. Comparison of the calculated average pore radius from different conversion methods with the average pore radius derived from HPMI.
Core No. r ¯ Derived from HPMI
(μm)
Linear Conversion ResultsNonlinear Conversion Results
r ¯ (μm)Error (%) r ¯ (μm)Error (%)
A480.1760.14915.00.1855.3
B170.0950.0994.00.1016.7
Z330.0950.0923.60.0940.7
Z390.0320.02523.50.03921.8

