An Analysis on Barriers to Biomass and Bioenergy Development in Rural China Using Intuitionistic Fuzzy Cognitive Map


1
School of Economics and Management, China University of Geosciences, Wuhan 430074, China
2
Resources Environmental Economic Research Center, China University of Geosciences, Wuhan 430074, China
3
Business School, Xinyang Normal University, Xinyang 464000, China
*
Author to whom correspondence should be addressed.
Energies 2019, 12(9), 1598; https://doi.org/10.3390/en12091598
Submission received: 29 March 2019
/
Revised: 14 April 2019
/
Accepted: 24 April 2019
/
Published: 26 April 2019
(This article belongs to the Special Issue Biomass and Biofuels 2019)
Abstract
:Biomass is viewed as one of the critical renewable energies and it widely exists in nature. Developing bioenergy has been promoted as a viable mean of dealing with environment issues that are related to the utilization of fossil fuel. However, due to many obstacles, the biomass and bioenergy technology has not won widespread support in developing countries, like China, with vast land area, particularly in rural area. Furthermore, most existing researches just focused on the description of the influence factors, along with the solution to the technical problems, while many social factors are overlooked. In fact, the process of developing biomass is indeed complicated due to the need for consensus and active participation of the various stakeholders, such as the government, the industry, and the local residents. Therefore, while integrating the intuitionistic fuzzy logic and fuzzy cognitive map, this study constructs an intuitionistic fuzzy cognitive map (IFCM) that is in line with experts’ suggestions and the current literature to investigate how to promote the development of biomass through enhancing public acceptance. We conduct several simulations from the perspective of different stakeholders, according to the IFCM. The analysis results reveal the influence mechanism in the system and illustrate the effect of various factors that are stressed by every stakeholder. The research design also provides a reference for future studies.
1. Introduction
The utilization of fossil fuel is an essential driver for economic development, but it also leads to many serious problems (e.g., air pollution, greenhouse effect, energy depletion, and energy security). The threat of climate change as a result of greenhouse gas is attracting the global attention. To date, 181 parties have signed the Paris agreement, which states that all parties will put forward their best effort to work out climate change, so as to pursue to keep a global temperature rise below two degrees above pre-industrial levels [1]. Under this situation, sustainable development is stressed again, so the substitution of conventional energy by renewable energy attracts considerable attention, for which bioenergy is viewed as an important alternative with huge potential [2,3]. Biomass resources are potentially the world’s most substantial and most sustainable energy resource, providing 14% of the world’s energy [4,5,6]. Biomass accounts for 46% of national renewable energy in the United States (U.S.) [7]. Notably, in the rural area of the developing countries, biomass is not the only available energy source, as it was previously portrayed, but as an energy source that has a large range of feedstock and will continue to be widely used. The estimates of the potential of biomass source in Cameroon showed that all the biomass was able to generate 12 times the amount of national electricity production in 2010 [8], while considering that only the forest and agricultural residuals are used to generate electricity, the electricity generated from this biomass could meet 15–38% of the current national consumption [2]. The agricultural biomass residues are the most promising renewable energy source in Ghana, which could meet the growing rural energy demand [9]. In addition, biomass energy consumption had positive impacts on economic growth [10], and the direct socio-economic benefits of biomass use is a significant driver in the impletion of biomass projects [11]. What is more, biomass, such as forest residuals, straw, and agricultural crop, is commonly classified as a natural resource and the utilization of this biomass does not cause the extra increase of CO2 emission, which effectively supports the completion of emission reduction targets [4,6,7]. The use of plantation residuals showed the lowest impact on the local environment when compared with the current electricity production from natural gas [12].
In practice, in the current energy system, bioenergy is not dominant as compared to other traditional energies [12] due to its rare evidence of the vast potential of biomass. Additionally, numerous barriers prevent the development of biomass, which is related to several aspects, including socio-economical, technological, financial, policy, and political issue [11,13,14,15]. Typically, economic, along with policy and politics, are the two most significant barriers to the development of renewable energy [13] and the transportation problem is also a critical aspect in the barrier [12,13]. Moreover, in Cameroon and Zambia, the implementation of biomass project faced a considerable challenge due to the lack of research and the development of a bioenergy and financial support scheme [2,16]. Roopnarain and Adeleke also stated that the barrier to promote the biogas technology in Africa included a lack of finical support, such as the provision of loans and government assistance, but it is not limited to this [17]. Similarly, it is necessary to conduct some further researches regarding the optimization of biomass supply distance [12,18]. Moreover, enhancing the study on the mathematic modeling to deal with the trade-off between storage and transportation is imperative via investigating the animal waste-to-energy supply chains [3]. Furthermore, the engagement of all stakeholders is another critical aspect that we need to consider [3,16,17]. Svanberg et al. [3] directly pointed out that the cooperation between stable owner and energy company is needed to support the commercialization of conversion technology. What is more, the lack of public participation always results in the social amplification of the negative image of biomass technology, which is the main reason why the local residents feel anxious about the new biomass project and thus leads to failure [19,20]. Gasparatos et al. [21] demonstrated that the impact of incomplete understanding of biomass fuel is one of the most critical barriers in the development of biomass investments through a case study in the continent.
For economic and political issues, many researchers proposed corresponding suggestions regarding the particular biomass project. As to technology, the scholars focused on how to improve energy efficiency [22,23,24]. Accordingly, enlarging the use of biomass is not only feasible for technological and economic benefits, but is also significant in adding the substitute of the energy source for developing countries, although technology barriers still exist in some countries. Nevertheless, biomass source is not widely used due to the negative public attitude to the biomass. Furthermore, it is worth noting that public attitude has a complex interrelationship with the other factors mentioned above. That is the reason why we should construct a mathematical model to study how to reconcile the confliction between these factors. For instance, industry, policy, and forest management implications affected the financial viability of the biomass project [7]. Unfortunately, current studies are limited due to the lack of useful methods for the simple identification and description of the factors.
Fortunately, a popular participatory method for representing knowledge and modeling a complicated dynamic system is suitable for dealing with this real problem that involves many factors, as well as such uncertain and complex interrelations among them, that is, fuzzy cognitive map (FCM). FCM consists of fuzzy theory, neural network, expert system, evolutionary computing, and nonlinear dynamic system [25,26]. FCM is capable of combining accumulated knowledge and expert experience and it has the ability to incorporate various participators (i.e., individual, community, industry, and government) to an accessible and normal format, so it is usually employed as a soft computing and intelligent technique for simulating the human thinking process and reasoning process [27]. In recent years, FCM has been viewed as a promising modeling approach attracts much interest in various fields, such as medical decision support system [28,29,30,31,32], grading celiac disease [33], the supervision of multi-agent systems [34], predicting yield in cotton crop production [35], evaluating the renewable local planning [36], assessing critical success factors in high-risk emergency system [37,38], prediction [39], and decision making [40,41]. According to previous literatures, FCM has been applied to renewable energy area, but there is still a lack of researches on the public acceptance of renewable energy, which consider the participation of various stakeholders by fully taking advantage of FCM.
Under this situation, based on the integration of intuitionistic fuzzy set theory and fuzzy cognitive map, this study constructs a novel framework for quantifying the relationship among the factors, revealing the influencing mechanism, and then conducting scenario simulations to identify the key factor that influences the public acceptance of biomass, taking into account all stakeholders’ perception on biomass. All of these provide a novel insight on how to deal with the barriers to biomass utilization in developing countries.
2. Materials and Methods
This section provides the basic information regarding the intuitionistic fuzzy set and traditional fuzzy cognitive map (FCM), and it presents the process of the intuitionistic fuzzy cognitive map (IFCM) in detail.
2.1. The Basic Procedure of FCM
The fuzzy cognitive map is a popular semi-quantitative modeling approach for the representation of human thinking process and it is used to describe the causal and effect relationship among factors in the complex system. Kosko proposed FCM as a general extension of original cognitive map [42,43]. Axelrod first presented the cognitive map (CM) in 1976, aiming at tackling complex decision-making problems in the social science area [44], and then it is used in other fields, such as education, archaeology, planning, and urban management. CM consists of nodes and edge connections between these nodes. The nodes represent a set of concepts that are the variables in the real life system, while the edge between nodes is the causal relationship among these concepts extracted from the system. Every connecting edge with a plus or minus only shows whether the influence of one concept on another one is positive or negative, but not the degree of the influences. Due to the nature of the original cognitive map, there are some difficulties in dealing the practiced problems with a complicated relationship. Thus, FCM inheriting the essential features of CM is developed as an extension of CM.
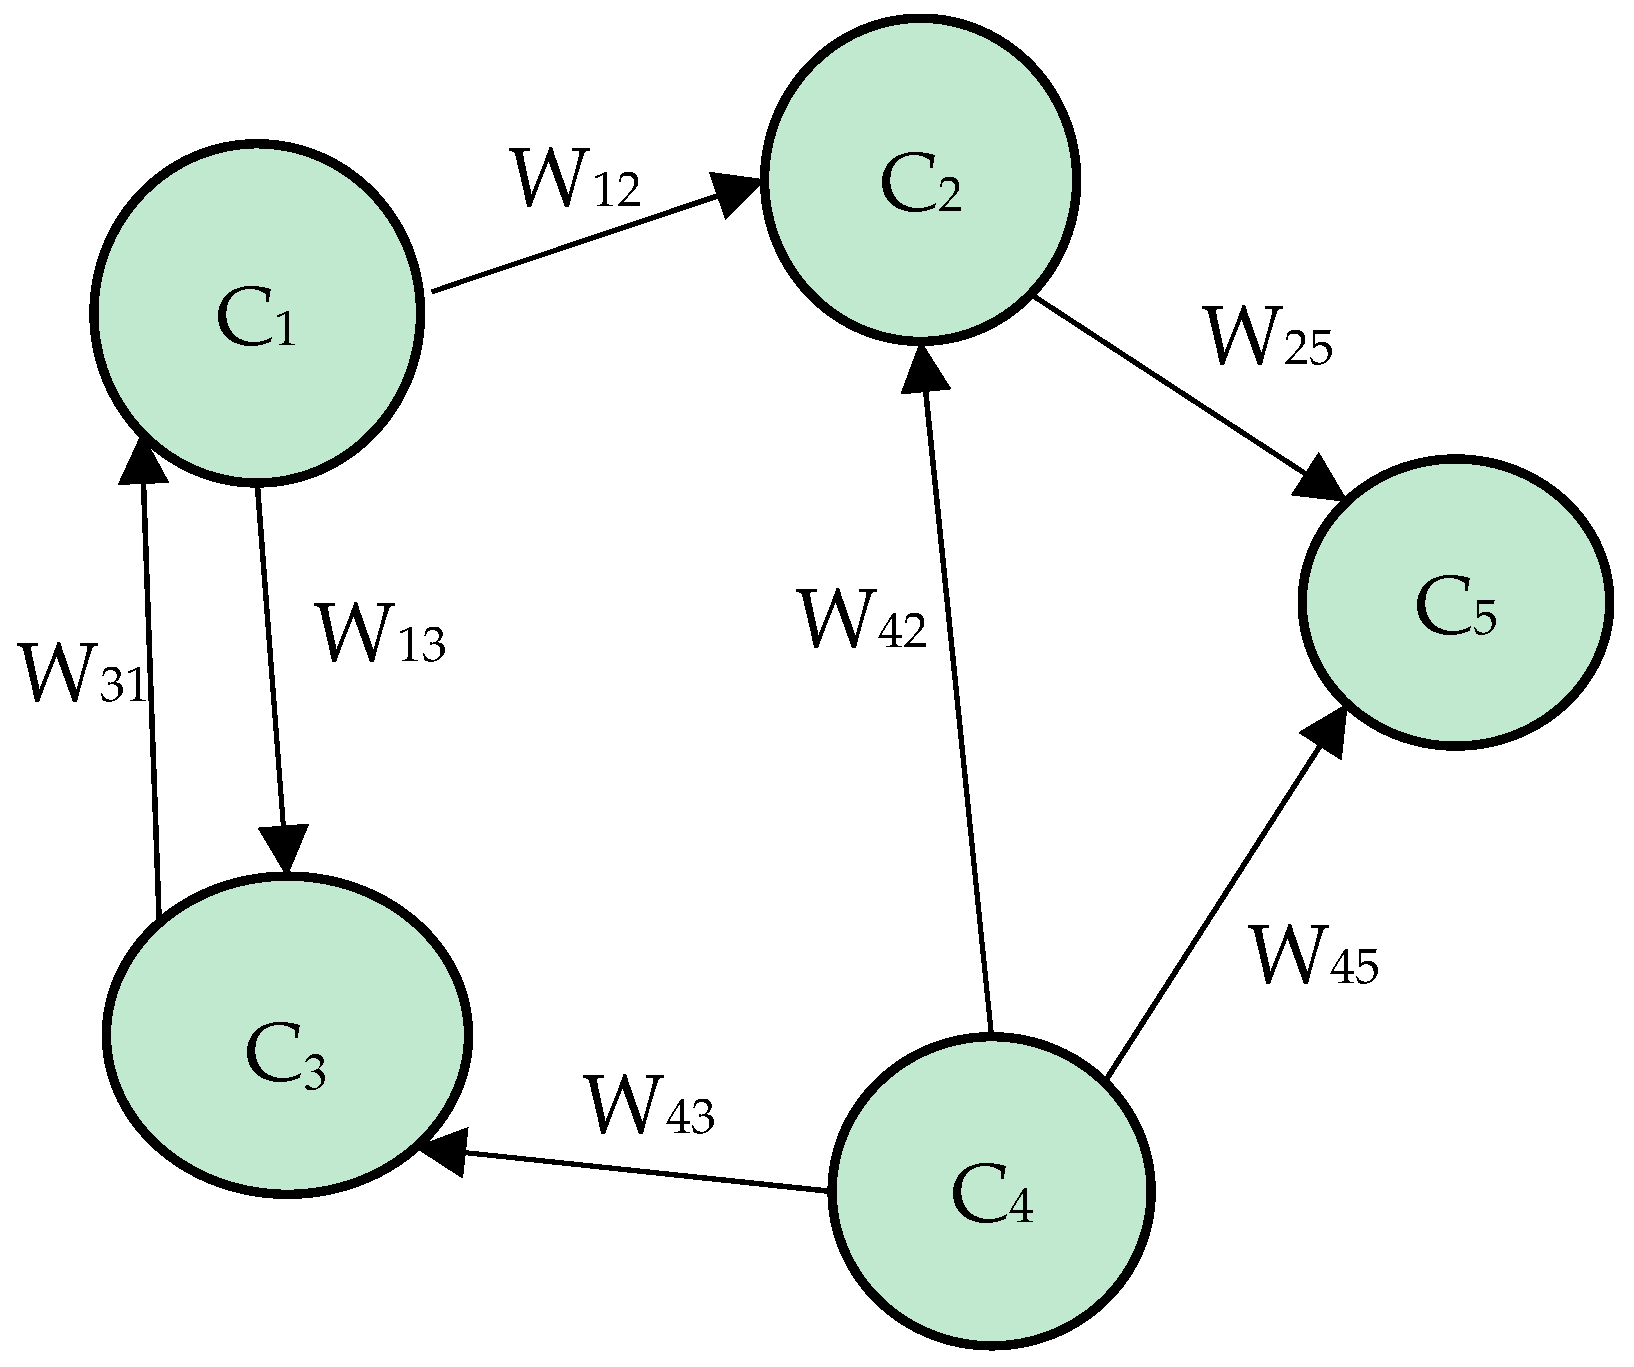
Generally, FCM is a computational modeling method with the ability to simulate a complicated system that involves a fuzzy or uncertain situation and is viewed as a directed graph that consists of nodes and weighted arcs, as shown in Figure 1. These nodes are the corresponding concepts that represent different variables, features, and states that are extracted from the described complex system [33]. Each node is assigned with a real number value to express a current state for a main feature in the modeled system at a specific time. The weighted edge is the causal relationship between these concepts.
Figure 1 is a graphic representation for a simple FCM model, with five nodes and seven weighted edges. In the mathematical model, FCM is represented as a pair , where and are the collection of the concepts and the relationship between them, respectively. The value of concept is in the [0,1] interval. The connecting edge specifies the direction and effects of the causal relationship between two concepts, and each edge has a weight in the interval , indicating the degree of the influences. Accordingly, is also named as connection matrix and it is expressed as Formulation (1), where represents the impact of on .
where is the number of concept in the practical system.
Obviously, the larger the absolute value of , the stronger the degree of the corresponding relation. However, the sign of shows different states of the causal relation between two concepts:
indicates the influence of on is positive. In other words, an increase or decrease in cause the same result in ;
expresses the negative casual relation between and , which means the change of will cause an opposite effect on ;
Whereas, suggests that there is no interconnection between and . According to these rules, the connection matrix in Figure 1 can be specified as Formulation (2).
As for FCM, during the simulation, the value of each concept at every simulation iteration is computed based on Formulation (3).
where is the simulation iteration, is the amount of the concept, and is the threshold function. Accordingly, and are the value of concept at the and iteration, respectively, and then is the value of concept at th iteration. Generally, the value of is selected. The simulation procedure will continue until the condition or is met, where is the residual that is determined by specific problems. It states that, when the modeled system enters a steady state, the condition is satisfied. The final values of all concepts are gained.
The threshold function has different types:
In Equation (6), is a constant and it determines the steepness of the threshold function. In most cases, the sigmoid function is used as the threshold function, so as to promise the value of the concepts is in the universe [33,37], and the value of is employed, which is approximate to a linear function and it outperformed the other functions in the literature [35,45].
We can outline the basic procedure of FCM, according to the description above:
Step 1: Invite experts to identify the factors relevant to the modeled system.
In this stage, a group of experts that are related to this issue should determine the element that comprises the FCM model based on their own experience or knowledge. Subsequently, all of the experts work together to identify the final elements and construct the FCM model that can be accepted by all experts. Furthermore, the expert describes the interrelation among these elements. They point out whether there is a causal and effective relation between two elements and the direction of the causality. Hence, the basic structure of FCM model is constructed.
Step 2: Define the strength of the interrelation.
The weight represents the strength of the relationship among these concepts. The experts give the value of the weights. The experts offer their suggestions on the degree of the relationship in linguistic variables, and these linguistic variables are then transformed in crisp value by using the center of gravity defuzzifier.
Step 3: Simulate the inference process.
During the simulation, Formulation (3) is used to calculate the value of concepts, and the new values repeatedly replace the value at last iteration.
Step 4: Check the termination condition.
If condition or is meet, then output the final value of concepts to the decision maker. Otherwise, continue Step 3.
2.2. Intuitionistic Fuzzy Set Theory
In practical situation, experts usually cannot express their opinions on a given issue due to lacking complete or abundant information, even though they are experts with expertise knowledge associated with this issue. Therefore, they might be uncertainty and hesitated in making their decisions, especially when they are involved in a multi-objective of complicated systems. Fuzzy set (FS) theory was developed to deal with fuzziness and the partial truth of information to overcome the drawbacks that are mentioned above [46]. Subsequently, intuitionistic fuzzy set (IFS) theory was proposed as an expanded fuzzy theory [47,48]. Set as a nonempty fixed set of the universe and then an IFS in is expressed as:
where is the membership function of element to the set , while is the corresponding non-membership function. and meet the condition: . When , the IFS is reduced to the output of a traditional FS. In addition to the membership and the non-membership function, for an IFS, there is another concept of hesitancy degree (), which represents the uncertainty or hesitancy of whether belongs to the set . Accordingly, IFS has the ability to handle much of the hesitancy in complex circumstances when compared with traditional FS. Therefore, the trapezoidal intuitionistic fuzzy number is expressed as and the membership and non-membership functions are shown as Formulations (8) and (9). The trapezoidal fuzzy number is transferred into a triangle fuzzy number under a special situation where the most promising value is equal, namely and .
2.3. Intuitionistic FCM
FCM is a suitable technique for modeling complex systems that involve various elements (concepts, variables, factors, or characteristics) according to the aforementioned, for it can depict and quantify the interrelation among these concepts rather than just conduct a simple pairwise comparison. What is more, substituting the traditional FS with IFS is a feasible approach towards improving the experts’ ability to tackle the vagueness of information when facing the complex practical circumstances. Therefore, integrating IFS with FCM is an effective way for all stakeholders to evaluate the current state of the concepts and the corresponding interrelation among them. The detailed procedure of this IFS and FCM based approach is as follows:
Step 1: invite all of the stakeholders containing official staffs from government administration, experts from industry and institute, and individuals from the local community to form a group of an advisory committee. Combining literature review and the committee’s advice on the factors that are related to the given issue determines which concepts construct the FCM. This method provides a convenient way of integrating previous knowledge and individual perception and improving the participation of all stakeholders.
Step 2: define the linguistic variables and the parameters of the membership and non-membership functions. At this stage, the number of linguistic variables is defined and the parameters of the corresponding membership and non-membership functions are then fixed according to the description of intuitionistic fuzzy set theory.
The experts’ determinations on the degree of the influence of one element on another are acquired while using a seven-scale linguistic variable or the corresponding score, which is described in Table 1. Figure 2 depicts the corresponding membership function and non-membership function. Note that the experts have reached a consensus on the direction of all influences in the system before they determine the corresponding degree.
Step 3: produce the crisp value of the connect matrix (i.e., weight matrix). After the experts’ opinions on the degree of the influence are submitted, while using SUM method, all of the fuzzy initial connect matrices are aggregated to produce an overall fuzzy connect matrix. Considering that the selected experts have rich knowledge and experience regarding the problem, we assume the same weight for experts’ suggestions in calculating the degree of the influences. After that, these fuzzy numbers are transformed into a crisp value by means of the defuzzification method of the centroid of gravity. Eventually, the connection matrix, belonging to , is yielded, respectively.
Step 4: execute the simulation process. In this stage, the simulation refers to the reasoning process of FCM and it can be executed according to the calculation rule aforementioned based on the gained connect matrix. Finally, intuitionistic FCM yields the last state of all concepts, which is viewed as the original steady state of the system.
Step 5: conduct the scenario simulation. As for the constructed intuitionistic FCM, the last state of the modeled system can be produced under different conditions by using scenario simulation, because the structure of FCM allows for interaction with external variables at each iteration. It is clear that we can obtain some useful advice through the comparison between the last states of the system yielded under different conditions.
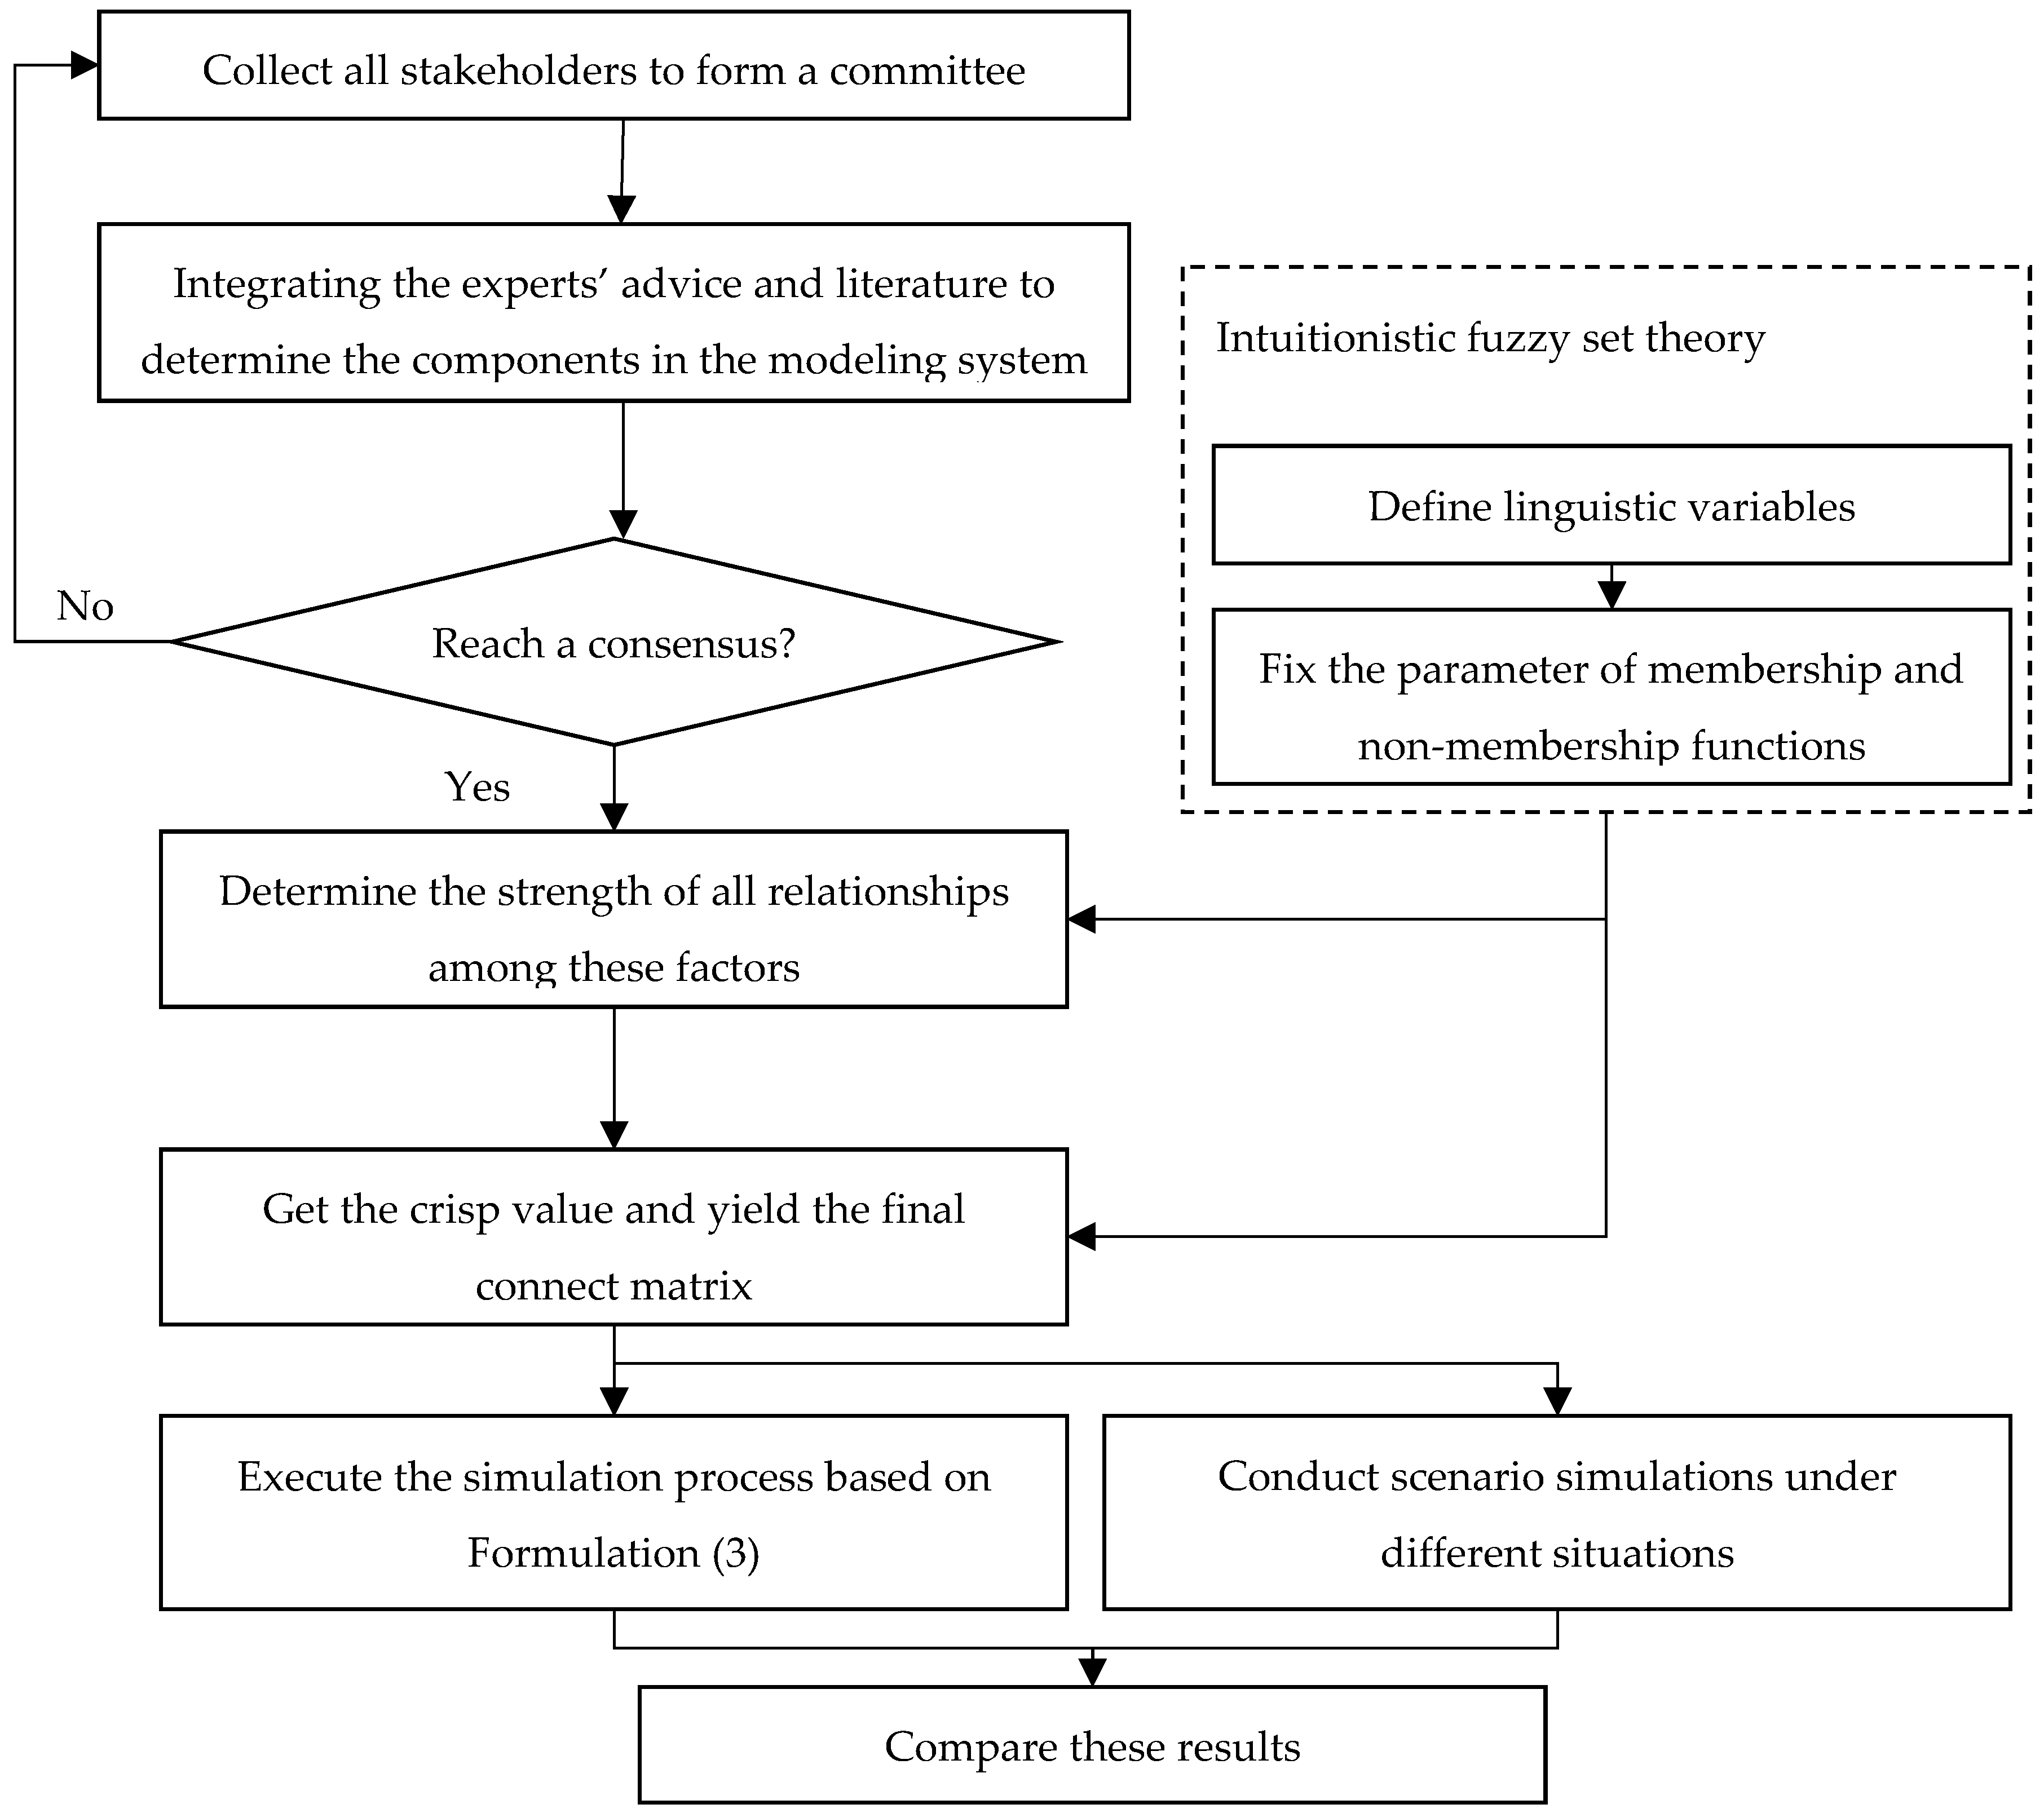
Eventually, Figure 3 provides a brief framework of IFCM that is based on the above steps.
3. Parameters Identification
The participation of all stakeholders is a critical aspect in the promotion of biomass energy. The stakeholders regarding the development of biomass can be classified into three categories based on the stakeholder theory: officials from government, local residents, and experts from industry. According to the presented studies, their focus on the issue of development of biomass differs from each other. Hereby, a group of factors that influence the development of biomass has been extracted by integrating the previous researches and the committee’s advice. This section introduces these factors from perspectives of various stakeholders.
3.1. Government Perspective
The government is a significant participator in the implementation of biomass, even being viewed as the overall designer and always being responsible for its layout at the national level. Accordingly, they focus on the macro issue of the development of biomass.
3.1.1. Policy and Regulation
Government focus is very important in the promotion of biomass energy and other renewable energy [13,49]. In most cases, failures to implement the biomass technology arise from the lack of direction of normalizing policies and dedicated regulations [8,17,21]. An attractive policy mechanism and an effective regulation on biomass are the basis of its development, so the designed policy and regulation should involve every aspect of the life cycle of biomass. Particularly, the stability of policy also matters in the dissemination of biomass technology, since the uncertainty always leads to failure [50,51].
3.1.2. Financial Support
High investment cost is one major barrier to the adoption of biomass [17], so the development of biomass technology has a high demand for subsidy that is provided by the government viewed as the financial incentive [2,4,52]. In this respect, while taking into account how to provide financial support at different stages of its development is the responsibility for the national or local administration [53].
3.1.3. Promotion Information
The promotion information that was launched by the government is a very important incentive for individuals to adopt a new technology. Issuing the official report can enhance the communication between the governor and the individual, avoiding hurdles to the dissemination of biomass resulting from the limited communication and negative perceptions of the biomass [14,17,20]. What is more, the promotion information is also viewed as policy commitment for the development of technology [52], and even a guarantee for the safety of biomass technologies.
3.1.4. Effect on Employment
The sufficient supply of energy that results from the implementation of biomass leads to the acceleration of urbanization and the occurrence of surplus labor diverted from the original agriculture. What is more, industrialization and urbanization also cause a large amount of unemployment in developing countries. The potential to contribute to employment generation is also a crucial issue for the government in the promotion of biomass technology [14,21]. Biomass is proven as a labor intensive technology and it has huge potential to create employment [11]. Therefore, the regional unemployment rate also amplifies the impact of developing biomass technology on the economy [19].
3.1.5. Impact on Regional Economy
The regional economic impact refers to the local economy gain and poverty alleviation [11,21], because the limited access to modern energy in the rural area results in adverse effects on economic development in general. Additionally, the perceived regional economic benefits from the diffusion of biomass technology facilitate the local residents adopting these technologies.
3.2. Industry Perspective
All of the companies at different stages of the supply chain of biomass industry play a major role in the diffusion of technology and they also face various critical obstructions. These limits are in place, being explained as the following aspects.
3.2.1. Availability of Technology
For different regions, the dissemination of biomass depends on specific techniques, which are capable of taking advantage of local feedstock and observing the corresponding regulations [54]. Various kinds of technology, as the basis of the development of biomass, provide the energy company with more proper choices when facing the different requirements of the residents. Moreover, the local residents prefer more kinds of available technologies than the sole option.
3.2.2. Maturity of Technology
One main barrier for firms in the commercialization of biomass technology is the underdeveloped technology, which leads to high conversion losses [6,55,56]. The maturity is essential to the adoption of biomass technologies, because the failure experiences resulting from the previous projects have a strong negative influence on the public perception towards biomass technologies [17,54]. Furthermore, many biomass conversion technologies are in their infancy phrase and they need further research and development.
3.2.3. Profitability of Investment
A major hurdle to the successive of penetration of biomass technology is the high initial investment and capital cost, including the construction cost, initial operation cost, and the cost of storage and transport [3,13,17,55]. Many researches were conducted to evaluate the viability of the biomass project while using net present value, internal rate of return, and the payback period [7,24], which demonstrated that the profitability of the biomass project technology is essential in the successful development of biomass.
3.2.4. Consumer Paying Capacity
At the initial stage of promoting biomass technology, the first barrier that the industry faces is the lack of end-users, especially in rural areas where the user always has a limited paying capacity [52,55]. Additionally, energy is essential for daily life, but the fuel choice of end-users is susceptible to household income [57]. Other alternatives to biomass energy widely exist in rural areas, such as firewood, agriculture crop, and forest residual.
3.2.5. Prospect of Market
The market prospect of biomass refers to the limitation of the market access, the guaranteed grid connection mechanism, and also the potential of the local market in the consumption of biomass energy, which has a huge impact on the willingness of investors [13,58]. If the region presents a broad market prospect for application of biomass energy, then the investor may supply an additional investment to enhance the development of biomass. Creating stable biomass markets plays a key role in attracting interest from investors [21].
3.3. Local Residents Perspective
When compared with the industry and authority, the residents living around the concrete biomass plant pay more attention to the impact of the biomass facility on the individual life and local environment. From a rational point of view, adopting biomass is a good choice for improving the region development, but the residents usually oppose constructing a biomass plant near their location, which is called “not in my backyard” syndrome.
3.3.1. Impact on Health and Safety
Even though there are various kinds of mature biomass technologies, the local residents are usually concerned the public health and safety problems that are associated with the biomass technology [20] and are very prudent and conservative in the face of these technologies due to an insufficient understanding of the impacts in less developed areas [21]. Actually, we have to confess that the environmental issues resulting from some biomass technologies, such as dust, noise, odor, fly ash, and exhaust gases, exist in the current circumstance [58], but the negative effects of these technologies on health and safety are usually consciously exaggerated. Therefore, this issue is considered as the most critical barriers to the widespread acceptability for the residents who live around the biomass facility
3.3.2. Resources Requirement
The resources requirement is related to the land use for constructing the unites and facilities, along with the water use for the production of feedback, which is considered as land competition with traditional agriculture and competitive demand for water resources; furthermore, the production may have negative impacts on local water quality [21,58,59,60].
3.3.3. Landscape and Local Environment Impact
3.3.4. Energy Price
Energy or electricity is essential for modern society, so the individual is always sensitive to the product price and more concerned about the cost of purchasing energy, especially in rural and remote regions [15]. Therefore, from the perspective of the local residents, the economic impact of biomass on the local residents is closely associated with the energy price after the adoption of biomass.
3.3.5. Energy Literacy
The energy literacy aspect refers to the knowledge and understanding of energy issues, such as energy independence, energy security, and the price of various kinds of energy that contains the cognitive, affective, or attitude and behavior (or action) about energy in daily life [61,62,63]. Although education can enhance their knowledge on energy-related problems, the degree of education does not simply represent the level of residents’ energy literacy. What is more, the energy literacy can change the users’ energy consumption pattern [64] as well as their attitude towards renewable technology. Energy literacy also concerns the foundational ability to distinguish renewable energy from traditional energy [61].
3.3.6. Environment Awareness
The environment awareness is relevant to the focus of individuals on the global environment, such as greenhouse gas emission, the status of global warming, and other fossils fuel-related environment problems. A lack of basic knowledge regarding global warming and climate change is viewed as the major informational barrier to the development of biomass technology [58], and the users with high environmental values are more interested in the development of biomass [60]. Particularly, the Paris Agreement highlighted the enhancement of climate change education [1].
The factors listed above are not independent but have great influence on each other. There are considerable reduplications and interactions among them, but there is non-substitution of one factor for another. What is more, all of these factors have a significant impact on the public acceptance or perception of biomass either directly or indirectly. Hence, the proposed intuitionistic FCM is employed to depict the interrelation among these factors and reveal the influence mechanism in order to promote the development of biomass by enhancing the public acceptance and mitigating the opposite for biomass.
4. Case Study and Scenario Simulation
In the remote area of China, about 33% of the population still depends on the traditional biomass energy source [17]. In contrast to the modern biomass technologies, the traditional approaches to biomass energy source produce more pollution and they are more harmful to human health. Therefore, it is urgent to accelerate the adoption of biomass technologies in order to enhance energy security, promote regional economic development, as well as better local life condition. In fact, various factors hinder the development of biomass technology and vary in different regions. Accordingly, some researches and investigations were conducted to solve this severe problem, but they were limited to the description of these obstructing factors. Aiming to explain the interrelationship among these factors and exhibit the influence mechanism, this study integrates intuitionistic fuzzy logic and cognitive map to model the complex cause relation that exists among these factors when considering the public acceptance of biomass technologies. In light of the description of the factors that are mentioned above, all the components used to construct the IFCM are listed in Table 2, and then the process is shown as follows in detail according to the introduction of IFCM.
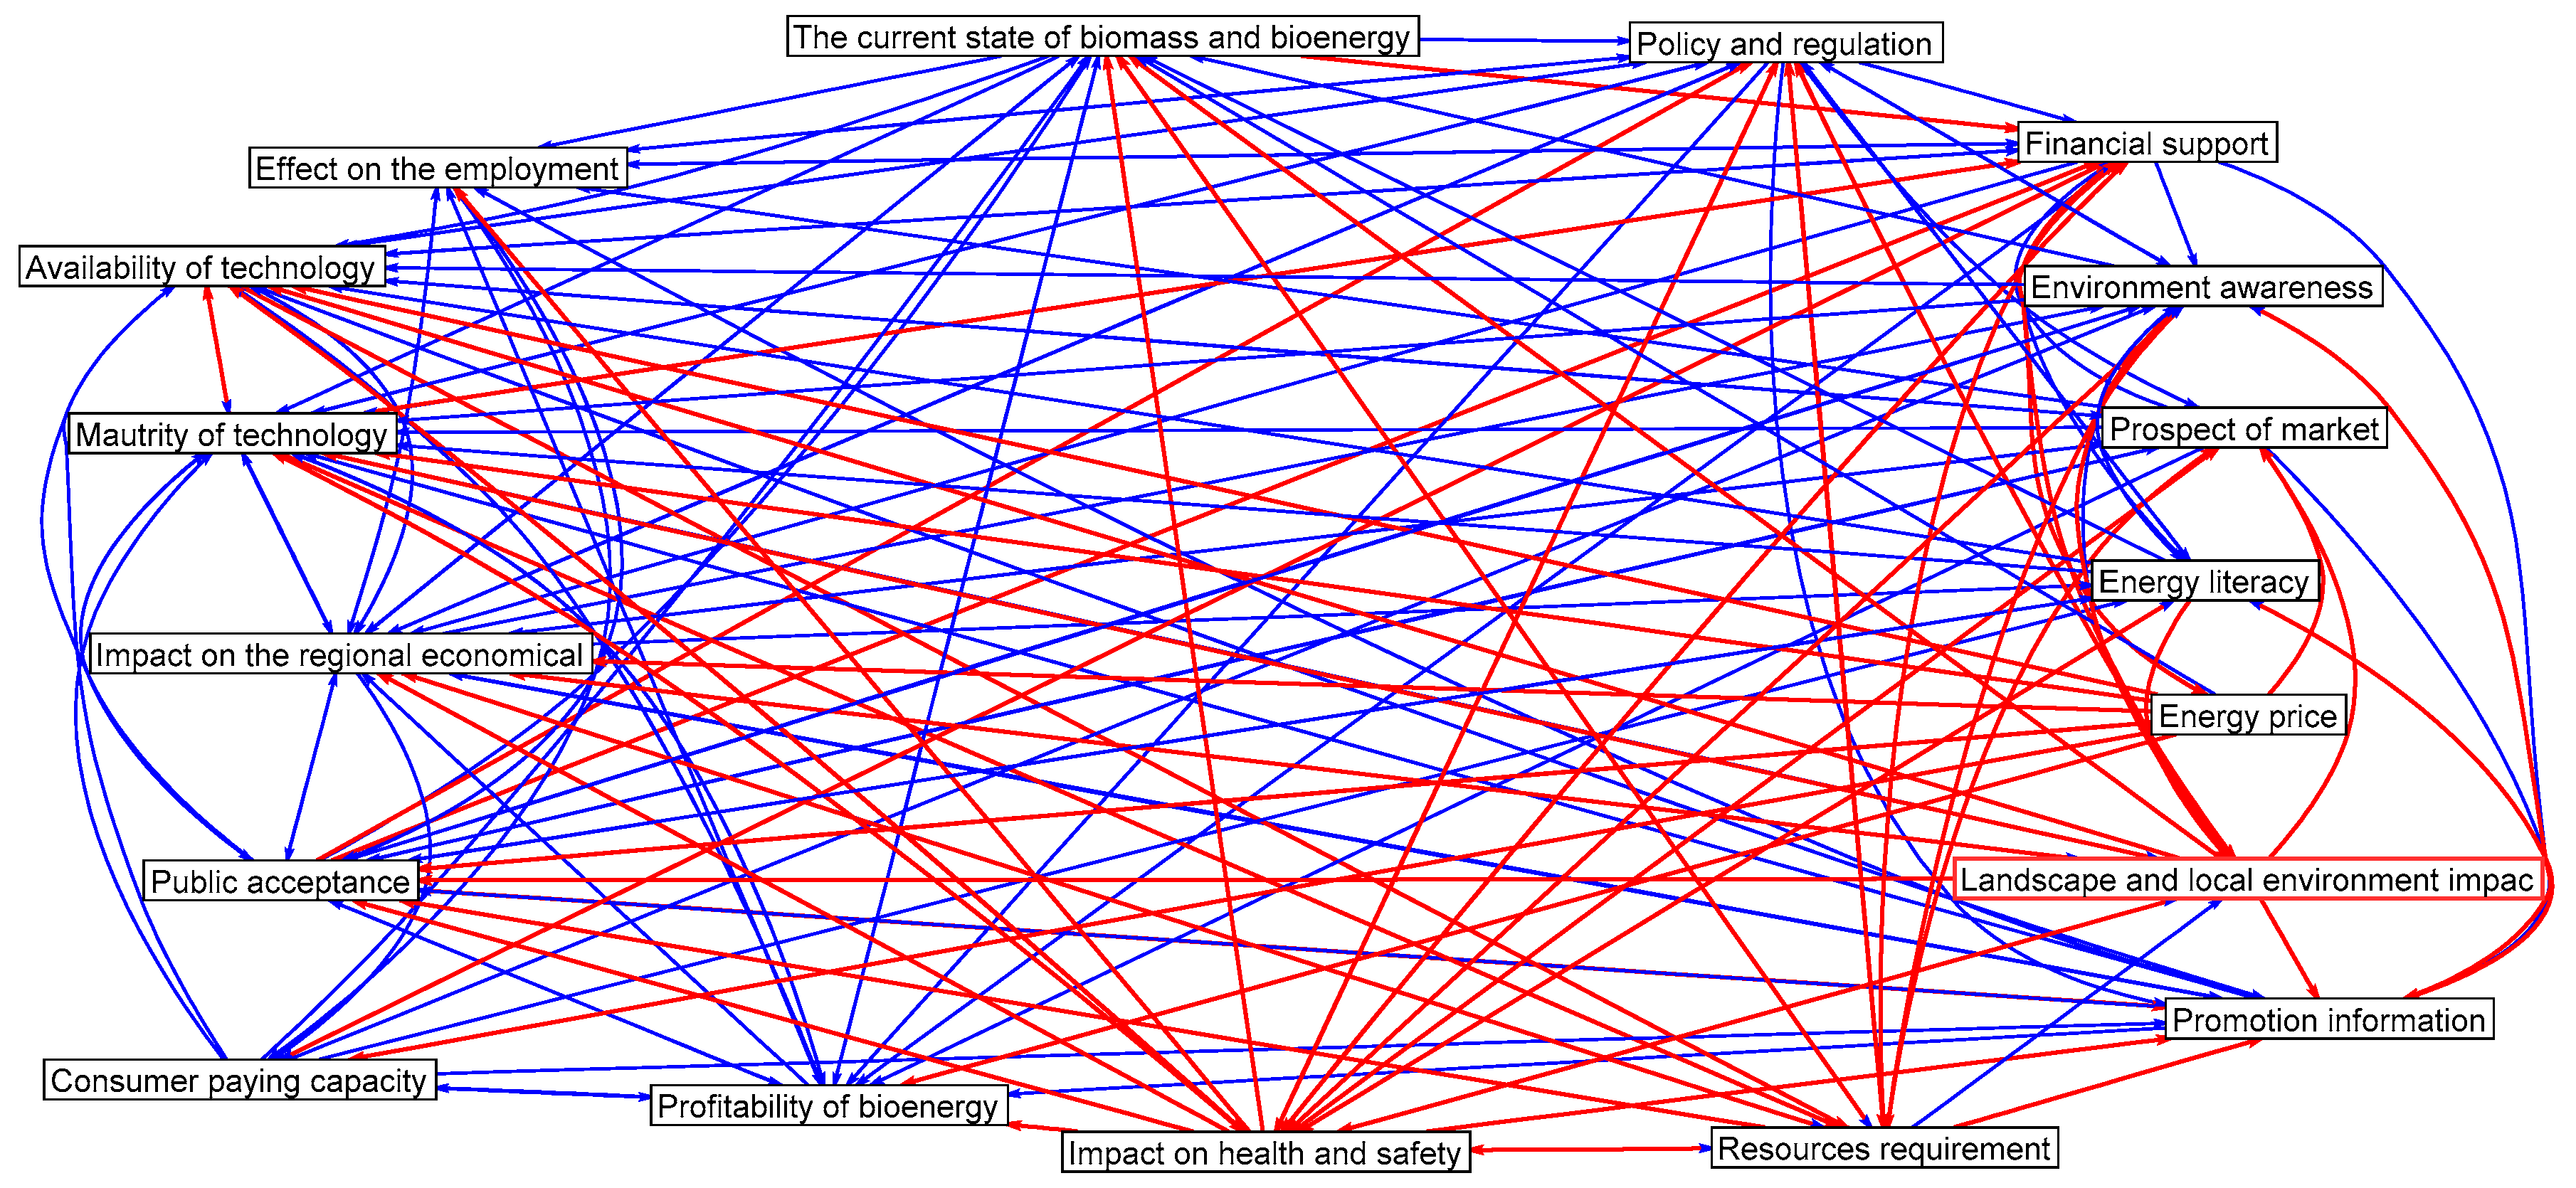
Firstly, taking the biomass and bioenergy situation in China into consideration, nine experts with rich knowledge and experience in the biomass industry are collected to identify the causal relation among the identified factors and construct the original cognitive map, as depicted in Figure 4 where the red lines indicate the influence is negative whereas the blue one shows a positive influence. Four experts come from universities and institutes that involve two professors concentrating on energy research and two professors studying on the effect of government policy; four experts are selected from renewable energy company, including one project manager and three engineers, who have first-hand experience regarding the implementation of the biomass project; and, another expert is an officer for the design of the energy development planning. The collective FCM includes 18 components and 186 connections among these factors and the density score is 0.608.
Secondly, using the fuzzy rules that are described in Section 2.3, all of the experts give their advices on the strength of the interrelationship among these factors. Table 3 shows one of these experts’ advice. Furthermore, after all experts give their views on the connection matrix, the numerical value is calculated by using the SUM method, and then Table 4 tabulates the full matrix.
After that, the simulation process is actualized on the Matlab platform according to the simulation procedure. Additionally, the nature of FCM proves that the initial value of all the factors has slight significances for the decision-makers, so we carried out several simulations and compared these results with a basic scenario. Consequently, as for the basic scenario (i.e., the business-as-usual scenario), the initial state of all the factors is set to 0.1, and the basic steady state of this system is calculated. We constructed three other scenarios in order to obtain the distinct impact of particular factors concerned with various stakeholders on other factors as well as the whole system: the government scenario, the technology scenario, and the individual scenario. Distinct factors are stressed because the emphasis of the relevant stakeholder is different at various scenarios.
For the government scenario, this scenario focuses on the factors concerned with the official function and political role in promoting biomass energy, such as the “policy and regulation”, the “financial support”, and the “promotion information”. As for the technology scenario, this scenario emphasizes the effect of technology factors on other factors and the role of related companies for the diffusion of biomass energy technologies. Accordingly, it concentrates on the “availability of technology” and the “maturity of technology” in view of better representativeness for the technology element. Besides, the individual scenario studies how the traits of the local residents influence the whole system. Specifically, “energy literacy” and the “environment awareness” are the central factors emphasized. What is more, the value of these factors belongs to the interval , so we post two special conditions for these three scenarios: the best and worst circumstance. The best circumstance sets the relevant factors to equal to 1, while the worst circumstance assumes the factors to be equivalent to 0.1.
5. Results and Analysis
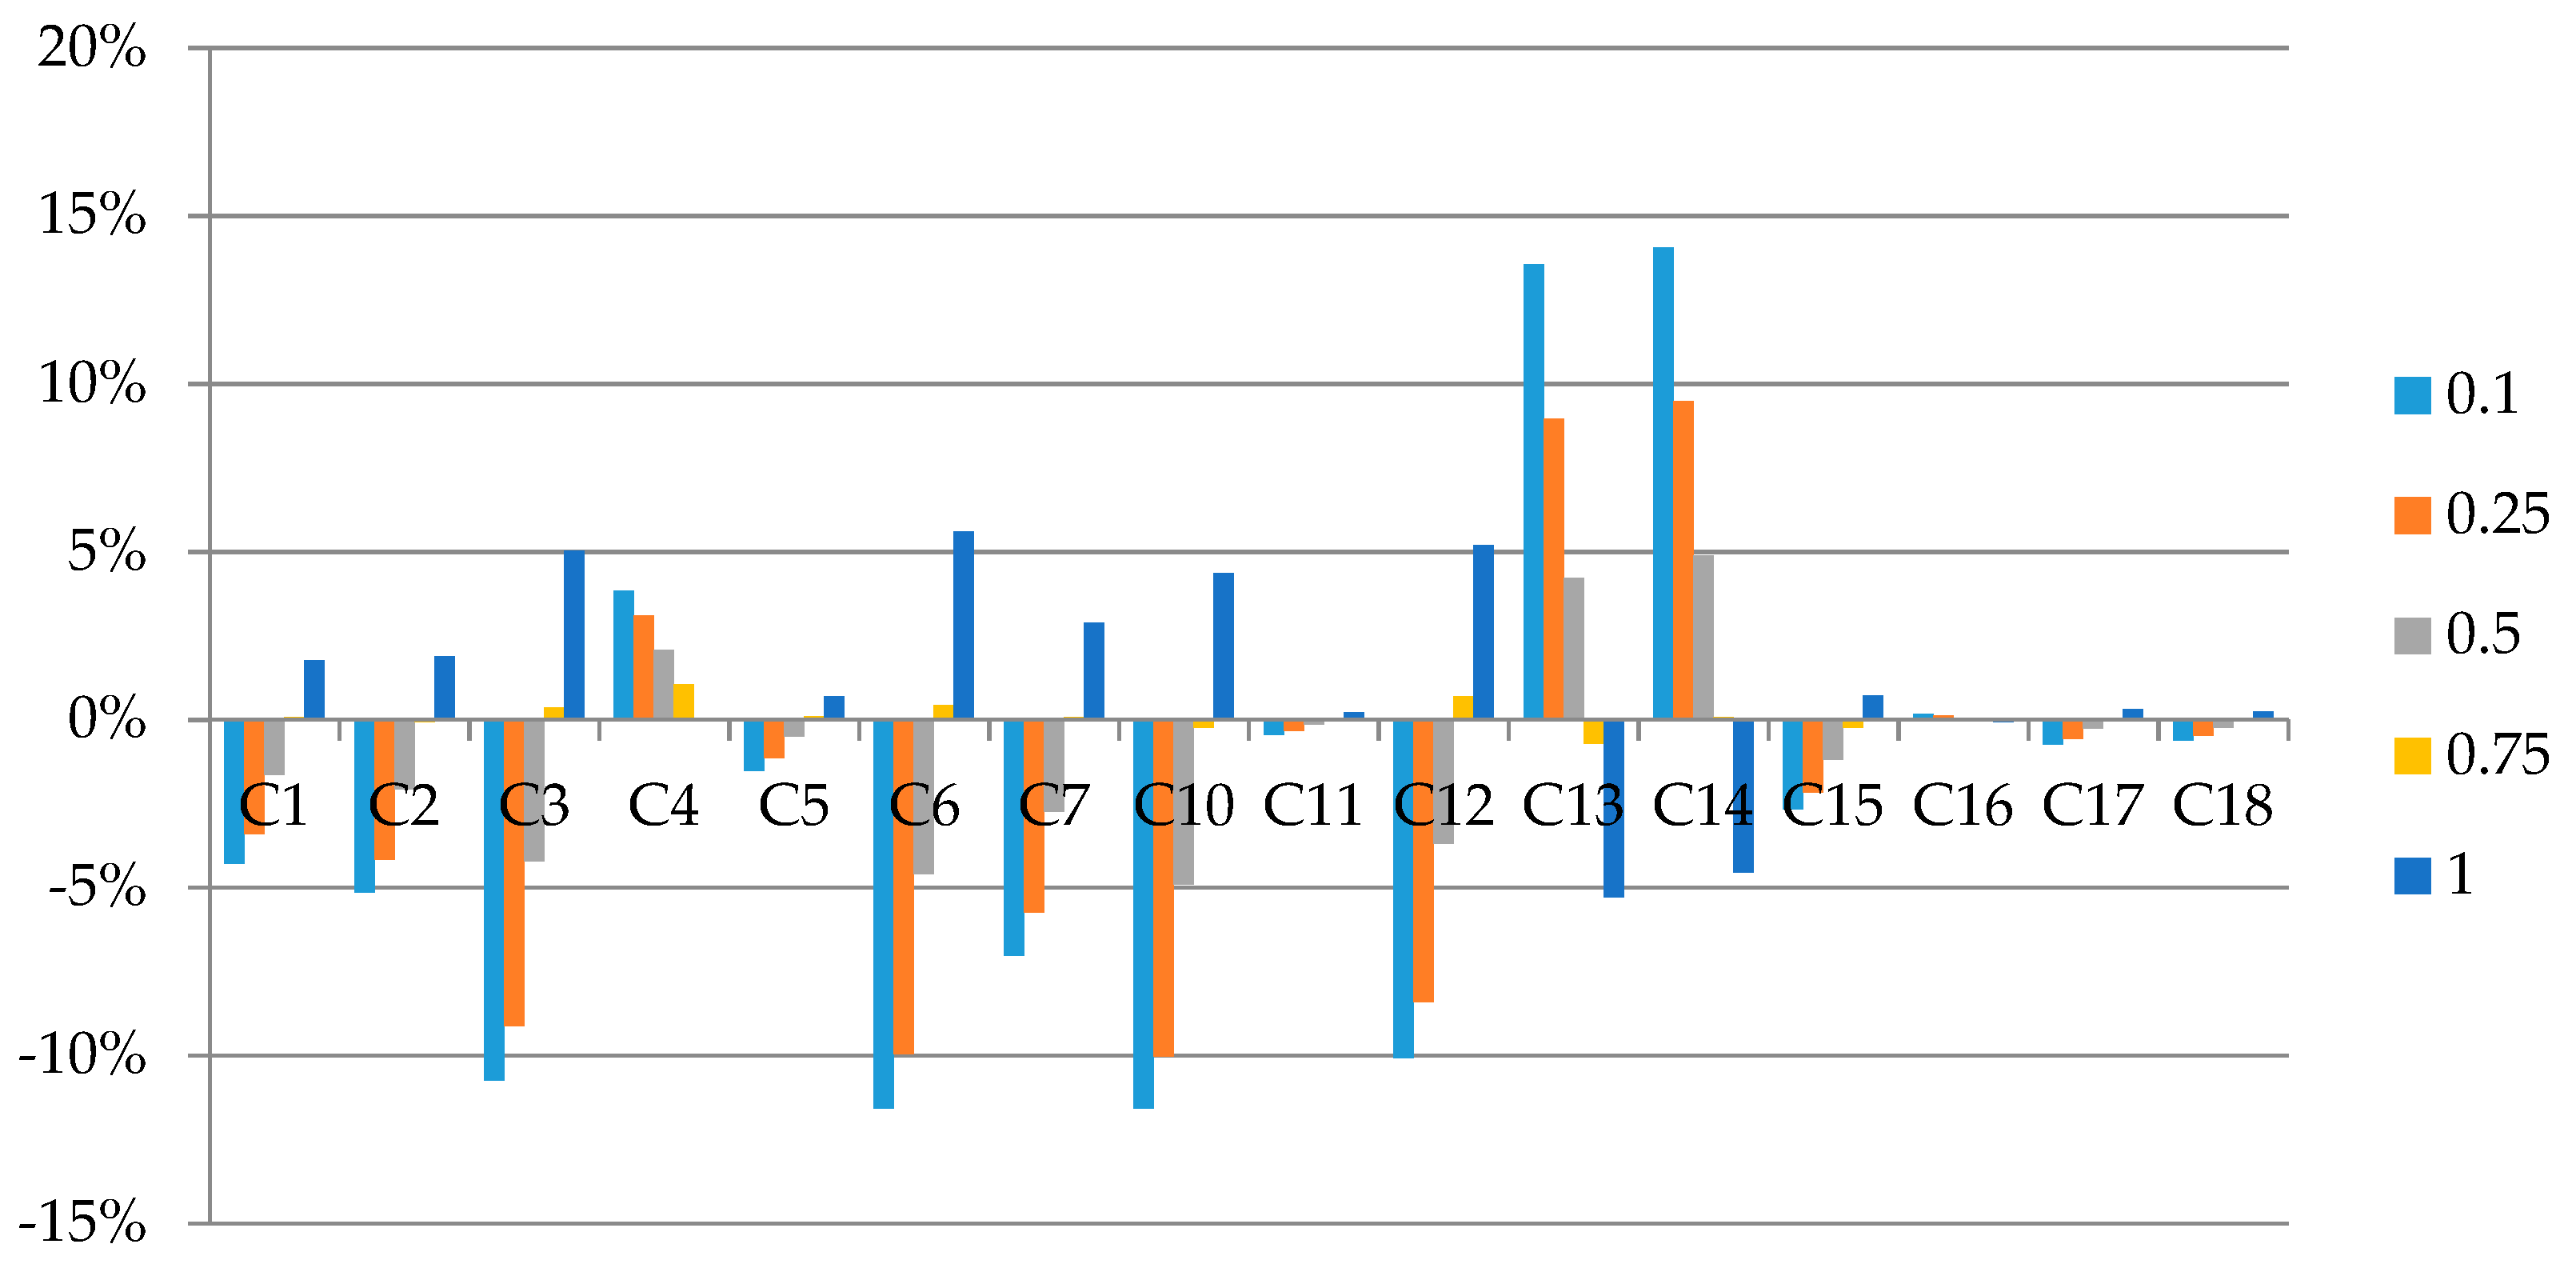
As far as the development of biomass energy is concerned, it is necessary to study the effect of political elements. Regarding the government scenario, under the best circumstance, the factors that are stressed by the central or local authority are set to 1, indicating that the government has its full support of biomass energy; whereas, under the worst circumstance, these factors are set to 0.1, which suggests that the government does not show a lively interest in biomass area. Figure 5 presents the results that illustrate the effect of government policy on other factors. The simulation results reveal that these policy elements have significant impacts on the system and government policy influences all the other factors. Notably, under the worst condition, the availability and maturity of biomass energy technology incur a decrease of more than 15% when compared to the steady state of business-as-usual scenario; meanwhile, “prospect of market” also has a reduction of about 15% and “public acceptance” drops by over 5%. What is more, the environment elements that local residents are concerned about (i.e., “impact on health and safety”, “resource requirement”, and “landscape and local environment impact”) have an increase of more than 5%. However, it is worth noting that the performance of technology availability and maturity increases by more than 15% and the “prospect of market” also rises by about 15% under the best circumstance, and then the environmental elements drop by over 5%. Furthermore, the increase in “public acceptance” exceeds 5%.
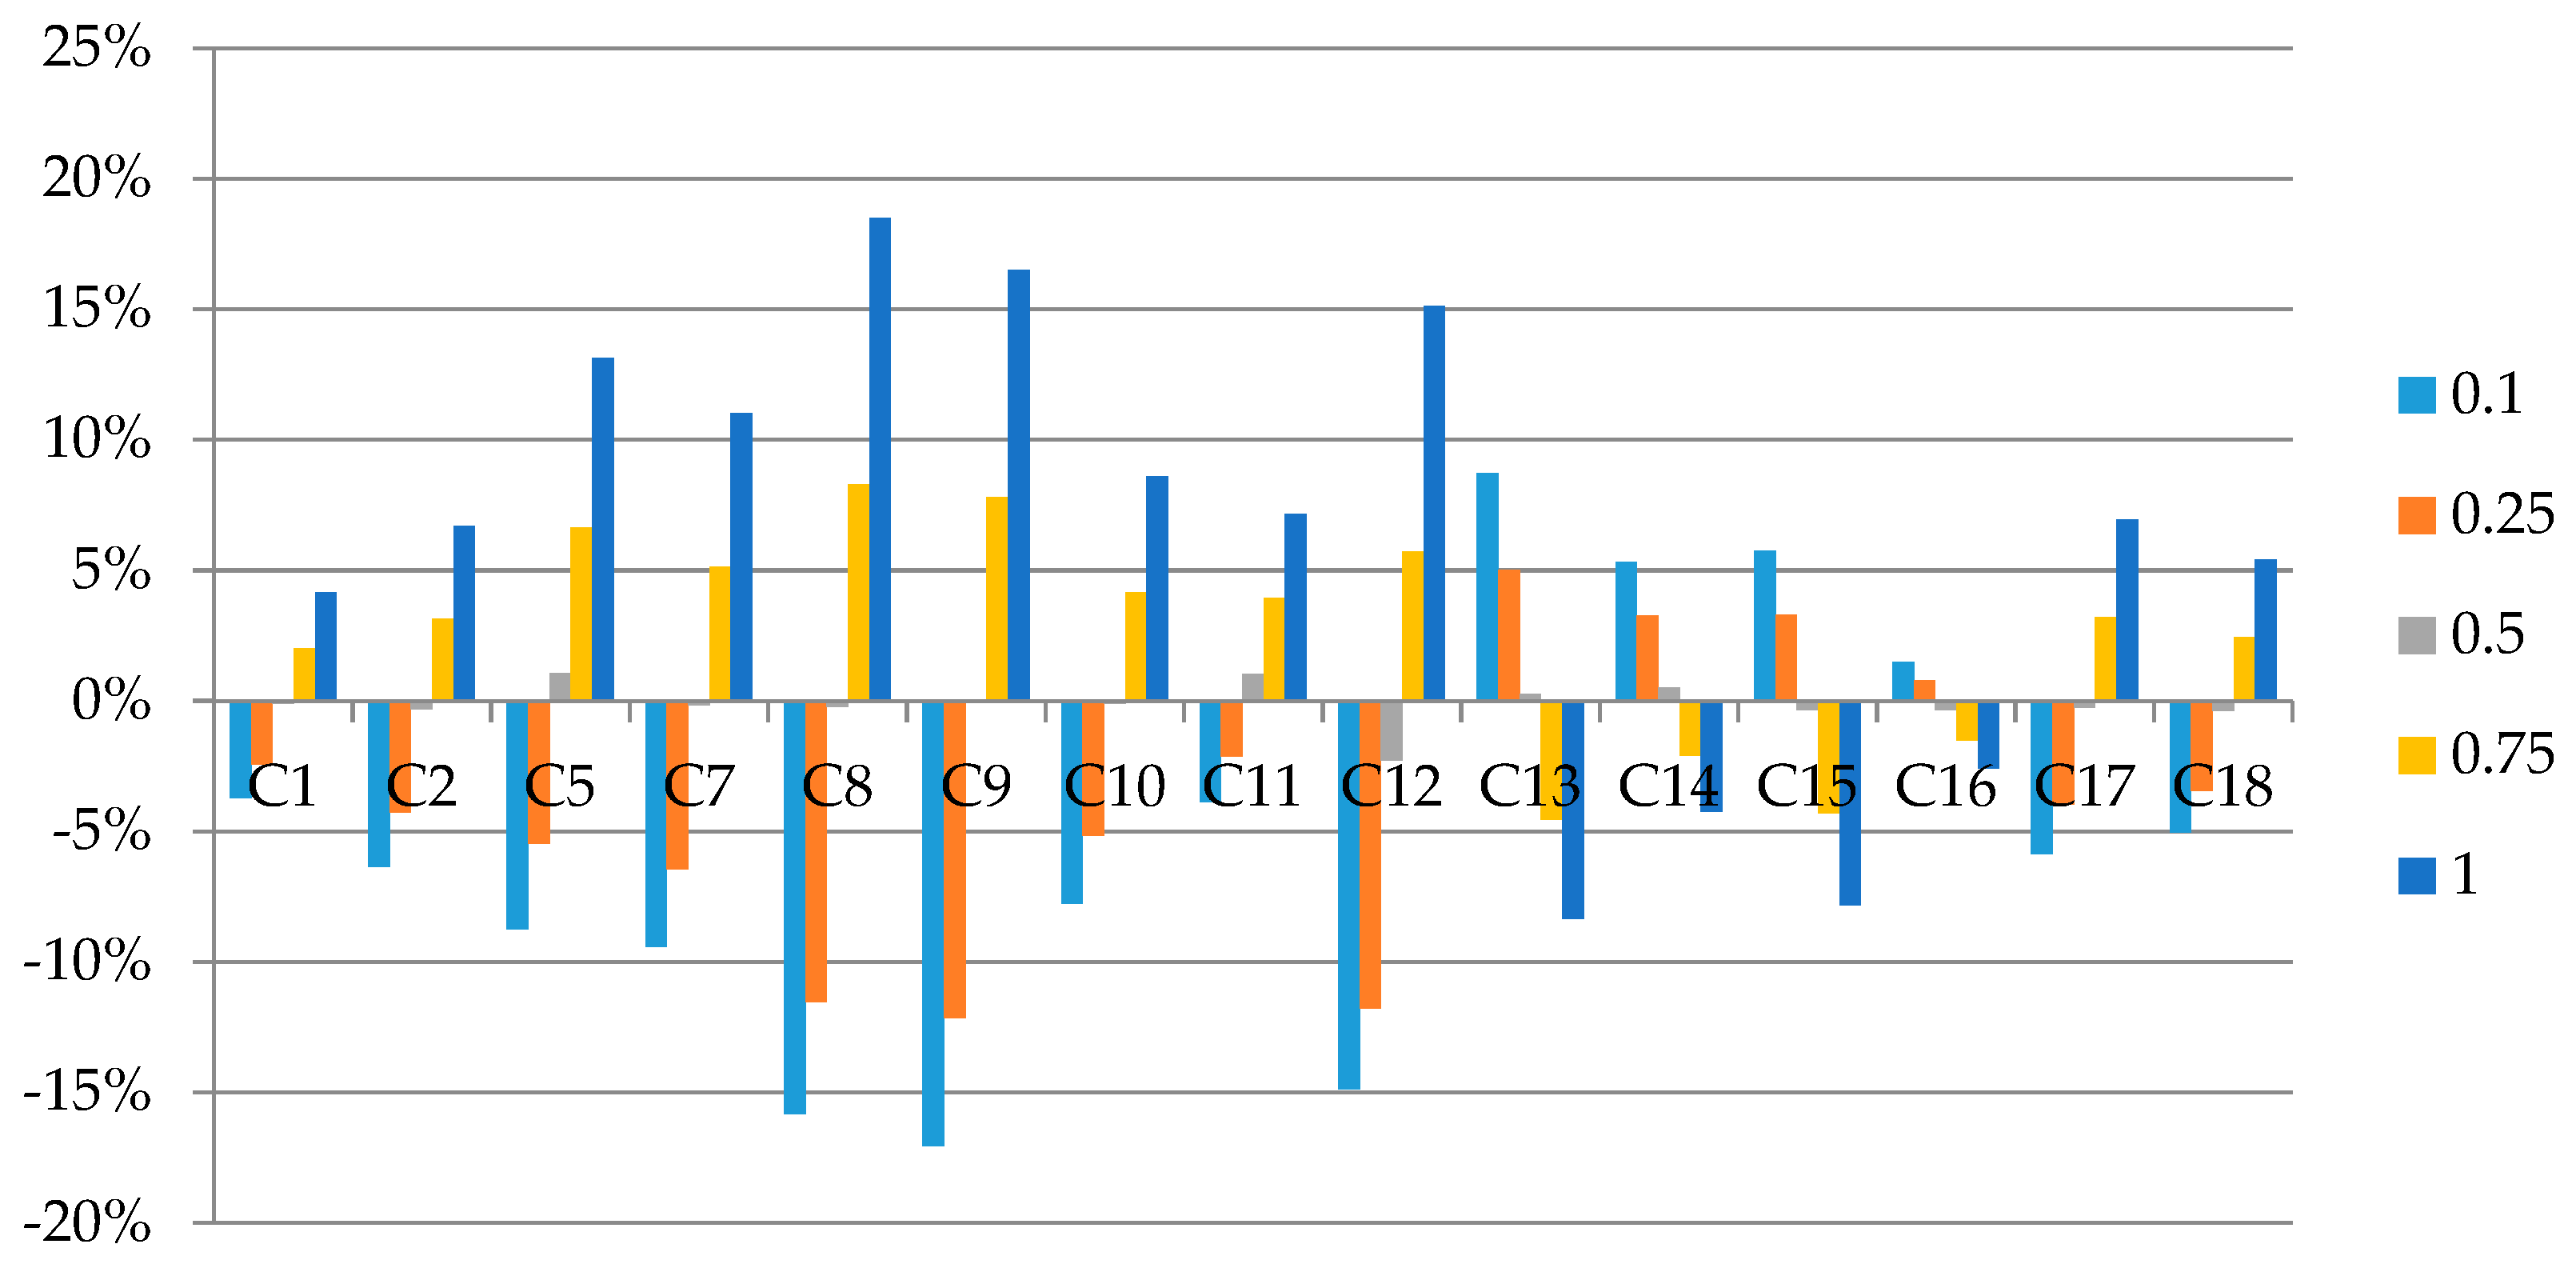
In light of the difference of possible effects of various acts of government, there are three sub-scenarios that are constructed to compare the separate impact of several kinds of policies on other elements in the system. Sub-scenario A focuses on the government policy and regulation on the bioenergy and Figure 6 presents the results. The analysis reveals that elements, such as “prospect of market”, “availability of technology”, and “maturity of technology”, are the most influenced factors followed by “impact on regional economy”, “impact on health and safety”, and “resources requirement”. The “prospect of market” varies from almost −14% under the worst condition to near 13% with the best case.
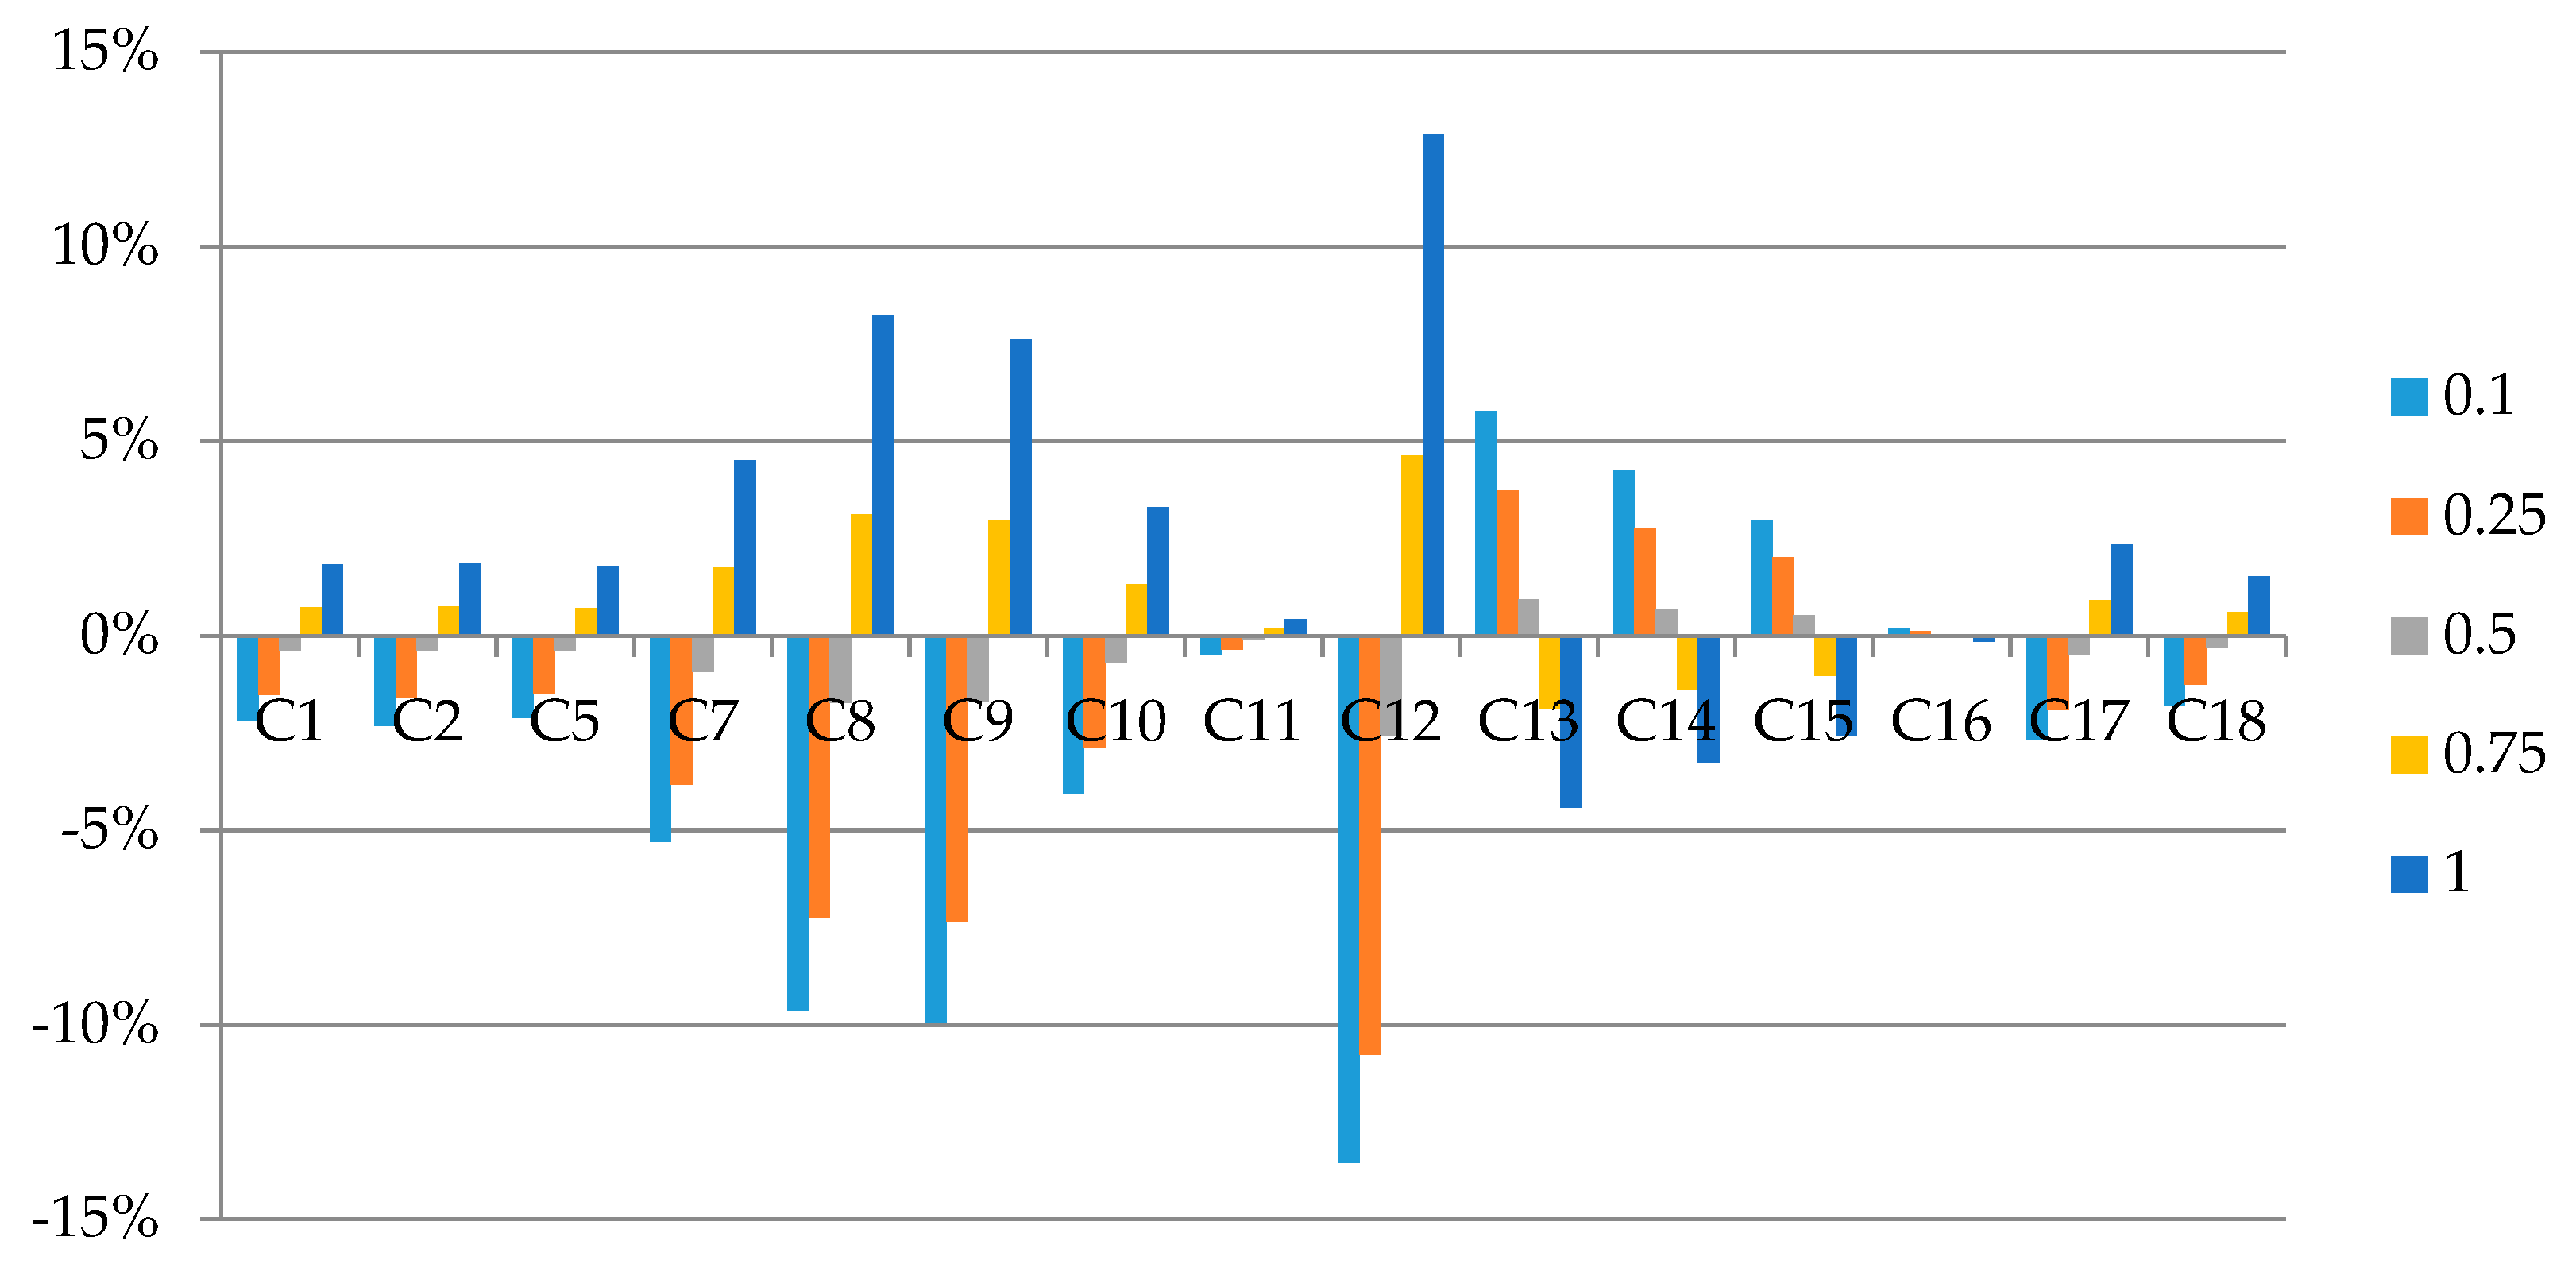
Furthermore, Figure 7 depicts the results of sub-scenario B that stress the effect of “financial support”. Obviously, the technological components (i.e., “availability of technology” and “maturity of technology”) are also significantly influenced by the factor “financial support”. Besides, the “effect on the employment”, the “impact on the regional economic”, and the “local consumer paying capacity” have a considerable connection with the value of “financial support”. The deviations range from −4% to 9%, from −2% to 5%, and from −3% to 6%, respectively, when compared to the steady state of business-as-usual. The results demonstrate that the government provides financial support for the research and development of technology, recruitment subsidy, and the direct allowance for the consumption of renewable energy.
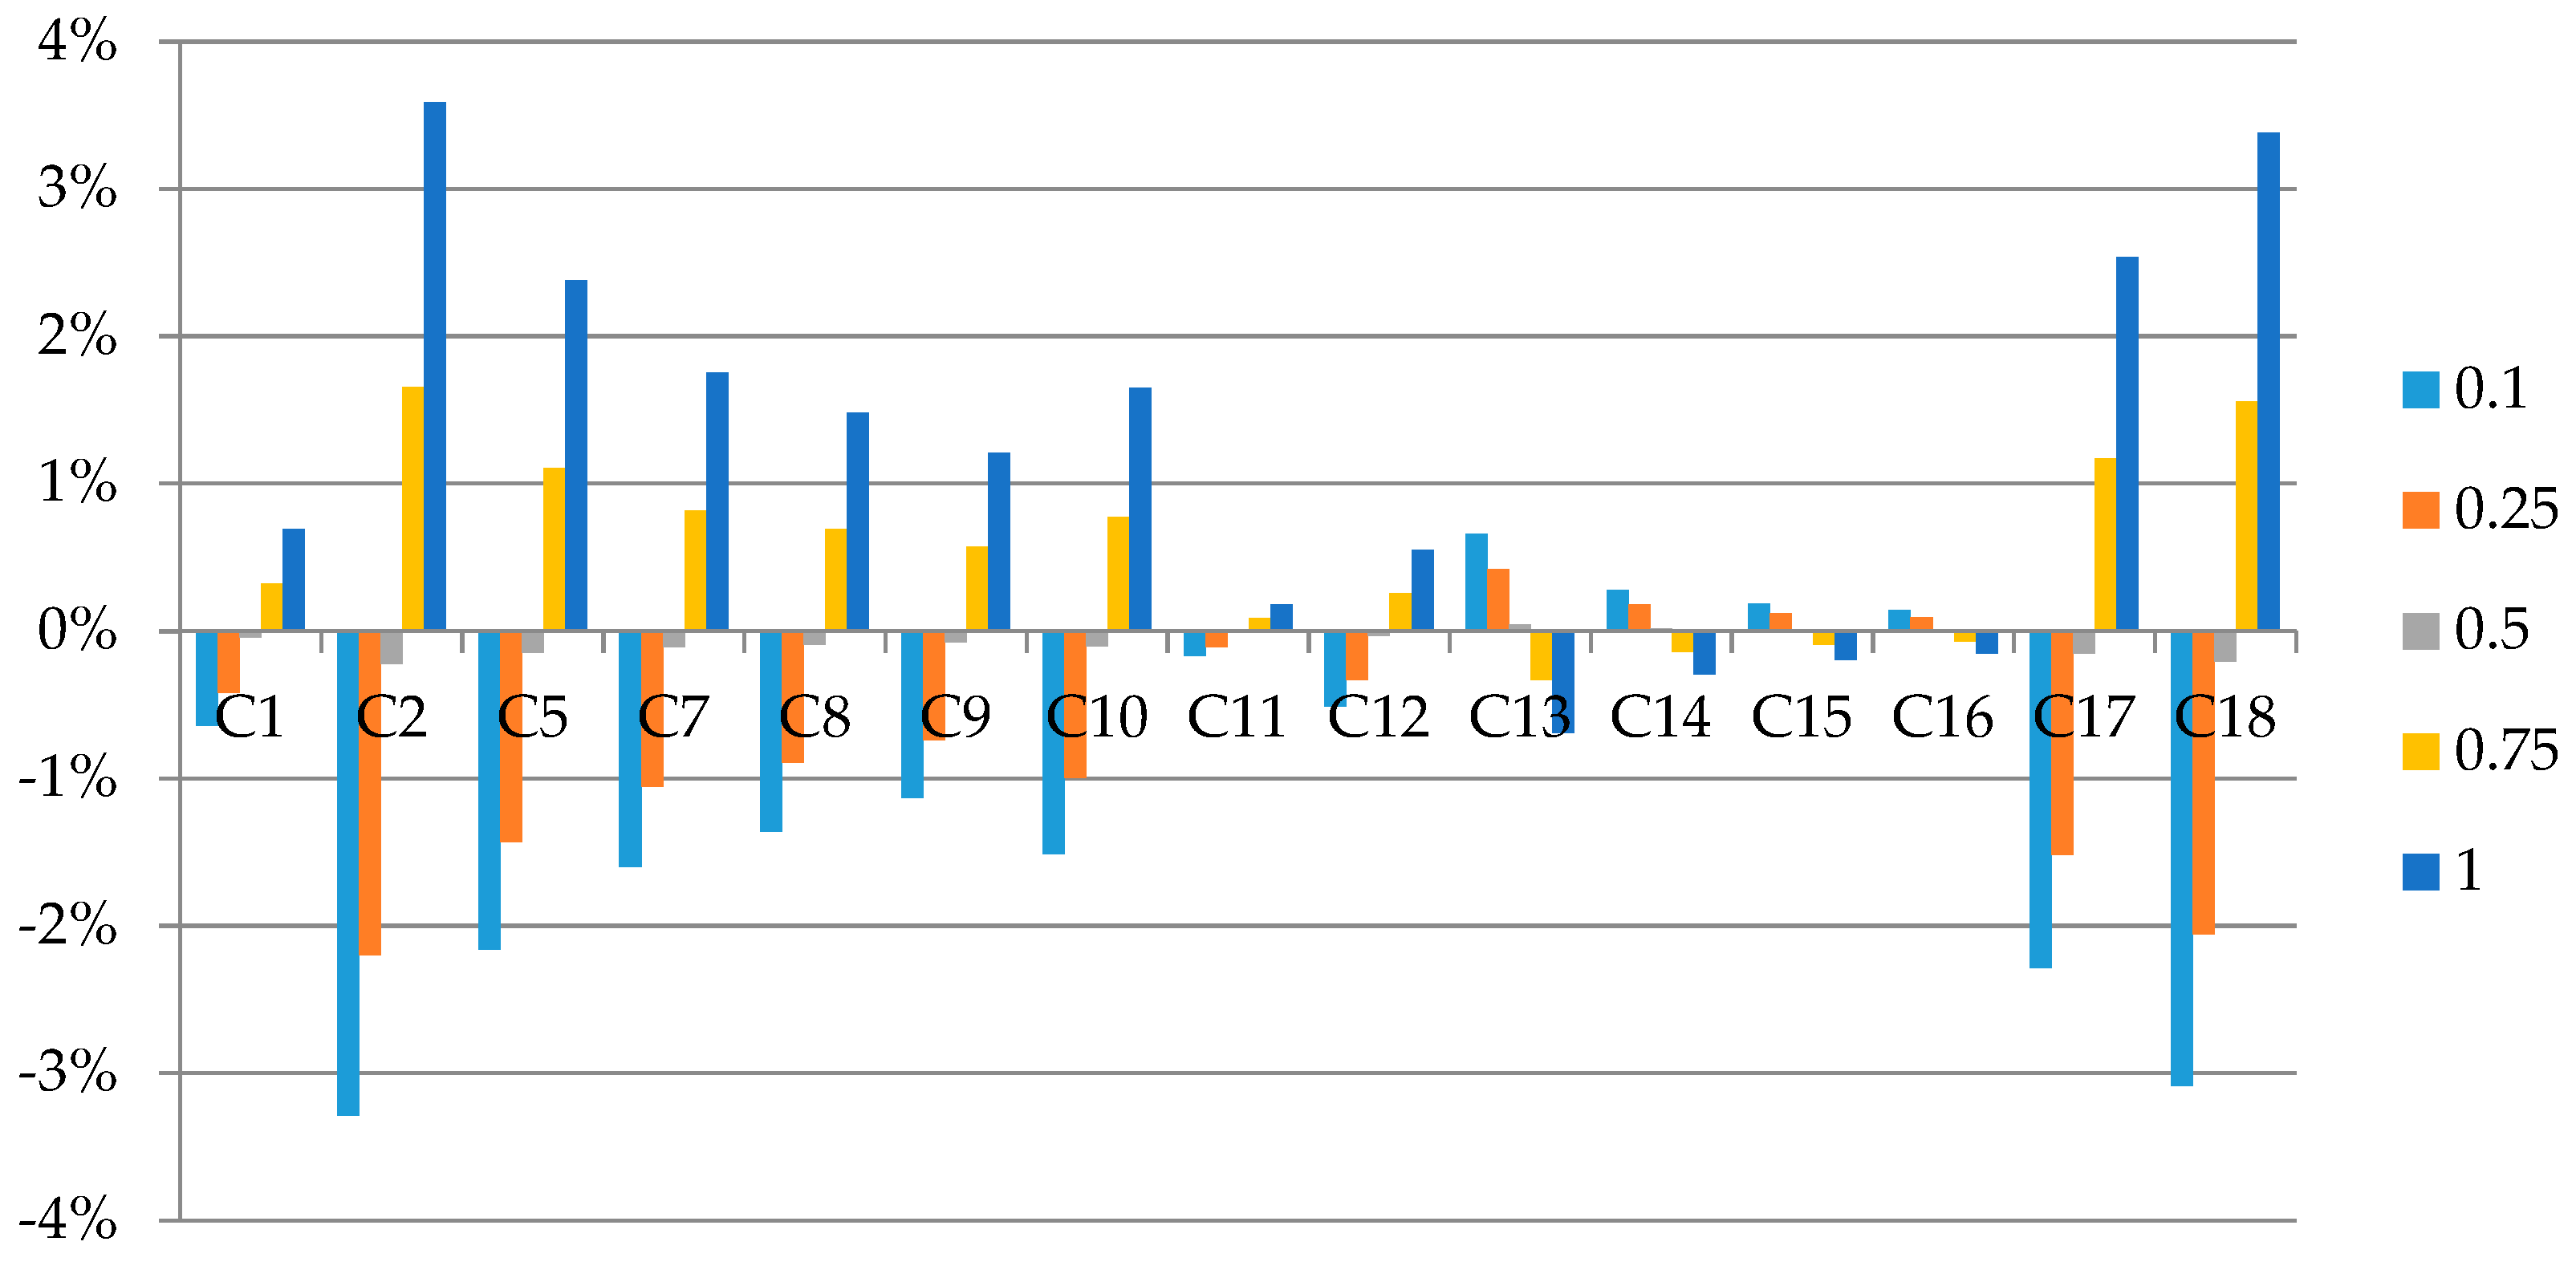
Moreover, Figure 8 explains the impact of “promotion information” on other elements for sub-scenario C. Under the impact of the change of “promotion information”, the “public acceptance”, which varies from −3.3% to 3.6%, is the most significantly affected element, followed by the “environment awareness” with a fluctuation from −3.1% to 3.4% and the “energy literacy”, ranging between −2.3% and 2.5%. It is worth noting that “promotion information” mainly affects the local resident knowledge on biomass and bioenergy.
To sum up, the role of various acts of government in the promotion of biomass technology is different from each other. Different policies affect different components of the whole system, in which “policy and regulation” and “financial support” mainly influence the technological elements, while “promotion information” affects “public acceptance”. Consequently, a policy mixture would have a large effect on the development of biomass and bioenergy.
Similar to the government scenario, at the technology scenario, the best circumstance makes these focused factors equal to 1, which suggests that the biomass energy technology is booming and the company has access to various techniques. On the other hand, the worst circumstance assumes that these factors are equal to 0.1, which hints that the relevant technology is at a poor level and the company cannot find an appropriate technology for the investment in biomass area. Figure 9 demonstrates the changes in other factors when compared with the steady state of the business-as-usual. Under the worst circumstance, the “policy and regulation” and the “promotion information” drop by 10%, which proves that the government has less interest in low-technology. The “profitability of investment” and the “prospect of market” decrease by more than 10%, which demonstrates that the low-technology has a negative influence on the company. Moreover, the almost 15% growth in the “impact on health and safety” and the “resources requirement” fully confirms that the low-technology also has an undesirable impact on human health and greater demand for local resources, so as to negatively affect public attitude to the relevant bioenergy. Consequently, the decrease in the “public acceptance” is over 5% when compared with the steady state of business-as-usual scenario. On the contrary, under the best circumstance, all of the mentioned factors have an opposed change. Specifically, an increase in the “promotion information” is over 5% as compared with the business-as-usual scenario. The results prove that it is easier for high-tech technology to get the government support due to its lower passive effects on the health and safety and less demand of the local resources. Subsequently, there is a slight increase in the “public acceptance”.
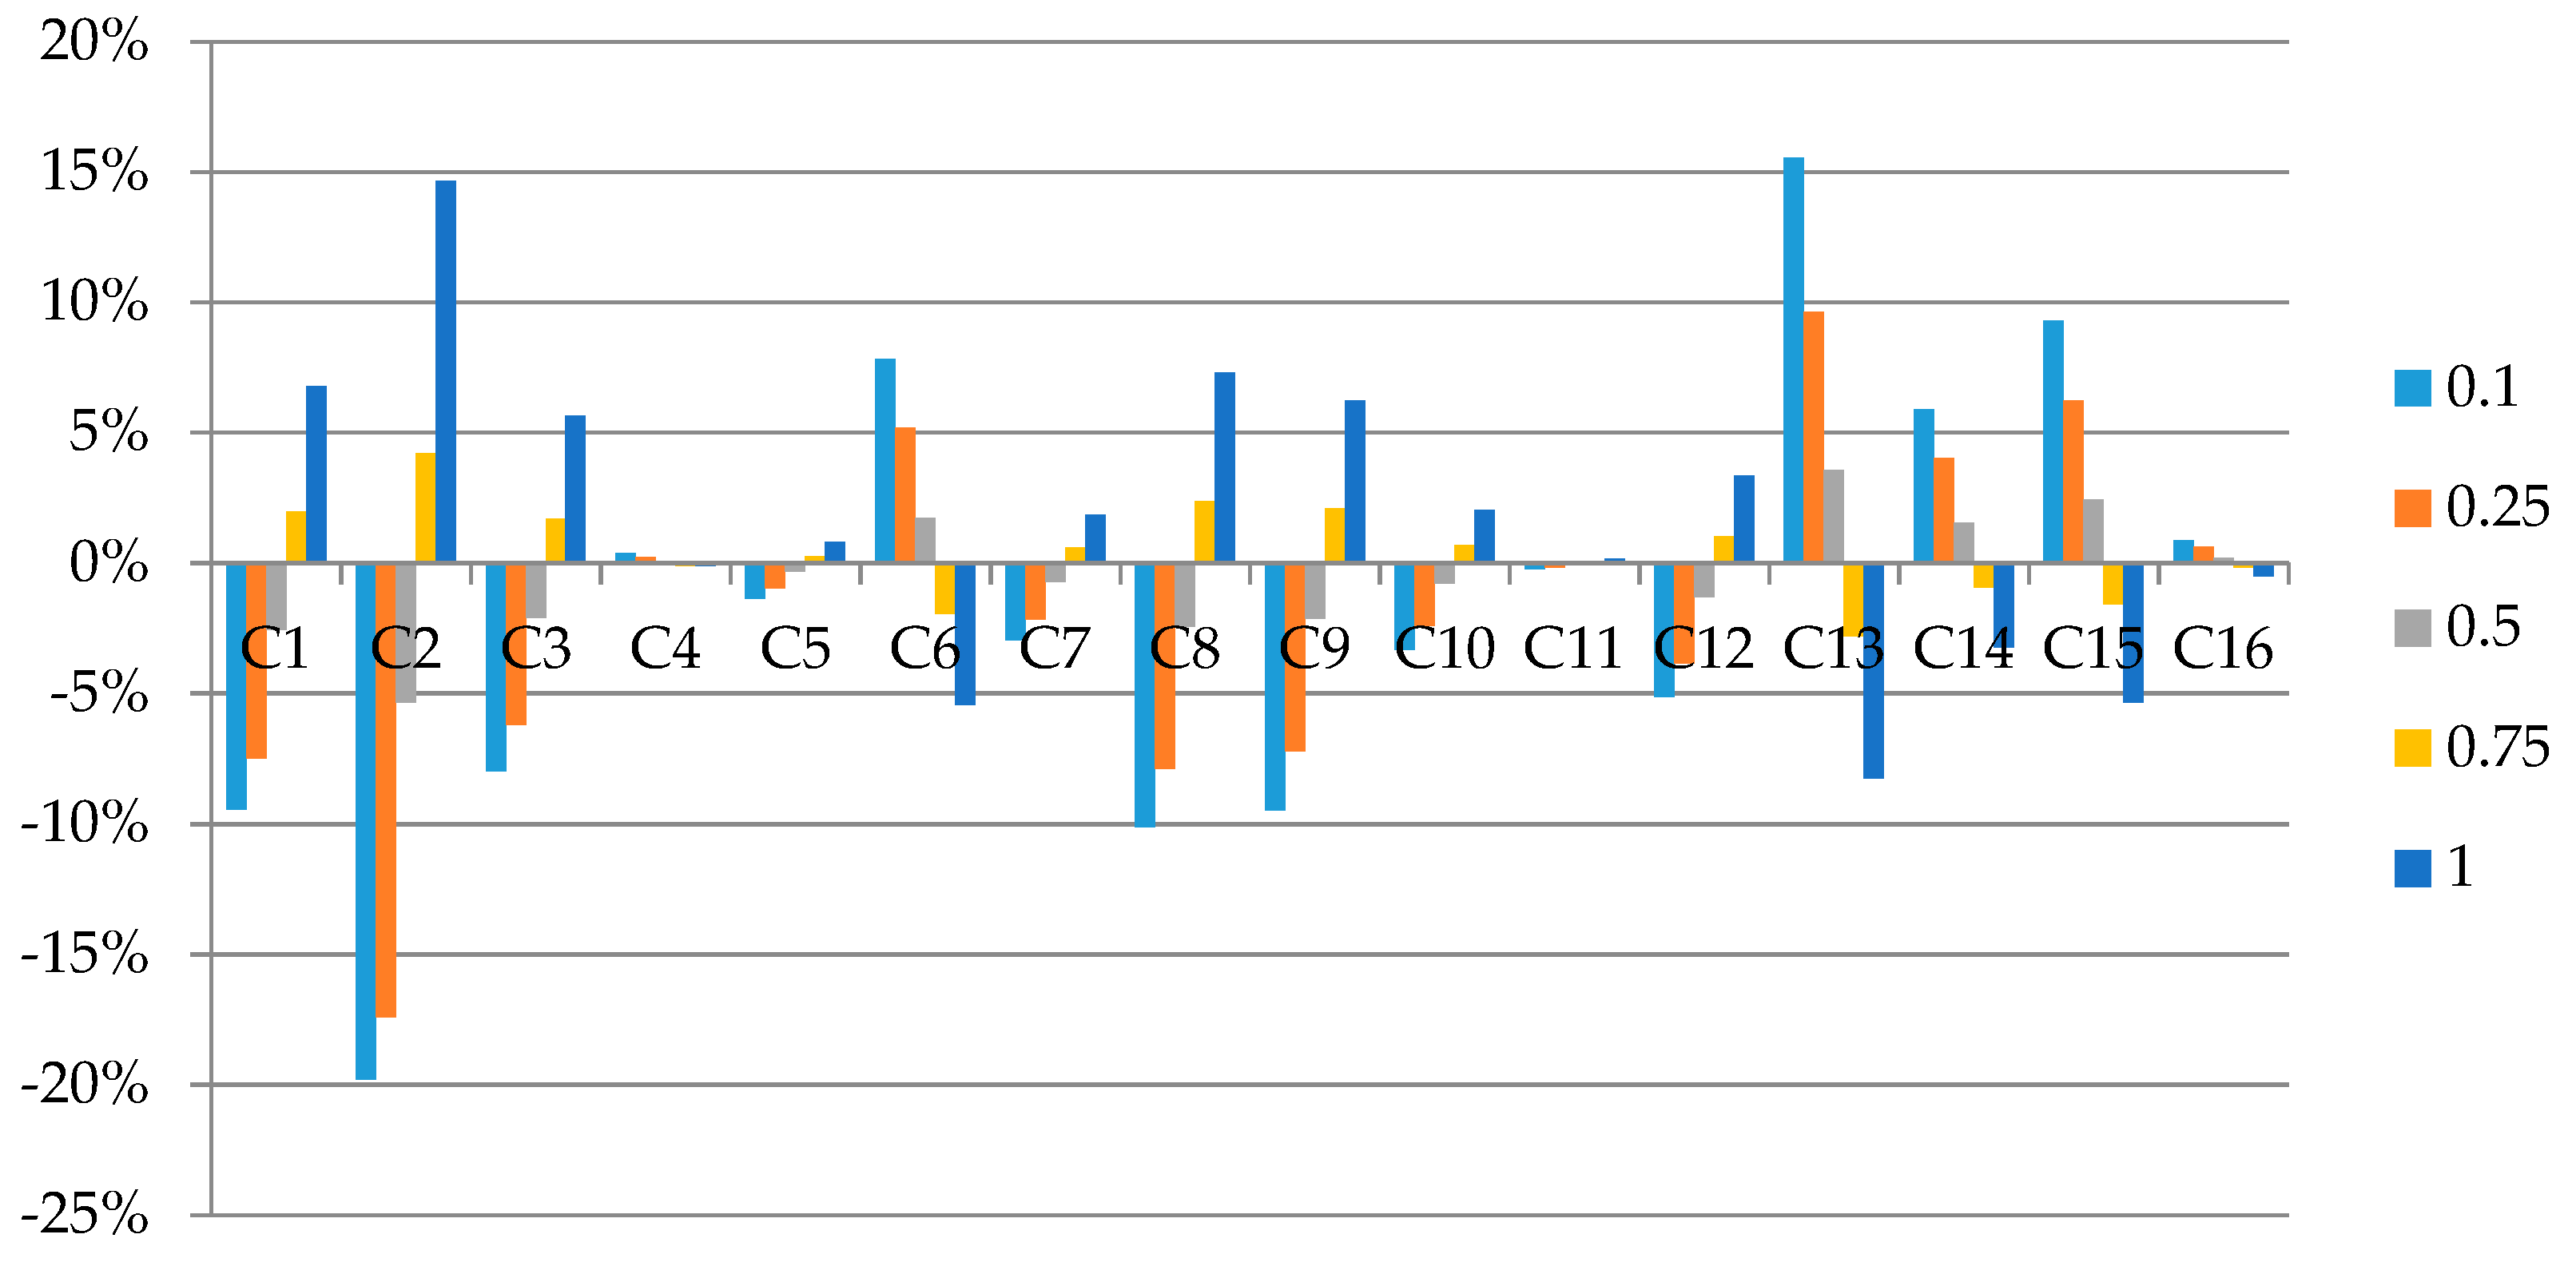
Besides, at the individual scenario, the best circumstance with these factors equal to 1 indicates that the local residents get a decent education in the energy area, so that they can fully master knowledge of renewable energy and they have higher requirements for community living environment, so as to pay more attention to the relevant issue. In contrast, the worst circumstance with these factors equal to 0.1 suggests that the residents who have little knowledge on energy do not keep their eyes on the environment issue. A sensitive analysis is conducted under these conditions to show the roles of the local residents, and Figure 10 presents the corresponding results. When considering the results, the most affected factor is the “public acceptance”, which has a decline of 20% when the individual factors take the lowest value but obtain an increase of 15% under the best condition. In the same way, the individual features make a serious effect on the “impact on health and safety”. This factor rises by over 15% under the worst condition, but it drops by almost 10% in the best case. Likewise, the “availability of technology” and the “maturity of technology” are also influenced, which have a change that range from −10% to almost 7%.
In summary, when comparing the three scenarios, these simulation results suggest that policy elements have the most significant impact on the whole system, especially on the development of technology. It is clear that all of the factors have a considerable change under different political conditions. Meanwhile, the development and innovation of biomass technology depend on government policy to a large extent. Additionally, the impacts of technology on the health and safety, along with the requirement of local resources, also determinate whether the government will support its development and financially back it up. What is more, when taken together, these results suggest that there is an association between the feature of local residents and public acceptance of bioenergy technology as well as the development of the bioenergy. Another striking observation that emerges from the comparison is that the change of the development state of relevant technologies is indeed consistent with the public acceptance of these technologies under different conditions.
6. Conclusions and Policy Implications
The development of biomass technology has made a significant contribution to ecological resources circulation and the environment improvement of China, especially in rural areas. It also has considerable significance for the local economic development and energy security at the national level from the perspective of government. However, the spreading of such technologies confronts many obstacles, because the promotion of biomass and bioenergy involves several factors from various stakeholders, including the government, the energy company, and the local residents. Consequently, promoting the use of bioenergy not only relates to technology itself, but it also involves many social elements, which suggests that the solution of this problem turns out to be more complicated. This study aims to explain the interrelationship among these elements and illustrate the influence mechanism by virtue of integrating intuitionistic fuzzy logic and fuzzy cognitive map, so as to identify the role of various components concerning different stakeholders.
First and foremost, the components related to the government, such as the “policy and regulation”, the “financial support”, and the “promotion information”, contribute a significant effect on the other factors and the “availability of technology” and the “maturity of technology” are the most influenced factors. Therefore, it is concluded that the advancement of biomass technology is more sensitive to the cost in China. Furthermore, the technological factors largely influence the “impact on health and safety”, the “resources requirement”, and the “landscape and local environment”, which are the most concerned components for the local residents. Based on these simulation results, for the government, more attention should be paid to the research and development of new technology and the enhancement of the infrastructure of the industry, so as to reduce the high cost of investment for the company and gain environmental benefits for the local residents. It is evident that the proper policy guideline on the bioenergy market is essential to the industry due to its crucial role in boosting industry confidence in the investment of biomass and bioenergy. Apart from the effective regulation and favorable policy, various financial supports for the company provide greater access to technology innovation. For the company related to biomass, the company should strengthen the research on new high-tech technology and mitigate adverse effects on the environment to get more policy support and promotion as well as public acceptance.
What is more, the relevant promotion information is vital in improving public energy literacy and environmental awareness in rural China. Generally, the public hesitates to adopt a new energy technology because of unfamiliarity, particularly in remote regions where the residents have less access to relevant information. Hereby, the official promotion information about bioenergy, along with the foundational education on the nation energy, are essential in enhancing the public knowledge of renewable and environment awareness, which has a significant effect on the public acceptance of the related technologies. Apart from that, the information that is issued by the government is viewed as a guarantee for the safety of relevant technologies, particularly in rural China. Therefore, distributing proper information regarding new biomass technologies to the public may boost support for the development and use of bioenergy.
In conclusion, this study analyzes how various elements influence the public acceptance of biomass and bioenergy and illustrates the influence mechanism. According to the analysis results, we give some pieces of advice on how to improve the public recognition to promote the development and use of biomass and bioenergy in rural China. However, there are some shortcomings to our study, so further experimental researches are needed to explore the roles of each element in detail while using a wilder investigation to avoid the limitations of the expert’s experience and take more consideration of the local residents. Although this study has validated that public energy literacy and environment awareness have a significant effect on public acceptance, a greater focus on the exact method for intensifying public recognition on biomass could produce interesting findings that account more for the purpose of boosting public acceptance of bioenergy.
Author Contributions
L.M. and J.Y. conceived and designed the research project; J.Y. collected the expert’s data; L.M. constructed the model, analyzed the results and wrote the manuscript and L.Z. reviewed the manuscript.
Funding
This research was funded by the Fundamental Research Funds for the Central Universities, China University of Geosciences (Wuhan) (Grant G1323541816), Key Projects of Open Fund of Mineral Resource Strategy and Policy Research Center of China University of Geosciences (WUHAN), Resources Environmental Economic Research Center of China University of Geosciences (WUHAN) (Grant H2018006A, H2017001A), the tendering project of Government Decision Making Research in Henan Province (Grant 2018B132), the Key Scientific Research Project of Colleges and Universities in Henan Province (Grant 19A790020) and China Scholarship Council (Grant 201706410061).
Conflicts of Interest
The authors declare no conflict of interest. The founding sponsors had no role in the design of the study; in the collection, analyses, or interpretation of data; in the writing of the manuscript, and in the decision to publish the results.
References
- United Nations. The Paris Agreement. 2016 [cited 2018]. Available online: https://unfccc.int/process-and-meetings/the-paris-agreement/the-paris-agreement (accessed on 1 March 2019).
- Ackom, E.K.; Alemagi, D.; Ackom, N.B.; Minang, P.A.; Tchoundjeu, Z. Modern bioenergy from agricultural and forestry residues in Cameroon: Potential, challenges and the way forward. Energy Policy 2013, 63, 101–113. [Google Scholar] [CrossRef]
- Svanberg, M.; Finnsgård, C.; Flodén, J.; Lundgren, J. Analyzing animal waste-to-energy supply chains: The case of horse manure. Renew. Energy 2018, 129, 830–837. [Google Scholar] [CrossRef]
- Rosillo-Calle, F.; Hall, D.O. Biomass energy, forests and global warming. Energy Policy 1992, 20, 124–136. [Google Scholar] [CrossRef]
- Rosillo-Calle, F. Bioenergy (Other than Wood). In 2004 Survey of Energy Resources, 20th ed.; Elsevier: Amsterdam, The Netherlands, 2004; pp. 267–294. [Google Scholar]
- Sansaniwal, S.K.; Pal, K.; Rosen, M.A.; Tyagi, S.K. Recent advances in the development of biomass gasification technology: A comprehensive review. Renew. Sustain. Energy Rev. 2017, 72, 363–384. [Google Scholar] [CrossRef]
- Campbell, R.; Anderson, N.; Daugaard, D.; Naughton, H. Technoeconomic and Policy Drivers of Project Performance for Bioenergy Alternatives Using Biomass from Beetle-Killed Trees. Energies 2018, 11, 293. [Google Scholar] [CrossRef]
- Mboumboue, E.; Njomo, D. Biomass resources assessment and bioenergy generation for a clean and sustainable development in Cameroon. Biomass Bioenergy 2018, 118, 16–23. [Google Scholar] [CrossRef]
- Mohammed, Y.S.; Mokhtar, A.S.; Bashir, N.; Saidur, R. An overview of agricultural biomass for decentralized rural energy in Ghana. Renew. Sustain. Energy Rev. 2013, 20, 15–25. [Google Scholar] [CrossRef]
- Aslan, A. The causal relationship between biomass energy use and economic growth in the United States. Renew. Sustain. Energy Rev. 2016, 57, 362–366. [Google Scholar] [CrossRef]
- Domac, J.; Richards, K.; Risovic, S. Socio-economic drivers in implementing bioenergy projects. Biomass Bioenergy 2005, 28, 97–106. [Google Scholar] [CrossRef]
- González-García, S.; Bacenetti, J. Exploring the production of bio-energy from wood biomass. Italian case study. Sci. Total Environ. 2019, 647, 158–168. [Google Scholar] [CrossRef]
- Ghimire, L.P.; Kim, Y. An analysis on barriers to renewable energy development in the context of Nepal using AHP. Renew. Energy 2018, 129, 446–456. [Google Scholar] [CrossRef]
- Shane, A.; Gheewala, S.H.; Kafwembe, Y. Kafwembe, Urban commercial biogas power plant model for Zambian towns. Renew. Energy 2017, 103, 1–14. [Google Scholar] [CrossRef]
- Adams, P.W.; Hammond, G.P.; McManus, M.C.; Mezzullo, W.G. Barriers to and drivers for UK bioenergy development. Renew. Sustain. Energy Rev. 2011, 15, 1217–1227. [Google Scholar] [CrossRef]
- Shane, A.; Gheewala, S.H.; Fungtammasan, B.; Silalertruksa, T.; Bonnet, S.; Phiri, S. Bioenergy resource assessment for Zambia. Renew. Sustain. Energy Rev. 2016, 53, 93–104. [Google Scholar] [CrossRef]
- Roopnarain, A.; Adeleke, R. Current status, hurdles and future prospects of biogas digestion technology in Africa. Renew. Sustain. Energy Rev. 2017, 67, 1162–1179. [Google Scholar] [CrossRef]
- Malladi, K.T.; Quirion-Blais, O.; Sowlati, T. Development of a decision support tool for optimizing the short-term logistics of forest-based biomass. Appl. Energy 2018, 216, 662–677. [Google Scholar] [CrossRef]
- Kortsch, T.; Hildebrand, J.; Schweizer-Ries, P. Acceptance of biomass plants—Results of a longitudinal study in the bioenergy-region Altmark. Renew. Energy 2015, 83, 690–697. [Google Scholar] [CrossRef]
- Upreti, B.R.; van der Horst, D. National renewable energy policy and local opposition in the UK: The failed development of a biomass electricity plant. Biomass Bioenergy 2004, 26, 61–69. [Google Scholar] [CrossRef]
- Gasparatos, A.; von Maltitz, G.P.; Johnson, F.X.; Lee, L.; Mathai, M.; De Oliveira, J.P.; Willis, K.J. Biofuels in sub-Sahara Africa: Drivers, impacts and priority policy areas. Renew. Sustain. Energy Rev. 2015, 45, 879–901. [Google Scholar] [CrossRef]
- Mehetre, S.A.; Panwar, N.L.; Sharma, D.; Kumar, H. Improved biomass cookstoves for sustainable development: A review. Renew. Sustain. Energy Rev. 2017, 73, 672–687. [Google Scholar] [CrossRef]
- Li, Q.; Qi, J.; Jiang, J.; Wu, J.; Duan, L.; Wang, S.; Hao, J. Significant reduction in air pollutant emissions from household cooking stoves by replacing raw solid fuels with their carbonized products. Sci Total Environ. 2019, 650, 653–660. [Google Scholar] [CrossRef]
- Ozonoh, M.; Aniokete, T.C.; Oboirien, B.O.; Daramola, M.O. Techno-economic analysis of electricity and heat production by co-gasification of coal, biomass and waste tyre in South Africa. J. Clean. Prod. 2018, 201, 192–206. [Google Scholar] [CrossRef]
- Glykas, M. Fuzzy Cognitive Maps: Advances in Theory, Methodologies, Tools and Applications; Springer: Berlin, Germany, 2010; Volume 247. [Google Scholar]
- Papageorgiou, E.I.; Stylios, C.D. Handbook of granular computing. Fuzzy Cognitive Maps; John Wiley & Sons: Hoboken, NJ, USA, 2008; pp. 755–774. [Google Scholar]
- Ahmed, A.; Woulds, C.; Drake, F.; Nawaz, R. Beyond the tradition: Using Fuzzy Cognitive Maps to elicit expert views on coastal susceptibility to erosion in Bangladesh. Catena 2018, 170, 36–50. [Google Scholar] [CrossRef]
- Amirkhani, A.; Papageorgiou, E.I.; Mosavi, M.R.; Mohammadi, K. A novel medical decision support system based on fuzzy cognitive maps enhanced by intuitive and learning capabilities for modeling uncertainty. Appl. Math. Comput. 2018, 337, 562–582. [Google Scholar] [CrossRef]
- Stylios, C.D.; Georgopoulos, V.C. Fuzzy Cognitive Maps Structure for Medical Decision Support Systems, in Forging New Frontiers: Fuzzy Pioneers II; Springer: Berlin, Germany, 2008; pp. 151–174. [Google Scholar]
- Georgopoulos, V.C.; Stylios, C.D. Competitive Fuzzy Cognitive Maps Combined with Case Based Reasoning for Medical Decision Support; Springer: Berlin, Germany, 2007. [Google Scholar]
- Georgopoulos, V.C.; Stylios, C.D. Soft Computing. Complementary Case-Based Reasoning and Competitive Fuzzy Cognitive Maps for Advanced Medical Decisions; Springer: Berlin, Germany, 2008; Volume 12, pp. 191–199. [Google Scholar]
- Papageorgiou, E.; Stylios, C.D.; Groumpos, P.P. Hybrid model based on Decision Trees and Fuzzy Cognitive Maps for Medical Decision Support System. In World Congress on Medical Physics and Biomedical Engineering 2006; Springer: Berlin, Germany, 2007. [Google Scholar]
- Amirkhani, A.; Mosavi, M.R.; Mohammadi, K.; Papageorgiou, E.I. A novel hybrid method based on fuzzy cognitive maps and fuzzy clustering algorithms for grading celiac disease. Neural Comput. Appl. 2016, 30, 1573–1588. [Google Scholar] [CrossRef]
- Jose, A. Dynamic fuzzy cognitive maps for the supervision of multiagent systems. In Fuzzy Cognitive Maps; Springer: Berlin, Germany, 2010; pp. 307–324. [Google Scholar]
- Papageorgiou, E.I.; Markinos, A.T.; Gemtos, T.A. Fuzzy cognitive map based approach for predicting yield in cotton crop production as a basis for decision support system in precision agriculture application. Appl. Soft Comput. 2011, 11, 3643–3657. [Google Scholar] [CrossRef]
- Kyriakarakos, G.; Patlitzianas, K.; Damasiotis, M.; Papastefanakis, D. A fuzzy cognitive maps decision support system for renewables local planning. Renew. Sustain. Energy Rev. 2014, 39, 209–222. [Google Scholar] [CrossRef]
- Han, Y.; Deng, Y. A hybrid intelligent model for assessment of critical success factors in high-risk emergency system. J. Ambient Intell. Hum. Comput. 2018, 9, 1933–1953. [Google Scholar] [CrossRef]
- Azadeh, A.; Salehi, V.; Arvan, M.; Dolatkhah, M. Assessment of resilience engineering factors in high-risk environments by fuzzy cognitive maps: A petrochemical plant. Saf. Sci. 2014, 68, 99–107. [Google Scholar] [CrossRef]
- Shan, D.; Lu, W.; Yang, J. The data-driven fuzzy cognitive map model and its application to prediction of time series. Int. J. Innov. Comput. Inf. Control 2018, 14, 1583–1602. [Google Scholar]
- Baykasoğlu, A.; Gölcük, İ. Development of a novel multiple-attribute decision making model via fuzzy cognitive maps and hierarchical fuzzy TOPSIS. Inf. Sci. 2015, 301, 75–98. [Google Scholar] [CrossRef]
- Ortolani, L.; McRoberts, N.; Dendoncker, N.; Rounsevell, M. Analysis of farmers’ concepts of environmental management measures: An application of cognitive maps and cluster analysis in pursuit of modelling agents’ behavior. In Fuzzy Cognitive Maps; Springer: Berlin, Germany, 2010; pp. 363–381. [Google Scholar]
- Kosko, B. Fuzzy cognitive maps. Int. J. Man-Mach. Stud. 1986, 24, 65–75. [Google Scholar] [CrossRef]
- Groumpos, P.P. Fuzzy cognitive maps: Basic theories and their application to complex systems. In Fuzzy Cognitive Maps; Springer: Berlin, Germany, 2010; pp. 1–22. [Google Scholar]
- Axelrod, R. Structure of Decision: The Cognitive Maps of Political Elites; Princeton university press: Princeton, NJ, USA, 1976. [Google Scholar]
- Bueno, S.; Salmeron, J.L. Benchmarking main activation functions in fuzzy cognitive maps. Expert Syst. Appl. 2009, 36, 5221–5229. [Google Scholar] [CrossRef]
- Zadeh, L.A. Fuzzy sets. Inf. Control 1965, 8, 338–353. [Google Scholar] [CrossRef]
- Atanassov, K.T. Intuitionistic fuzzy sets. Fuzzy sets Syst. 1986, 20, 87–96. [Google Scholar] [CrossRef]
- Atanassov, K.T. Intuitionistic fuzzy sets. In Intuitionistic fuzzy sets; Springer: Berlin, Germany, 1999; pp. 1–137. [Google Scholar]
- Wirba, A.V.; Mas’ ud, A.A.; Muhammad-Sukki, F.; Ahmad, S.; Tahar, R.M.; Rahim, R.A.; Munir, A.B.; Karim, M.E. Renewable energy potentials in Cameroon: Prospects and challenges. Renew. Energy 2015, 76, 560–565. [Google Scholar] [CrossRef]
- Dulal, H.B.; Shah, K.U.; Sapkota, C.; Uma, G.; Kandel, B.R. Renewable energy diffusion in Asia: Can it happen without government support? Energy Policy 2013, 59, 301–311. [Google Scholar] [CrossRef]
- Singh, B.K. South Asia energy security: Challenges and opportunities. Energy Policy 2013, 63, 458–468. [Google Scholar] [CrossRef]
- Luthra, S.; Kumar, S.; Garg, D.; Haleem, A. Barriers to renewable/sustainable energy technologies adoption: Indian perspective. Renew. Sustain. Energy Rev. 2015, 41, 762–776. [Google Scholar] [CrossRef]
- Yatim, P.; Lin, N.S.; Lam, H.L.; Choy, E.A. Overview of the key risks in the pioneering stage of the Malaysian biomass industry. Clean Technol. Environ. Policy 2017, 19, 1825–1839. [Google Scholar] [CrossRef]
- Mittal, S.; Ahlgren, E.O.; Shukla, P.R. Shukla, Barriers to biogas dissemination in India: A review. Energy Policy 2018, 112, 361–370. [Google Scholar] [CrossRef]
- Zhang, Z.; Chen, B.; Chen, A.; Zhao, W. Barriers to commercialization development of crop straw gasification technology in China and promoting policy design. Energy Sources, Part B: Economics. Plan. Policy 2013, 8, 279–289. [Google Scholar]
- Gironès, V.C.; Moret, S.; Peduzzi, E.; Nasato, M.; Maréchal, F. Optimal use of biomass in large-scale energy systems: Insights for energy policy. Energy 2017, 137, 789–797. [Google Scholar] [CrossRef]
- Bansal, M.; Saini, R.P.; Khatod, D.K. Development of cooking sector in rural areas in India—A review. Renew. Sustain. Energy Rev. 2013, 17, 44–53. [Google Scholar] [CrossRef]
- Sansaniwal, S.K.; Rosen, M.A.; Tyagi, S.K. Tyagi, Global challenges in the sustainable development of biomass gasification: An overview. Renew. Sustain. Energy Rev. 2017, 80, 23–43. [Google Scholar] [CrossRef]
- Berndes, G. Bioenergy and water—The implications of large-scale bioenergy production for water use and supply. Glob. Environ. Chang. 2002, 12, 253–271. [Google Scholar] [CrossRef]
- Laasasenaho, K.; Lensu, A.; Rintala, J.; Lauhanen, R. Landowners’ willingness to promote bioenergy production on wasteland-future impact on land use of cutaway peatlands. Land Use Policy 2017, 69, 167–175. [Google Scholar] [CrossRef]
- DeWaters, J. Developing an energy literacy scale. In Proceedings of the 2007 ASEE Annual Conference and Exposition, Honolulu, HI, USA, 24–27 June 2007. [Google Scholar]
- DeWaters, J.; Qaqish, B.; Graham, M.; Powers, S. Designing an Energy Literacy Questionnaire for Middle and High School Youth. J. Environ. Educ. 2013, 44, 56–78. [Google Scholar] [CrossRef]
- DeWaters, J.; Powers, S. Establishing Measurement Criteria for an Energy Literacy Questionnaire. J. Environ. Educ. 2013, 44, 38–55. [Google Scholar] [CrossRef]
- Schwartz, T.; Denef, S.; Stevens, G.; Ramirez, L.; Wulf, V. Cultivating energy literacy: Results from a longitudinal living lab study of a home energy management system. In SIGCHI Conference on Human Factors in Computing Systems; ACM: Paris, France, 2013; pp. 1193–1202. [Google Scholar]
Figure 1.
The basic fuzzy cognitive map.

Figure 2.
The membership and non-membership function of trapezoidal IFN for the degree of influence.
Figure 2.
The membership and non-membership function of trapezoidal IFN for the degree of influence.
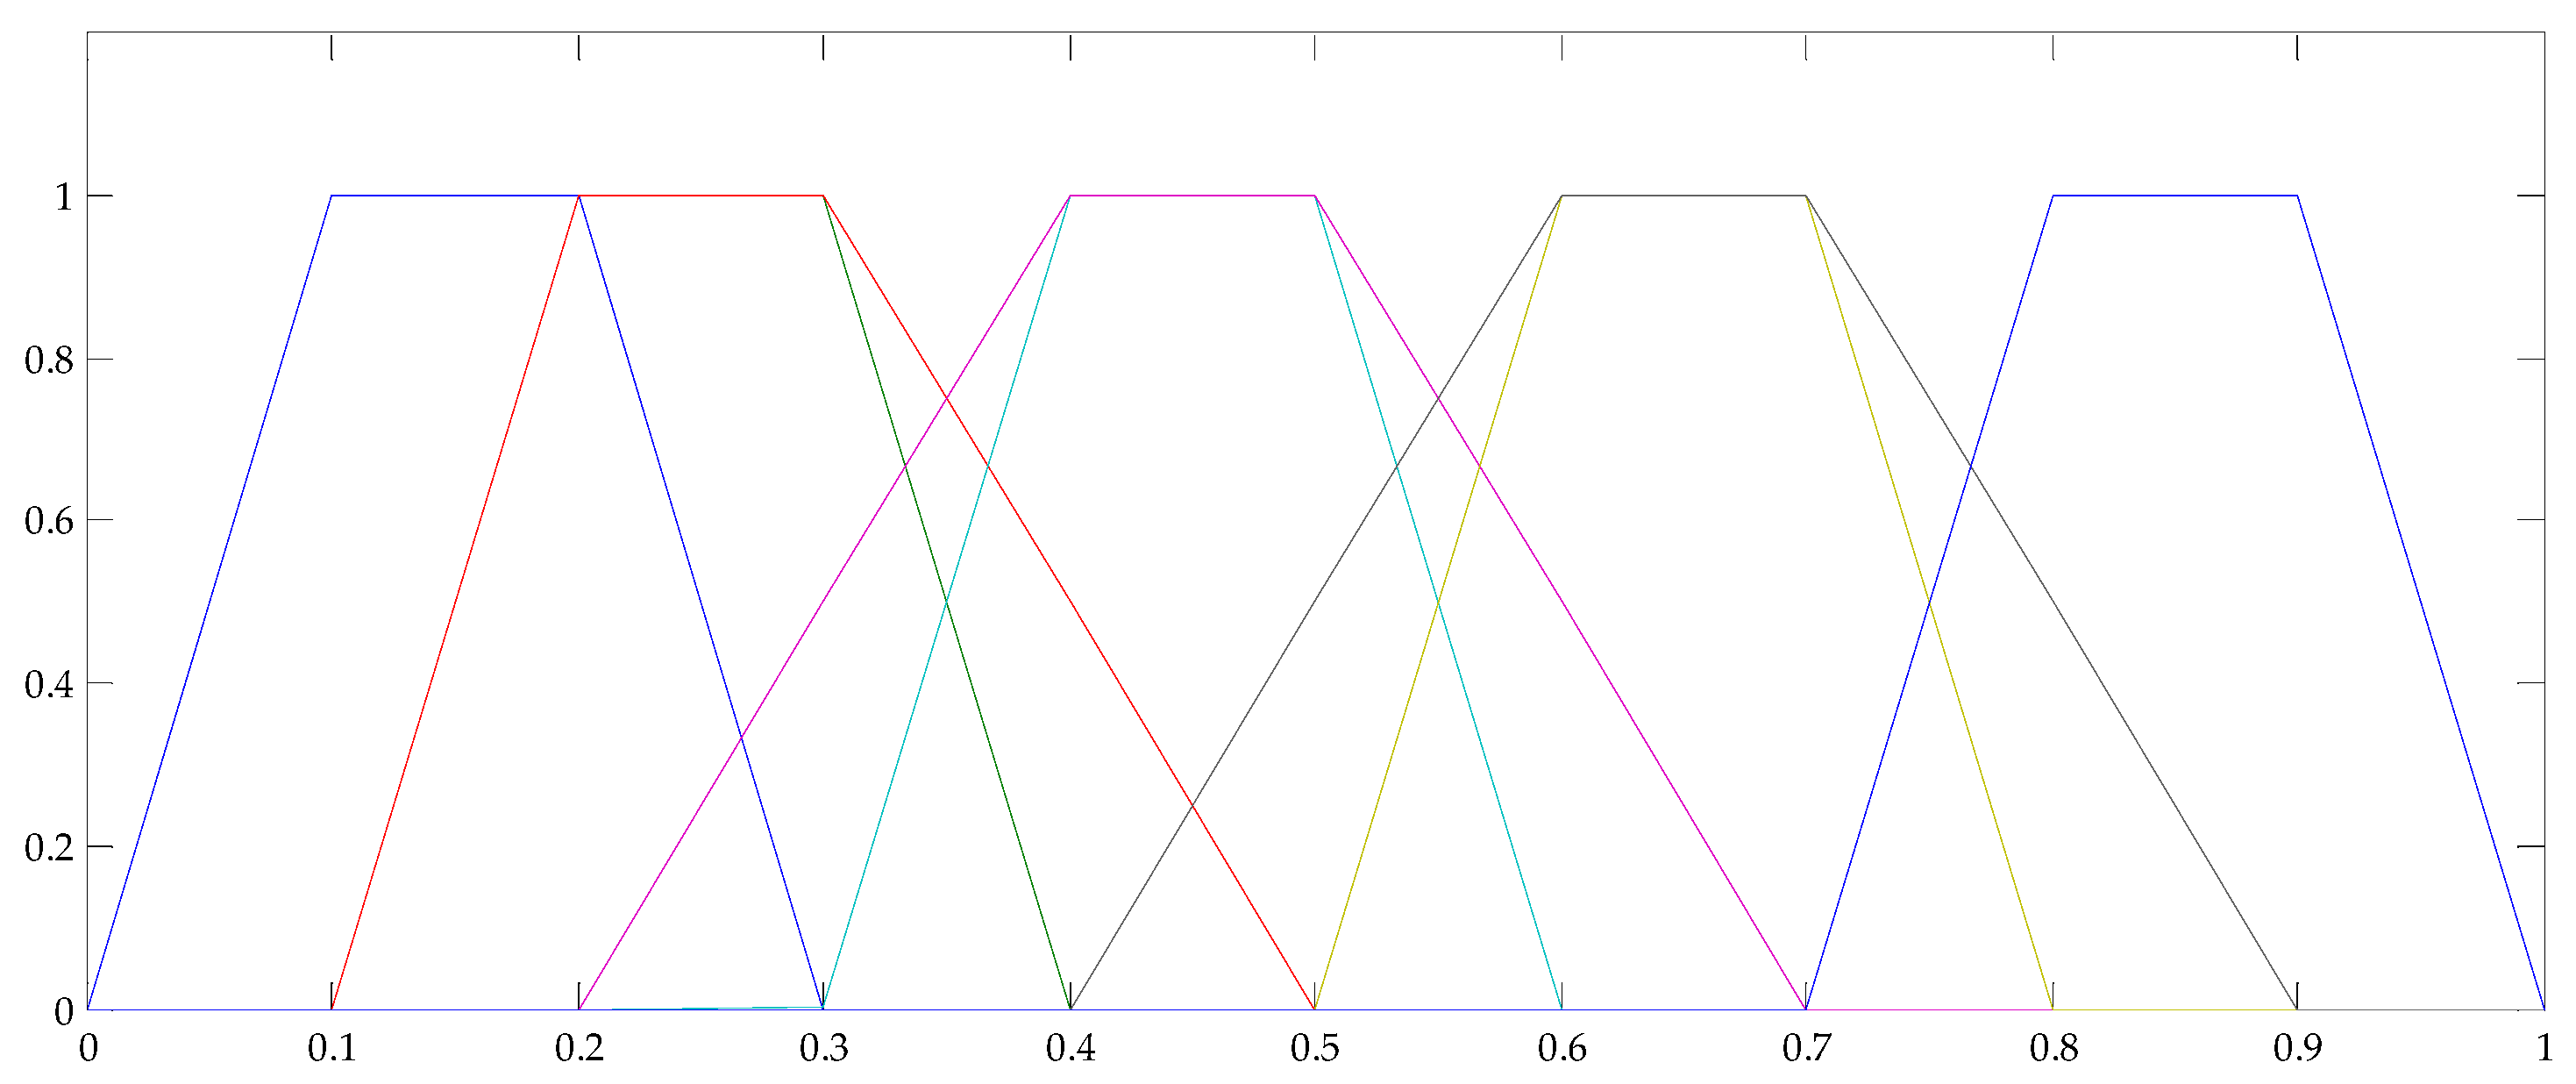
Figure 3.
The process of intuitionistic fuzzy cognitive map (IFCM).

Figure 4.
The collective fuzzy cognitive map.

Figure 5.
The impact of political factors on the other factors.

Figure 6.
The effect of the factor “policy and regulation”.

Figure 7.
The effect of the factor “financial support”.
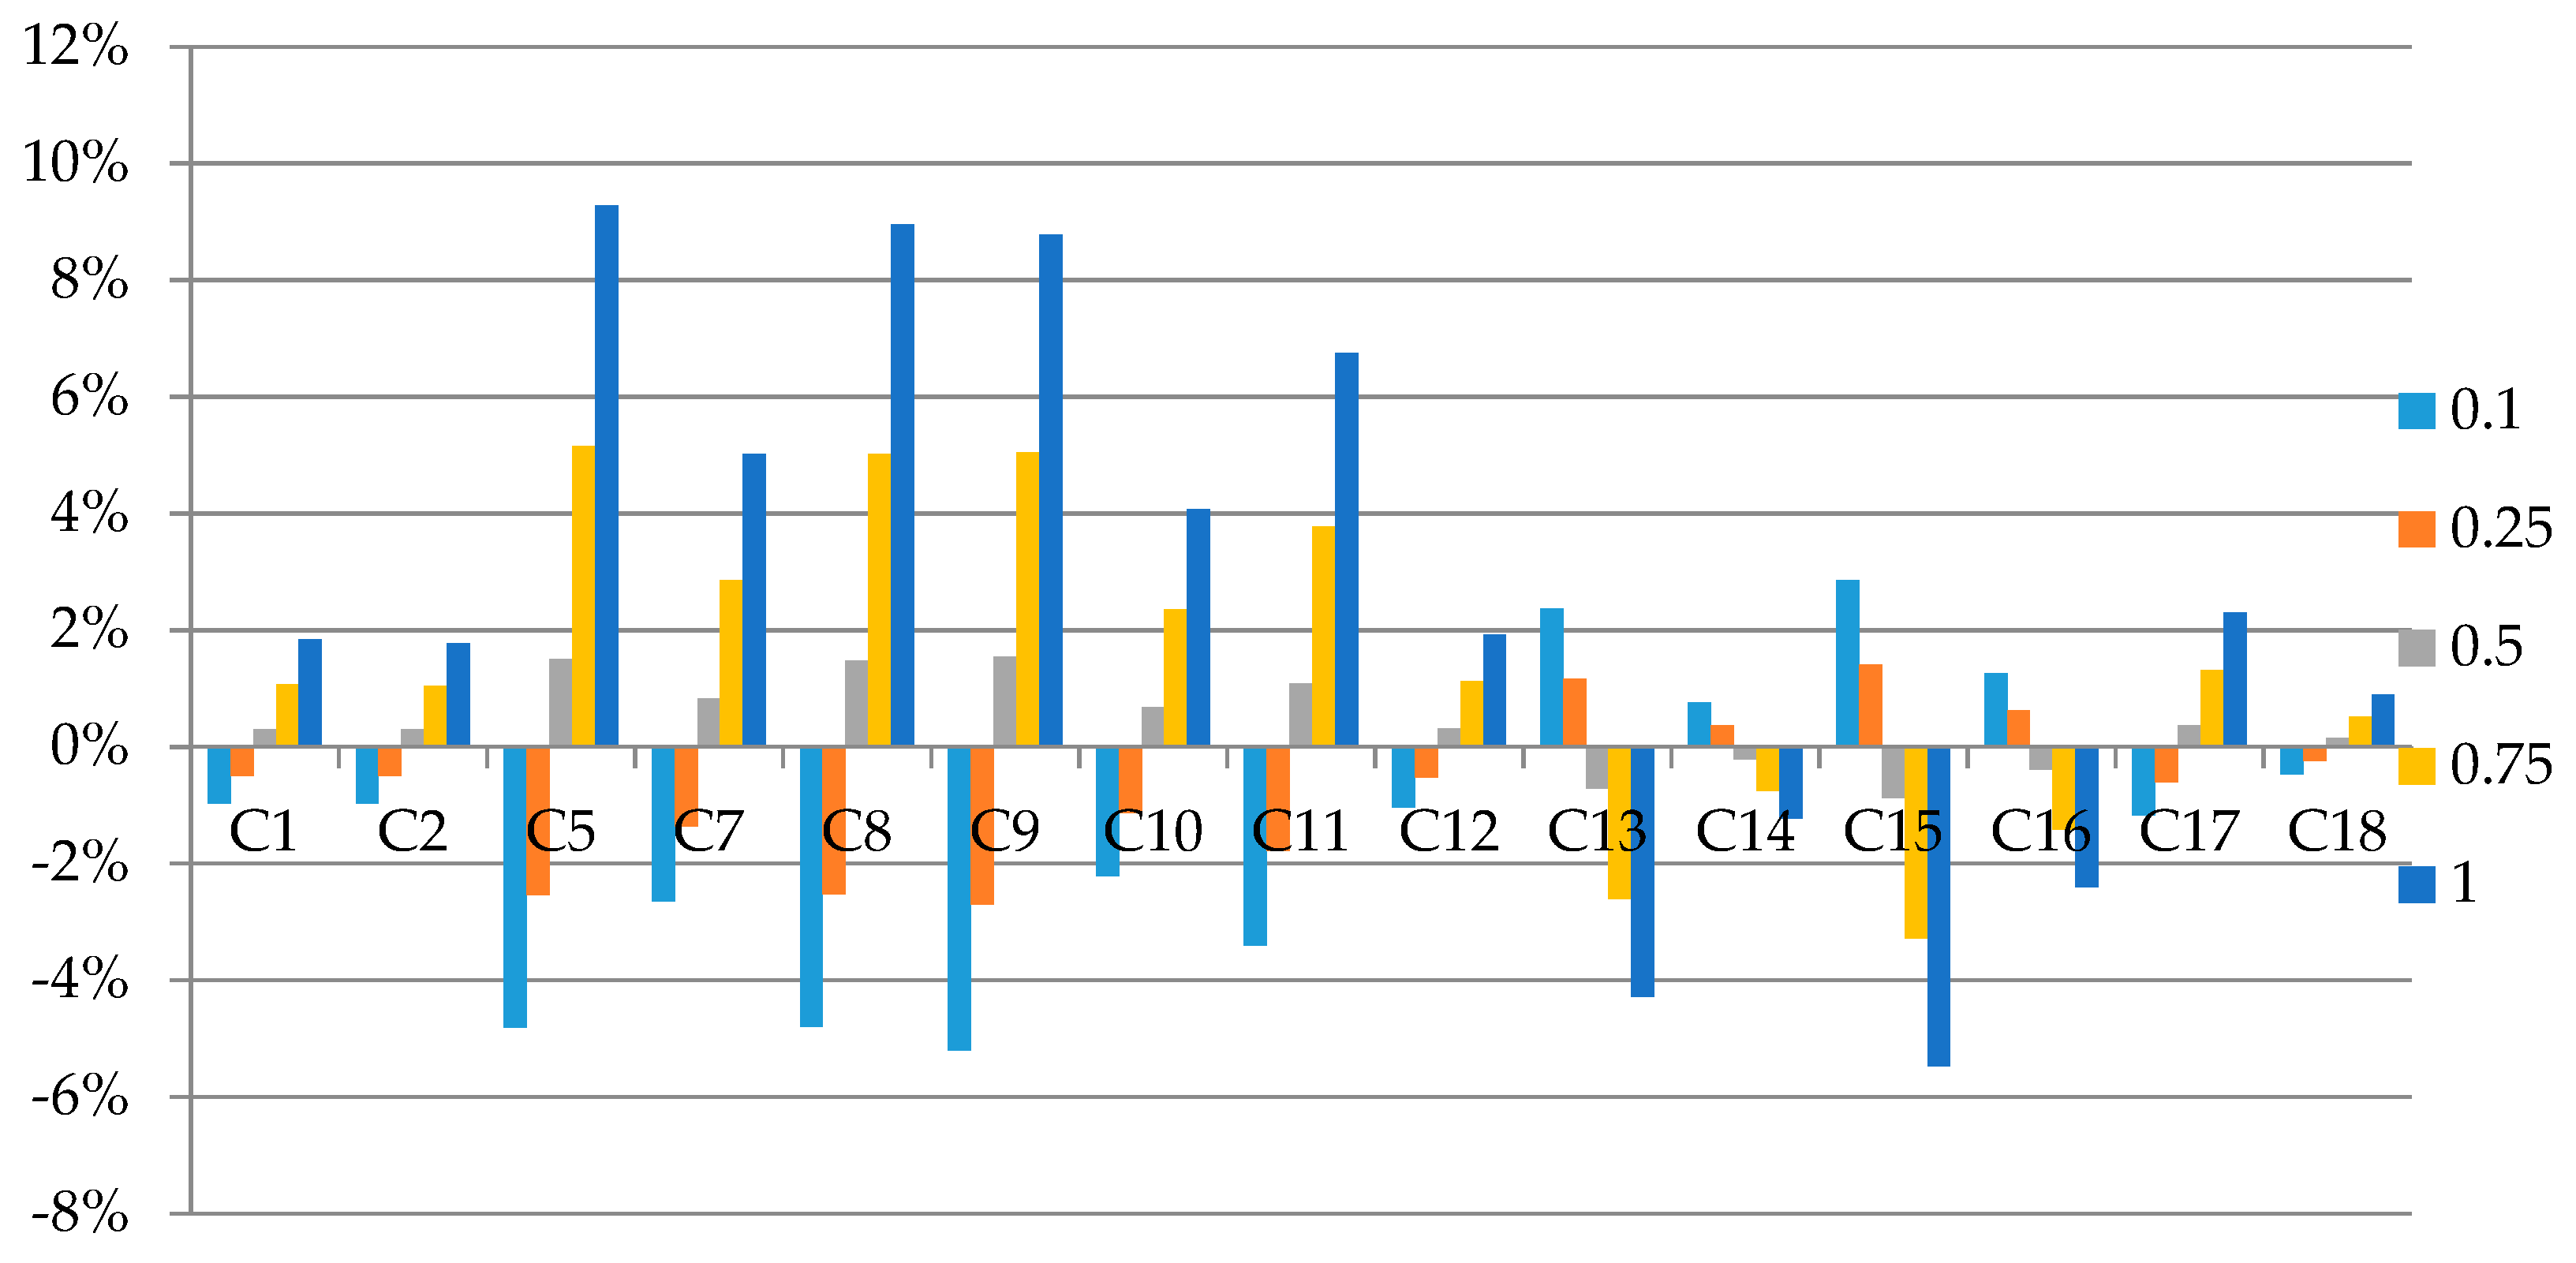
Figure 8.
The effect of the factor “promotion information”.

Figure 9.
The impact of technological factors on the other factors.

Figure 10.
The impact of individual factors on the other factors.


Table 1.
Linguistic variable and fuzzy number for the degree of influence.
| Linguistic Variable | Score | Intuitionistic Trapezoidal Fuzzy Number |
|---|---|---|
| Absolutely strong influence | 6 | |
| Strong influence | 5 | |
| Fairly strong influence | 4 | |
| Medium influence | 3 | |
| Fairly weak influence | 2 | |
| Weak influence | 1 | |
| Absolutely weak influence | 0 |
Table 2.
All the factors in IFCM.
| Concepts | Description | Stakeholders |
|---|---|---|
| C1: The current state | The current state of the implementation of biomass and bioenergy | Government |
| C2: Public acceptance | The degree of public acceptance of bioenergy | |
| C3: Policy and regulation | Official guideline, regulation and development planning on the promotion of biomass issued by government | |
| C4: Financial support | The strength of financial support provided by the government | |
| C5: Effect on the employment | The potential of developing biomass to create employment | |
| C6: Promotion information | The government launched information about biomass technology | |
| C7: Impact on regional economy | The role of biomass in the development of regional economy | |
| C8: Availability of technology | the number of available technologies for the industry to transform biomass | Industry (the energy company) |
| C9: Maturity of technology | the maturity of biomass technologies | |
| C10: Profitability of investment | The evaluation of the commercial value of a specific biomass technology or a pointed project | |
| C11: Local consumer paying capacity | the paying capacity of the local residents to pay for the bioenergy or renewable energy | |
| C12: Prospect of market | Market access requirement for bioenergy as well as the energy market’s capability to consume bioenergy or renewable energy | |
| C13: Impact on health and safety | The effect of biomass technology on the local residents’ health | The local residents (the individuals) |
| C14: Resources requirement | The demand for the limited local resources | |
| C15: Landscape and local environment impact | The influence of biomass project on the local landscape due to the visual effect along with the negative impact on the living environment | |
| C16: Energy price | The impact of increasing the portion of bioenergy in the energy market on the energy price | |
| C17: Energy literacy | Public knowledge and recognition of the energy and bioenergy | |
| C18: Environment awareness | Public attention on environment issues such as the living environment, global climate change, air pollution and so on |
Table 3.
One expert’s advice on the strength of these factors.
| C1 | C2 | C3 | C4 | C5 | C6 | C7 | C8 | C9 | C10 | C11 | C12 | C13 | C14 | C15 | C16 | C17 | C18 | |
|---|---|---|---|---|---|---|---|---|---|---|---|---|---|---|---|---|---|---|
| C1 | VL | VL | L | VL | VL | VL | VL | VL | VL | VL | VL | VL | VL | VL | VL | VL | VL | VL |
| C2 | FH | VL | −L | −L | VL | VL | L | VL | VL | L | VL | L | VL | VL | VL | VL | VL | VL |
| C3 | VL | VL | VL | VL | L | VL | L | M | M | VL | VL | M | −FL | −FL | −FL | −M | FL | L |
| C4 | VL | VL | VL | VL | L | L | L | FH | H | FL | M | L | −L | −L | −L | −L | L | L |
| C5 | VL | L | L | VL | VL | L | L | VL | VL | VL | L | VL | VL | VL | VL | VL | VL | VL |
| C6 | VL | L | VL | VL | VL | VL | VL | VL | VL | VL | VL | VL | VL | VL | VL | VL | L | L |
| C7 | VL | VL | L | VL | L | L | VL | L | L | L | L | VL | VL | VL | VL | L | L | FL |
| C8 | M | VL | L | L | VL | L | VL | VL | L | VL | VL | L | −L | VL | −L | VL | VL | VL |
| C9 | FH | VL | L | L | −L | FL | VL | −FL | VL | FL | VL | L | −L | −L | −FL | −L | M | VL |
| C10 | L | VL | VL | VL | VL | VL | FL | FH | M | VL | VL | VL | VL | VL | VL | VL | VL | VL |
| C11 | L | L | L | −L | VL | VL | VL | VL | VL | L | VL | VL | VL | VL | VL | VL | VL | VL |
| C12 | L | M | VL | VL | L | L | VL | M | FH | VL | VL | VL | VL | VL | VL | VL | VL | VL |
| C13 | −VH | −FH | −FL | −FL | −L | −M | −M | −M | −H | −M | VL | −FH | VL | VL | VL | VL | VL | VL |
| C14 | −H | −FL | −L | −L | VL | −L | −L | −L | VL | −L | VL | −L | VL | VL | VL | VL | VL | VL |
| C15 | −FH | −L | −L | −L | VL | −L | −L | −L | VL | −L | VL | −L | VL | VL | VL | VL | VL | L |
| C16 | −H | −M | L | L | VL | VL | VL | FL | L | L | −M | VL | VL | VL | VL | VL | VL | VL |
| C17 | VL | M | −L | VL | VL | VL | VL | L | L | VL | VL | VL | VL | VL | VL | VL | VL | VL |
| C18 | VL | FL | −L | VL | VL | VL | VL | L | L | VL | VL | VL | VL | VL | VL | VL | VL | VL |
Note: “VH” represents “absolutely strong influence”, “H” denotes “strong influence”, “FH” shows “fairly strong influence”, “M” refers to “medium influence”, “FL” is “fairly weak influence”, “L” is “weak influence”, and “VL” denotes “absolutely weak influence”, and then the minus sign “−” represents the influence is negative.
Table 4.
The crisp value of the connection matrix.
| C1 | C2 | C3 | C4 | C5 | C6 | C7 | C8 | C9 | C10 | C11 | C12 | C13 | C14 | C15 | C16 | C17 | C18 | |
|---|---|---|---|---|---|---|---|---|---|---|---|---|---|---|---|---|---|---|
| C1 | 0 | 0 | 0.15 | −0.05 | 0.15 | 0 | 0.1 | 0.05 | 0.05 | 0.15 | 0 | 0 | 0 | 0.05 | 0 | 0 | 0 | 0 |
| C2 | 0.225 | 0 | −0.125 | −0.275 | 0.125 | −0.125 | 0.15 | 0.05 | 0.15 | 0.3 | 0 | 0.24 | 0 | 0 | 0 | −0.125 | 0.125 | 0.225 |
| C3 | 0 | 0 | 0 | 0.125 | 0.05 | 0.125 | 0.2 | 0.55 | 0.725 | 0.125 | 0 | 0.55 | −0.125 | −0.1 | −0.125 | 0 | 0.12 | 0.1 |
| C4 | 0 | 0 | 0 | 0 | 0.4 | 0.15 | 0.15 | 0.45 | 0.65 | 0.125 | 0.225 | 0 | −0.075 | 0 | −0.2 | −0.075 | 0.075 | 0.025 |
| C5 | 0 | 0.075 | 0.135 | 0.125 | 0 | 0.075 | 0.2 | 0 | 0 | 0 | 0.15 | 0 | 0 | 0 | 0 | 0 | 0 | 0 |
| C6 | 0 | 0.175 | 0 | 0 | 0.125 | 0 | 0.075 | 0.075 | 0.075 | 0.075 | 0 | 0 | 0 | 0 | 0 | 0 | 0.12 | 0.2 |
| C7 | 0.075 | 0.225 | 0.125 | 0 | 0.125 | 0.15 | 0 | 0.025 | 0.05 | 0 | 0.055 | 0.125 | 0 | 0.125 | 0.225 | 0 | 0.015 | 0.02 |
| C8 | 0 | 0 | 0.225 | 0.125 | 0 | 0.2 | 0.075 | 0 | 0.2 | 0.075 | 0 | 0.25 | −0.25 | −0.125 | 0 | 0 | 0 | 0 |
| C9 | 0 | 0.125 | 0.125 | −0.25 | 0 | 0.125 | 0.125 | −0.05 | 0 | 0.35 | 0 | 0 | −0.075 | −0.24 | 0.1 | 0 | 0 | 0 |
| C10 | 0.15 | 0.075 | 0 | 0 | 0.125 | 0 | 0.2 | 0.125 | 0.25 | 0 | 0.125 | 0 | 0 | 0 | 0 | 0 | 0 | 0 |
| C11 | 0.075 | 0 | 0 | −0.2 | 0 | 0.125 | 0 | 0.1 | 0.05 | 0.05 | 0 | 0 | 0 | 0 | 0 | 0 | 0.125 | 0.225 |
| C12 | 0 | 0.25 | 0 | 0.25 | 0.12 | 0.15 | 0.075 | 0.1 | 0.1 | 0.125 | 0 | 0 | 0 | 0 | 0 | 0 | 0 | 0 |
| C13 | −0.525 | −0.25 | −0.225 | −0.325 | −0.175 | −0.225 | −0.35 | −0.225 | −0.25 | −0.225 | 0 | −0.325 | 0 | 0.075 | 0.125 | 0 | 0.02 | 0.225 |
| C14 | −0.65 | −0.2 | −0.3 | 0.225 | 0 | −0.25 | −0.025 | 0 | 0 | 0 | 0 | −0.35 | −0.15 | 0 | 0.225 | 0 | 0 | 0.02 |
| C15 | −0.45 | −0.175 | −0.075 | −0.175 | 0 | −0.075 | −0.175 | −0.23 | −0.25 | 0 | 0 | −0.3 | −0.025 | 0 | 0 | 0 | 0 | 0.175 |
| C16 | 0.25 | −0.45 | 0 | 0 | 0 | 0 | −0.075 | −0.125 | −0.25 | −0.25 | −0.15 | −0.125 | 0 | 0 | 0 | 0 | 0 | 0 |
| C17 | 0.075 | 0.525 | 0.125 | 0 | 0 | −0.25 | 0 | 0.35 | 0.425 | 0 | 0 | 0 | −0.125 | 0 | −0.075 | 0 | 0 | 0.125 |
| C18 | 0.075 | 0.45 | 0.15 | 0 | 0 | −0.15 | 0 | 0.15 | 0.15 | 0 | 0 | 0 | −0.25 | −0.125 | −0.25 | 0 | 0.075 | 0 |
© 2019 by the authors. Licensee MDPI, Basel, Switzerland. This article is an open access article distributed under the terms and conditions of the Creative Commons Attribution (CC BY) license (http://creativecommons.org/licenses/by/4.0/).
Share and Cite
MDPI and ACS Style
Ma, L.; Yu, J.; Zhang, L. An Analysis on Barriers to Biomass and Bioenergy Development in Rural China Using Intuitionistic Fuzzy Cognitive Map. Energies 2019, 12, 1598. https://doi.org/10.3390/en12091598
AMA Style
Ma L, Yu J, Zhang L. An Analysis on Barriers to Biomass and Bioenergy Development in Rural China Using Intuitionistic Fuzzy Cognitive Map. Energies. 2019; 12(9):1598. https://doi.org/10.3390/en12091598
Chicago/Turabian StyleMa, Linmao, Jing Yu, and Long Zhang. 2019. "An Analysis on Barriers to Biomass and Bioenergy Development in Rural China Using Intuitionistic Fuzzy Cognitive Map" Energies 12, no. 9: 1598. https://doi.org/10.3390/en12091598
Note that from the first issue of 2016, this journal uses article numbers instead of page numbers. See further details here.