Assessment of the Space Heating and Domestic Hot Water Market in Europe—Open Data and Results
by
 , , and
Simon Pezzutto
1,* ,
,
Silvia Croce
1,2 ,
,
Stefano Zambotti
1,
Lukas Kranzl
3,
Antonio Novelli
1 and
and
Pietro Zambelli
1 1
Institute for Renewable Energy, European Academy of Bozen/Bolzano (EURAC Research), Viale Druso 1, 39100 Bolzano, Italy
2
Department of Civil, Environmental and Architectural Engineering, University of Padova, Via Marzolo 9, 35131 Padova, Italy
3
Institute of Energy Systems and Electric Drives, Energy Economics Group, TU Wien, Gusshausstrasse 25-29/370-3, 1040 Vienna, Austria
*
Author to whom correspondence should be addressed.
Energies 2019, 12(9), 1760; https://doi.org/10.3390/en12091760
Submission received: 13 April 2019
/
Revised: 30 April 2019
/
Accepted: 8 May 2019
/
Published: 9 May 2019
(This article belongs to the Special Issue Open Data and Energy Analytics)
Abstract
:The paper investigates the European space heating (SH) and domestic hot water (DHW) market in order to close knowledge gaps concerning its size. The stimulus for this research arises from incongruences found in SH and DHW market’s data in spite of over two decades of scientific research. The given investigation has been carried out in the framework of the Hotmaps project (Horizon 2020—H2020), which aims at designing an open source toolbox to support urban planners, energy agencies, and public authorities in heating and cooling (H&C) planning on country, regional, and local levels. Our research collects and analyzes SH and DHW market data in the European Union (EU), specifically the amount of operative units, installed capacities, energy efficiency coefficients as well as equivalent full-load hours per equipment type and country, with a bottom-up approach. The analysis indicates that SH and DHW account for a significant portion of the total EU energy utilization (more than 20%), amounting to almost 3900 TWh/y. At the same time, the energy consumption provided by district heating (DH) systems exceeds the one of condensing boilers. While DH systems applications are growing throughout the EU, the replacement of elderly, conventional boilers progresses at a slower pace.
1. Introduction
While the member states (MS) of the European Union (EU) aim at reaching an integrated policy framework, especially directed at delivering sound market regulations to investors, national policies have been focused on a permanent improvement in efficiency by bringing the share of energy generated by renewable energy sources (RES) to 27% within 2030. Moreover, EU MS explicitly set a reduction in greenhouse gas (GHG) emissions goal of 40% compared to 1990 levels by 2030 [1], aiming to 80–95% by 2050 [2]. The achievement of the Paris Conference of the Parties 21 (COP21) accordance will require reaching at least the upper bound of this range [3].
In 2015, EU’s primary energy consumption accounted for about 1600 Mtoe/y, of which a major contribution is provided by heating and cooling (H&C) applications (about 800 Mtoe/y, including also industrial heat), followed by transport and electricity (about 490 Mtoe/y and 310 Mtoe/y respectively) [4,5,6,7,8]. Buildings are responsible for approximately 640 Mtoe/y, which corresponds to 40% of the whole EU primary energy consumption [9,10]. The largest parts of energy utilization within the EU building stock (~75% in total), according to an order of magnitude, occur for space heating (SH), domestic hot water (DHW), and space cooling (SC) [11]. In the past three decades, EU MS invested massively in assessing the energy used by the different sectors [12,13,14,15,16,17]. In contrast to SC, the SH and DHW field is well researched in the scientific literature since more than two decades apart [7,18].
In particular, the EC supported a number of studies to provide quantitative data in this area, and inform related energy strategies and roadmaps (e.g., EC 2019 [19], Pardo et al. 2012 [20], and EC 2011 [21]). Further notable studies on the SH and DHW market in Europe were the result of various projects, such as the H2020 HRE4 [22], IEE STRATEGO [23], and Seventh Framework Programme (FP7) iNSPiRe [24]. Moreover, the following reports provide valuable insights into the investigated market: Patronen et al. 2012 [25], Boermans et al. 2012 [26], Von Manteuffel et al. 2016 [27], and Sanner et al. 2011 [28]. Finally, also scientific journal papers like Scoccia et al. 2018 [29], Balaras et al. 2007 [30], and Leurent et al. 2018 [31] contribute to the understanding of the SH and DHW market in Europe.
Carried out in the framework of the Horizon 2020 (H2020) Hotmaps project [32], our study generated a data repository for the SH and DHW market [33] (sources are available in the respective csv file [34]). The data are released as open data under the Creative Commons license CC-BY 4.0 [35]. This EU-funded project aims at designing an open source toolbox (released under the Apache 2.0 license [36]) to support urban planners, energy agencies, and public authorities in heating and cooling (H&C) planning at different scales (national, regional, and local), and in line with EU policies. As part of the project, the data analyzed in the present paper have been collected through a bottom-up approach. Based on the analysis carried out in [37], a more comprehensive investigation has been performed. In particular, we took a closer look at the uncertainty of generated results, provided an interpretation of the main outcomes, compared the main result with related findings of scientific literature as well as discussed its implications.
In order to create a high quality data set—characterized by completeness, accuracy, and reliability—in the framework of our analysis we place a special focus on the following aspects:
1.1. Data Inventory
One of the main challenges of creating an inventory of SH and DHW market technologies consists of preparing an exhaustive list of all existing data. Generally, the use of data collected at EU-wide level offers unique advantages due to their extensive territorial scope (e.g., EurObserv’ER [40], EUROHEAT&POWER [41], and EHPA [42]). However, data completeness can never be fully ensured.
Attempts of closing data gaps require not only extrapolating and assembling data from large data sets available online (e.g., EU Buildings Database [43], EHPA’s Online Stats Tool [44], and IGA [45]). To ensure a rigorous approach and address the lack of data, it also encompasses searching data source-by-source, especially by using individual scientific literature sources such as journal papers (e.g., Bertoldi et al. 2012 [46], Martinopoulos et al. 2018 [47], and Clay 2015 [48]).
One important aspect of the data inventory is to ensure that the information can be understood and interpreted correctly by any user. This requires a compilation of clear metadata description, annotation, contextual information, and documentation. The data documentation provides standardized structured information, indicating the creator, title, time references, access conditions, and terms of use of the data collection (please see Pezzutto and Zambelli 2019 [34] and Pezzutto and Zambelli 2019 [49]). The data repository is structured following the Frictionless data standards [50], to encode and describe the metadata and the main data set information using a data package.json file that is readable by both human and computers. A more detailed insight on the methodology that produced the data set is provided by the respective README.md file [51]. The license of the data repository is encoded using the Software Package Data Exchange (SPDX) format [52], in order to univocally identify the license. The Hotmaps’ project selects a git repository to publish the data set, instead for example of a File Transfer Protocol (FTP) service, because a git service allows to: (i) preserve the history of the changes; (ii) perform an automatic versioning of the data that univocally identified the data set; and (iii) provide the functionalities to manage and discuss external contributions (e.g., open/assign/close issues, accept/comment/reject data modifications, etc.). Further details on the data inventory can be found in the Hotmaps Data Management Plan (DMP) [53].
1.2. Data Reliability
Much effort has been dedicated to analyze sources, assess the reliability of the gathered data, and fill existing gaps by in-depth investigations. We discern various types of information, by analyzing the different approaches applied for the collection of the identified data (e.g., amount of SH and DHW sold vs. operative units). In case of lacking or uncertain documentation, the data have not been considered for the development of the database.
All information collected on SH and DHW (i.e., amount of operative units, installed capacities, energy efficiency coefficients as well as equivalent full-load hours per equipment type and country) have been filtered and evaluated statistically; the methodology adopted is described in Section 2. Materials and Methods. Moreover, additional sources and types of information have been used to validate the outcomes obtained for the EU28 (see Section 4—Discussion) to assess their reliability.
1.3. Data Definition and Comparability
Although most data providers use standardized data formats and units, this does not necessarily mean that data are entirely comparable. In order to increase data comparability, the entire process of data elaboration requires adjusting differences and inconsistencies resulting from different methods, assumptions, measures, time references, and specifications [54].
Data have been collected for each EU MS using the most recent year available, while data over a decade old have been excluded (please see [34]). The developed data sets including the documentation are expected to improve data quality, add value to already existing data and provide data needed to monitor the progress of the SH and DHW field in Europe.
2. Materials and Methods
Our main data sources were derived from previous works. In particular, to those elaborated by AALBORG UNIVERSITY, HALMSTAD UNIVERSITY, and EUROPA-UNIVERSITÄT FLENSBURG in the context of several projects dedicated to the topic, including the data sets of the H2020 project Heat Roadmap Europe 4 (HRE4) [55], and the Intelligent Energy Europe (IEE) project STRATEGO (Multi level actions for enhanced Heating and Cooling plans) [56]. Another source, relevant for the data set compilation of the present investigation, is the data collection of the tender “Mapping and analyses of the current and future (2020–2030) heating/cooling fuel deployment (fossil/renewables)—ENER/C2/2014-641” led by the Fraunhofer Institute for Systems and Innovation Research—FH ISI [57].
Besides the deliverables achieved through the projects above (such as [58,59,60]), “Deliverable 2.1 Intermediate analysis of the heating and cooling industry” [61] was key in carrying out our work. The deliverable was produced within the tender “Support to key activities of the European technology platform on renewable heating and cooling”—PP-2041/2014.
Additional important information are provided by reports of Solar Heat Worldwide (e.g., [62,63]), EUROSTAT [64], and the TABULA WebTool [65]. Scientific publications have also been used as data sources, e.g., [66,67,68]. Given the large amount of references, in Section 3. Results and Table 1, only the major ones are indicated. Table 1 summarizes the most relevant data sources per type of information researched.
The analysis started by considering different SH and DHW technologies installed throughout Europe. The data were collected for each MS—as sources mainly provide information at country level—and were not subdivided by sector. The equipment typologies were categorized as found in [58,62,69]:
- Boilers:
- -
- Non-condensing;
- -
- Condensing;
- Stoves;
- Electric radiators;
- Heat pumps (HPs):
- -
- Aerothermal;
- -
- Geothermal;
- Solar thermal systems (STS):
- -
- Unglazed collectors;
- -
- Flat-plate collectors;
- -
- Evacuated tube collectors;
- Combined heat and power—Internal combustion (CHP-IC);
- District heating (DH).
In the list above, furnaces were classified in the category “Boilers, Non-condensing”.
For each MS and type of equipment, data regarding number of units, installed capacity, yearly equivalent full-load hours, and energy efficiency coefficients were collected. With regard to energy efficiency coefficients, the absolute majority of the technologies identified were characterized by thermal efficiency. These include condensing and non-condensing boilers, stoves, electric radiators, CHP-IC units, and various solar thermal systems (unglazed, flat-plate, and evacuated tube collectors). Aerothermal and geothermal HPs were instead described by the coefficient of performance (COP). In order to estimate the efficiency of DH systems, mean losses were included by considering DH network heat losses [70].
We also researched information on system types—in percentage at country level—as well as resources used to fuel each equipment considered. The latter are classified as proposed in [58,64,69]:
- Oil;
- Gas (natural gas);
- Coal;
- Renewables;
- Other fuels.
The category “Other fuels” included less dispersed combustibles (e.g., coke, peat, etc.) [64].
The data analysis was based on a bottom-up approach, which included an extensive literature analysis aimed at deriving reliable values. Data collected from scientific literature sources were filtered and statistically analyzed.
As a first step, for each MS and category of information (i.e., number of units, installed capacity, yearly equivalent full-load hours, and energy efficiency coefficients) at least three data were collected from different sources when possible. Then, their mean values were calculated. Depending on the amount of references, data that departed between a range of plus or minus one standard deviation around the mean of the respective data pool were excluded. The resulting numbers were utilized to calculate a more robust mean.
The sources of the data used as input cannot always be classified as open data, but the results of the statistical elaboration were released as open data. The published data set in [34] explicitly specifies when a value is the result of the statistical elaboration using more than one source (tagged as “Own calculation”) or derived by a single source solely; for the latter, the source is specified.
Moreover, the coefficient of variation (CV) was utilized as a statistical indicator of uncertainty for generated values. The CV is the ratio of the standard deviation to the mean. The higher the CV the higher is the dispersion around the mean. Generally, it is indicated as a percentage [71,72] (displayed at the top of the columns in Figures 1–4). Unfortunately, due to missing data, it was not always possible to retrieve two or more data for each investigated value; in these cases, no statistical elaborations were carried out. In a minor amount of cases, data were extrapolated from one country, where data were available, to another, where data were missing—whenever in the presence of geographical, socio-economic, and historical similarities. Extrapolation of data was applied to the following countries:
- Czech Republic and Slovakia;
- Bulgaria and Romania;
- Estonia, Latvia, and Lithuania.
This approach was only applied with regard to mean installed capacities, efficiencies, and equivalent full-load hours. We did not put forward any specific assumption on mean installed capacities for DH systems. Zero values are present only when this was supported by one or more references, e.g., showing that no DH systems are available in Malta so far [73]. In a few specific cases, when information was available only at aggregated EU28 level, data were applied to all MS equally. As an example, this was the case of values regarding the mean installed capacity of stoves [61].
Based on the methodology proposed by Pezzutto et al. 2017 [7], once the data collection has been concluded, mean capacities installed per technology have been divided by their respective energy efficiency coefficients to obtain the work input (W) per equipment type. Then, in order to obtain energy consumption values per equipment type and sector, the number (Nr.) of units was multiplied by the equivalent full-load hours (T—time) in a year and by its work input (W) using the following Equation (1):
The utilized formula represents a simplified method to assess the energy consumption given by SH and DHW equipment at EU28 level, not differentiating between modulation and on-off equipment, as well as not considering partial load operation, efficiency of sources depending on its level of load, and accumulation of energy in buildings. Mainly due to not taking into consideration partial load operation, the used methodology thus might underestimate the assessed energy consumption.
To compare this investigation outcome with others in the scientific literature (please see Section 4. Discussion), we converted energy demand in energy consumption values by multiplying by 1.15. An important distinction is in place: What is meant with energy demand and energy consumption. The first is the net energy necessary to satisfy both SH and DHW needs. The second represents instead the input of energy at the level of devices necessary to cover the demand. On the basis of these definitions, the values of these quantities differ by a conversion factor. With these premises, since a boiler’s efficiency is <1 (about 0.8–0.9 for those currently installed in Europe), energy consumption values are always higher compared to demand [37,66,69].
As the applied methodology relies on a number of assumptions, the main uncertainties associated with the final results were the following:
- The use of average data at the EU level, when data for each MS were not available, and of efficiency coefficients constants for all MS were necessary to fill the existing gaps in EU databases on SH and DHW and to perform the analysis for estimating the European SH and DHW market. However, these hypotheses result in inaccuracies related to the correctness of the final data relatively to each MS.
- Correspondence of full-load hours, efficiency, and mean installed capacity were assumed in case of missing data for countries with geographical, socio-economic, and historical similarities. However, SH and DHW systems are not always conforming and there might be differences between regions. This might also be influenced by diversities in climatic conditions.
At this point, it has to be stressed that the amount of data subject to assumptions accounted for approximately 4% of those needed to generate the results of the present investigation.
3. Results
The present paper displays the main results aggregated at the whole EU28 level and not for each MS individually. The entire data set, with detailed data for each MS, including sources, is available as open data in the Hotmaps git repository under [33] under [34]. The results at EU28 scale, per each type of equipment, regarded all the main data categories used for the estimation of the final energy consumption, i.e., number of installed units, equivalent full-load hours, mean installed capacity, and energy efficiency coefficients. Finally, the distribution of energy consumption per equipment type at EU28 level was presented and discussed.
In the column charts of Figure 1, the error bars indicated standard deviations, and above positioned percentages the coefficient of variation (CV).
With regard to installed units, Figure 1 shows the amount of SH and DHW units per equipment type at EU28 level (in millions—Mil.). Non-condensing boilers had the greatest diffusion, with about 80 Mil. installed devices, followed by stoves (60 Mil.). Other technologies, in order of distribution magnitude are electric radiators (approximately 30 Mil. units), condensing boilers, and aerothermal HPs, with about 10 Mil. units, respectively. They are followed by geothermal HPs (2 Mil. units) and STS flat-plate collectors (about 1 Mil. units). STS-evacuated tube collectors, CHP-IC, STS-unglazed collectors, and DH were less diffused equipment, with 0.14, 0.05, 0.03, and 0.02 Mil. units, respectively.
Looking at the average CV percentages per equipment type related to SH and DHW at EU28 level (indicated on the top of the columns over the bars in Figure 1) we inferred that the data building these bars were highly unequally distributed. The overall CV percentage was 34%. The highest variation was the one of condensing boilers (~66%), followed by aerothermal HPs (~52%). The lowest variation was the one of stoves (~8%). Other equipment types were characterized by variations around 30%.
Figure 2 displays the annual distribution of equivalent full-load hours per equipment type. CHP-IC units had the highest mean value of full-load hours per year, nearly 1900 hours (h). Boilers (condensing and non) were second with over 1000 h. Equivalent full-load hours of electric radiators and DH amounted to 900 h each, closely followed by aerothermal HPs, with more than 700 h, and STS-flat-plate and STS-unglazed collectors with 400 h each. Geothermal HPs presented about 300 h, while stoves and STS-evacuated tube collectors were positioned last, with approximately 200 h each.
CV percentages included in Figure 2 indicated that the obtained data was rather dispersed. The mean value amounted to roughly 26%. The highest variation was given for STS-evacuated tube collectors (~53%), followed by the variation of STS-unglazed (~40%). The lowest variations related to condensing and non-condensing boilers (~6%). Other equipment types were characterized by variations between about 18% and 34%.
The mean installed capacity per equipment type in kW is presented in Figure 3. DH’s mean value exceeded Figure 3’s axis indication, reaching a nominal number of almost 75,000 kW. CHP-ICs were characterized by means of about 200 kW. Next were STS-unglazed collectors with over 140 kW, followed by other STS types (i.e., flat-plate and evacuated tube collectors) with approximately 40 kW. Boilers (condensing and non) had a mean installed capacity of about 20 kW. Geothermal HPs and electric radiators came next with approximately 10 kW each. Conclusively, aerothermal HPs and stoves were positioned last with around 5 kW each.
In the case of average installed capacity per SH and DHW equipment type (EU28), the mean CV percentage was quite high, with an average of 38%. The highest variation related to stoves and aerothermal HPs (around 70%) followed by electric radiations (~60%). Geothermal HPs and CHP-IC followed with variations of about 40%. The lowest variations related to condensing and non-condensing boilers (~3%). Other equipment types were characterized by variations around 30%.
Efficiency values at full-load (Figure 4) were evaluated by means of different indicators depending on the technology of the equipment type considered. Looking at technologies characterized by a thermal efficiency coefficient, we found that boilers and electric radiators had efficiency mean values near to 100%, with STS-unglazed collectors and non-condensing boilers being placed second and third with around 90% and 85%. Other STS systems, flat-plate and evacuated tube collectors, presented values around 60%; while, CHP-IC units and stoves of respectively 58% and 50%. For technologies characterized by a COP coefficient, geothermal HPs were significantly more efficient than aerothermal ones, the energy efficiency of the former amounting to 4.5 and of the latter to 3.5. Indicated values referred to nominal COPs and were not related to real operating conditions for building uses. To fully consider DH systems’ efficiency, we included in the mean losses those deriving from DH network heat losses. The heat losses mean value for EU28 was found to be 13.70% [70].
For SH and DHW equipment, energy efficiency coefficients at full-load (EU28) had CV mean percentages with values around 10%. The highest variation was found for stoves (~36%). The lowest one for electric radiators (~2%). Other equipment types were characterized by variations between 5% and 12%.
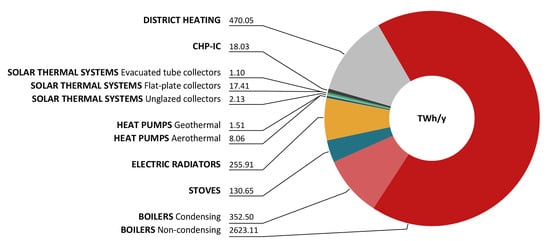
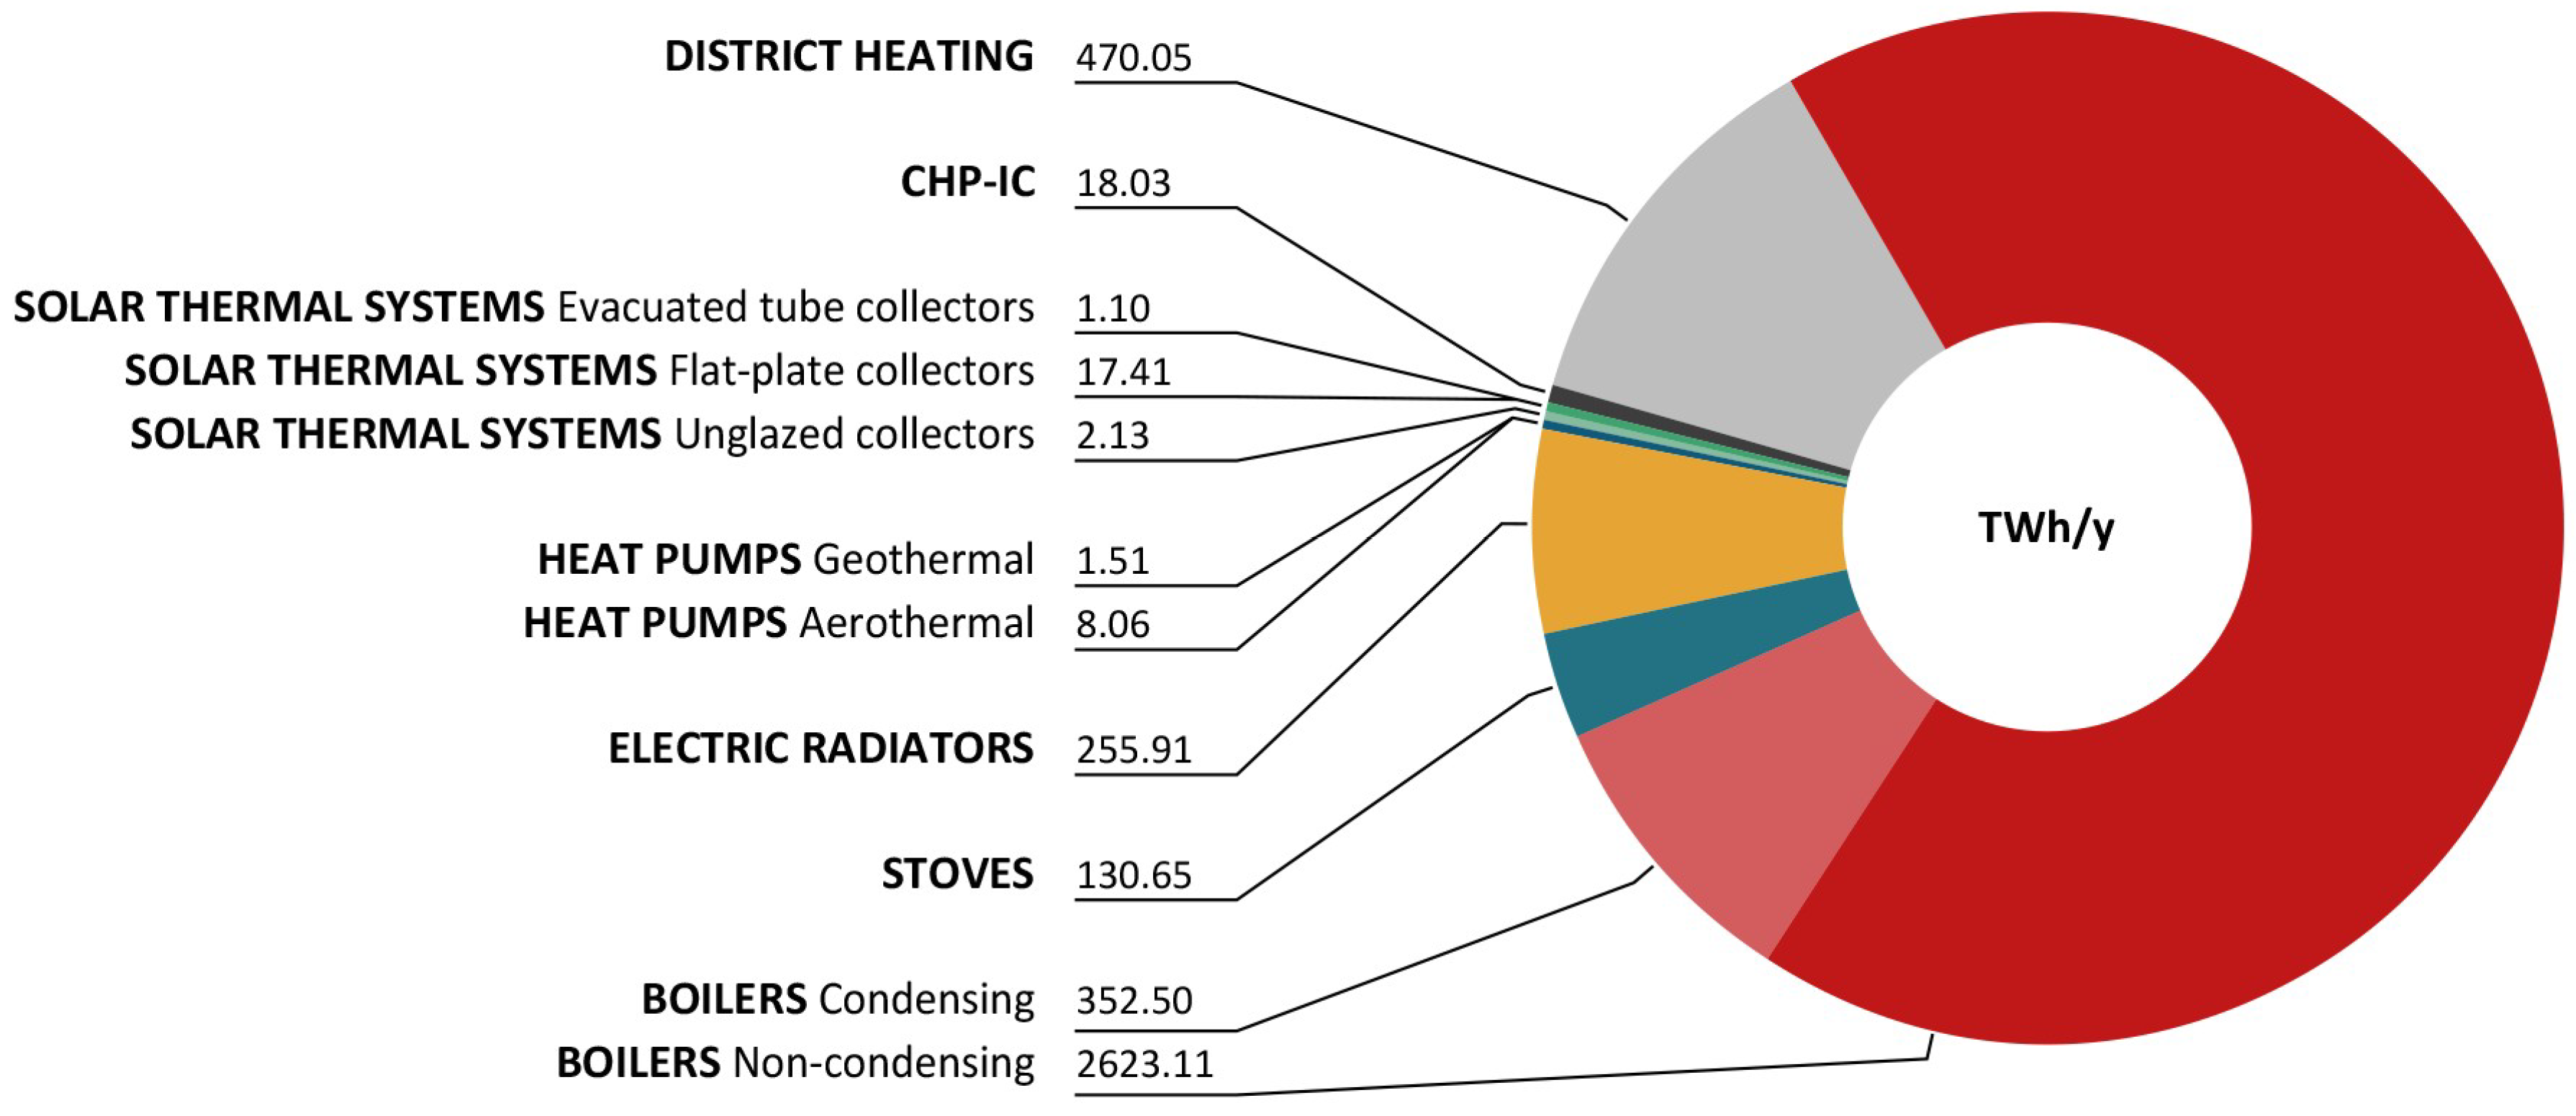
Finally, including the data presented in previous figures in Equation (1), the results in terms of energy consumption per equipment type (Figure 5) were obtained. The entire EU28 energy use for SH and DHW technologies amounted to approximately 3880 TWh/y, and its largest share went to non-condensing boilers (over 2600 TWh/y, equaling to 67% of total). DH technologies came second with an energy use of about 500 TWh/y (13% of total). Condensing boilers’ energy consumption corresponded to 350 TWh/y (i.e., 9% of total), while electric radiators consumed nearly 250 TWh/y (approximately 6% of total). These were followed by stoves, with about 130 TWh/y (approximately 3% of the above indicated 3880 TWh/y). CHP-IC, STS (flat-plate collectors), aerothermal HPs, STS (unglazed collectors), geothermal HPs, and STS (evacuated tube collectors) were last, accounting together for about 2% of total. A particularly striking feature was that the energy consumption deriving from DH systems exceeded the one of condensing boilers. The indicated difference was significant as the value for DH systems was approximately 25% higher.
Additionally, Table 2 displays the results in percentage with regard to various fuels utilization for SH and DHW equipment in the 28 EU MS.
As per Table 2, condensing boilers were mostly gas (natural gas) driven (~66%), followed by oil, with about 34%. The same ranking applies for non-condensing boilers. Gas (natural gas) was the first energy vector with nearly 54%. Oil was second (~38%), followed by RES and coal with about 5% and 2%, respectively.
Stoves were estimated to be for 100% RES (biomass) driven.
Regarding CHP-IC, gas (natural gas) again was the first (~43%). RES and coal followed with about 23% and 19%, respectively. In the last place we found “other fuels” and oil, with approximately 7% each.
DH systems were found to be mainly powered by gas (natural gas). Coal comes next, with about 29%. Close behind coal, what follows were renewables, with nearly 26%. Last positioned were oil and other fuels, with approximately 4% and 2%.
4. Discussion
SH and DHW equipment’s total energy consumption at EU28 level nearly reached 3900 TWh/y (approximately 3880 TWh/y) of which over 85% (about 3315 TWh/y) of this was provided by SH. Thus, only about 600 TWh/y (~580 TWh/y) accounted for DHW use. SH and DHW total consumption accounted for more than 20% of the EU’s entire energy consumption [5]. If SC consumption was included, the latter amounted to only about 3% of the total energy consumption [37].
While notable studies in the field report SH and DHW values very close to ours (the H2020 project HRE4 [22], a publication of Patronen et al. 2012 [25], as well as the IEE STRATEGO project [23]), other studies differ greatly reporting values both falling short and exceeding ours. The three studies reporting values very close to ours differ by 3% to 6%.
The numbers falling short are provided by Boermans et al. 2012 [26], a report of the Seventh Framework Programme (FP7) iNSPiRe project [24], and by Von Manteuffel et al. 2016 [27]. In this case, differences with respect to our work range from 12% to 47%.
The detected values exceeding ours are given by Sanner et al. 2011 [28], Scoccia et al. 2018 [29], and Balaras et al. 2007 [30]. The indications provided by these authors vary compared to our own by 13% to 35%. Table 3 summarizes and analyzes in greater detail similarities and differences to our outcome found in scientific literature:
We wish to emphasize that even though only ~11% of the input data for our investigation derived from the HRE4 project, our result showed only a minor deviation, 3%.
Furthermore, concerning the IEE STRATEGO project result, we must recall that the output would be even lower if taking into consideration the decrease of energy use for SH and DHW in EU buildings in the past decade.
To complete our study, we calculated energy consumption for DHW per MS, using population and household data—by means of energy per person [77], number of inhabitants [78], and dwellings [79]. The values, expressed in TWh/y, were found to be approximately 510 TWh/y and 540 TWh/y, respectively. Thus, the differences with respect to the results shown above were 12% and 7%, respectively. Please find respective data set under [80] (details on all sources used are available in the respective csv file [81]).
As already mentioned in the Section 3. Results, a particularly striking result is given by the fact that energy consumption provided by DH systems exceeded the one of condensing boilers by 25%. Furthermore, comparing non-condensing boilers with condensing ones, we found that the replacement of conventional boilers with better performing SH and DHW technologies seemed to progress very slowly. As a plausibility check, we should first consider the share of biomass boilers (~2%), oil boilers (~19%), and natural gas boilers (~28%) [23]. In fact, while Regulation EU 813/2013 does not impose the use of condensing boilers over biomass boilers, it only came into place at the end of 2015, with significant exemptions. As a further confirmation of our results, if we suppose that all gas and oil boilers installed in the period 2015–2016 are substituted by condensing boilers, these would reach a total number of around 10.7 Mil. (assuming non-condensing boilers installed prior to 2015 and assuming a lifetime of 15 years) [82]. This is very much in line with the data presented in Figure 1. However, in the event of an enforcement of the Eco-design Regulation EU 813/2013, the share of condensing boilers should grow significantly in the coming years. This evidence is further reinforced by the indication that the thermal efficiency of currently installed boilers in Europe is approximately 85% [66], while condensing boilers are characterized by declared efficiency levels of approximately 99% [37]. On the other hand, a number of scientific resources confirm the steady growth of DH applications within the EU28 [83,84,85].
Concerning the fuels utilization at EU28 level for SH and DHW equipment (Table 2), it has to be stressed that gas (natural gas) dominated the ranking, while renewables were lower positioned, besides in the case of stoves. However, it is worth nothing that the indicated renewables value for stoves had been estimated due to a lack of sources. RES were mostly found at lower level positions (once again this was not valid for stoves and CHP-IC). Especially with regard to DH, the utilization for RES was characterized by a high potential [86,87,88].
5. Conclusions
This work presented a collection, statistical elaboration, calculation, and comparison of data that offered insights on the SH and DHW market for the EU28. The main aspects were the following:
- A significant portion of the total EU energy consumption went to SH and DHW (more than 20%), reaching almost the value of 3900 TWh/y.
- The energy consumption of DH systems covered around 13% of the total, and exceeded that of condensing boilers. While DH system applications are growing throughout the EU, the replacement of older, conventional boilers progresses at a slower pace.
- The investigation also included information on the use of fuels for SH and DHW technologies at the EU28 level. Gas (i.e., natural gas) was the most diffused, while renewables were ranking lower. This was different for stoves and CHP-IC. Especially DH offered a high potential for the use of RES.
The collected data per MS and the entire EU are also available as an open source data set, which allows for freely access and to retrieve information on SH and DHW consumption.
The data collection at the basis of the investigation and its insights presented certain limitations, which resulted from the assumptions indicated in Section 2. Materials and Methods.
All types of collected data (amount of operative units, installed capacities, energy efficiency coefficients as well as equivalent full-load hours per SH and DHW equipment type and country) were subject to not negligible variations, which resulted in pertinent CV values. This was especially true for collected data concerning the number of operative units for condensing boilers and aerothermal HPs (CV = 66% and 52%, respectively), the amount of equivalent full-load hours of STS—evacuated tube collectors (CV = 53%), and mean installed capacities of electric radiators (CV = 60%). Consequently, the performed analysis represented an assessment, and respective outcomes are to be interpreted with care.
The data collection and results of this work can form the basis for the collection and analysis of further data regarding Europe’s building stock. Finally, our research indicates room for improvement in terms of data quality and completeness, as well as for extending the scope to areas such as industry and transportation.
Author Contributions
Conceptualization, S.P.; Data curation, S.C. and S.Z.; Supervision, L.K.; Validation, S.C., S.Z., L.K., A.N. and P.Z.
Funding
We are thankful to the Horizon 2020 Hotmaps project (Grant Agreement number 723677), for providing partial funding for the performance of the work.
Acknowledgments
We are thankful to Amy Segata (Eurac Research) for designing the figures of the study. In addition, our gratitude goes to Sonja Gantioler (Eurac Research) for the language editing of the text.
Conflicts of Interest
The authors declare no conflict of interest.
References
- EC. 2030 Climate & Energy Framework. 2019. Available online: http://ec.europa.eu/clima/policies/strategies/2030/index_en.htm (accessed on 15 February 2019).
- EC. 2050 Low-Carbon Economy. 2019. Available online: https://ec.europa.eu/clima/policies/strategies/2050_en (accessed on 15 February 2019).
- EC. Paris Agreement. 2019. Available online: https://ec.europa.eu/clima/policies/international/negotiations/paris_en (accessed on 15 February 2019).
- Benejam, G.M.; Mata, É.; Kalagasidis, A.S.; Johnsson, F. Bottom-up characterization of the Spanish building stock for energy assessment and model validation. In Proceedings of the Retrofit 2012 Conference, Manchester, UK, 24–26 January 2012. [Google Scholar]
- EC. Consumption of Energy. 2019. Available online: http://ec.europa.eu/eurostat/statistics-explained/index.php/Consumption_of_energy (accessed on 16 February 2019).
- Economidou, M. Energy performance requirements for buildings in Europe. REHVA J. 2012, 92, 16–21. [Google Scholar]
- Pezzutto, S.; De Felice, M.; Fazeli, R.; Kranzl, L.; Zambotti, S. Status Quo of the Air-Conditioning Market in Europe: Assessment of the Building Stock. Energies 2017, 10, 1253. [Google Scholar] [CrossRef]
- EC. Energy Efficiency Trends in Buildings in the EU. 2012. Available online: https://energiatalgud.ee/img_auth.php/6/68/Enerdata._Energy_Efficiency_Trends_in_Buildings_in_the_EU._2012.pdf (accessed on 17 February 2019).
- EC. Buildings. 2019. Available online: https://ec.europa.eu/energy/en/topics/energy-efficiency/buildings (accessed on 18 February 2019).
- Tronchin, L.; Manfren, M.; Nastasi, B. Energy efficiency, demand side management and energy storage technologies—A critical analysis of possible paths of integration in the built environment. Renew. Sustain. Energy Rev. 2018, 95, 341–353. [Google Scholar] [CrossRef]
- IEA. Energy Efficiency Requirements in Building Codes, Energy Efficiency Policies for New Buildings. 2008. Available online: https://www.iea.org/publications/freepublications/publication/Building_Codes.pdf (accessed on 17 February 2019).
- EEA. Final Energy Consumption by Sector and Fuel. 2019. Available online: https://www.eea.europa.eu/data-and-maps/indicators/final-energy-consumption-by-sector-9/assessment-4 (accessed on 18 February 2019).
- IEA. Data Service. 2019. Available online: http://wds.iea.org/WDS/Common/Login/login.aspx (accessed on 18 February 2019).
- Vinnova. H2020 Visualization. 2019. Available online: http://h2020viz.vinnova.se/#/ (accessed on 18 February 2019).
- EC. Research and Innovation. 2019. Available online: https://ec.europa.eu/research/energy/eu/index_en.cfm?pg=projects&fp7page=10b (accessed on 18 February 2019).
- Bointner, R.; Pezzutto, S.; Sparber, W. Scenarios of public energy research and development expenditures: Financing energy innovation in Europe. Wiley Interdisciplin. Rev. Energy Environ. 2016, 5, 470–488. [Google Scholar] [CrossRef]
- Bointner, R.; Pezzutto, S.; Grilli, G.; Sparber, W. Financing Innovations for the Renewable Energy Transition in Europe. Energies 2016, 9, 990. [Google Scholar] [CrossRef]
- Pezzutto, S.; Fazeli, R.; De Felice, M.; Sparber, W. Future development of the air-conditioning market in Europe: An outlook until 2020. Wiley Interdisciplin. Rev. Energy Environ. 2016, 5, 649–669. [Google Scholar] [CrossRef]
- EC. An EU Strategy on Heating and Cooling. 2016. Available online: https://ec.europa.eu/energy/sites/ener/files/documents/1_EN_ACT_part1_v14.pdf (accessed on 29 April 2019).
- Pardo, N.; Vatopoulos, K.; Krook-Riekkola, A.; Moya, J.A.; Perez, A. Heat and Cooling Demand and Market Perspective. 2012. Available online: http://publications.jrc.ec.europa.eu/repository/bitstream/111111111/26989/1/ldna25381enn.pdf (accessed on 29 April 2019).
- EC. Energy Roadmap 2050. 2011. Available online: http://ec.europa.eu/smart-regulation/impact/ia_carried_out/docs/ia_2011/sec_2011_1565_en.pdf (accessed on 29 April 2019).
- Fleiter, T.; Elsland, R.; Rehfeldt, M.; Steinbach, J.; Reiter, U.; Catenazzi, G.; Jakob, M.; Rutten, C.; Harmsen, R.; Dittmann, F.; et al. Profile of Heating and Cooling Demand in 2015. Heat Roadmap Europe, 2017. Available online: https://heatroadmap.eu/wp-content/uploads/2018/11/HRE4_D3.1.pdf (accessed on 24 February 2019).
- Persson, U.; Werner, S. Quantifying the Heating and Cooling Demand in Europe. STRATEGO, 2015. Available online: http://www.heatroadmap.eu/resources/STRATEGO%20WP2%20-%20Background%20Report%204%20-%20Heat%20%26%20Cold%20Demands.pdf (accessed on 24 February 2019).
- Birchall, S.; Wallis, I.; Churcher, D.; Pezzutto, S.; Fedrizzi, R.; Causse, E. D2.1a—Survey on the Energy Needs and Architectural Features of the EU Building Stock. iNSPiRe, 2014. Available online: http://inspirefp7.eu/wp-content/uploads/2016/08/WP2_D2.1a_20140523_P18_Survey-on-the-energy-needs-and-architectural-features.pdf (accessed on 25 February 2019).
- Patronen, J.; Kaura, E.; Torvestad, C. Nordic Heating and Cooling. 2017. Available online: http://www.diva-portal.org/smash/get/diva2:1098961/FULLTEXT01.pdf (accessed on 24 February 2019).
- Boermans, T. Building Renovation in Europe—What are the Choices? 2012. Available online: https://www.eurima.org/uploads/ModuleXtender/Publications/90/Renovation_tracks_for_Europe_08_06_2012_FINAL.pdf (accessed on 24 February 2019).
- Von Manteuffel, B.; Petersdorff, C.; Bettgenhäuser, K.; Boermans, T. EU Pathways to a Decarbonised Building Sector. 2016. Available online: https://www.ecofys.com/files/files/ecofys-2016-eu-pathways-towards-a-decarbonised-building-sector.pdf (accessed on 25 February 2019).
- Sanner, B. 2020–2030–2050 Common Vision for the Renewable Heating & Cooling Sector in Europe. 2011. Available online: http://www.rhc-platform.org/fileadmin/Publications/RHC_BROCHURE_140311_web.pdf (accessed on 25 February 2019).
- Scoccia, R.; Toppi, T.; Aprile, M.; Motta, M. Absorption and compression heat pump systems for space heating and DHW in European buildings: Energy, environmental and economic analysis. J. Build. Eng. 2018, 16, 94–105. [Google Scholar] [CrossRef]
- Balaras, C.A.; Gaglia, A.G.; Georgopoulou, E.; Sevastianos, M.; Sarafidis, Y.; Lalas, D.P. European residential buildings and empirical assessment of the Hellenic building stock, energy consumption, emissions and potential energy savings. Build. Environ. 2007, 42, 1298–1314. [Google Scholar] [CrossRef]
- Leurent, M.; Da Costa, P.; Rämä, M.; Persson, U.; Jasserand, F. Cost-benefit analysis of district heating systems using heat from nuclear plants in seven European countries. Energy 2018, 149, 454–472. [Google Scholar] [CrossRef]
- EU. Hotmaps. 2019. Available online: https://www.hotmaps-project.eu/ (accessed on 18 February 2019).
- Pezzutto, S.; Zambelli, P. space_heating_cooling_dhw_bottom-up_SH+DHW.xlsx. 2019. Available online: https://gitlab.com/hotmaps/space_heating_cooling_dhw_demand/blob/master/data/space_heating_cooling_dhw_bottom-up_SH+DHW.xlsx (accessed on 18 February 2019).
- Pezzutto, S.; Zambelli, P. space_heating_cooling_dhw_bottom-up_SH+DHW.csv. 2019. Available online: https://gitlab.com/hotmaps/space_heating_cooling_dhw_demand/blob/master/data/space_heating_cooling_dhw_bottom-up_SH+DHW.csv (accessed on 18 February 2019).
- Creative commons. Attribution 4.0 International (CC BY 4.0). 2019. Available online: https://creativecommons.org/licenses/by/4.0/ (accessed on 18 February 2019).
- The Apache Software Foundation. Apache License. 2019. Available online: https://apache.org/licenses/LICENSE-2.0 https://apache.org/licenses/LICENSE-2.0 (accessed on 18 February 2019).
- Pezzutto, S.; Zambotti, S.; Croce, S.; Zambelli, P.; Garegnani, G.; Scaramuzzino, C.; Pascuas, R.P.; Zubaryeva, A.; Haas, F.; Exner, D.; et al. D2.3 WP2 Report—Open Data Set for the EU28. Hotmaps, 2018. Available online: https://www.hotmaps-project.eu/wp-content/uploads/2018/03/D2.3-Hotmaps_for-upload_revised-final_.pdf (accessed on 18 February 2019).
- Noussan, M.; Nastasi, B. Data Analysis of Heating Systems for Buildings—A Tool for Energy Planning, Policies and Systems Simulation. Energies 2018, 11, 233. [Google Scholar] [CrossRef]
- Noussan, M.; Roberto, R.; Nastasi, B. Performance Indicators of Electricity Generation at Country Level—The Case of Italy. Energies 2018, 11, 650. [Google Scholar] [CrossRef]
- EurObserv’ER. All Heat Pumps Barometers. 2018. Available online: https://www.eurobserv-er.org/category/all-heat-pumps-barometers/ (accessed on 18 February 2019).
- EUROHEAT&POWER. District Heating and Cooling—Country by Country—2015 Survey. 2015. Available online: http://www.euroheat.org/wp-content/uploads/2016/03/2015-Country-by-country-Statistics-Overview.pdf (accessed on 18 February 2019).
- Nowak, T.; Westring, P. European Heat Pump Market and Statistics Report. 2018. Available online: https://www.ehpa.org/market-data/market-report/ (accessed on 18 February 2019).
- EC. EU Buildings Database. Available online: https://ec.europa.eu/energy/en/eu-buildings-database (accessed on 18 February 2019).
- EHPA. The Online Stats Tool. 2019. Available online: http://www.stats.ehpa.org/hp_sales/country_cards/ (accessed on 18 February 2019).
- IGA. OUR DATABASES. 2019. Available online: https://www.geothermal-energy.org/explore/our-databases/ (accessed on 18 February 2019).
- Bertoldi, P.; Rezessy, S.; Lees, E.; Baudry, P.; Jeandel, A.; Labanca, N. Energy supplier obligations and white certificate schemes: Comparative analysis of experiences in the European Union. Energy Pol. 2010, 8, 1455–1469. [Google Scholar] [CrossRef]
- Martinopoulos, G.; Papakostas, K.T.; Papadopoulos, A.M. A comparative review of heating systems in EU countries, based on efficiency and fuel cost. Renew. Sustain. Energy Rev. 2018, 90, 687–699. [Google Scholar] [CrossRef]
- Clay, K. Power to the People: Energy in Europe over the Last Five Centuries. J. Econ. Hist. 2015, 75, 936–937. [Google Scholar] [CrossRef]
- Pezzutto, S.; Zambelli, P. space_heating_cooling_dhw_demand. 2019. Available online: https://gitlab.com/hotmaps/space_heating_cooling_dhw_demand (accessed on 18 February 2019).
- Open Knowledge International. Frictionless Data. Specifications and Software. 2019. Available online: https://frictionlessdata.io/ (accessed on 18 February 2019).
- Pezzutto, S.; Zambelli, P. Space Heating, Cooling and DHW Demand—EU28. 2019. Available online: https://gitlab.com/hotmaps/space_heating_cooling_dhw_demand/blob/master/README.md (accessed on 18 February 2019).
- SPDX Workgroup. Software Package Data Exchange® (SPDX®). 2019. Available online: https://spdx.org/ (accessed on 18 February 2019).
- Zambelli, P.; Pezzutto, S.; Garegnani, G.; Pignatelli, A.; Lehtsalu, L.; Kranzl, L.; Fritz, S. Data Management Plan. Hotmaps, 2018. Available online: https://www.hotmaps-project.eu/wp-content/uploads/2019/03/Hotmaps_D2.1_Data-Management-Plan_2018-09-28_final.pdf (accessed on 18 February 2019).
- Nouvel, R.; Zirak, M.; Coors, V.; Eicker, U. The influence of data quality on urban heating demand modeling using 3D city models. Comput. Environ. Urban Syst. 2017, 64, 68–80. [Google Scholar] [CrossRef]
- EU. Heat Roadmap Europe. 2019. Available online: http://www.heatroadmap.eu/ (accessed on 18 February 2019).
- EU. Stratego. 2014. Available online: http://stratego-project.eu (accessed on 19 February 2019).
- EC. Mapping and Analyses of the Current and Future (2020–2030) Heating/Cooling Fuel Deployment (Fossil/Renewables). 2019. Available online: https://ec.europa.eu/energy/en/studies/mapping-and-analyses-current-and-future-2020-2030-heatingcooling-fuel-deployment (accessed on 19 February 2019).
- Dengler, J.; Köhler, B.; Dinkel, A.; Bonato, P.; Azam, N.; Kalz, D. Work Package 2: Assessment of the Technologies for the Year 2012. Mapping and Analyses of the Current and Future (2020–2030) Heating/Cooling Fuel Deployment (Fossil/Renewables). 2016. Available online: https://ec.europa.eu/energy/sites/ener/files/documents/mapping-hc-final_report-wp2.pdf (accessed on 20 February 2019).
- Persson, U.; Möller, B.; Wiechers, E. Deliverable 2.3: A Final Report Outlining the Methodology and Assumptions used in the Mapping. Heat Roadmap Europe, 2017. Available online: http://www.heatroadmap.eu/resources/HRE4_D2.3.pdf (accessed on 20 February 2019).
- Connolly, D.; Hansen, K.; Drysdale, D.; Lund, H.; Vad Mathiesen, B.; Werner, S.; Persson, U.; Möller, B.; Wilke, O.C.; Bettgenhäuser, K.; et al. Enhanced Heating and Cooling Plans to Quantify the Impact of Increased Energy Efficiency in EU Member States. Stratego, 2016. Available online: http://stratego-project.eu/wp-content/uploads/2014/09/STRATEGO-WP2-Executive-Summary-Main-Report.pdf (accessed on 20 February 2019).
- Fedrizzi, R.; Marchetti, R. iNSPiRe, Bolzano, Italy. Deliverable 2.1 Intermediate analysis of the heating and cooling industry. Support to key activities of the European technology platform on renewable heating and cooling. Unpublished work. 2016. [Google Scholar]
- Mauthner, F.; Weiss, W.; Spörk-Dür, M. Solar Heat Worldwide. 2017. Available online: http://www.iea-shc.org/Data/Sites/1/publications/Solar-Heat-Worldwide-2017.pdf (accessed on 20 February 2019).
- Mauthner, F.; Weiss, W.; Spörk-Dür, M. Solar Heat Worldwide. 2016. Available online: http://www.iea-shc.org/Data/Sites/1/publications/Solar-Heat-Worldwide-2016.pdf (accessed on 20 February 2019).
- EC. ENERGY DATA. 2019. Available online: http://ec.europa.eu/eurostat/web/energy/data (accessed on 20 February 2019).
- EU. TABULA WebTool. 2019. Available online: http://webtool.building-typology.eu/#bm (accessed on 21 February 2019).
- Pezzutto, S.; Toleikyte, A.; De Felice, M. Assessment of the Space Heating and Cooling Market in the EU28: A Comparison between EU15 and EU13 Member States. Int. J. Contemp. Energy 2015, 1, 35–48. [Google Scholar]
- Welch, T. Heat Pump Technology. 2009. Available online: https://www.cibsejournal.com/cpd/modules/2009-05/ (accessed on 21 February 2019).
- Nouvel, R.; Cotrado, M.; Pietruschka, D. European Mapping of Seasonal Performances of Air-Source and Geothermal Heat Pumps for Residential Applications. In Proceedings of the CISBAT 2015, Lausanne, Switzerland, 9–11 September 2015. [Google Scholar]
- Pezzutto, S. Analysis of the space heating and cooling market in Europe. Ph.D. Thesis, University of Natural Resources and Life Sciences, Vienna, Austria, 22 May 2014. [Google Scholar]
- Werner, S. Possibilities with more District Heating in Europe. Ecoheatcool, 2006. Available online: https://www.euroheat.org/wp-content/uploads/2016/02/Ecoheatcool_WP4_Web.pdf (accessed on 21 February 2019).
- Insee. Coefficient of Variation/CV. 2019. Available online: https://www.insee.fr/en/metadonnees/definition/c1366 (accessed on 23 February 2019).
- Lee, C.F.; Lee, J.C.; Lee, A.C. Statistics for Business and Financial Economics, 2nd ed.; World Scientific Publishing: Singapore, 2000; pp. 103–104. [Google Scholar]
- Malta’s Office of The Prime Minister (Energy and Projects). Malta’s National Energy Efficiency Action Plan. 2017. Available online: https://ec.europa.eu/energy/sites/ener/files/documents/mt_neeap_2017.pdf (accessed on 22 February 2019).
- Andrews, D.; Riekkola, A.K.; Tzimas, E.; Serpa, J.; Carlsson, J.; Pardo-Garcia, N.; Papaioannou, I. Background Report on EU-27 District Heating and Cooling Potentials, Barriers, Best Practice and Measures of Promotion. 2012. Available online: https://setis.ec.europa.eu/system/files/1.DHCpotentials.pdf (accessed on 25 February 2019).
- Werner, S. International review of district heating and cooling. Energy 2017, 137, 617–631. [Google Scholar] [CrossRef] [Green Version]
- Gupta, A.; Bai, A.S. Europe Boiler Market Growth 2017–2024—Industry Size, Share Report. 2018. Available online: https://www.gminsights.com/industry-analysis/europe-boiler-market (accessed on 25 February 2019).
- UNEP. Domestic Hot Water for Single Family Houses. 2015. Available online: http://www.estif.org/fileadmin/estif/content/publications/downloads/UNEP_2015/factsheet_single_family_houses_v05.pdf (accessed on 25 February 2019).
- Index mundi. Demographics: Population. 2017. Available online: https://www.indexmundi.com/map/ (accessed on 25 February 2019).
- Fuentes, E.; Arce, L.; Salom, J. A review of domestic hot water consumption profiles for application in systems and buildings energy performance analysis. Renew. Sustain. Energy Rev. 2018, 81, 1530–1547. [Google Scholar] [CrossRef]
- Pezzutto, S.; Zambelli, P. space_heating_cooling_dhw_population_households.xlsx. 2019. Available online: https://gitlab.com/hotmaps/space_heating_cooling_dhw_demand/blob/master/data/space_heating_cooling_dhw_population_households.xlsx (accessed on 25 February 2019).
- Pezzutto, S.; Zambelli, P. space_heating_cooling_dhw_population_households.csv. 2019. Available online: https://gitlab.com/hotmaps/space_heating_cooling_dhw_demand/blob/master/data/space_heating_cooling_dhw_population_households.csv (accessed on 25 February 2019).
- EU. Commission Regulation (EU) No 813/2013 of 2 August 2013 Implementing Directive 2009/125 /EC of the European Parliament and of the Council with Regard to Ecodesign Requirements for Space Heaters and Combination Heaters. 2013. Available online: https://eur-lex.europa.eu/legal-content/EN/TXT/PDF/?uri=CELEX:32013R0813&from=EN (accessed on 25 February 2019).
- Epp, B. Top District Heating Countries—EUROHEAT&POWER 2015 Survey Analysis. 2015. Available online: https://www.euroheat.org/news/district-energy-in-the-news/top-district-heating-countries-euroheat-power-2015-survey-analysis/ (accessed on 25 February 2019).
- EUROHEAT&POWER. European Heating Sector Well Positioned for Renewables Integration. 2017. Available online: https://www.euroheat.org/news/european-heating-sector-well-positioned-renewables-integration/ (accessed on 25 February 2019).
- Gustavsson, L. District heating systems and energy conservation—Part II. Energy 1994, 19, 93–102. [Google Scholar] [CrossRef]
- IRENA. Renewable Energy Indistrict Heating and Cooling. A Sector Roadmap for Remap. 2017. Available online: https://www.irena.org/-/media/Files/IRENA/Agency/Publication/2017/Mar/IRENA_REmap_DHC_Report_2017.pdf (accessed on 28 February 2019).
- Wangab, D.; Orehounigab, K.; Carmelieta, J. Investigating the potential for district heating networks with locally integrated solar thermal energy supply. Energy Proc. 2017, 122, 1057–1062. [Google Scholar] [CrossRef]
- Olsthoorna, D.; Haghighata, F.; Mirzaeib, P.A. Integration of storage and renewable energy into district heating systems: A review of modelling and optimization. Sol. Energy 2016, 136, 49–64. [Google Scholar] [CrossRef]
Figure 1.
Number of operative units for SH and DHW per equipment type, EU28 [40,41,55,56,57,58,62,63,65] (As not visible in Figure 1: HP geothermal = 1.93, STS unglazed, flat-plate, and evacuated tube collectors = 0.03, 0.97, and 0.14, CHP-IC = 0.05, DH = 0.02 Mil. units.).

Figure 2.
Distribution of mean SH and DHW units’ equivalent full-load hours per equipment typology, EU28 [57,59,60,61,62,63,69].
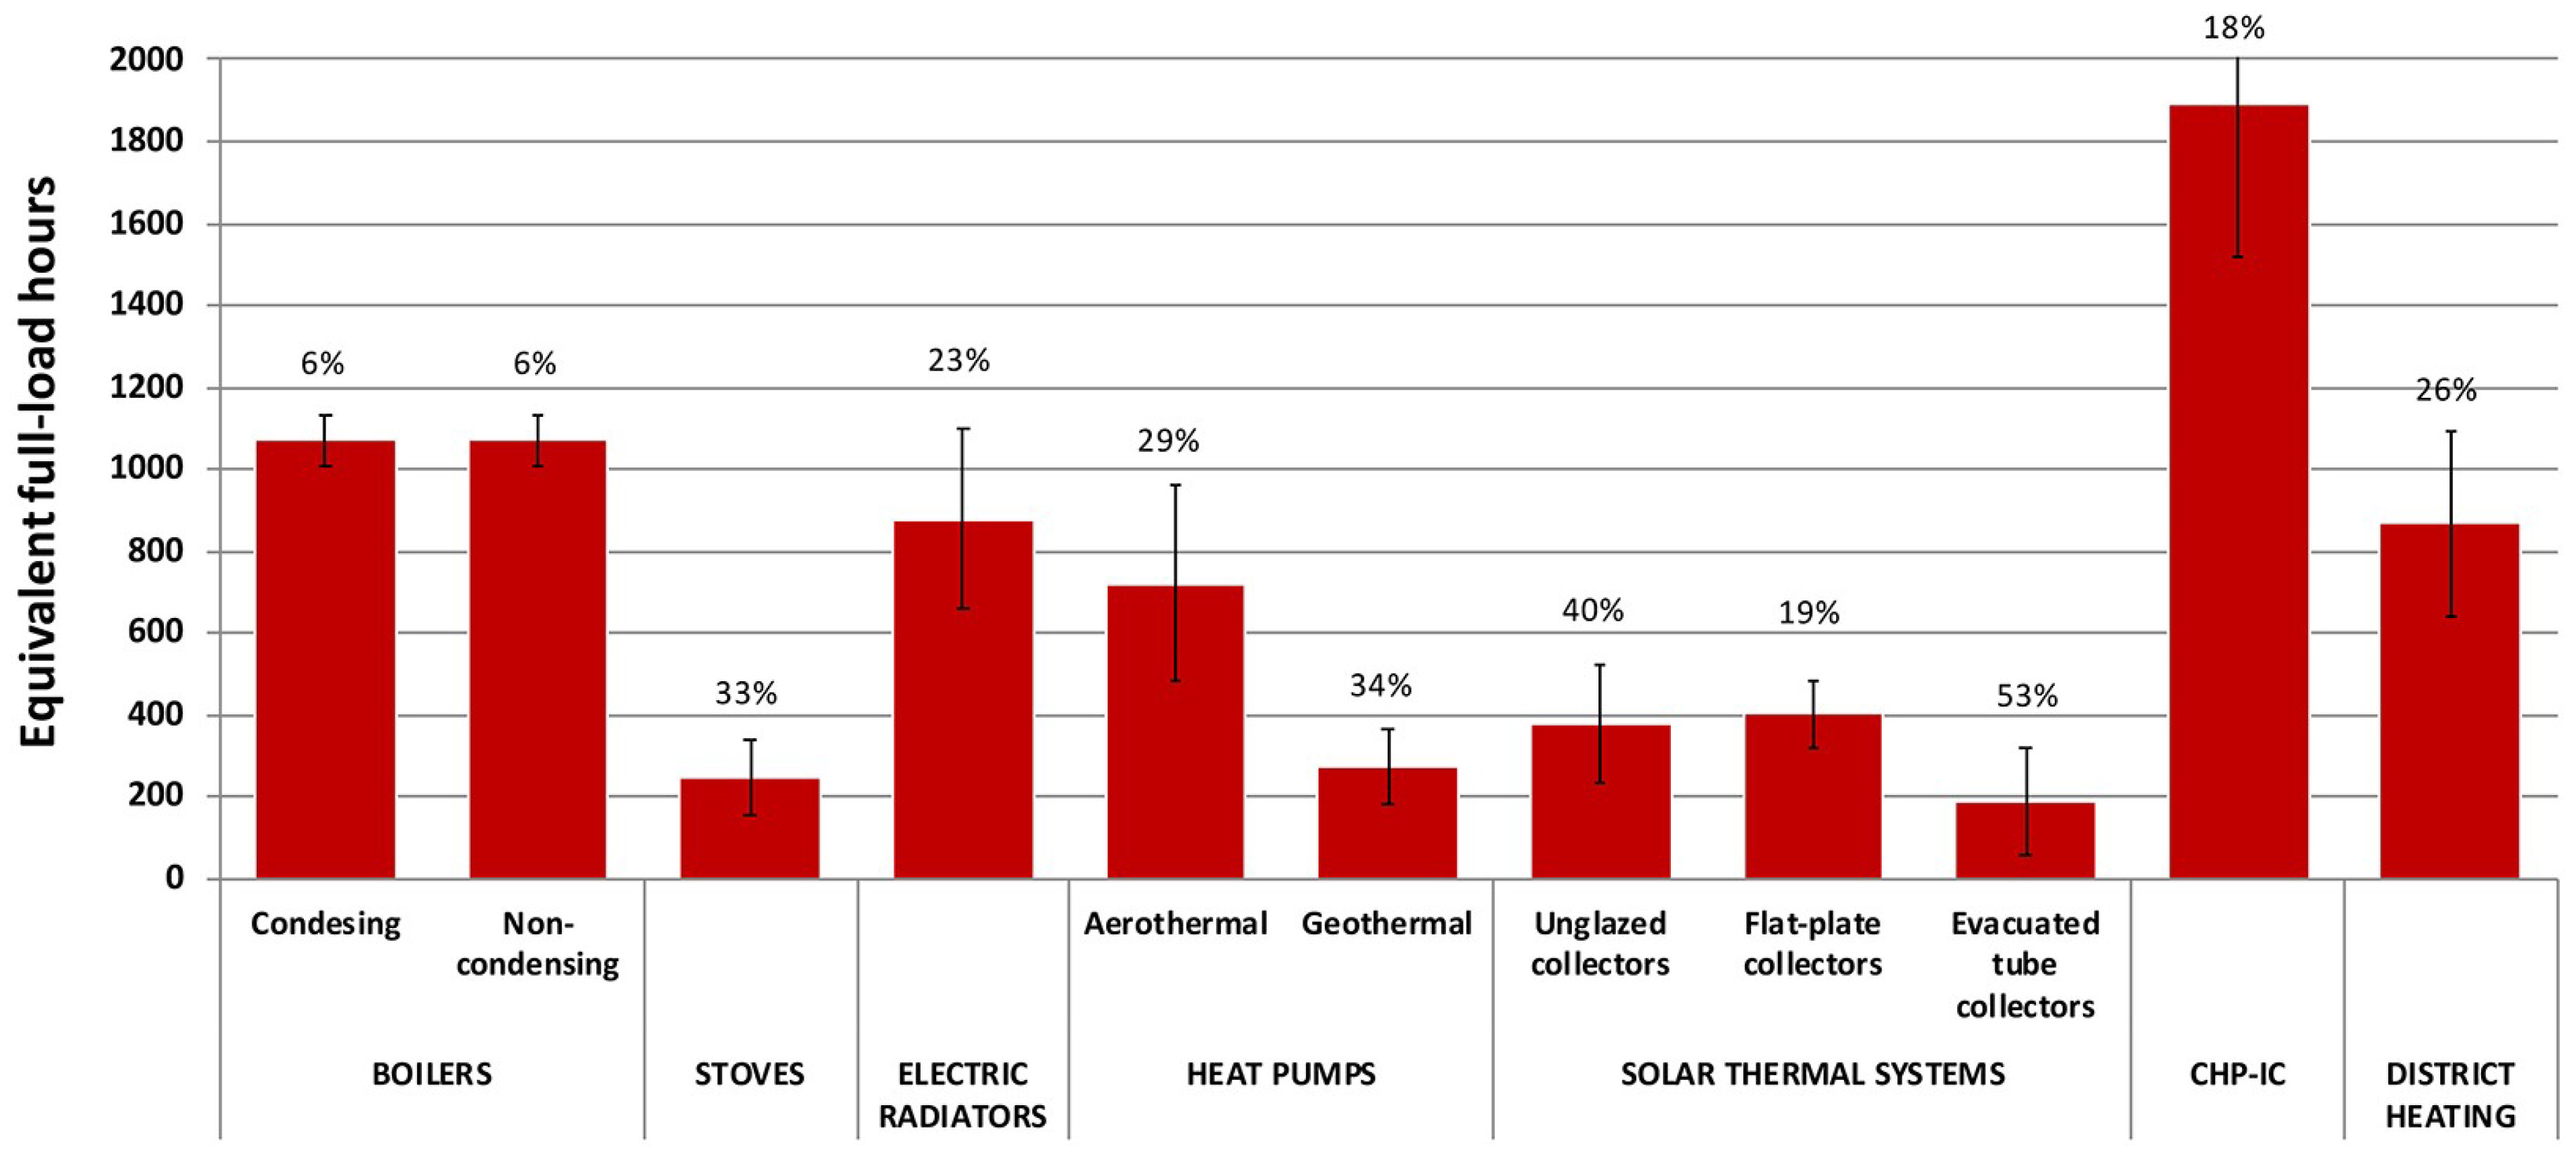

Figure 4.
Energy efficiency coefficients at full-load per equipment type, EU28 [55,56,57,58,59,60,65,68,69,70].
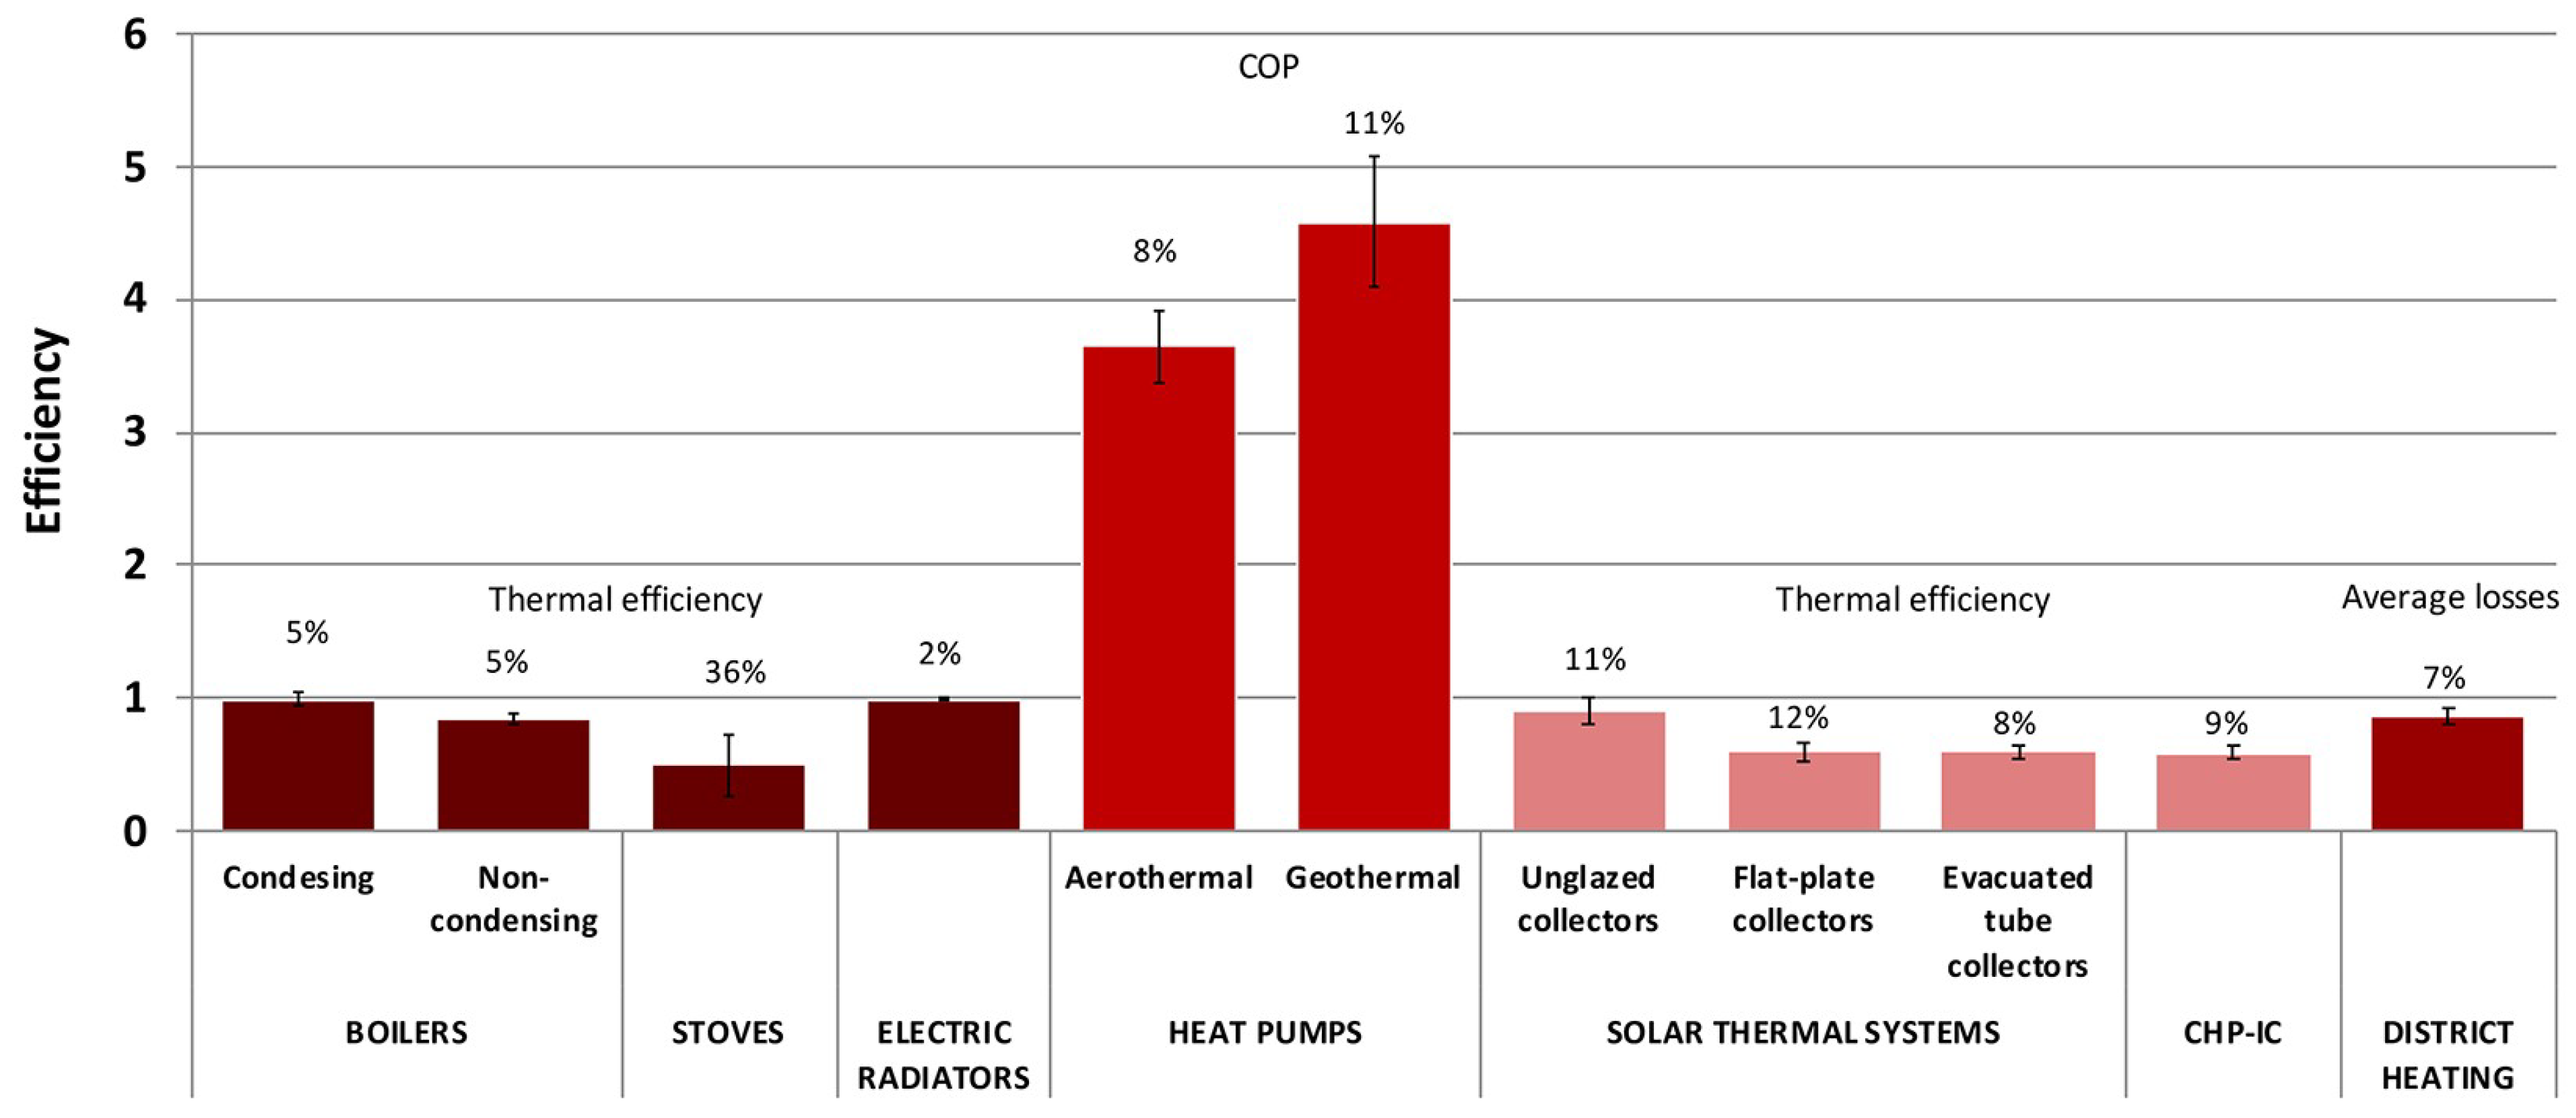
Figure 5.
Energy consumption per type in TWh/y, EU28 [40,41,55,56,57,58,59,60,61,62,63,65,68,69,70].


Table 1.
Key data sources for amount of operative units, installed capacities, energy efficiency coefficients, and equivalent full-load hours per space heating (SH) and domestic hot water (DHW) equipment type and country (EU28), and information on public availability of data.
Table 1.
Key data sources for amount of operative units, installed capacities, energy efficiency coefficients, and equivalent full-load hours per space heating (SH) and domestic hot water (DHW) equipment type and country (EU28), and information on public availability of data.
| Source | Amount of Operative Units | Installed Capacities | Equivalent Full-Load Hours | Energy Efficiency Coefficients | Public Available |
|---|---|---|---|---|---|
| EurObserv’ER [40] | × | Yes | |||
| EUROHEAT&POWER [41] | × | Yes | |||
| HRE4 project [55] | × | × | × | No | |
| STRATEGO project [56] | × | × | × | No | |
| Tender ENER/C2/2014-641 [57] | × | × | × | Yes | |
| Dengler et al. 2012 [58] | × | × | × | Yes | |
| Persson et al. 2017 [59] | × | × | × | Yes | |
| Connolly et al. 2016 [60] | × | × | × | Yes | |
| Fedrizzi et al. 2016 [61] | × | × | No | ||
| Mauthner et al. 2017 [62] | × | × | × | Yes | |
| Mauthner et al. 2016 [63] | × | × | × | Yes | |
| TABULA project [65] | × | × | Yes | ||
| Nouvel et al. 2015 [68] | × | No | |||
| Pezzutto 2014 [69] | × | × | × | No |
Table 2.
Fuels utilization at EU28 level for various SH and DHW equipment in percentage (NA—not available) [57,64,69,74,75] 1.
| Oil | Gas (Natural Gas) | Coal | Renewables | Other Fuels | |
|---|---|---|---|---|---|
| Boilers-Condensing | 33.77% | 66.23% | NA | NA | NA |
| Boilers-Non-condensing | 38.30% | 54.30% | 2.28% | 5.12% | NA |
| Stoves | NA | NA | NA | 100.00% | NA |
| CHP-IC | 7.39% | 43.73% | 18.62% | 22.84% | 7.42% |
| DH | 4.45% | 38.35% | 28.76% | 26.02% | 2.42% |
1 Electric radiators, aerothermal, and geothermal HPs, as well as STS—unglazed, flat-plate, and evacuated tube collectors were not considered in Table 2 due to not being fuel powered. A minor amount of coal and renewables driven condensing boilers, as well as not solely renewables (biomass) powered stoves are operative in Europe too [58,69,76].
Table 3.
Comparison of SH and DHW market quantifications at the EU level found in scientific literature and the present investigation’s result.
Table 3.
Comparison of SH and DHW market quantifications at the EU level found in scientific literature and the present investigation’s result.
| Comparison to the Present Study’s Result | Energy Consumption (TWh/y) | Deviation | Reference Year | Source |
|---|---|---|---|---|
| Close | ~4025 | 3% | 2015 | [22] |
| Close | ~3980 | 3% | 2012 | [25] |
| Close | ~4150 | 6% | 2010 | [23] |
| Lower | ~3400 | 12% | 2012 | [26] |
| Lower | ~2760 | 29% | 2014 | [24] |
| Lower | ~2070 | 47% | 2015 | [27] |
| Higher | ~4450 | 13% | 2006 | [28] |
| Higher | ~4715 | 18% | 2006/2007 | [29] |
| Higher | ~5990 | 35% | 2013 | [30] |
© 2019 by the authors. Licensee MDPI, Basel, Switzerland. This article is an open access article distributed under the terms and conditions of the Creative Commons Attribution (CC BY) license (http://creativecommons.org/licenses/by/4.0/).
Share and Cite
MDPI and ACS Style
Pezzutto, S.; Croce, S.; Zambotti, S.; Kranzl, L.; Novelli, A.; Zambelli, P. Assessment of the Space Heating and Domestic Hot Water Market in Europe—Open Data and Results. Energies 2019, 12, 1760. https://doi.org/10.3390/en12091760
AMA Style
Pezzutto S, Croce S, Zambotti S, Kranzl L, Novelli A, Zambelli P. Assessment of the Space Heating and Domestic Hot Water Market in Europe—Open Data and Results. Energies. 2019; 12(9):1760. https://doi.org/10.3390/en12091760
Chicago/Turabian StylePezzutto, Simon, Silvia Croce, Stefano Zambotti, Lukas Kranzl, Antonio Novelli, and Pietro Zambelli. 2019. "Assessment of the Space Heating and Domestic Hot Water Market in Europe—Open Data and Results" Energies 12, no. 9: 1760. https://doi.org/10.3390/en12091760
Note that from the first issue of 2016, this journal uses article numbers instead of page numbers. See further details here.