Finite Element Simulation of Multi-Scale Bedding Fractures in Tight Sandstone Oil Reservoir
by
 , ,
, ,
Qianyou Wang
1,2,3 ,
,
Yaohua Li
4,
Wei Yang
1,2,3,*,
Zhenxue Jiang
1,2,3,*,
Yan Song
1,2,3,*,
Shu Jiang
5,6,
Qun Luo
1,2,3 and
Dan Liu
7 1
State Key Laboratory of Petroleum Resources and Prospecting, China University of Petroleum, Beijing 102249, China
2
Unconventional Natural Gas Institute, China University of Petroleum, Beijing 102249, China
3
Unconventional Gas Collaborative Innovation Center, China University of Petroleum, Beijing 102249, China
4
Oil and Gas Survey, China Geological Survey, Beijing 100083, China
5
Key Laboratory of Tectonics and Petroleum Resources of Ministry of Education, Faculty of Earth Resources, China University of Geosciences, Wuhan 430074, China
6
Energy & Geoscience Institute, University of Utah, Salt Lake City, UT 84108, USA
7
The Institute of Exploration Techniques, Chinese Academy of Geological Sciences, Langfang 065000, China
*
Authors to whom correspondence should be addressed.
Energies 2020, 13(1), 131; https://doi.org/10.3390/en13010131
Submission received: 28 November 2019
/
Revised: 21 December 2019
/
Accepted: 23 December 2019
/
Published: 26 December 2019
(This article belongs to the Special Issue Development of Unconventional Reservoirs 2020)
Abstract
:Multi-scale bedding fractures, i.e., km-scale regional bedding fractures and cm-scale lamina-induced fractures, have been the focus of unconventional oil and gas exploration and play an important role in resource exploration and drilling practice for tight oil and gas. It is challenging to conduct numerical simulations of bedding fractures due to the strong heterogeneity without a proper mechanical criterion to predict failure behaviors. This research modified the Tien–Kuo (T–K) criterion by using four critical parameters (i.e., the maximum principal stress (σ1), minimum principal stress (σ3), lamina angle (θ), and lamina friction coefficient (μlamina)). The modified criterion was compared to other bedding failure criteria to make a rational finite element simulation constrained by the four variables. This work conducted triaxial compression tests of 18 column samples with different lamina angles to verify the modified rock failure criterion, which contributes to the simulation work on the multi-scale bedding fractures in the statics module of the ANSYS workbench. The cm-scale laminated rock samples and the km-scale Yanchang Formation in the Ordos Basin were included in the multi-scale geo-models. The simulated results indicate that stress is prone to concentrate on lamina when the lamina angle is in an effective range. The low-angle lamina always induces fractures in an open state with bigger failure apertures, while the medium-angle lamina tends to induce fractures in a shear sliding trend. In addition, the regional bedding fractures of the Yanchang Formation in the Himalayan tectonic period tend to propagate under the conditions of lower maximum principal stress, higher minimum principal stress, and larger stratigraphic dip.
1. Introduction
Multi-scale bedding fractures, including km-scale regional bedding fractures and cm-scale lamina-induced fractures, are caused by lamina dissolution or induced by regional tectonic stress [1,2,3,4,5,6,7,8,9,10]. The formation of sedimentary lamina and bedding underground exerts a strong control on the following fracture propagation [11,12,13], so the term lamina-induced fractures is used to indicate the cm-scale fractures forming along the core lamina under the influence of external forces and internal rock mechanical properties [14]. Moreover, the lamina-induced fractures also correspond to the km-scale regional bedding fractures, which are induced by the formation beddings. These fractures have been the focus of conventional and unconventional oil and gas reservoir characterization including shale, tight oil [14,15,16,17,18,19,20,21,22,23], and Carboniferous rocks [24]. The fractures have also played an important role in methane gas emissions from coal seams [25,26,27]. It has been found that the open state of bedding fractures in complicated tectonic zones could play an essential role in oil and gas diffusion, emission, migration, and accumulation [14,17,28,29,30,31,32,33]. In addition, the lamina or bedding in the tight reservoirs coupled with the hydraulic fractures could induce a more complicated in-situ fracture network [34]. However, the quantitative simulation work of bedding fractures, despite the qualitative description, as mentioned above, is still lacking due to the complicated stress distribution caused by the lamina heterogeneity. It is challenging to distinguish the lamina or bedding from surrounding rocks and predict the failure behaviors under the effects of heterogeneity.
Multiple methods and softwares have been used to conduct numerical simulations and make predictions on the energy resources, e.g., artificial neural networks, ant tracking algorithms, petrophysical logging, and microseisms [35,36,37,38]. The ant tracking algorithm can be applied to detect small faults, but it is difficult to extract detailed formation of the fractures due to the extremely low resolution and low coherence of data [39]. Even though the microseism is often used for artificial fracture detection and modeling in the hydraulic fracturing process of the horizontal wells, its roles are confined to the oil-gas exploration and development period [40]. In addition, the accuracy of logging interpretation strongly depends on the data amount, and the resolution of seismic data is too low to conduct a precise fracture simulation. Therefore, it is necessary to find out an efficient method to make an accurate prediction for the multi-scale fractures without the need for a great amount of data.
In this study, a finite element simulation of bedding fractures was conducted based on the dynamic propagation condition for the tectonic bedding fractures. The finite element simulation is widely used to predict the present geological stress and fracture index, because it can provide a platform for researchers to focus on the geological or mechanical model, with the adjustability of the rock failure criterion and boundary stress conditions [41,42,43]. In addition, this study focused on the modified failure criterion of tectonic bedding fractures in the dynamic simulation environment.
The most challenging work for bedding fracture simulation is to build rational failure criteria in the finite element simulation environment considering four factors, i.e., maximum stress, minimum stress, lamina angle (or the km-scale regional stratigraphic dip), and differences between the lamina and surrounding rock in different lamina lithofacies. Although some failure criteria have been proposed for the bedding fractures based on the mechanical tests of laminated rock, as shown in Table 1 [6,44,45,46,47], a coefficient should be additionally proposed to indicate the different lamina lithofacies and the difference between the lamina and the surrounding rock in the laminated cores or the rock formations with bedding fractures.
In summary, the innovations of the multi-scale fracture (km-scale regional bedding fractures and cm-scale lamina-induced fractures in cores) simulations conducted in this work are reflected in the following aspects: (1) A modified Tien–Kuo (T–K) bedding failure criterion was proposed based on the stress equilibrium equation along the lamina, where two critical parameters (the lamina angle (θ) and lamina friction coefficient (μlamina)) were proposed to precisely characterize the laminated rock. The μlamina values were tested based on the triaxial compression tests of different lamina lithofacies. (2) A finite element simulation was conducted based on the modified T–K criterion to study the stress distribution in the laminated rock model composed of the independent lamina and the surrounding rock bodies. (3) The regional bedding fractures distribution of the Upper Triassic Yanchang Formation in the Ordos Basin was clarified based on the regional stratigraphic dip distribution, as well as the regional laminated rock lithofacies distribution proposed in this work, and the regional stress field, which was simulated in our prior simulation work [14].
2. Materials and Methods
2.1. Materials
The six laminated samples studied in this work were collected from the Chang 8 to Chang 6 member, the principal hydrocarbon-accumulating intervals in the Upper Triassic Yanchang Formation of the southern Ordos Basin. These samples could represent the different petrophysical facies in the delta-lacustrine environment. Core-1 and Core-2 are the tight siltstone- and sandstone-deposited distributary channel facies in tractive current hydrodynamic conditions. Core-1 represents the tight channel siltstone with the inconspicuous lamina, i.e., micro-cross-bedding lamina. Core-2 represents the tight channel sandstone with the macro-cross-bedding lamina. Core-3 represents the tight argillaceous siltstone with the horizontal lamina. Core-4 and Core-5 represent the tight sheet siltstone with the obvious lamina, i.e., wavy or lenticular lamina. Core-6 represents the tight siltstone deposited in the lacustrine turbidite fan facies with slumping-induced deformation lamina. Generally, the six laminated cores are typical representatives for all tight sandstone oil reservoirs, especially for the tight sandstone oil reservoir of the Ordos Basin in China.
2.2. Triaxial Compression Tests
To indicate the heterogeneity of laminated rocks and lamina lithofacies in the geo-models, we tested 18 column samples with different lamina angles from the six different laminated cores in triaxial compression experiments. The triaxial compression tests were performed with an RTR apparatus under a 20 MPa confining pressure. The 20 MPa approximates the underground pressure at a 2000 m depth, so it can be used to simulate real geological conditions. Sample treatment was conducted in strict accordance with the International Society of Rock Mechanics (ISRM) rock triaxial test requirements and the China National Standard (GB/T 50266-99).
2.3. Finite Element Simulation
Finite element simulation was performed in the statics module of the ANSYS workbench. In this method, the geological model is divided into different specific elements linked to nodes. In addition, the approximate value of the node displacement could be calculated using the element functions in the equilibrium state. Based on the computed result, we can obtain the stress and strain of these elements [48,49,50,51,52]. For the geological model building work, it is generally assumed that the stress and strain of the shallow crust rocks are linearly dependent during the period of rock elastic deformation [53,54]. In this study, the principle of the finite element approach is composed of the following three relationships: (1) The strain–displacement relationship; (2) strain–stress relationship; and (3) stress–external force relationship. The principle and its detailed explanations can be found in our previous study [17].
In this work, to calculate the boundary stress conditions for the finite element simulation, we modified the Newberry formula to make it more suitable for the tensional and compressive stress fields. Although the rock spatial stress computed by the Newberry formula is appropriate for the tight reservoir simulation [55], the equation is only defined in compressive stress fields and leaves the tensional stress field out of consideration [56,57,58]. Hence, the positive sign of the compressive stress field in the Newberry formula is changed to a negative sign for the tensional stress field. In addition, this work constrained the calculative process of the boundary stress state, based on the assumption that the 3D geo-model can be regarded as a point mass with the corresponding well burial history area. In this way, we can calculate the boundary stress state by combining the regional tectonic stress, tectonic direction, and rock density. The detailed modification of the Newberry formula and the calculative process of the boundary stress state can also be found in our previous study [17].
3. Results
3.1. Stress Balance along the Lamina
A finite element simulation of lamina-induced fractures is conducted in the statics module of the ANSYS workbench based on two geo-bodies, i.e., the lamina and surrounding rock. The contact relationship was settled to the frictional model characterized by a friction coefficient representing the difference between the two separated geo-bodies. Here, this study defined the coefficient as the lamina friction coefficient (μlamina) in the laminated rock, where μlamina could be used to indicate different lamina lithofacies and modify the T–K failure criterion in the finite element simulation. The laminated rock model is shown in Figure 1, which was constructed with the laminated body and the surrounding rock body. Two parameters were introduced into the geo-model to characterize the laminated rock, i.e., the lamina angle (θ) and μlamina. It should be emphasized that μlamina of the laminated rock differs from the internal friction coefficient of intact rocks. The μlamina is not only a physical factor representing the physical sliding behavior in simulation but also a geological factor indicating different lamina lithofacies. Therefore, the range of μlamina may vary from the traditional internal friction coefficient. Its detailed values for different laminated rock types were tested using the triaxial compression technologies in Section 2.2.
Another critical factor for the failure criterion is the lamina angle (θ), indicating the intersection angle between the axial stress direction and the lamina dip direction, which is the complementary angle to the β angle (the acute angle between the direction of maximum principal stress and the discontinuity) in previous works [6,47]. A stress equilibrium equation was built based on the decomposition of stress along the lamina surface (Equation (1), Figure 1). In this equation, θ indicates the lamina angle, σ1 indicates the axial stress, σ3 indicates the confining pressure, and Clamina indicates the lamina cohesion, which is different from the cohesion of homogeneous rock.
The Mohr–Coulomb rock failure criterion (Equation (2)) is usually used to explain the propagation condition for shear fractures. Here, an assumption was made that the propagation condition for bedding fractures meets the Mohr–Coulomb rock failure criterion. In other words, the lamina-induced fractures could be regarded as specially compressed fractures along the lamina surface in the intact rock. Then, Equation (3) was achieved when we solved the simultaneous Equations (1) and (2). It describes the relationship among the internal friction angle (φ) of intact rock, the lamina friction coefficient (μlamina), and the lamina angle (θ) of laminated rock. Equation (4) describes the relationship among the cohesion (S0), the internal friction angle (φ) of intact rock, and the lamina angle (θ) of laminated rock. The final relationship (Equation (5)) was built among the cohesion (S0), the internal friction angle (φ) of intact rock, the lamina angle (θ), and the lamina friction coefficient (μlamina) of laminated rock, when Equation (3) was put into Equation (4). Thus, an important function (Equation (5)) was used to modify the T–K criterion in the following section. Furthermore, the detailed derivation and physical interpretations are shown in Appendix A.
3.2. The Failure Criterion of Bedding Fractures
Tien and Kuo (2001) proposed a common failure criterion (Equation (6)) for the intact bedded rocks, which demonstrates the characteristics of strength anisotropy revealed by the laboratory experiments, where k and n indicate the elastic constants of laminated rocks [6]. In addition, the T–K criterion is based on the nonlinear Hoek–Brown criterion for the homogeneous rock with no lamina.
Zhou et al. (2017) proposed a more efficient modified T–K criterion (Equation (7)) to replace the nonlinear Hoek–Brown criterion with the linear Mohr–Coulomb criterion, where φ indicates the cohesion of surrounding rock beyond the lamina and S0 indicates the cohesion of laminated rocks [47]. The main problem for Zhou et al.’s modified criterion is that the cohesion of laminated rocks (S0) was a constant in Equation (7), but it actually varied with the lamina angle (θ) and the lamina friction coefficient (μlamina) when the compressed fractures primarily propagated along the lamina surface in the laminated rocks. Thus, θ and μlamina could be used together, as two modified factors of S0 in the T–K criterion, to predict the simulated failure behaviors in cm-scale laminated cores to the km-scale bedding formation.
Here, Equation (5) was put into Equation (7) to modify the T–K criterion. Thus, a modified T–K criterion is proposed by Equation (8), where φ indicates the surrounding rock properties and the other parameters indicate the lamina properties. The modified criterion is composed of four critical variables, i.e., the maximum principal stress (σ1), minimum principal stress (σ3), lamina angle (θ), and lamina friction coefficient (μlamina), which are advantageous and could also be used in the ANSYS finite element simulation.
3.3. Index of Bedding Fractures
Li et al. (2018) simulated the distribution of the structural fracture of the Upper Triassic Yanchang Formation in the Ordos Basin by the ANSYS software with a simplified fracture index set. The simulation was proposed based on the relationship between the maximum principal stress and the failure strength, and represents the total fracture possibility based on the distance between the envelope line and the stress state point (Equation (9)) [14]. In the bedding fracture simulation, (the maximum normal stress satisfied the critical rupture condition) is replaced by the failure criterion for the bedding fractures (i.e., Equation (8)) to indicate the index of bedding fractures, as shown in Equation (10).
where T0 is the tensile strength, T0-lamina is the tensile strength of laminated sandstone; μ is the coefficient of internal friction; fLF is the fracture index of lamina induced fractures.
4. Discussion
4.1. Comparisons of Different Failure Criteria For Bedding Fractures
To verify the modified T–K criterion, the testing data were compared to the calculated data using three criteria, i.e., the modified T–K criterion in this study, Zhou et al.’s modified T–K criterion, and the Jaeger criterion (Table 1). Figure 2 shows the triaxial compression test curves in the confining pressures of 10 and 20 MPa, where the samples are the artificial laminated rock in Zhang et al. (2017) (Figure 2a,b) and the naturally laminated rock in Zhou et al. (2017) (Figure 2c,d) [47,59]. The detailed criterion functions are listed in Table 1, and the detailed values of each criterion’s parameters are listed in Table 2. Detailed peak strength values are listed in Table 3, where samples a-0 to b-90 are achieved from Zhang et al. (2017) (Figure 2a,b), samples of c-0 to d-90 are referenced from Zhou et al. (2017) (Figure 2c,d), and samples of ‘1-1’ to ‘6-3’ are tested in this work, as shown in Figure 3. The lamina angle in this work was the complementary angle of the β angle in Zhou et al. (2017) [47,59].
As shown in Figure 2, there was a much lower peak strength for those samples with the lamina angle of 30°. Notably, black square points in Figure 3 indicate the compression peak strength values tested with the 20 MPa confining pressure in Zhou et al. (2017) (Figure 2d) [47]. Black round points in Figure 3 indicate the compressive peak strength values tested with the 10 MPa confining pressure in Zhou et al. (2017) (Figure 2c) [47]. In Figure 3, function curve 1 indicates the peak strength values fitted in Zhou et al. (2017)’s modified T–K criterion with a 10 MPa confining pressure [47]. Function curve 2 indicates the peak strength values fitted in Zhou et al. (2017)’s modified T–K criterion with a 20 MPa confining pressure [47]. Function curves 3 and 4 indicate the peak strength values fitted in the Jaeger failure criterion with 10 and 20 MPa confining pressures, respectively [44]. In addition, function curves 5 and 6 indicate the peak strength values fitted in our modified T–K criterion with 10 and 20 MPa confining pressures, respectively.
Generally, the modified T–K failure criterion has almost the same trend as the T–K criterion and even agrees better with the testing data in Zhang et al. (2017), as shown in Figure 3, especially for the medium-low-angle range (nearly 20°–50°) [59]. Moreover, the four variables in this criterion are in accordance with the ANSYS parameter environment and could provide us with a better failure criterion in the finite element simulation.
4.2. Lamina Friction Coefficients of Different Lamina Lithofacies
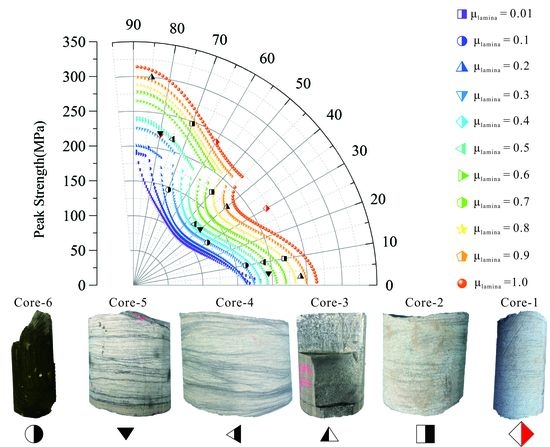
It is necessary to use the lamina friction coefficient (μlamina) to indicate the regional heterogeneity of lamina lithofacies in the geo-simulation work. In order to test the lamina friction coefficient (μlamina) of the different lamina rock types, we tested 18 column samples with different lamina angles from six different laminated cores in triaxial compression experiments. Triaxial compression stress–strain curves are shown in Figure 4. Peak strength values obviously varied between the samples with the different lamina angles, except Core-1, which was similar to the intact core without lamina. The peak strength values were compared to the calculated values using the modified T–K criterion (Figure 5). Black points with the different shapes indicate the peak strength values of the six cores shown in Figure 4 and Figure 5. Colored dotted lines indicate the function curve of the modified T–K criterion, where the different colors indicate the calculated data in different lamina friction coefficients (μlamina). The values of the lamina friction coefficient (μlamina) are 0.01, 0.1, 0.2, 0.3, 0.4, 0.5, 0.6, 0.7, 0.8, 0.9, and 1. In addition, the value of φ is 58°, σ3 is 20 MPa, n is 2.20, k is 0.9, and Clamina is 20 MPa.
As indicated in Figure 5, the following results could be drawn. (1) Different lamina friction coefficients (μlamina) indicate different laminated core types. The cores more strongly characterized by the obvious lamina, such as Core-4, Core-5, and Core-6, are typically correlated with a lower μlamina. (2) The fitting data agreed well with the testing data, except Core-1, which is characterized by the inconspicuous and micro-cross-bedding lamina. Here, the strength values of Core-1 are nearly located in the same range due to the weak influence of these inconspicuous and micro-cross-bedding lamina within Core-1. In other words, the smaller the difference between the lamina and surrounding rock, the weaker the influence of the lamina in different angle ranges. Furthermore, the values of μlamina of Core-4 and Core-5 are around 0.5, which are the laminated siltstone deposited by traction currents in the delta front sedimentary environment. The value of μlamina of Core-6 is around 0.3, which is the laminated siltstone sedimented in the lacustrine turbidite environment. The value of μlamina of Core-3 is around 0.9, which is the laminated mudstone sedimented in a still water environment. From the perspective of the regional finite element simulation, the μlamina, as a critical variable, should be assigned differently according to the laminated rock types deposited in the different sedimentary environments during Yanchang Formation in the Ordos Basin.
4.3. Stress Distribution in the Laminated Rock
The laminated core model (cm-scale) in the finite element simulation is composed of two bodies, as shown in Figure 6, where the contact part between two bodies is settled as frictional with a sliding friction coefficient in accordance with the lamina friction coefficient in the failure criteria of this study. The failure behavior of the laminated rock in the special lamina angle range is determined by the stress distribution constrained by the constant value of μlamina. Therefore, it is necessary to study the stress distribution of the laminated rock using the finite element simulation technology, especially for the different lamina angle ranges, i.e., the low, medium, and high lamina angle ranges.
Researchers have tried to simulate the compression behavior of tight intact rock and the laminated rock using finite element simulation technology [60,61]. To better understand the stress distribution during the compression process, the failure distribution around the compression samples was simulated by using the modified criterion in the ANSYS environment. The simulated samples were divided into two parts: The surrounding rock and the lamina body, with the lamina surface acting as the sliding surface. Additionally, the mechanical parameters of the surrounding rock used in the simulation were different from those of the laminated rock. Here, the surrounding rock was set as siltstone, while the laminated rock was claystone in the ANSYS software. In addition, the contact relationship, i.e., the lamina sliding surface, was set as frictional in the ANSYS software with the fractional coefficient value of 0.2. Another critical parameter, the lamina angle, was designed in the computer model, as shown in Figure 6a,c,e.
Accordingly, the failure criterion was defined according to the modified T–K criterion in the ANSYS software. Figure 6a,c,e show the simulated results, in contrast to the CT (computerized tomography) results of fractured samples (Figure 6b,d,f) with the low, medium, and high lamina angle ranges, respectively.
By contrast, for the high lamina angle (Figure 6a,b) outside the effective lamina angle range, stress was prone to concentrate on the surrounding rock body compared to the samples simulated in the medium and low lamina angle ranges (Figure 6c,e). Therefore, the typical X-conjugate fractures were prone to propagate without associated bedding fractures. Notably, the effective lamina angle indicates that those compressed fractures were generally induced by the lamina body on which the stress was primarily concentrated.
For the medium lamina angle in the effective lamina angle range, a shear fracture propagated between the two bedding fractures, as shown in the CT photo (Figure 6c,d), and was accompanied by some shear fractures between the laminated bodies. The fracture aperture was smaller than that in the core with a small lamina angle and was characterized by the shear sliding distance, as shown in Figure 6d. In addition, stress was prone to concentrate around the rock body rather than the sample simulated at a low lamina angle, which could be indicated by the CT photos (Figure 6a,c,d).
For the low lamina angle (Figure 6e,f) in the effective lamina angle range, the CT photo showed a bigger fracture aperture in the darker color. In addition, the simulated fracture index of the lamina was much higher than that of the surrounding rock, indicating a stronger propagation tendency for the bedding fractures caused by the stress concentration on the lamina.
Overall, stress in these compression samples was prone to concentrate on the lamina when the lamina angle was in the effective lamina angle (low- and medium-angle range). The low-angle lamina always induces fractures in an extensively open state with a bigger failure aperture, and the medium-angle lamina always induces fractures in a shear sliding trend. On the contrary, stress was prone to concentrate on the surrounding rock body when the lamina angle was outside of the effective range, and contributed less to the compressed bedding fractures in the laminated rock.
4.4. Distribution of the Regional Bedding Fractures
In order to simulate the regional bedding fractures generated in a particular tectonic period using the modified criteria, previous simulation studies of the conventional structural fractures at the regional scale are used as the tectonic stress field [14,19,20,62]. Thus, the bedding fractures of the Yanchang Formation in the Ordos Basin generated during the latest orogenic episode (i.e., Himalayan episode) have been simulated by ameliorating Li et al. (2018) [14]. Specifically, as a result, the bedding fractures were calculated (Figure 7d) based on the improved rock failure criteria for bedding fractures (Equation (10)), the stress field simulated in Li et al. (2018) (Figure 7a,b) [14], the stratigraphic dip distribution map (Figure 7c), and the lamina fraction coefficient in different lithofacies (Figure 7d). Here, the stratigraphic dip at the regional scale (i.e., the intersection angle between the horizontal direction and the dip direction at the regional scale) is equal to the lamina angle at the cm-scale, because the maximum principal stress is in the horizontal direction during the orogenic periods, where the stratigraphic dips of the Yanchang Formation are valued in the relatively effective range for the bedding fracture failure criteria, as mentioned before (Figure 7c). In addition, μlamina is assigned different values according to the different fitting results in Figure 5. The laminated siltstone sedimented in a delta front environment (Figure 5 and Figure 7d) is assigned 0.5, the laminated turbidite sandstone sedimented in a lacustrine turbidite environment (Figure 5 and Figure 7d) is assigned 0.3, and the mud sedimented in a still water environment (Figure 5 and Figure 7d) is assigned 0.9.
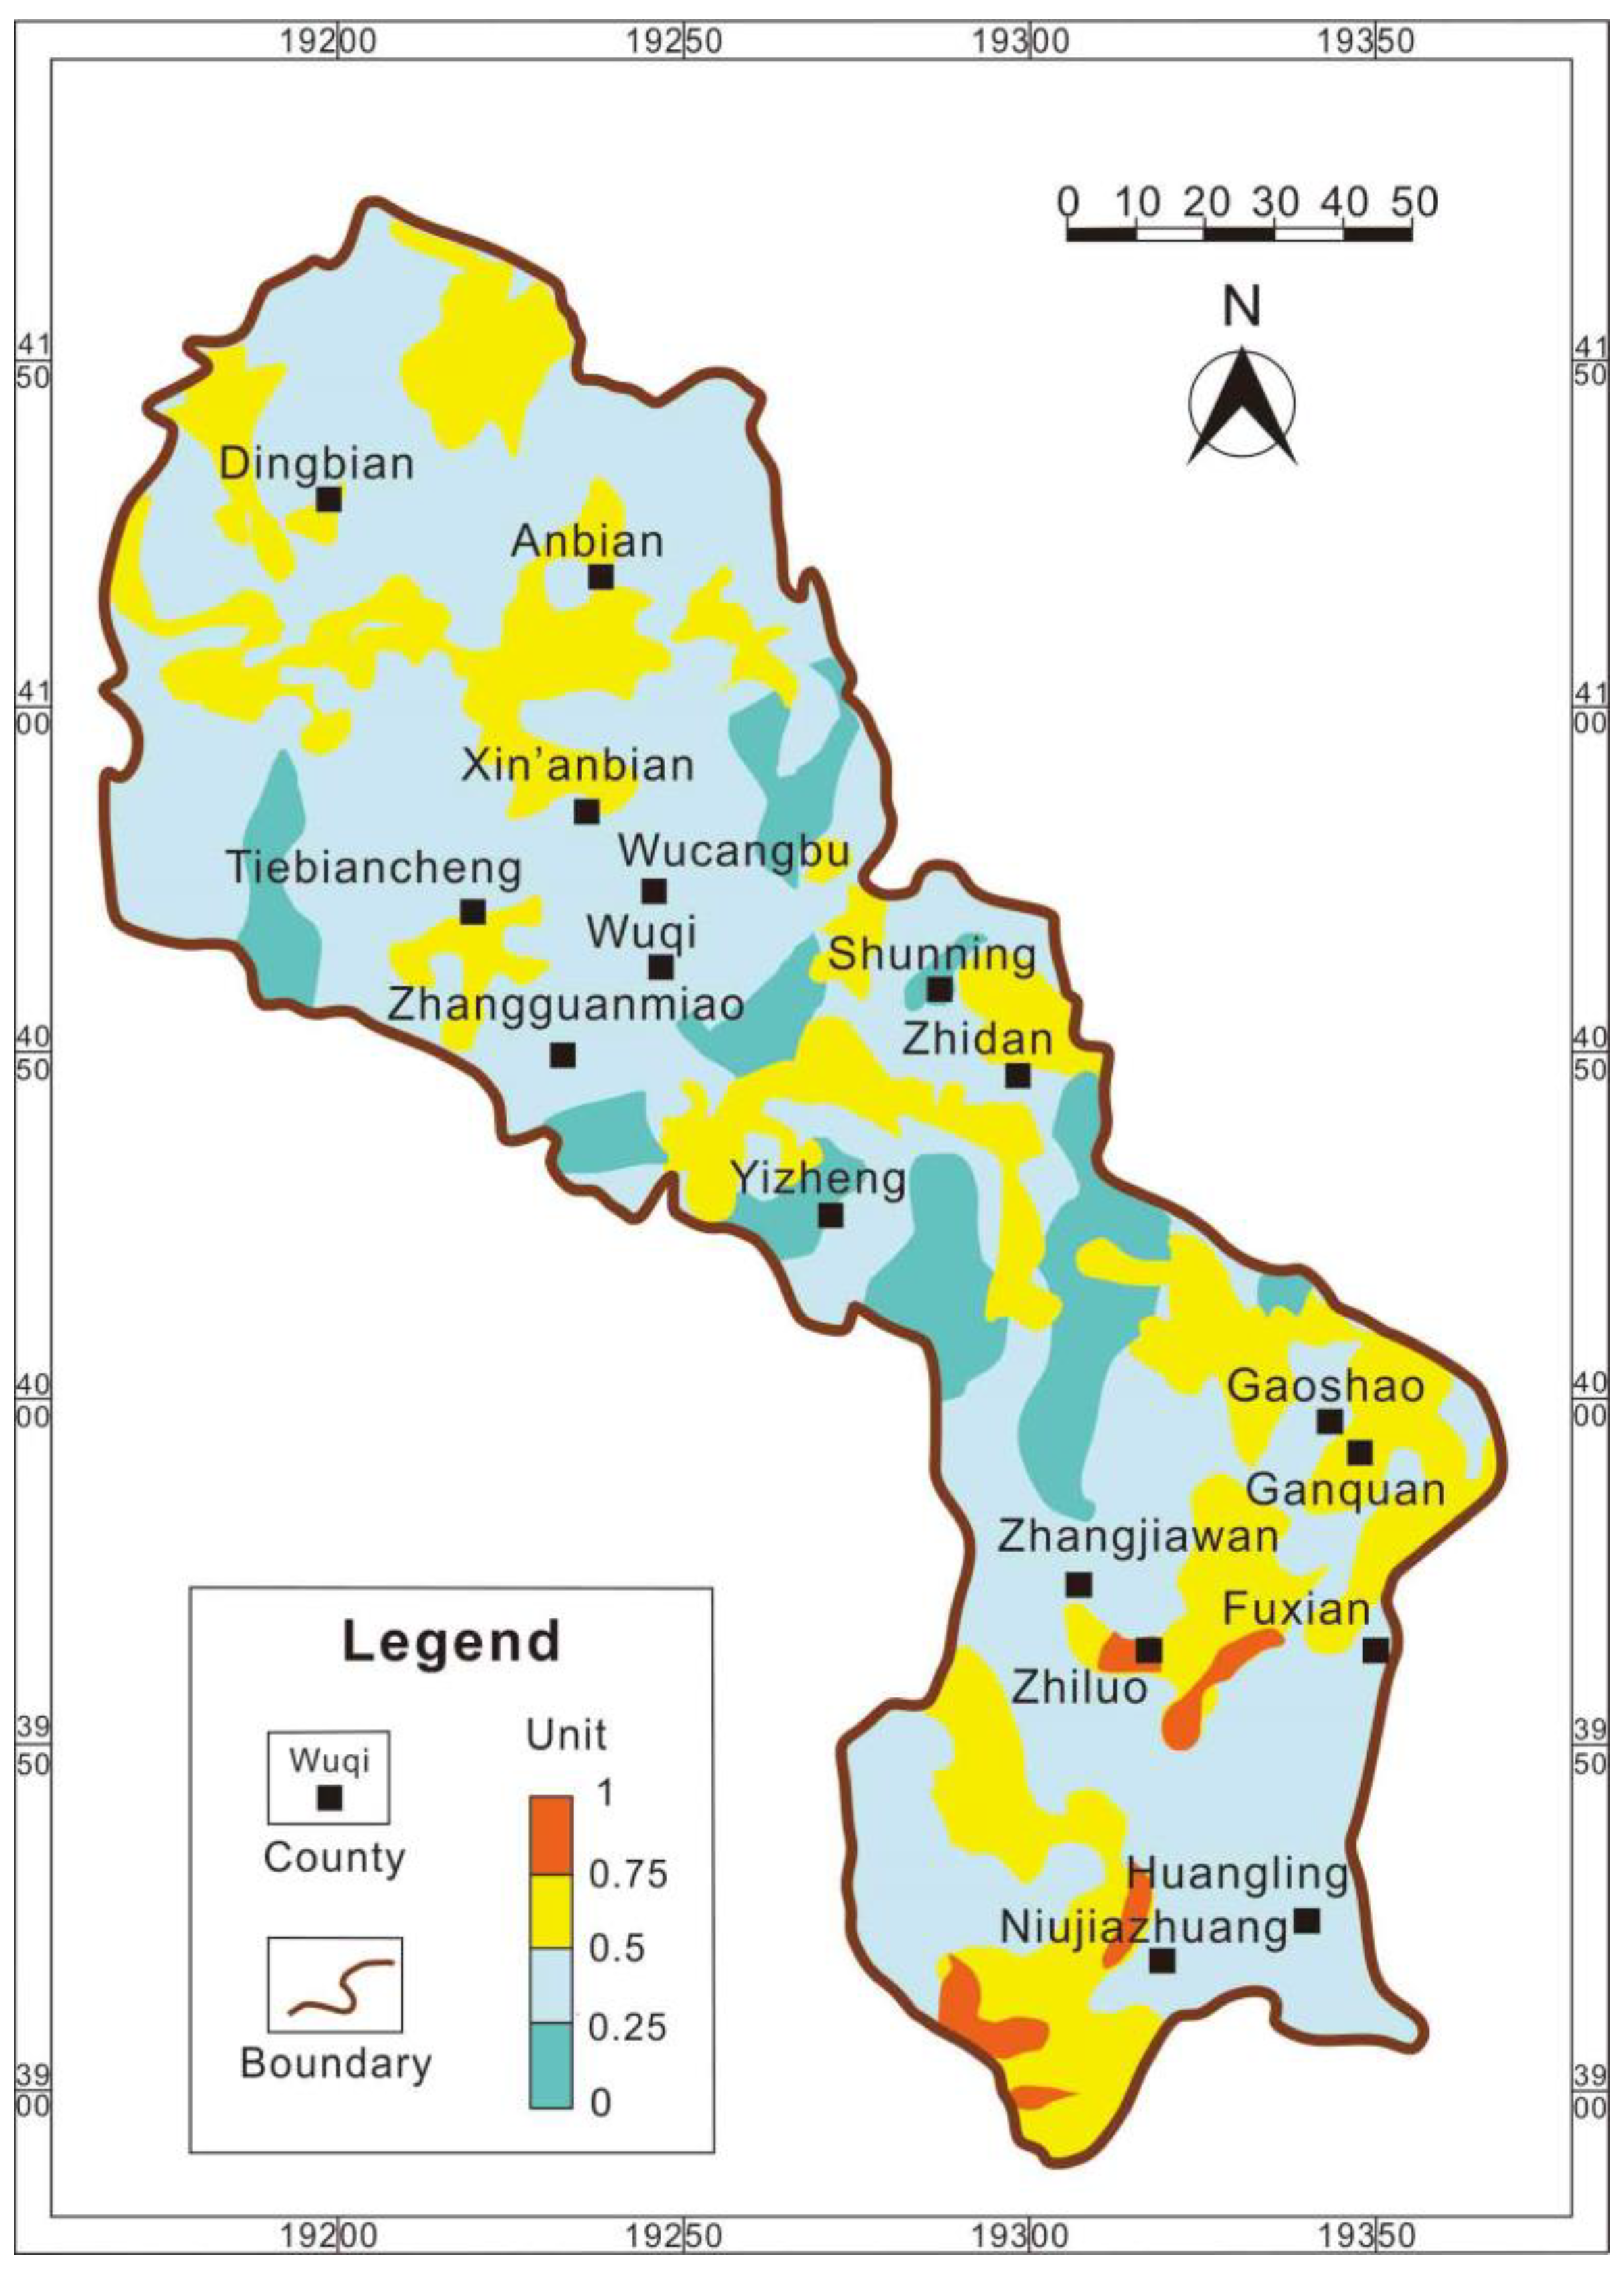
The finite element simulation environment, including the boundary condition, Himalayan tensile stress field, geological model, and petrophysical model, remained consistent with those in Li et al. (2018) [14]. The bedding fracture index in the Yanchang Formation was calculated based on four variables, i.e., the maximum principal stress (σ1), minimum principal stress (σ3), lamina angle (θ), and lamina friction coefficient (μlamina). The calculated bedding fracture distribution, as shown in Figure 8, is broadly consistent with the structural fractured regions simulated by Li et al. (2018) [14], such as the typical oilfield regions of “Dingbian,” “Xin’anbian,” and “Zhiluo” (Figure 7c). The difference is that the simulated bedding fractures spread over an even larger area, which reveals that bedding fractures are more easily induced than the conventional structural fractures (i.e., the tensile, shear, and hybrid fractures) under the same stress condition. For the Himalayan tensile stress field of the Yanchang Formation in the Ordos Basin, it is obvious that the bedding fractures tend to propagate under the conditions of lower maximum principal stress, higher minimum principal stress, and higher stratigraphic dip values (Figure 7a–d). Generally, the bedding fractures distribution simulated in this work (Figure 7d) would be a supplement for the structural fractures simulated by Li et al. (2018) [14], and both of the two research works contribute to the further study of the natural fracture network underground (including the bedding fractures and the conventional structural fractures) for the Yanchang Formation of the Ordos Basin.
5. Conclusions
1. Two critical parameters were introduced to modify the T–K criterion, i.e., the lamina angle (θ) based on the stress equilibrium equation along the lamina surface, and the lamina friction coefficient (μlamina) related to the different laminated rock type.
2. Stress is prone to concentrate on the lamina when the lamina angle is in the effective low and medium range. The low-angle lamina always induces fractures in the expansively open state with the bigger failure aperture, and the medium-angle lamina always induces fractures in the shear sliding trend. On the contrary, stress is prone to concentrate on the surrounding rock body, when the lamina angle is outside of the effective range, and contributes less to the compressed fractures in the laminated rock.
3. The bedding fractures of the Yanchang Formation in the Himalayan stress field were simulated based on the new rock failure criteria proposed in this work. It is concluded that these bedding fractures tend to propagate under the conditions of lower maximum principal stress, higher minimum principal stress, and larger stratigraphic dip.
Author Contributions
Conceptualization, Y.L.; Data curation, Q.W., Z.J. and D.L.; Formal analysis, D.L.; Funding acquisition, W.Y., Z.J. and Y.S.; Investigation, Q.W. and Y.L.; Methodology, Q.W. and Y.L.; Project administration, W.Y., Y.S. and Q.L.; Resources, D.L.; Software, Y.L. and D.L.; Supervision, W.Y., Z.J., Y.S., S.J. and Q.L.; Validation, Y.L.; Visualization, Y.L.; Writing—original draft, Q.W. and Y.L.; Writing—review & editing, Q.W. and Y.L. All authors have read and agreed to the published version of the manuscript.
Funding
This study was financially supported by the Science Foundation for top-notch innovative talents of China University of Petroleum, Beijing (No. 2462017BJB07), the National Science and Technology Major Project (No. 2016ZX05034-001 and 2017ZX05035-002), and the Key Scientific and Technological Project of Yanchang Oilfield (No. ycsy2015ky-B-01-09).
Acknowledgments
We highly appreciate two anonymous reviewers for their valuable and constructive comments, which are significantly helpful for us to improve the quality of our research achievements. Special acknowledgment is also given to the Scientific Research Institute of Petroleum Exploration and Development from the Shaanxi Yanchang Petroleum (Group) Co., Ltd. for providing the samples used in this study.
Conflicts of Interest
The authors declare no conflict of interest.
Nomenclature
| σ1 | the maximum principal stress |
| σ3 | the minimum principal stress |
| θ | the lamina angle |
| μlamina | the lamina friction coefficient |
| Clamina | the lamina cohesion |
| f | the friction force between the lamina surface and surrounding rock |
| φ | the internal friction angle |
| S0 | the cohesion of laminated rocks |
| k and n | the elastic constants of laminated rocks |
| β | the acute angle between the direction of maximum principal stress and the discontinuity |
| Cj | the lamina cohesion in the Jaeger criterion |
| φj | the internal friction angle in the Jaeger criterion |
| T0 | the tensile strength |
| fLF | the fracture index of lamina induced fractures |
| T0-lamina | the tensile strength of laminated sandstone |
| μ | the coefficient of internal friction |
| the maximum normal stress satisfied the critical rupture condition |
Appendix A
The stress balance in Figure 1 is based on shear strength and is expressed as follows:
where f = μlamina × (σ3cosθ + σ1sinθ) and represents the physical and frictional interactions between the lamina and the surrounding rock, as shown in Figure 1. Clamina represents the chemical cementation between the lamina and the surrounding rock, which is treated as a constant parameter in this simulation.
To establish an equation in contrast to the Mohr–Coulomb failure criterion (Equation (A2)), Equation (A3) is achieved when Equation (A1) is transformed into (A2).
It is possible to compare Equation (A2) with (A3) when the lamina-induced fractures are considered a special product emerging when shear fractures slide along the lamina surface. Thus, an equivalent relationship between the constant term and the coefficient term of the variables σ1 and σ3 can be expressed as Equations (A4) and (A5):
Then, φ and S0 can be expressed as Equations (A6) and (A7):
Thus, S0 can be further expressed as Equation (A8) when Equation (A6) is put into Equation (A7).
References
- Cheng, Y.; Lu, Y.; Ge, Z.; Cheng, L.; Zheng, J.; Zhang, W. Experimental study on crack propagation control and mechanism analysis of directional hydraulic fracturing. Fuel 2018, 218, 316–324. [Google Scholar] [CrossRef]
- Desai, C.S.; Zaman, M.M.; Lightner, J.G.; Siriwardane, H.J. Thin-layer element for interfaces and joints. Int. J. Numer. Anal. Methods Geomech. 1984, 8, 19–43. [Google Scholar] [CrossRef]
- Hu, S.-C.; Tan, Y.-L.; Zhou, H.; Guo, W.-Y.; Hu, D.-W.; Meng, F.-Z.; Liu, Z.-G. Impact of Bedding Planes on Mechanical Properties of Sandstone. Rock Mech. Rock Eng. 2017, 50, 2243–2251. [Google Scholar] [CrossRef]
- Ma, L.-J.; Liu, X.-Y.; Wang, M.-Y.; Xu, H.-F.; Hua, R.-P.; Fan, P.-X.; Jiang, S.-R.; Wang, G.-A.; Yi, Q.-K. Experimental investigation of the mechanical properties of rock salt under triaxial cyclic loading. Int. J. Rock Mech. Min. Sci. 2013, 62, 34–41. [Google Scholar] [CrossRef]
- Sampath, K.H.S.M.; Perera, M.S.A.; Elsworth, D.; Ranjith, P.G.; Matthai, S.K.; Rathnaweera, T. Experimental Investigation on the Mechanical Behavior of Victorian Brown Coal under Brine Saturation. Energy Fuels 2018, 32, 5799–5811. [Google Scholar] [CrossRef]
- Tien, Y.M.; Kuo, M.C. A failure criterion for transversely isotropic rocks. Int. J. Rock Mech. Min. Sci. 2001, 38, 399–412. [Google Scholar] [CrossRef]
- Vervoort, A.; Min, K.-B.; Konietzky, H.; Cho, J.-W.; Debecker, B.; Dinh, Q.-D.; Frühwirt, T.; Tavallali, A. Failure of transversely isotropic rock under Brazilian test conditions. Int. J. Rock Mech. Min. Sci. 2014, 70, 343–352. [Google Scholar] [CrossRef]
- Wu, J.-H.; Ohnishi, Y.; Nishiyama, S. Simulation of the mechanical behavior of inclined jointed rock masses during tunnel construction using Discontinuous Deformation Analysis (DDA). Int. J. Rock Mech. Min. Sci. 2004, 41, 731–743. [Google Scholar] [CrossRef]
- Zhang, Z.-H.; Deng, J.-H.; Zhu, J.-B.; Li, L.-R. An Experimental Investigation of the Failure Mechanisms of Jointed and Intact Marble under Compression Based on Quantitative Analysis of Acoustic Emission Waveforms. Rock Mech. Rock Eng. 2018, 51, 2299–2307. [Google Scholar] [CrossRef]
- Zhou, Y.; Wu, S.; Li, Z.; Zhu, R.; Xie, S.; Jing, C.; Lei, L. Multifractal Study of Three-Dimensional Pore Structure of Sand-Conglomerate Reservoir Based on CT Images. Energy Fuels 2018, 32, 4797–4807. [Google Scholar] [CrossRef]
- Cilona, A.; Aydin, A.; Likerman, J.; Parker, B.; Cherry, J. Structural and statistical characterization of joints and multi-scale faults in an alternating sandstone and shale turbidite sequence at the Santa Susana Field Laboratory: Implications for their effects on groundwater flow and contaminant transport. J. Struct. Geol. 2016, 85, 95–114. [Google Scholar] [CrossRef] [Green Version]
- Ishii, E. The role of bedding in the evolution of meso- and microstructural fabrics in fault zones. J. Struct. Geol. 2016, 89, 130–143. [Google Scholar] [CrossRef]
- Zhang, Y.; Zhang, Z.; Sarmadivaleh, M.; Lebedev, M.; Barifcani, A.; Yu, H.; Iglauer, S. Micro-scale fracturing mechanisms in coal induced by adsorption of supercritical CO 2. Int. J. Coal Geol. 2017, 175, 40–50. [Google Scholar] [CrossRef] [Green Version]
- Li, Y.; Song, Y.; Jiang, Z.; Yin, L.; Chen, M.; Liu, D. Major factors controlling lamina induced fractures in the Upper Triassic Yanchang formation tight oil reservoir, Ordos basin, China. J. Asian Earth Sci. 2018, 166, 107–119. [Google Scholar] [CrossRef]
- Espinoza, D.N.; Shovkun, I.; Makni, O.; Lenoir, N. Natural and induced fractures in coal cores imaged through X-ray computed microtomography—Impact on desorption time. Int. J. Coal Geol. 2016, 154–155, 165–175. [Google Scholar] [CrossRef]
- Li, L.; Sheng, J.J.; Su, Y.; Zhan, S. Further Investigation of Effects of Injection Pressure and Imbibition Water on CO2 Huff-n-Puff Performance in Liquid-Rich Shale Reservoirs. Energy Fuels 2018, 32, 5789–5798. [Google Scholar] [CrossRef]
- Li, Y.; Song, Y.; Jiang, Z.; Yin, L.; Luo, Q.; Ge, Y.; Liu, D. Two episodes of structural fractures: Numerical simulation of Yanchang Oilfield in the Ordos basin, northern China. Mar. Pet. Geol. 2018, 97, 223–240. [Google Scholar] [CrossRef]
- Liang, S.; Elsworth, D.; Li, X.; Fu, X.; Sun, B.; Yao, Q. Key strata characteristics controlling the integrity of deep wells in longwall mining areas. Int. J. Coal Geol. 2017, 172, 31–42. [Google Scholar] [CrossRef]
- Liu, J.; Ding, W.; Wang, R.; Yin, S.; Yang, H.; Gu, Y. Simulation of paleotectonic stress fields and quantitative prediction of multi-period fractures in shale reservoirs: A case study of the Niutitang Formation in the Lower Cambrian in the Cen’gong block, South China. Mar. Pet. Geol. 2017, 84, 289–310. [Google Scholar] [CrossRef]
- Liu, J.; Ding, W.; Yang, H.; Wang, R.; Yin, S.; Li, A.; Fu, F. 3D geomechanical modeling and numerical simulation of in-situ stress fields in shale reservoirs: A case study of the lower Cambrian Niutitang formation in the Cen’gong block, South China. Tectonophysics 2017, 712–713, 663–683. [Google Scholar] [CrossRef]
- Weniger, S.; Weniger, P.; Littke, R. Characterizing coal cleats from optical measurements for CBM evaluation. Int. J. Coal Geol. 2016, 154–155, 176–192. [Google Scholar] [CrossRef]
- Widera, M. Lignite cleat studies from the first Middle-Polish (first Lusatian) lignite seam in central Poland. Int. J. Coal Geol. 2014, 131, 227–238. [Google Scholar] [CrossRef]
- Zeng, L.; Li, X. Fractures in sandstone reservoirs with ultra-low permeability: A case study of the Upper Triassic Yanchang Formation in the Ordos Basin, China. AAPG Bull. 2009, 93, 461–477. [Google Scholar]
- Małkowski, P.; Ostrowski, Ł.; Brodny, J. Analysis of Young’s modulus for Carboniferous sedimentary rocks and its relationship with uniaxial compressive strength using different methods of modulus determination. J. Sustain. Min. 2018, 17, 145–157. [Google Scholar] [CrossRef]
- Cai, Y.; Liu, D.; Mathews, J.P.; Pan, Z.; Elsworth, D.; Yao, Y.; Li, J.; Guo, X. Permeability evolution in fractured coal—Combining triaxial confinement with X-ray computed tomography, acoustic emission and ultrasonic techniques. Int. J. Coal Geol. 2014, 122, 91–104. [Google Scholar] [CrossRef]
- Kędzior, S.; Dreger, M. Methane occurrence, emissions and hazards in the Upper Silesian Coal Basin, Poland. Int. J. Coal Geol. 2019, 211, 103226. [Google Scholar] [CrossRef]
- Tutak, M.; Brodny, J. Forecasting Methane Emissions from Hard Coal Mines Including the Methane Drainage Process. Energies 2019, 12, 3840. [Google Scholar] [CrossRef] [Green Version]
- Ardakani, O.H.; Sanei, H.; Ghanizadeh, A.; McMechan, M.; Ferri, F.; Clarkson, C.R. Hydrocarbon potential and reservoir characteristics of Lower Cretaceous Garbutt Formation, Liard Basin Canada. Fuel 2017, 209, 274–289. [Google Scholar] [CrossRef]
- Fan, D.; Ettehadtavakkol, A. Semi-analytical modeling of shale gas flow through fractal induced fracture networks with microseismic data. Fuel 2017, 193, 444–459. [Google Scholar] [CrossRef]
- Gong, J.; Rossen, W.R. Characteristic fracture spacing in primary and secondary recovery for naturally fractured reservoirs. Fuel 2018, 223, 470–485. [Google Scholar] [CrossRef]
- Lyu, W.; Zeng, L.; Zhang, B.; Miao, F.; Lyu, P.; Dong, S. Influence of natural fractures on gas accumulation in the Upper Triassic tight gas sandstones in the northwestern Sichuan Basin, China. Mar. Pet. Geol. 2017, 83, 60–72. [Google Scholar] [CrossRef]
- Mehana, M.; Al Salman, M.; Fahes, M. Impact of Salinity and Mineralogy on Slick Water Spontaneous Imbibition and Formation Strength in Shale. Energy Fuels 2018, 32, 5725–5735. [Google Scholar] [CrossRef]
- Zeng, L.; Tang, X.; Wang, T.; Gong, L. The influence of fracture cements in tight Paleogene saline lacustrine carbonate reservoirs, western Qaidam Basin, northwest ChinaGeologic Notes. AAPG Bull. 2012, 96, 2003–2017. [Google Scholar] [CrossRef]
- Parvizi, H.; Rezaei-Gomari, S.; Nabhani, F. Robust and Flexible Hydrocarbon Production Forecasting Considering the Heterogeneity Impact for Hydraulically Fractured Wells. Energy Fuels 2017, 31, 8481–8488. [Google Scholar] [CrossRef] [Green Version]
- Brodny, J.; Tutak, M. Exposure to Harmful Dusts on Fully Powered Longwall Coal Mines in Poland. Int. J. Environ. Res. Public Health 2018, 15, 3. [Google Scholar] [CrossRef] [Green Version]
- Ostojic, J.; Rezaee, R.; Bahrami, H. Production performance of hydraulic fractures in tight gas sands, a numerical simulation approach. J. Pet. Sci. Eng. 2012, 88–89, 75–81. [Google Scholar] [CrossRef]
- Tokhmchi, B.; Memarian, H.; Rezaee, M.R. Estimation of the fracture density in fractured zones using petrophysical logs. J. Pet. Sci. Eng. 2010, 72, 206–213. [Google Scholar] [CrossRef]
- Tutak, M.; Brodny, J. Predicting Methane Concentration in Longwall Regions Using Artificial Neural Networks. Int. J. Environ. Res. Public Health 2019, 16, 2. [Google Scholar] [CrossRef] [Green Version]
- Miller, P.; Dasgupta, S.; Shelander, D. Seismic imaging of migration pathways by advanced attribute analysis, Alaminos Canyon 21, Gulf of Mexico. Mar. Pet. Geol. 2012, 34, 111–118. [Google Scholar] [CrossRef]
- Maxwell, S.C.; Waltman, C.; Warpinski, N.R.; Mayerhofer, M.J.; Boroumand, N. Imaging Seismic Deformation Induced by Hydraulic Fracture Complexity. SPE Reserv. Eval. Eng. 2009, 12, 48–52. [Google Scholar] [CrossRef] [Green Version]
- Ding, W.; Fan, T.; Yu, B.; Huang, X.; Liu, C. Ordovician carbonate reservoir fracture characteristics and fracture distribution forecasting in the Tazhong area of Tarim Basin, Northwest China. J. Pet. Sci. Eng. 2012, 86–87, 62–70. [Google Scholar] [CrossRef]
- Ju, W.; Sun, W. Tectonic fractures in the Lower Cretaceous Xiagou Formation of Qingxi Oilfield, Jiuxi Basin, NW China Part one: Characteristics and controlling factors. J. Pet. Sci. Eng. 2016, 146, 617–625. [Google Scholar] [CrossRef]
- Zeng, L.; Wang, H.; Gong, L.; Liu, B. Impacts of the tectonic stress field on natural gas migration and accumulation: A case study of the Kuqa Depression in the Tarim Basin, China. Mar. Pet. Geol. 2010, 27, 1616–1627. [Google Scholar] [CrossRef] [Green Version]
- Jaeger, J.C. Shear failure of anisotropic rocks. Geol. Mag. 1960, 97, 65–72. [Google Scholar] [CrossRef]
- Zhou, Y.; Feng, X.; Xu, D.; Chen, D.; Li, S. Experimental study of mechanical response of thin-bedded limestone under bending conditions. Rock Soil Mech. 2016, 37, 1895–1902. [Google Scholar]
- Zhou, Y.-Y.; Feng, X.-T.; Xu, D.-P.; Fan, Q.-X. Experimental Investigation of the Mechanical Behavior of Bedded Rocks and Its Implication for High Sidewall Caverns. Rock Mech. Rock Eng. 2016, 49, 3643–3669. [Google Scholar] [CrossRef]
- Zhou, Y.-Y.; Feng, X.-T.; Xu, D.-P.; Fan, Q.-X. An enhanced equivalent continuum model for layered rock mass incorporating bedding structure and stress dependence. Int. J. Rock Mech. Min. Sci. 2017, 97, 75–98. [Google Scholar] [CrossRef]
- Fries, T.-P.; Belytschko, T. The extended/generalized finite element method: An overview of the method and its applications. Int. J. Numer. Methods Eng. 2010. [Google Scholar] [CrossRef]
- Geuzaine, C.; Remacle, J.-F. Gmsh: A 3-D finite element mesh generator with built-in pre- and post-processing facilities. Int. J. Numer. Methods Eng. 2009, 79, 1309–1331. [Google Scholar] [CrossRef]
- Liu, G.R.; Dai, K.Y.; Nguyen, T.T. A Smoothed Finite Element Method for Mechanics Problems. Comput. Mech. 2006, 39, 859–877. [Google Scholar] [CrossRef]
- Roters, F.; Eisenlohr, P.; Hantcherli, L.; Tjahjanto, D.D.; Bieler, T.R.; Raabe, D. Overview of constitutive laws, kinematics, homogenization and multiscale methods in crystal plasticity finite-element modeling: Theory, experiments, applications. Acta Mater. 2010, 58, 1152–1211. [Google Scholar] [CrossRef]
- Stefanou, G. The stochastic finite element method: Past, present and future. Comput. Methods Appl. Mech. Eng. 2009, 198, 1031–1051. [Google Scholar] [CrossRef] [Green Version]
- Wang, H. Numerical modeling of non-planar hydraulic fracture propagation in brittle and ductile rocks using XFEM with cohesive zone method. J. Pet. Sci. Eng. 2015, 135, 127–140. [Google Scholar] [CrossRef]
- Wang, X.; Shi, F.; Liu, H.; Wu, H. Numerical simulation of hydraulic fracturing in orthotropic formation based on the extended finite element method. J. Nat. Gas Sci. Eng. 2016, 33, 56–69. [Google Scholar] [CrossRef]
- Newberry, N.R.; Nicoll, R.A. Comparison of the action of baclofen with gamma-aminobutyric acid on rat hippocampal pyramidal cells in vitro. J. Physiol. 1985, 360, 161–185. [Google Scholar] [CrossRef] [PubMed]
- Fan, X.; Gong, M.; Zhang, Q.; Wang, J.; Bai, L.; Chen, Y. Prediction of the horizontal stress of the tight sandstone formation in eastern Sulige of China. J. Pet. Sci. Eng. 2014, 113, 72–80. [Google Scholar] [CrossRef]
- Fang, Y.; den Hartog, S.A.M.; Elsworth, D.; Marone, C.; Cladouhos, T. Anomalous distribution of microearthquakes in the Newberry Geothermal Reservoir: Mechanisms and implications. Geothermics 2016, 63, 62–73. [Google Scholar] [CrossRef] [Green Version]
- Rust, A.C.; Cashman, K.V. Multiple origins of obsidian pyroclasts and implications for changes in the dynamics of the 1300 B.P. eruption of Newberry Volcano, USA. Bull. Volcanol. 2007, 69, 825–845. [Google Scholar] [CrossRef]
- Zhang, G.; Wang, L.; Wu, Y.; Li, Y.; Yu, S. Failure mechanism of bedded salt formations surrounding salt caverns for underground gas storage. Bull. Eng. Geol. Environ. 2017, 76, 1609–1625. [Google Scholar] [CrossRef]
- Hajiabdolmajid, V.; Kaiser, P.K.; Martin, C.D. Modelling brittle failure of rock. Int. J. Rock Mech. Min. Sci. 2002, 39, 731–741. [Google Scholar] [CrossRef]
- Jing, L.; Nordlund, E.; Stephansson, O. A 3-D constitutive model for rock joints with anisotropic friction and stress dependency in shear stiffness. Int. J. Rock Mech. Min. Sci. Geomech. Abstr. 1994, 31, 173–178. [Google Scholar] [CrossRef]
- Liu, J.; Ding, W.; Yang, H.; Jiu, K.; Wang, Z.; Li, A. Quantitative prediction of fractures using the finite element method: A case study of the lower Silurian Longmaxi Formation in northern Guizhou, South China. J. Asian Earth Sci. 2018, 154, 397–418. [Google Scholar] [CrossRef]
Figure 1.
Laminated rock model composed of the lamina and the surrounding rock. Red arrows indicate the decomposition of stress along the lamina surface, where θ indicates the lamina angle, σ1 indicates the axial stress, σ3 indicates the confining pressure, Clamina indicates the lamina cohesion, and f indicates the friction force between the lamina surface and surrounding rock.
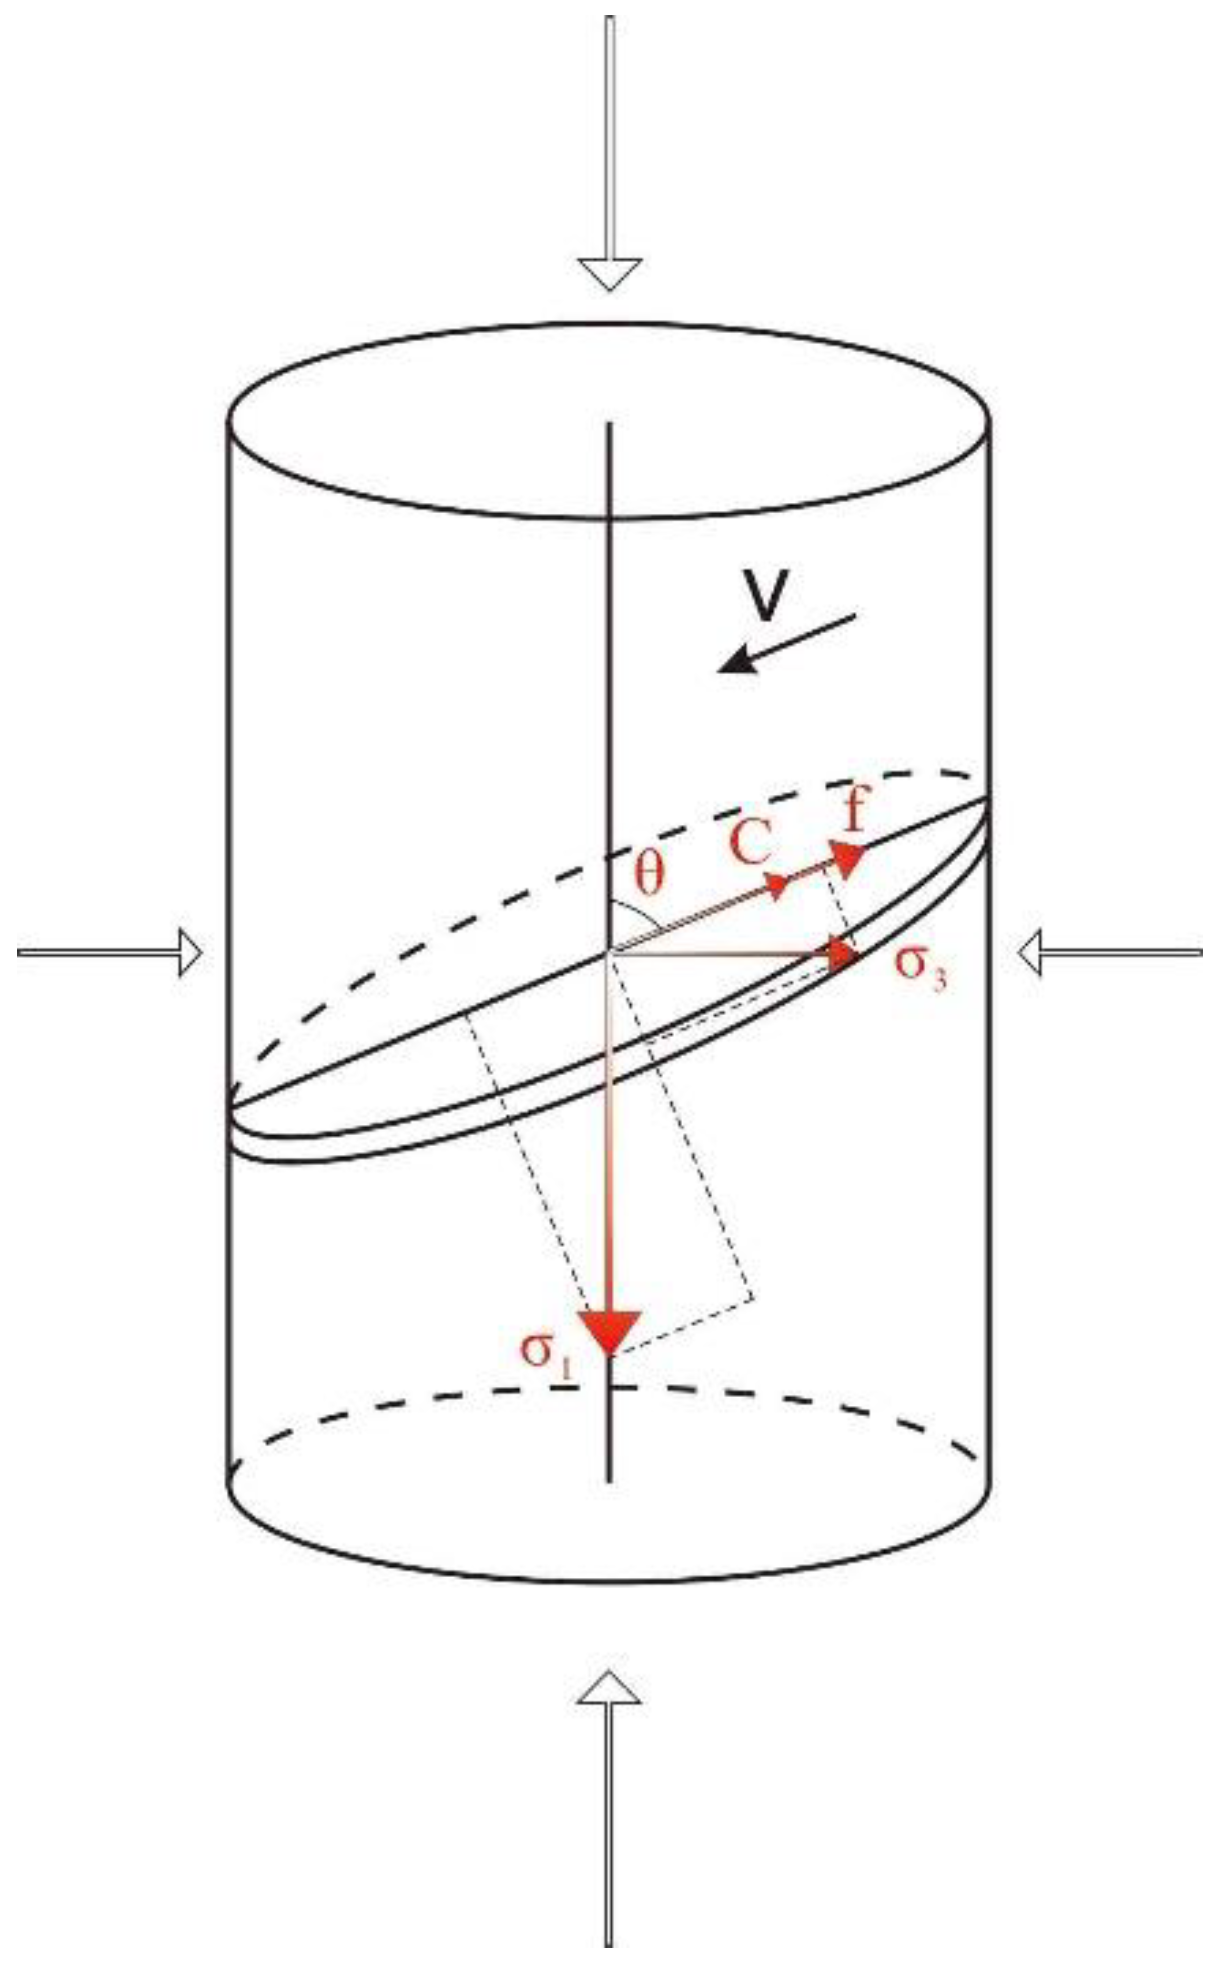
Figure 2.
Stress–strain curves of laminated rock tested in previous works. (a) Curves tested in Zhang et al. (2017) [59]; samples are artificial laminated cores tested at 10 MPa confining pressure. (b) Curves tested in Zhang et al. (2017); samples are artificial laminated cores tested at 20 MPa confining pressure. (c) Curves tested in Zhou et al. (2017) [47]. The peak strength values of these curves are also used to verify the modified Tien–Kuo (T–K) criterion, and the samples are the naturally laminated cores tested at 10 MPa confining pressure. (d) Curves tested in Zhou et al. (2017). The peak strength values of these curves are also used to verify the modified T–K criterion, and samples are the naturally laminated cores tested at 20 MPa confining pressure.
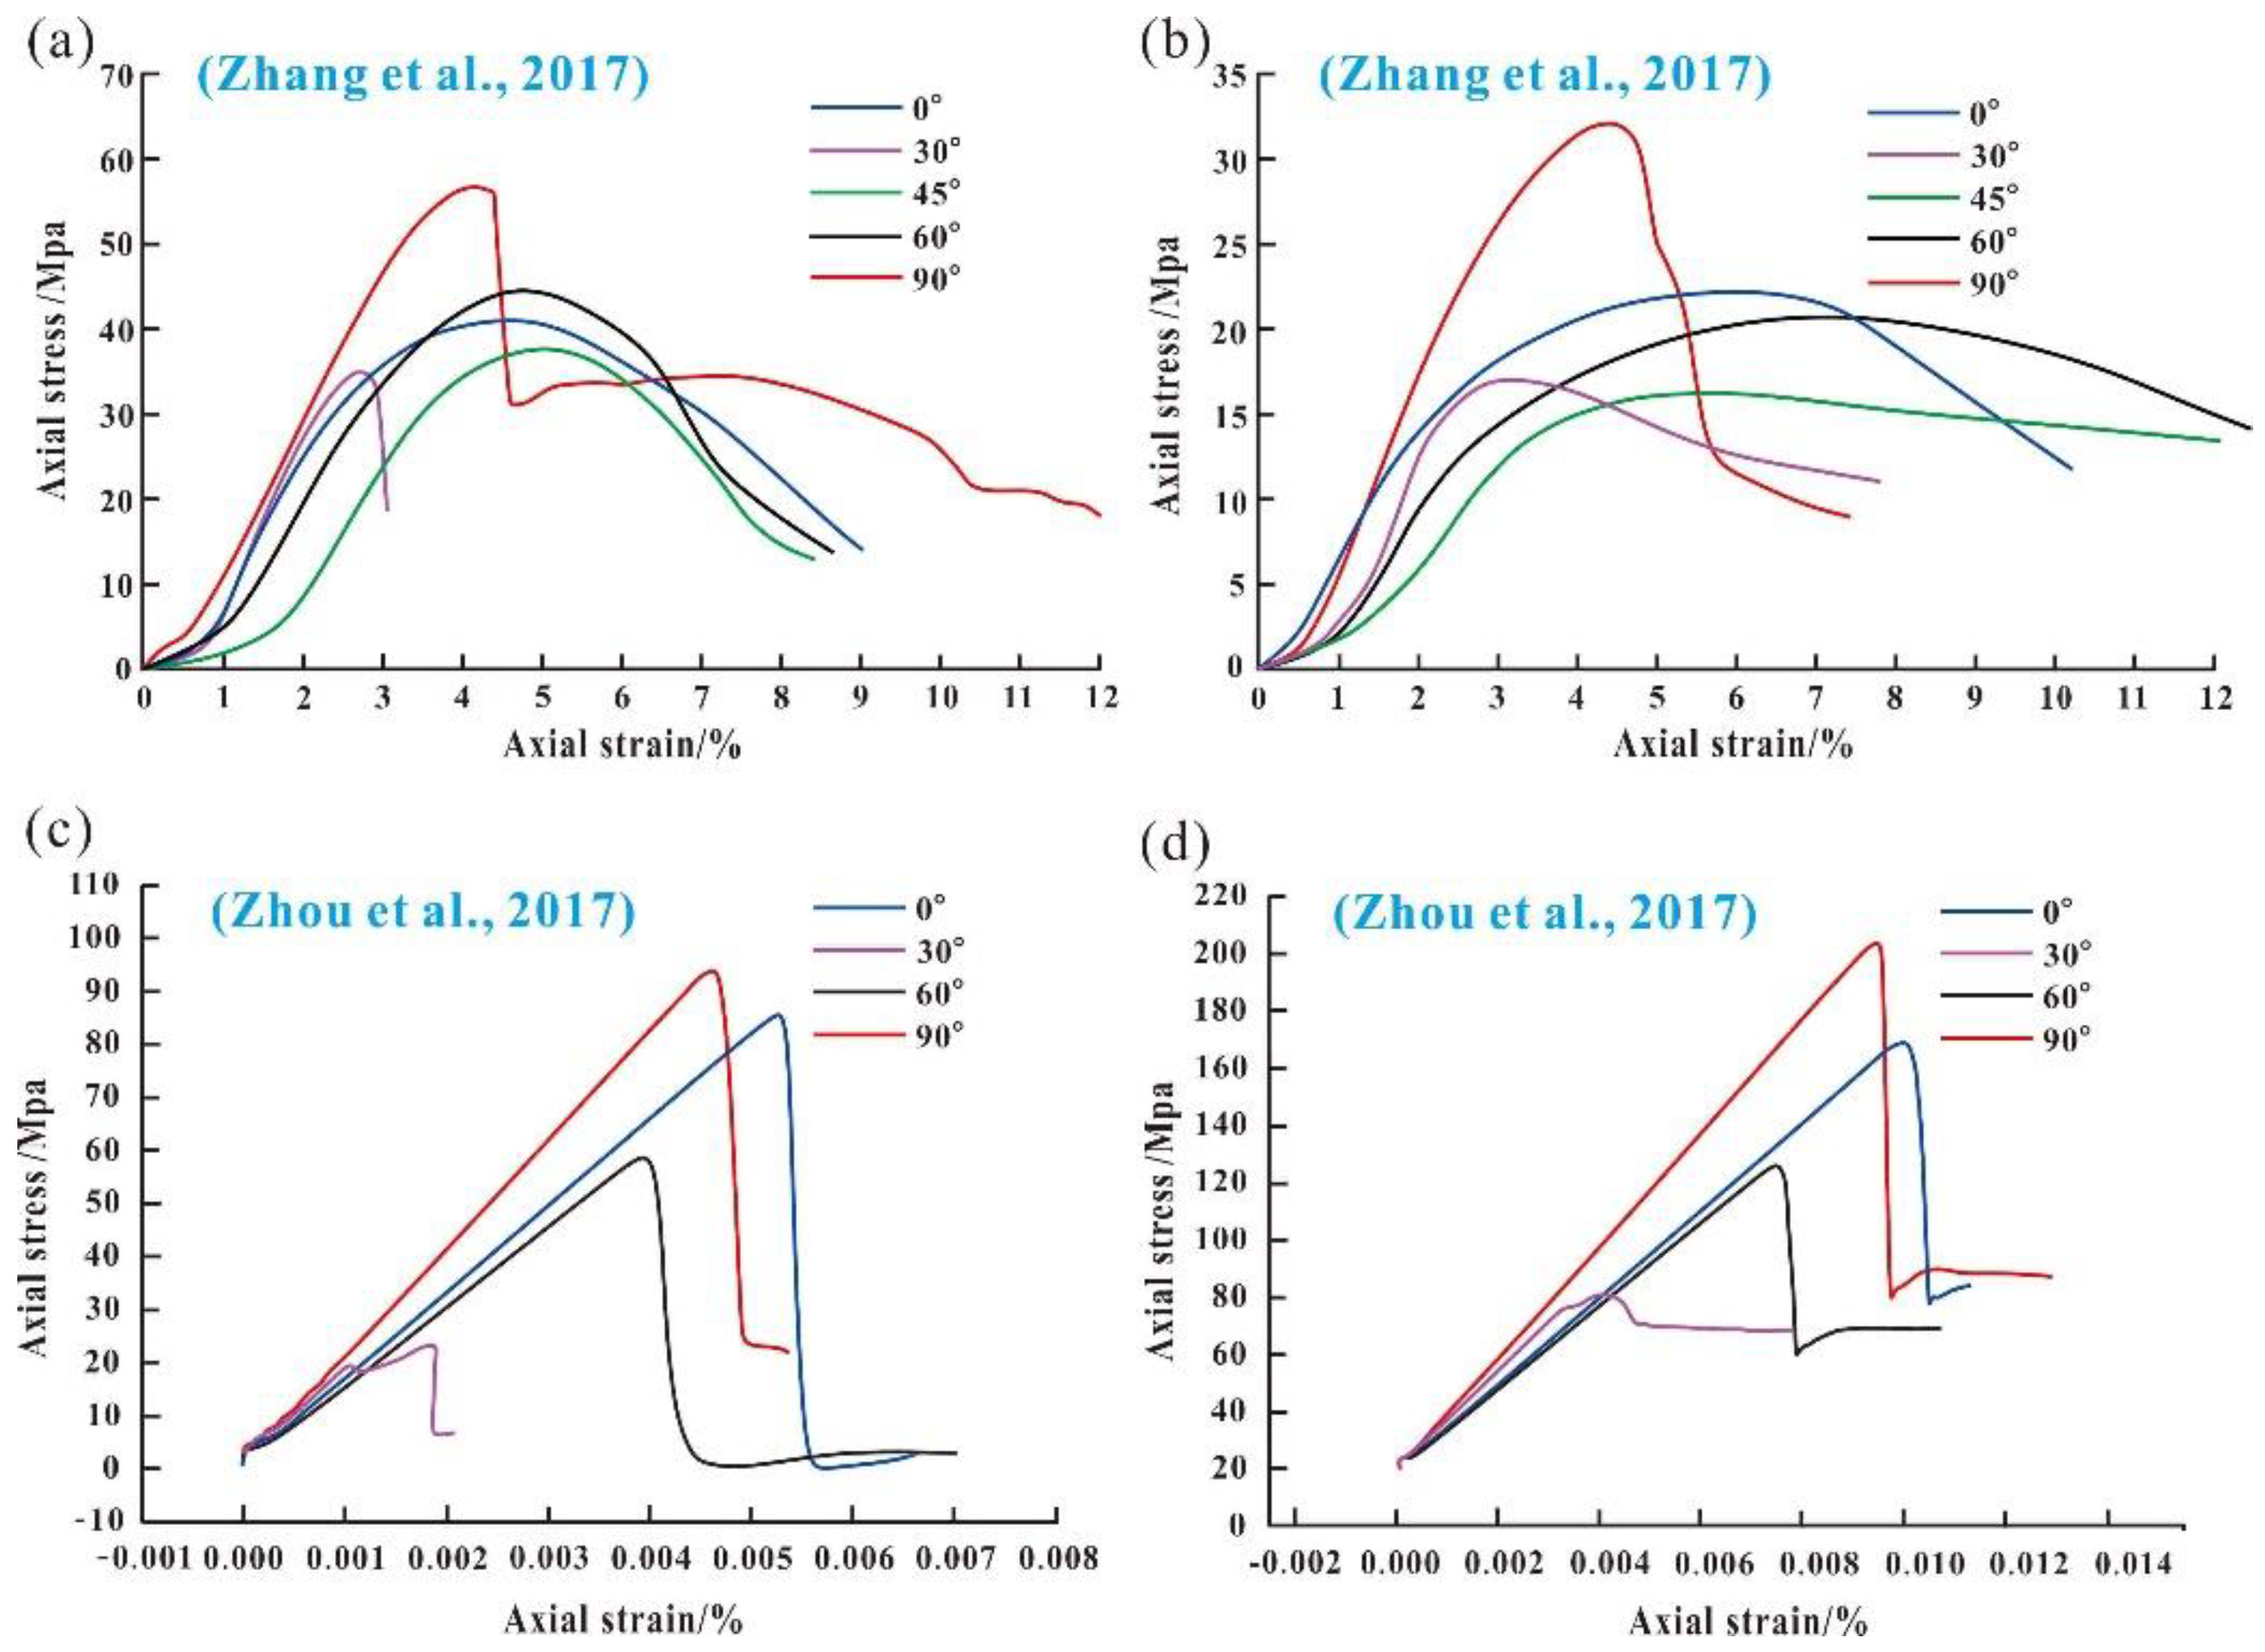
Figure 3.
Function curves of the different failure criteria for the bedding fractures, i.e., the modified T–K criterion in this work, Zhou et al. (2017)’s modified T–K criterion, and the Jaeger criterion [44,47]. Black points indicate the peak strength values of the laminated rock in different confining pressures tested in Zhou et al. (2017).
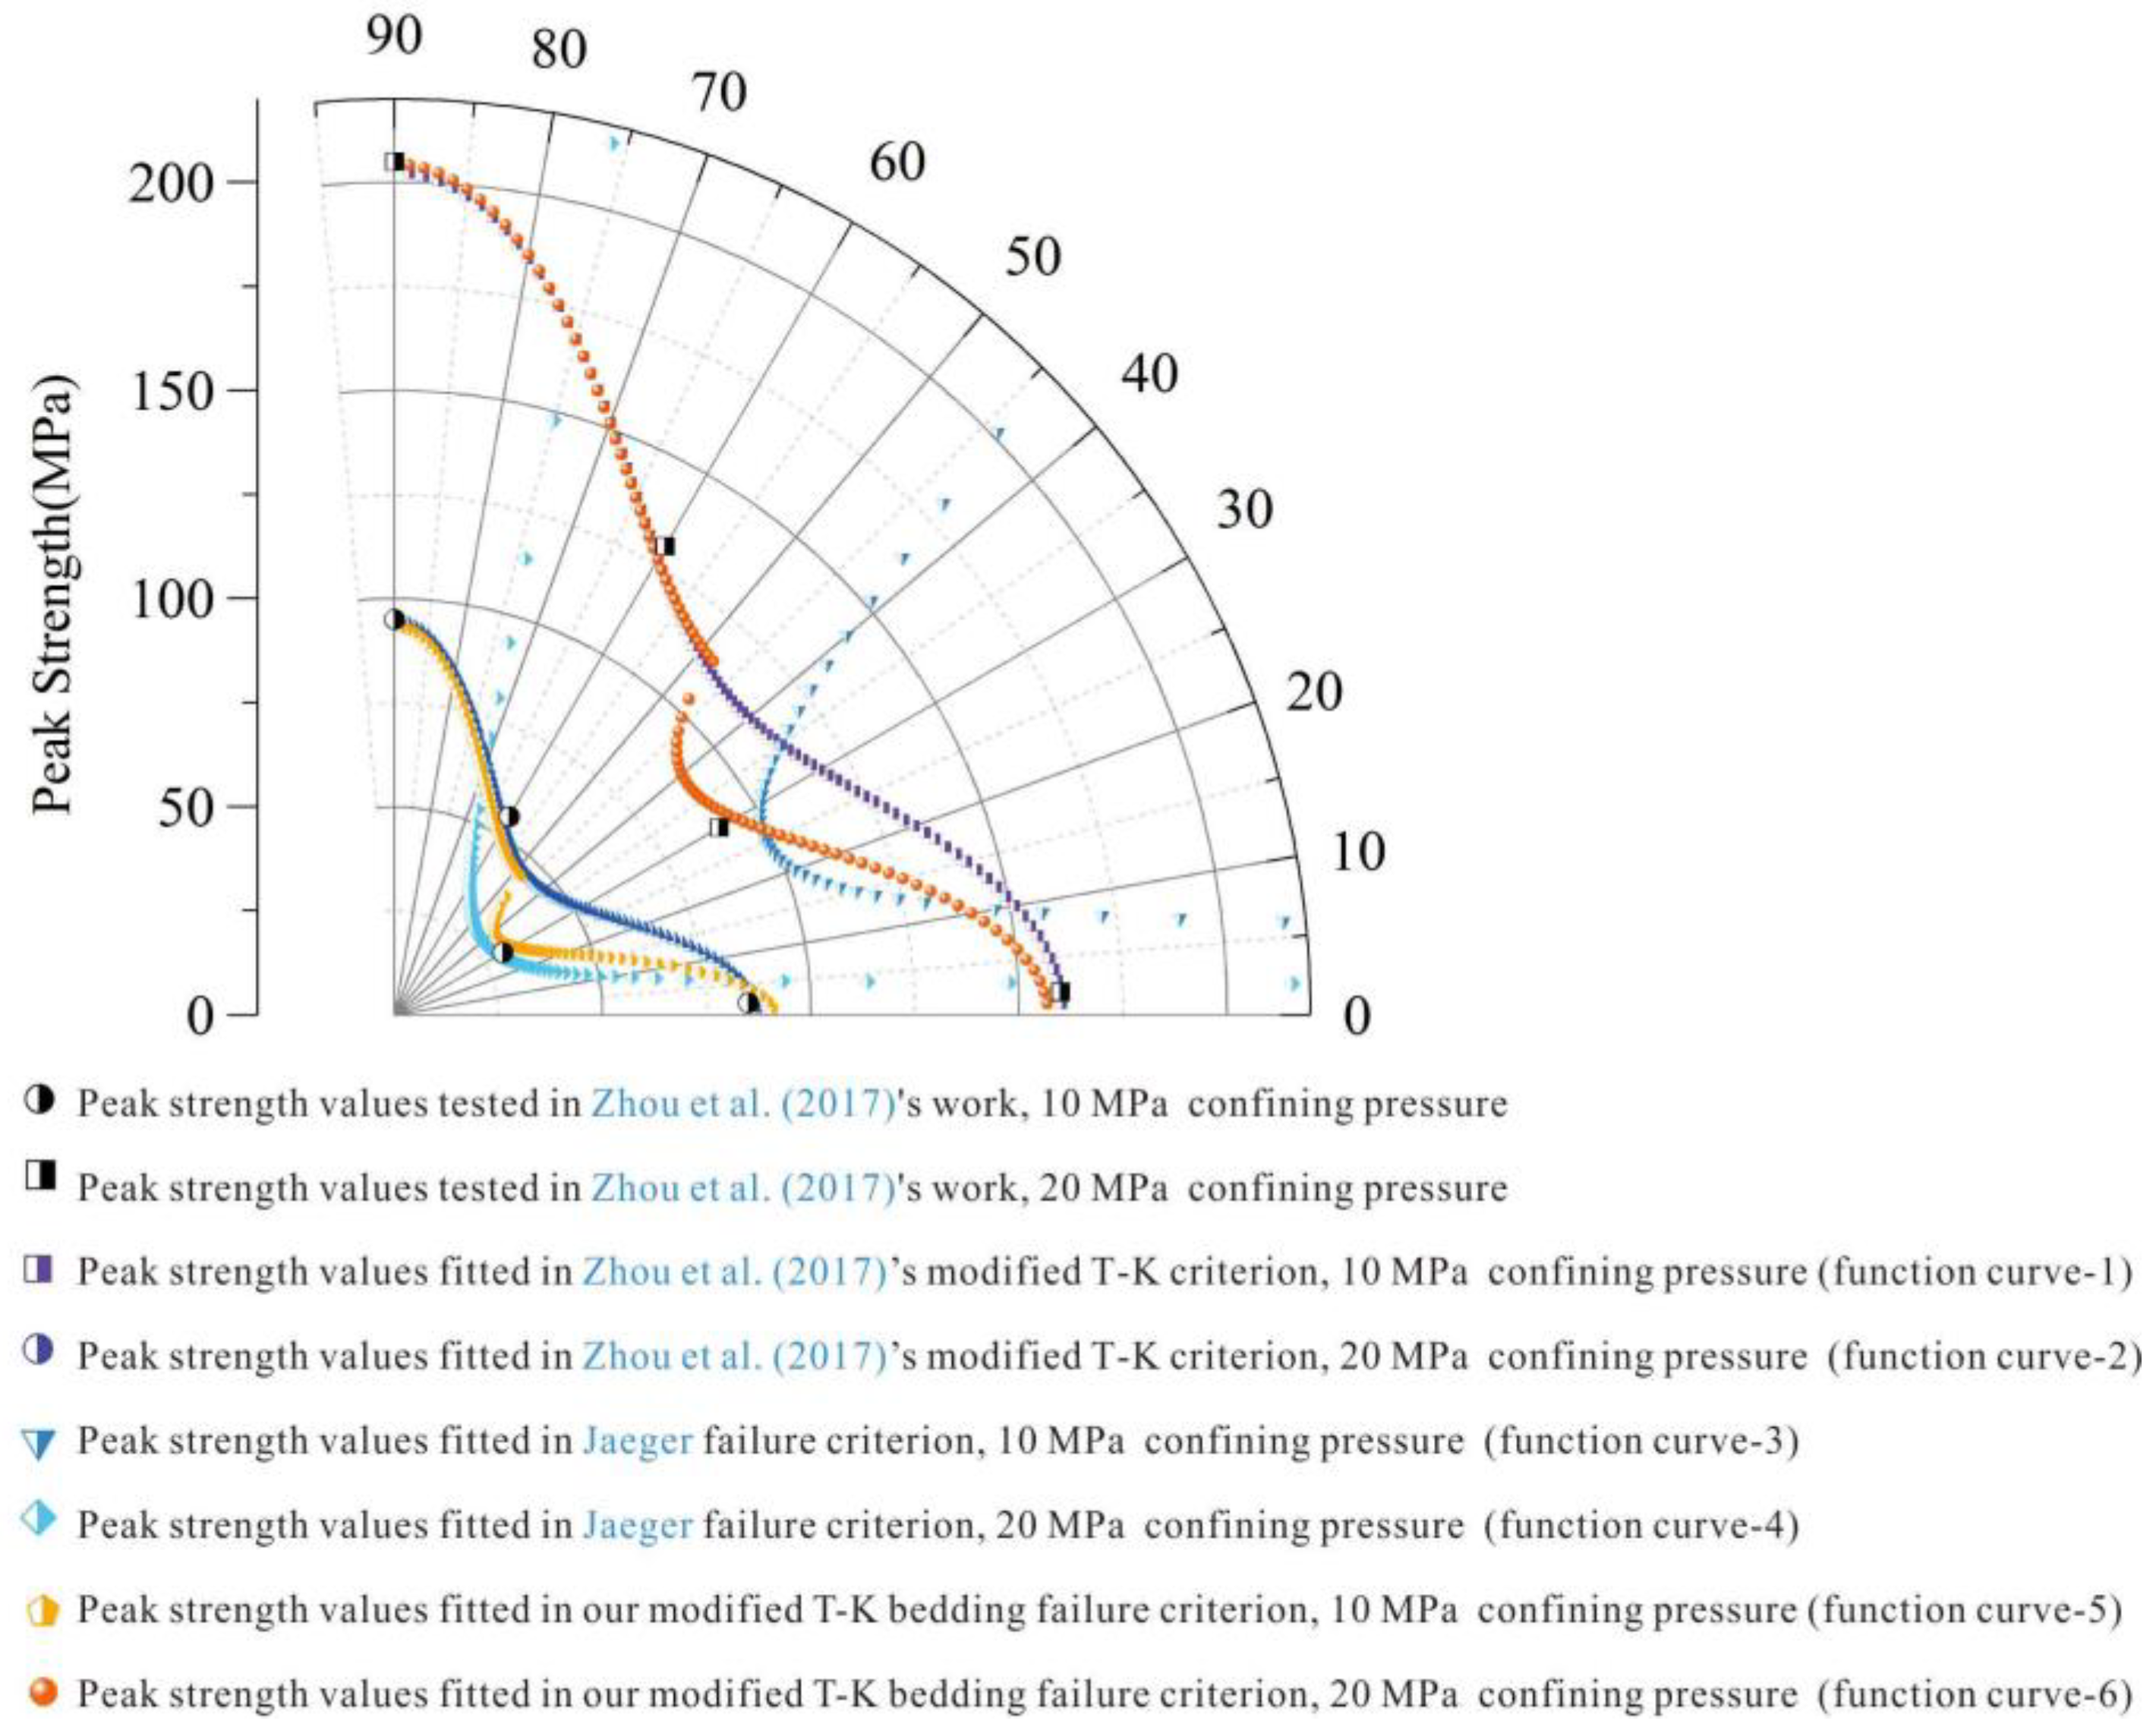
Figure 4.
Stress–strain curves of the six laminated core samples with different lamina angles at a 20 MPa confining pressure. (a) Core-1; (b) Core-2; (c) Core-3; (d) Core-4; (e) Core-5; (f) Core-6. Blue lines indicate those samples in a high lamina angle range, cyan lines indicate those samples in a low lamina angle range, and red lines indicate those samples in a medium lamina angle range.
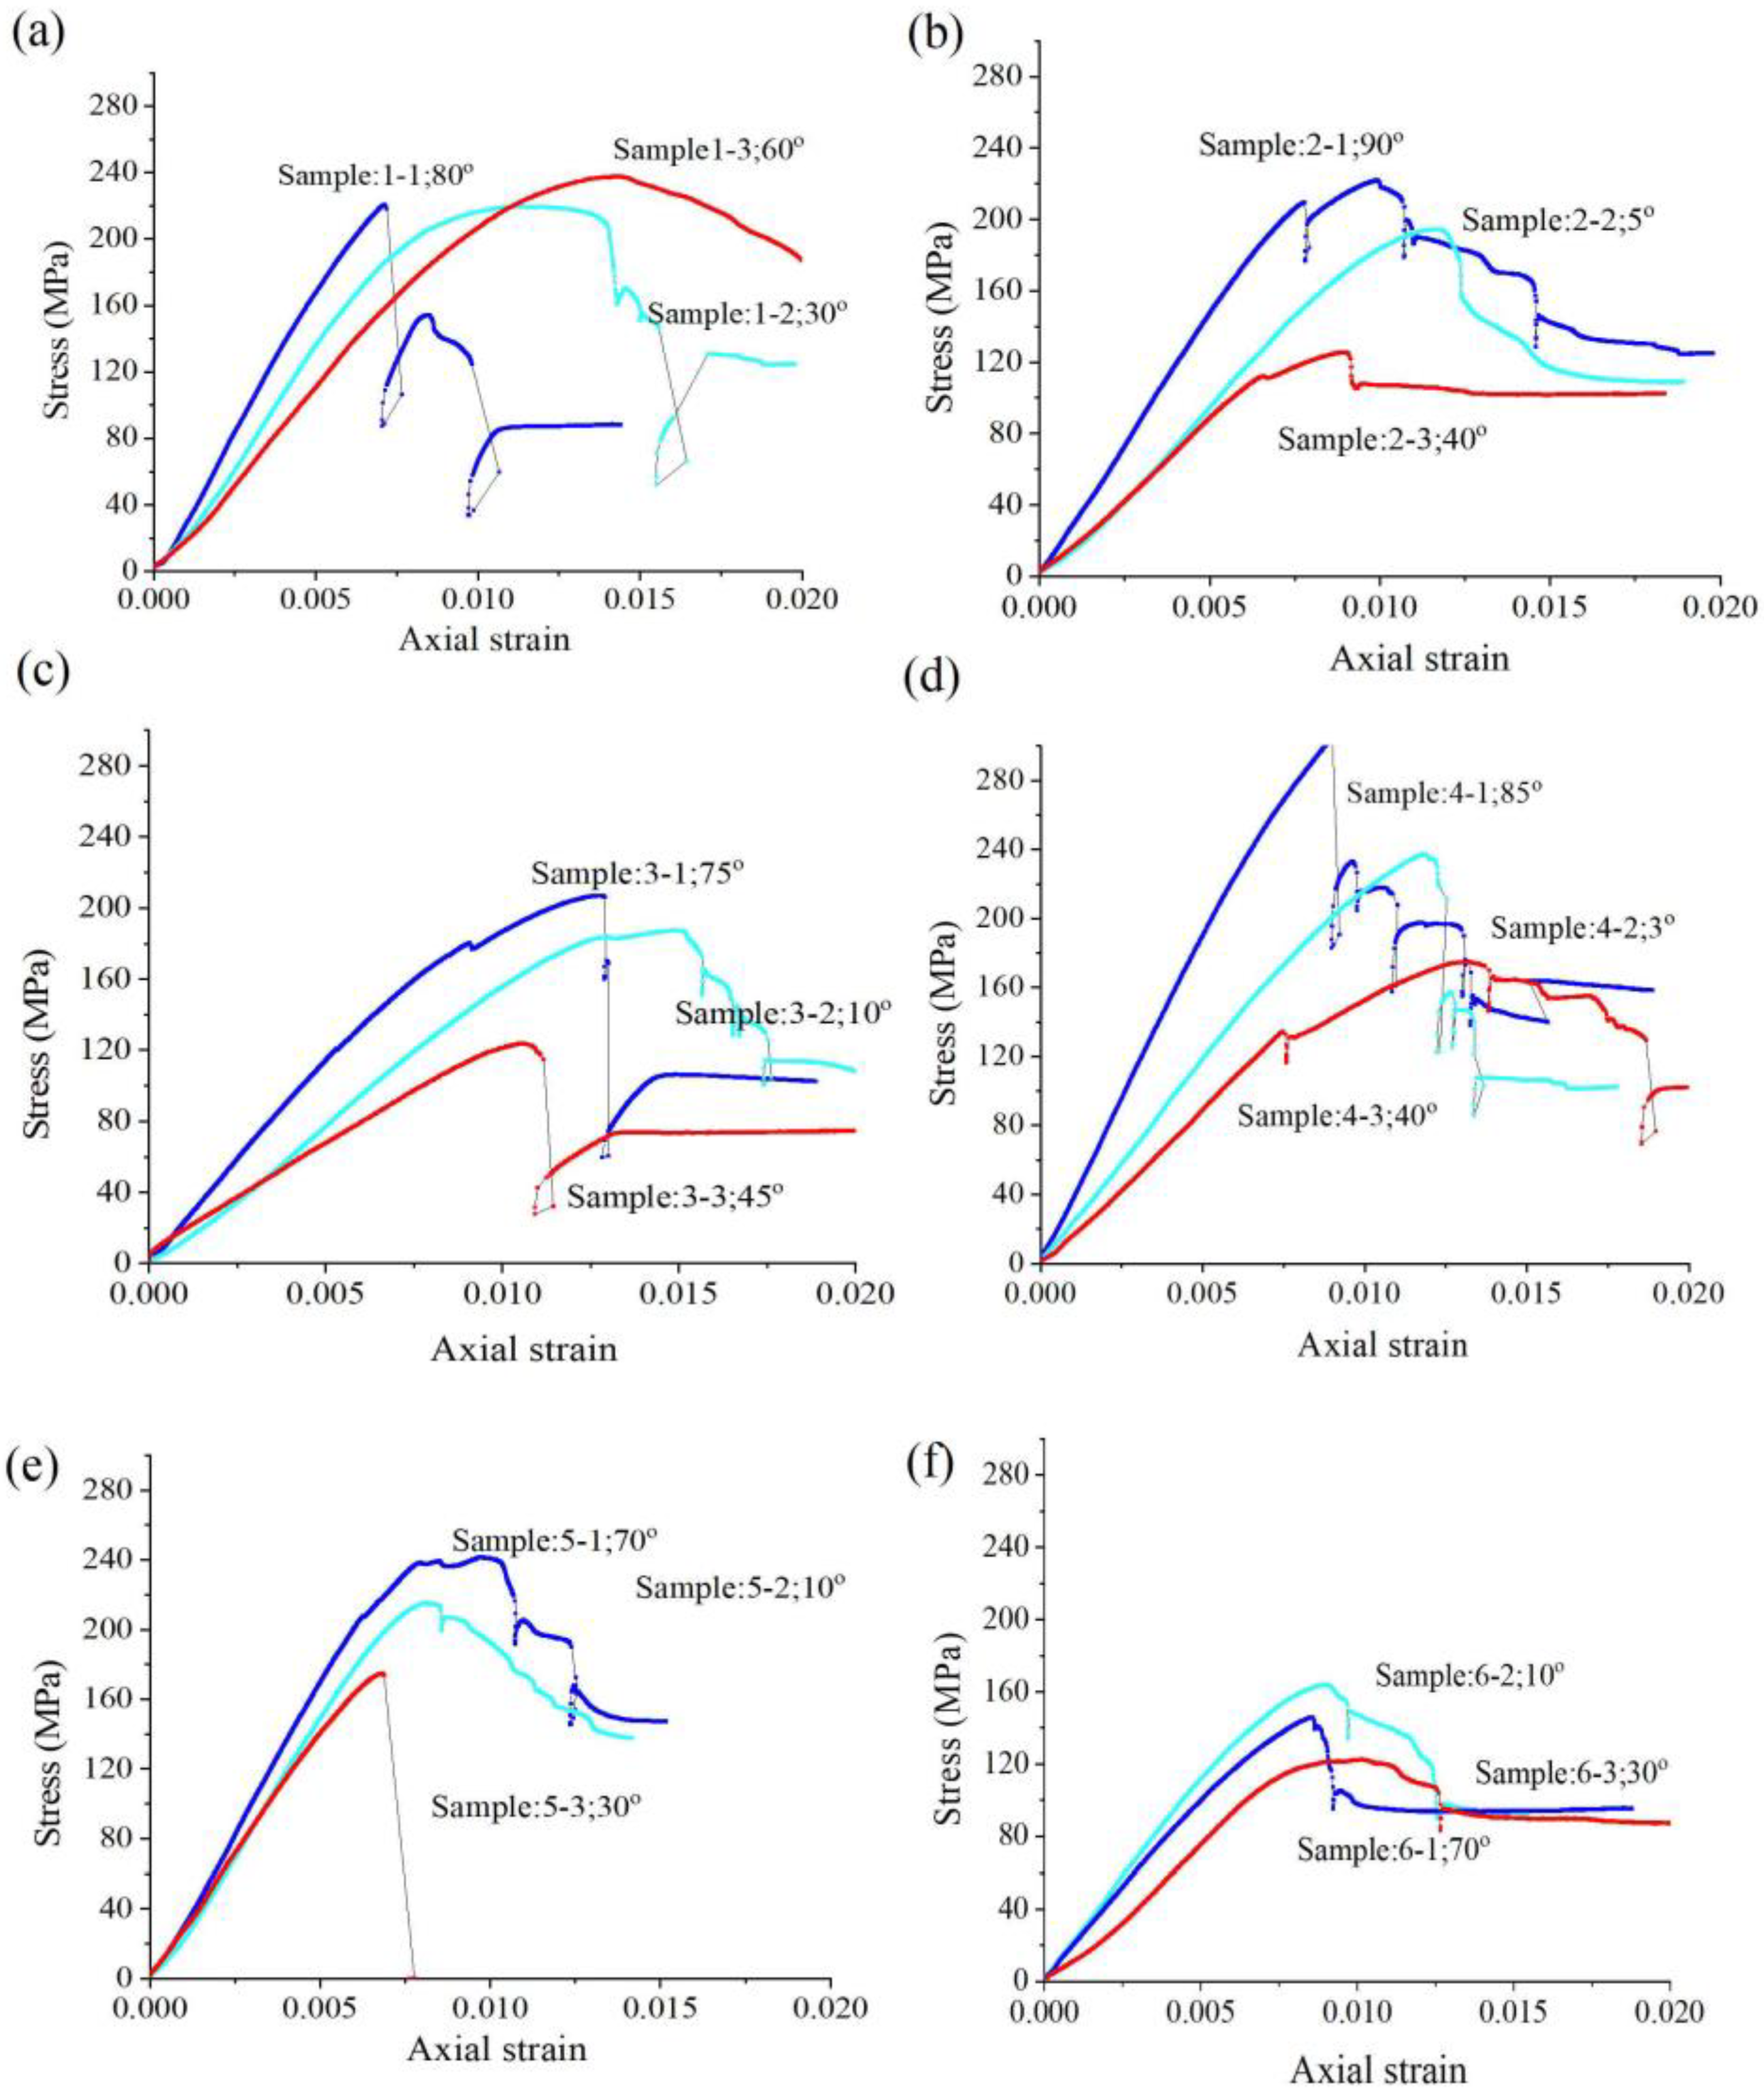
Figure 5.
Function curves calculated with the modified T–K criterion using different lamina coefficients (μlamina). Black points in different shapes indicate the different laminated rocks. Notably, peak strength values of Core-1 (with inconspicuous lamina) in the red points do not agree with the calculated function curves.

Figure 6.
Finite element simulation results of the bedding fractures (i.e., lamina-induced fractures) and the computerized tomography (CT) photos of the fractured laminated samples. The color code for the finite element simulation results of (a,c,e) indicates the fractured index based on the modified T–K criterion. (b,d,f) show the CT photos of fractured samples, and the darker color indicates a bigger fracture aperture.
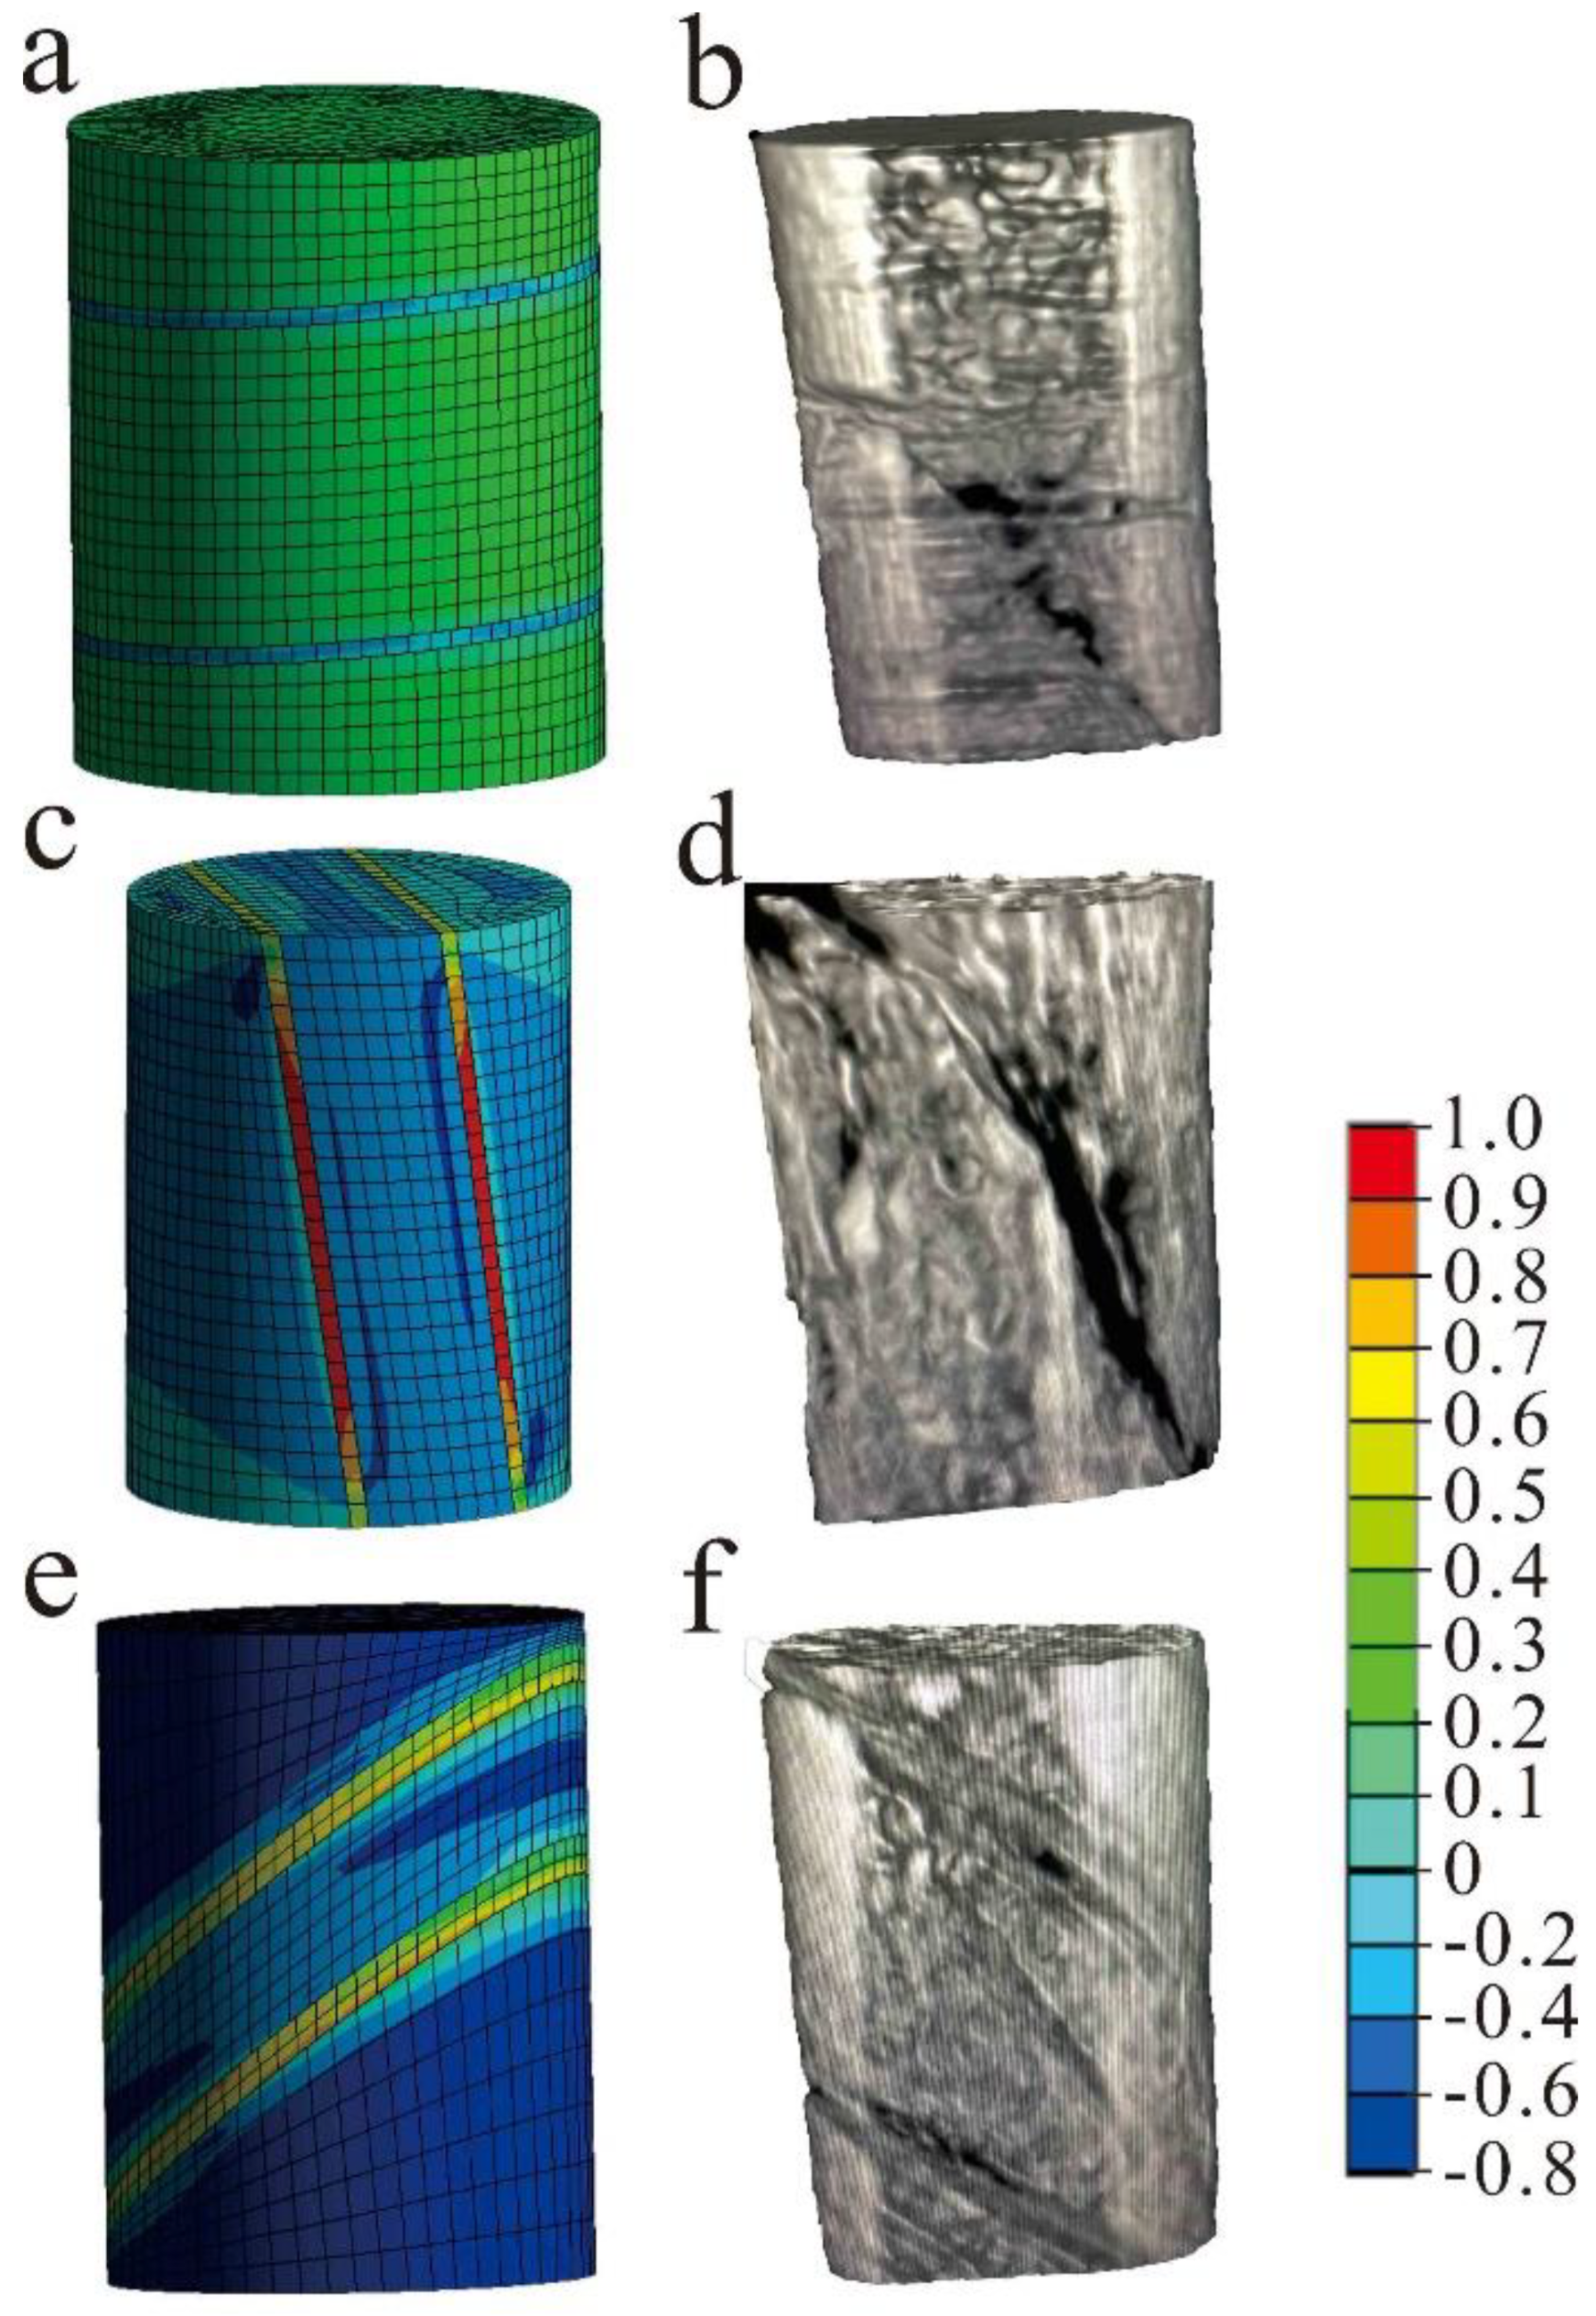
Figure 7.
Calculation parameters used in the bedding fractures simulation. (a,b) Himalayan stress field during the Yanchang Formation simulated in Li et al. (2018) [14]; (c) stratigraphic dip map of tight reservoirs of Yanchang Formation; (d) lamina lithofacies distribution of tight reservoirs of Yanchang Formation.
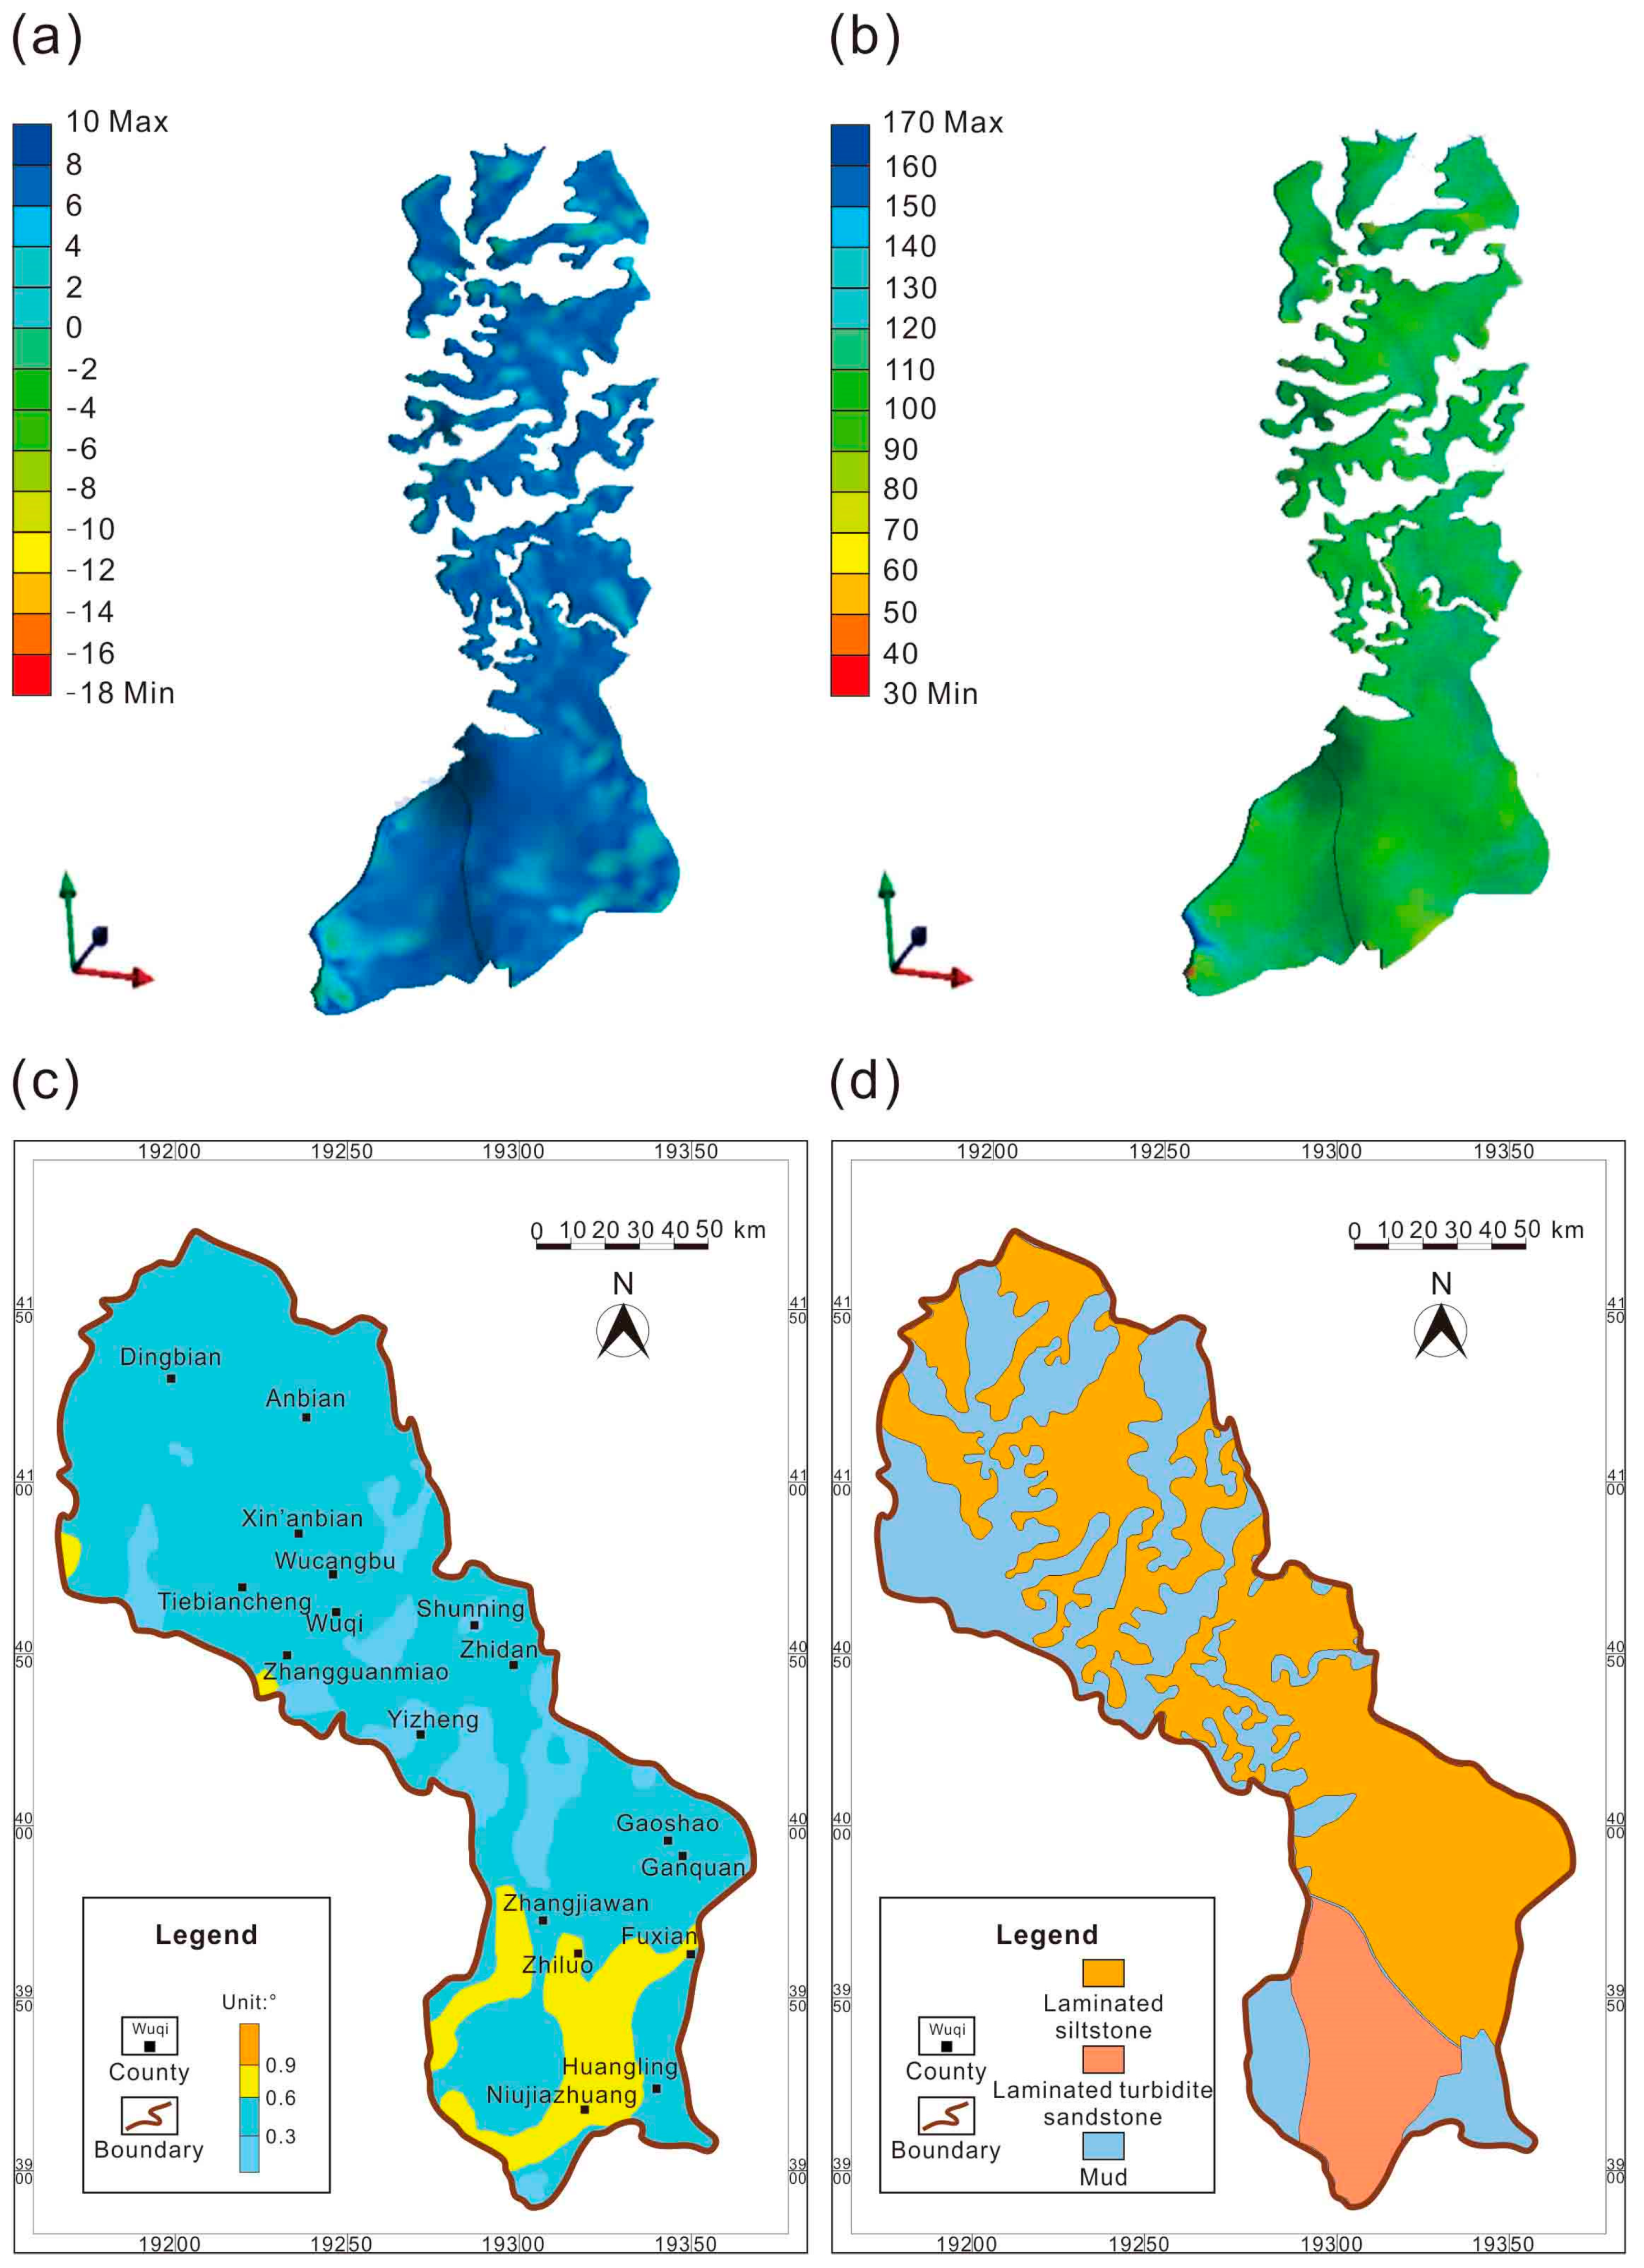
Figure 8.
Bedding fractures distribution of tight sandstone reservoirs of Yanchang Formation in Ordos Basin during the Himalayan episode.
Figure 8.
Bedding fractures distribution of tight sandstone reservoirs of Yanchang Formation in Ordos Basin during the Himalayan episode.

Table 1.
Failure criteria for the bedding fractures proposed by different researchers.
| Criterion | Literature Source |
|---|---|
| [44] | |
| [6] | |
| [47] |
Table 2.
Parameters used to fit the function curves of the failure criteria.
| Criteria | n | k | Φ/° | μlamina | σ3/MPa | Clamina/MPa | S0/MPa | Cj */MPa | φj/° ** |
|---|---|---|---|---|---|---|---|---|---|
| The modified T–K criterion in this study | 8 | 0.5 | 63.5 | 0.1 | 10 | 20 | - | - | - |
| 3.3 | 1.1 | 63.5 | 0.9 | 20 | 20 | - | - | - | |
| Zhou et al. (2017)’s modified T–K criterion [47] | 11 | 3.3 | 63.5 | - | 10 | - | 11 | - | - |
| 2.2 | 1.3 | 63.5 | - | 20 | - | 8 | - | - | |
| Jaeger criterion [44] | - | - | - | - | 10 | - | - | 5 | 12 |
| - | - | - | - | 20 | - | - | 2 | 39.5 |
*: The lamina cohesion in the Jaeger criterion; **: The internal friction angle in the Jaeger criterion.
| Samples | Lamina Angle/° | Peak Strength/MPa | Confining Pressure/MPa |
|---|---|---|---|
| a-0 | 0 | 40.5 | 0 |
| a-30 | 30 | 35 | 0 |
| a-45 | 45 | 37.2 | 0 |
| a-60 | 60 | 44.1 | 0 |
| a-90 | 90 | 56.8 | 0 |
| b-0 | 0 | 22.2 | 0 |
| b-30 | 30 | 17.6 | 0 |
| b-45 | 45 | 17.1 | 0 |
| b-60 | 60 | 20.5 | 0 |
| b-90 | 90 | 32.3 | 0 |
| c-0 | 0 | 85.4 | 10 |
| c-30 | 30 | 23.2 | 10 |
| c-60 | 60 | 59.4 | 10 |
| c-90 | 90 | 94.1 | 10 |
| d-0 | 0 | 168 | 20 |
| d-30 | 30 | 80.4 | 20 |
| d-60 | 60 | 128 | 20 |
| d-90 | 90 | 205 | 20 |
| 1-1 | 80 | 221 | 20 |
| 1-2 | 30 | 220 | 20 |
| 1-3 | 60 | 239 | 20 |
| 2-1 | 90 | 222 | 20 |
| 2-2 | 5 | 195 | 20 |
| 2-3 | 40 | 124 | 20 |
| 3-1 | 75 | 208 | 20 |
| 3-2 | 10 | 189 | 20 |
| 3-3 | 45 | 122 | 20 |
| 4-1 | 85 | 300 | 20 |
| 4-2 | 3 | 234 | 20 |
| 4-3 | 40 | 175 | 20 |
| 5-1 | 70 | 241 | 20 |
| 5-2 | 10 | 218 | 20 |
| 5-3 | 30 | 173 | 20 |
| 6-1 | 70 | 146 | 20 |
| 6-2 | 10 | 162 | 20 |
| 6-3 | 30 | 121 | 20 |
© 2019 by the authors. Licensee MDPI, Basel, Switzerland. This article is an open access article distributed under the terms and conditions of the Creative Commons Attribution (CC BY) license (http://creativecommons.org/licenses/by/4.0/).
Share and Cite
MDPI and ACS Style
Wang, Q.; Li, Y.; Yang, W.; Jiang, Z.; Song, Y.; Jiang, S.; Luo, Q.; Liu, D. Finite Element Simulation of Multi-Scale Bedding Fractures in Tight Sandstone Oil Reservoir. Energies 2020, 13, 131. https://doi.org/10.3390/en13010131
AMA Style
Wang Q, Li Y, Yang W, Jiang Z, Song Y, Jiang S, Luo Q, Liu D. Finite Element Simulation of Multi-Scale Bedding Fractures in Tight Sandstone Oil Reservoir. Energies. 2020; 13(1):131. https://doi.org/10.3390/en13010131
Chicago/Turabian StyleWang, Qianyou, Yaohua Li, Wei Yang, Zhenxue Jiang, Yan Song, Shu Jiang, Qun Luo, and Dan Liu. 2020. "Finite Element Simulation of Multi-Scale Bedding Fractures in Tight Sandstone Oil Reservoir" Energies 13, no. 1: 131. https://doi.org/10.3390/en13010131
Note that from the first issue of 2016, this journal uses article numbers instead of page numbers. See further details here.