Next Article in Journal
Modeling and Enhanced Control of Hybrid Full Bridge–Half Bridge MMCs for HVDC Grid Studies
Previous Article in Journal
Characteristics and Current Harmonic Control of N* Three-Phase PMSG for HVDC Transmission Based on MMC
 
 
Correction published on 5 August 2022, see Energies 2022, 15(15), 5693.
Article

Optimal Operation Strategy of ESS for EV Charging Infrastructure for Voltage Stabilization in a Secondary Feeder of a Distribution System

1
Jeju Global Research Center (JGRC), Korea Institute of Energy Research (KIER), Jeju 63357, Korea
2
Department of Mechanical Design and Robot Engineering, Seoul National University of Science and Technology (SeoulTech), Seoul 01811, Korea
*
Author to whom correspondence should be addressed.
Energies 2020, 13(1), 179; https://doi.org/10.3390/en13010179
Submission received: 21 October 2019 / Revised: 18 December 2019 / Accepted: 27 December 2019 / Published: 1 January 2020 / Corrected: 5 August 2022
(This article belongs to the Section D: Energy Storage and Application)

Abstract

:
The introduction of electrical vehicle charging infrastructure including electric vehicle (EV) charger renewable energy resource at the secondary feeder in a distribution system has been increased as one of countermeasure for global environmental issues. However, the electric vehicle charging (EVC) infrastructure may act as the peak load in the distribution system, which can adversely impact on the voltage stability when the electric vehicle is quickly charged. Therefore, to keep within the limit capacity of a secondary feeder and allowable limit for the feeder voltage, this paper proposes a stabilization method by an energy storage system (ESS) control strategy at the secondary feeder to not exceed the upper limit or fall below the lower limit. In addition, this paper presents an estimation method to keep the proper standard value of the state of charge (SOC). From the simulation results, the voltage stabilization operation by the ESS should make the feeder voltages of the distribution system (secondary feeder) introduced EVC infrastructure keep better voltage conditions. In addition, the estimation method was able to keep the proper standard value confirming that the SOC of the ESS when it is in standby can be kept within the proper reference range. Therefore, it is confirmed that this strategy is an effective tool to solve the voltage problems by ESS.

1. Introduction

As power systems have been deregulated and decentralized according to technological development of small-scale electric vehicle charging infrastructure, including electric vehicle (EV) chargers, renewable energy resources (RES) have been actively interconnected and operated at the secondary feeder in distribution systems. Therefore, many power quality and allowable capacity problems, such as voltage variations and acceptable capacity in the secondary feeder, may occur when the electric vehicle charging (EVC) infrastructure, including RES, are interconnected at the secondary feeder in the distribution system [1,2,3,4]. Specifically, when the EV infrastructure, including the RES, is operated in the secondary feeder, the feeder voltage is increased or decreased more than the allowable limit by the EV charging capacity and the output of the renewable energy resource. As a result, electrical components connected to the EVC infrastructure, such as electrical devices, protectors, and RESs, can malfunction or disconnect from the grid, adversely affecting the power system. For example, when the output of renewable energy is better than customer power, the feeder voltage is increased by the reverse power flow. Furthermore, when the EV charge capacity and the customer power are increased, the feeder voltage has a characteristic which causes it to be dropped by a heavy load.
A charging price based EVC strategies has been proposed to mitigate the impacts of EV charging on the distribution system [5,6,7,8,9,10,11,12]. In [5], EV charging demand is constructed using the route characteristics of EV users, and the charging price is determined considering the voltage deviation of the distribution system. Therefore, the area where a high EV charge demand is expected is priced higher, and accordingly, the EV charging demand becomes low so that grid voltage could remain in a stable range. A time-of-use (TOU) pricing scheme is introduced to decrease the peak load demand and alleviate overloading on the transformer [6,7,8,9,10,11]. In addition, an automatic demand response (ADR) strategy was proposed as a real-time price-based method [12], minimizing the cost of the EV charging price, while increasing self-consumption of photovoltaics (PV) generation, and reducing the impact on the voltage of the distribution system. However, the above studies have a limitation which is that it is difficult to respond immediately to the voltage fluctuations caused by the EV charging loads in the distribution system.
In another approach, the EV battery charging process in EV chargers is operated to support grid voltage. The fast-charging station (FSC) is composed of two converters, Alternating Current (AC)/Derect Current (DC) and DC/DC internally [13,14,15]. The grid-connected converter (AC/DC) is controlled to inject the reactive power into the grid for voltage regulation, and the EV charger (DC/DC) performs the charging process based on a constant current/reduced constant current method [13,14]. These studies have addressed the bi-directional EV charger concept to improve grid voltage quality. In [15], a decoupled concept between the grid side converter and EV chargers was suggested. The grid side converter is in charge of reactive power, AC system voltage, and DC-link voltage. And EV chargers control the constant voltage (CV) and constant current (CC) to the EV battery. Despite the advantages of directly controlling the grid voltage by supplying reactive power, the above studies have constraints on the use of the commercial product due to the DC-link voltage and the need for customized EV chargers. The relevant studies mentioned above are summarized in Table 1. Therefore, to keep within the limit capacity of the secondary feeder and allowable limit for feeder voltage, this paper proposes a stabilization method at the secondary feeder by an energy storage system (ESS) control strategy which is operated as the charging mode when RES output is exceeded for the feeder capacity, or the discharge mode when customer power and EV power are higher than limit capacity of feeder.
This paper presents the electric vehicle infrastructure stabilization (EVI) algorithm to keep an allowable limit for power and voltage at the secondary feeder through the ESS introduction with an electric vehicle and renewable energy resource at the end of the section. In addition, this paper proposes the estimation method to keep the proper standard value of the state of charge (SOC) (it is named the state of reference, SOR) considering ESS operation conditions while the voltage is in a stable range. Based on the EVI algorithm and SOR algorithm simulated by MATLAB/SIMULINK software, it is confirmed that feeder voltages in the distribution system (secondary feeder) can be maintained within allowable limits and to keep the SOC the in proper range. Meanwhile, the voltage stabilization operation by ESS should enable the feeder voltages of the distribution system (secondary feeder) integrated with EVC infrastructure to keep the voltage in normal conditions. Furthermore, the ability of the estimation method to keep the proper value of the SOC and that the SOC of the ESS can be maintained exactly within the proper reference range to enable the operation at any time under the coordination operation situation of an EVI is confirmed.
The paper is organized as follows: The next section explains the necessity of ESS for voltage regulation. Section 3 presents the line impedance decision algorithm, and the proposed optimal operation algorithm of ESS for voltage regulation is presented in Section 4. Section 5 presents the modeling of electric vehicle charging infrastructure at the secondary feeder. Finally, the conclusions close the paper.

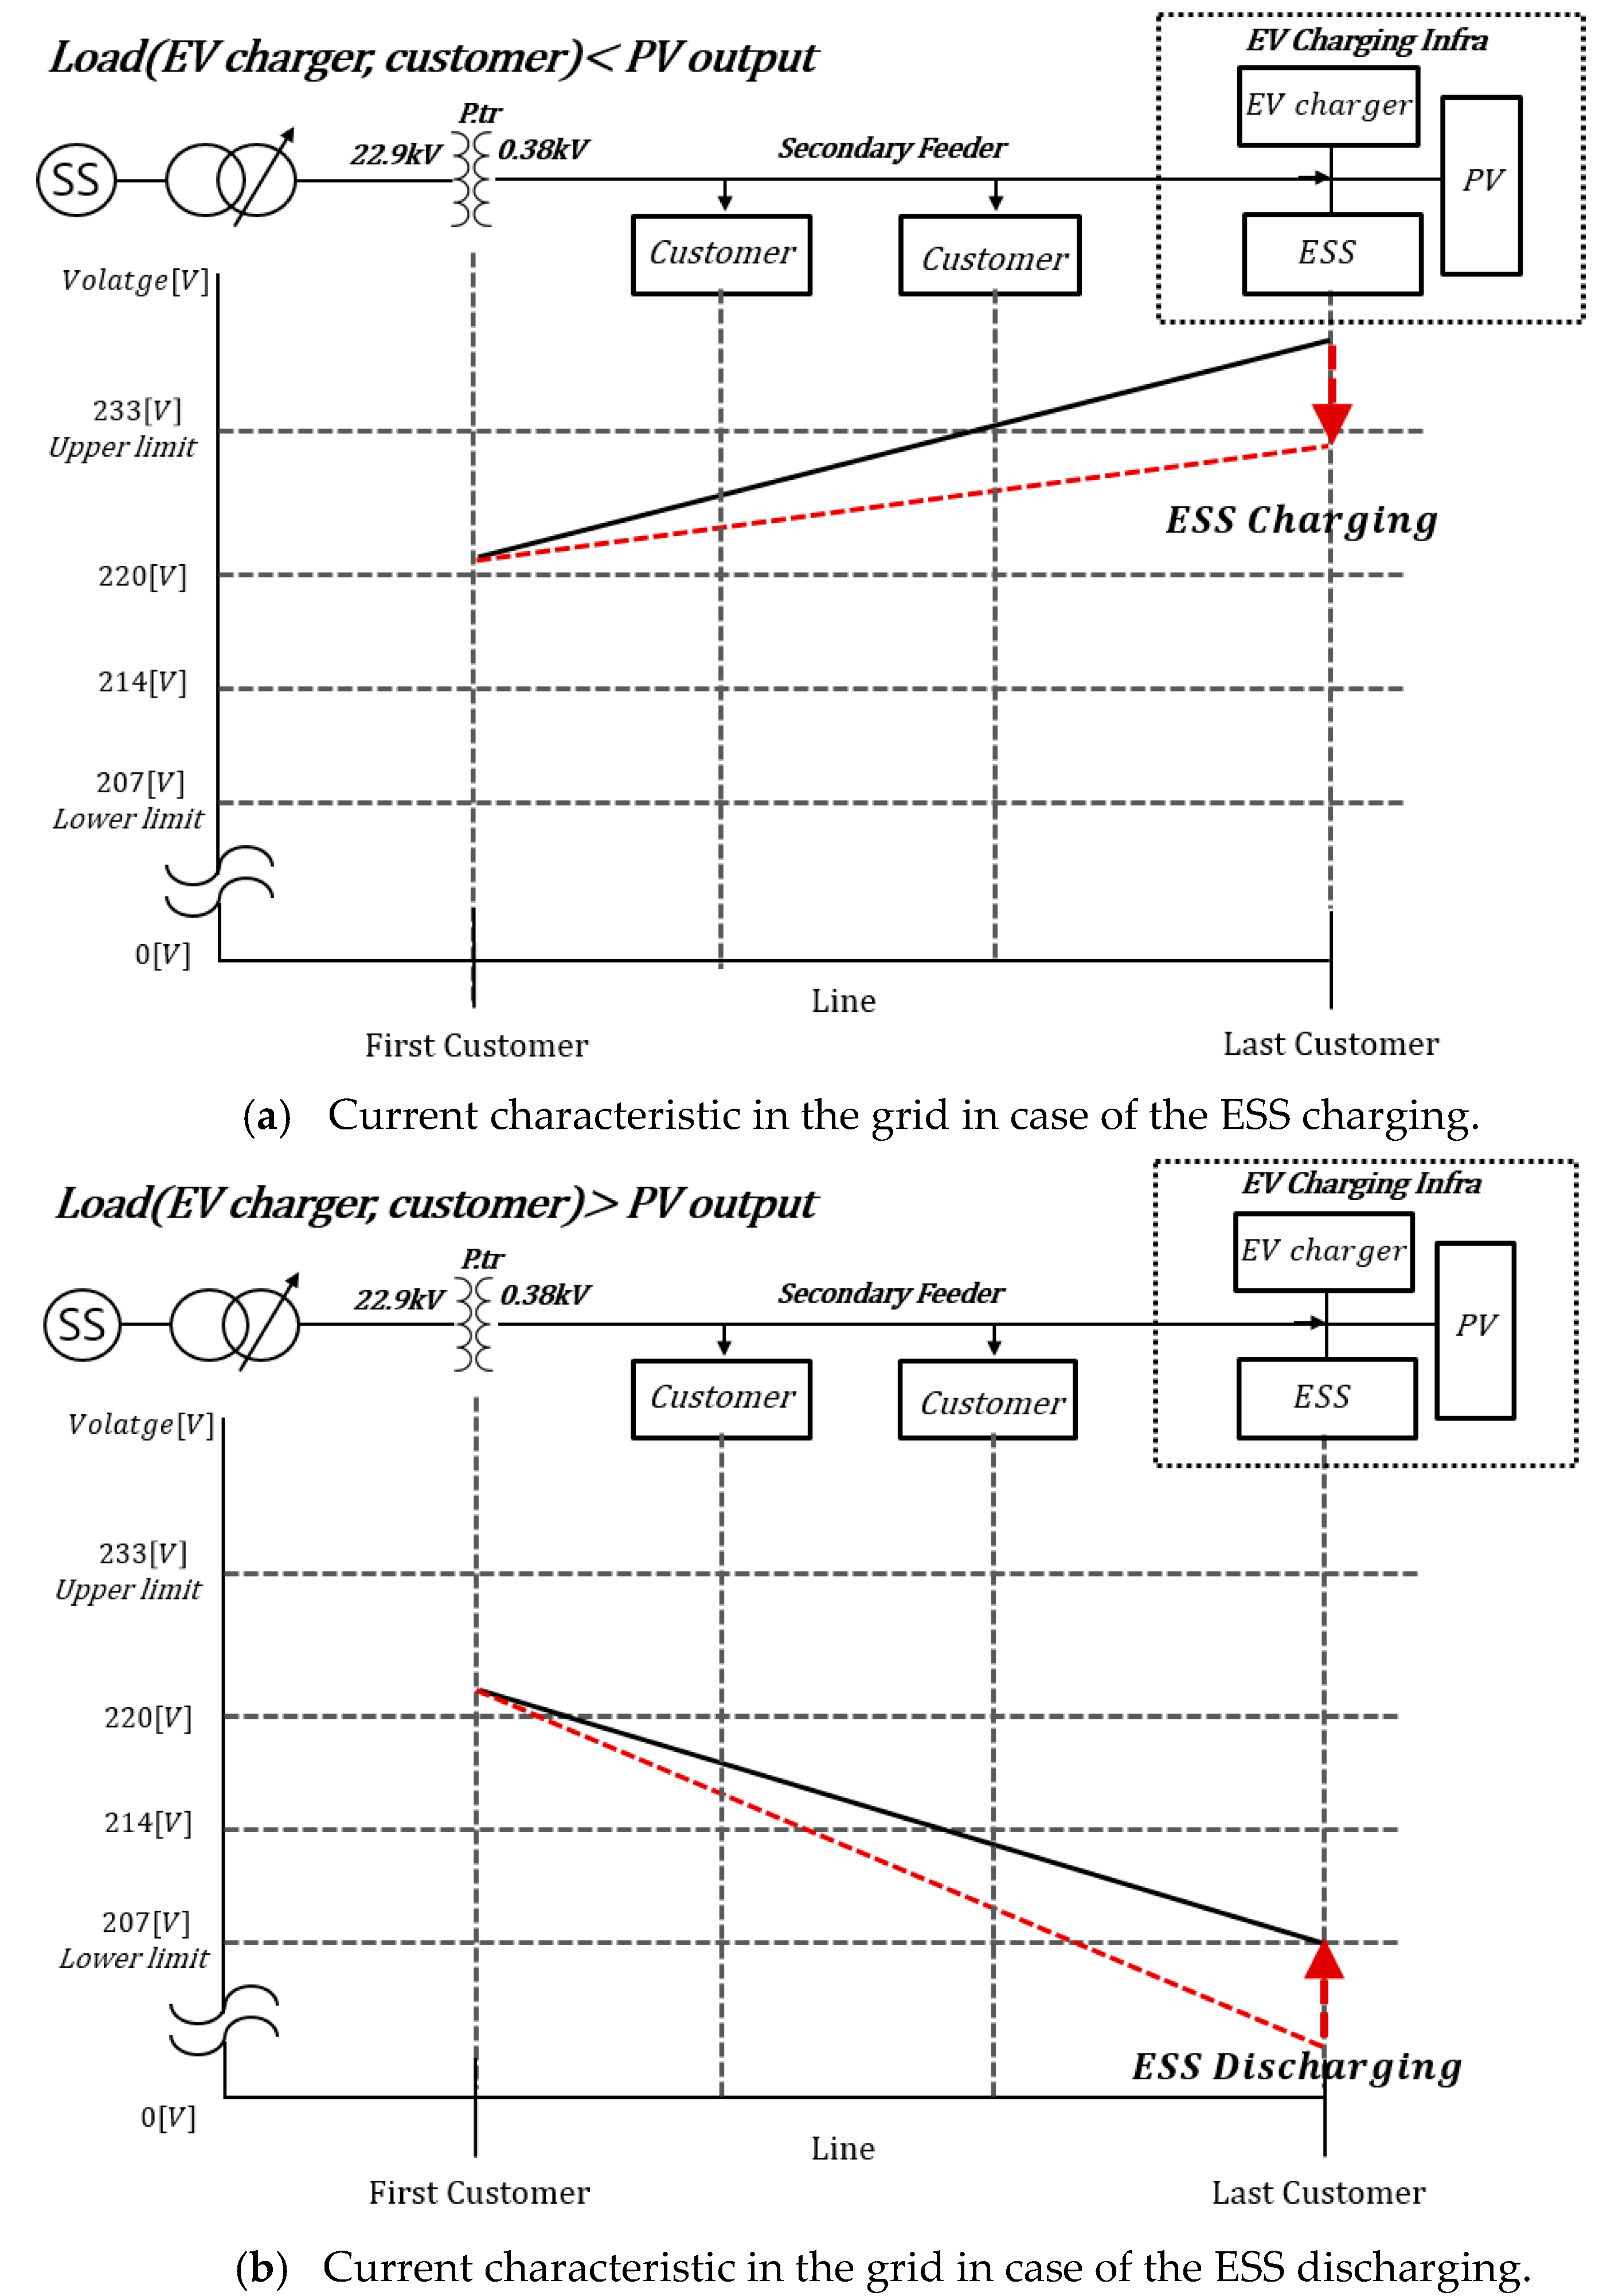
2. Introduction Necessity of an ESS for Voltage Regulation at the Secondary Feeder with EV Infrastructure

When the electric charging system, including a renewable energy resource, is operated in the secondary feeder, the feeder voltage is increased or decreased more than allowable limit by the EV charging capacity and the output of the renewable energy resource. For example, when the output of the renewable energy is higher than the customer power, the feeder voltage is increased by the reverse power flow. In addition, when the EV charge capacity and the customer power are increased, the feeder voltage has a characteristic which causes it to be dropped by the heavy load. Therefore, to keep within the limit capacity of the secondary feeder and the allowable limit for feeder voltage, this paper proposes a stabilization method at the secondary feeder by an ESS control strategy which is operated as the charging mode when RES output violates the feeder capacity, as shown in Figure 1. Furthermore, the discharge mode when customer power and EV power is higher than the limit capacity of the feeder is controlled. In addition, this paper presents an estimation method to keep the proper standard value of the SOC considering ESS operation conditions when ESS is not operated by the voltage stabilization function.
Meanwhile, the voltage stabilization method by an ESS is based on the principle of the following feeder voltage characteristics. The feeder current of each section is controlled by the operation of the ESS such that the feeder current decreases when the ESS is operated in discharging mode, as shown in Figure 2b and the feeder current increases in the case where the ESS is operated in charging mode, as shown in Figure 2a. At this time, the secondary feeder voltages are dropped or raised by the relationship between fixed impedance and the current capacity at the prior sections of an ESS site.
Therefore, this paper presents a method to expand the acceptance of EV charging infrastructure through ESS operation, and presents a stabilization strategy of power to keep the feeder voltage within the allowable limit in the secondary feeder. Furthermore, this paper proposes the proper standard range of ESS SOC to operate the ESS at all times.

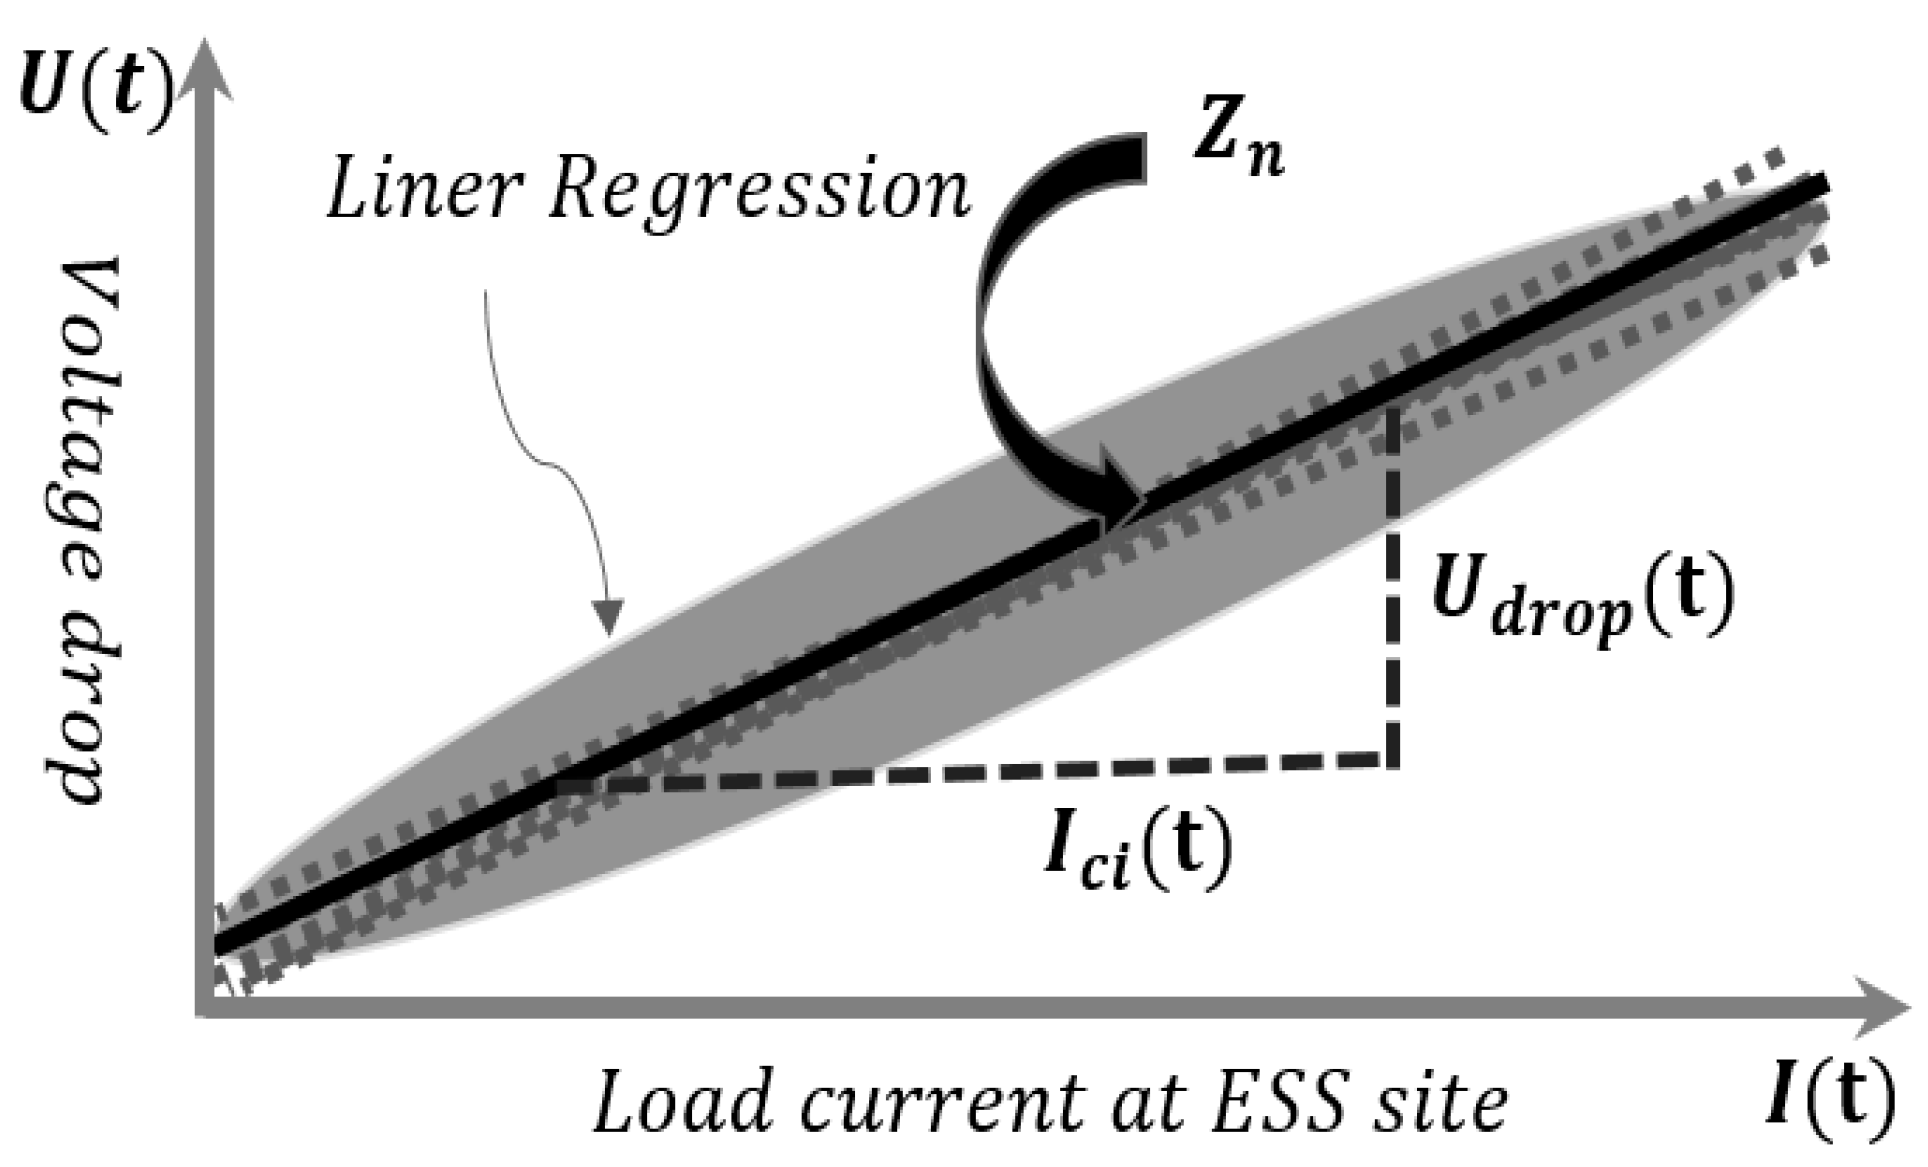
3. Line Impedance Decision Algorithm for Operation of Voltage Stabilization ESS

The feeder voltage of the distribution system is changed by the current magnitude with a variation value and the line impedance with a fixed value. At this time, the feeder voltage has a characteristic which is increased by the reverse power flow when the output of renewable energy is better than the customer power and is dropped by the heavy load when the EV charge capacity and the customer power are increased. Under this concept, to present a stabilization strategy of voltage to keep the feeder voltage within the allowable limit in the secondary feeder, the decision problem of line impedance is very important in the proposed algorithm.
Therefore, to operate the ESS introduced in the electric charging system, this paper presents a method to determine the line impedance based on the voltage and the passing current on the existing secondary feeder with a RES and EV infrastructure. Specifically, the optimal line impedance value has a general relationship with the pole transformer voltage and power common coupling voltage at the EVS infrastructure, including passing current, as shown in Equation (1). Therefore, the optimal line impedance values can be calculated by solving the equation for U p . t r , U c i , and I c i .
Obj . to   Z n = l r [ t = 0 m i = 1 n U p . t r ( t ) U c i ( t ) I c i ( t ) × COS θ c i ( t ) ] ,
where Z n is the line impedance value, l r is the liner regression method, U p . t r ( t ) is the pole transformer voltage, U c i ( t ) is the power common coupling voltage at EV infrastructure, I c i ( t ) is the passing current at the secondary feeder, COS θ c i ( t ) is the lower factor at the secondary feeder, m is the measuring time, n is the ESS site (EV infrastructure) section number of the secondary feeder.
Solving the equation for Z n in Equation (1) cannot provide a linear function and has a wide distribution characteristic, as depicted in Figure 3. Therefore, the solution of optimal line impedance values is equivalent to finding coefficients of the first order equation of Equation (2). It is desirable to minimize the differences between the optimal line impedance value and the first order equation. The least square method (LSM) is introduced to find the optimal line impedance. The squared summation of differences is formulated as:
M i n   q = t = 1 T [ Z n ( t ) U d r o p ( t ) I c i ( t ) ] 2 Subj .   to   U d r o p ( t ) = U p . t r ( t ) U c i ( t ) ,
where q is the error function, and T is the total number of the time interval.
By minimizing q in Equation (3), Zn can be obtained as:
Z n = [ t = 1 m ( i = 1 n ( ( U p . t r ( t ) U c i ( t ) ) × COS θ c i ( t ) ) T t = 1 m ( ( U p . t r ( t ) U c i ( t ) ) × COS θ c i ( t ) ) ] ( t = 1 m I c i ( t ) ) 2 T ( t = 1 m I c i ( t ) ) 2 .

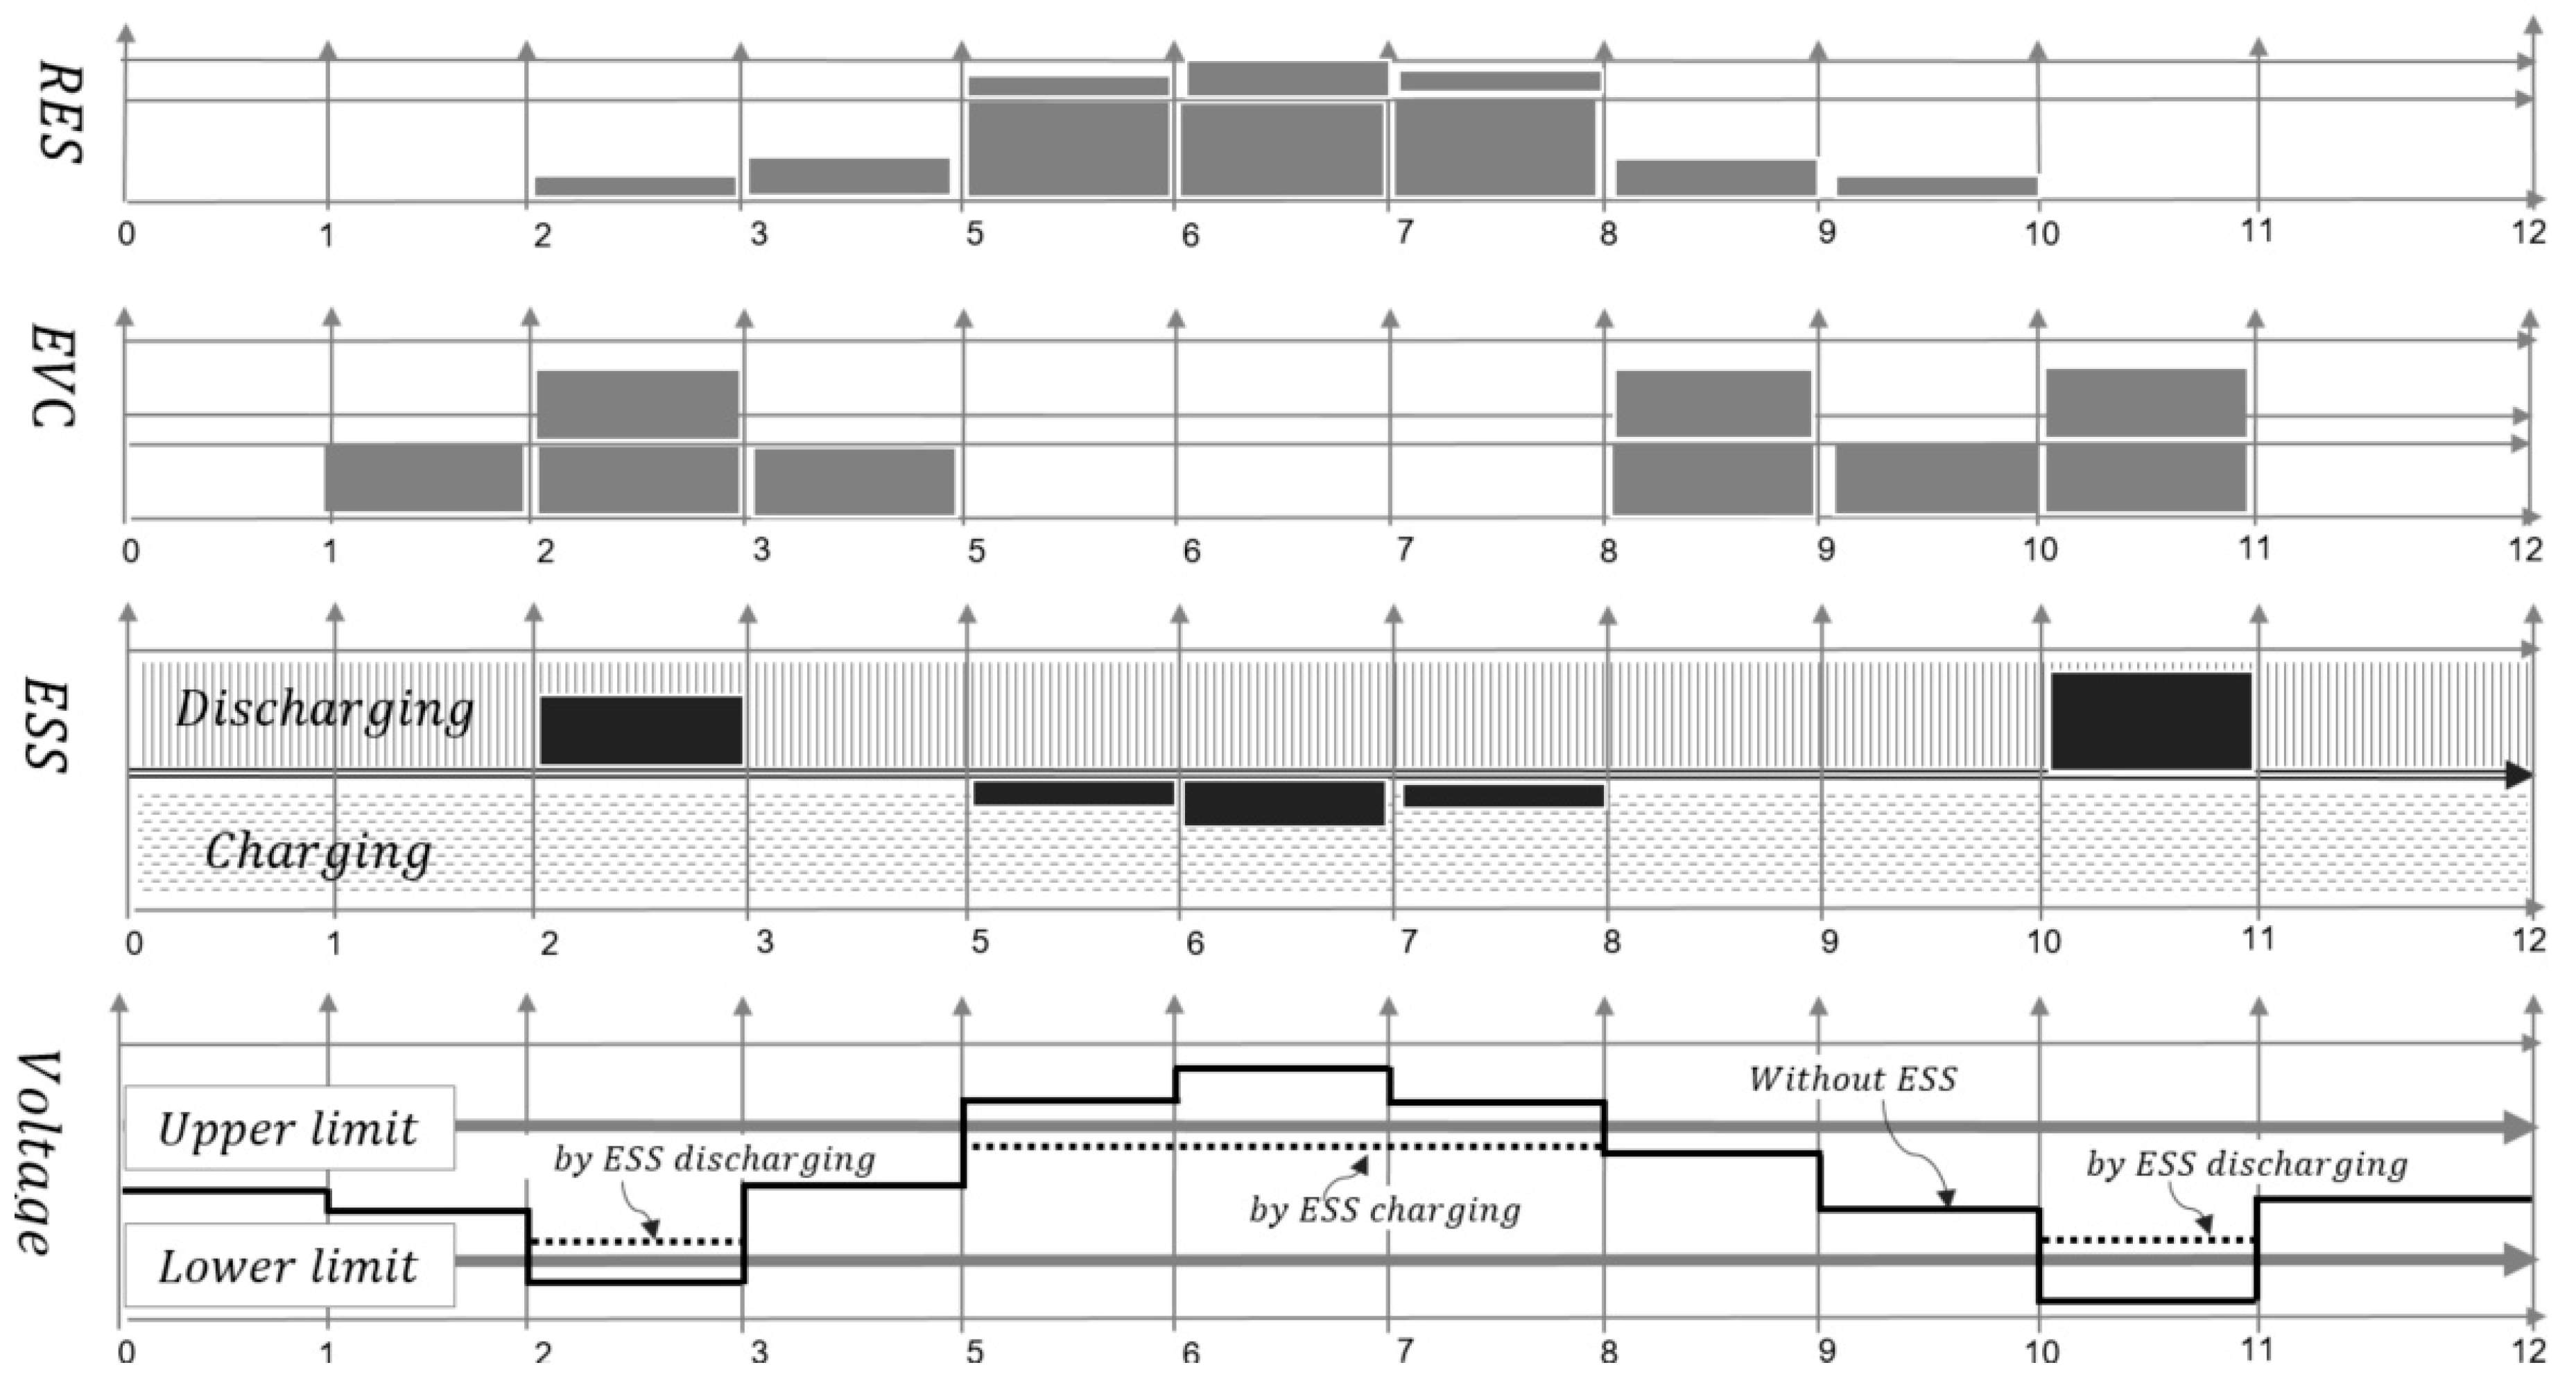
4. Optimal Operation Algorithm of ESS for Voltage Regulation

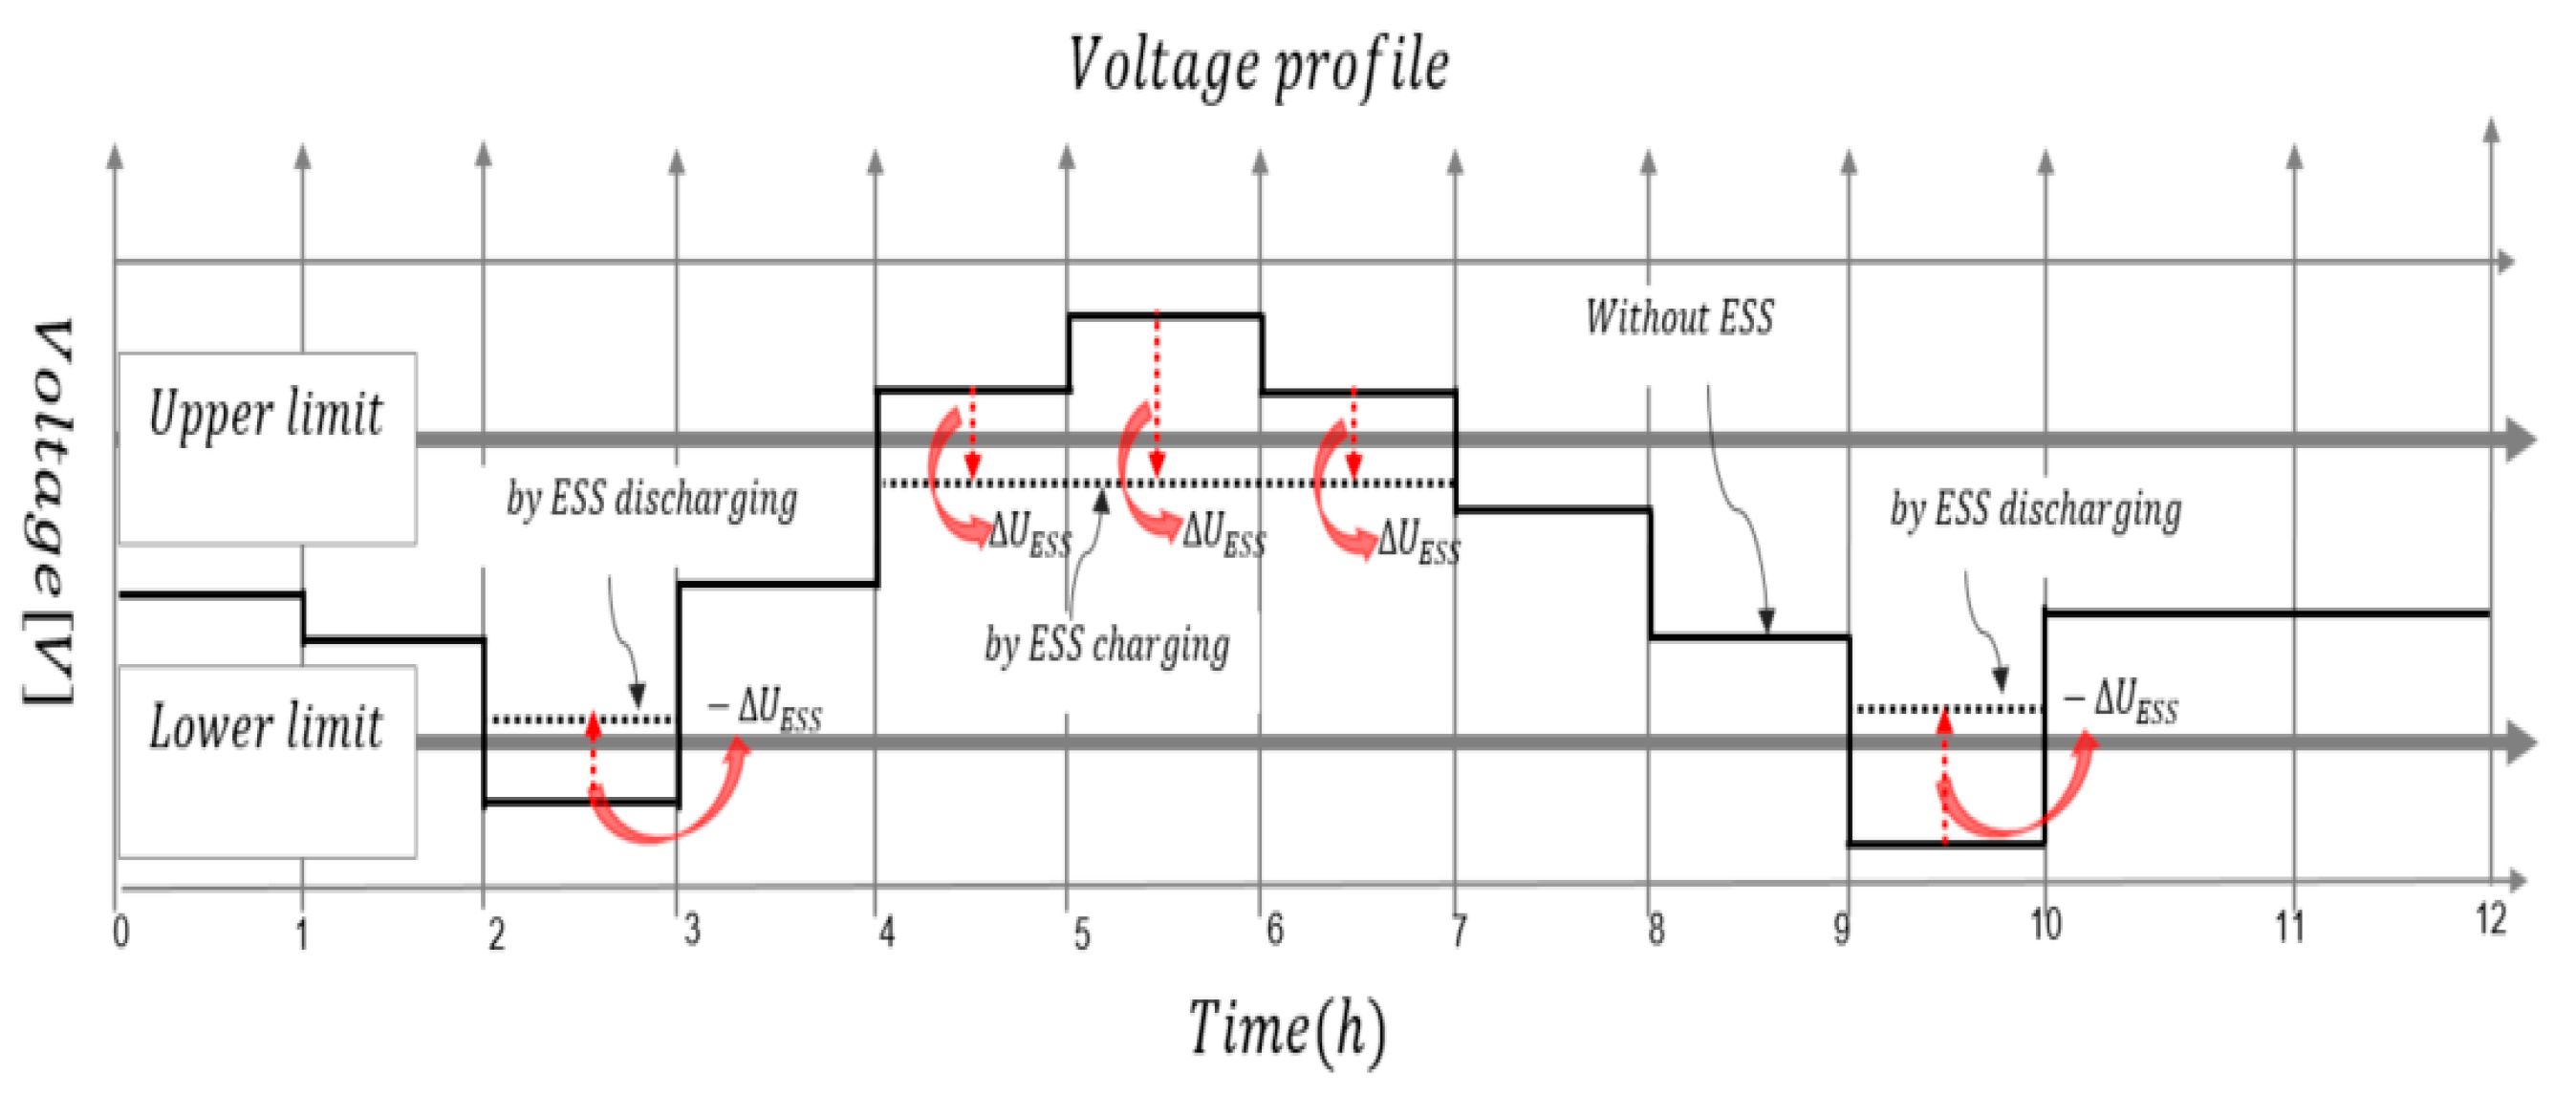
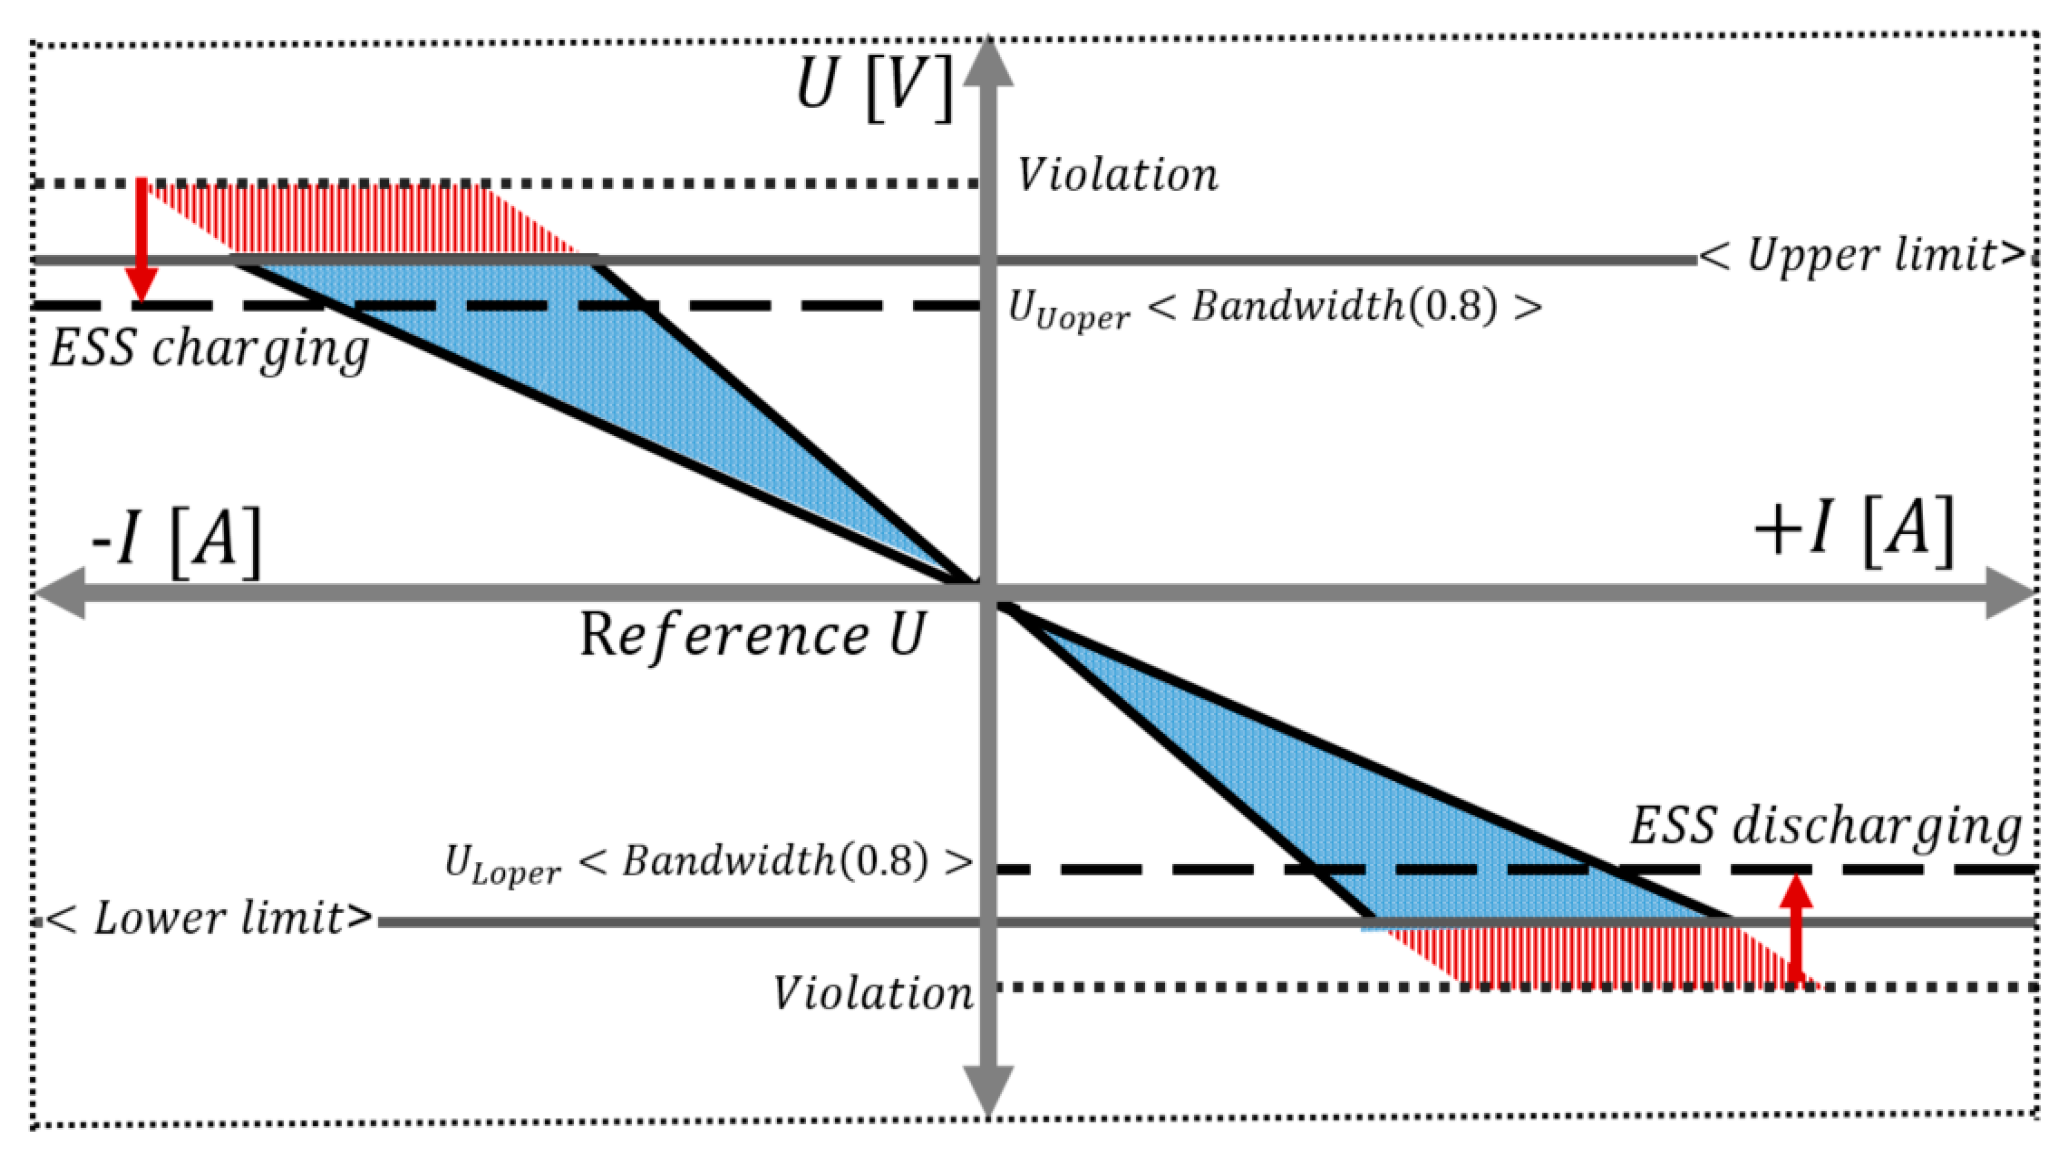
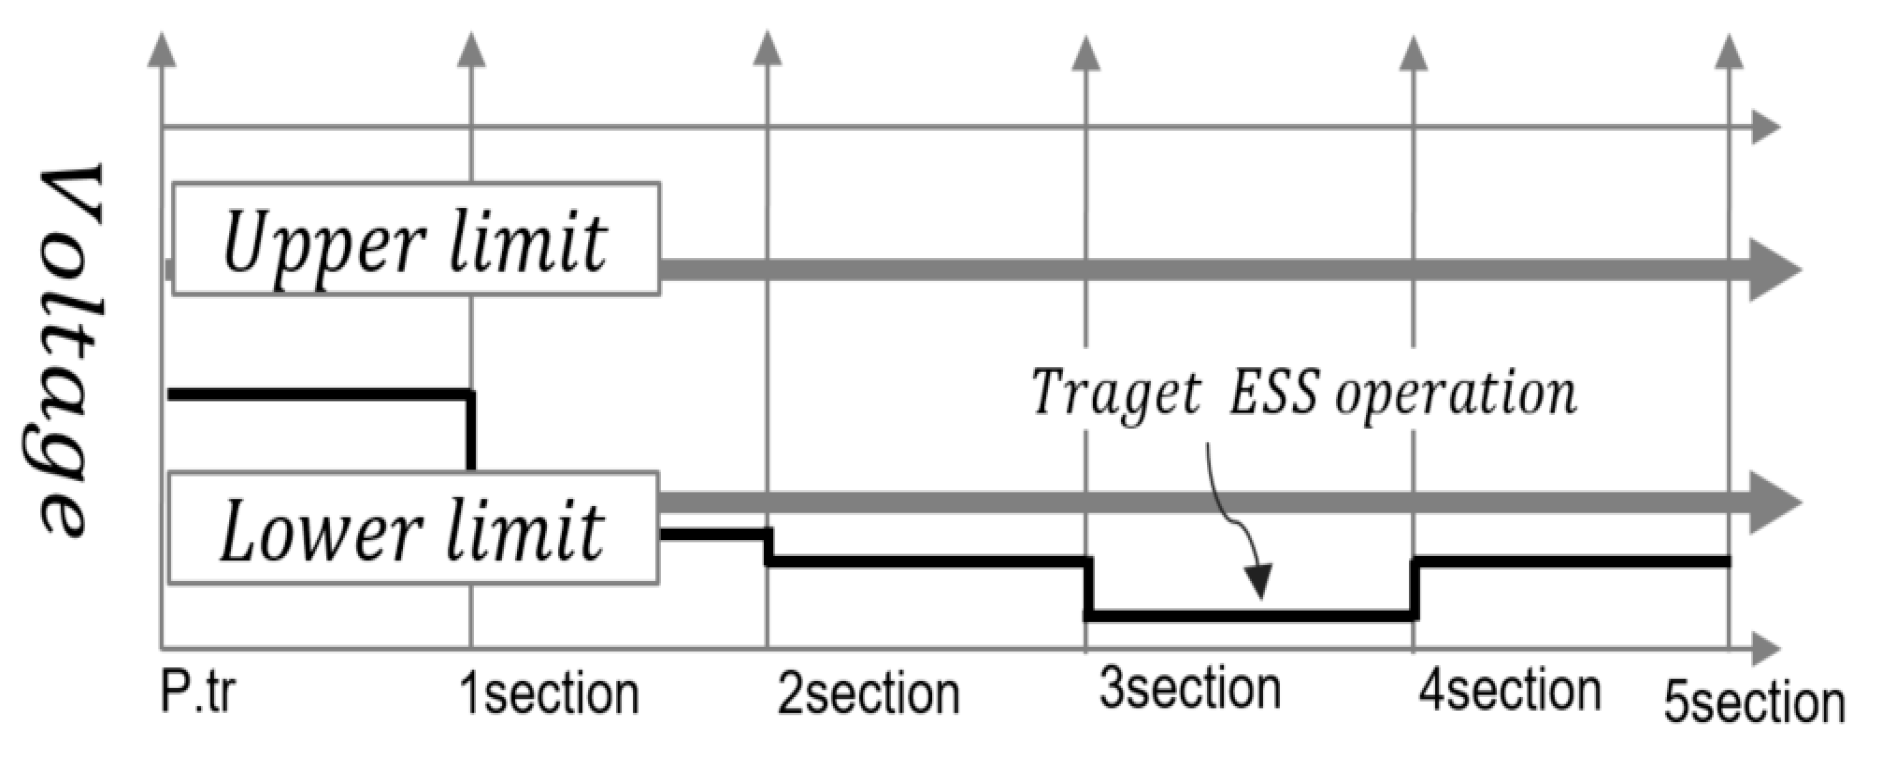
4.1. EVI-Algorithm of ESS for Voltage Regulation

Figure 4 assumes that the ESS is installed at the end of the secondary feeder. The distribution system (secondary feeder) model is expressed such that it stabilizes the voltage of the distribution system by ESS operation. Meanwhile, this paper presents a method to keep the allowable limit for power and voltage of the secondary feeder through ESS introduction with an electric vehicle and renewable energy resource at the end of the section.
As mentioned earlier, the concept of the proposed strategy is as follows:
First, the rated capacity (maximum current) of the secondary feeder through visual inspection is confirmed. In addition, the voltage characteristics from the pole transformer to the end section are analyzed by each voltage characteristic for heavy load and a maximum output of the renewable energy resource. After that, secondary feeder voltages with EV infrastructure are controlled within the allowable limit (upper limit, lower limit) by charging and discharging of the ESS as much as the voltage ( Δ U E S S ) out of the limit capacity of the secondary feeder. This concept is expressed in Figure 5.
On the other words, the voltage is compensated by the ESS to as much as the voltage ( Δ U E S S ) limit capacity of the secondary feeder and is defined as the voltage compensation rate (VCR). In this case, the secondary feeder is stabilized by the ESS operation with a charging/discharging value in which the VCR is converted into active power. However, the ESS can have problems when the VCR is terminated to the upper limit and lower limit warnings frequently. Therefore, this paper presents a setting method of the VCR with a margin, as shown in Figure 6. Specifically, the margin (bandwidth) is applied to the under area of upper limit and the over area of the lower limit, and the ESS is operated by considering the VCR and bandwidth coefficient.
Therefore, the proposed EVI-algorithm by the ESS can be summarized, as shown in Figure 7.

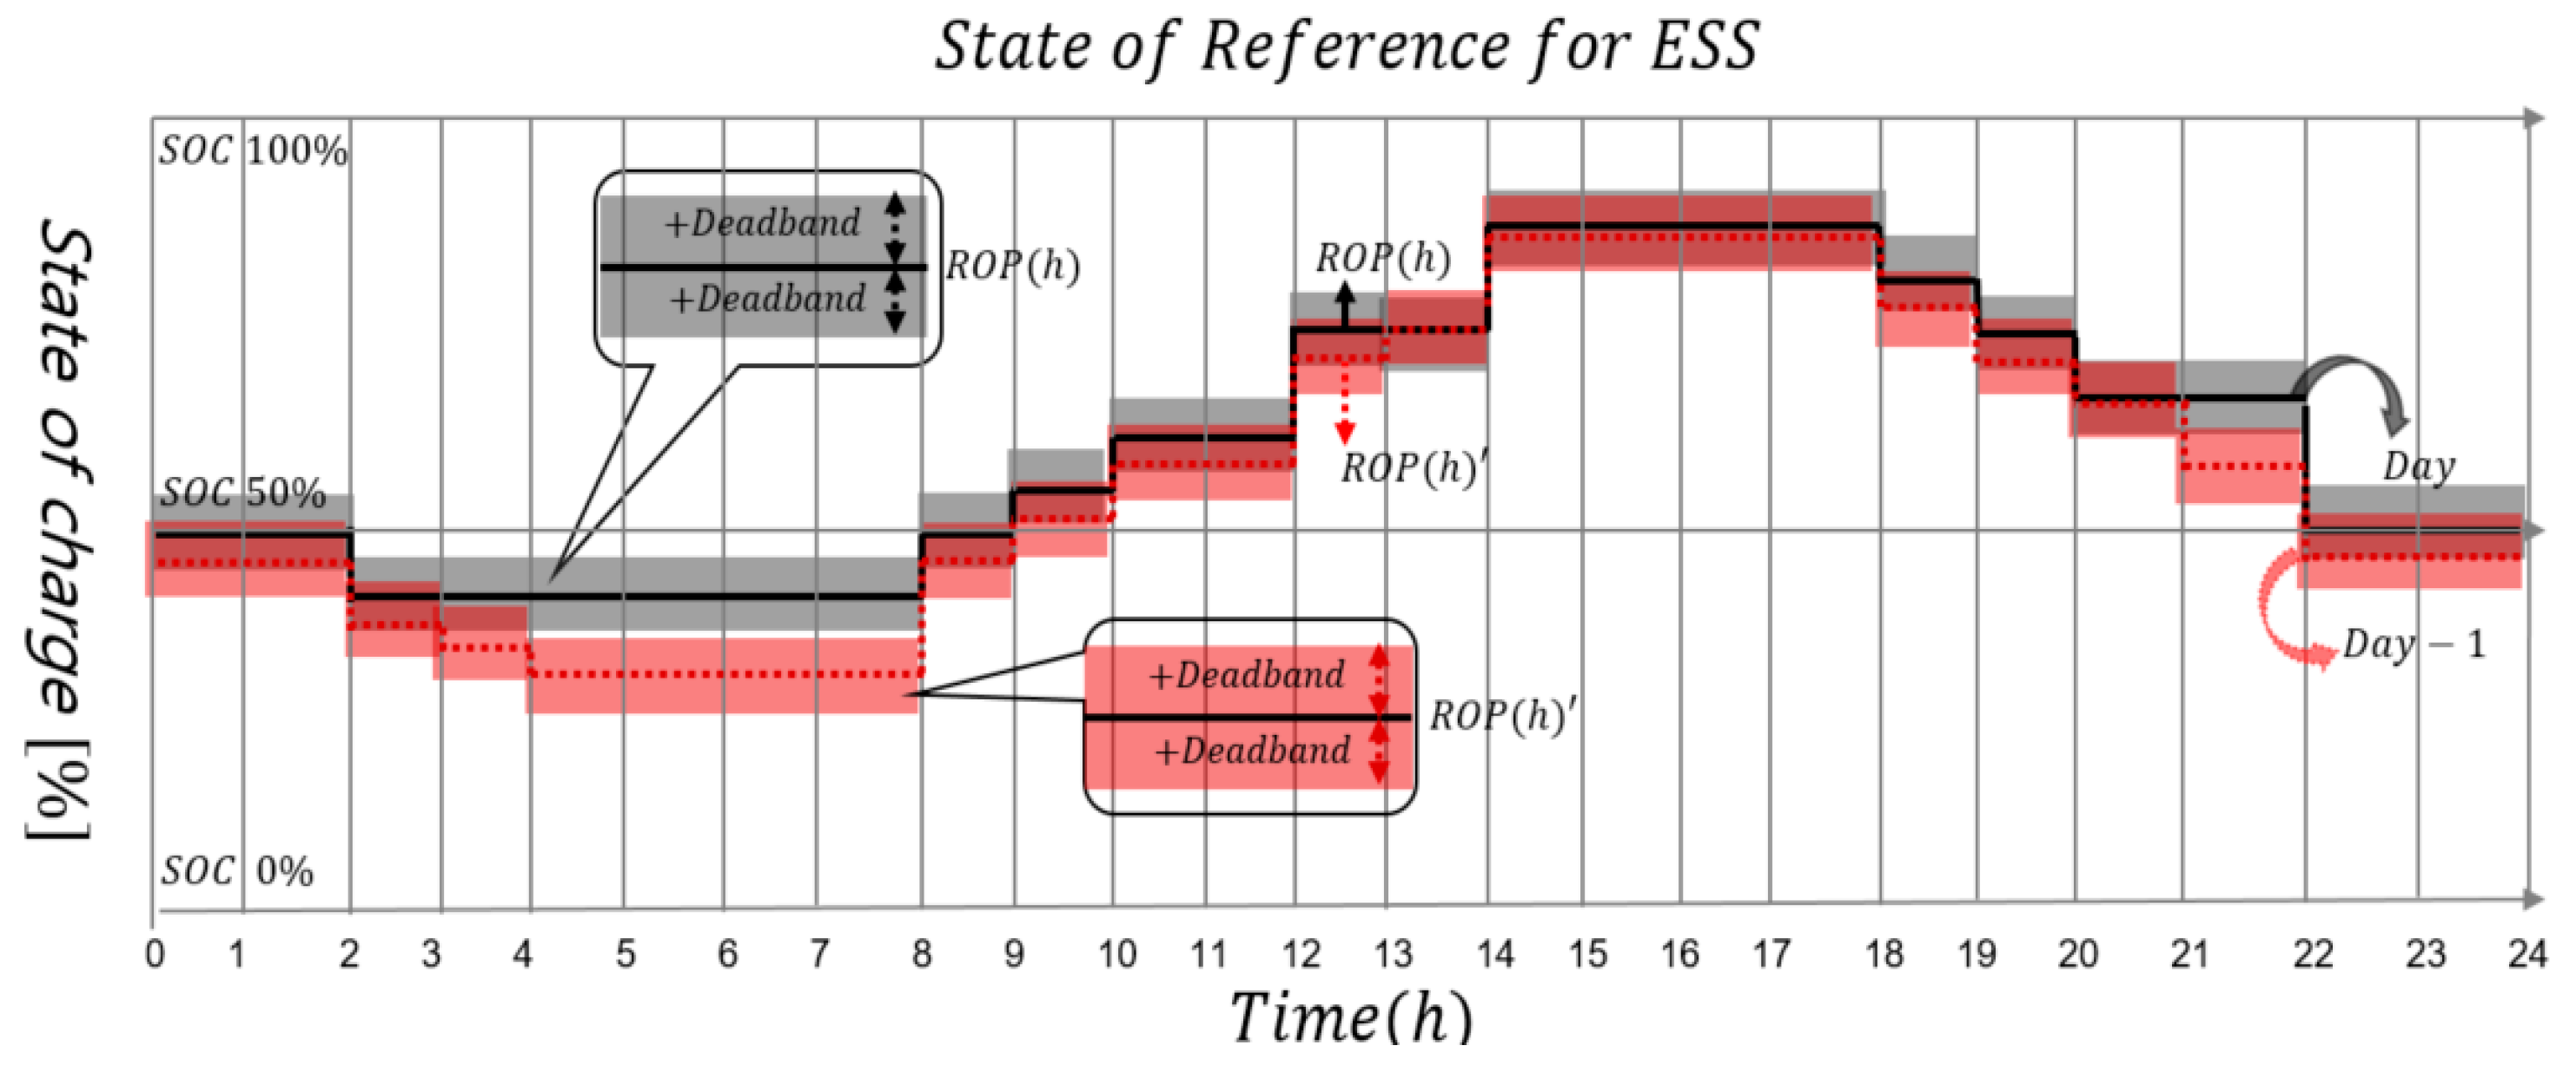
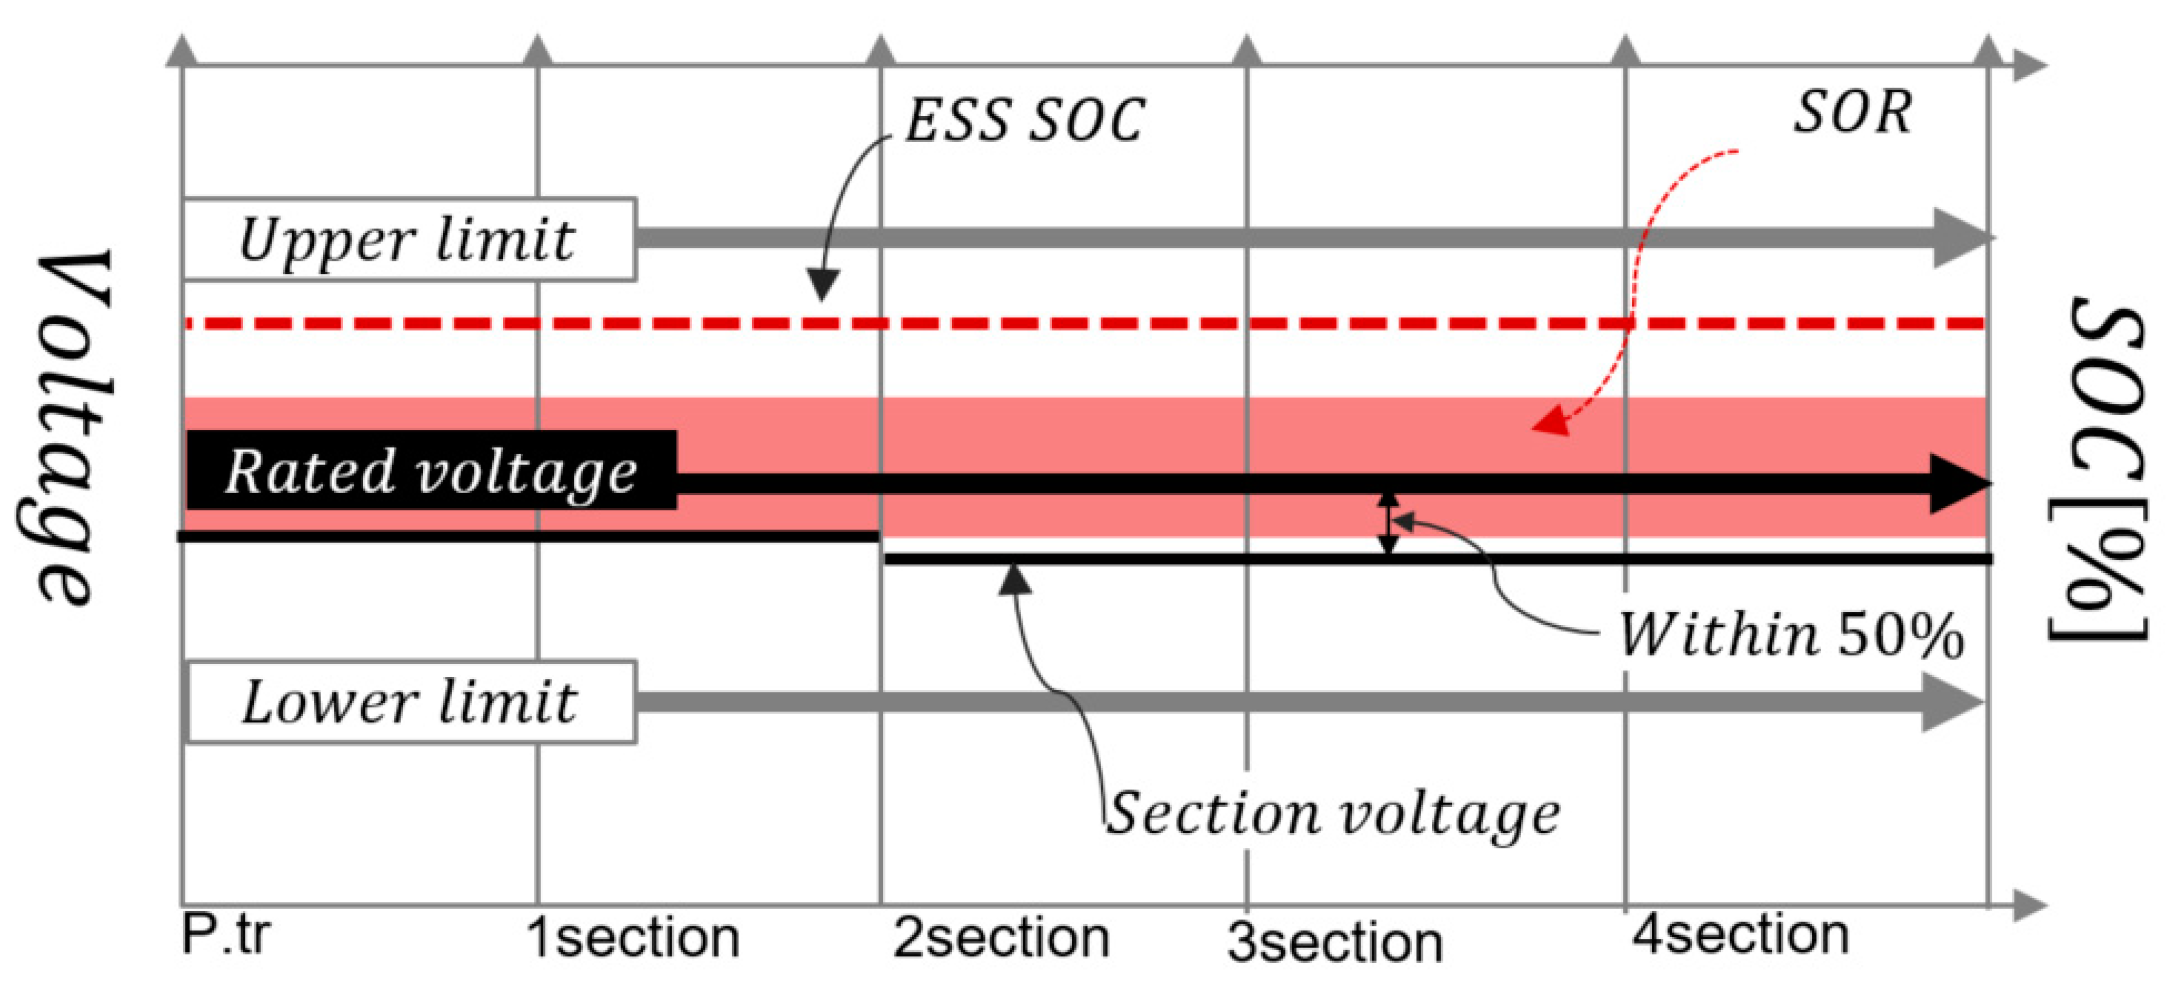
4.2. SOR-Algorithm of ESS for Voltage Regulation

The charging and discharging operation of the ESS are generally carried out based on 50% reference value of the state of charge (SOC) to operate the ESS during 24 h. However, the ESS introduced for voltage stabilization in the distribution system, including the secondary feeder, has a problem if the standard operating value is the fixed SOC because the number of charges and discharges differs per hour. If the standard operating value of the SOC is calculated by real-time per day or hour, it is possible to have a more stable operation than the existing method such as 50% of the SOC. Therefore, this paper also proposes an estimation method to keep the proper standard value of the SOC (it is named the state of reference, SOR) considering ESS operation conditions when the ESS is not operated by the EVI-algorithm, as shown in Figure 8. Meanwhile, the proper SOR is continuously estimated from the result value of the previous hour or daily operation pattern of the ESS when the charging and discharging operation of the ESS is performed based on a fixed SOC when operating the ESS for the first time.
Under this concept, the SOR is calculated as the sum of 50% SOC (initial value of the ESS) and the rate of change in [kWh] charging and discharging capacity [%] of the ESS for each time period, as shown in Figure 8. The statistical calculation method for SOR estimation is expressed in Equation (4).
SOR th ( h ) = y = 1 t h { [ t = 1 s e c P E S S - c h a r g e ( y , t ) t = 1 s e c P E S S - d i s c h a r g e ( y , t ) t = 1 s e c P E S S - c h a r g e ( y , t ) + t = 1 s e c P E S S - d i s c h a r g e ( y , t ) × 100 [ % ] ] + 50 [ % ] } ,
where, SOR th ( h ) is the proper standard value of the SOC for each time period, P E S S - c h a r g e is the charging capacity of the ESS for one time, P E S S - d i s c h a r g e is the discharging capacity of the ESS for one time, th is the application time zone of the SOR.
If the setting width of the SOR is very small, the ESS can have problems because of the frequency of the operation when the ESS is controlled to the proper standard value. To solve the problems, this paper proposes a method to apply the margin of ± D B (deadband, DB) to the SOR of the ESS in Equation (5).
boundary   of   SOR th ( h ) [ % ] = SOR th ( h ) [ % ] D B [ % ] SOR th ( h ) [ % ] SOR th ( h ) [ % ] D B [ % ] ,
where DB [%] is the margin of the SOR.

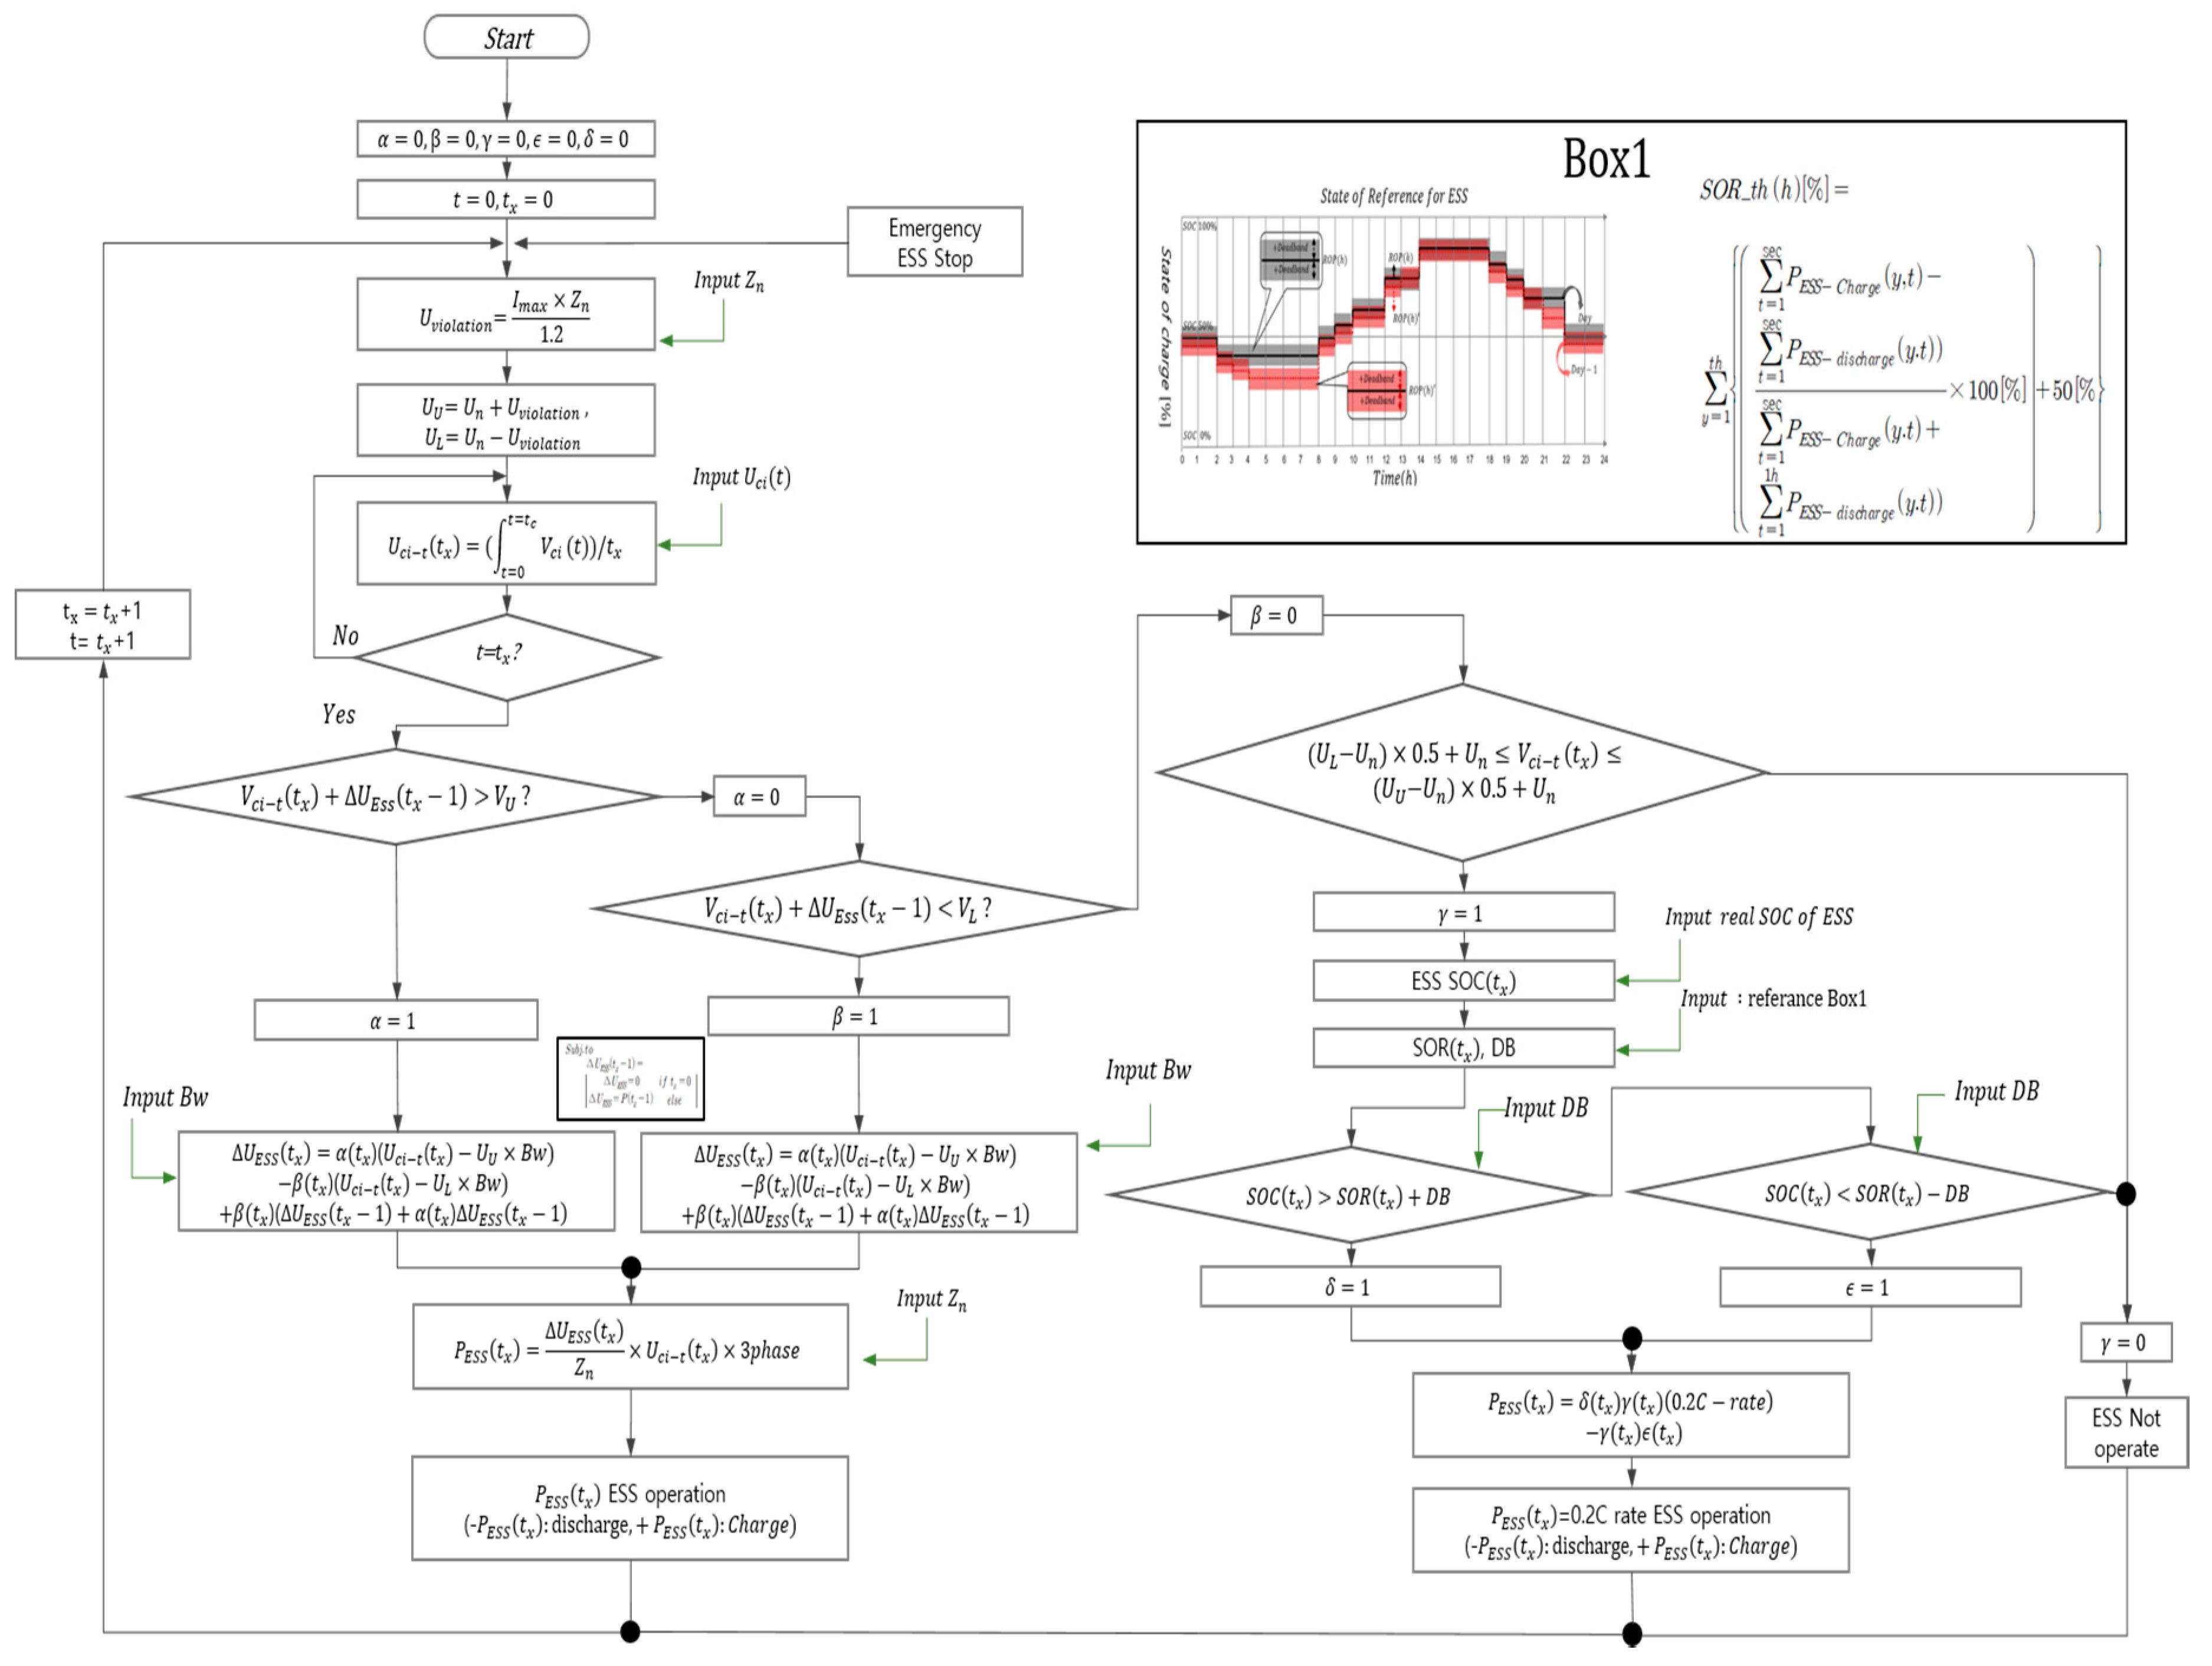
4.3. Coordination Control Strategy between EVI-Algorithm and SOR-Algorithm for ESS

In this paper, the operation of the ESS by the proposed coordination control strategy between the EVI-Algorithm and SOR-algorithm are classified into three categories as below:
  • [Category 1] When the voltage in the secondary feeder violates the upper limit and lower limit.
    • Case l. Only one voltage is not kept within the upper limit and lower limit
    • Case 2. Multiple voltages are not kept within the upper limit and lower limit
  • [Category 2] When the ESS is performed as the SOR-algorithm operation
The voltage in the secondary feeder for the ESS operation is the measured voltage for each section. This concept is summarized as follows:
A. In the case where the voltage in the secondary feeder violates the upper limit and lower limit
First, in case the voltage is violated in only one section, the ESS is operated after the determination of the capacity which is as much as voltage compensation range at the violated section, as shown in Figure 9.
And, when is the voltage to be violated in multiple sections, the voltage compensation range of the ESS is determined based on the largest voltage at violated feeders, as shown in Figure 10.
B. In the case where the ESS is performed as the SOR-algorithm operation
The ESS performs the SOC operation by the SOR-algorithm when it has a relationship between it to not be operated as the stabilization method and to not be kept within the SOR boundary, as expressed in Figure 11.
As mentioned earlier, the coordination control operation procedure of the ESS to stabilize the power and voltage of the secondary feeder is categorized by eight steps as below.
[STEP 1] To determine the voltage range ( U v i o l a t i o n ) from the rated voltage to the upper limit and lower limit in the secondary feeder with EV infrastructure, multiply the maximum allowable current in the secondary feeder by the estimated value of the line impedance from Section 3, and the load factor as shown in Equation (6). Here, the load factor is based on the heavy load (LF: from 0.7 to 0.8) voltage range. Furthermore, the voltage range in each section has the same value because of the linear characteristic of the voltage based on the current variation.
U v i o l a t i o n = I m a x × Z n × L F ,
where U v i o l a t i o n is the voltage range in the secondary feeder, I m a x is the maximum allowable current and L F is the load factor at heavy load.
[STEP 2] The upper limit and lower limit, which are allowable limit values, are determined by the rated voltage and the voltage range that is calculated by [STEP 1] considering the capacity of the secondary feeder, as expressed by Equations (7) and (8).
U U = U n + U v i o l a t i o n ,
U L = U n U v i o l a t i o n ,
where U U is the upper limit of the voltage, U L is the lower limit of the voltage, and U n is the rated voltage in the secondary feeder based on the 1 phase 2 wire.
[STEP 3] The frequent operation of the ESS as an instantaneous value within 1 sec is difficult because of the lamp late time of the power conversion system (PCS) for the ESS and the life cycle of the electric device. In addition, generators for the frequency regulator are operated as an average power value over 10 seconds. Under this concept, this step secures the stability of ESS through the time interval for the ESS operation by applying the average real-time voltage value at the secondary feeder during the set time, as shown in Equation (9). Merely, the operation time of the ESS is only determined by a set time to calculate the average real-time voltage value.
U c i t ( t x ) = [ t = 0 t = t x U c i ( t ) ] t x ,
where, U c i t ( t x ) is the average voltage in the secondary feeder during t x time, t x is the continuous operation time before the next operation time of the ESS, and U c i ( t ) is the real-time voltage in the secondary feeder.
[STEP 4] Based on the calculated voltage in Equation (9), the stabilization operation signal by the ESS is recognized by the condition of the charging and discharging modes. Meanwhile, the ESS is operated as the charging mode in which the alpha value is “1”, and the beta value is “0” when the average voltage of Equation (9) exceeds the upper limit. Furthermore, the ESS is operated as the discharging mode in which the alpha value is “0”, and the beta value is “1” when the average voltage of Equation (10) is kept below the lower limit. For Equation (10), because the voltage compensation rate determined at the previous time period is summed as the average voltage, the condition equation is applied. However, in the initial operation of the ESS, the voltage compensation range of the previous time is assumed to be zero.
α ( t x ) , β ( t x ) = [ U c i t ( t x ) + Δ U E S S ( t x 1 ) > U U α = 1 ,   β = 0 U c i t ( t x ) + Δ U E S S ( t x 1 ) > U L α = 0 ,   β = 1 U L U c i t ( t x ) + Δ U E S S ( t x 1 ) U U α = 0 ,   β = 0 ] ,
where α ( t x ) is the charging mode signal for voltage stabilization by the ESS and β ( t x ) is the discharging mode signal for voltage stabilization by the ESS.
[STEP 5] On the other hand, when the ESS does not operate as a voltage stabilization function, it is possible to determine the SOR operation. First, in case all section voltages of the secondary feeder are satisfied within the allowable limit, the charging and discharging signal of the ESS must be determined as α = 0 and β = 0 from [STEP 2]. Therefore, all feeder voltages should be kept within the target ± value ( U n ± T m ) range, which is the set value between the rated voltage and limit voltage (upper limit and lower limit). Therefore, when all of the above conditions are satisfied, the primary condition signal (γ) for the SOR operation of the ESS becomes “γ = 1”, as expressed by Equation (11). Where, to prevent frequent operation at the SOR operation condition, target ± margin, which means the proper value between the rated voltage and limit values, is applied to setting the voltage range for the SOR operation. The charging and discharging of the ESS for the SOR operation will be determined at the next step.
α ( t x ) , β ( t x ) , γ ( t x ) = [ ( U L U n ) × T m + U n U c i t ( t x ) ( U U U n ) × T m + U n α = 0 , β = 0 , γ = 1 e l s e α = 0 , β = 0 , γ = 0 ] ,
where γ is the primary condition signal ( γ ) for the SOR operation, and T m is the proper value between the rated voltage and limit values.
[STEP 6] In this step, charging or discharging signals of the ESS for the SOR are determined based on the primary condition signal ( γ ) of the ESS SOR operation at [STEP 5]. Meanwhile, from the proposed SOR algorithm of the Section 4.2, ESS is carried out in charging mode (1/4 kW value of ESS rated capacity) when the SOC is lower than the SOR range considering DB. Furthermore, ESS is performed as the discharging mode (1/4 kW value of ESS rated capacity) when the SOC of the ESS is upper than the SOR range. Under this concept, the operation signal of the SOR operation is formulated by:
ϵ ( t x ) , δ ( t x ) = [ S O C ( t x ) > S O R ( t x ) + D B ϵ ( t x ) = 1 , δ ( t x ) = 0 S O C ( t x ) < S O R ( t x ) D B ϵ ( t x ) = 0 , δ ( t x ) = 1 S O R D B S O C ( t x ) S O R ( t x ) + D B not   operate ] ,
where ϵ ( t x ) is the charging signal for the SOR operation, δ ( t x ) is the discharging signal for the SOR operation, and DB is the margin of the SOR.
Therefore, the condition for voltage stabilization and SOR operation are classified in Table 2.
[STEP 7] Determination of voltage compensation rate considering bandwidth
Based on the determination for the voltage stabilization operation of the ESS, the decision problem for the voltage compensation range is defined by Equation (13). In other words, the voltage compensation rate ( Δ U E S S ( t x ) ) to maintain the voltage to be between the violated voltage and the allowable limit is calculated by the limit voltage at [STEP 2], margin of voltage (bandwidth), measured average voltage at [STEP 3], voltage compensation rate of previous time, and charging/discharging signal of the ESS when the operation of ESS is decided as the voltage stabilization function. Here, the voltage compensation rate of the previous time is assumed to be “zero” in case the ESS has not been operated in the previous time or initial time. In addition, the + Δ U E S S ( t x ) means a compensation range value for ESS discharging and − Δ U E S S ( t x ) means a compensation range value for ESS charging.
Δ U E S S ( t x ) = α ( t x ) ( U c i t ( t x ) U U + B w ) β ( t x ) ( U c i t ( t x ) U L B w ) + α ( t x ) ( Δ U E S S ( t x 1 ) + β ( t x ) ( Δ U E S S ( t x 1 ) ,
where Δ U E S S ( t x ) is the voltage compensation rate by the ESS, and Bw is the margin for the voltage compensation rate.
[STEP 8] Voltage and stabilization operation of the ESS
On the other hand, the output of the ESS when ESS voltage stabilization is operated as function, as shown in Equation (14), is determined by the impedance value from Section 2, the voltage compensation rate from [STEP 7], and measuring average voltage from [STEP 3].
P E S S ( t x ) = ( Δ U E S S ( t x ) Z n × U c i t ( t x ) ) × 3 p h a s e ,
where P E S S ( t x ) is the output of the ESS.
[STEP 9] SOR operation of the ESS
In this step, the SOR operation of the ESS, expressed by Equation (15), is carried out when the ESS does not operate as a voltage stabilization function. In order words, the ESS performs at about 1/4 of the ESS rated capacity [kW] when it is assumed as signal(γ) = 1, signals (ϵ,δ) = 1.0 or (ϵ,δ) = 0.1. Here, γ signal, ϵ, and δ signals are the results values that occurred from [Step 5] and [Step 6]. In addition, the + value of P E S S ( t x ) means the ESS discharging state and −value means the ESS charging state.
P E S S ( t x ) = ϵ ( t x ) δ( t x )( ESScapacity [ kW] 4 )ϵ( t x )δ( t x )( ESScapacity [ kW] 4 )
[STEP 10] After the operation of all steps, the procedure returns to [STEP 2] and re-decides whether to operate the ESS.
As mentioned earlier, the coordination operation procedure between the EVI-algorithm and SOR-algorithm for ESS is expressed in Figure 12.

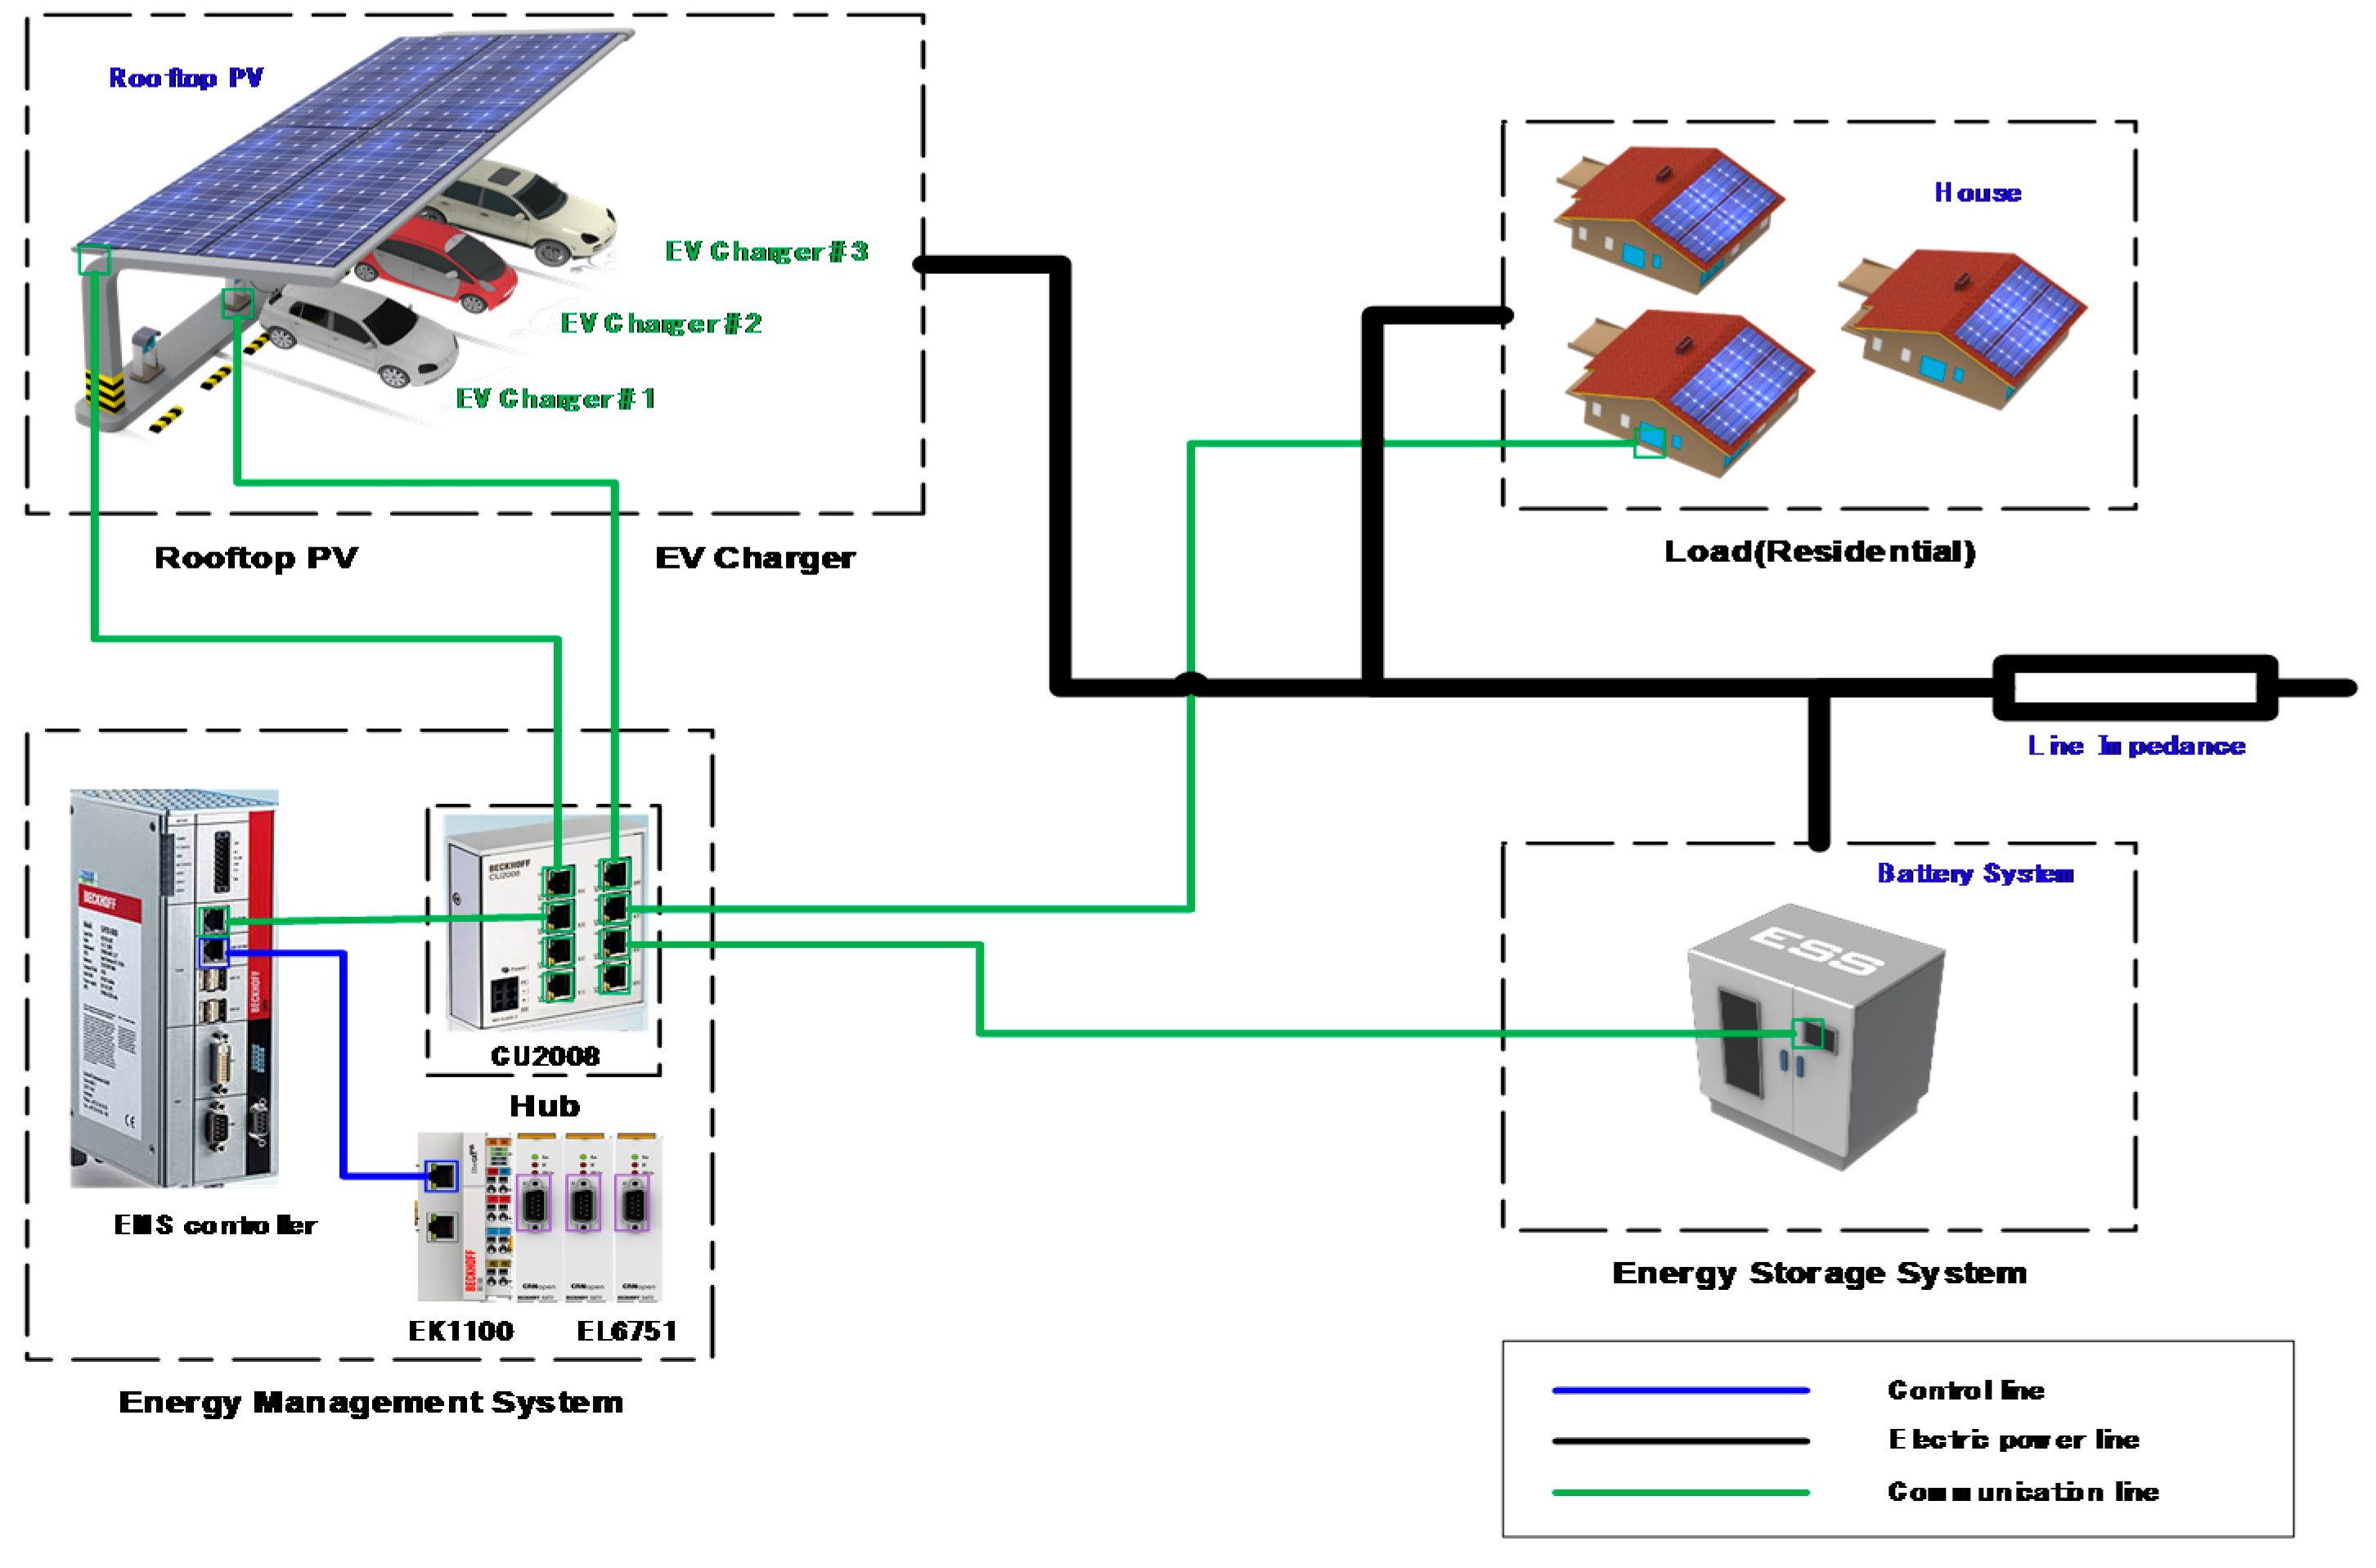
5. Modeling of Electric Vehicle Charging Infrastructure at the Secondary Feeder

To perform the verification of the coordination control strategy between the AVI-algorithm and SOR algorithm at the secondary feeder in the distribution system proposed above, this section presents the simulation modeling of the low voltage distribution system, ESS, photovoltaic system, loads, and the proposed algorithm for the electric vehicle using MATLAB/SIMULINK. In this simulation model, no harmonic and frequency variation is assumed, and only the positive sequence is considered. Therefore, the RMS based phasor model is suitable under this environment and also is able to simulate for long-term scenarios.

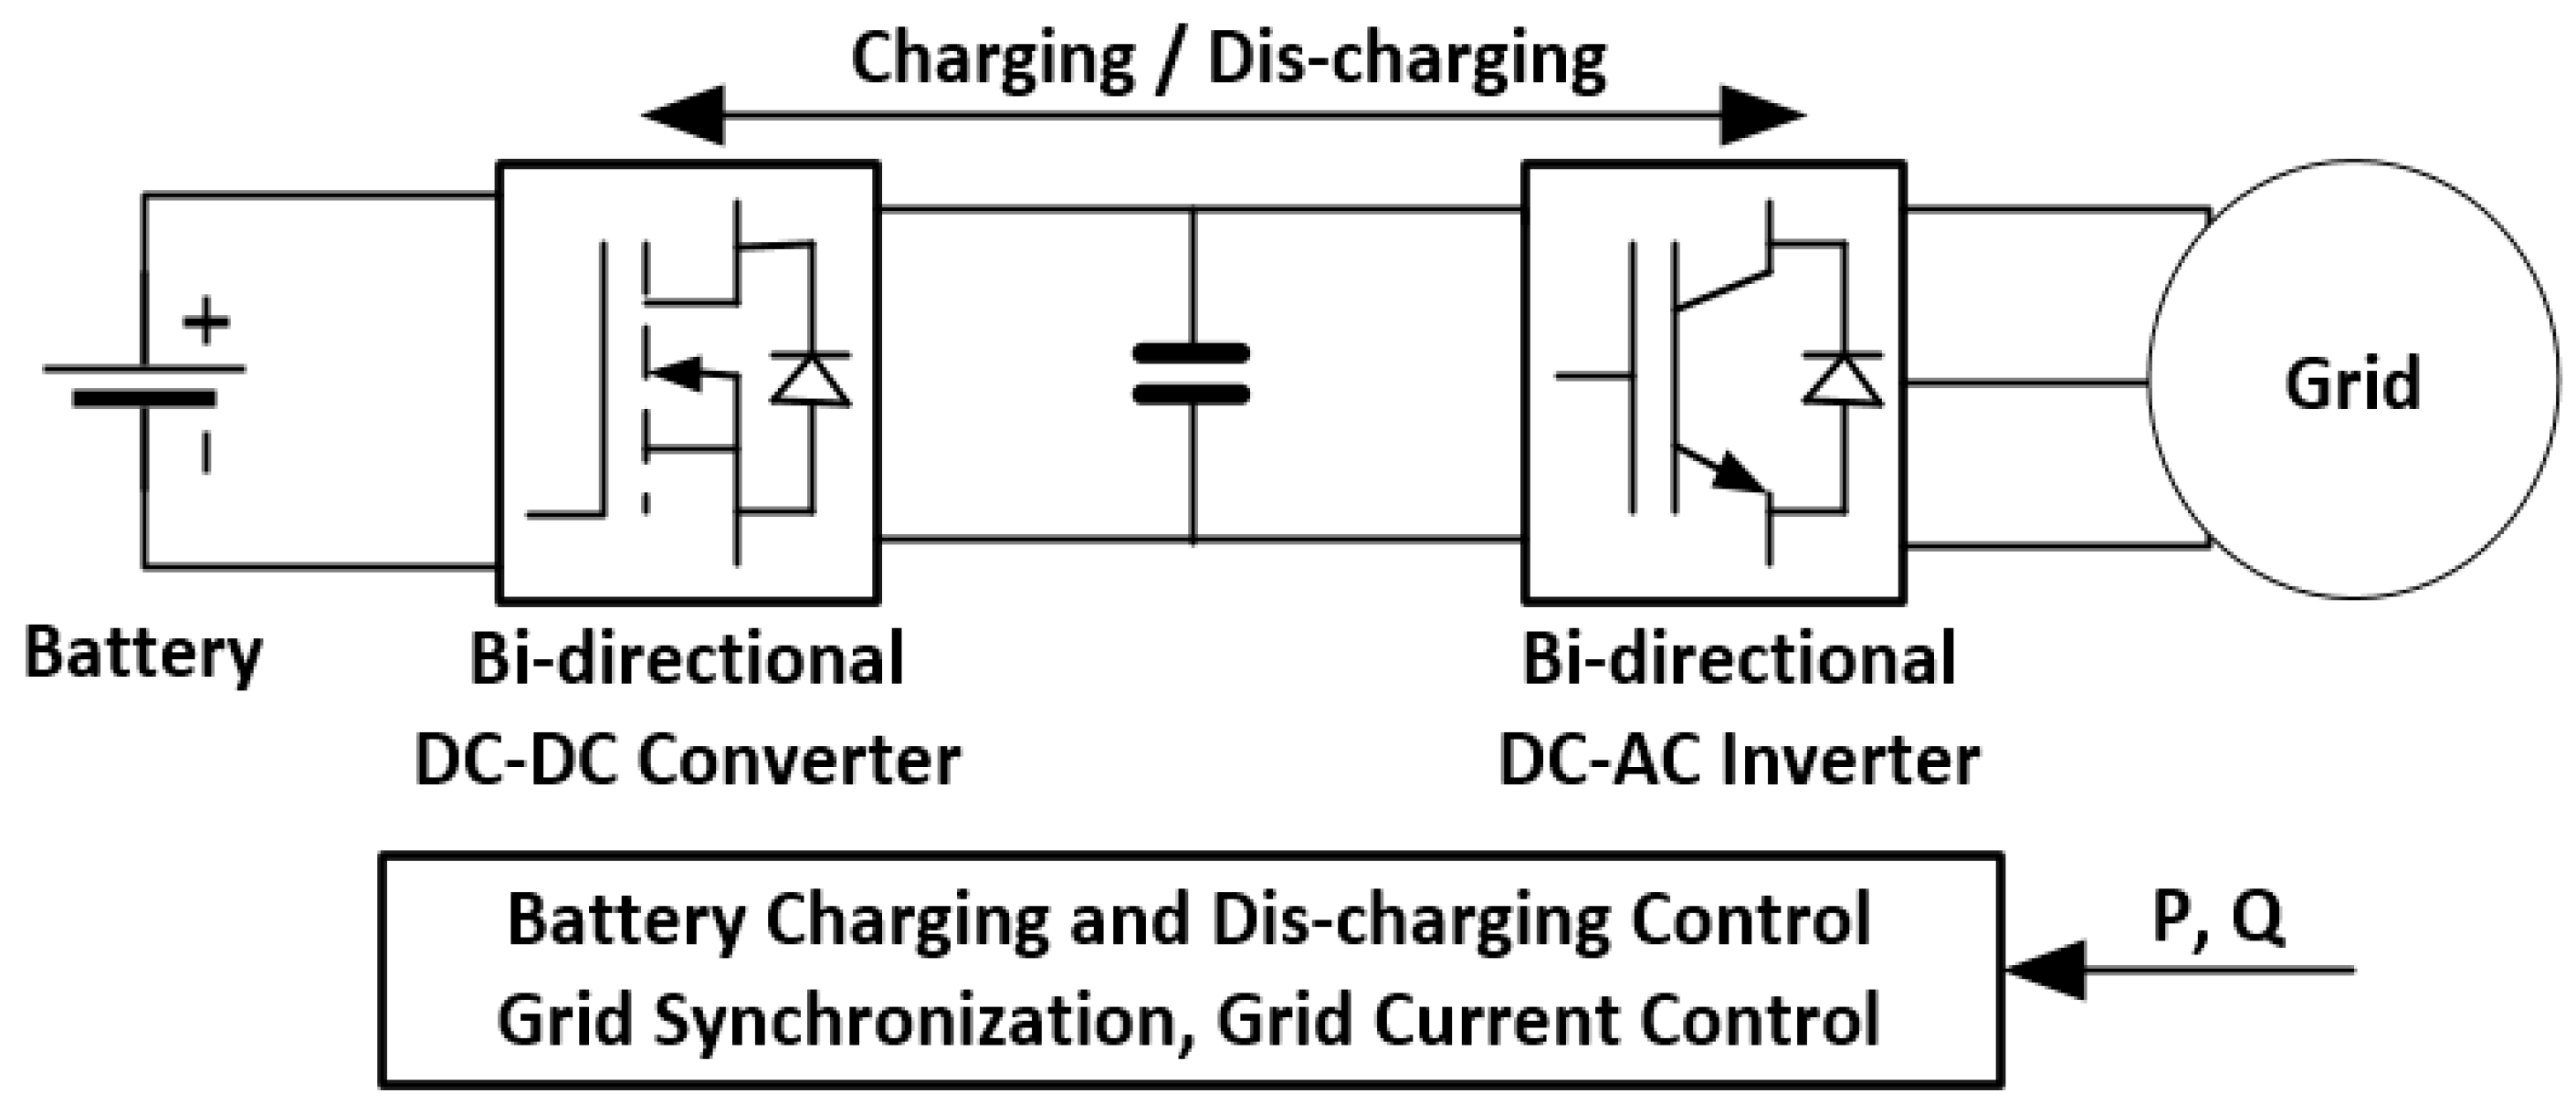
5.1. Battery Energy Storage System Modeling for Voltage Stabilization

The ESS for voltage stabilization, which is connected to the EVC infrastructure in the low voltage distribution system, consists of a battery that is able to charge and discharge energy and a DC/DC converter that is responsible for bi-directional power flow through voltage control, and an inverter that is in charge of synchronizing with the AC system. As shown in Figure 13, the ESS modeling is constructed to follow the command value from the supervisory controller, such as an energy management system (EMS). Therefore, it is controlled by the proposed algorithm.

5.2. Loads (Consumer) and EV Loads (Charging) Modeling

The loads are limited to the general customer and the electric vehicles, all assumed to be the general resistive load. In general, load patterns vary according to weather, season, and even hour, so it is modeled to make output follow the input values. Consumers and EV load patterns for various scenarios are generated for each hour, based on 24 hours a day. Here, the EV loads are limited to the one-way direction so that the energy flows from load to secondary feeder.

5.3. Photovoltaic Power Generation Modeling

The photovoltaic system consists of a solar panel and a power converter, and DC output power from solar panels is determined by irradiation and temperature. In this step, MPPT (maximum power point tracking) control of the power converter extracts maximum energy and transforms it into the AC output. The combination of the photovoltaic module changes the output characteristics of the voltage and current of the DC power, and it determines the topology of the photovoltaic power converter. In this paper, it is assumed that the photovoltaic system operates by the MPPT through Equations (16) to (17) [17].
I m p = I p v I o [ exp ( V m p + I m p R s N a V T ) 1 ] V m p + I m p R s R s h ,
I m p V m p = I 0 N a V T ( 1 I m p V m p R s ) [ exp ( V m p + I m p R s N a V T ) ] 1 R s h ( 1 I m p V m p R s ) ,
where V T is the thermal voltage, R s is the series resistor, I o is the reverse saturation current, R s h is the shunt resistance, V m p and I m p are the voltage and current levels at the maximum power point, respectively.

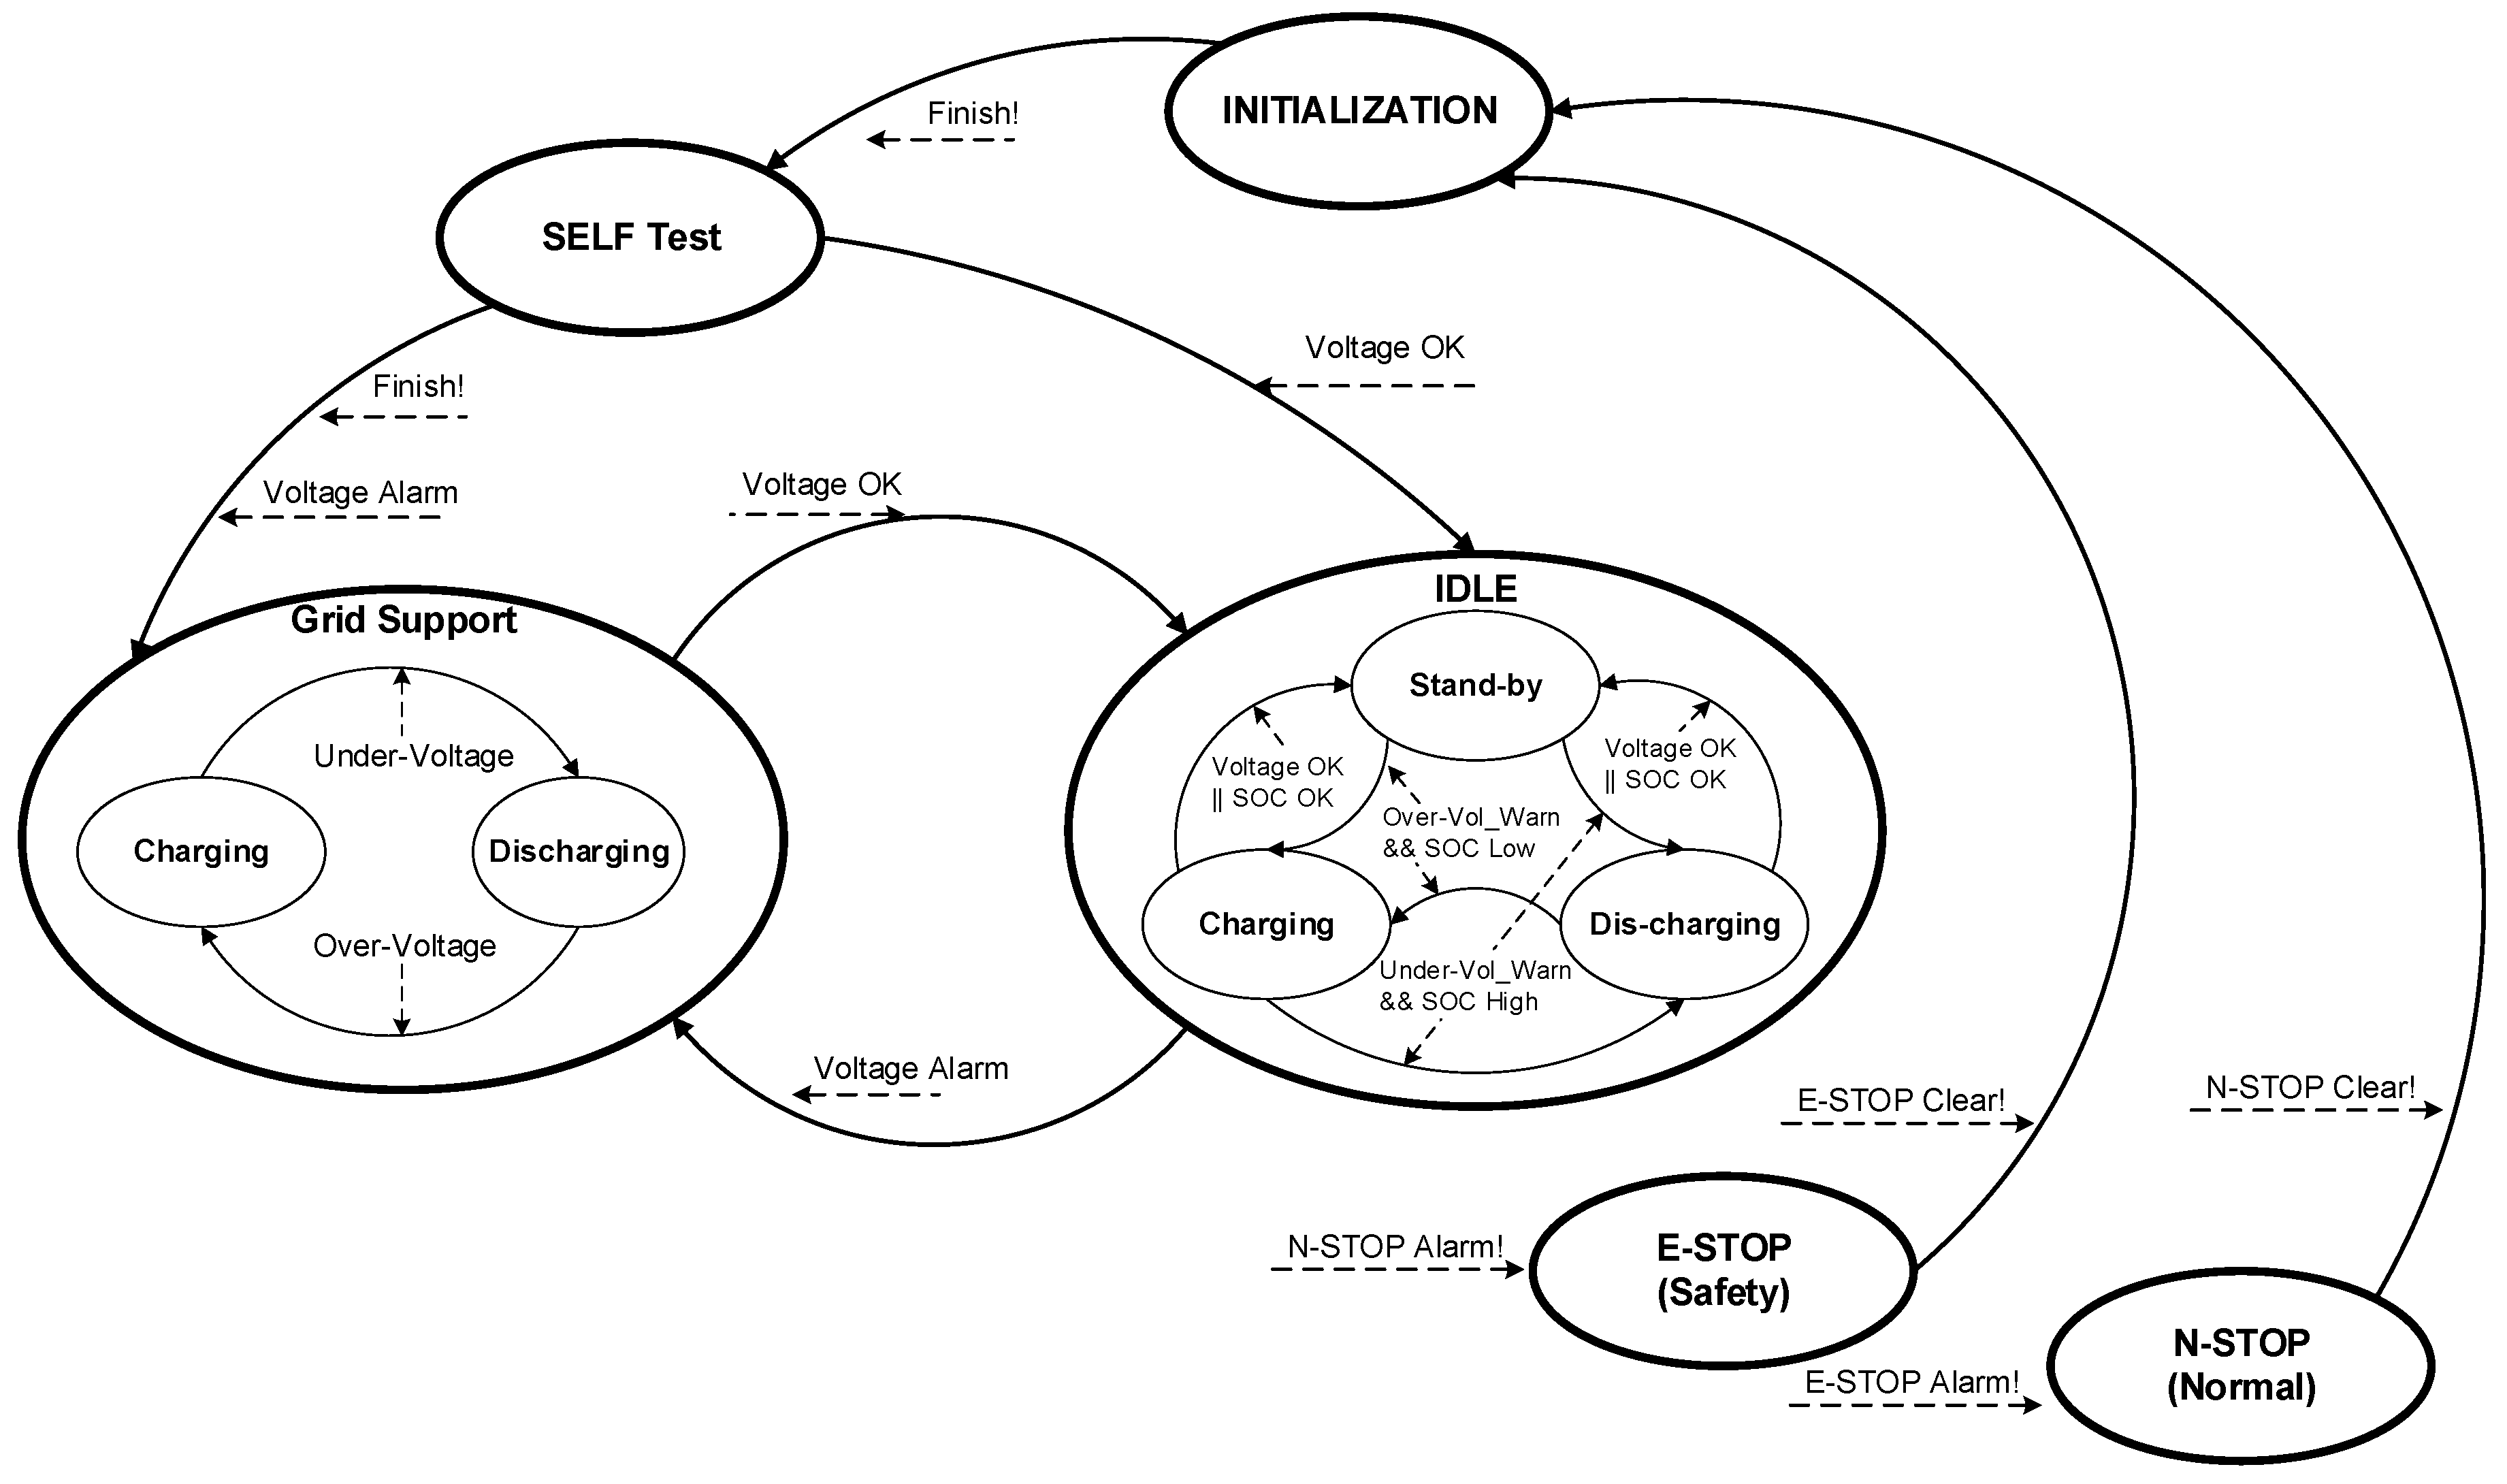
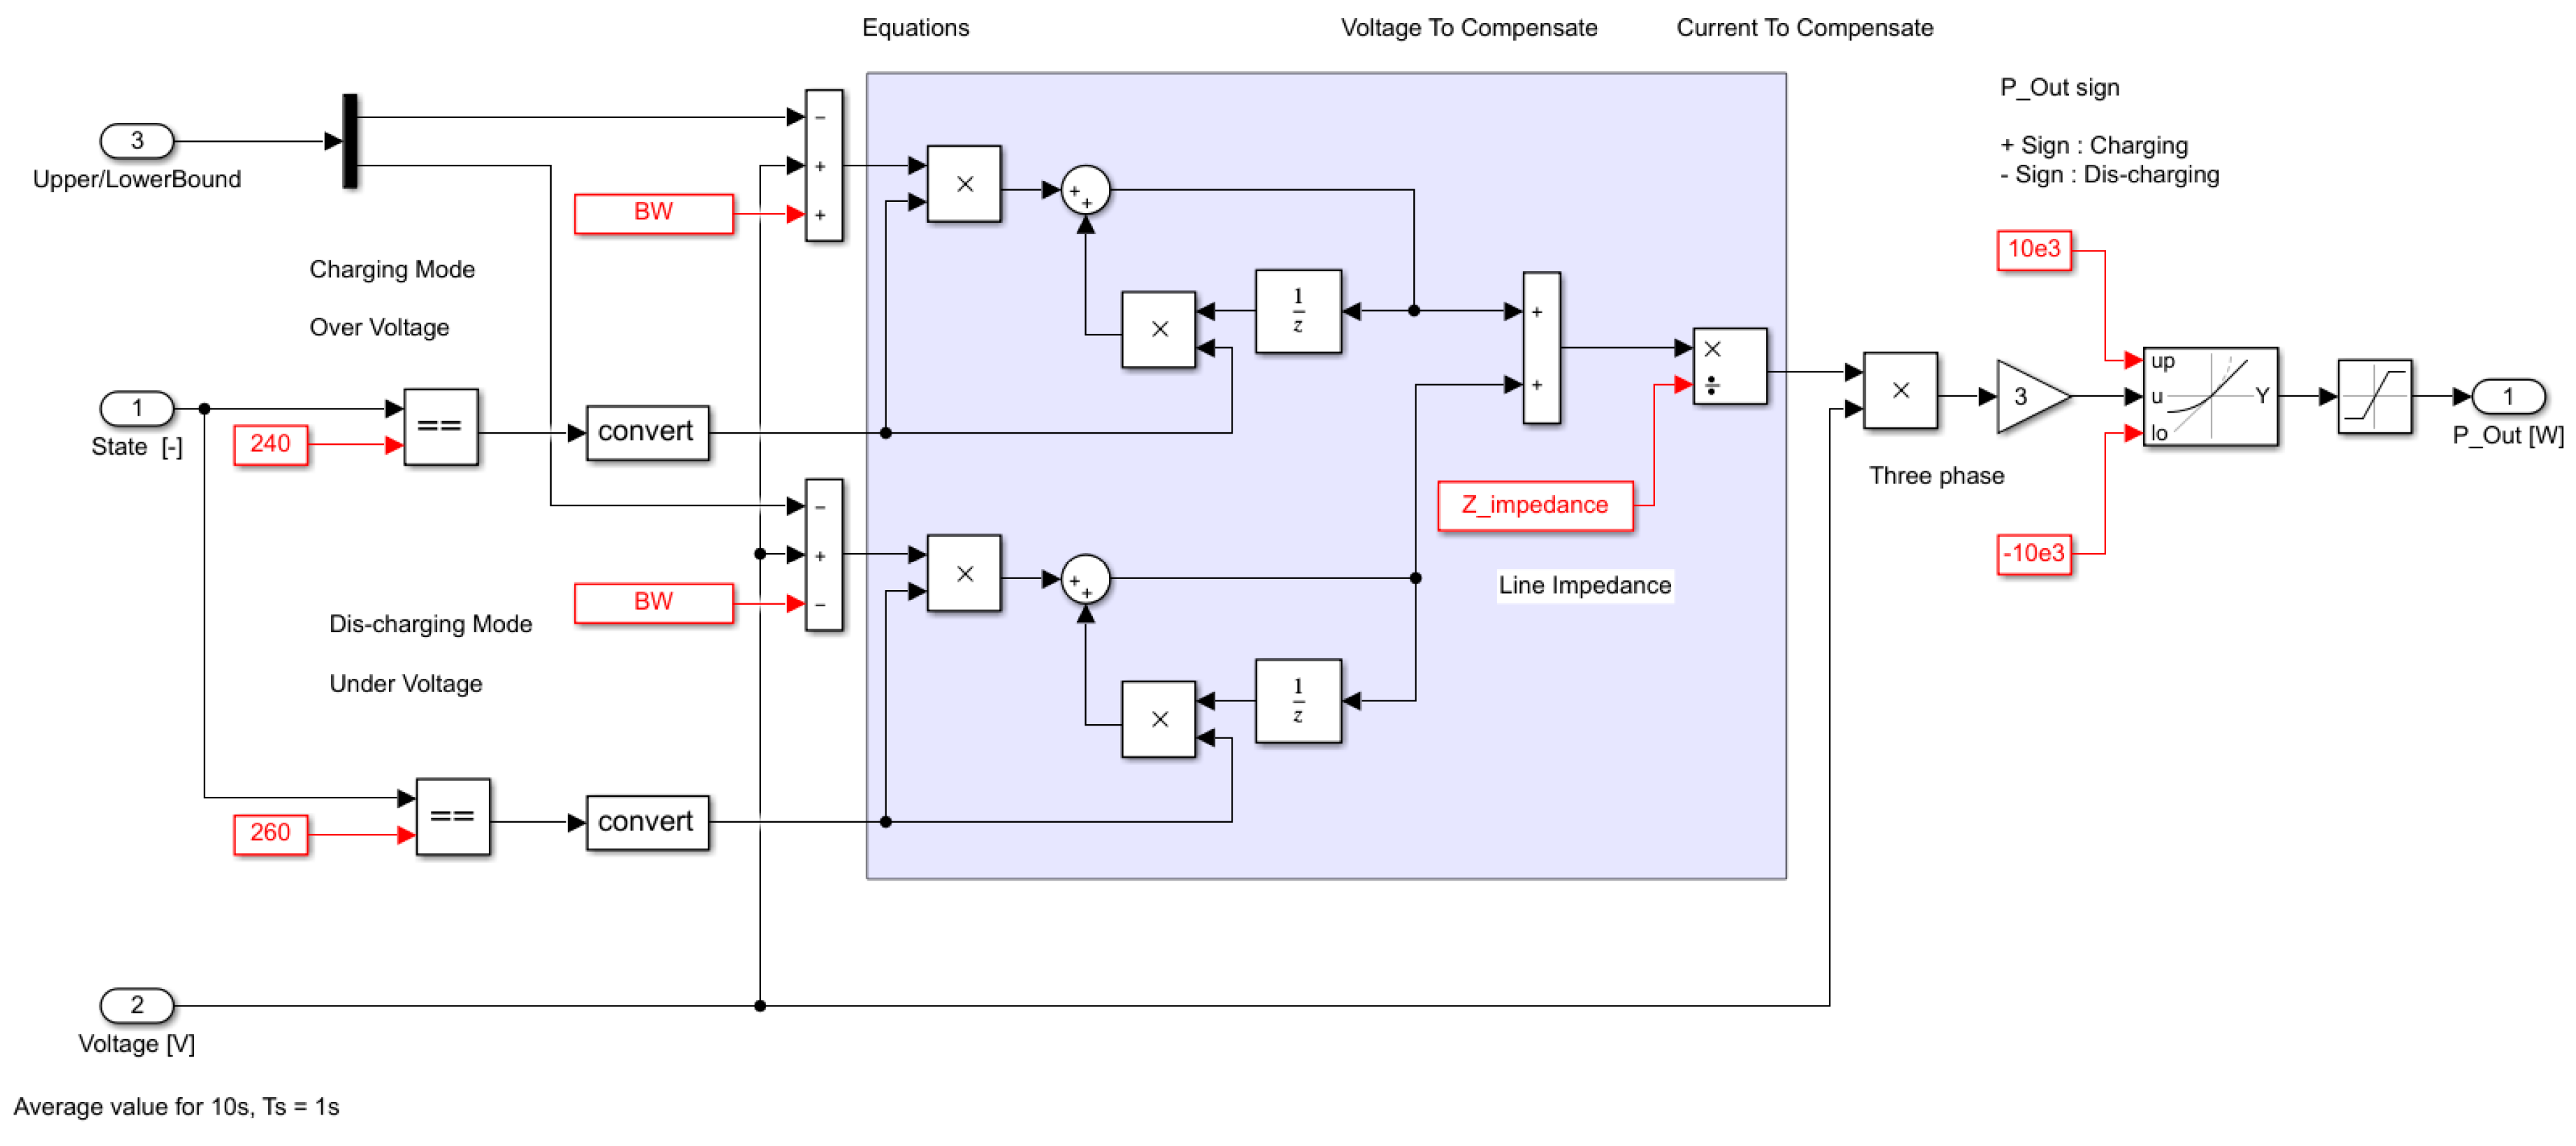
5.4. Control Algorithm Modeling

The EVC infrastructure is an integrated system in which PV, ESS, and loads are linked to the secondary feeder and must be kept in stable operation under various conditions by an external environment. Depending on the unpredictable generation of renewable energy and the consumption loads, such as an EV, the voltage could reach an unstable state occasionally, and an emergency stop may be necessary in case of malfunction of the components. Therefore, the proposed control algorithm is implemented based on the state of the machine to operate the whole system, as shown in Figure 14.
Basically, the state machine for electric charging infrastructure consists of ‘INITIALIZATION’, ‘SELF Test’, ‘Grid Support’, ‘IDLE’, ‘N-STOP’, and ‘E-STOP’. At first, it receives measurement data from each component of the EVC infrastructure, then processes the raw data through post-processing and checks the alarm state based on it. For instance, if the voltage is reached out of the upper and lower limit boundary in the EV charging infrastructure, the state moves to ‘Grid Support’ and executes the internal algorithm, which is expressed in Figure 15.
Combining the Low Voltage (LV) distribution system, PV, ESS, load, EV, and EMS with the proposed algorithm, the entire simulation model is generated using MATLAB/SIMULINK, as shown in Figure 16.

6. Case Studies

6.1. Performance Index

The characteristic of feeder voltage distributions can be evaluated by the degree of how close feeder voltages are maintained to the rated voltage. Therefore, a performance index can be defined as a form of the squared differences between the rated voltage and feeder voltages in the secondary feeder as bellows:
P I ( t x ) = t x = 1 T i = 1 N [ { V c i t ( t x , i ) V r a t e d } 2 ] .
where V c i t ( t x ) is the feeder voltage in the secondary feeder at i section, V r a t e d is the reference voltage (220 V), T is the total operation time, and N is the total amount of the section.

6.2. Simulation Condition

The electric vehicle charging infrastructure presented in this paper is a system which is connected to the low voltage distribution system, and power cables and transformers should be configured in accordance with power characteristic and capacity. In addition, the low voltage distribution system should be properly modeled because the X/R ratio of the line impedance is low compared to the transmission system so that the magnitude of the active power is dominant to voltage fluctuation. To verify the proposed algorithm, the configuration of EVC infrastructure was modeled as a distribution grid, transformer, and line impedance, as shown in Figure 17. And the dynamic voltage variation caused by the line impedance according to the power flow between the EV charging infrastructure and the PCC (Point of common coupling) of the distribution grid is shown in Section 3.
Based on the model of the secondary feeder with EVS infrastructure, system parameters and a section of the secondary feeder are assumed by Table 3, and simulations were performed in DELL M3800 Laptop with an Intel Core i7-4712HQ CPU @2.30 GHz and 16.0 GB RAM. Here, the pole transformer ratio of the incoming point from the primary feeder was considered as 13,200 V/230 V, and the line impedance (X/R) ratio was assumed as the value of resistance bigger than value of the reactor according to the general characteristic of the secondary feeder.
The load pattern, the output of RES with the PV system and the demand pattern of EV charger was predicted, as shown in Figure 18. The above patterns were simulated by the operation characteristics under the 30 kW scale based on the EVC infrastructure capacity. EV charging was assumed as standard 3 EV chargers having 7.7 kW capacity. In addition, the PV system assuming a renewable energy resource was considered as equal capacity to the total EV charger capacity. Furthermore, the load pattern was assumed by the residential profile in KOREA.

6.3. Analysis of the Secondary Feeder Voltage Characteristic by Voltage Stabilization Operation of ESS

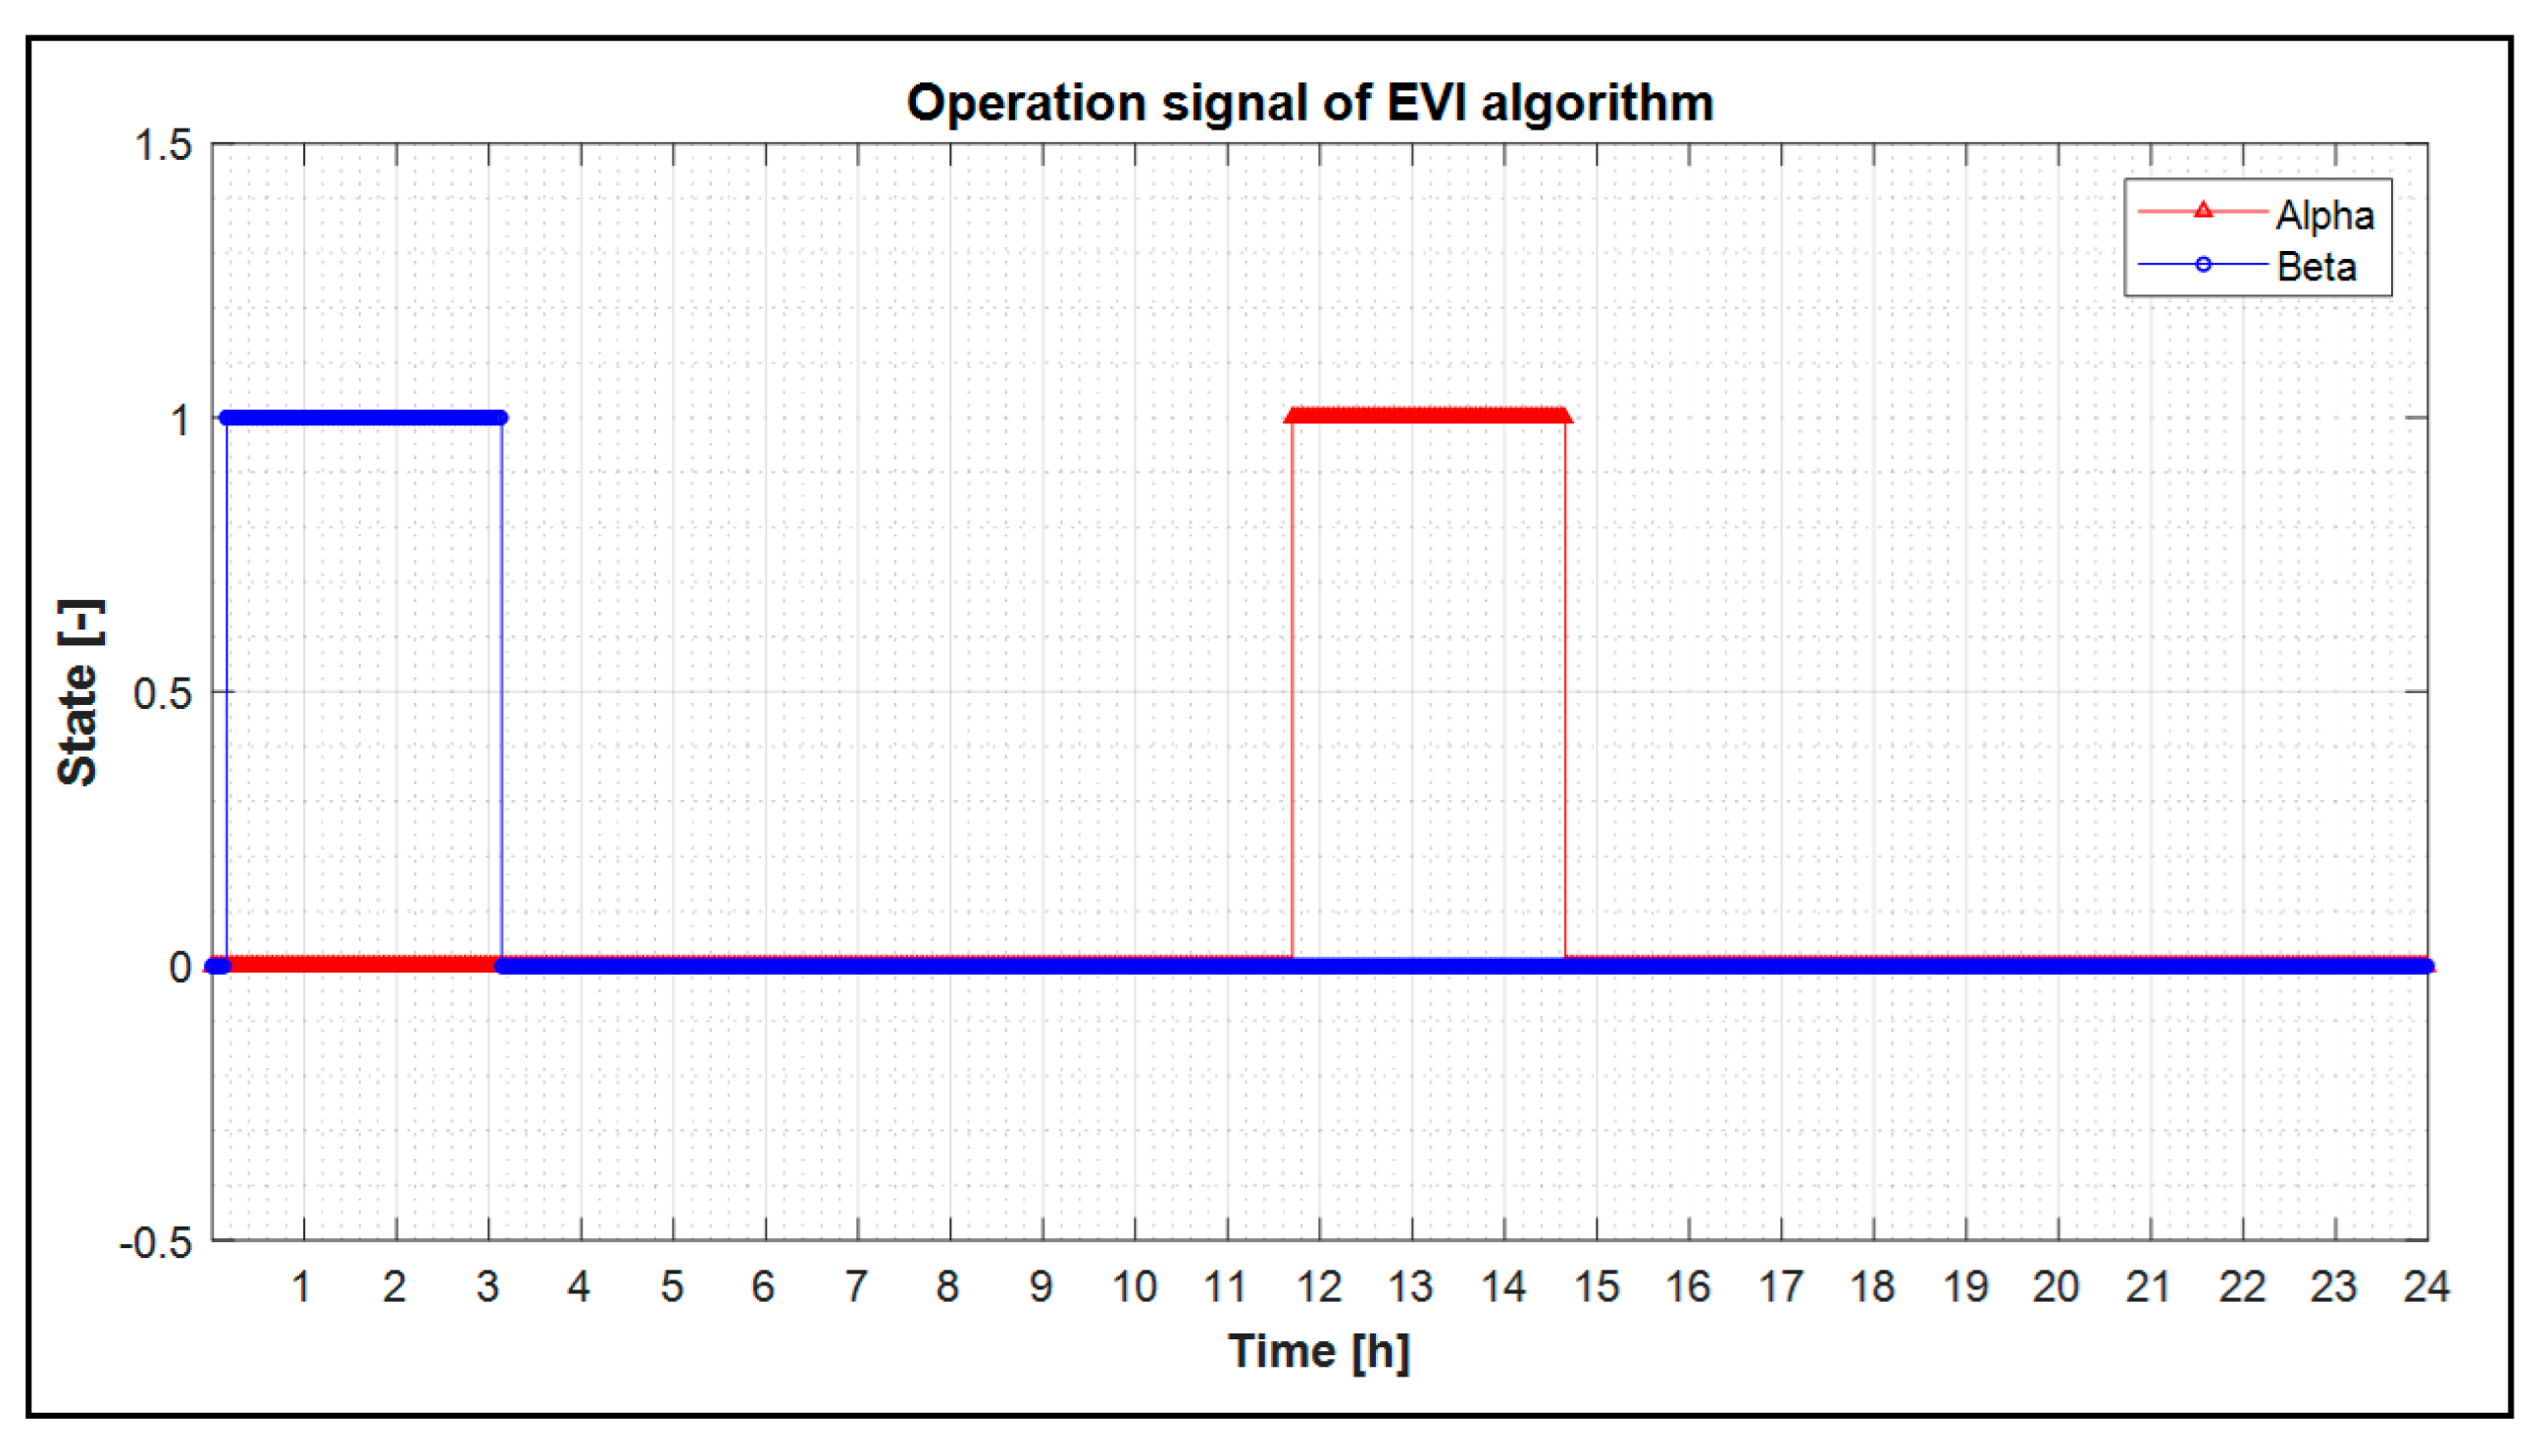
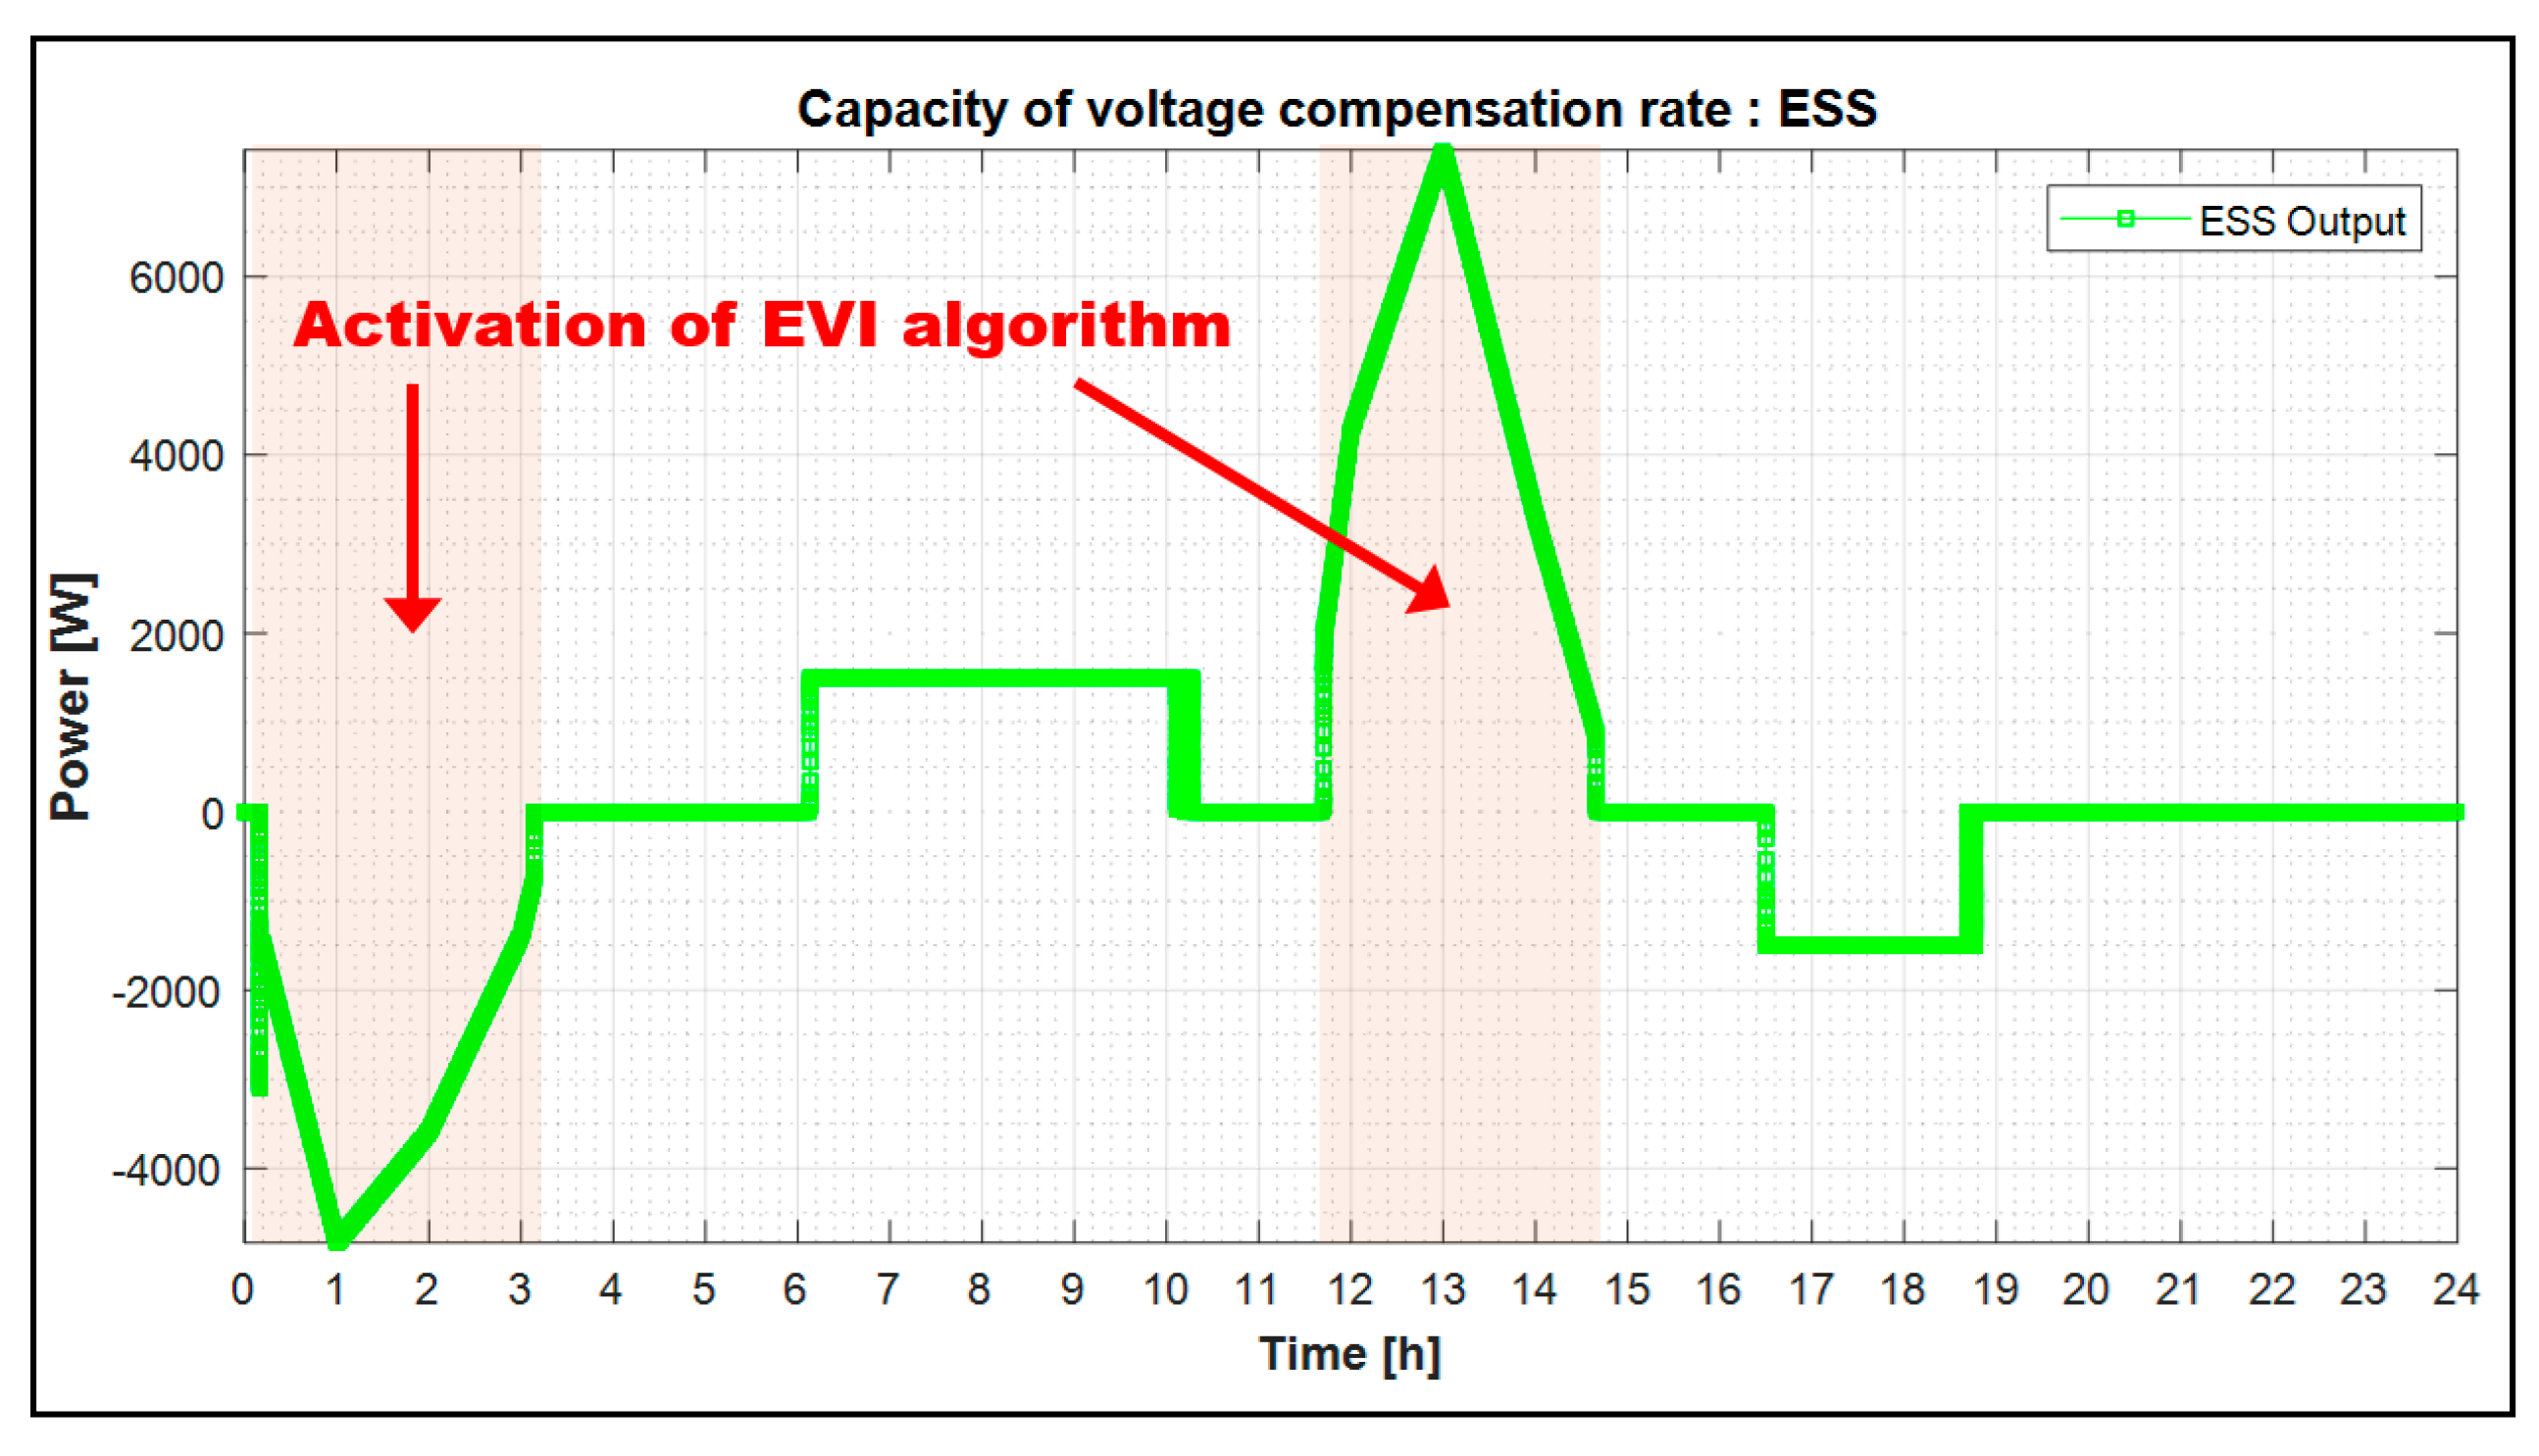
6.3.1. Verification of the EVI Algorithm for Voltage Stabilization Strategy

Based on the AVI-algorithm, the control characteristic of the ESS is analyzed for the voltage stabilization operation when the feeder voltage was not kept at an allowable limit. In this case, it is confirmed that the ESS has been exactly controlled by the operation determination signal which is ( α ( t x ) :   c h a r g i n g ) and ( β ( t x ) :   d i s c h a r g i n g ) in Figure 19. At the time, the ESS outputted as much as the capacity of the voltage compensation rate for the voltage stabilization in Figure 20. Therefore, it was clear that the EVI algorithm of ESS for voltage stabilization was a useful tool.

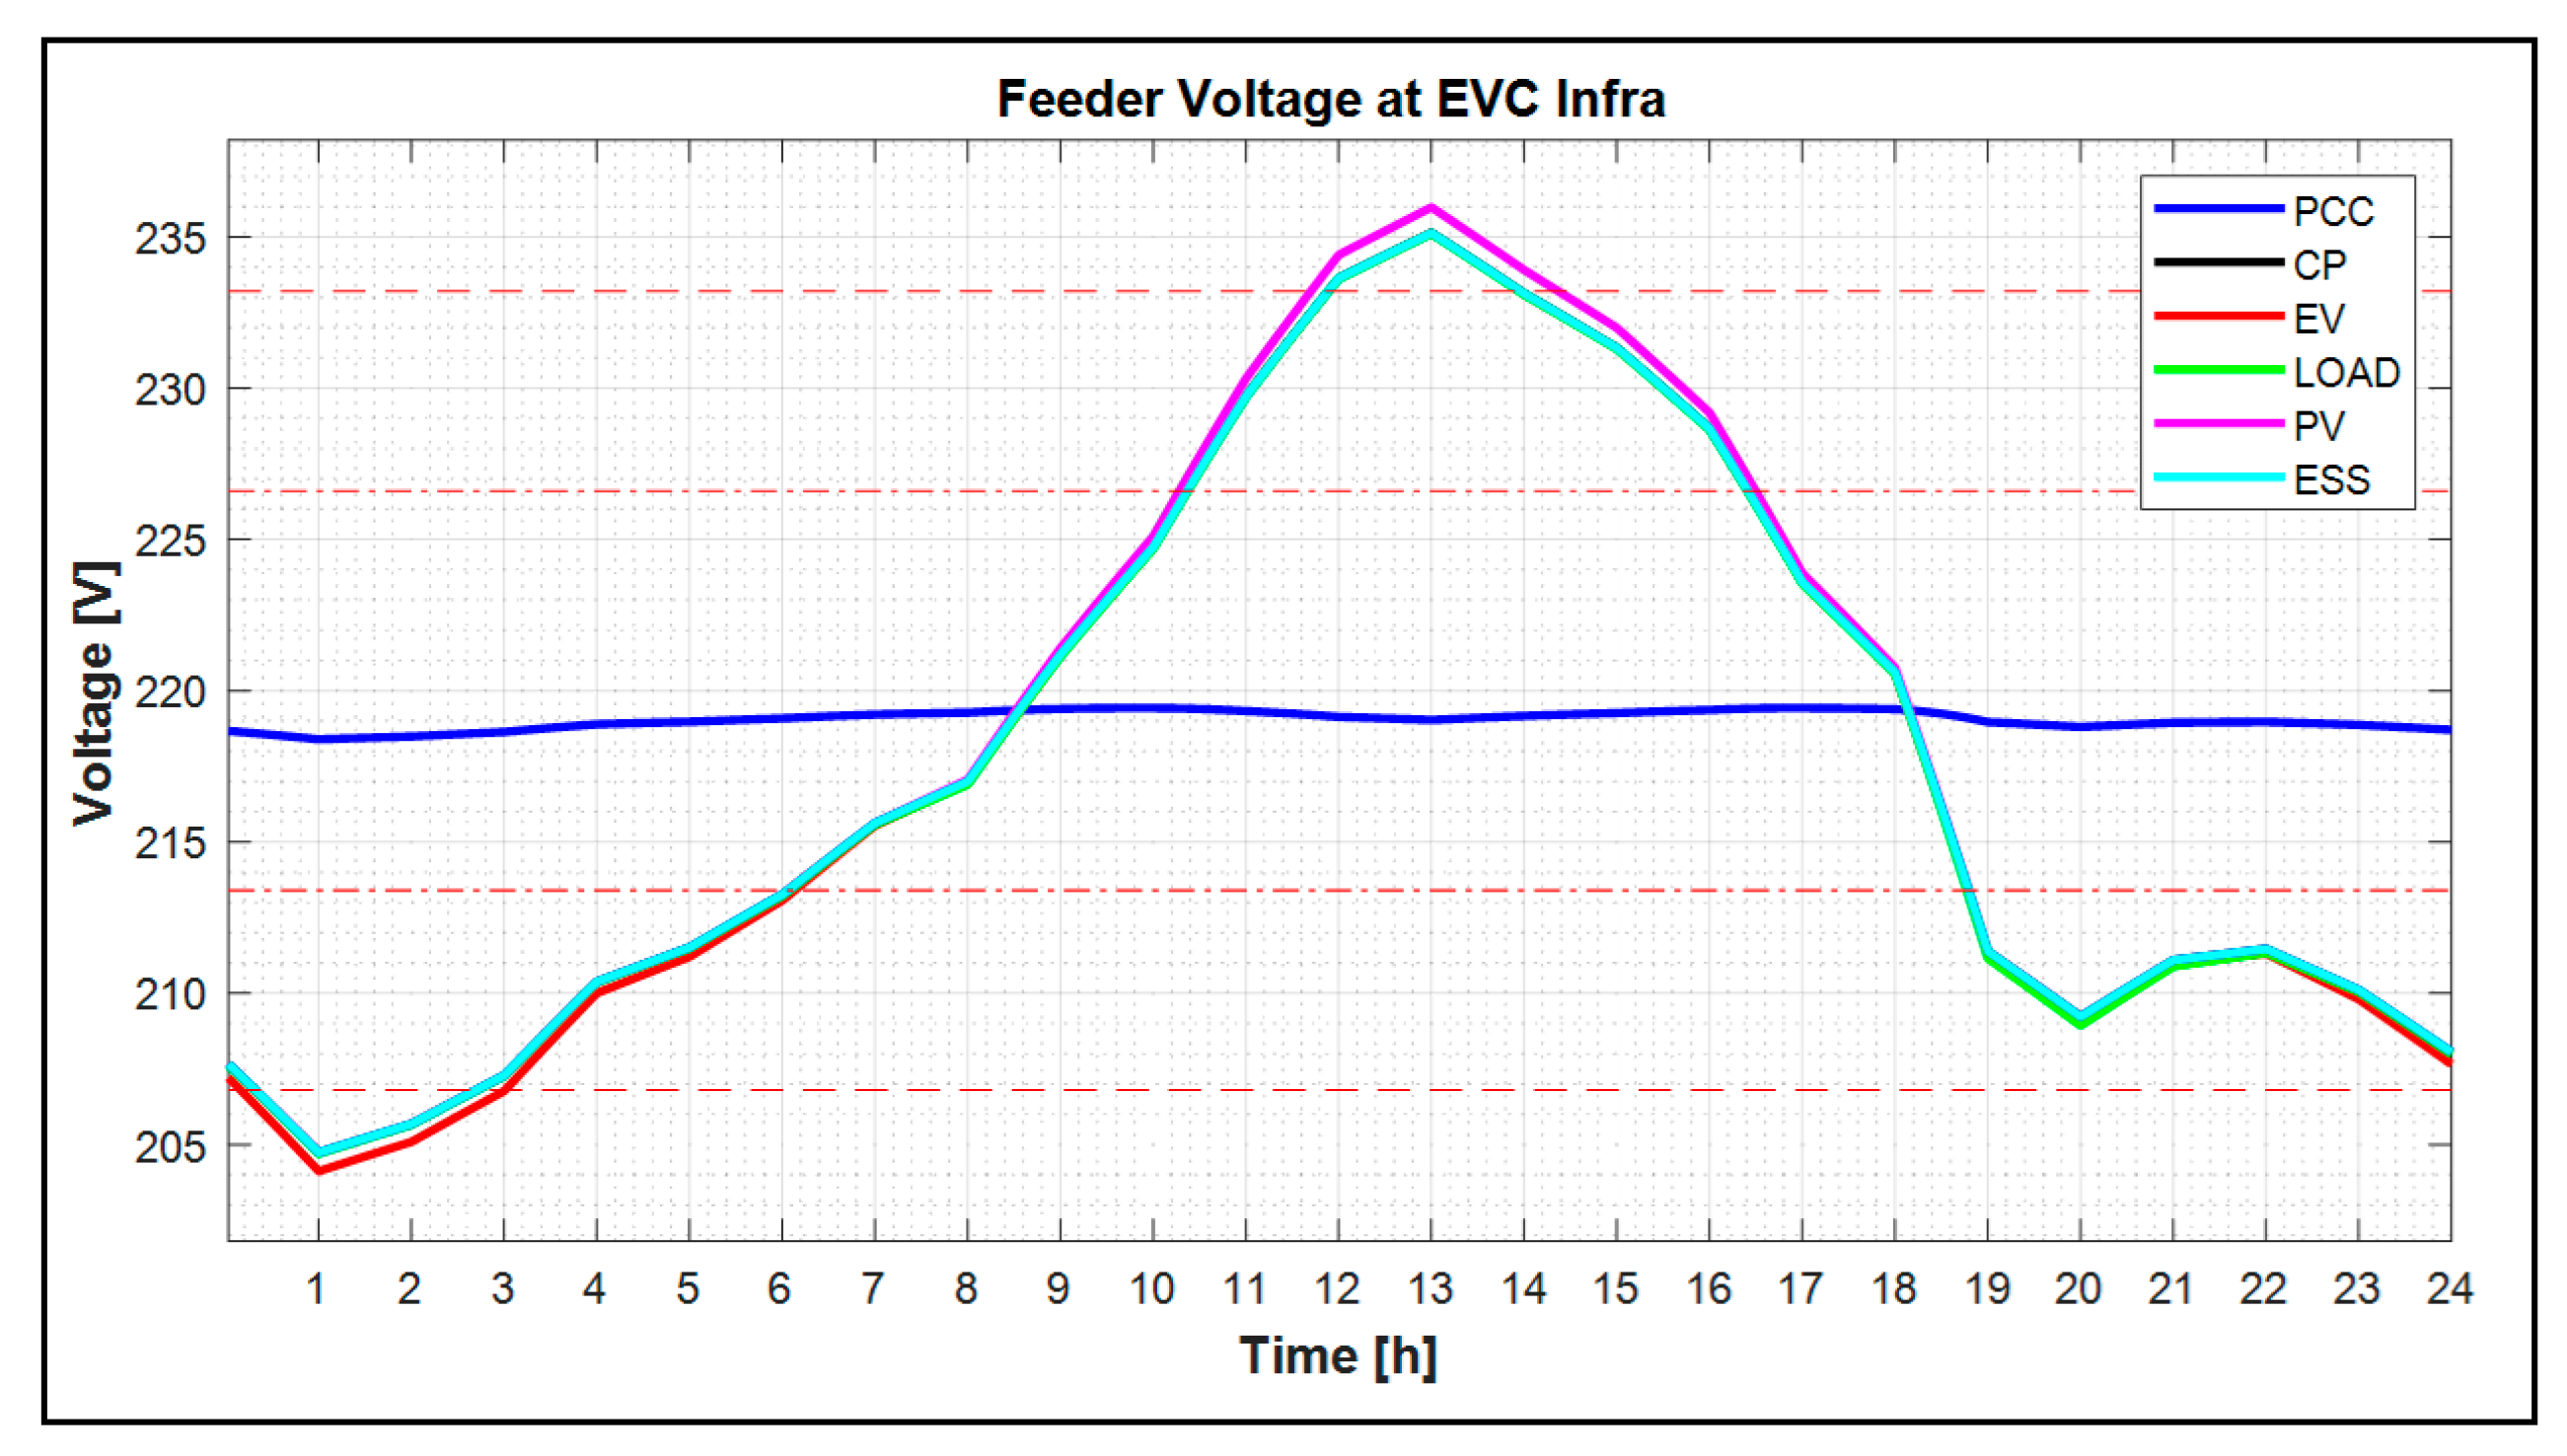
6.3.2. Analysis of the feeder voltage characteristic by the introduction of ESS

Figure 21 means the feeder voltage characteristics at the EVC, consumer, and PV sections in the EVC infrastructure site without the ESS. Here, the feeder voltage was analyzed as an average value per 10 minutes from 00:00 to 24:00 (all time). From the results of the simulation, it shows that the feeder voltage could not be maintained to reasonable conditions (over-voltage phenomena) at 11:50–14:20 when the PV system generated the maximum output, as shown in Figure 21. In addition, at 00:00–03:00, the feeder voltage was also less than the lower limit due to the energy demands of the EVC and customer. Therefore, the feeder voltage could not be exactly maintained within the allowable limits because the voltage was not compensated by the ESS.
Figure 22 means the feeder voltage characteristics at the EVC, consumer, and PV sections at the EVC infrastructure site with an ESS. Based on the simulation result using MATLAB/SIMULINK, all of the feeder voltages at the point of common coupling (PCC) section, including all sections, could be perfectly kept within the allowable limits by the EVI-algorithm of an ESS. Meanwhile, from the over voltage (from 11:50 to 14:20 and low voltage (from 00:00 to 03:00) phenomena, it is confirmed that they were solved by the voltage stabilization operation of the ESS expressed by Figure 22. Therefore, the voltage stabilization operation by ESS should make the feeder voltages of the distribution system (secondary feeder) introduced by the EVC infrastructure maintain better voltage conditions.

6.4. Analysis of the SOC Characteristic of ESS According to the Application of SOR Algorithm

6.4.1. Verification of the SOR Algorithm for Maintain of Proper SOC Operation Range of ESS

To verify the performance of the SOR algorithm when the ESS does not operate as a voltage stabilization function, Figure 23 shows the SOR operation signal, which is the γ ,   ε ,   and   δ signal at [STEP 5] and [STEP 6] in Section 4. In this case, the operation of the ESS, as shown in Figure 23, until the proper reference range by the determination signal which is γ ( t x ) = 1 ,   ε ( t x ) = 1 ,   δ ( t x ) = 0 (charging mode) or γ ( t x ) = 1 ,   ε ( t x ) = 1 ,   δ ( t x ) = 0 (discharging mode) has been achieved is confirmed. At the time, the operation of the ESS was assumed as 1/4 of the rated capacity to keep the proper reference range of the ESS expressed by Figure 24. Therefore, it was clear that the SOR algorithm to maintain the stable SOC condition of the ESS was a useful tool.

6.4.2. Analysis of the ESS SOC Characteristic by SOR Algorithm

Figure 25 shows the SOC characteristics of the ESS for a 24 h period. Meanwhile, when the ESS does not operated as a voltage stabilization function, and the SOC of the ESS violates the set SOR range, the SOC pattern, as shown in Figure 25, is variated by the operation characteristic of the ESS based on the operation signal of the SOR algorithm earlier. From the result of the simulation, it is confirmed that the SOC of the ESS when in the standby condition could be exactly maintained within the proper reference range.

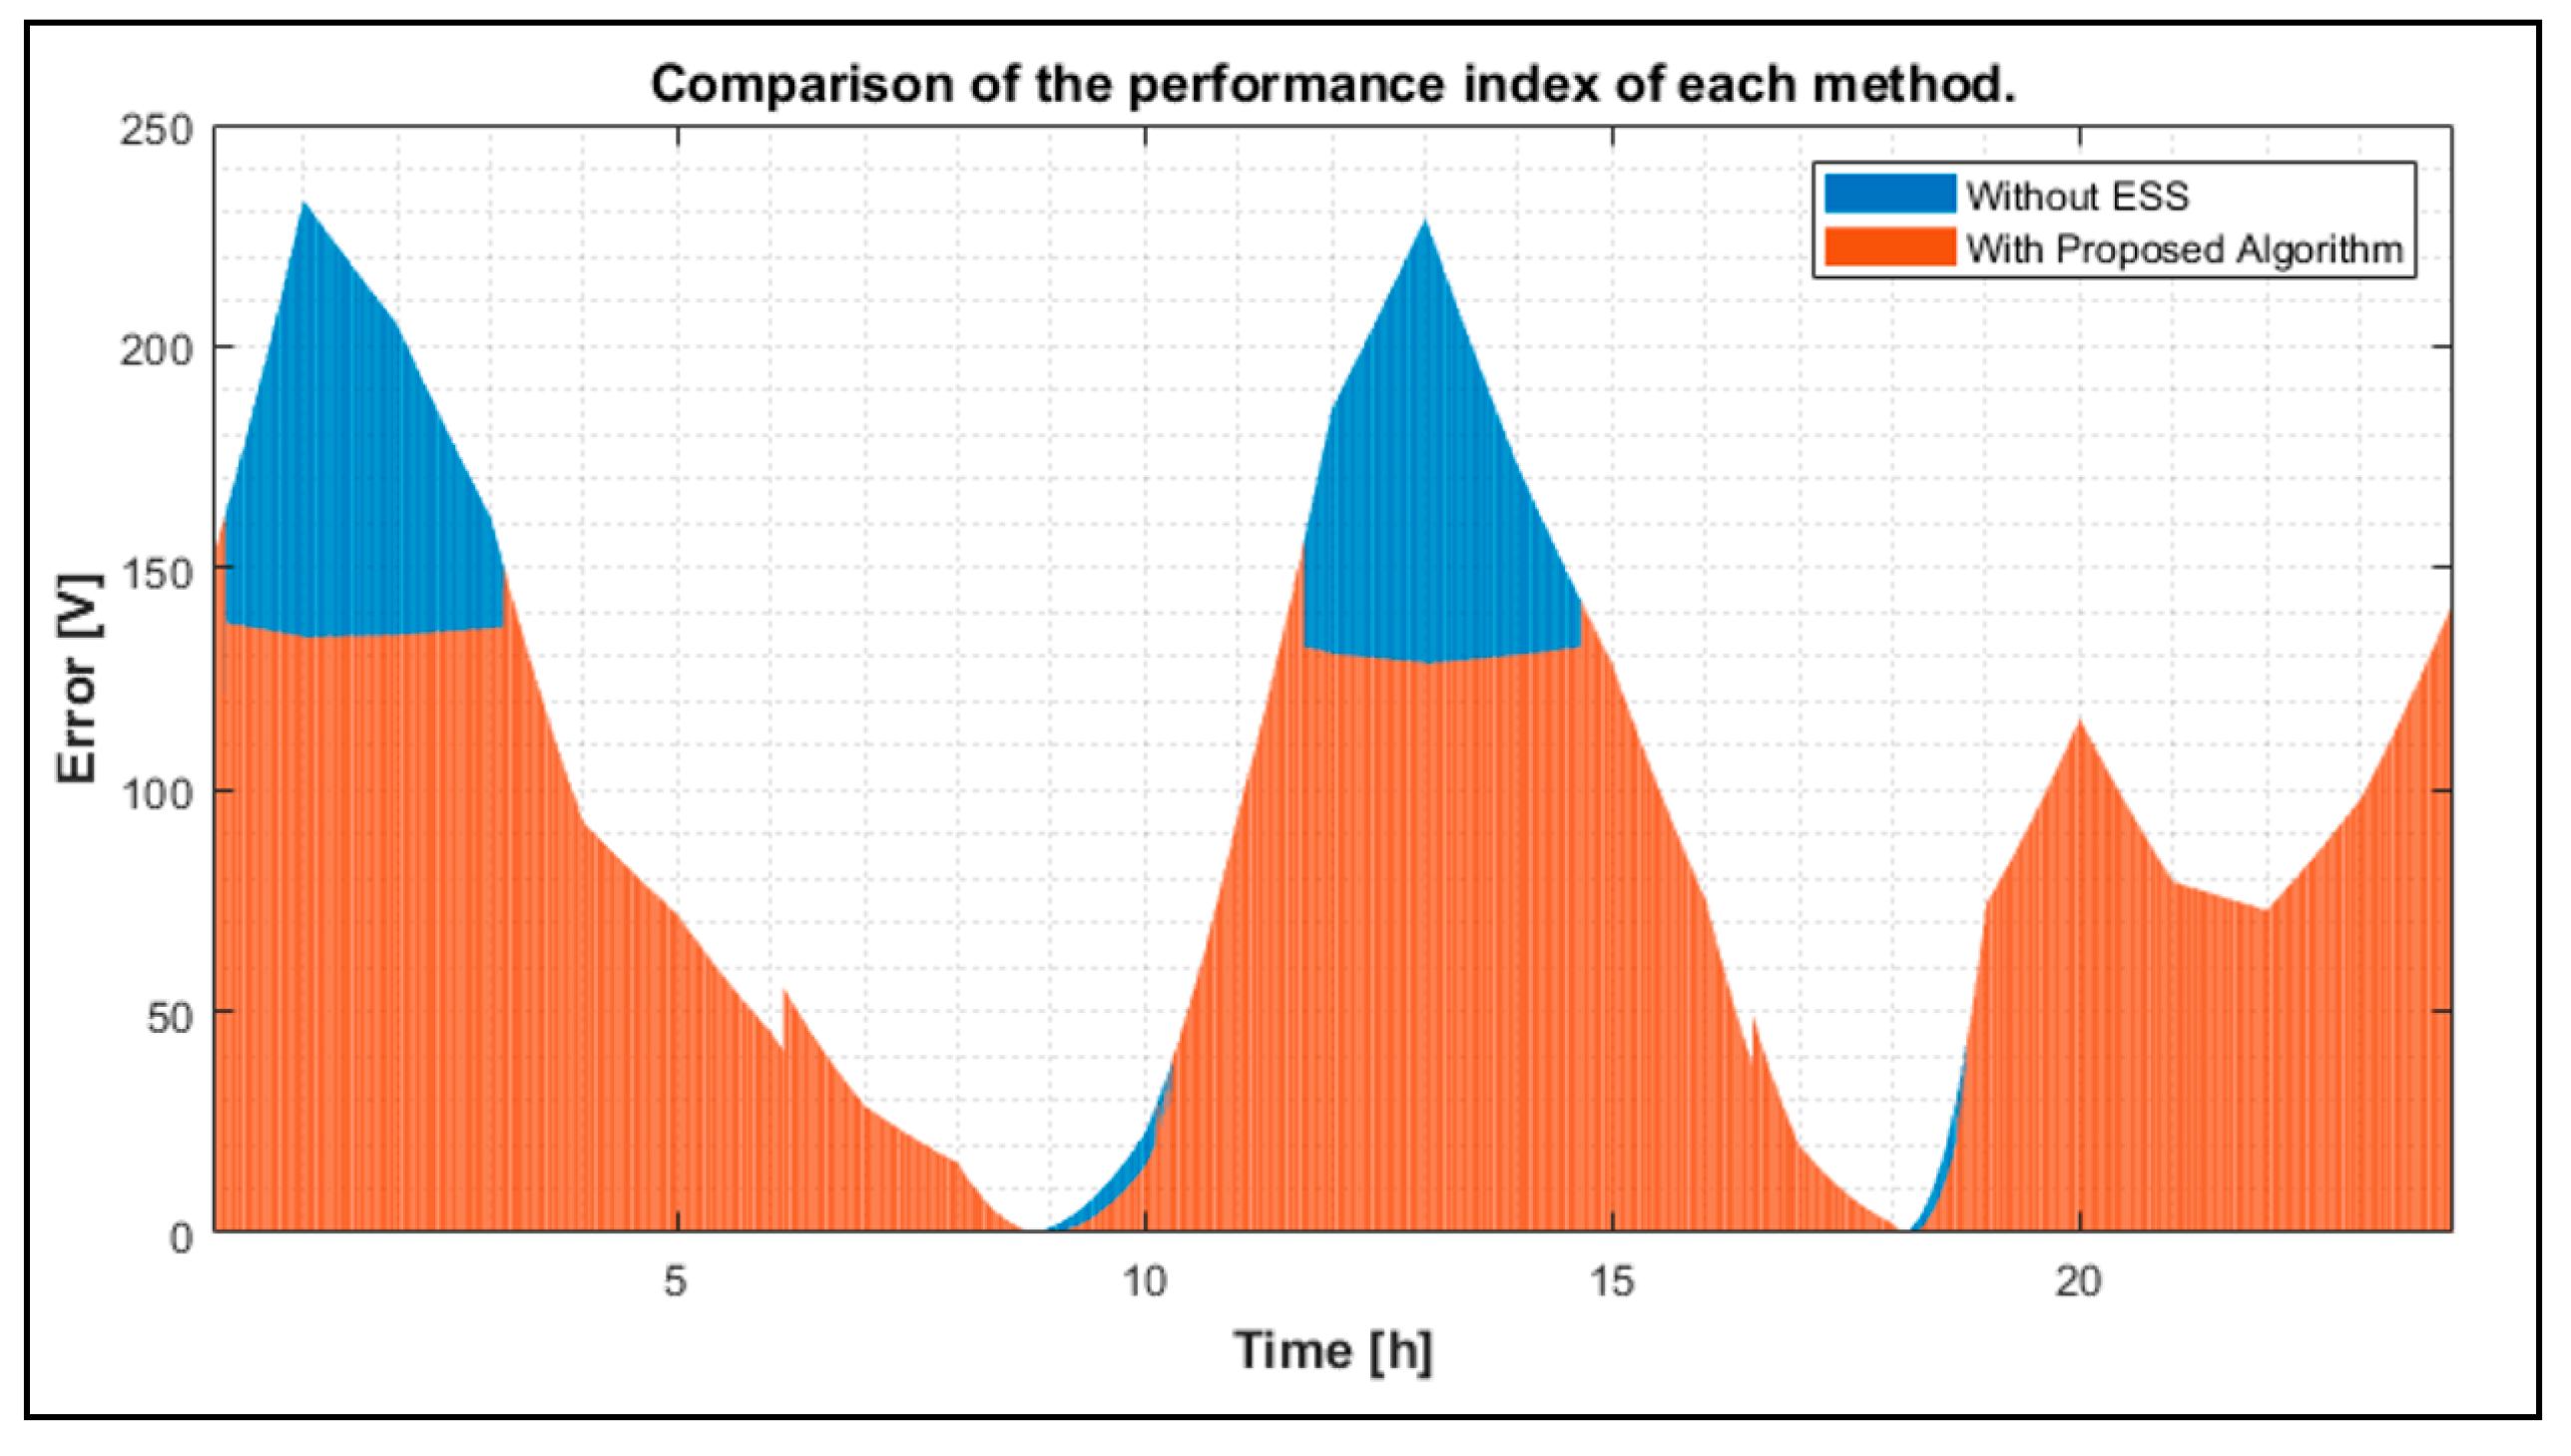
6.5. Performance Caluation for Feeder Voltage Characteristic

Figure 26 and Table 4 show the performance index by the introduction of the ESS at the EVC infrastructure site with renewable energy sources in the secondary feeder. Based on the result of the performance index based on Table 4, it is confirmed that feeder voltages in the distribution system (secondary feeder) can be maintained within the allowable limit. Therefore, the case study results show that this strategy is an effective tool to solve the voltage problems by an ESS.

7. Conclusions

The paper proposed an electric vehicle infrastructure stabilization (EVI) algorithm to maintain the allowable limit for power and voltage of the secondary feeder through an ESS introduction with an electric vehicle and renewable energy resource at the end of the section. In addition, the paper presented an estimation method to keep the proper SOR considering the ESS operation condition when the ESS is not operated by the EVI-algorithm. The main results are summarized as follows:
(1)
To operate the ESS introduced in the EVS infrastructure, this paper presented a method to determine the line impedance based on the voltage and the passing current on the existing secondary feeder with RES and EV infrastructure. Specifically, based on the least square method, the optimal line impedance value was determined by the relationship between the pole transformer voltage and the power common coupling voltage at the EVS infrastructure, including passing current.
(2)
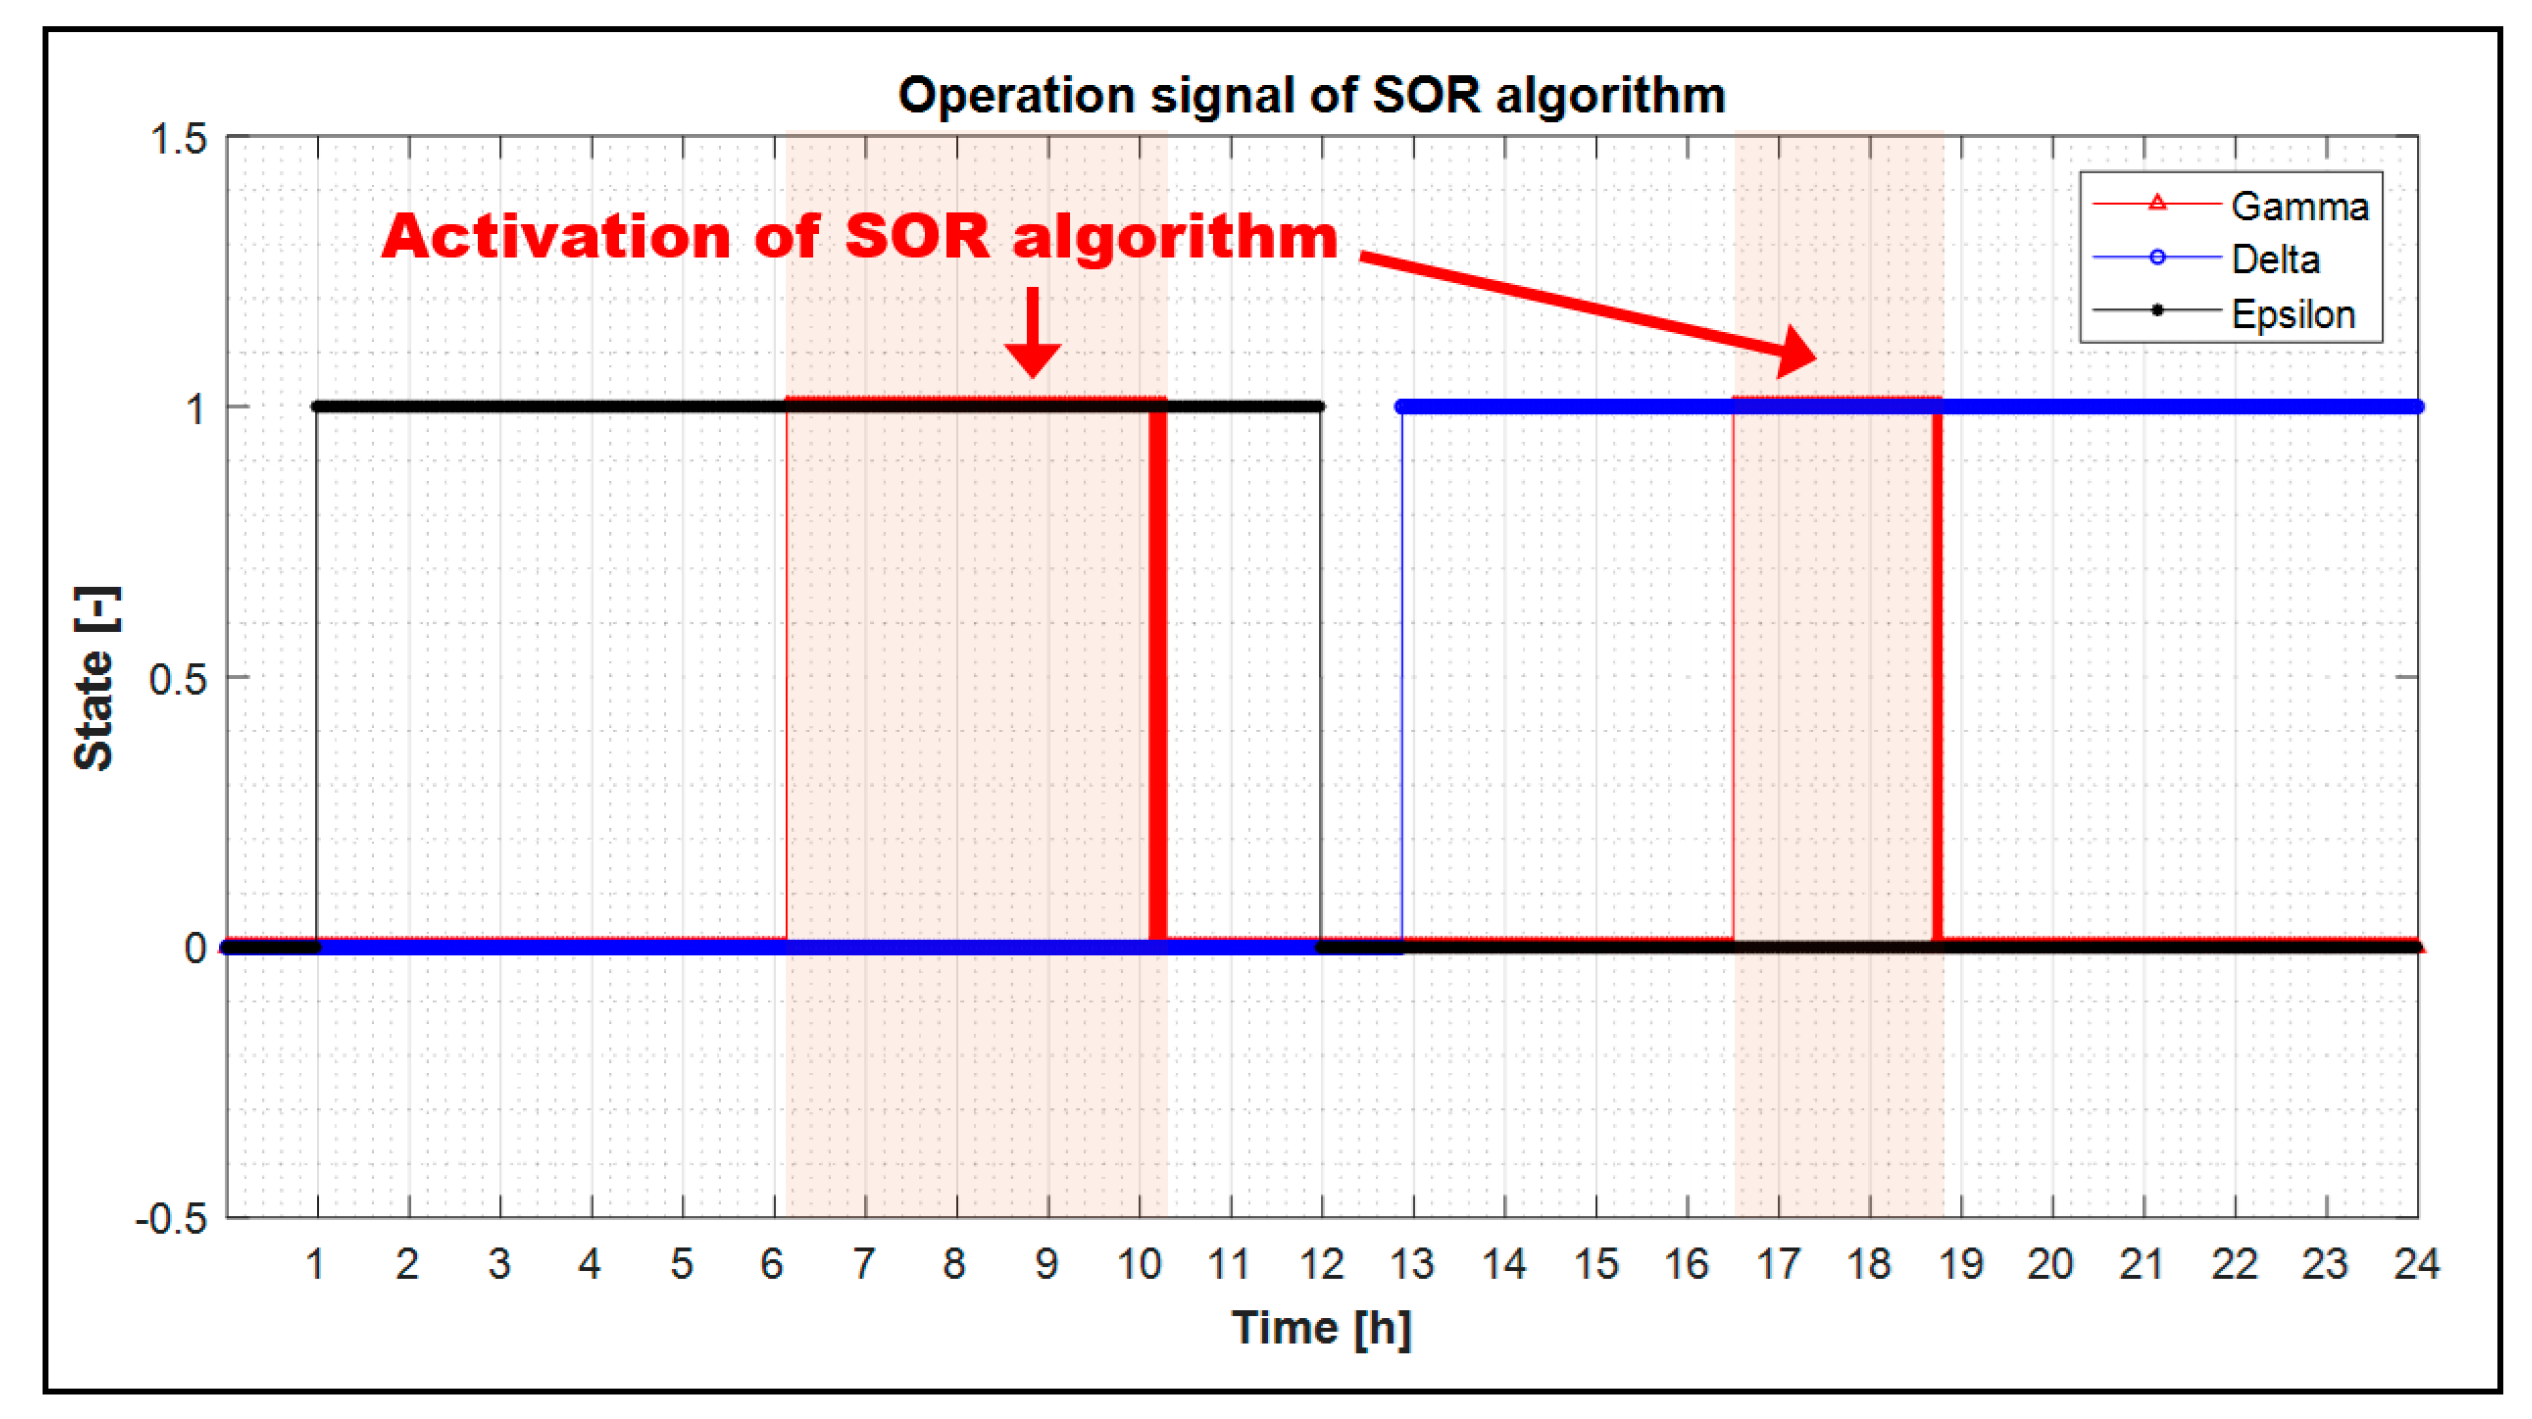
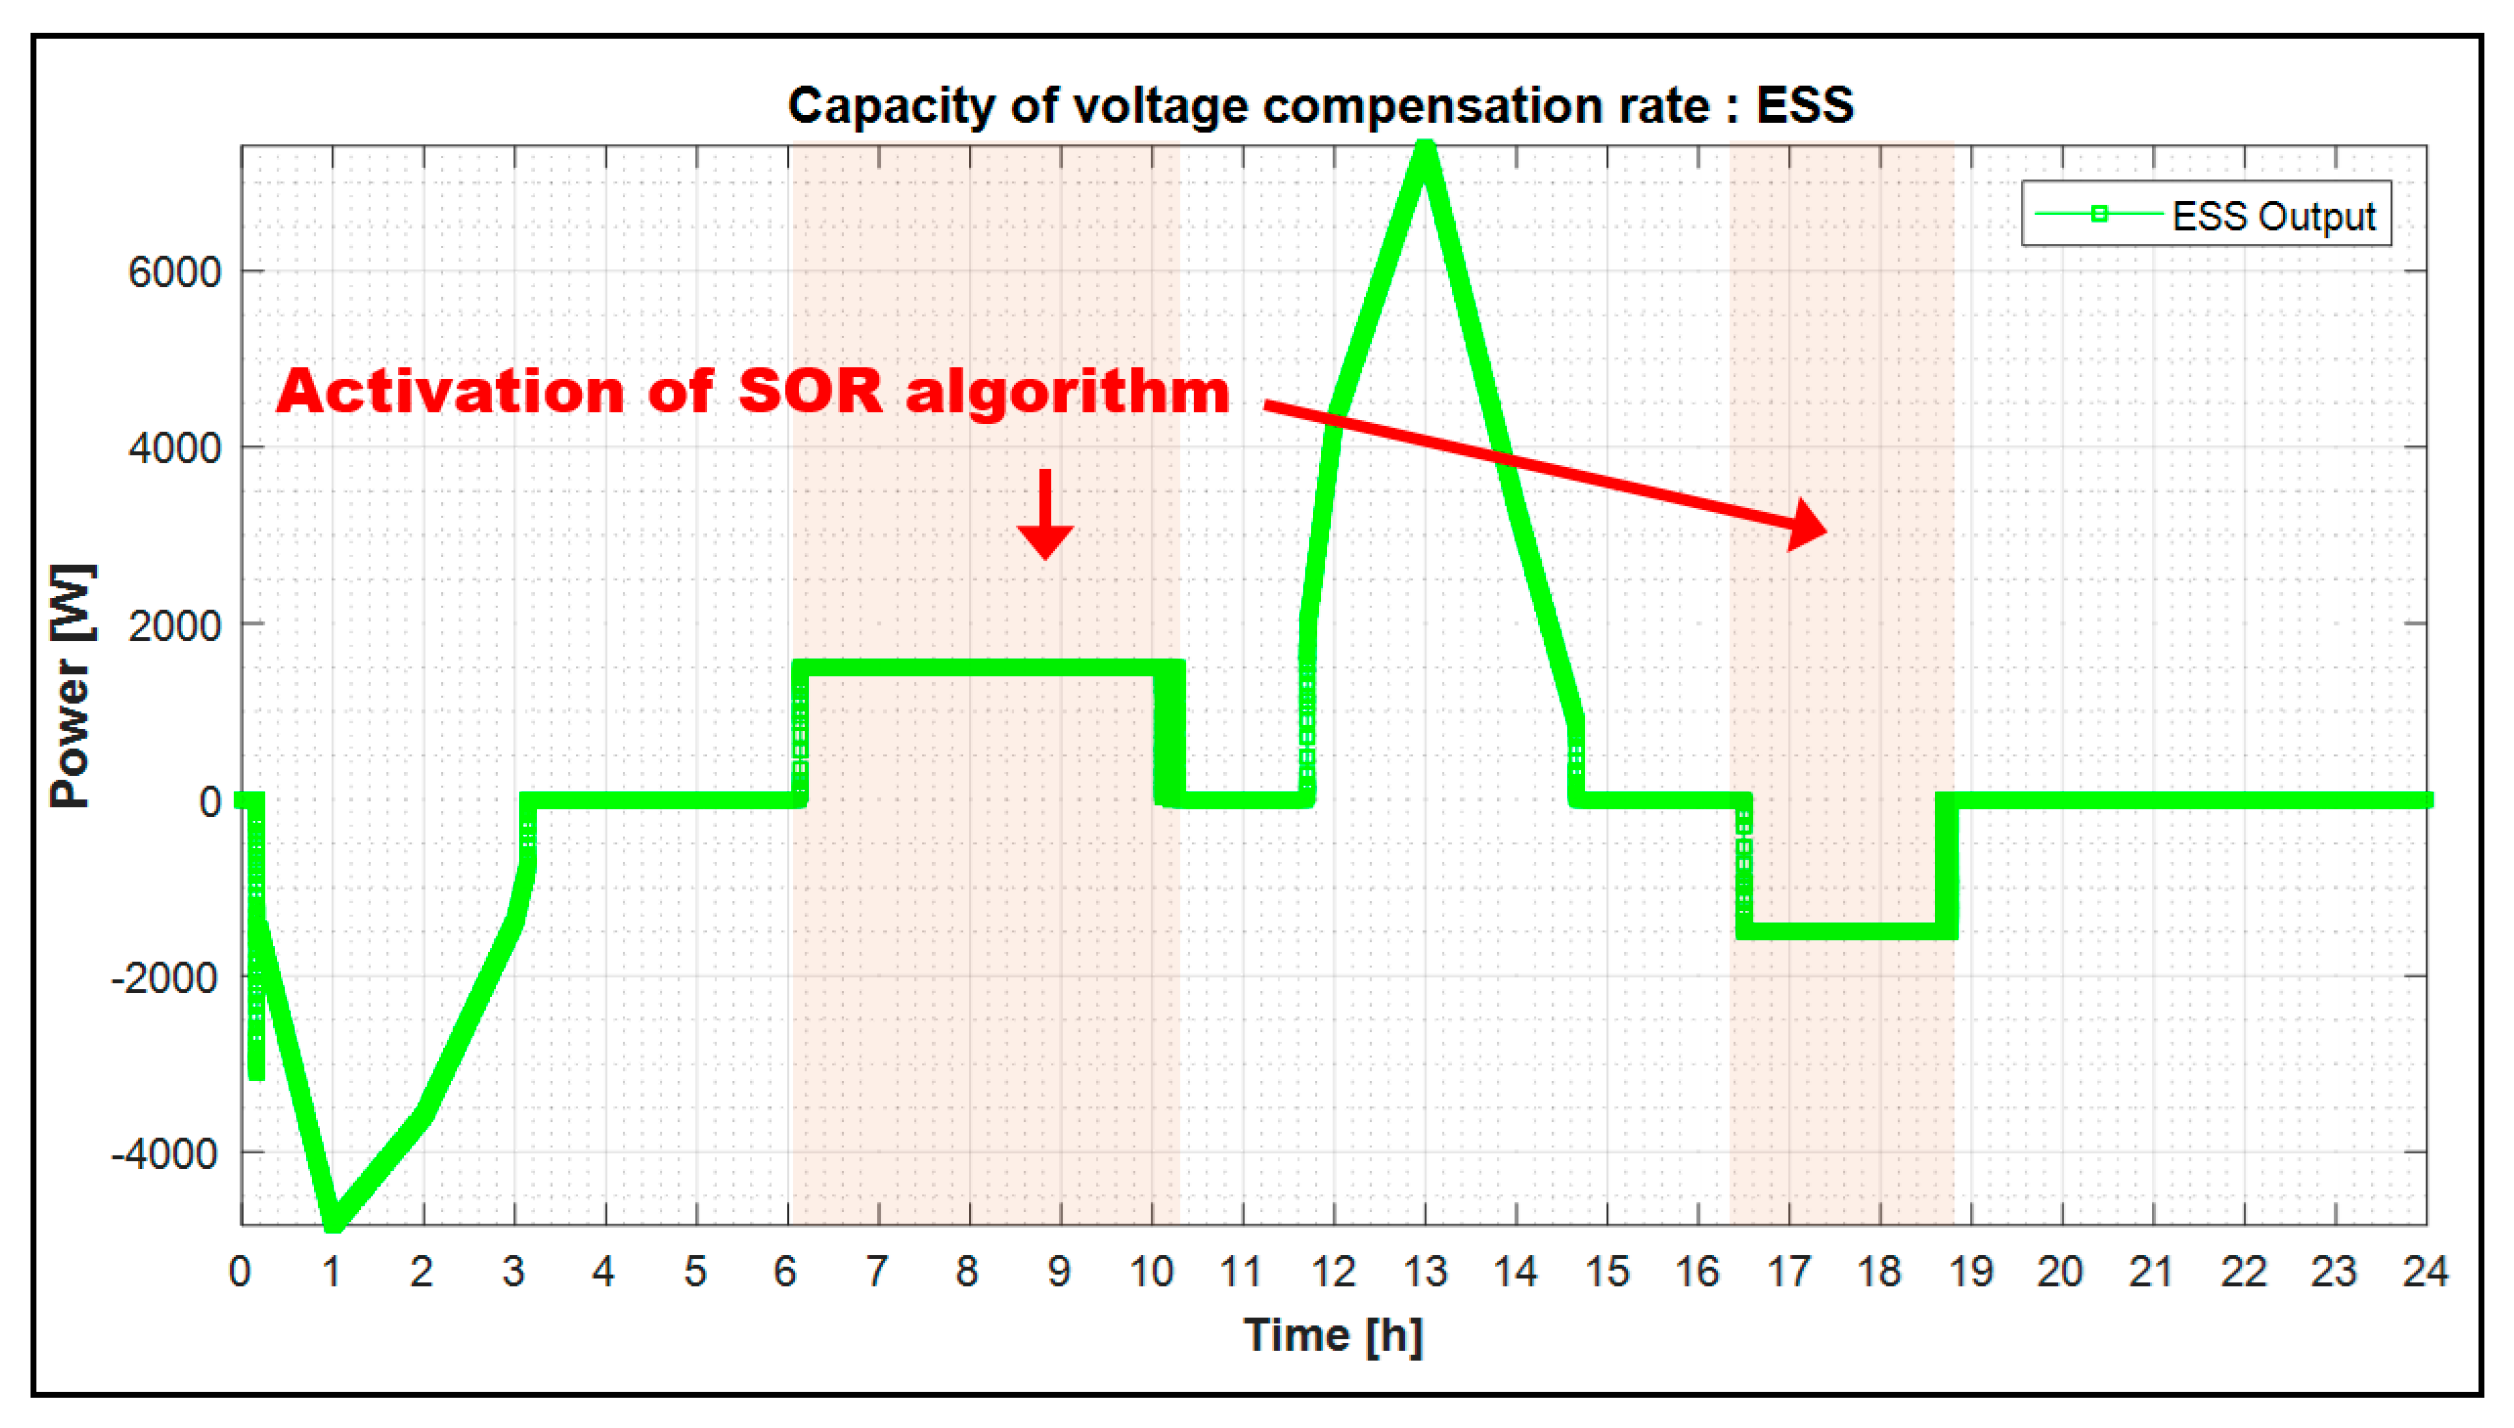
To overcome voltage problems at the EVC infrastructure in the secondary feeder, a voltage compensation method by the ESS operation was proposed. The control characteristic of the ESS was analyzed for the voltage stabilization operation when the feeder voltage was not kept at an allowable limit. In this case, it is confirmed that ESS has been exactly controlled by the operation determination signal.
(3)
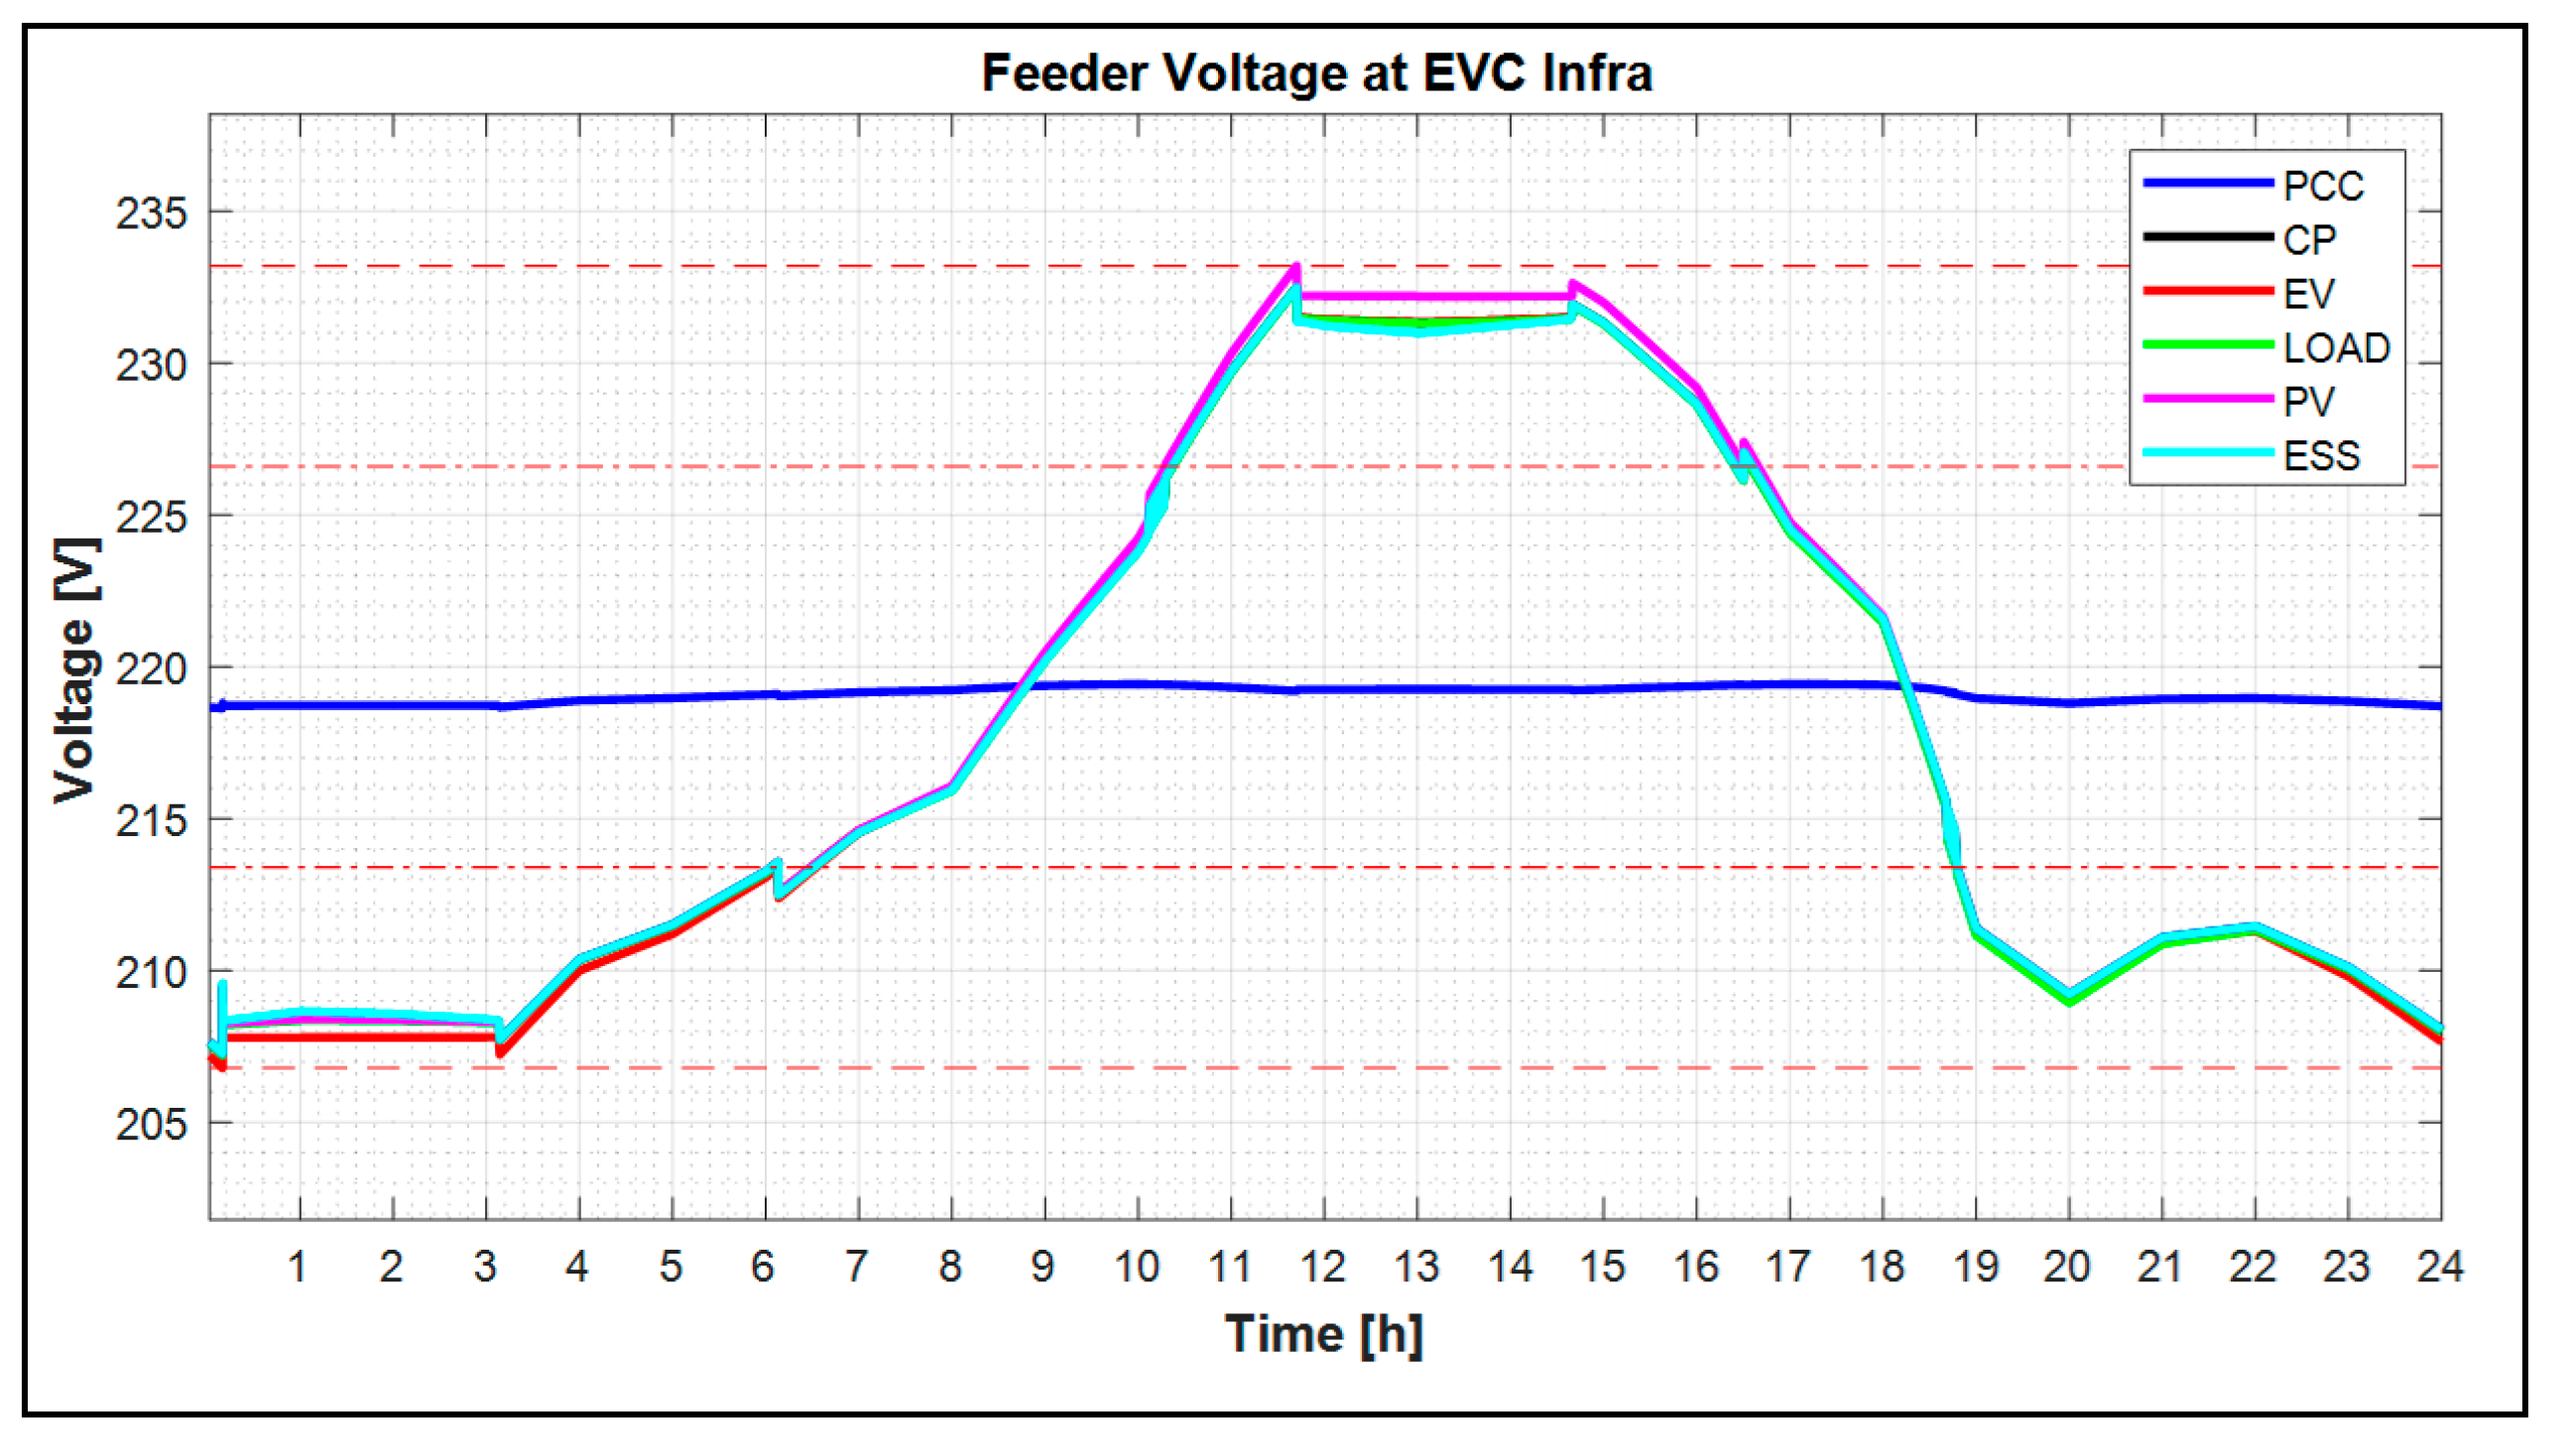
Therefore, from the simulation results, it was confirmed that all of the feeder voltages at the PCC section, including all sections, could be perfectly maintained within the allowable limits by the EVI-algorithm of the ESS in case the feeder voltage could not be maintained to reasonable conditions (over/under voltage phenomena) by the maximum output of PV system, energy demands of the EVC, and load.
(4)
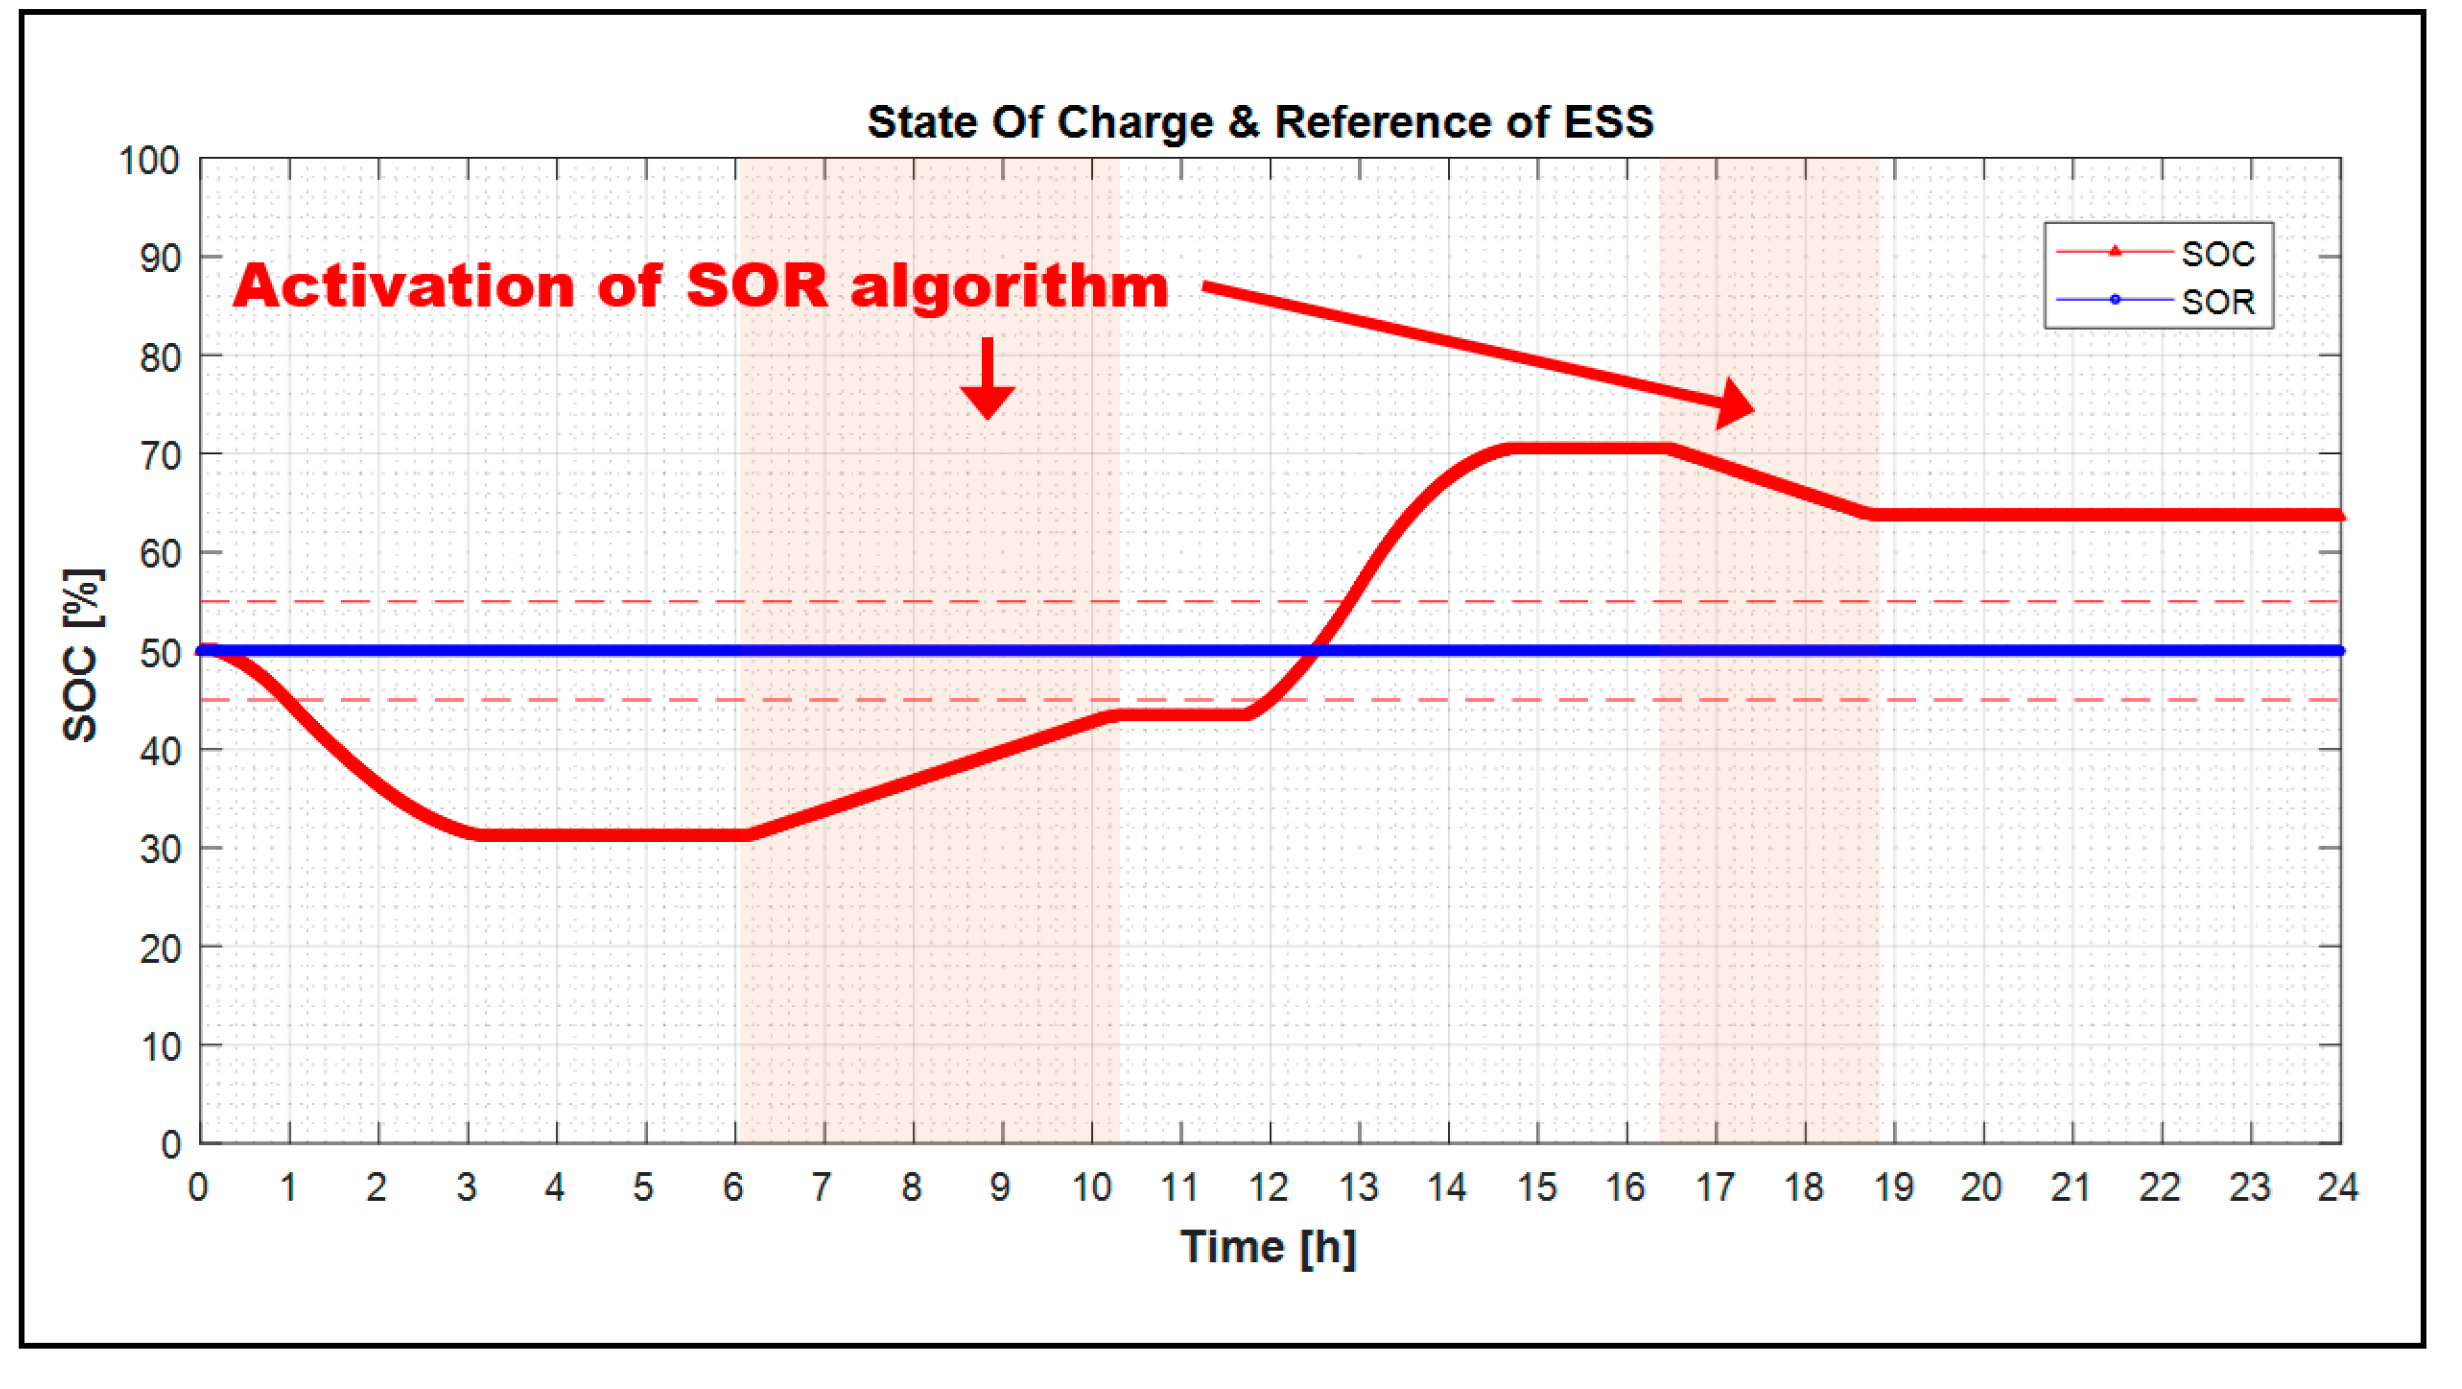
When the ESS did not operate as a voltage stabilization function and the SOC of the ESS violated the set SOR range, the SOC pattern was varied by the operation characteristic of the ESS based on the operation signal of the SOR algorithm. Based on the simulation, it was confirmed the that this strategy is an effective tool to solve the no guarantee problems for operation papacy by the ESS.
(5)
Based on the result of the performance index base, it was clear that feeder voltages in the distribution system (secondary feeder) could be maintained within the allowable limits. Therefore, the case study results show that this strategy is an effective tool to solve the voltage problems by an ESS. However, since this proposed scheme operates based on centralized control concepts, it was necessary to well configure and operate the communication system with other components, such as inverters, chargers, and measurement devices.
(6)
This study was performed in a simulation environment with certain conditions. Therefore, in our future work, we will implement this algorithm in an EMS system and validate it in a real electric vehicle charging infrastructure. In addition, it is necessary to analyze the difference in the performance index according to the control period of the proposed algorithm and the effect of the change in capacity and combination of the EVC on the proposed algorithm.

Author Contributions

All of the authors contributed to publishing this paper. D.-J.K. and B.K. carried out modeling and simulations, and compiled the manuscript. The literature review and simulation analysis were performed by K.-S.R., H.-S.K. collected the data and investigated early works. All authors have read and agreed to the published version of the manuscript.

Funding

This research was funded by the Ministry of Trade, Industry and Energy, and supported by the Korea Institute of Energy Technology Evaluation and Planning (KETEP) grant number [No. 20182410105070]. This work was conducted under the framework of the Research and Development Program of the Korea Institute of Energy Research (KIER) (No. B9-2421).

Acknowledgments

This research was funded by the Ministry of Trade, Industry and Energy, and supported by the Korea Institute of Energy Technology Evaluation and Planning (KETEP) (No. 20182410105070). This work was conducted under the framework of the Research and Development Program of the Korea Institute of Energy Research (KIER) (No. B9-2421).

Conflicts of Interest

The authors declare no conflict of interest.

Nomenclature

The list of nomenclature through the paper is as follows.
Z n line impedance value
l r liner regression method
U p . t r pole transformer voltage
U c i power common coupling voltage at EV infrastructure
I c i passing current at the secondary feeder
COS θ c i Power factor at the secondary feeder
n ESS site (EV infra) section number of the secondary feeder
m measuring time
q error function
T total number of the time interval

References

  1. Rubino, L.; Capasso, C.; Veneri, O. Review on plug-in electric vehicle charging architectures integrated with distributed energy sources for sustainable mobility. Appl. Energy 2017, 207, 438–464. [Google Scholar] [CrossRef]
  2. Madina, C.; Zamora, I.; Zabala, E. Methodology for assessing electric vehicle charging infrastructure business models. Energy Policy 2016, 89, 284–293. [Google Scholar] [CrossRef]
  3. Sbordone, D.; Bertini, I.; Di Pietra, B.; Falvo, M.C.; Genovese, A.; Martirano, L. EV fast charging stations and energy storage technologies: A real implementation in the smart micro grid paradigm. Electr. Power Syst. Res. 2015, 120, 96–108. [Google Scholar] [CrossRef]
  4. Serradilla, J.; Wardle, J.; Blythe, P.; Gibbon, J. An evidence-based approach for investment in rapid-charging infrastructure. Energy Policy 2017, 106, 514–524. [Google Scholar] [CrossRef]
  5. Dong, X.; Mu, Y.; Xu, X.; Jia, H.; Wu, J.; Yu, X.; Qi, Y. A charging pricing strategy of electric vehicle fast charging stations for the voltage control of electricity distribution networks. Appl. Energy 2018, 225, 857–868. [Google Scholar] [CrossRef]
  6. Leou, C.; Su, C.-L.; Lu, C.-N. Stochastic analyses of electric vehicle charging impacts on distribution network. IEEE Trans. Power Syst. 2014, 29, 1055–1063. [Google Scholar]
  7. Gray, M.K.; Morsi, W.G. Power quality assessment in distribution systems embedded with plug-in hybrid and battery electric vehicles. IEEE Trans. Power Syst. 2015, 30, 663–671. [Google Scholar] [CrossRef]
  8. Dubey, A.; Santoso, S.; Cloud, M.P.; Waclawiak, M. Determining time-of-use schedules for electric vehicle loads: A practical perspective. IEEE Power Energy Technol. Syst. J. 2015, 2, 12–20. [Google Scholar] [CrossRef]
  9. Weiller, C. Plug-in hybrid electric vehicle impacts on hourly electricity demand in the United States. Energy Policy 2011, 39, 3766–3778. [Google Scholar] [CrossRef]
  10. Gao, Y.; Wang, C.; Wang, Z.; Liang, H. Research on time-of-use price applying to electric vehicles charging. In Proceedings of the IEEE PES Innovative Smart Grid Technologies, Tianjin, China, 21–24 May 2012; pp. 1–6. [Google Scholar]
  11. Shao, S.; Zhang, T.; Pipattanasomporn, M.; Rahman, S. Impact of TOU rates on distribution load shapes in a smart grid with PHEV penetration. In Proceedings of the IEEE PES T&D 2010, New Orleans, LA, USA, 19–22 April 2010; p. 16. [Google Scholar]
  12. Chen, Q.; Wang, F.; Hodge, B.M.; Zhang, J.; Li, Z.; Shafie-Khah, M.; Catalão, J.P. Dynamic Price Vector Formation Model-Based Automatic Demand Response Strategy for PV-Assisted EV Charging Stations. IEEE Trans. Smart Grid 2017, 8, 2903–2915. [Google Scholar] [CrossRef]
  13. Ying, J.; Ramachandaramurthy, V.K.; Miao, K.; Mithulananthan, N. Bi-directional electric vehicle fast charging station with novel reactive power compensation for voltage regulation. Int. J. Electr. Power Energy Syst. 2015, 64, 300–310. [Google Scholar] [CrossRef]
  14. Jiang, B.; Fei, Y. Decentralized scheduling of PEV on-street parking and charging for smart grid reactive power compensation. In Proceedings of the 2013 IEEE PES Innovative Smart Grid Technologies Conference (ISGT), Washington, DC, USA, 24–27 February 2013; pp. 1–6. [Google Scholar]
  15. Li, S.; Bao, K.; Fu, X.; Zheng, H. Energy management and control of electric vehicle charging stations. Electr. Power Compon. Syst. 2014, 42, 339–347. [Google Scholar] [CrossRef]
  16. Beykverdi, M.; Jalilvand, A.; Ehsan, M. Cooperative Energy Management of Hybrid DC Renewable Grid Using Decentralized Control Strategies. Energies 2016, 9, 859. [Google Scholar] [CrossRef]
  17. Cubas, J.; Pindado, S.; Sorribes-Palmer, F. Analytical Calculation of Photovoltaic Systems Maximum Power Point (MPP) Based on the Operation Point. Appl. Sci. 2017, 7, 870. [Google Scholar] [CrossRef]
Figure 1. Strategy of power stabilization in the secondary feeder by an energy storage system (ESS).
Energies 13 00179 g001
Figure 2. Current characteristics in the grid according to the ESS operation.
Energies 13 00179 g002
Figure 3. Distribution characteristics of line impedance.
Energies 13 00179 g003
Figure 4. Configuration of the secondary feeder with electric vehicle (EV) infrastructure for the proposed method.
Energies 13 00179 g004
Figure 5. Operation concept of the proposed method.
Energies 13 00179 g005
Figure 6. Concept of the voltage compensation rate (VCR) considering a margin (bandwidth).
Energies 13 00179 g006
Figure 7. Concept for electric vehicle infrastructure stabilization (EVI)-algorithm by an ESS.
Energies 13 00179 g007
Figure 8. Concept of estimation method for state of reference of an ESS.
Energies 13 00179 g008
Figure 9. Case of voltage to be violated in only one section.
Energies 13 00179 g009
Figure 10. Case of voltage being violated in multiple sections.
Energies 13 00179 g010
Figure 11. State of charge (SOC) operation of ESS within the state of reference (SOR).
Energies 13 00179 g011
Figure 12. Flowchart of coordination control strategy between EVI-algorithm and SOR-algorithm for ESS.
Energies 13 00179 g012
Figure 13. Bi-directional grid-connected inverter model with an ESS [16].
Energies 13 00179 g013
Figure 14. State machine of the energy management system (EMS) for EV charging infrastructure.
Energies 13 00179 g014
Figure 15. Voltage compensation algorithm in the ‘Grid Support’ state.
Energies 13 00179 g015
Figure 16. PV-ESS based EV charging infrastructure model (MATLAB/SIMULINK).
Energies 13 00179 g016
Figure 17. Configuration of the secondary feeder with EV infrastructure.
Energies 13 00179 g017
Figure 18. Output pattern of the EV charger, PV system, and customer load.
Energies 13 00179 g018
Figure 19. Operation signal of EVI algorithm.
Energies 13 00179 g019
Figure 20. Capacity of voltage compensation rate for voltage stabilization.
Energies 13 00179 g020
Figure 21. Analysis of the feeder voltage characteristic at electric vehicle charging (EVC) infrastructure without an ESS.
Energies 13 00179 g021
Figure 22. Analysis of the feeder voltage characteristic by ESS operation at EVC infrastructure.
Energies 13 00179 g022
Figure 23. Operation signal of the SOR algorithm.
Energies 13 00179 g023
Figure 24. Capacity characteristic by operation of the SOR algorithm.
Energies 13 00179 g024
Figure 25. SOC pattern of ESS during a 24 h period.
Energies 13 00179 g025
Figure 26. Comparison of the performance index for simulation results.
Energies 13 00179 g026
Table 1. Previous researches of stabilization of voltage on applications of an electric vehicle charging infrastructure.
Ref.Major ContentsAdvantagesDisdvantages
[5,12]Charging price method is used considering the voltage deviationUser friendly with economic approach
Real-time price update
Slow response to voltage variation
[6,7,8,9,10,11]Time-of-use pricing (TOU) scheme is introduced to decrease the peak load demand and alleviate overloadUser friendly with economic approachSlow response to voltage variation
[13,14,15]Fast-charging process control scheme to control power quality (DC/DC)Fast response to voltage variationCustomized components
(power converter, EV charger)
Table 2. Operation signal classification of an energy storage system (ESS).
ClassificationSignal Condition
α β γ ϵ δ
Charging operation of voltage stabilization10---
Discharging operation of voltage stabilization01---
Charging operation within SOR range00101
Discharging operation within SOR range00110
Not operation00000
00100
00010
00001
Table 3. Simulation data.
Section NumberImpedanceLength (km)Power FactorLoad (kW)RES (PV System) (kW)EV Charger (kW)
R (Ω/km)X (Ω/km)
1 (total)0.400.027110–15.00–30.00–18.9
1-1 (load)0.400.0270.0310–15.0--
1-2 (RES)0.400.0270.051-0–30.0-
1-3 (EVC)0.400.0270.051--0–18.9
1-4 (ESS)0.400.0270.081---
Table 4. Comparison of the performance index of each method.
Not Operation of ESSESS Operation
Performance index value 8.2803 × 10 6 7.0532 × 10 6

