Thermal Gradients with Sintered Solid State Electrolytes in Lithium-Ion Batteries
by
 , , and
Robert Bock
1 ,
,
Morten Onsrud
2,
Håvard Karoliussen
1,
Bruno G. Pollet
1,
Frode Seland
3 and
Odne S. Burheim
1,* 1
Department of Energy and Process Engineering, Norwegian University of Science and Technology, NO-7491 Trondheim, Norway
2
NORSIRK AS, NO-0663 Oslo, Norway
3
Department of Materials Science and Engineering, Norwegian University of Science and Technology, NO-7491 Trondheim, Norway
*
Author to whom correspondence should be addressed.
Energies 2020, 13(1), 253; https://doi.org/10.3390/en13010253
Submission received: 6 December 2019
/
Revised: 22 December 2019
/
Accepted: 24 December 2019
/
Published: 3 January 2020
(This article belongs to the Special Issue Smart and Functional Materials for Lithium-Ion Battery)
Abstract
:The electrolyte is one of the three essential constituents of a Lithium-Ion battery (LiB) in addition to the anode and cathode. During increasingly high power and high current charging and discharging, the requirement for the electrolyte becomes more strict. Solid State Electrolyte (SSE) sees its niche for high power applications due to its ability to suppress concentration polarization and otherwise stable properties also related to safety. During high power and high current cycling, heat management becomes more important and thermal conductivity measurements are needed. In this work, thermal conductivity was measured for three types of solid state electrolytes: LiLaZrO (LLZO), LiAlGe(PO) (LAGP), and LiAlTi(PO) (LATP) at different compaction pressures. LAGP and LATP were measured after sintering, and LLZO was measured before and after sintering the sample material. Thermal conductivity for the sintered electrolytes was measured to 0.470 ± 0.009 WKm, 0.5 ± 0.2 WKm and 0.49 ± 0.02 WKm for LLZO, LAGP, and LATP respectively. Before sintering, LLZO showed a thermal conductivity of 0.22 ± 0.02 WKm. An analytical temperature distribution model for a battery stack of 24 cells shows temperature differences between battery center and edge of 1–2 K for standard liquid electrolytes and 7–9 K for solid state electrolytes, both at the same C-rate of four.

1. Introduction
Society has seen a major introduction of the lithium-ion battery into the transport sector as of recently, being an attractive and efficient way to store electrical energy in hybrid and electric vehicles. Also, larger transportation vehicles are increasingly equipped with hybrid systems and batteries, creating an ever-increasing need for more specific power and energy, high power opportunity charging, better performance, and longer lifetime [1]. For any given battery, higher C-rate (complete discharge relative to an hour) means higher current density. Very high C-rates lead to a large cross-sectional current density, which creates unwanted loss mechanisms alongside lowered energy efficiency (high ohmic losses) [2]. At any given C-rate, a battery can be modified to have lower current density, simply by lowering the electrode thickness. This in turn leads to lower specific energy and specific power (larger weight fraction of electrolyte separator, current collectors, etc.). This means that, to simultaneously have high specific energy and power, current density must increase. However, the liquid electrolyte currently in use in modern lithium-ion batteries does not cope properly with current densities well above 100 Am and needs to be replaced with a non-liquid electrolyte to prevent some of the losses associated with liquid electrolyte/electrode interfaces. A similar evolution took place in the fuel cell sector, where early alkaline fuel cells used a liquid electrolyte that was subject to concentration polarization at higher currents [3]. This problem was overcome when solid proton conducting membranes were developed [4]. Thus, the drive for a solid state electrolyte (SSE) in lithium-ion batteries is mainly motivated by two things; one is to keep performance at high load conditions while simultaneously increasing specific energy and specific power of the battery, and the other is to lower the risk of dangerous fires by removing the liquid and volatile liquid electrolyte [5,6].
1.1. Role of the Electrolyte
Traditional lithium-ion batteries contain a concentrated organic liquid electrolyte. The liquid electrolyte provides intimate wetting with the solid electrode and sufficient ionic conductivity within the operating temperature [7,8]. The constituents of the liquid electrolyte, lithium cations, associated counter anions, and solvent molecules, facilitate the formation of a passivation layer on the electrolyte surface, commonly named solid electrolyte interphase (SEI) [9,10,11]. The local variation of current densities linked to inhomogeneities within the SEI can result in the formation of dendrites [12,13]. This is a challenge in liquid electrolyte cells, as dendrites can penetrate the porous separator by growing through it and can lead to potentially fatal short circuiting of the electrodes. Due the liquid nature of the electrolyte, mass transport limitations by diffusion will arise in the electrolyte and have to be considered, especially at high current densities. [14]. This concentration polarization is what currently limits the available current density in some lithium-ion batteries [15]. Especially the ambition to quick-charge batteries is stifled by it. New non-liquid electrolytes are necessary to overcome these challenges. Much attention has been given to a broad new family of electrolytes, namely the solid state electrolytes (SSE). They demonstrate certain improved properties over the traditional liquid electrolyte. Due to the absence of concentration polarization effects that characterize liquid electrolytes, higher current densities are possible and thicker electrodes can be used, which can increase the capacity of the battery [3,16]. Alternatively, fewer cells are needed to reach the same capacity as when using thinner electrodes, which means that less material not contributing to the capacity needs to be used, e.g., copper and aluminium for the current collectors or separator/SSE material. This will increase the energy density of the battery. Kato et al. have produced a solid state battery with 15.7 mAh cm at room temperature using a cathode layer with a thickness of 600 m, which is more than twice the maximum thickness in our study [17]. Currently, most solid state battery prototypes use thinner composite electrodes to compensate for the lower ionic conductivity of the electrode material and the absence of electrolytes wetting the electrode [18].
Very high current densities and certainly high temperatures of above 70 C can lead to the gasification of liquid electrolyte compounds due to overheating, generating a highly flammable gas with the inherent dangers that holds [5]. Using an SSE will not lead to degassing of a vaporized organic and flammable electrolyte. This is particularly important on naval and aviative vehicles. The lack of a flammable organic solvent makes the SSE a safer alternative, as it also eliminates the risk of thermal runaway, an exothermic accelerated catastrophic process leading to a fire-like explosion [19]. The SSE enables battery producers to manufacture thin and dense electrolyte layers between the electrodes, hence increasing the overall volumetric and gravimetric cell capacity. Thicknesses between and 3 and 5 m were achieved by Yan et al. for an LLZO (LiLaZrO) ultrathin film SSE that was coated directly onto the cathode layer [20]. A thinner electrolytic layer also results in a lower ohmic resistance. Furthermore, Li ions are the sole charge carrier in the SSE, meaning the transference number can approach one as the ions are moving through interstitial or vacant sites in the matrix of a crystalline or glassy SSE [21,22]. Regrettably, the ionic conductivity of these electrolyte systems is low and they are therefore not extensively used as the primary electrolyte in consumer lithium-ion batteries as of yet. LiLaZrO (LLZO), LiAlGe(PO) (LAGP), and LiAlTi(PO) (LATP), the materials investigated in this work, achieve an ionic conductivity of 0.1–0.2 Sm [23,24,25,26] as compared to values in the order of 1 Sm for LiPF-based liquid electrolytes employed in many commercial lithium-ion batteries today [27,28,29].
Many research groups are tackling the challenges related to the low ionic conductivity of the SSE [30,31,32,33,34,35]. Even though significant advances have been made in terms of ionic conductivity, the large charge transfer resistance at the interface between the electrode and the solid electrolyte remains. It originates from the particle-to-particle nature and lack of liquid wetting, meaning there is poor contact between the electrode and electrolyte resulting in an insufficient charge transfer at the solid/solid interface [36,37]. In addition, the particle contact is further impaired by the electrode expansion and contraction during charge/discharge [38]. Efforts are being made to study strategies that can decrease the interface resistance by applying new interfacial architectures with nanoscale materials forming a buffer layer in the SSE [19]. Anomalous ionic conduction at the interface of ionic conductors takes place in the space-charge layers at the interface. This effect has been studied, and a new field called nanoionics is consequently emerging [39].
1.2. Heat and Thermal Conductivity
To predict the heat distribution in a battery cell requires a good understanding of heat production and heat transfer within it. The need for accurate temperature values inside the battery is well documented in the literature, e.g., by Bandhauer et al. [40]. The influence of temperature on the different ageing mechanisms is well reported [41,42,43,44]. Several research groups report internal temperatures of battery cells using an in situ measurement setup [45,46,47,48].
There are several sources that contribute to the heat developed in a battery cell. These are activation (interfacial kinetics) and concentration (species transport) overpotentials (when the electrolyte is liquid) as well as ohmic losses (Joule heating from the movement of charged particles) [40]. All of these losses will appear both when discharging and charging a battery. In the case of discharge, the losses lead to a potential lower than the reversible potential that can be drawn from the battery cell, whilst they require a larger potential than the reversible potential applied to the battery cell when charging. These overpotentials will be dissipated as heat in the cell for both cases during operation. Especially the ohmic losses and the concentration overpotential are dependent on the current drawn from the cell. That means, when drawing or imposing a very large current from or into the cell, a large amount of heat will be produced. This would be the case in a high power situation like a vehicle moving at high speed or the quick charging of a battery at high current levels. These ohmic resistances are reportedly changing while the battery cell is ageing [49]. The voltage loss in the cell is dominated by the charge transfer resistance at the electrode/electrolyte interface and the ionic resistivity of the electrolyte. The first is reported to make up more than 60% of the total resistance of a cell [36,37]. This results in a considerable amount of ohmic heat produced at the interface.
The accurate determination of the heat sources together with measuring the thermal conductivities of the different battery components enables precise modeling of the internal temperature profiles of a battery cell. This can provide viable information to the cooling system of a battery pack. Improved thermal management will also enhance the understanding of local ageing mechanisms and will lead to superior battery designs and enhanced cell lifetimes [50]. The main heat production in a battery cell stems from the separator-electrolyte region, closely followed by the solid electrolyte interface region at high currents [51]. Thus, determining the thermal conductivity of the electrolyte is critical. Cui et al. measured and reported thermal conductivity of an LAGP SSE prepared by powder sintering and bulk glass heat-treatment. They obtained values between 0.6 and 1.8 WKm at room temperature depending on the preparation method [25]. Richter et al. reported the thermal conductivity for a wide range of separator materials dry and soaked in electrolyte solvent which are relevant here for comparison [50].
In a detailed review, Bandhauer et al. report how thermal issues in Li-ion batteries are connected to capacity fade, power fade, and self discharge. They also report heat generation mechanisms and an approach to thermal modeling [40]. According to Brousseley et al., the most likely cause of aging of a battery cell is the side reactions between the electrolyte and the active materials of the electrodes. Insoluble species are produced on the graphite electrode, which changes the SEI properties and in turn leads to a reduction of the lithium corrosion rate with aging [52].
The desire for increased current densities in lithium-ion batteries could be fulfilled through the use of SSEs. However, the handling of the dissipated heat in such a battery becomes evermore important due to their higher ohmic resistance compared to liquid electrolytes and the increased current densities. This work reports some of the first measured values for thermal conductivity of sintered SSEs using a custom-built measurement rig. These values are explored with a simple analytical model to give an indication as to what is to be expected in terms of temperature distribution in a lithium-ion battery with SSEs.
2. Experimental
2.1. Thermal Conductivity Measurements
The thermal conductivity measurements for this study were performed ex situ in a custom-built measurement rig, which is sketched in Figure 1, similar to the one in Reference [53]. The rig applies a constant heat flux through a cylindrical geometry. The setup is symmetrical on top and bottom. Thermoelectric Peltier modules (Termo-Gen AB TEP1-1264-3.4) are used on either side to generate the heat flux by heating the top and cooling the bottom. The sample thickness is recorded by two Mitutoyo micrometers (accuracy ±0.003 mm). Thus, samples and stacks of different thickness (10–2000 m) can be studied. Compression is applied by a pneumatic piston (Aventics Series ED02) between 3 and 23 bar compaction pressure onto the samples progressively throughout testing. That allows for monitoring of the compression behaviour. The materials investigated in this study were measured at 3–5 bar compaction pressure.
The one-dimensional form of Fourier’s first law is
where is the heat flux (Wm) in the x-direction through the sample, is the thermal conductivity (WmK) of interest, and dT is the temperature change (K) over the sample thickness dx (m). Therefore, to obtain the thermal conductivity , and must be measured. The temperature difference over the sample is recorded by two thermocouples: T and T (Omega type K). They are positioned inside an aluminum cap on either side of the sample. Aluminum was chosen for its high thermal conductivity, which ensures a uniform temperature distribution over the whole sample contact area. Three additional thermocouples spaced equally apart both in the upper (T–T) and the lower (T–T) steel cylinders determine the magnitude of the heat flux. Upper and lower heat fluxes were allowed to equilibrate to within 4% of each other before each measurement, where their average was used to calculate the thermal resistance of the sample. The sample thickness is measured using the micrometers. An insulation cap was designed and fitted tightly around the steel cylinders (top and bottom) to ensure that the heat transport occurs in the longitudinal direction. The deviation between upper and lower heat flux was below 0.5% for most measurements, which supports the assumption that the heat flux travels axially only. The thermal resistance measured this way does include a thermal contact resistance between rig and sample. To decouple this contact resistance, two samples with different thicknesses of each material were measured, each on its own and stacked together. When only a small amount of material is available, samples can be stacked to obtain a variation of thickness. Then, the thermal resistance can be plotted against the sample thickness. Applying a linear trendline to these results will yield a slope of which the reciprocal is the average thermal conductivity of the measured samples. The thermal resistance value for a thickness of zero will then be the total contact resistance in the system. The accuracy of the obtained results is limited by the precision of the thermal conductivity calibration. This calibration was achieved by measuring sample discs of the same polyether ether ketone (PEEK) material with different thicknesses, which had been measured for their thermal conductivity by an independent commercial actor with an accuracy of 5% prior to our measurements. The given error in the results shows the deviation from the expected linear trend of thermal resistance against sample thickness. Further details on the measurement rig and the procedure can be found in Reference [53].
2.2. Sample Preparation
Three commercially available solid electrolyte materials were obtained in powder form with particle sizes between 1 and 10 m from Toshima Manufacturing Co., Ltd.: LLZO, LAGP, and LATP. Two different amounts of each electrolyte were weighed (to obtain different thicknesses) and individually transferred into a press die (25 mm in diameter). The powders were then compressed between two punches in a hydraulic press at pressures between 50 and 500 bar for one minute; pressure was increased until stable samples were obtained. Afterwards, the pressed pellets were transferred to a muffle furnace and sintered. Pressure and sintering details for the three different SSE materials are given in Table 1.
2.3. Modeling of the Temperature Distribution
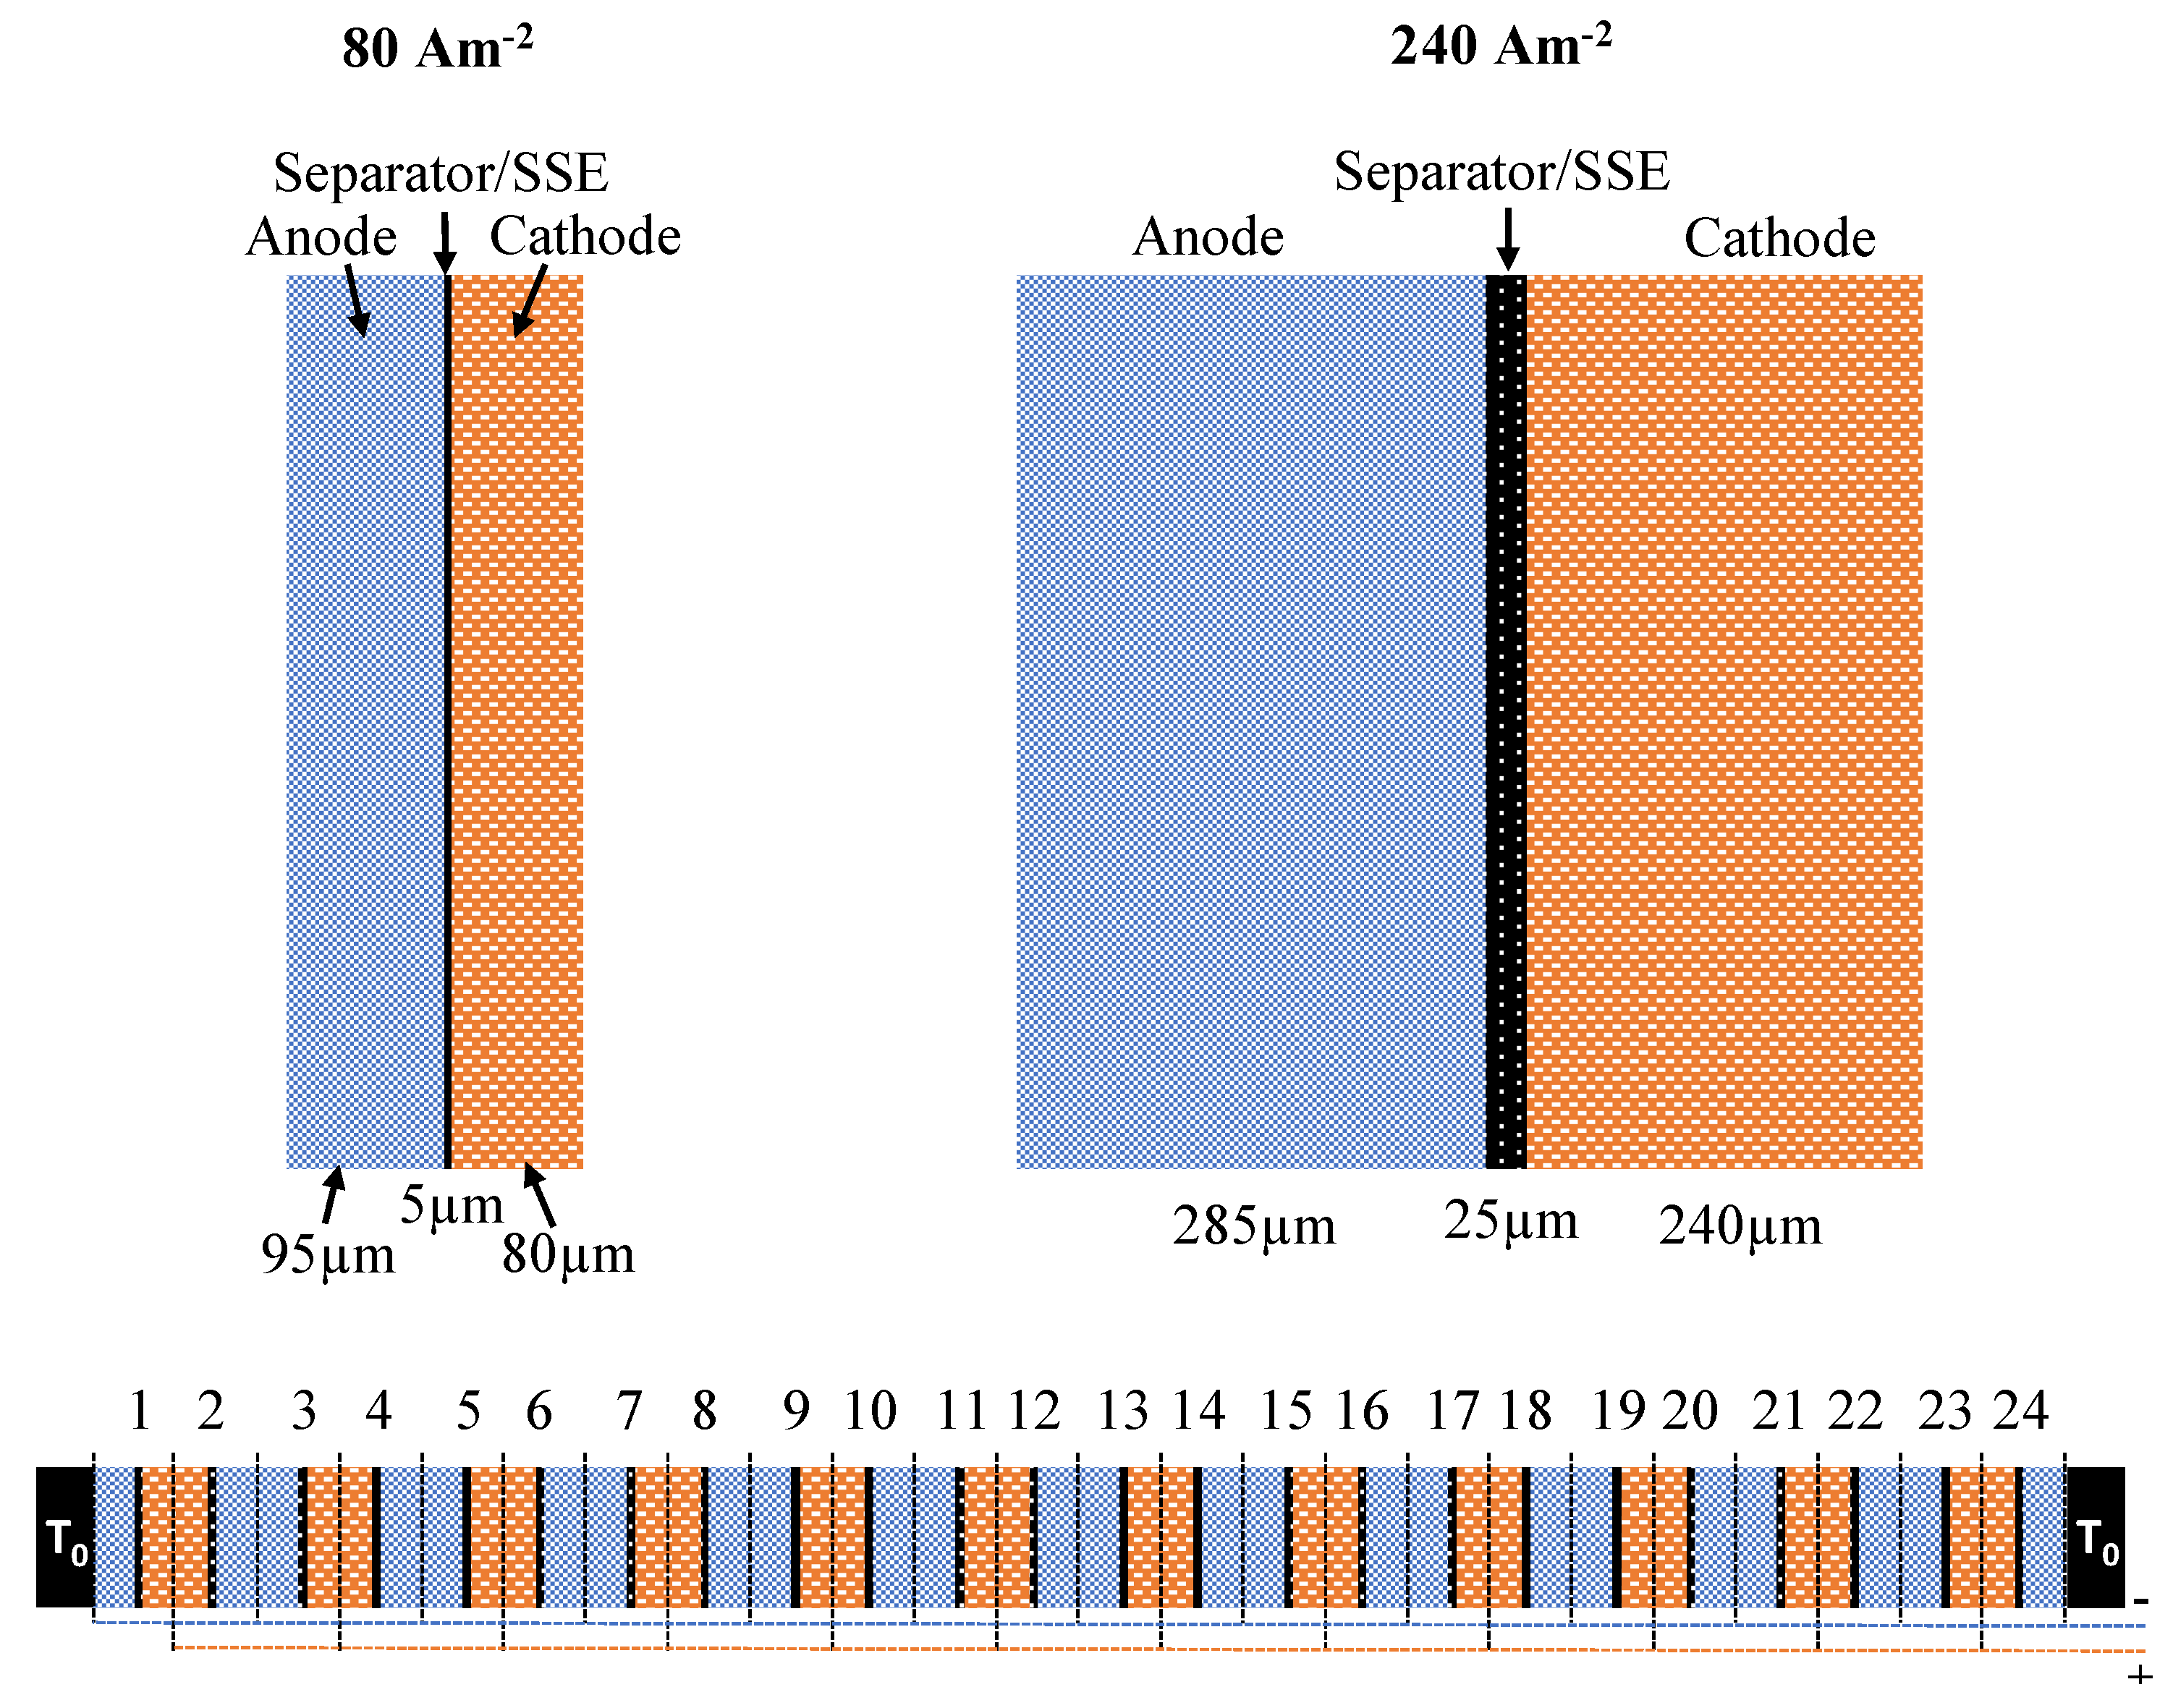
A simple analytical model of a lithium-ion battery cell stack was constructed to show the impact of the results obtained through the thermal conductivity measurements. It is based on a work by Richter et al. [56]. The model calculates the maximum temperature in the middle of a lithium cobalt(III) oxide (LCO) battery with 24 pouch cells, assuming cooling on both ends of the stack that keeps room temperature T. The temperature change is then modeled one-dimensional in the x-direction, through-plane. The cells were simplified to consist of electrodes and separator/SSE material only; see Figure 2. Thermal contact resistance between these layers was neglected in this simple model, even though it could have a non-negligible impact on the thermal performance of real systems [57].
The heat sources for each cell were combined into a heat flux q (Wm) as follows [50]:
where is the reversible heat generated the cell reactions ( is the entropy of reaction (JmolK), and F is the Faraday constant (Cmol); j is the current density (Am)); is the ohmic heat generated in the separator/SSE only, as the electrodes are assumed to have an electrical conductivity several magnitudes higher; and is the heat caused by the activation overpotential at the interfaces. A volumetric heat production was obtained for n cells:
by using the heat density q and the total thickness of the cell stack . The thermal conductivities of the electrodes and the separator/SSE were weighted by their thicknesses and combined into an effective thermal conductivity per cell:
See Table 2 for the thermal conductivity and thickness values used. Fourier’s second law was set up in one dimension for the predominating heat transfer perpendicular to the cell area:
After integrating once,
where denotes the center of the battery. With the maximum temperature in the center of the battery and, thus, . Upon integrating again
and with the temperature on the battery surface at , is found. It follows that
Solving this for and substituting for yields the following:
To explore the effect of thicker electrodes made possible by the use of SSEs, calculations were made for standard thickness and a tripling of it. This is not deemed possible for traditional separators but was included as a hypothetical case nonetheless for the sake of comparison.
A discharge current density of 80 Am was drawn from the thinner cells, while 240 Am was drawn from the thicker SSE cells. This corresponds to a C-rate of four if a capacity of 20 Ah m is assumed for the former and 60 Ahm is assumed for the latter case [58]. The thickness of the separator/SSE layer was varied between 5 and 25 m, as such low thicknesses have been reported possible [20].
The entropic heat term is temperature dependent. An entropy change value of JmolK is used as reported for LCO battery chemistry [59]. This negative value denotes an exothermic process, which in turns leads to a heat source. Heat sources are reported as positive values in Table 3. The ohmic heat has a wide range due to the difference in ionic conductivity by one order of magnitude between SSE and separator in addition to the different thicknesses considered. However, even a reduction of the SSE thickness to less than 5 m would only decrease part of the considerable ohmic heating occurring in a cell with an SSE. The activation overpotential is calculated for the negative electrode during discharge only, as it dominates for the electrochemical reaction in LCO batteries [51].
3. Results and Discussion
The production of samples in a mechanical press yielded tablets that were solid in appearance but very brittle and easily disintegrated. Great care had to be taken when transferring them to the measurement rig.
3.1. Thermal Conductivity Measurements
The values of the measured thermal conductivities are presented in Table 4. Measurements were taken at 3–5 bar compaction pressure only, as Li-ion batteries are not usually compressed beyond that.
All three types of sintered SSE show a thermal conductivity of around 0.5 WKm for the range of compaction pressures they were measured in. LLZO and LATP gave results with very low errors of 2–4%, whilst the LAGP results show a very large error of 20–40%, as visualized in Figure 3. During the measurement with stacked LAGP samples, one of the sample discs was fractured. This may have led to less sample area available for the heat transport, which would result in an overestimated thermal resistance for the remaining measurements. These results match with the lower scale of Cui et. al’s thermal conductivity measurements for LAGP of 0.6–1.8 WKm, also at room temperature. The thermal conductivity of LATP decreases slightly with increasing compaction pressure. Keeping in mind the overall 5% accuracy limitation of the measurement rig, this is deemed as hardly significant and can be attributed to inaccuracies when measuring and calculating the heat flux through the sample.
The traditional electrolytes that SSEs are intended to replace are reported to have thermal conductivities in the range of 0.14–0.36 WKm when soaked with electrolyte and 0.07–0.14 WKm when dry, both at a compaction pressure of 2.3 bar. The compaction pressure does not have a significant influence for sintered LLZO and LAGP; for LATP, the thermal conductivity decreases by around 10% from 3 bar–5 bar compaction pressure. The unsintered SSE has a thermal conductivity of 0.22 WKm, which is in the same range as the electrolyte-soaked separators. Thus, the sintering has a significant influence on the structure of the SSE. The assumption that both electrical and thermal conductivity are likely to (independently) increase as the porosity of the solid electrolyte decreases can be made because neither phonons (heat transfer [60]) nor ions (current transfer [1]) can conduct through gas-filled pores.
3.2. Modeling of Discharge Temperature Distribution
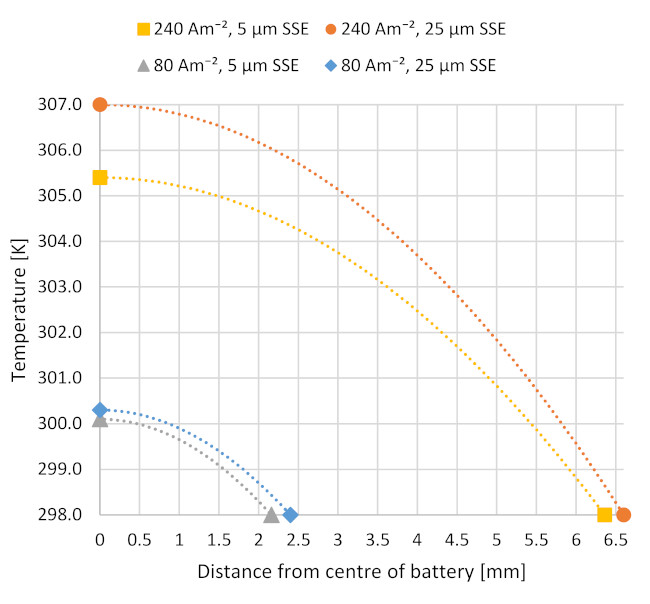
Figure 4a,b shows the temperature distribution through one symmetrically cut half of the cell stack according to the developed model and the discussed inputs. Figure 4a explores the heat distribution when employing a traditional electrolyte-soaked separator of thickness 5 or 25 m for two different electrode thicknesses with the respective discharge current densities of 80 and 240 Am. The 240 Am case where the electrode thickness is increased by a factor of three to obtain more lithium ions per cell area is not possible today. The limiting current density for this type of electrolyte is governed by concentration polarization so that 80 Am can be considered the maximum current density to be obtained from such a system. Nonetheless, both current densities were included in the model to facilitate the comparison of separator and SSE. The two different thicknesses do not have a significant effect, suggesting that the ohmic heat from the separator plays a minor role in the overall heat contribution. The temperature in the centre of the battery is not significantly higher than at the edge for both thicknesses at 80 Am. The change reaches slightly more than 2 K for the hypothetical case of 240 Am and less than 1 K for a current density of 80 Am. Note that the overall thickness of the battery is almost tripled due to the thicker electrodes.
Figure 4b shows the temperature distribution when using an SSE electrolyte between the electrodes. Here as well, current densities of 80 and 240 Am were considered, but in this case, they are deemed realizable. For the low current density, the SSE thickness plays a less significant role; both reach a temperature difference of just over 2 K from the centre of the battery to the edge. For the high current density, the SSE thickness has a more prominent impact of around 2 K maximum temperature difference between the two thicknesses, where the thicker SSE produces a higher temperature due to more ohmic heating. The overall temperature difference from battery centre to outer edge for this current density is 7–9 K.
There are two key mechanisms that influence the temperature gradients in these results. Firstly, the difference in ionic conductivity by one order of magnitude in separator and SSE makes a significant difference in their ohmic heat productions. Secondly, the dry design of a cell containing an SSE means lower overall thermal conductivity in the system, as liquid electrolyte in porous media enhances their thermal conductivity by a factor of three. The resulting increase in stack temperature must be addressed in connection to the degradation mechanisms attributed to thermal issues in Li-ion batteries.
4. Conclusions
In this work, the thermal conductivity of three types of solid state electrolytes, LiLaZrO (LLZO), LiAlGe(PO) (LAGP), and LiAlTi(PO) (LATP) was measured at different compaction pressures. LAGP and LATP were measured after they had been sintered, whilst LLZO was measured before and after sintering the sample material. The thermal conductivity of the sintered solid electrolytes was measured to 0.470 ± 0.009 WKm, 0.5 ± 0.2 WKm, and 0.49 ± 0.02 WKm at 3 bar compaction pressure for LLZO, LAGP, and LATP respectively. Before it was sintered, LLZO was measured to have a thermal conductivity of 0.22 ± 0.02 WKm at 3 bar compaction pressure. The SSE materials are shown to have higher thermal conductivity than the electrolyte-soaked separators commonly used in commercial lithium ions batteries. They do, however, have an ionic conductivity one order of magnitude lower than the separators used today. This leads to increased heat production from ohmic heating, as shown in the results from the analytical temperature distribution model. The shortcoming of low ionic conductivity in the development of dry electrodes is in the focus of several research groups.
An analytical temperature distribution model for a battery stack of 24 cells shows temperature differences between battery center and edge of 1–2 K for standard liquid electrolytes and 7–9 K for solid state electrolytes, both at the same C-rate of four. The developed model shows the necessity of more focus on heat management of a cell stack if SSEs are to be used in the future. Especially high power batteries that deliver very high current densities will face enormous heat production that needs to be dissipated to ensure prolonged function of the battery.
Author Contributions
R.B. conducted the thermal conductivity measurements and all simulations and wrote the manuscript. M.O. supplied and prepared the samples and contributed to the discussion. H.K. proofread the article and contributed with scientific feedback. B.G.P. was part of the discussions leading to this article and proofread. F.S. contributed with scientific feedback, copyediting, and proofreading. O.S.B. lead the discussions leading to this article, copyedited, and proofread. All authors have read and agreed to the published version of the manuscript.
Acknowledgments
R. Bock thanks NTNU for the award of a Postdoctoral Research Fellow scholarship. The cross-disciplinary ENERSENSE research framework is acknowledged for extra funding.
Conflicts of Interest
The authors declare no conflicts of interest.
References
- Burheim, O.S. Engineering Energy Storage, 1st ed.; Elsevier Academic Press: London, UK, 2017; ISBN 9780128141007. [Google Scholar]
- Kasnatscheew, J.; Rodehorst, U.; Streipert, B.; Wiemers-Meyer, S.; Jakelski, R.; Wagner, R.; Laskovic, I.C.; Winter, M. Learning from Overpotentials in Lithium Ion Batteries: A Case Study on the LiNi1/3Co1/3Mn1/3O2 (NCM) Cathode. J. Electrochem. Soc. 2016, 163, A2943–A2950. [Google Scholar] [CrossRef]
- Canaday, J.; Wheat, T.; Kuriakose, A.; Ahmad, A. A polarization model for protonic solid electrolyte fuel cells. Int. J. Hydrogen Energy 1987, 12, 151–157. [Google Scholar] [CrossRef]
- Rao, V.; Kluy, N.; Ju, W.; Stimming, U. Handbook of Membrane Separations: Chemical, Pharmaceutical, Food, and Biotechnological Applications; CRC Press: Boca Raton, FL, USA, 2015; Chapter 21; pp. 567–609. [Google Scholar]
- Mikolajczak, C.; Kahn, M.; White, K.; Long, R.T. Lithium-Ion Batteries Hazard and Use Assessment; Technical Report; Fire Protection Research Foundation: Quincy, MA, USA, 2011. [Google Scholar]
- Jorne, J. The Chalkboard: C Rating of Batteries: A Misleading Concept, C Flux Rather than C Rate. Electrochem. Soc. Interface 2018, 27, 42–43. [Google Scholar]
- Aurbach, D. Nonaqueous Electrochemistry; CRC Press: New York, NY, USA, 1999; ISBN 9780367399573. [Google Scholar]
- Wu, M.S.; Liao, T.L.; Wang, Y.Y.; Wan, C.C. Assessment of the Wettability of Porous Electrodes for Lithium-Ion Batteries. J. Appl. Electrochem. 2004, 34, 797–805. [Google Scholar] [CrossRef]
- Fong, R.; von Sacken, U.; Dahn, J.R. Studies of Lithium Intercalation into Carbons Using Nonaqueous Electrochemical Cells. J. Electrochem. Soc. 1990, 137, 2009–2013. [Google Scholar] [CrossRef]
- Peled, E. The Electrochemical Behavior of Alkali and Alkaline Earth Metals in Nonaqueous Battery Systems—The Solid Electrolyte Interphase Model. J. Electrochem. Soc. 1979, 126, 2047–2051. [Google Scholar] [CrossRef]
- Winter, M. The Solid Electrolyte Interphase—The Most Important and the Least Understood Solid Electrolyte in Rechargeable Li Batteries. Z. Phys. Chem. 2009, 223, 1395–1406. [Google Scholar] [CrossRef]
- Brissot, C.; Rosso, M.; Chazalviel, J.; Lascaud, S. Dendritic growth mechanisms in lithium/polymer cells. J. Power Sources 1999, 81-82, 925–929. [Google Scholar] [CrossRef]
- Rosso, M.; Gobron, T.; Brissot, C.; Chazalviel, J.N.; Lascaud, S. Onset of dendritic growth in lithium/polymer cells. J. Power Sources 2001, 97-98, 804–806. [Google Scholar] [CrossRef]
- Nyman, A.; Zavalis, T.G.; Elger, R.; Behm, M.; Lindbergh, G. Analysis of the Polarization in a Li-Ion Battery Cell by Numerical Simulations. J. Electrochem. Soc. 2010, 157, A1236–A1246. [Google Scholar] [CrossRef]
- Maier, J. Concentration Polarization of Salt-Containing Liquid Electrolytes. Adv. Funct. Mater. 2011, 21, 1448–1455. [Google Scholar] [CrossRef]
- Janek, J.; Zeier, W. A solid future for battery development. Nat. Energy 2016, 1, 16141. [Google Scholar] [CrossRef]
- Kato, Y.; Shiotani, S.; Morita, K.; Suzuki, K.; Hirayama, M.; Kanno, R. All-Solid-State Batteries with Thick Electrode Configurations. J. Phys. Chem. Lett. 2018, 9, 607–613. [Google Scholar] [CrossRef] [PubMed]
- Sakuda, A. Favorable composite electrodes for all-solid-state batteries. J. Ceram. Soc. Jpn. 2018, 126, 675–683. [Google Scholar] [CrossRef] [Green Version]
- Takada, K. Progress and prospective of solid-state lithium batteries. Acta Mater. 2013, 61, 759–770. [Google Scholar] [CrossRef]
- Yan, X.; Li, Z.; Wen, Z.; Han, W. Li/Li7La3Zr2O12/LiFePO4 All-Solid-State Battery with Ultrathin Nanoscale Solid Electrolyte. J. Phys. Chem. C 2017, 121, 1431–1435. [Google Scholar] [CrossRef]
- Kato, Y.; Hori, S.; Saito, T.; Suzuki, K.; Hirayama, M.; Mitsui, A.; Yonemura, M.; Iba, H.; Kanno, R. High-power all-solid-state batteries using sulfide superionic conductors. Nat. Energy 2016, 1, 16030. [Google Scholar] [CrossRef]
- Diederichsen, K.M.; McShane, E.J.; McCloskey, B.D. Promising Routes to a High Li+ Transference Number Electrolyte for Lithium Ion Batteries. ACS Energy Lett. 2017, 2, 2563–2575. [Google Scholar] [CrossRef]
- Baek, S.W.; Lee, J.M.; Kim, T.Y.; Song, M.S.; Park, Y. Garnet related lithium ion conductor processed by spark plasma sintering for all solid state batteries. J. Power Sources 2014, 249, 197–206. [Google Scholar] [CrossRef]
- Shao, C.; Liu, H.; Yu, Z.; Zheng, Z.; Sun, N.; Diao, C. Structure and ionic conductivity of cubic Li7La3Zr2O12 solid electrolyte prepared by chemical co-precipitation method. Solid State Ionics 2016, 287, 13–16. [Google Scholar] [CrossRef]
- Cui, Y.; Mahmoud, M.M.; Rohde, M.; Ziebert, C.; Seifert, H.J. Thermal and ionic conductivity studies of lithium aluminum germanium phosphate solid-state electrolyte. Solid State Ionics 2016, 289, 125–132. [Google Scholar] [CrossRef]
- Mertens, A.; Yu, S.; Schön, N.; Gunduz, D.C.; Tempel, H.; Schierholz, R.; Hausen, F.; Kungl, H.; Granwehr, J.; Eichel, R.A. Superionic bulk conductivity in Li1.3Al0.3Ti1.7(PO4)3 solid electrolyte. Solid State Ionics 2017, 309, 180–186. [Google Scholar] [CrossRef]
- Dudley, J.; Wilkinson, D.; Thomas, G.; LeVae, R.; Woo, S.; Blom, H.; Horvath, C.; Juzkow, M.; Denis, B.; Juric, P.; et al. Conductivity of electrolytes for rechargeable lithium batteries. J. Power Sources 1991, 35, 59–82. [Google Scholar] [CrossRef]
- Valøen, L.O.; Reimers, J.N. Transport Properties of LiPF6-Based Li-Ion Battery Electrolytes. J. Electrochem. Soc. 2005, 152, A882–A891. [Google Scholar] [CrossRef]
- Logan, E.R.; Tonita, E.M.; Gering, K.L.; Li, J.; Ma, X.; Beaulieu, L.Y.; Dahn, J.R. A Study of the Physical Properties of Li-Ion Battery Electrolytes Containing Esters. J. Electrochem. Soc. 2018, 165, A21–A30. [Google Scholar] [CrossRef]
- Bernuy-Lopez, C.; Manalastas, W.; Lopez del Amo, J.M.; Aguadero, A.; Aguesse, F.; Kilner, J.A. Atmosphere Controlled Processing of Ga-Substituted Garnets for High Li-Ion Conductivity Ceramics. Chem. Mater. 2014, 26, 3610–3617. [Google Scholar] [CrossRef]
- Jin, Y.; McGinn, P.J. Al-doped Li7La3Zr2O12 synthesized by a polymerized complex method. J. Power Sources 2011, 196, 8683–8687. [Google Scholar] [CrossRef]
- Wang, D.; Zhong, G.; Dolotko, O.; Li, Y.; McDonald, M.J.; Mi, J.; Fu, R.; Yang, Y. The synergistic effects of Al and Te on the structure and Li+-mobility of garnet-type solid electrolytes. J. Mater. Chem. A Mater. Energy Sustain. 2014, 2, 20271–20279. [Google Scholar] [CrossRef]
- Allen, J.; Wolfenstine, J.; Rangasamy, E.; Sakamoto, J. Effect of substitution (Ta, Al, Ga) on the conductivity of Li7La3Zr2O12. J. Power Sources 2012, 206, 315–319. [Google Scholar] [CrossRef]
- Dhivya, L.; Murugan, R. Effect of Simultaneous Substitution of Y and Ta on the Stabilization of Cubic Phase, Microstructure, and Li+ Conductivity of Li7La3Zr2O12 Lithium Garnet. ACS Appl. Mater. Interfaces 2014, 6, 17606–17615. [Google Scholar] [CrossRef]
- Tong, X.; Thangadurai, V.; Wachsman, E.D. Highly Conductive Li Garnets by a Multielement Doping Strategy. Inorg. Chem. 2015, 54, 3600–3607. [Google Scholar] [CrossRef]
- Han, F.; Gao, T.; Zhu, Y.; Gaskell, K.J.; Wang, C. A Battery Made from a Single Material. Adv. Mater. 2015, 27, 3473–3483. [Google Scholar] [CrossRef]
- Yao, X.; Huang, B.; Yin, J.; Peng, G.; Huang, Z.; Gao, C.; Liu, D.; Xu, X. All-solid-state lithium batteries with inorganic solid electrolytes: Review of fundamental science. Chin. Phys. B 2016, 25, 018802. [Google Scholar] [CrossRef]
- Goodenough, J.B.; Singh, P. Review—Solid Electrolytes in Rechargeable Electrochemical Cells. J. Electrochem. Soc. 2015, 162, A2387–A2392. [Google Scholar] [CrossRef]
- Guo, X.; Maier, J. Comprehensive Modeling of Ion Conduction of Nanosized CaF2/BaF2 Multilayer Heterostructures. Adv. Funct. Mater. 2008, 19, 96–101. [Google Scholar] [CrossRef]
- Bandhauer, T.M.; Garimella, S.; Fuller, T.F. A Critical Review of Thermal Issues in Lithium-Ion Batteries. J. Electrochem. Soc. 2011, 158, R1–R25. [Google Scholar] [CrossRef]
- Broussely, M.; Biensan, P.; Bonhomme, F.; Blanchard, P.; Herreyre, S.; Nechev, K.; Staniewicz, R. Main aging mechanisms in Li ion batteries. J. Power Sources 2005, 146, 90–96. [Google Scholar] [CrossRef]
- Vetter, J.; Novák, P.; Wagner, M.; Veit, C.; Möller, K.C.; Besenhard, J.; Winter, M.; Wohlfahrt-Mehrens, M.; Vogler, C.; Hammouche, A. Ageing mechanisms in lithium-ion batteries. J. Power Sources 2005, 147, 269–281. [Google Scholar] [CrossRef]
- Leng, F.; Tan, C.M.; Pecht, M. Effect of Temperature on the Aging rate of Li Ion Battery Operating above Room Temperature. Sci. Rep. 2015, 5, 12967. [Google Scholar] [CrossRef] [Green Version]
- Waldmann, T.; Wilka, M.; Kasper, M.; Fleischhammer, M.; Wohlfahrt-Mehrens, M. Temperature dependent ageing mechanisms in Lithium-ion batteries—A Post-Mortem study. J. Power Sources 2014, 262, 129–135. [Google Scholar] [CrossRef]
- Heubner, C.; Lämmel, C.; Junker, N.; Schneider, M.; Michaelis, A. Microscopic in-operando thermography at the cross section of a single lithium ion battery stack. Electrochem. Commun. 2014, 48, 130–133. [Google Scholar] [CrossRef]
- Heubner, C.; Schneider, M.; Lämmel, C.; Langklotz, U.; Michaelis, A. In-operando temperature measurement across the interfaces of a lithium-ion battery cell. Electrochim. Acta 2013, 113, 730–734. [Google Scholar] [CrossRef]
- Zhang, G.; Cao, L.; Ge, S.; Wang, C.Y.; Shaffer, C.E.; Rahn, C.D. In Situ Measurement of Radial Temperature Distributions in Cylindrical Li-Ion Cells. J. Electrochem. Soc. 2014, 161, A1499–A1507. [Google Scholar] [CrossRef] [Green Version]
- Veth, C.; Dragicevic, D.; Merten, C. Thermal characterizations of a large-format lithium ion cell focused on high current discharges. J. Power Sources 2014, 267, 760–769. [Google Scholar] [CrossRef]
- Eddahech, A.; Briat, O.; Vinassa, J.M. Performance comparison of four lithium–ion battery technologies under calendar aging. Energy 2015, 84, 542–550. [Google Scholar] [CrossRef]
- Richter, F.; Kjelstrup, S.; Vie, P.J.S.; Burheim, O.S. Thermal conductivity and internal temperature profiles of Li-ion secondary batteries. J. Power Sources 2017, 359, 592–600. [Google Scholar] [CrossRef] [Green Version]
- Burheim, O.; Onsrud, M.; Pharoah, J.; Vullum-Bruer, F.; Vie, P. Thermal conductivity, heat sources and temperature profiles of Li-ion batteries. ECS Trans. 2014, 58, 145–171. [Google Scholar] [CrossRef] [Green Version]
- Broussely, M.; Herreyre, S.; Biensan, P.; Kasztejna, P.; Nechev, K.; Staniewicz, R. Aging mechanism in Li ion cells and calendar life predictions. J. Power Sources 2001, 97–98, 13–21. [Google Scholar] [CrossRef]
- Bock, R.; Shum, A.D.; Xiao, X.; Karoliussen, H.; Seland, F.; Zenyuk, I.V.; Burheim, O.S. Thermal Conductivity and Compaction of GDL-MPL Interfacial Composite Material. J. Electrochem. Soc. 2018, 165, F514–F525. [Google Scholar] [CrossRef]
- Liu, Y.; Liu, J.; Sun, Q.; Wang, D.; Adair, K.R.; Liang, J.; Zhang, C.; Zhang, L.; Lu, S.; Huang, H.; et al. Insight into the Microstructure and Ionic Conductivity of Cold Sintered NASICON Solid Electrolyte for Solid-State Batteries. ACS Appl. Mater. Interfaces 2019, 11, 27890–27896. [Google Scholar] [CrossRef]
- Huang, X.; Lu, Y.; Song, Z.; Xiu, T.; Badding, M.E.; Wen, Z. Preparation of dense Ta-LLZO/MgO composite Li-ion solid electrolyte: Sintering, microstructure, performance and the role of MgO. J. Energy Chem. 2019, 39, 8–16. [Google Scholar] [CrossRef] [Green Version]
- Richter, F.; Vie, P.J.; Kjelstrup, S.; Burheim, O.S. Measurements of ageing and thermal conductivity in a secondary NMC-hard carbon Li-ion battery and the impact on internal temperature profiles. Electrochim. Acta 2017, 250, 228–237. [Google Scholar] [CrossRef]
- Vishwakarma, V.; Waghela, C.; Wei, Z.; Prasher, R.; Nagpure, S.C.; Li, J.; Liu, F.; Daniel, C.; Jain, A. Heat transfer enhancement in a lithium-ion cell through improved material-level thermal transport. J. Power Sources 2015, 300, 123–131. [Google Scholar] [CrossRef] [Green Version]
- Burheim, O.S.; Pollet, B.G. Thermal Gradients and Thermal Conductivity in PEM Fuel Cells, Compared to Li-Ion Batteries and Super Capacitors. ECS Trans. 2018, 86, 97–109. [Google Scholar] [CrossRef]
- Viswanathan, V.V.; Choi, D.; Wang, D.; Xu, W.; Towne, S.; Williford, R.E.; Zhang, J.G.; Liu, J.; Yang, Z. Effect of entropy change of lithium intercalation in cathodes and anodes on Li-ion battery thermal management. J. Power Sources 2010, 195, 3720–3729. [Google Scholar] [CrossRef]
- Klemens, P. Heat conduction in solids by phonons. Thermochim. Acta 1993, 218, 247–255. [Google Scholar] [CrossRef]
Figure 1.
Sketch of the measurement rig.
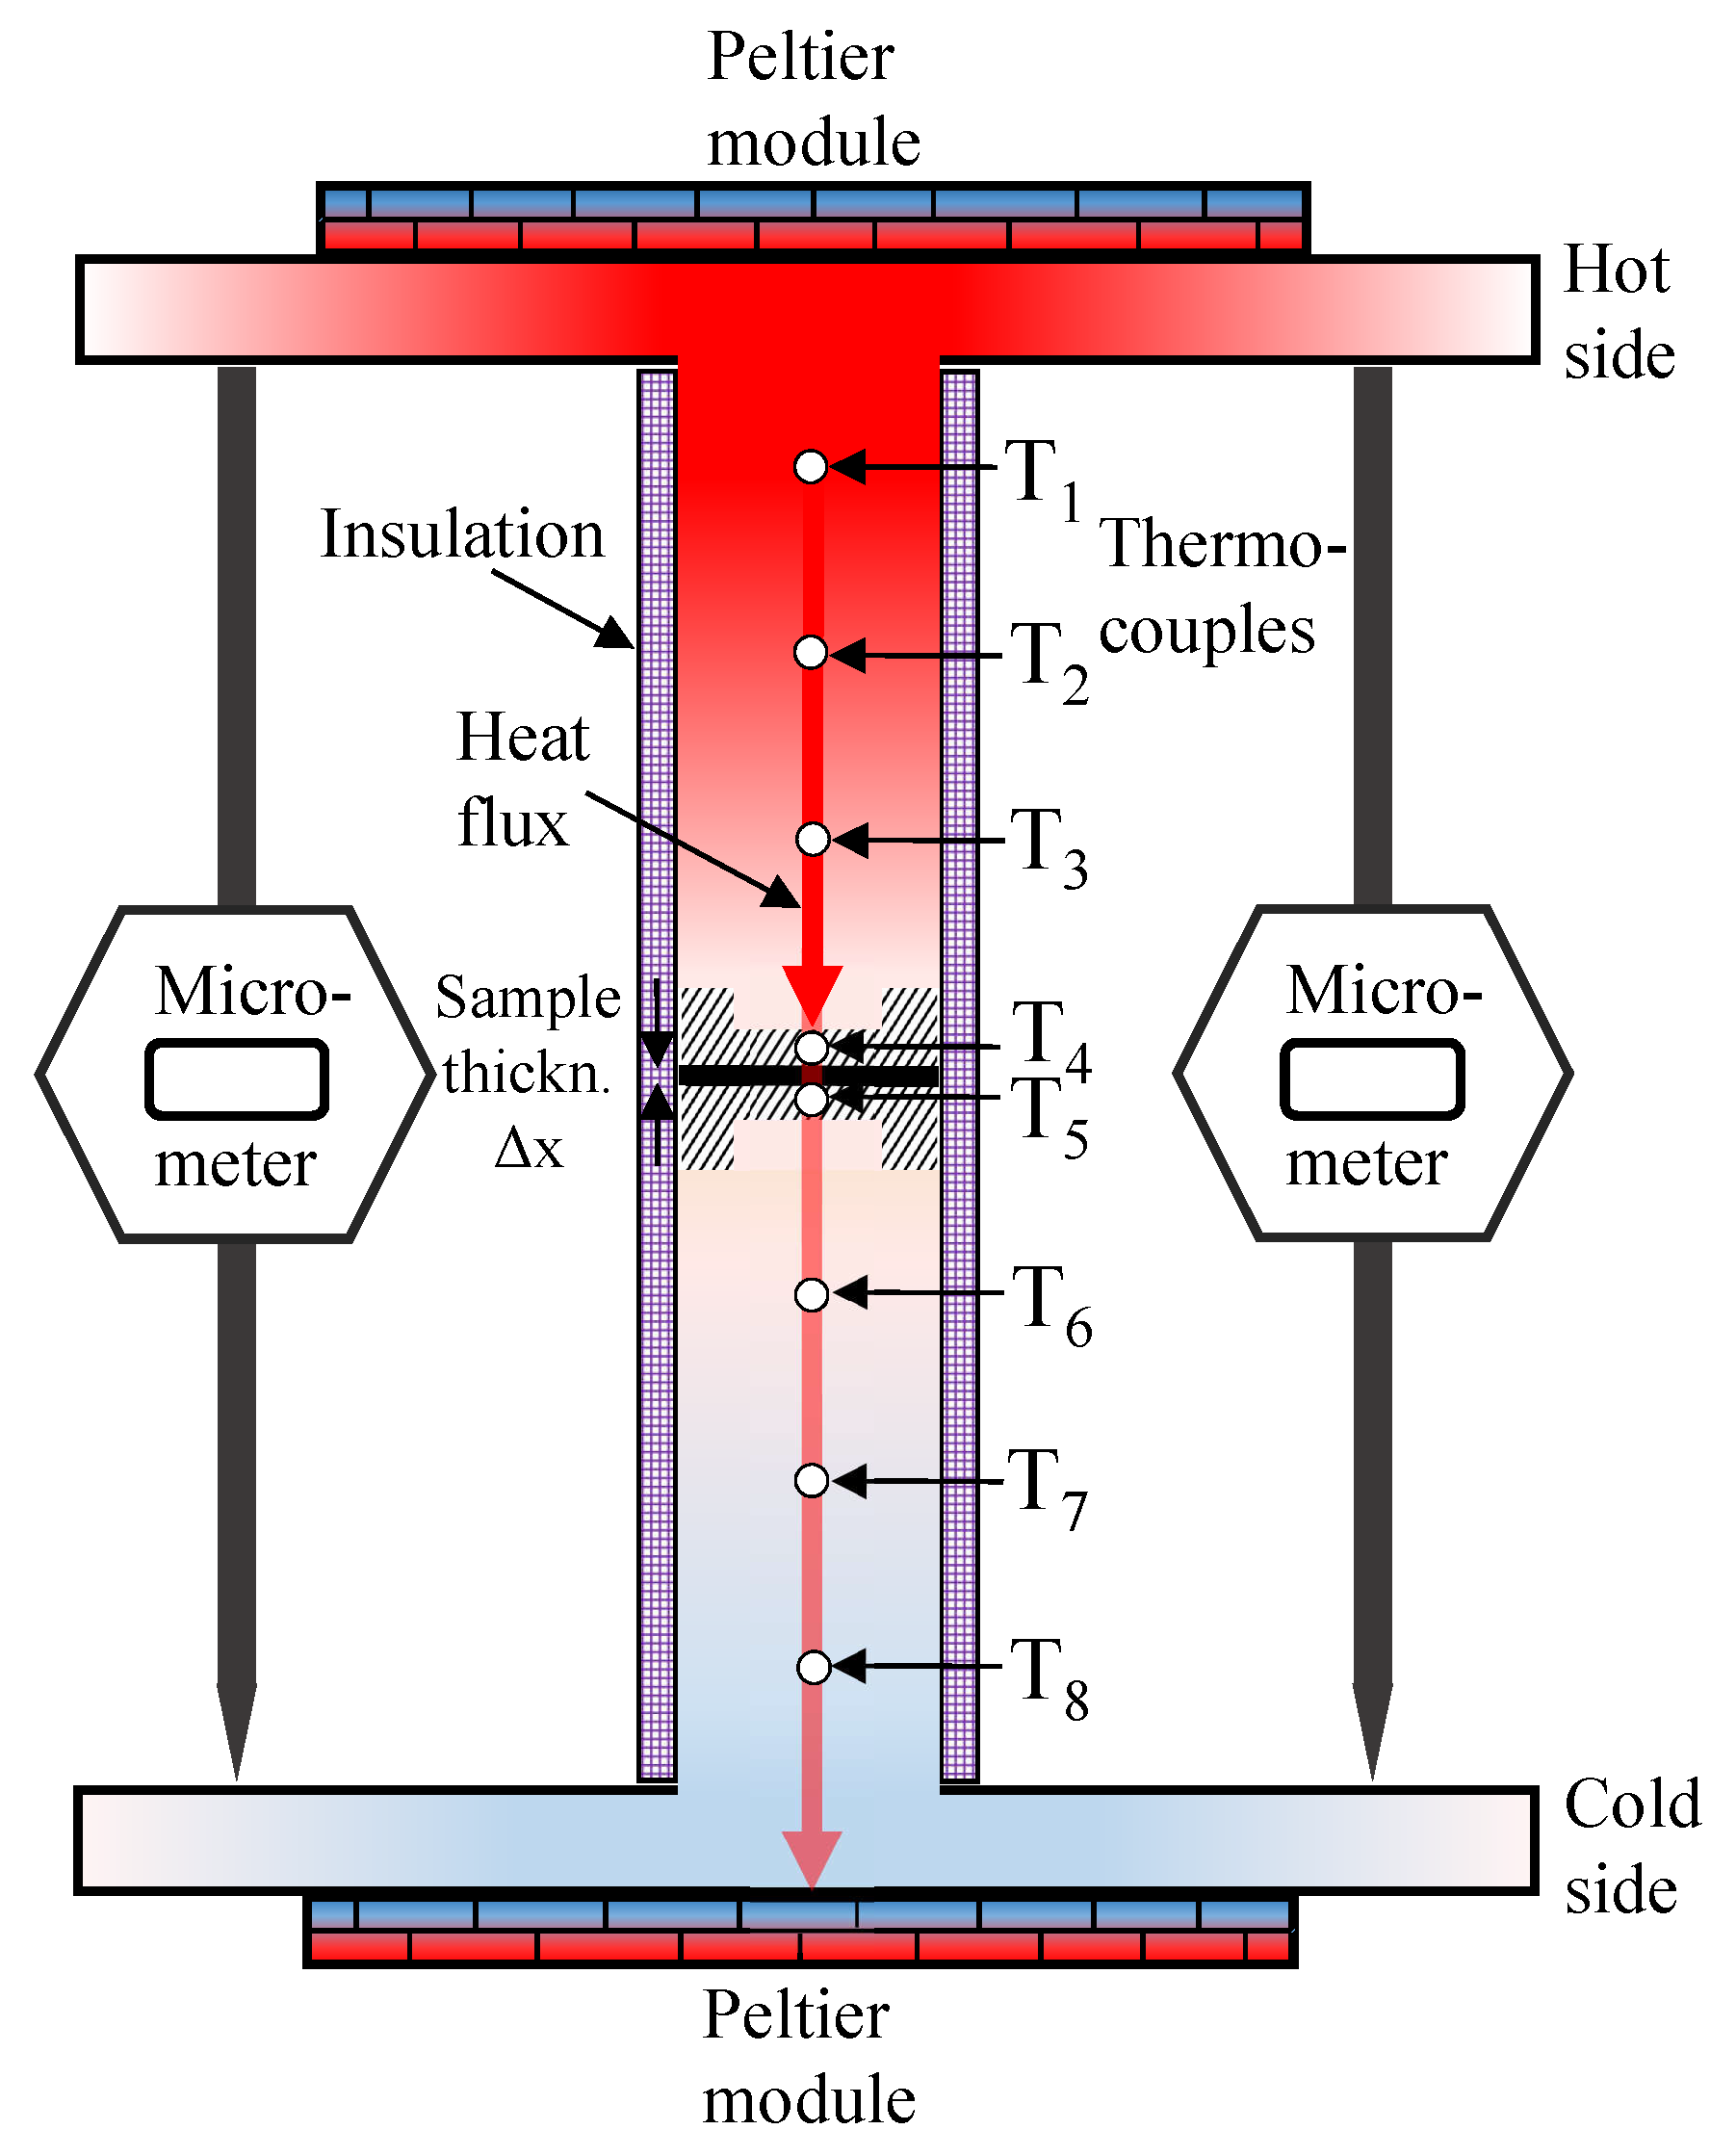
Figure 2.
Sketch of the modeling geometry on top showing three times thicker electrodes for 240 Am than for 80 Am: Separator/Solid State Electrolyte (SSE) thickness is varied between 5 and 25 m for both cases. Setup of the modeled 24-cell stack is shown below.
Figure 2.
Sketch of the modeling geometry on top showing three times thicker electrodes for 240 Am than for 80 Am: Separator/Solid State Electrolyte (SSE) thickness is varied between 5 and 25 m for both cases. Setup of the modeled 24-cell stack is shown below.

Figure 3.
Measured thermal conductivities as a function of compaction pressure for sintered and unsintered solid state electrolytes.
Figure 3.
Measured thermal conductivities as a function of compaction pressure for sintered and unsintered solid state electrolytes.

Figure 4.
Temperature of the stack center (24 cells) compared to the outer boundary for batteries with the two different electrolytes, each with two possible SSE thicknesses (5 and 25 m): The 240 Am battery has three times thicker electrodes than the 80 Am battery; it is almost three times thicker for same number of cells and has three times the capacity. C-rate is four in all cases, and 240 Am is a hypothetical case for electrolyte-soaked separators.


Table 1.
Sample preparation pressure and sintering parameters of the three different solid state electrolytes measured for thermal conductivity.
Table 1.
Sample preparation pressure and sintering parameters of the three different solid state electrolytes measured for thermal conductivity.
| Solid State | Comp. Pressure | Heating Rate | Sintering Temp. | Sintering Time |
|---|---|---|---|---|
| Electrolyte | (bar) | (C min) | (C) | (min) |
| LLZO | 200 | 200 | 1100 | 60 |
| LAGP | 50 | 200 | 1100 | 60 |
| LATP | 500 | 200 | 1100 | 60 |
Table 2.
Thermal conductivities used in the model shown in Equation (9).
Table 2.
Thermal conductivities used in the model shown in Equation (9).
| Material | (through-Plane) | Ref. | |
|---|---|---|---|
| (WKm) | (m) | ||
| Liquid electrolyte soaked separator | 0.6 | 5 and 25 | [50] |
| LLZO, LAGP, LATP; sintered | 0.5 | 5 and 25 | [*] |
| Cathode, dry | 0.3 | 80 and 240 | [50] |
| Cathode, soaked | 1.0 | 80 and 240 | [50] |
| Anode, dry | 0.3 | 95 and 285 | [50] |
| Anode, soaked | 1.0 | 95 and 285 | [50] |
* values measured in this work at 3 bar compaction pressure.
Table 3.
Heat sources used in the developed model.
| Heat | Loss Terms | Current Density | Ref. | Heat Flux, T = 25 C |
|---|---|---|---|---|
| Source | (V) | j (Am) | (Wm) | |
| Entropic | 35 JmolK · T/F | 80 and 240 | [59] | 8.6–27.0 |
| Ohmic | /·j | 80 and 240 | [26,29] | 0.03–15.6 |
| Activation | −0.039 + 0.068 log(j) | 80 and 240 | [51] | 7.2–31.0 |
according to Table 2; = 0.1 Sm for SSE and 1.0 Sm for separator.
Table 4.
Thermal conductivity values of different solid state electrolytes.
| Compaction | LLZO | LLZO | LAGP | LATP |
|---|---|---|---|---|
| Pressure | Unsintered | Sintered | Sintered | Sintered |
| (bar) | (WKm) | (WKm) | (WKm) | (WKm) |
| 3 | ||||
| 4 | ||||
| 5 |
© 2020 by the authors. Licensee MDPI, Basel, Switzerland. This article is an open access article distributed under the terms and conditions of the Creative Commons Attribution (CC BY) license (http://creativecommons.org/licenses/by/4.0/).
Share and Cite
MDPI and ACS Style
Bock, R.; Onsrud, M.; Karoliussen, H.; Pollet, B.G.; Seland, F.; Burheim, O.S. Thermal Gradients with Sintered Solid State Electrolytes in Lithium-Ion Batteries. Energies 2020, 13, 253. https://doi.org/10.3390/en13010253
AMA Style
Bock R, Onsrud M, Karoliussen H, Pollet BG, Seland F, Burheim OS. Thermal Gradients with Sintered Solid State Electrolytes in Lithium-Ion Batteries. Energies. 2020; 13(1):253. https://doi.org/10.3390/en13010253
Chicago/Turabian StyleBock, Robert, Morten Onsrud, Håvard Karoliussen, Bruno G. Pollet, Frode Seland, and Odne S. Burheim. 2020. "Thermal Gradients with Sintered Solid State Electrolytes in Lithium-Ion Batteries" Energies 13, no. 1: 253. https://doi.org/10.3390/en13010253
Note that from the first issue of 2016, this journal uses article numbers instead of page numbers. See further details here.