Potential Effects of Vacuum Insulating Glazing Application for Reducing Greenhouse Gas Emission (GHGE) from Apartment Buildings in the Korean Capital Region


1
Industry Academic Cooperation Foundation, Hankyong National University, 327, Jungang-ro, Anseong-si, Gyeonggi-do 17579, Korea
2
School of Architecture, Hankyong National University, 327, Jungang-ro, Anseong-si, Gyeonggi-do 17579, Korea
*
Author to whom correspondence should be addressed.
Energies 2020, 13(11), 2828; https://doi.org/10.3390/en13112828
Submission received: 11 May 2020
/
Revised: 27 May 2020
/
Accepted: 30 May 2020
/
Published: 2 June 2020
(This article belongs to the Special Issue Designing, Modeling and Optimizing Energy and Environmental Systems for Buildings)
Abstract
:Korea has set a goal of reducing greenhouse gas emissions (GHGEs) to levels 37% below the “business as usual (BAU)” level by 2030, and the building sector, in particular, aims to reduce GHGEs by 45,000,000-ton CO2-eq by 2020. In order to reach this goal, it is crucial to reduce GHGEs that result from energy consumption in apartment buildings, which account for approximately 65% of all buildings in the capital region where the population is concentrated. Moreover, as apartment buildings not only have high window-to wall area ratios, but also use insulating glazing (IG) with low thermal performance, an advanced window system with low heat transmittance (U-value), such as a concrete structure, is necessary for effective GHGE reduction. Therefore, this study aims to evaluate the GHGE reduction effects from replacing existing IG vacuum insulating glazing (VIG) with low U-values in the apartment housing located in the capital region. The analysis revealed the possibility of a GHGE reduction by 45%–79% with the application of commercial VIG with U-values of 0.7 W/m2·K in lieu of the existing IG with U-values ranging from 1.2 to 3.3 W/m2·K for all apartment buildings located in the capital region. Furthermore, GHGEs could be reduced by 82%–93% by replacing the existing IG with VIG with U-values of 0.2 W/m2·K.
1. Introduction
At the 21st Conference of the Parties on Climate Change (COP21) held in Paris, France at the end of 2015, a goal to reduce greenhouse gas emissions (GHGEs) was established for each of the 195 countries of the United Nations Framework Convention on Climate Change (UNFCCC) on the basis of the Intended Nationally Determined Contribution (INDC) [1,2,3]. According to the results of this conference, the roles and responsibilities of the building sector, which is responsible for 40% of global energy use and 30% of GHGEs, are expected to increase [4]. Thus, additional studies, technical developments, and policies for GHGE reduction are anticipated.
Since direct exposure of the building envelope to the external environment is a key factor in the increase in GHGEs due to fossil fuel use by buildings, a fundamental solution for the reduction in GHGEs from buildings is the reduction in energy usage by the building envelope [5,6]. Building envelopes comprise the exterior walls, roof, floors, and windows. Among these components, windows are largely responsible for increased heating and cooling energy use and GHGEs due to heat transmittance caused by the indoor and outdoor temperature difference and direct heat gain by penetrating solar radiation [6,7,8]. Therefore, improving the thermal performance of windows is one of the most important tasks for reducing the total building energy use and GHGEs. The windows most commonly used in modern buildings are insulating glazing (IG), which consist of two or three panes, an insulating gas, frames, spacers, and a low-emission coating, and can reduce energy consumption compared to traditional windows composed of only a single pane and a frame. The use of such IG rather than traditional ones could bring the heat transmission coefficient (U-value) close to 1.0 W/m2·K, significantly reducing the heat loss through the building envelope [9,10,11,12,13,14]. However, these windows have technical limitations that prevent them from reaching a U-value less than 1.0 W/m2·K, i.e., concrete walls, which have a high convection and radiation heat transfer within the IG cavity. Thus, the windows’ complicated heat transfer mechanism, which involves convection and radiation in the IG cavity, must be simplified to achieve a U-value less than 1.0 W/m2·K.
To this end, current research is focused on vacuum insulating glazing (VIG) as an innovative technology that could enhance the thermal performance of windows. The technology theoretically involves only heat transfer through radiation and eliminates both conduction and convection [15,16]. In the assembly of VIG, the vacuum cavity pressure between two panes of glass must be maintained in a vacuum state at or below 0.1 Pa (about 0.000001 kgf/cm2), and support pillars must be inserted to prevent damage to the panes and the vacuum layer by a pressure difference between the vacuum cavity and atmospheric pressure. Effective edge-sealing technology is also required for the vacuum cavity [16].
Since VIG were first proposed by Zoller in 1913, theoretical and experimental studies have continuously worked toward their successful fabrication. Commercial VIG with U-values at or below 1.0 W/m2·K have now been developed and are being supplied in some countries such as the United States, Japan, Australia, and the United Kingdom [17,18,19,20,21,22,23,24,25,26,27,28,29,30,31,32,33,34,35,36,37,38,39]. The best U-value of VIG achieved thus far by theoretical and experimental studies is 0.2 W/m2·K but that of commercial VIG actually supplied is 0.7 W/m2·K [16,35,40,41].
In Korea, officials at the Ministry of Science, Information & Communication Technology (ICT), and Future Planning (MSIP) have selected VIG as a new project for national growth. The MSIP has been continuously investing in the development of VIG with U-values of 0.3 W/m2·K or less. The newly developed windows are expected to be used as a core technology in Korean zero-energy buildings and in current building remodeling projects aiming to reduce energy use and GHGEs in the building sector [42,43,44].
However, the domestic VIG market has not been growing because production costs are high, research and technology are still in their infancy, and the importation of original technology is still required. Thus, these products are neither being produced nor supplied. Nonetheless, the insulation performance of VIG has been demonstrated to be superior to that of existing IG by overseas research, technical developments, and case studies. If VIG is to be used as an advanced technology for reductions in the energy consumption and GHGEs in buildings, a strategy for their phased supply under governmental supervision, regardless of the domestic market trends, is needed.
Nearly 25% of all domestic buildings are concentrated in the capital region, where ~44% of the total population resides; residential apartment buildings account for ~65% of the residential buildings in the capital region. Given these statistics, it is reasonable to first target these residential apartment buildings as the starting point for introducing the VIG in the capital region. Therefore, this study aims to evaluate the GHGE reduction effects from replacing existing IG with VIG with ultralow U-values in all the apartment buildings in the residential area of the capital.
This study is organized as follows. First, we explain the national, industrial sector, and building sector GHGE reduction goals by 2020 and 2030 and analyze the building supply status throughout the country, specifically with respect to residential and apartment buildings in the capital region. Next, we describe a standard apartment building design for the GHGE calculation as well as the indoor and outdoor conditions. Based on this information, we then calculate and analyze the annual energy demand and GHGEs for each household within the apartment buildings as well as the total GHGEs from all apartment buildings in the capital region. This allows us to compare the GHGE reduction effects between the existing IG and the proposed VIG. Lastly, we outline a strategy to effectively supply VIG for the national GHGE reduction goal based on our results. We expect that these study results will provide key data on the use of VIG and help to establish supply strategies to reduce GHGEs in the building sector as well as overall.
2. The Korean GHGE Reduction Goal
Korea has announced a plan to reduce GHGEs by 37% from the “business as usual” (BAU) levels by 2030 according to its INDC submitted to the UNFCCC at the COP21. In particular, Korea’s projected BAU for 2030 is 851,000,000-ton CO2-equivalent, and its GHGE and reduction goals are 536,130,000- and 314,870,000-ton CO2-eq, respectively [45]. To achieve the national GHGE reduction goal by 2030, the government established an individual goal for each industry and prepared an action plan for reaching the national GHGE reduction goals by 2020, as shown in Figure 1.
This plan includes a progressive reduction goal every five years in preparation for the New Climate Change Regime after the year 2020. By 2020, Korea’s BAU is projected to be 776,100,000-ton CO2-eq, while its GHGE reduction goal is 233,100,000-ton CO2-eq. The GHGE reduction goal for the building sector is 27% (45,000,000-ton CO2-eq) below BAU (167,600,000-ton CO2-eq) by 2020. Of this goal, 21,900,000- and 23,100,000-ton CO2-eq are for residential and nonresidential buildings, respectively. The projected BAU of the building sector is the highest of all industries; thus, the GHGE reduction goal is also greatest for this sector. Therefore, a practical strategy and relevant laws and policies are needed to reduce excessive GHGEs within a short period for the building sector. To this end, VIG could be used as a core technology.
3. Building Status in the Capital Region
The number of buildings in Korea was investigated using Korean Statistical Information Service (KSIS) data, from which Korea was divided into a total of 16 administrative districts. Among these districts, the capital region includes Seoul, which is the capital of Korea, and Gyeonggi Province, which is composed of satellite cities, as labeled in Figure 2. Therefore, to calculate the GHGEs from the use of VIG in apartment buildings in the capital region, we analyzed the overall, residential, and apartment building supply status in the capital region, in that order. In 2015, the number of buildings nationwide was 6,986,913. Of these, 1,728,126 (24.7%) were located in the capital region, with 1,092,385 being residential and the remaining 635,741 being non-residential [46].
There are 1,092,385 residential buildings and 357,283 commercial buildings in the capital region, with 96,212 industrial buildings and 49,695 educational buildings. The remaining 132,551 non-residential buildings were used for other purposes [46]. There were 5,560,287 households in residential buildings in the capital region in 2015 [46]. Of these, there were 872,872 single-family households and 3,583,192 households in apartment buildings. Tenements represented another 1,055,574 households, and other household types made up the remaining 48,649 households. Thus, apartment buildings comprised the majority (65%) of the households in residential buildings in the capital region. There are 3,583,192 total households in apartment buildings in the capital region. The data provided by KSIS on the number of households in apartment buildings include categories of buildings with 4–25 stories. Apartments with more than 25 stories are considered 25-F apartments, and households were calculated accordingly. Among the apartments with 4–25 stories, 15-F apartments had the greatest share of households at 25.1% (899,872 households). The apartment household status according to the number of floors is shown in Figure 3 [46].
4. Analysis Method of GHGE
4.1. The Standard Apartment Building
In order to calculate the GHGEs from apartment buildings in the capital region, we needed data on standard apartments. However, there are no research data on apartment surfaces, facades, and windows in Korea, and there is no standard apartment building that could be used as a representative of the capital region. In addition, it is impossible to select a standard representative apartment building objectively on the basis of statistical figures because there have been no studies on surfaces or the window-to-wall area ratio, regarding the building envelopes, or according to elevation. Therefore, we decided that 15-F buildings, which account for more than 25% of the total number of apartment buildings, based on national statistical data, would represent the standard apartment for this study, as shown in Figure 3 [46,47]. The standard apartment building structure consists of reinforced concrete with multiple stories. U-values of the lowest floor and the roof are about 0.174 and 0.110 W/m2·K, respectively, the U-value of the middle floors is about 0.153 W/m2·K, and the U-value of an exterior wall is 0.201 W/m2·K. Basements used as parking lots were excluded from the modeling. The Ministry of Land, Infrastructure, and Transport (MOLIT) recommends that the optimal window area ratio be less than 40% of the total envelope area to reduce the energy consumption in buildings. Thus, we used a window area ratio of 40% of the total envelope area, excluding public areas for the designed standard apartment building [48] The front and back views and basic characteristics of the standard apartment building designed for this study are presented in Figure 4 and Table 1. We calculated the GHGEs generated with conventional IG and VIG for these apartment buildings and compared the results.
4.2. Design of the Conventional IG and VIG
For the evaluation of the reduction in GHGEs due to VIG, the U-values of these windows must be compared with those of conventional windows. However, because it would be impossible to use the U-values of all of the windows on the market in this study, we objectively selected four types of windows proposed by MOLIT in its “Design Standard for Saving Energy in a Building” as representatives, as presented in Table 2.
We compared the GHGEs with these commercial IG, commercial VIG with U-values of 0.7 W/m2·K, and the VIG currently in research with U-values of 0.2 W/m2·K [47].
4.3. Internal and External Conditions
For evaluation of the insulation performance of windows according to their U-values, the internal and external weather conditions of a building needed to be determined. The Korean Solar Energy Society (KSES) analyzed 30 years of weather data in Korea to improve their reliability, as required for various simulations regarding buildings, and then converted them into standard data and distributed them to the general public. For the internal and external temperature and solar radiation conditions in this study, we used the Seoul meteorology data from the Korea Standard Meteorology Data (KSMD) provided by KSES (2015). For a building’s solar radiation conditions, we used the direct and total horizontal radiation data from KSMD. For the outdoor temperature conditions of the walls of apartment buildings during the cooling period, solar air temperatures that considered solar radiation were applied using Equations (1)–(3), taking into consideration the peak load of a building. The outdoor temperature from KSMD was used as-is for the outdoor temperature conditions of air conditioners [49,50].
In Equations (1)–(3), , , , and represent the total direct radiation, total diffuse radiation, total horizontal radiation, and total vertical radiation, respectively. A, AV, and h represent the sun’s azimuth, wall’s azimuth, and sun’s altitude, respectively. Further, , , , and represent the solar air temperature, the outdoor temperature, the solar radiation absorptivity of a wall, and the heat transfer coefficient of the exterior wall surface, respectively. For inside cooling and heating temperatures, MOLIT has recently proposed an appropriate temperature range according to building usage and type in order to reduce GHGEs and building energy use. As such, the cooling and heating temperatures in apartment homes can be selected from 26 to 28 °C and 20 to 22 °C, respectively [46]. Therefore, the temperatures for cooling and heating in this study were set to 26 and 22 °C, respectively, which are commonly used in residential buildings.
4.4. Cooling and Heating Periods
Korean weather conditions can be categorized into cooling, heating, and noncooling or nonheating periods. In this study, we used a degree method with the outdoor temperatures from KSMD along with Equations (4) and (5) to calculate these periods.
In Equations (4)–(5), HDD and CDD refer to the heating degree day and cooling degree day, respectively, as presented in Table 3. Additionally, refers to the indoor set temperature during the cooling and heating periods, and is the daily mean temperature expressed annually.
4.5. Conditions for the Calculation of Energy Demand and GHGEs
As Korea experiences a continental climate, the temperature differences between summer and winter are very great [54]. Because of these temperature differences, the Korean climate is separated into cooling, heating, and noncooling or nonheating periods [55]. Thus, to calculate the annual energy demand according to the types of windows (refer to Table 2), each energy demand level during the cooling and heating periods has been calculated; then, both values were combined. Moreover, the systems for indoor cooling and heating in most apartment buildings are air-conditioning and radiant floor heating systems that are based on electric power [56,57,58,59]. In particular, the supply of hot water for underfloor heating uses individual boilers in each household or district heating, which is supplied by the National District Heating Cooperation [46,60]. However, the apartment buildings using district heating make up less than 10% of all apartment buildings, and more than 90% of apartment buildings use individual boilers [46]. Therefore, considering the cooling and heating status for domestic apartment buildings, the energy resource selected for calculating GHGEs was electric power. GHGEs were calculated as a carbon dioxide emission quantity (ton CO2-eq.) using the carbon emission coefficient of 0.215, which is the ton of oil equivalent (TOE) for residential electric power consumption offered by the Korea Energy Agency [61,62].
5. Results and Discussion
5.1. Energy Demand
5.1.1. Cooling Energy Demand
Figure 5 shows the results for the total cooling energy demand for each standard apartment building. The total annual cooling energy demand for apartment buildings using double-pane windows with U-values of 3.3 W/m2·K was 10,148 kWh, and those for apartment buildings using double-, triple-, and quadruple-pane windows, which have U-values of 1.8, 1.4, and 1.2 W/m2·K, respectively, were calculated to be 5535, 4305, and 3690 kWh, respectively. On the other hand, the total annual cooling energy demand for apartments using VIG with U-values of 0.7 and 0.2 W/m2·K was 2153 and 615 kWh, respectively. The total annual cooling energy demand for each household, for which that of apartment buildings was divided into the number of households (60 households), using windows with U-values of 3.3, 1.8, 1.4, and 1.2 W/m2·K was calculated to be 169.1, 92.3, 71.8, and 61.5 kWh, respectively. On the other hand, the cooling energy demand for each household using VIG was 35.9 and 10.3 kWh, respectively.
5.1.2. Heating Energy Demand
Figure 6 shows the results for the heating energy demand for each standard apartment building. The total heating energy demand for apartment buildings using double-pane windows with U-values of 3.3 W/m2·K, double-pane windows with U-values of 1.8 W/m2·K, triple-pane windows with U-values of 1.4 W/m2·K, and quadruple-pane windows with U-values of 1.2 W/m2·K was calculated to be 360,058, 196,396, 152,752, and 130,930 kWh, respectively, whereas it was 76,376 and 21,822 kWh for apartment buildings using VIG (U-values of 0.7 and 0.2 W/m2·K, respectively). Although the total annual heating energy demand for each household was calculated to be 6001, 3273, 2546, and 2182 kWh for the two types of double-pane windows, the triple-pane windows, and the quadruple-pane windows, respectively, it was 1273 and 364 kWh when the two types of VIG were used. The cooling energy demand is considerably higher than the heating energy demand because the temperature difference between the summer and winter seasons in Korea is very large. Moreover, the inside and outside temperature difference is much larger in the winter than in the summer, and the heating period is also significantly longer than the cooling period, according to our calculations using the degree method.
5.1.3. Annual Energy Demand for a Household
The total annual energy demand for a household in the standard apartment building combined with the total annual household cooling energy and heating energy demand was calculated to be 6170.1, 3365.5, 2617.6, and 2243.7 kWh for apartment buildings using the double-pane window with a U-value of 3.3 W/m2·K, the double-pane window with a U-value of 1.8 W/m2·K, the triple-pane window with a U-value of 1.4 W/m2·K, and the quadruple-pane window with a U-value of 1.2 W/m2·K, respectively, as shown in Figure 7. On the other hand, the total annual energy demand for each household using VIG was 1308.8 or 373.9 kWh.
5.2. GHGE
5.2.1. Annual GHGEs for a Household
GHGE calculations using the energy demand were performed with the TOE and residential electric power values according to the energy type. Because Korean officials are still developing a Korean TOE, the TOE proposed by the Intergovernmental Panel on Climate Change (IPCC) was used. Thus, in this study, we also used the TOE developed by the IPCC [63]. The GHGEs for each household using the calculated household energy demand were determined to be 2.9-, 1.6-, 1.2-, and 1.1-ton CO2-eq, respectively, for households using the double-pane window with a U-value of 3.3 W/m2·K, the double-pane window with a U-value of 1.8 W/m2·K, the triple-pane window with a U-value of 1.4 W/m2·K, and the quadruple-pane window with a U-value of 1.2 W/m2·K, respectively, as shown in Figure 8. On the other hand, when VIG with U-values of 0.7 and 0.2 W/m2·K were used, the GHGEs were calculated to be 0.6- and 0.2-ton CO2-eq, respectively. In a household in the standard apartment building, if the two types of double-pane windows (U-values of 3.3 W/m2·K and 1.8 W/m2·K), triple-pane windows (U-value of 1.4 W/m2·K), and quadruple-pane windows (U-value of 1.2 W/m2·K) were replaced with the commercial VIG with a U-value of 0.7 W/m2·K, the GHGEs decreased by 45.5%–79.3%. If these windows were replaced with the VIG under research with a U-value of 0.2 W/m2·K, GHGEs decreased by 81.8%–93.1%.
5.2.2. Annual GHGEs of Apartment Buildings in the Capital Region
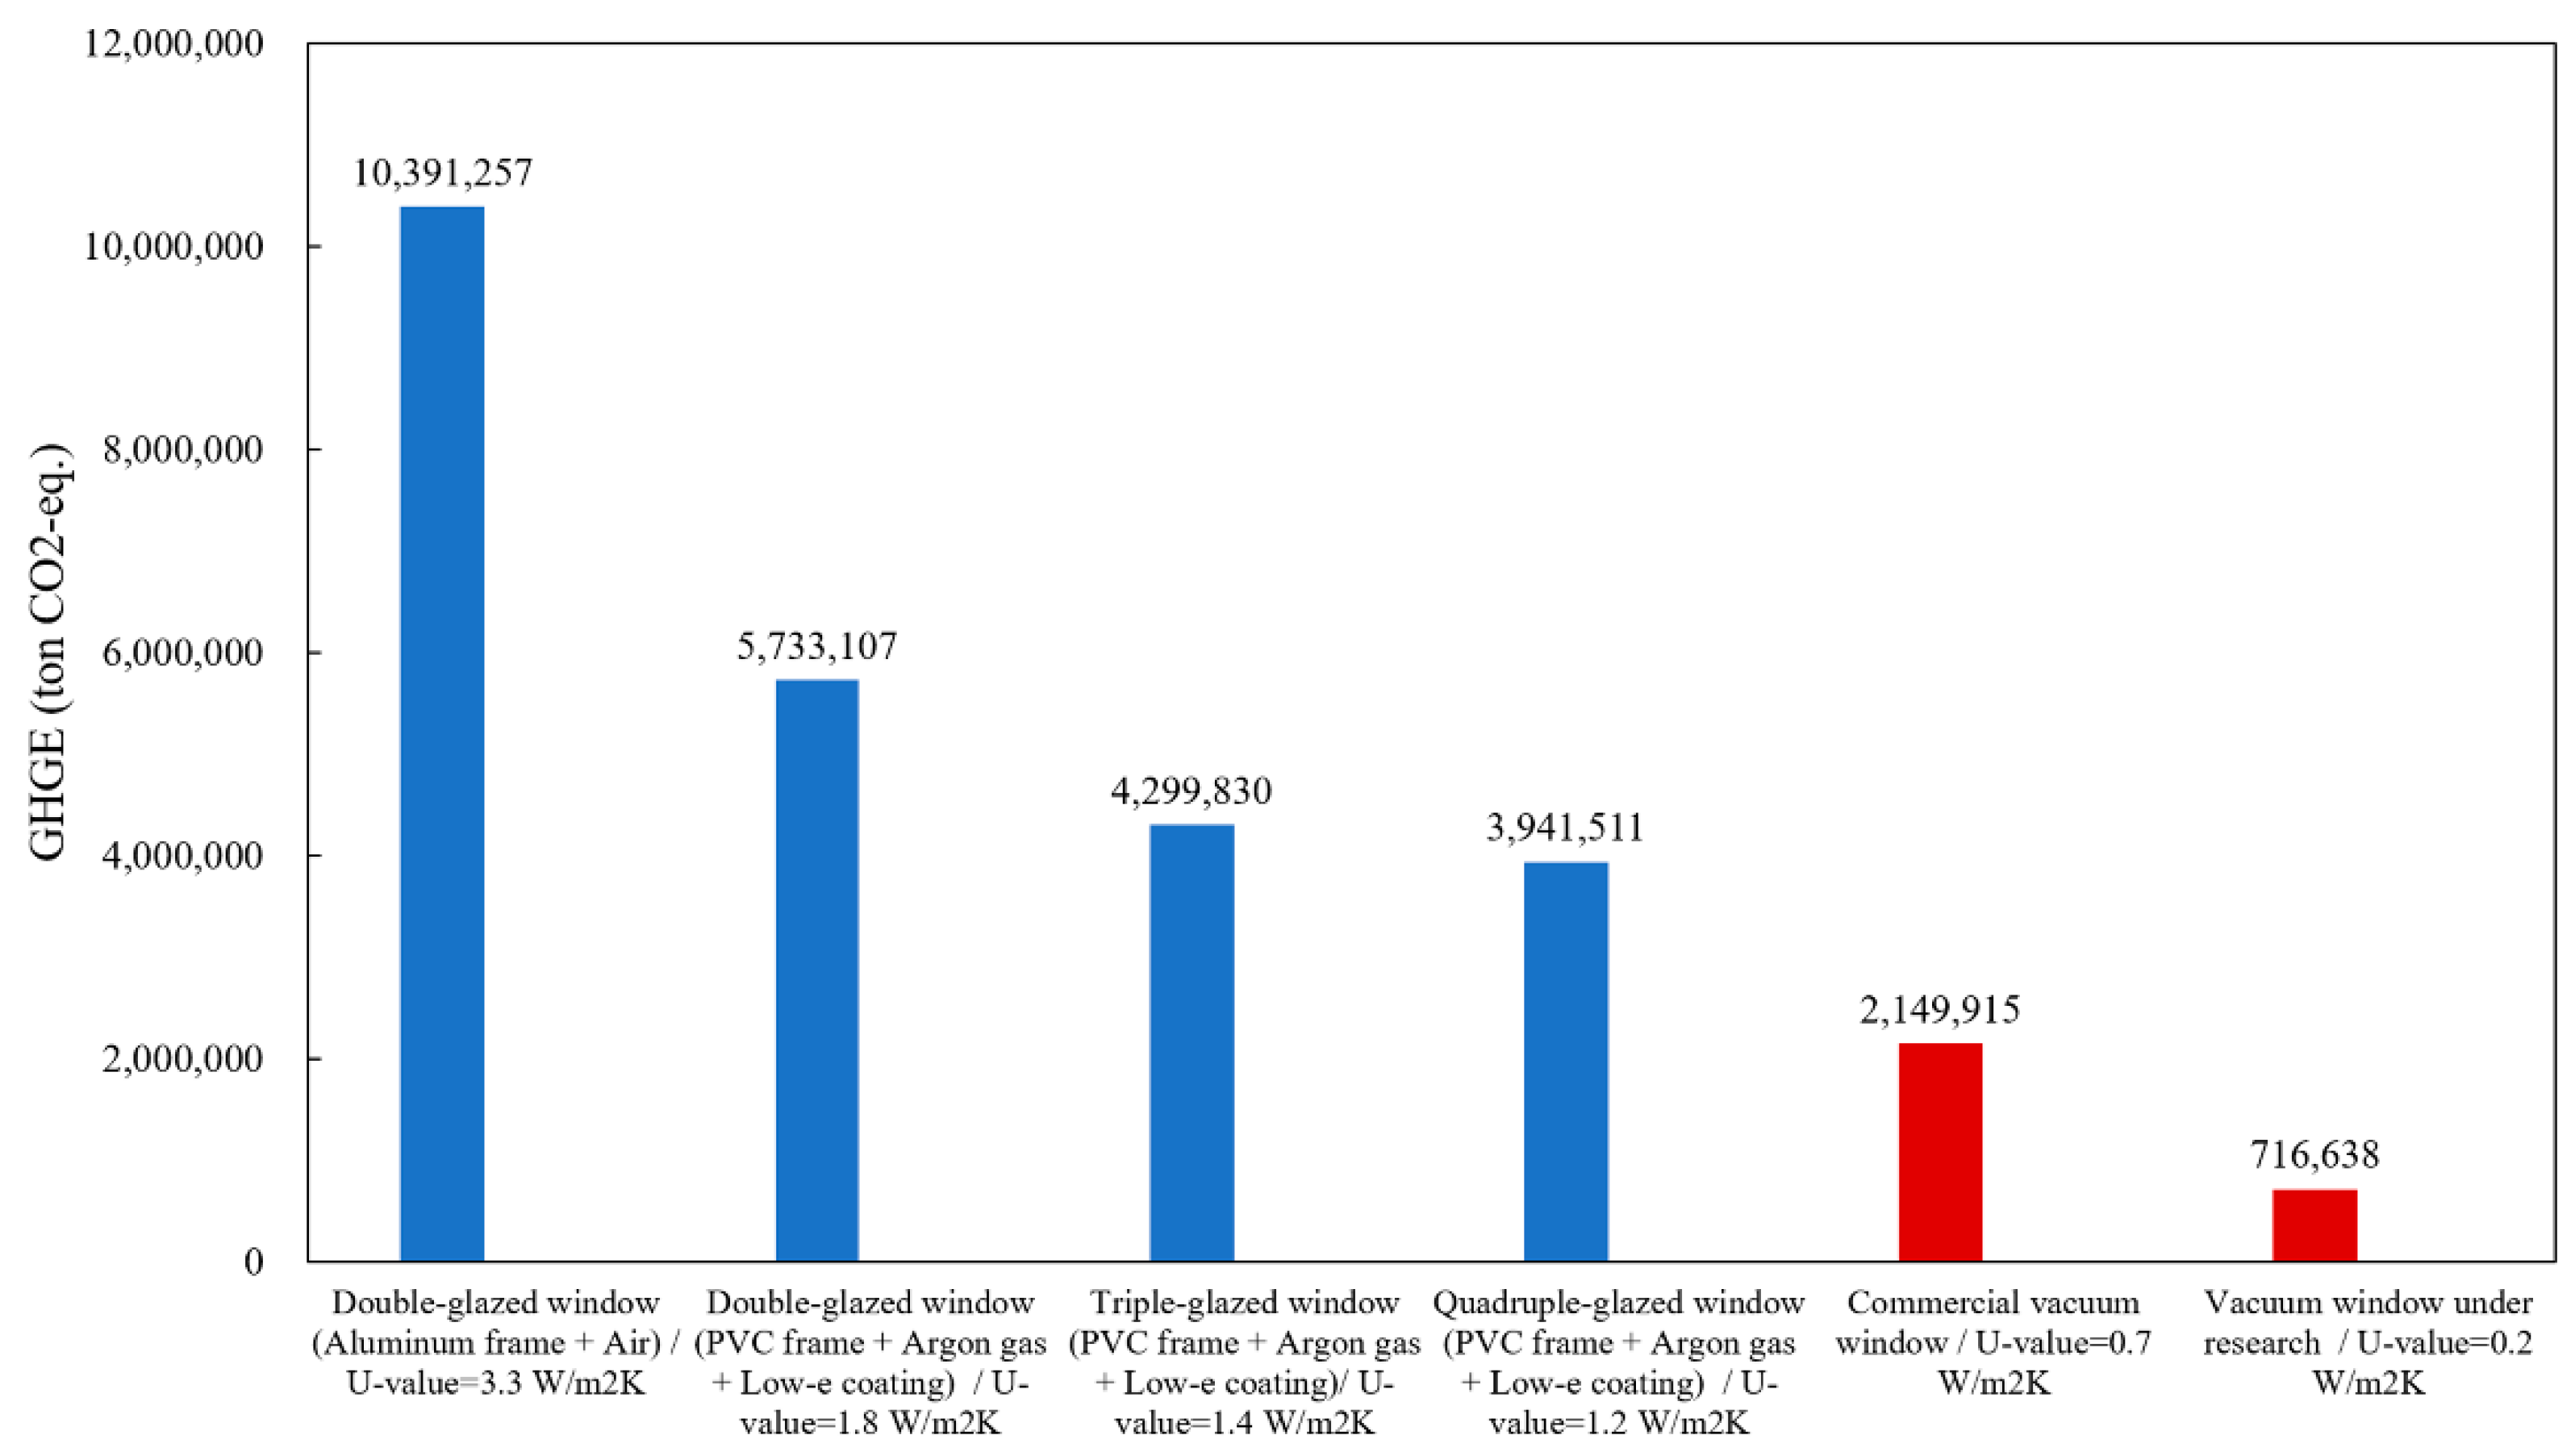
The calculated results of GHGEs for all apartment buildings in the capital region from the total annual GHGEs for each household, as calculated above, are presented in Figure 9. According to calculations using the GHGEs for each household based on the total number of apartment households (3,583,192 households) and window type, the total GHGEs for apartments using double-, triple-, and quadruple-pane windows with U-values of 3.3 and 1.8 W/m2·K, 1.4 W/m2·K, and 1.2 W/m2·K were 10,391,257-, 5,733,107-, 4,299,830-, and 3,299,830-ton CO2-eq, respectively. On the other hand, the total GHGEs for apartment buildings using VIG with U-values of 0.7 and 0.2 W/m2·K were calculated to be 2,149,915- and 716,638-ton CO2-eq, respectively. When the two types of double-pane windows, triple-pane windows, and quadruple-pane windows were replaced with the commercial VIG with a U-value of 0.7 W/m2·K, the GHGEs decreased by 8,241,342-, 3,583,192-, 2,149,915-, and 1,791,596-ton CO2-eq, respectively, and when replaced with the VIG under research with a U-value of 0.2 W/m2·K, the GHGEs decreased by 9,674,619-, 5,016,469-, 3,583,192-, and 3,224,873-ton CO2-eq, respectively.
5.3. VIG Supply Strategy for a Reduction in GHGE
Korea’s GHGE reduction goal by 2020 is 233,100,000-ton CO2-eq, and those for the building sector and residential building sector are 45,000,000- and 21,900,000-ton CO2-eq, respectively. For an effective reduction in GHGEs in the building sector, it is extremely important to first reduce GHGEs in the capital region, where the population and building concentrations are greatest. In particular, the residential building sector comprises the largest share of the entire building sector, and the number of apartment buildings exceeds 50% of all buildings in the nation. Thus, a reduction in GHGEs from apartment buildings is key to achieving the GHGE reduction goal of the building sector over the long term as well as the national GHGE reduction goal. Moreover, because most of the energy used in buildings is for heating and cooling, a reduction in the cooling and heating energy demands through the use of envelopes with high insulation performance is the most basic and important task for reducing GHGEs. Maximizing the insulation performance of the windows in the envelope is a good method for considerably reducing energy demands. VIG, part of an advanced envelope system, could considerably reduce the GHGEs of buildings using fewer resources and a simpler production process than that of IG, as explained in Section 1 and in preceding studies. Thus, these windows have great potential marketability. As shown in the study results, GHGEs could be reduced by 37.6% and 18.3% in the residential building and overall building sectors, respectively, through the use of commercial VIG with U-values of 0.7 W/m2·K in the apartment buildings in the capital region of Korea. The national GHGE reduction goal of 3.5% would also be achieved. Therefore, in order to achieve the GHGE reduction goals by 2020 and 2030, the government must focus on investing in research and development and technical developments aimed at propagating VIG. A phased approach to supplying VIG must also be implemented.
In this supply strategy, must first be supplied to residential buildings, which make up the largest share of buildings. Starting with apartment buildings, the use of VIG that could easily be mass-manufactured would be most effective, because apartments make up 65% of all residential buildings, have a large window area ratio, and use a uniform window type. As shown in Figure 3, because 15-F apartment buildings make up the largest share of all apartment buildings to be supplied in the capital region in Korea, it would be most effective to supply VIG to 15-F apartments through a phased approach. Because high-rise apartment buildings with more than 25 floors have an extremely large window area ratio, there must be laws and policies that mandate the use of VIG for these buildings. Furthermore, if the installation of VIG is made to be mandatory through compulsory laws and policies, as in the Green Standard for Energy and Environmental Design (G-SEED), the architecture energy efficiency level, and environmentally friendly architecture [64,65], the spread of VIG will accelerate, leading to more rapid technical developments and market security.
6. Conclusions
The purpose of this study was to evaluate the necessity of introducing VIG and their effects on GHGE reduction in apartment buildings located in the capital region. The study results are as follows:
- Korea aims to reduce GHGEs to 37% below BAU by 2030. The building sector accounts for ~27% of the total reduction goal, which is the highest amount in the domestic industrial sectors. Thus, building sector GHGE reduction is necessary to reach the national GHGE reduction goal.
- About 25% of all buildings in the country is located in the capital region. Since residential apartment buildings account for approximately 64% of the buildings in the capital, it is important to reduce their energy consumption to meet the GHGE reduction goals. Moreover, apartment buildings have high window-to-wall area ratios and mainly utilize IG with low energy performance. The usage of such windows increases energy consumption and GHGEs for cooling and heating periods. Hence, it is necessary to introduce an advanced window system with superior energy performance to replace the existing windows.
- Recently, a VIG has been developed as an advanced window system. So far, the commercial VIG that have been completed have U-values of 0.7 W/m2·K, but research to develop a with a U-value of 0.2 W/m2·K is actively occurring. If these VIGs are applied to the apartment buildings located in the capital region, GHGEs from energy consumption during cooling and heating periods will be significantly reduced.
- In order to confirm the effects of the VIG, we applied them to all apartment buildings in the capital region and analyzed the amounts of GHGE reduction. When a commercial VIG with a U-value of 0.7 W/m2·K was applied, GHGEs were reduced from 45% to 79% compared to the existing IG with U-values ranging from 1.2 to 3.3 W/m2·K. In addition, when the under-development VIG with a U-value of 0.2 W/m2·K replaced the existing windows, GHGEs decreased by between 82% and 93%.
- The study results suggest that these VIG can significantly reduce GHGEs by improving the energy performance of apartment building envelopes due to their low U-values. If this study were to be expanded to all building sectors, including residential and nonresidential buildings, the VIG GHGE reduction would be even greater.
Despite the superior effects of the VIG with respect to GHGE reduction, it is not easy to introduce them in the buildings due to the high price. Accordingly, the government must lead the market through progressive investments, such as implementing funding for research and development, developing original technology surrounding the VIG, and enforcing codes and standards for U-values, vacuum pressure, and so on. Currently, the government is carrying out the G-SEED policy to reduce GHGEs from the building sector, and this policy includes content related to the energy performance of windows (Korea Energy Economics Institute, 2010). If usage of the VIG were legally encouraged by policies like G-SEED, it could become the main technology factor in reducing GHGEs in the building sector.
Author Contributions
Conceptualization, S.B.; Methodology, S.B.; Software, S.B.; Validation, S.B. and S.K.; Formal Analysis, S.B.; Investigation, S.B. and S.K.; Writing-Original Draft Preparation, S.B.; Writing-Review & Editing, S.B. and S.K.; Visualization, S.B. and S.K.; Supervision, S.K.; Project Administration, S.K. and S.B.; Funding Acquisition, S.K. All authors have read and agreed to the published version of the manuscript.
Funding
This research was funded by the Basic Science Research Program through the National Research Foundation of Korea (NRF) funded by the Ministry of Education (grant number: 2018R1D1A1B07048848).
Conflicts of Interest
The authors declare no conflict of interest.
References
- United Nations Framework Convention on Climate Change. Adoption of the Paris Agreement 2015. Available online: https://unfccc.int/resource/docs/2015/cop21/eng/l09r01.pdf (accessed on 25 May 2020).
- United Nations Framework Convention on Climate Change. Nationally Determined Contributions (NDCs). Available online: https://unfccc.int/nationally-determined-contributions-ndcs (accessed on 25 May 2020).
- UNFCCC. Submission by the Republic of Korea: Intended Nationally Determined Contribution. 2015. Available online: https://www4.unfccc.int/sites/ndcstaging/PublishedDocuments/Republic%20of%20Korea%20First/INDC%20Submission%20by%20the%20Republic%20of%20Korea%20on%20June%2030.pdf (accessed on 25 May 2020).
- Australian Sustainable Built Environmental Council. Defining Zero Emission Buildings Review and Recommendations: Final Report. 2011. Available online: https://www.asbec.asn.au/files/ASBEC_Zero_Carbon_Definitions_Final_Report_Release_Version_15112011_0.pdf (accessed on 25 May 2020).
- International Energy Agency. Technology Roadmap: Energy Efficient Building Envelopes. 2013. Available online: https://www.iea.org/reports/technology-roadmap-energy-efficient-building-envelopes (accessed on 25 May 2020).
- Cuce, E. Development of Innovative Window and Fabric Technologies for Low-Carbon Building. Ph.D. Dissertation, The University of Nottingham, Nottingham, UK, 2014. Available online: https://www.researchgate.net/publication/303443747_Development_of_innovative_window_and_fabric_technologies_for_low-carbon_buildings (accessed on 25 May 2020).
- Yoo, S.; Jeong, H.; Ahn, B.; Han, H.; Seo, D.; Lee, J.; Jang, C. Thermal transmittance of window systems and effects on building heating energy use and energy efficiency rating in South Korea. Energy Build. 2013, 67, 224–236. [Google Scholar] [CrossRef] [Green Version]
- Danny Harvey, L.D. Reducing energy use in the buildings sector: Measures, costs, and examples. Energy Eff. 2009, 2, 139–163. [Google Scholar] [CrossRef]
- Jelle, B.P.; Hynd, A.; Gustavsen, A.; Arasteh, D.; Goudey, H.; Hart, R. Fenestration of today and tomorrow: A state-of-the-art review and future research opportunities. Solar Energy Mater. Solar Cells 2012, 96, 1–28. [Google Scholar] [CrossRef] [Green Version]
- Kamalisarvestani, M.; Saidur, R.; Mekhilef, S.; Javadi, F.S. Performance, materials and coating technologies of thermochromic thin films on smart windows. Renew. Sustain. Energy Rev. 2013, 26, 353–364. [Google Scholar] [CrossRef]
- Van Den Bergh, S.; Hart, R.; Jelle, B.P.; Gustavsen, A. Window spacers and edge seals in insulating glass units: A state-of-the-art review and future perspectives. Solar Energy 2013, 58, 263–280. [Google Scholar] [CrossRef]
- Cuce, E.; Riffat, S.B. A state-of-the-art review on innovative glazing technologies. Renew. Sustain. Energy Rev. 2015, 41, 695–714. [Google Scholar] [CrossRef]
- Malvoni, M.; Baglivo, C.; Congedo, P.M.; Laforgia, D. CFD modeling to evaluate the thermal performances of window frames in accordance with the ISO 10077. Energy 2016, 111, 430–443. [Google Scholar] [CrossRef]
- Murakami, S.; Levine, M.D.; Yoshino, H.; Inoue, T.; Ikaga, T.; Shimoda, Y.; Miura, S.; Sera, T.; Nishio, M.; Sakamoto, Y.; et al. Overview of energy consumption and GHG mitigation technologies in the building sector of Japan. Energy Eff. 2009, 2, 179–194. [Google Scholar] [CrossRef]
- Fang, Y.; Hyde, T.J.; Arya, F.; Hewitt, N.; Eames, P.C.; Norton, B.; Miller, S. Indium alloy-sealed vacuum glazing development and context. Renew. Sustain. Energy Rev. 2014, 37, 480–501. [Google Scholar] [CrossRef]
- Cuce, E.; Cuce, P.M. Vacuum glazing for highly insulating window: Recent developments and future prospects. Renew. Sustain. Energy Rev. 2016, 54, 1345–1357. [Google Scholar] [CrossRef]
- Benson, D.K.; Tracy, C.E. Laser Sealed Vacuum Insulation Window. U.S. Patent 4683154, 19 August 1987. [Google Scholar]
- Collins, R.E.; Robinson, S.J. Evacuated glazing. Solar Energy 1991, 47, 27–38. [Google Scholar] [CrossRef]
- Garrison, J.D.; Collins, R.E. Manufacture and cost of vacuum glazing. Solar Energy 1995, 55, 151–161. [Google Scholar] [CrossRef]
- Collins, R.E.; Simko, T.M. Current status of the science and technology of vacuum glazing. Solar Energy 1998, 62, 189–213. [Google Scholar] [CrossRef]
- Griffiths, P.W.; Di Leo, M.; Cartwright, P.; Eames, P.C.; Yianoulis, P.; Leftheriotis, G.; Norton, B. Fabrication of evacuated glazing at low temperature. Solar Energy 1998, 63, 243–249. [Google Scholar] [CrossRef]
- Ng, N.; Collins, R.E.; So, L. Photodesorption of gases in vacuum glazing. J. Vac. Sci. Technol. A Vac. Surf. Films 2003, 21, 1776–1783. [Google Scholar] [CrossRef]
- Ng, N.; Collins, R.E.; So, L. Thermal and optical evolution of gas in vacuum glazing. Mater. Sci. Eng. B 2005, 119, 258–264. [Google Scholar] [CrossRef]
- Fang, Y.; Eames, P.C.; Hyde, T.J.; Norton, B. Complex multimaterial insulating frames for windows with evacuated glazing. Solar Energy 2005, 79, 245–261. [Google Scholar] [CrossRef]
- Fang, Y.; Eames, P.C.; Norton, B.; Hyde, T.J. Experimental validation of a numerical model for heat transfer in vacuum glazing. Solar Energy 2006, 80, 564–577. [Google Scholar] [CrossRef]
- Fang, Y.; Eames, P.C.; Norton, B. Effect of glass thickness on the thermal performance of evacuated glazing. Solar Energy 2007, 81, 395–404. [Google Scholar] [CrossRef]
- Fang, Y.; Eames, P.C.; Norton, B.; Hyde, T.J.; Zhao, J.; Wang, J.; Huang, Y. Low emittance coatings and the thermal performance of vacuum glazing. Solar Energy 2007, 81, 8–12. [Google Scholar] [CrossRef]
- Fang, Y.; Hyde, T.; Eames, P.C.; Hewitt, N. Theoretical and experimental analysis of the vacuum pressure in a vacuum glazing after extreme thermal cycling. Solar Energy 2009, 83, 1723–1730. [Google Scholar] [CrossRef]
- Fang, Y.; Hyde, T.; Hewitt, N.; Eames, P.C.; Norton, B. Comparison of vacuum glazing thermal performance predicted using two- and three-dimensional models and their experimental validation. Solar Energy Mater. Solar Cells 2009, 93, 1492–1498. [Google Scholar] [CrossRef] [Green Version]
- Fang, Y.; Eames, P.C.; Norton, B.; Hyde, T.; Huang, Y.; Hewitt, N. The thermal performance of an electrochromic vacuum glazing with selected low-emittance coatings. Solar Energy 2010, 84, 516–525. [Google Scholar] [CrossRef]
- Fang, Y.; Hyde, T.J.; Hewitt, N. Predicted thermal performance of triple vacuum glazing. Solar Energy 2010, 84, 2132–2139. [Google Scholar] [CrossRef]
- Minaai, T.; Kumagai, M.; Nara, A.; Tanemura, S. Study of the outgassing behavior of SnO2: F films on glass in vacuum under external energy excitation. Mater. Sci. Eng. B 2005, 119, 252–257. [Google Scholar] [CrossRef]
- Fang, Y.; Eames, P.C. Thermal performance of an electrochromic vacuum glazing. Energy Convers. Manag. 2006, 47, 3602–3610. [Google Scholar] [CrossRef]
- Fang, Y.; Eames, P.C. The effect of glass coating emittance and frame rebate on heat transfer through vacuum and electrochromic vacuum glazed windows. Solar Energy Mater. Solar Cells 2006, 90, 2683–2695. [Google Scholar] [CrossRef]
- Manz, H.; Brunner, S.; Wullschleger, L. Triple vacuum glazing: Heat transfer and basic mechanical design constraints. Solar Energy 2006, 80, 1632–1642. [Google Scholar] [CrossRef]
- Wang, J.; Eames, P.C.; Zhao, J.F.; Hyde, T.; Fang, Y. Stresses in vacuum glazing fabricated at low temperature. Solar Energy Mater. Solar Cells 2007, 91, 290–303. [Google Scholar] [CrossRef]
- Zhao, J.F.; Eames, P.C.; Hyde, T.J.; Fang, Y.; Wang, J. A modified pump-out technique used for fabrication of low temperature metal sealed vacuum glazing. Solar Energy 2007, 81, 1072–1077. [Google Scholar] [CrossRef]
- Wullschleger, L.; Manz, H.; Ghazi Wakili, K. Finite element analysis of temperature-induced deflection of vacuum glazing. Constr. Build. Mater. 2009, 23, 1378–1388. [Google Scholar] [CrossRef]
- Guardian Glass Website. Available online: http://www.guardianglass.com (accessed on 25 May 2020).
- Pilkington Spacia UK. Pilkington Spacia Ultra-Thin Energy-Efficient Vacuum Glazing. 2016. Available online: https://www.pilkington.com/en-gb/uk/products/product-categories/thermal-insulation/pilkington-spacia/ (accessed on 25 May 2020).
- Specia Vacuum Glass Japan. Vacuum Window Spacia. 2016. Available online: https://shinku-glass.jp/product/st/ (accessed on 25 May 2020).
- Jeong, S.Y.; Baek, N.C.; Yoon, J.H.; Shin, U.; Kim, Y.K.; Kang, S.H. The study on energy performance measurement and energy self-sufficiency analysis of KIER zero energy solar house II. J. Arch. Inst. Korea 2011, 27, 307–314. [Google Scholar]
- Korea Land & Housing Corporation. Green Remodeling Project. 2016. Available online: http://www.lh.or.kr/contents/cont.do?sCode=user&mId=196&mPid=193 (accessed on 25 May 2020).
- Ministry of Science, ICT and Future Planning Korea. Selection Result for New Industry and Creating Project Assignment. 2016. Available online: http://www.korea.kr/news/pressReleaseView.do;JSESSIONID_KOREA=m7fWkDYBttMQj4B1wzvCpG8JyscuJJhi_4RxKoDQaBlq7bBWQKkF!468719327!643091080?newsId=156062188&pageIndex=4414&repCodeType=&repCode=&startDate=2008-02-29&endDate=2019-08-28&srchWord= (accessed on 25 May 2020).
- Ministry of Environment. Roadmap for Reaching National Greenhouse Reduction Goals. 2014. Available online: http://www.me.go.kr/home/web/board/read.do?pagerOffset=30&maxPageItems=10&maxIndexPages=10&searchKey=&searchValue=&menuId=286&orgCd=&boardId=339265&boardMasterId=1&boardCategoryId=&decorator (accessed on 25 May 2020).
- Korea Statistical Information Service. Total Population and Household Investigation. 2015. Available online: http://kosis.kr/statisticsList/statisticsListIndex.do?menuId=M_01_01&vwcd=MT_ZTITLE&parmTabId=M_01_01 (accessed on 25 May 2020).
- Choi, I.J.; Park, I.S. A study on the changes in the compositions of unit plan of apartments: Based on each actual area ratio of the apartment plans constructed in Busan area between 1970–2000s. J. Arch. Inst. Korea 2008, 10, 53–62. [Google Scholar]
- The National Law Information Center. Design Standard for Energy Saving in Buildings. 2016. Available online: http://www.law.go.kr/LSW/main.html (accessed on 25 May 2020).
- Suh, S.J. Building Equipment; Iljinsa Publishing Company: Seoul, Korea, 2003. [Google Scholar]
- Yu, A.; Shinsuke, K.; Satoru, K.; Harunori, Y.; Yasuhiko, M.; Tadahiko, I. Environmental engineering. In Architectural Environment Engineering; Lee, J., Keum, J., Do, G., Kim, S., Kim, J., Kim, H., Lee, S., Park, H., Kim, J.D., Kim, Y., Eds.; Sigmapress Publishing Company: Seoul, Korea, 2003; pp. 144–150. [Google Scholar]
- Lee, K.; Baek, H.J.; Cho, C.H. Future projection of changes in cooling and heating degree days in Korea. J. Clim. Res. 2014, 9, 1–13. [Google Scholar] [CrossRef]
- Pusat, S.; Ekmekci, I. A study on degree-day regions of Turkey. Energy Eff. 2016, 9, 232–525. [Google Scholar] [CrossRef]
- Friess, W.A.; Rakhshan, K.; Davis, M.P. A global survey of adverse energetic effects of increased wall insulation in office buildings: Degree day and climate zone indicators. Energy Eff. 2017, 10, 97–116. [Google Scholar] [CrossRef]
- Climate and Average Weather in South Korea. Weather & Climate. Available online: https://weather-and-climate.com/average-monthly-Rainfall-Temperature-Sunshine-in-South-Korea (accessed on 25 May 2020).
- Kim, D.; Lee, B. The development of the calibration method of building energy consumption by HDDm and CDDm. J. Korean Sol. Energy Soc. 2018, 38, 15–26. [Google Scholar]
- Sohn, C.W.; Yang, Y.S. Effect of types cooling system on electrical energy requirement in Korea. Soc. Air-Condit. Refrig. Eng. Korea 1995, 1995, 477–483. [Google Scholar]
- Lee, K.S.; Park, S.K.; Oh, S.K. Thermal comfort analysis on discharge system of a standing type air-conditioner in living room of an apartment. Soc. Air-Condit. Refrig. Eng. Korea 2002, 2002, 31–36. [Google Scholar]
- Koo, J.O. Thermal characteristics of the floor heating system (Ondol) with light weight concrete base. J. Adv. Miner. Aggreg. Compos. 2003, 8, 161–170. [Google Scholar]
- Yang, K.W.; Rhee, K.N.; Ryu, S.R.; Yeo, M.S.; Kim, K.W. A study on the thermal performance simulation considering hydronic analysis for radiant floor heating system. J. Arch. Inst. Korea 2008, 24, 321–328. [Google Scholar]
- Lim, S.Y.; Kim, H.J.; Yoo, S.H. The demand function for residential heat through district heating system and its consumption benefits in Korea. Energy Policy 2016, 97, 155–160. [Google Scholar] [CrossRef]
- Korea Energy Agency. Oil Conversion Tons Calculated. 2010. Available online: http://co2.kemco.or.kr/toe/toe.aspx (accessed on 25 May 2020).
- Korea Environment Corporation. National Greenhouse Gas Inventory Report Korea. 2015. Available online: https://www.keco.or.kr/kr/business/climate/communityid/187/view.do?idx=16284 (accessed on 25 May 2020).
- Korea Energy Economics Institute. A Study on Energy Consumption and Retrospective Estimation by Types in a Residential Sector. 2010. Available online: http://www.keei.re.kr/main.nsf/index.html?open&p=%2Fweb_keei%2Fd_results.nsf%2Fmain_all%2F0B6BF220B0D8EBF4492579C30039A7C8&s=%3FOpenDocument%26menucode%3DS0%26category%3D%25EA%25B8%25B0%25EB%25B3%25B8%25EC%2597%25B0%25EA%25B5%25AC (accessed on 25 May 2020).
- Korea Environmental Industry and Technology Institute. Explanation book on Green Standard for Energy and Environmental Design (G-SEED). 2016. Available online: https://www.gbc.re.kr/app/data/regulation/list.do (accessed on 25 May 2020).
- Korea Institute of Registered Architecture. Guideline for Building Energy Efficiency Rating. 2013. Available online: http://www.kira.or.kr/jsp/main/02/01.jsp?page=97&ba_bbsId=BBS_00_LAW_INFO&%3Bmode=read&ba_id=115554&bbsLocale=&sc_keyword=&sc_ba_authorNameL=&sc_ba_bbsId=BBS_00_LAW_INFO&mode=read&sc_ba_cateId=&sc_scType=1&sc_ba_titleL= (accessed on 25 May 2020).
Figure 1.
Reduction goal for each industry and building sector.
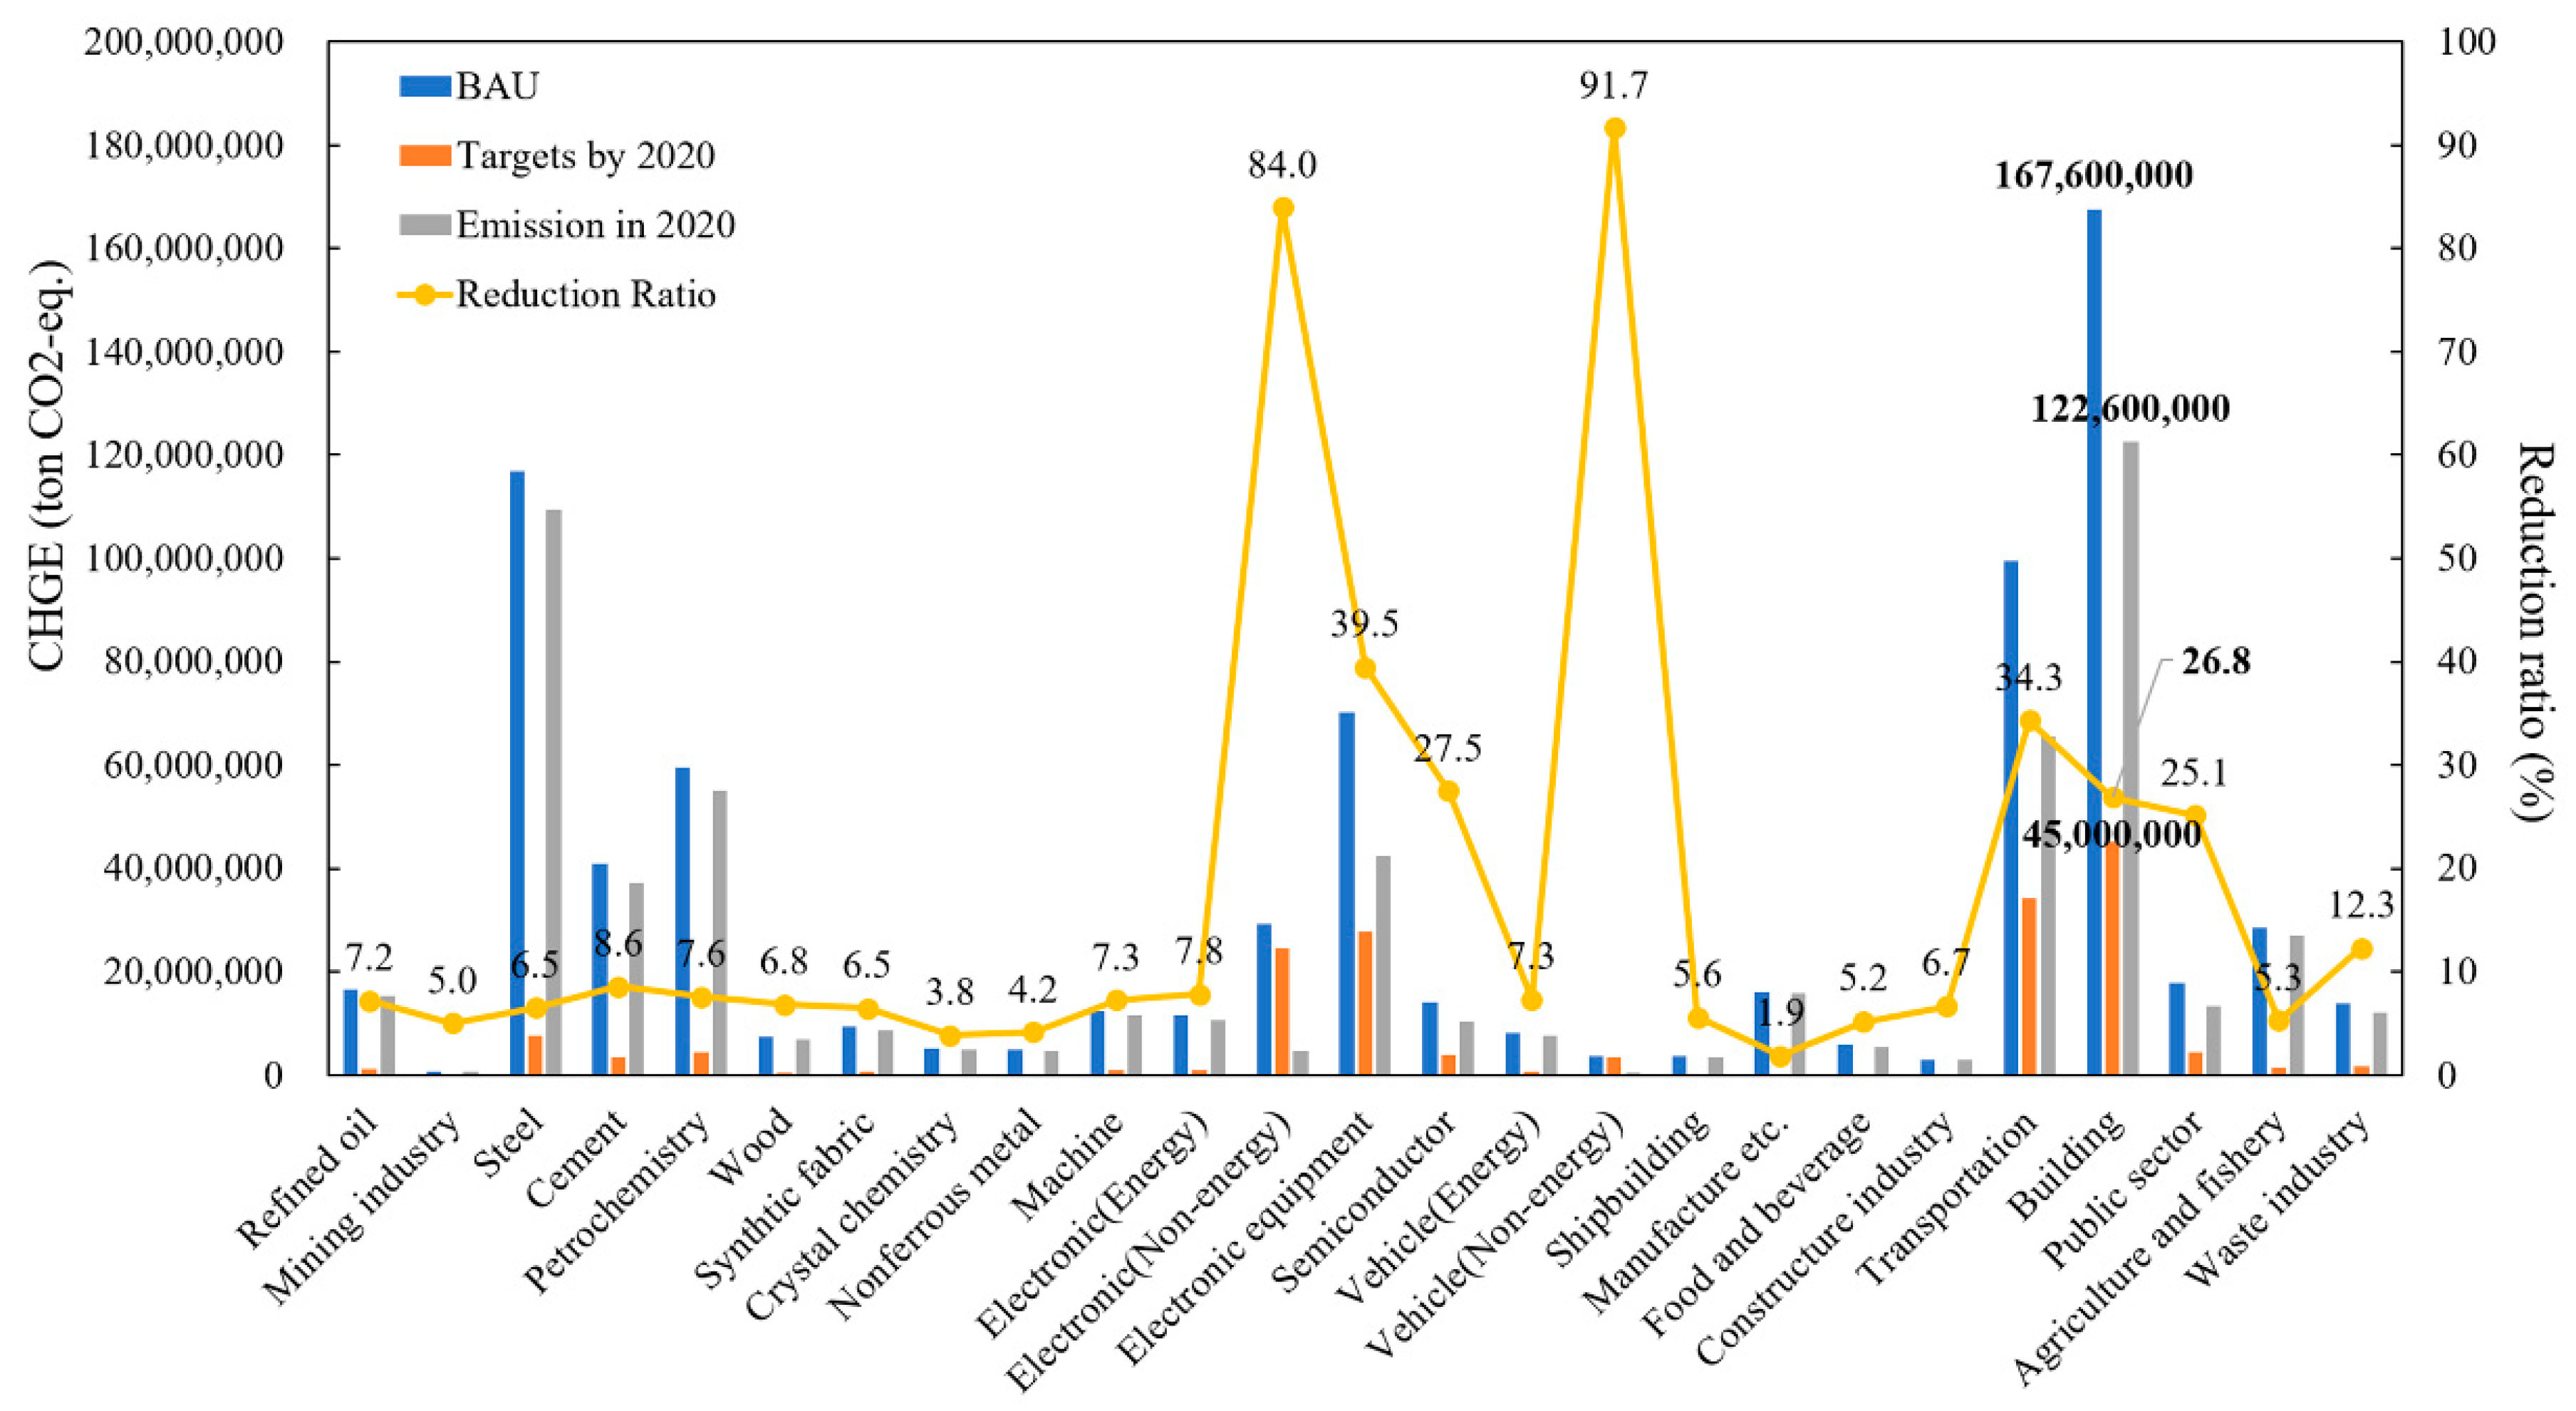
Figure 2.
The scope of the Korean capital region.

Figure 3.
Household status by apartment building floors in the capital region.
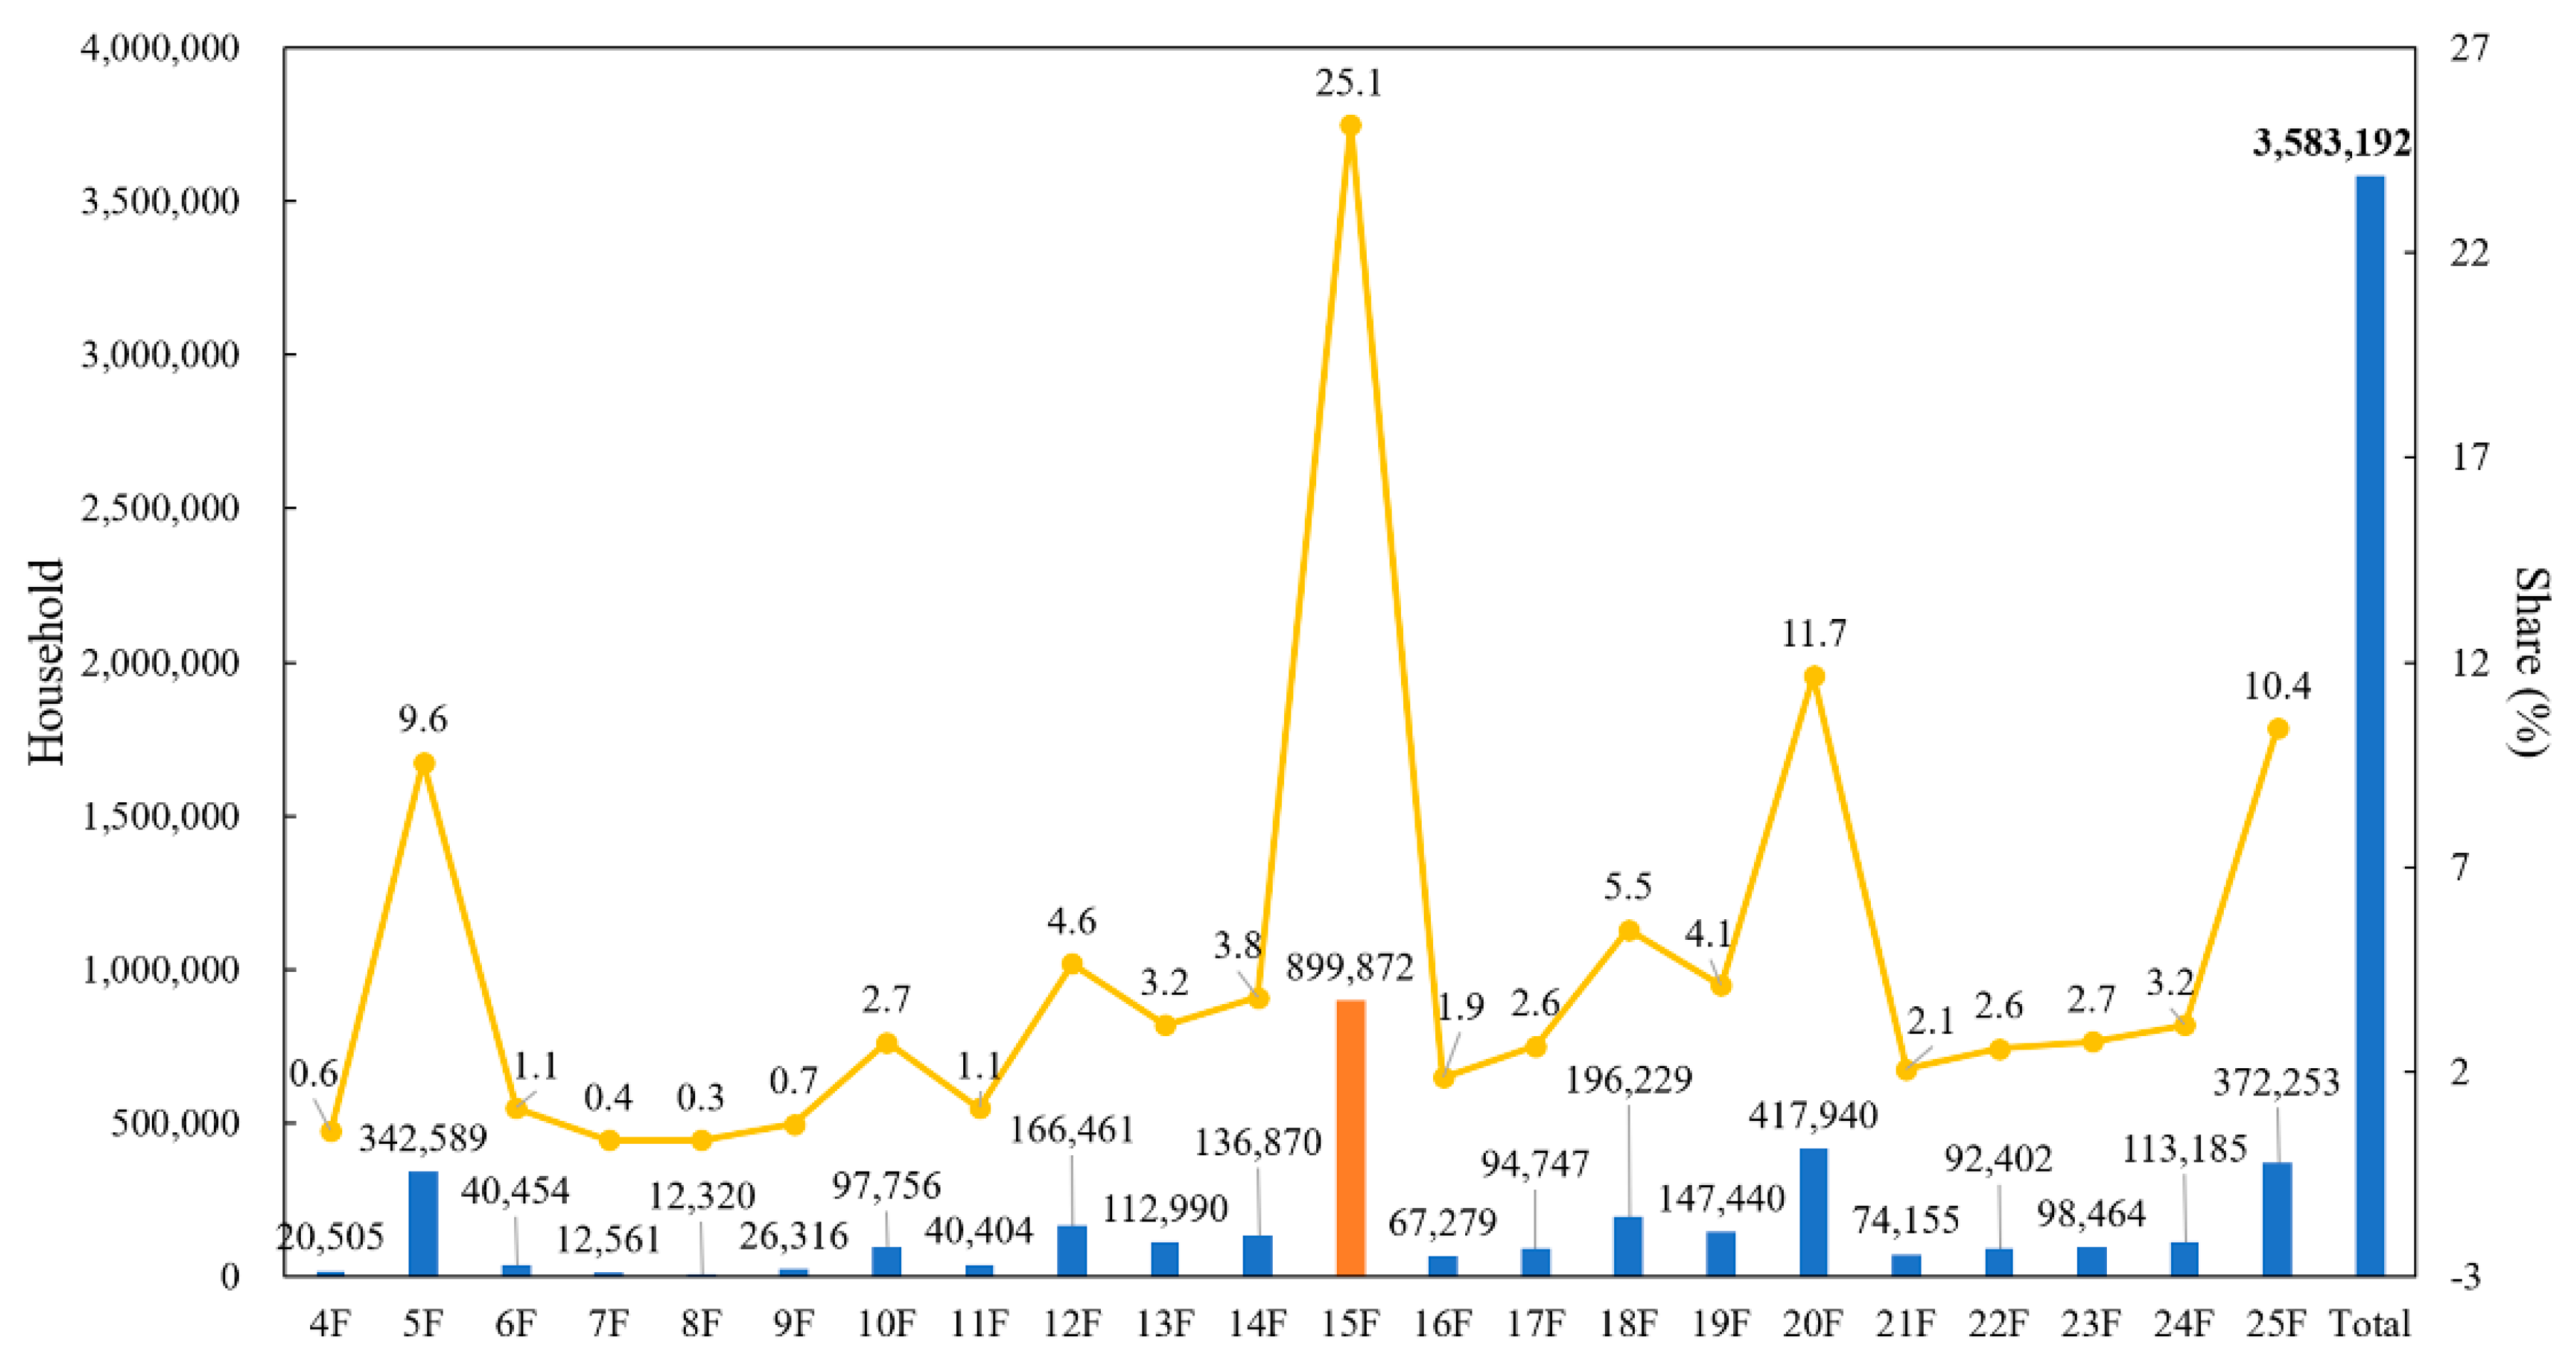
Figure 4.
Front view (left) and rear view (right) of the designed standard apartment building.
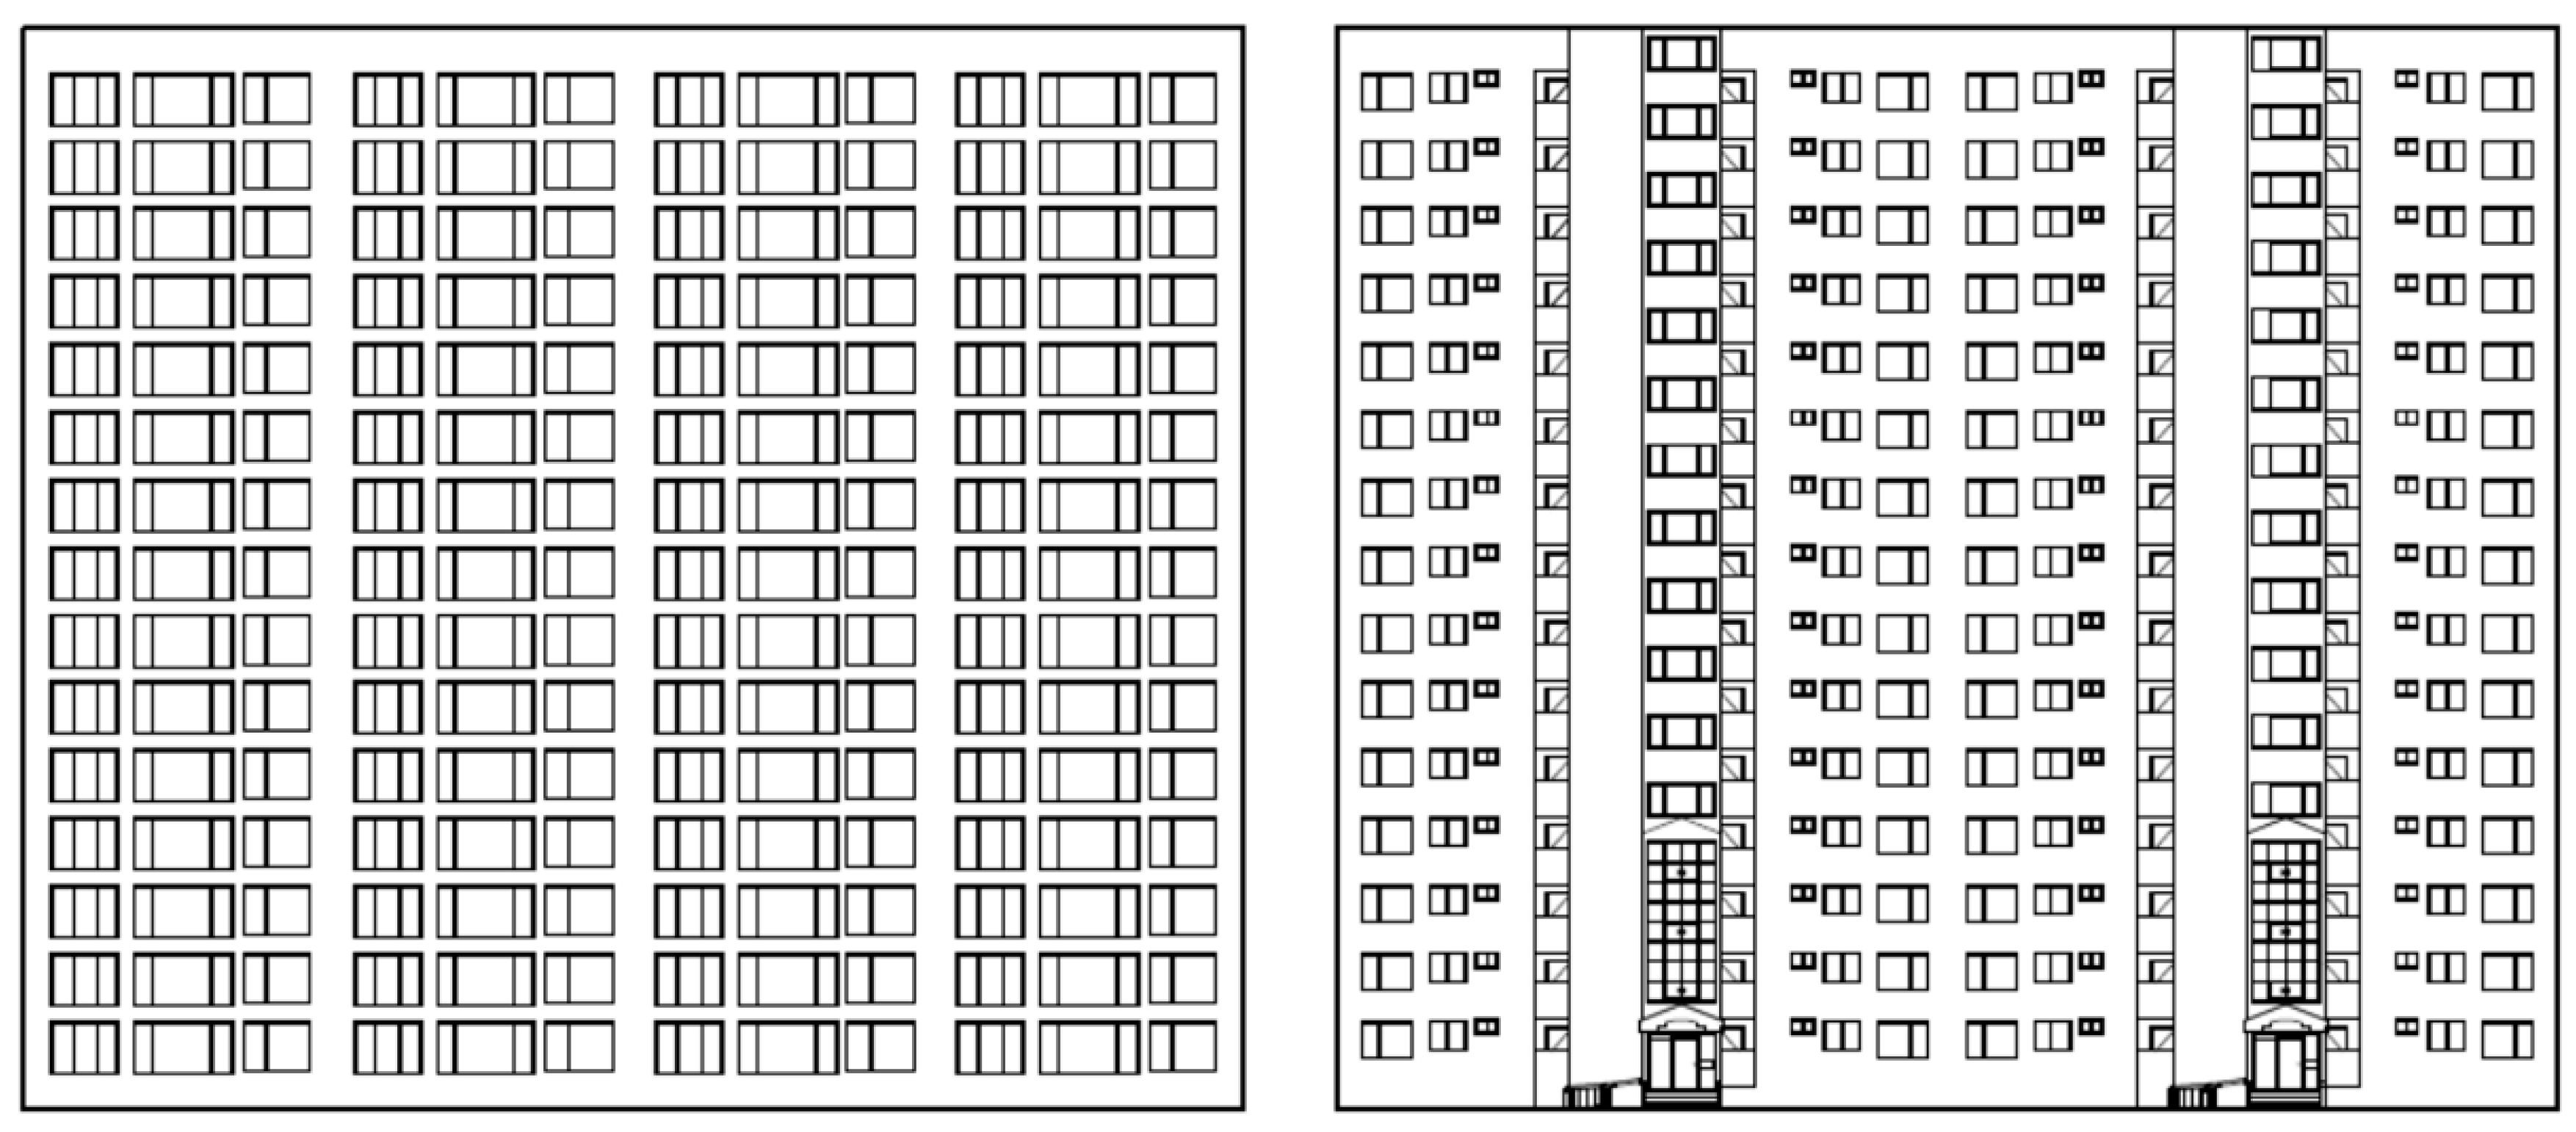
Figure 5.
Total annual cooling energy demand for a standard apartment building.
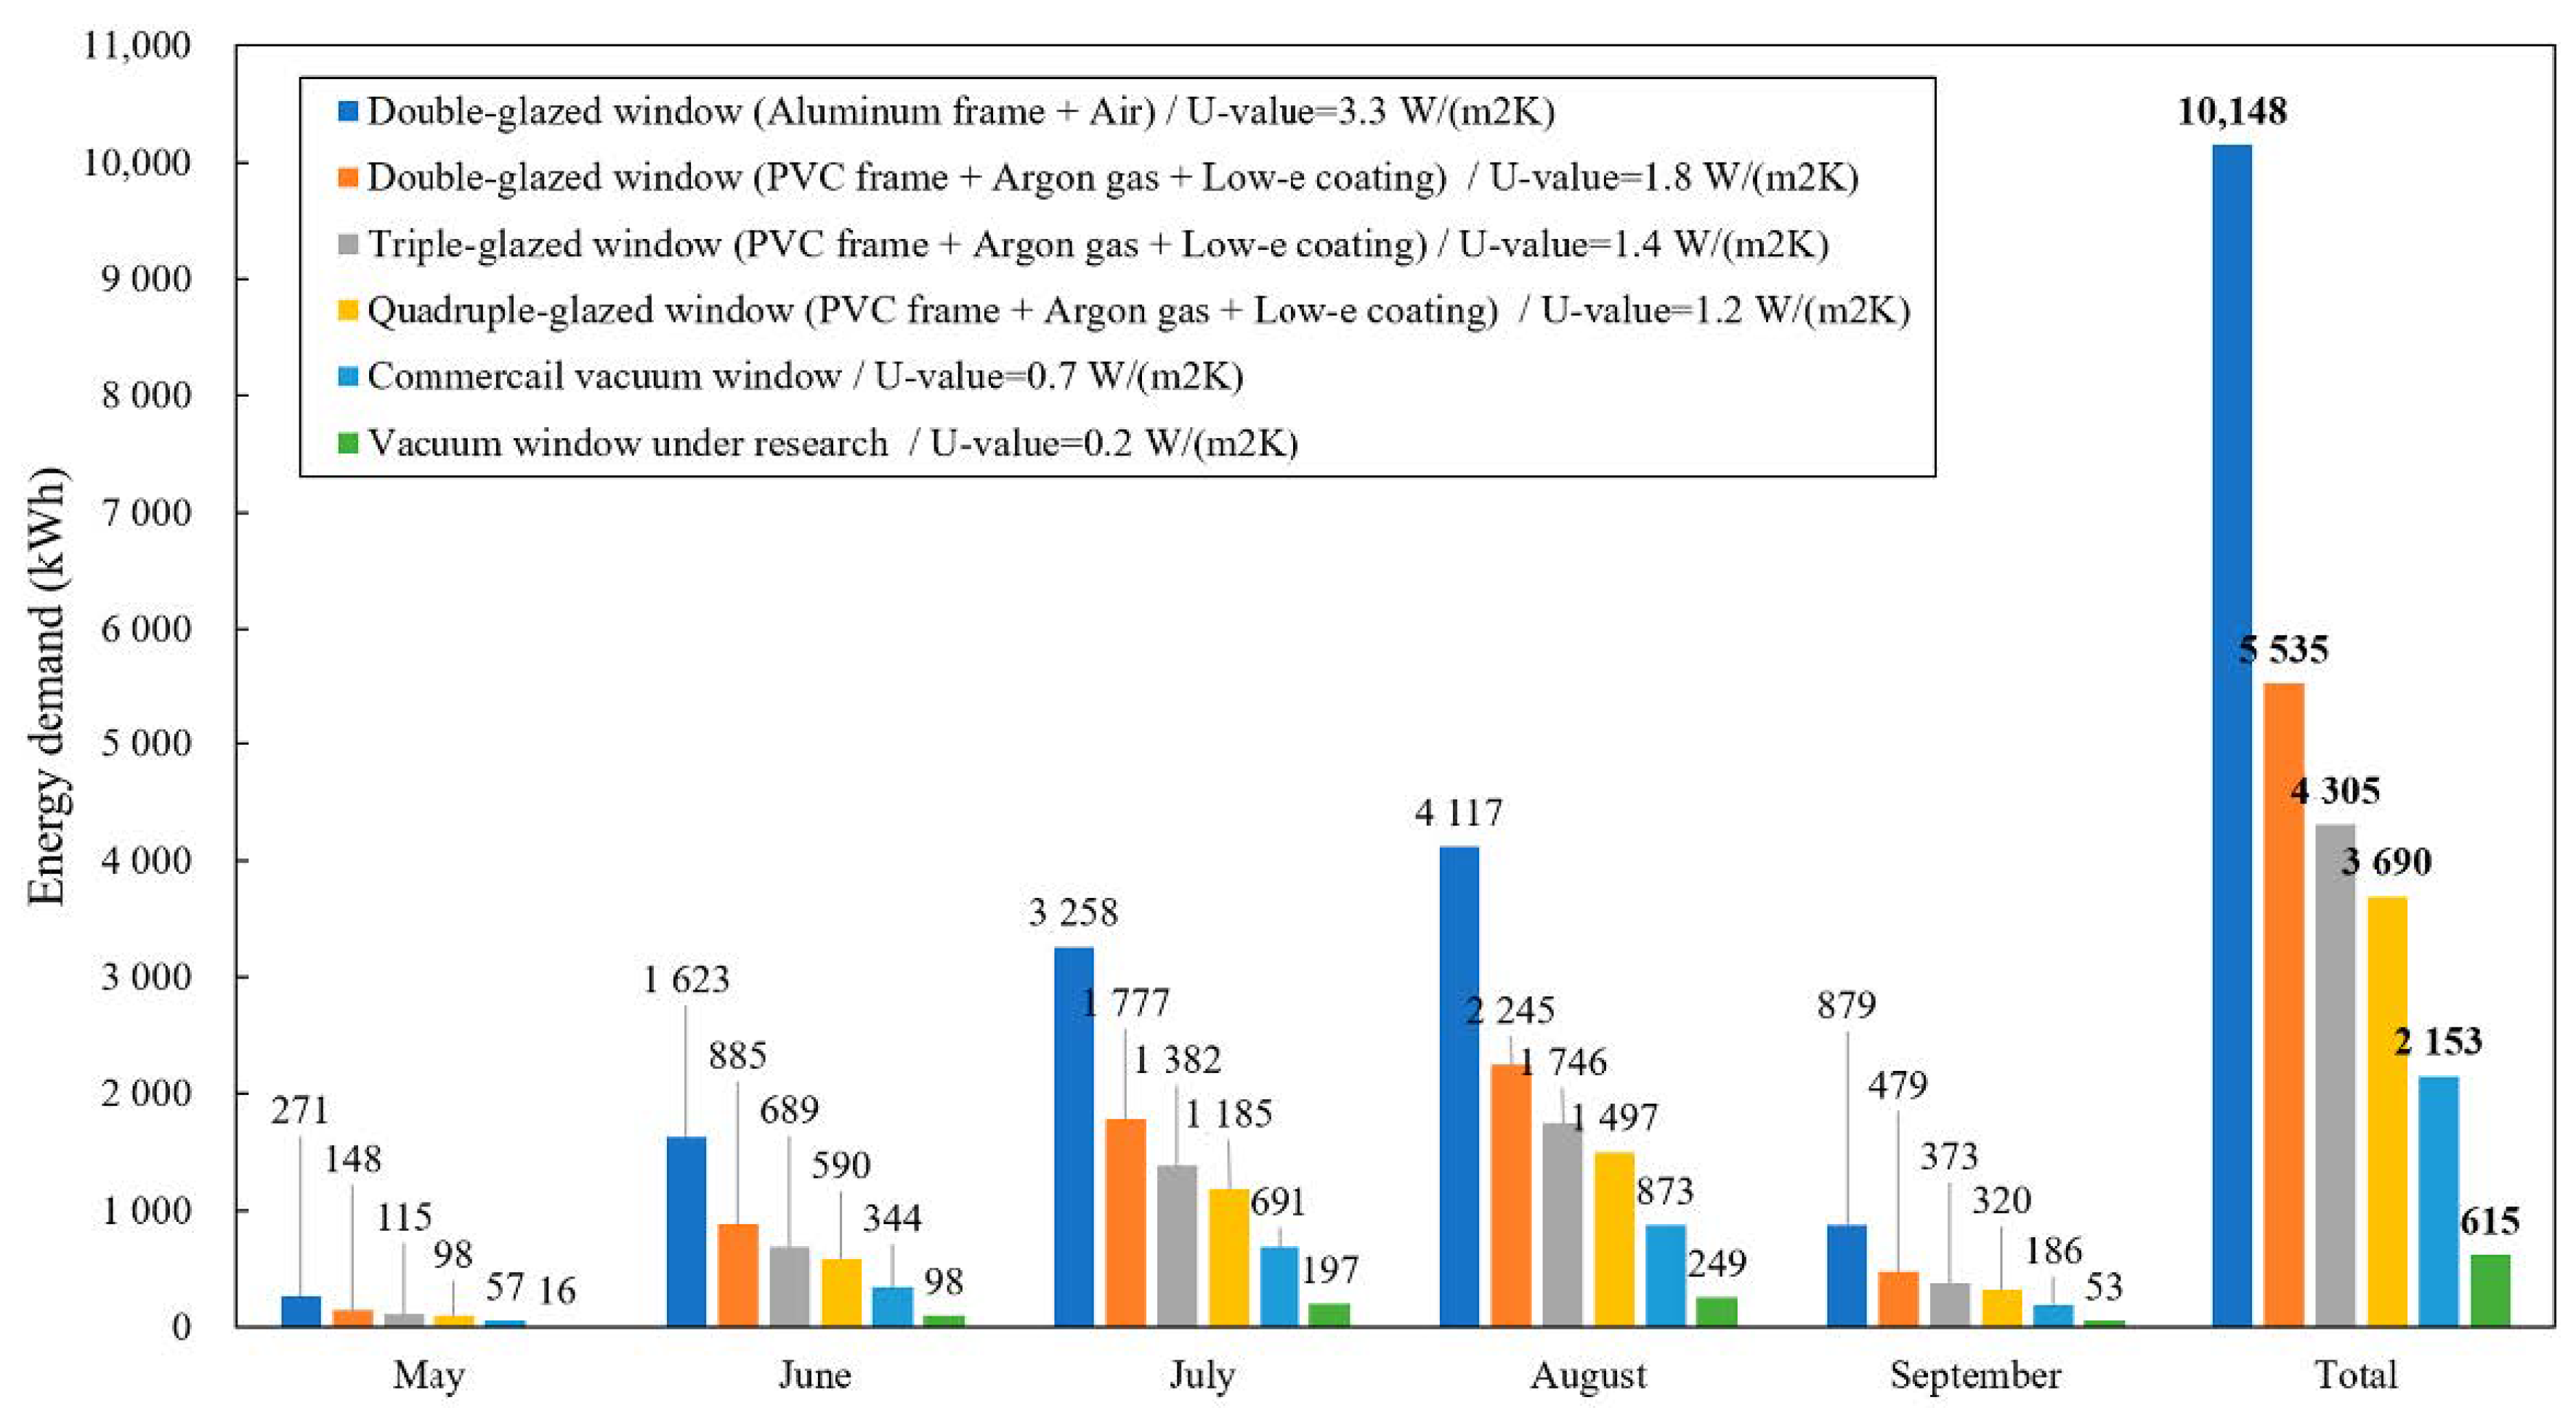
Figure 6.
Total annual heating energy demand for the standard apartment building.

Figure 7.
Total annual energy demand for a household in the standard apartment building.
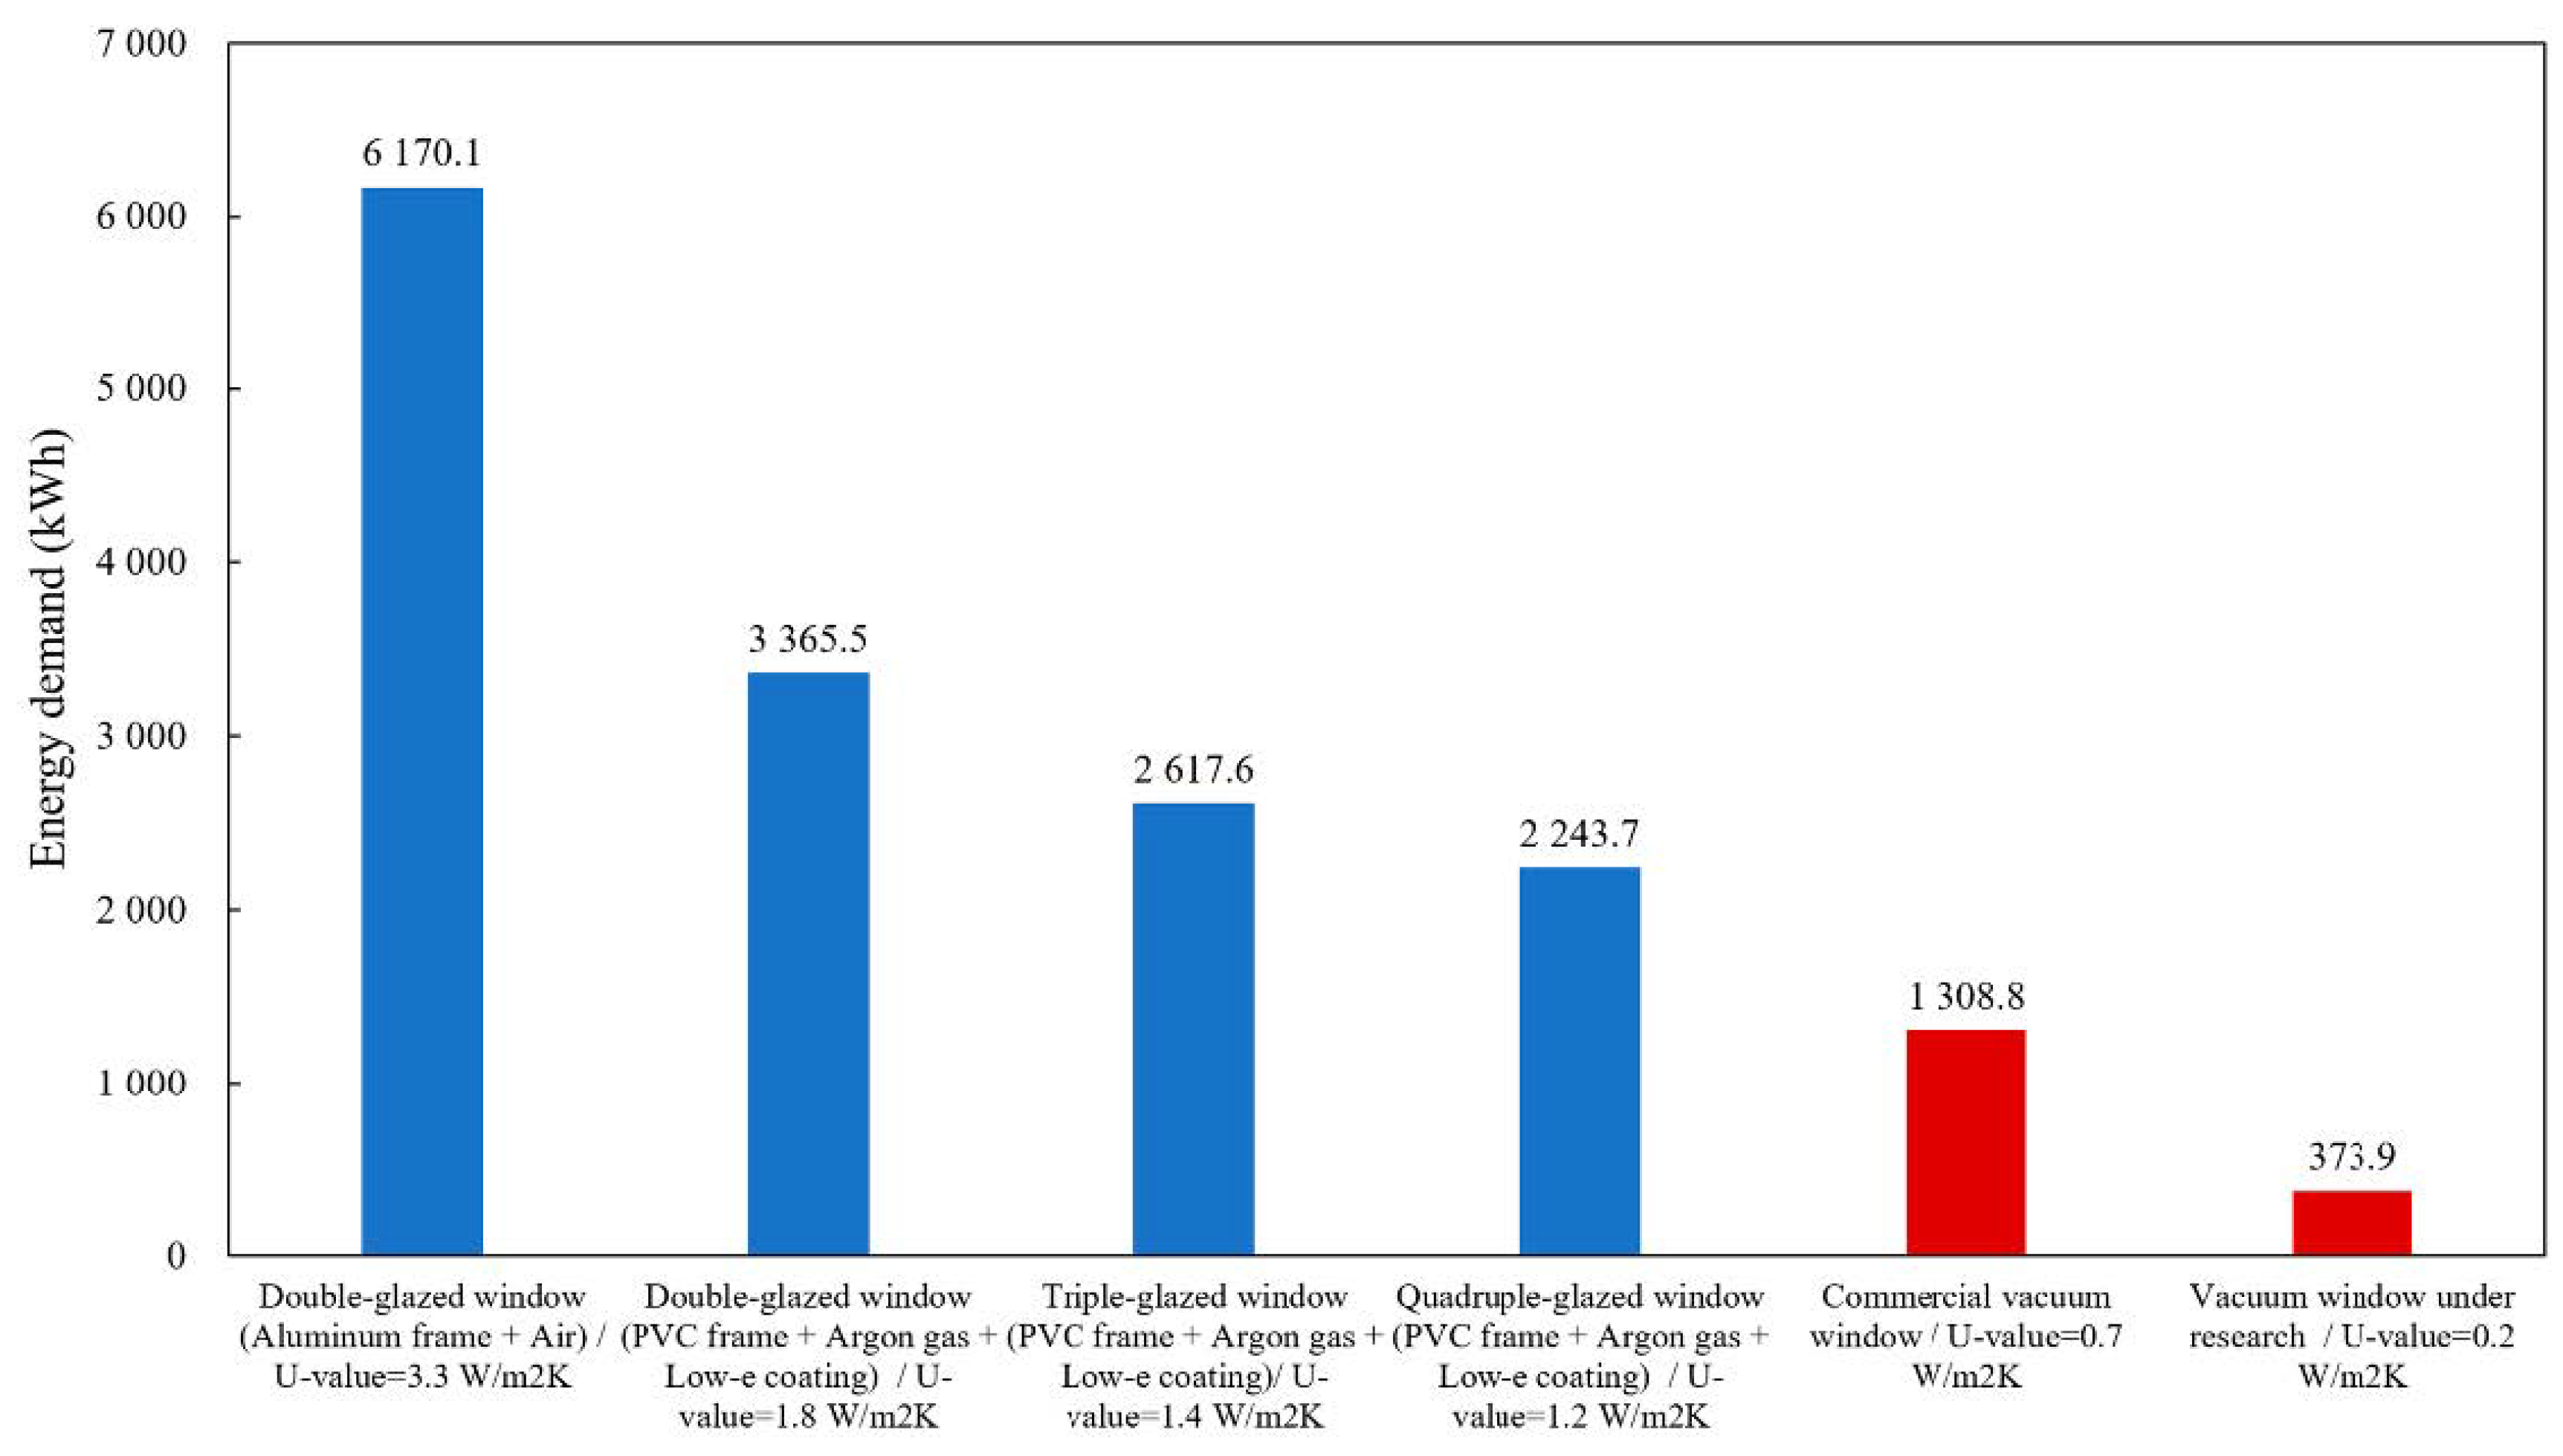
Figure 8.
Total annual GHGEs for a household in the standard apartment building.
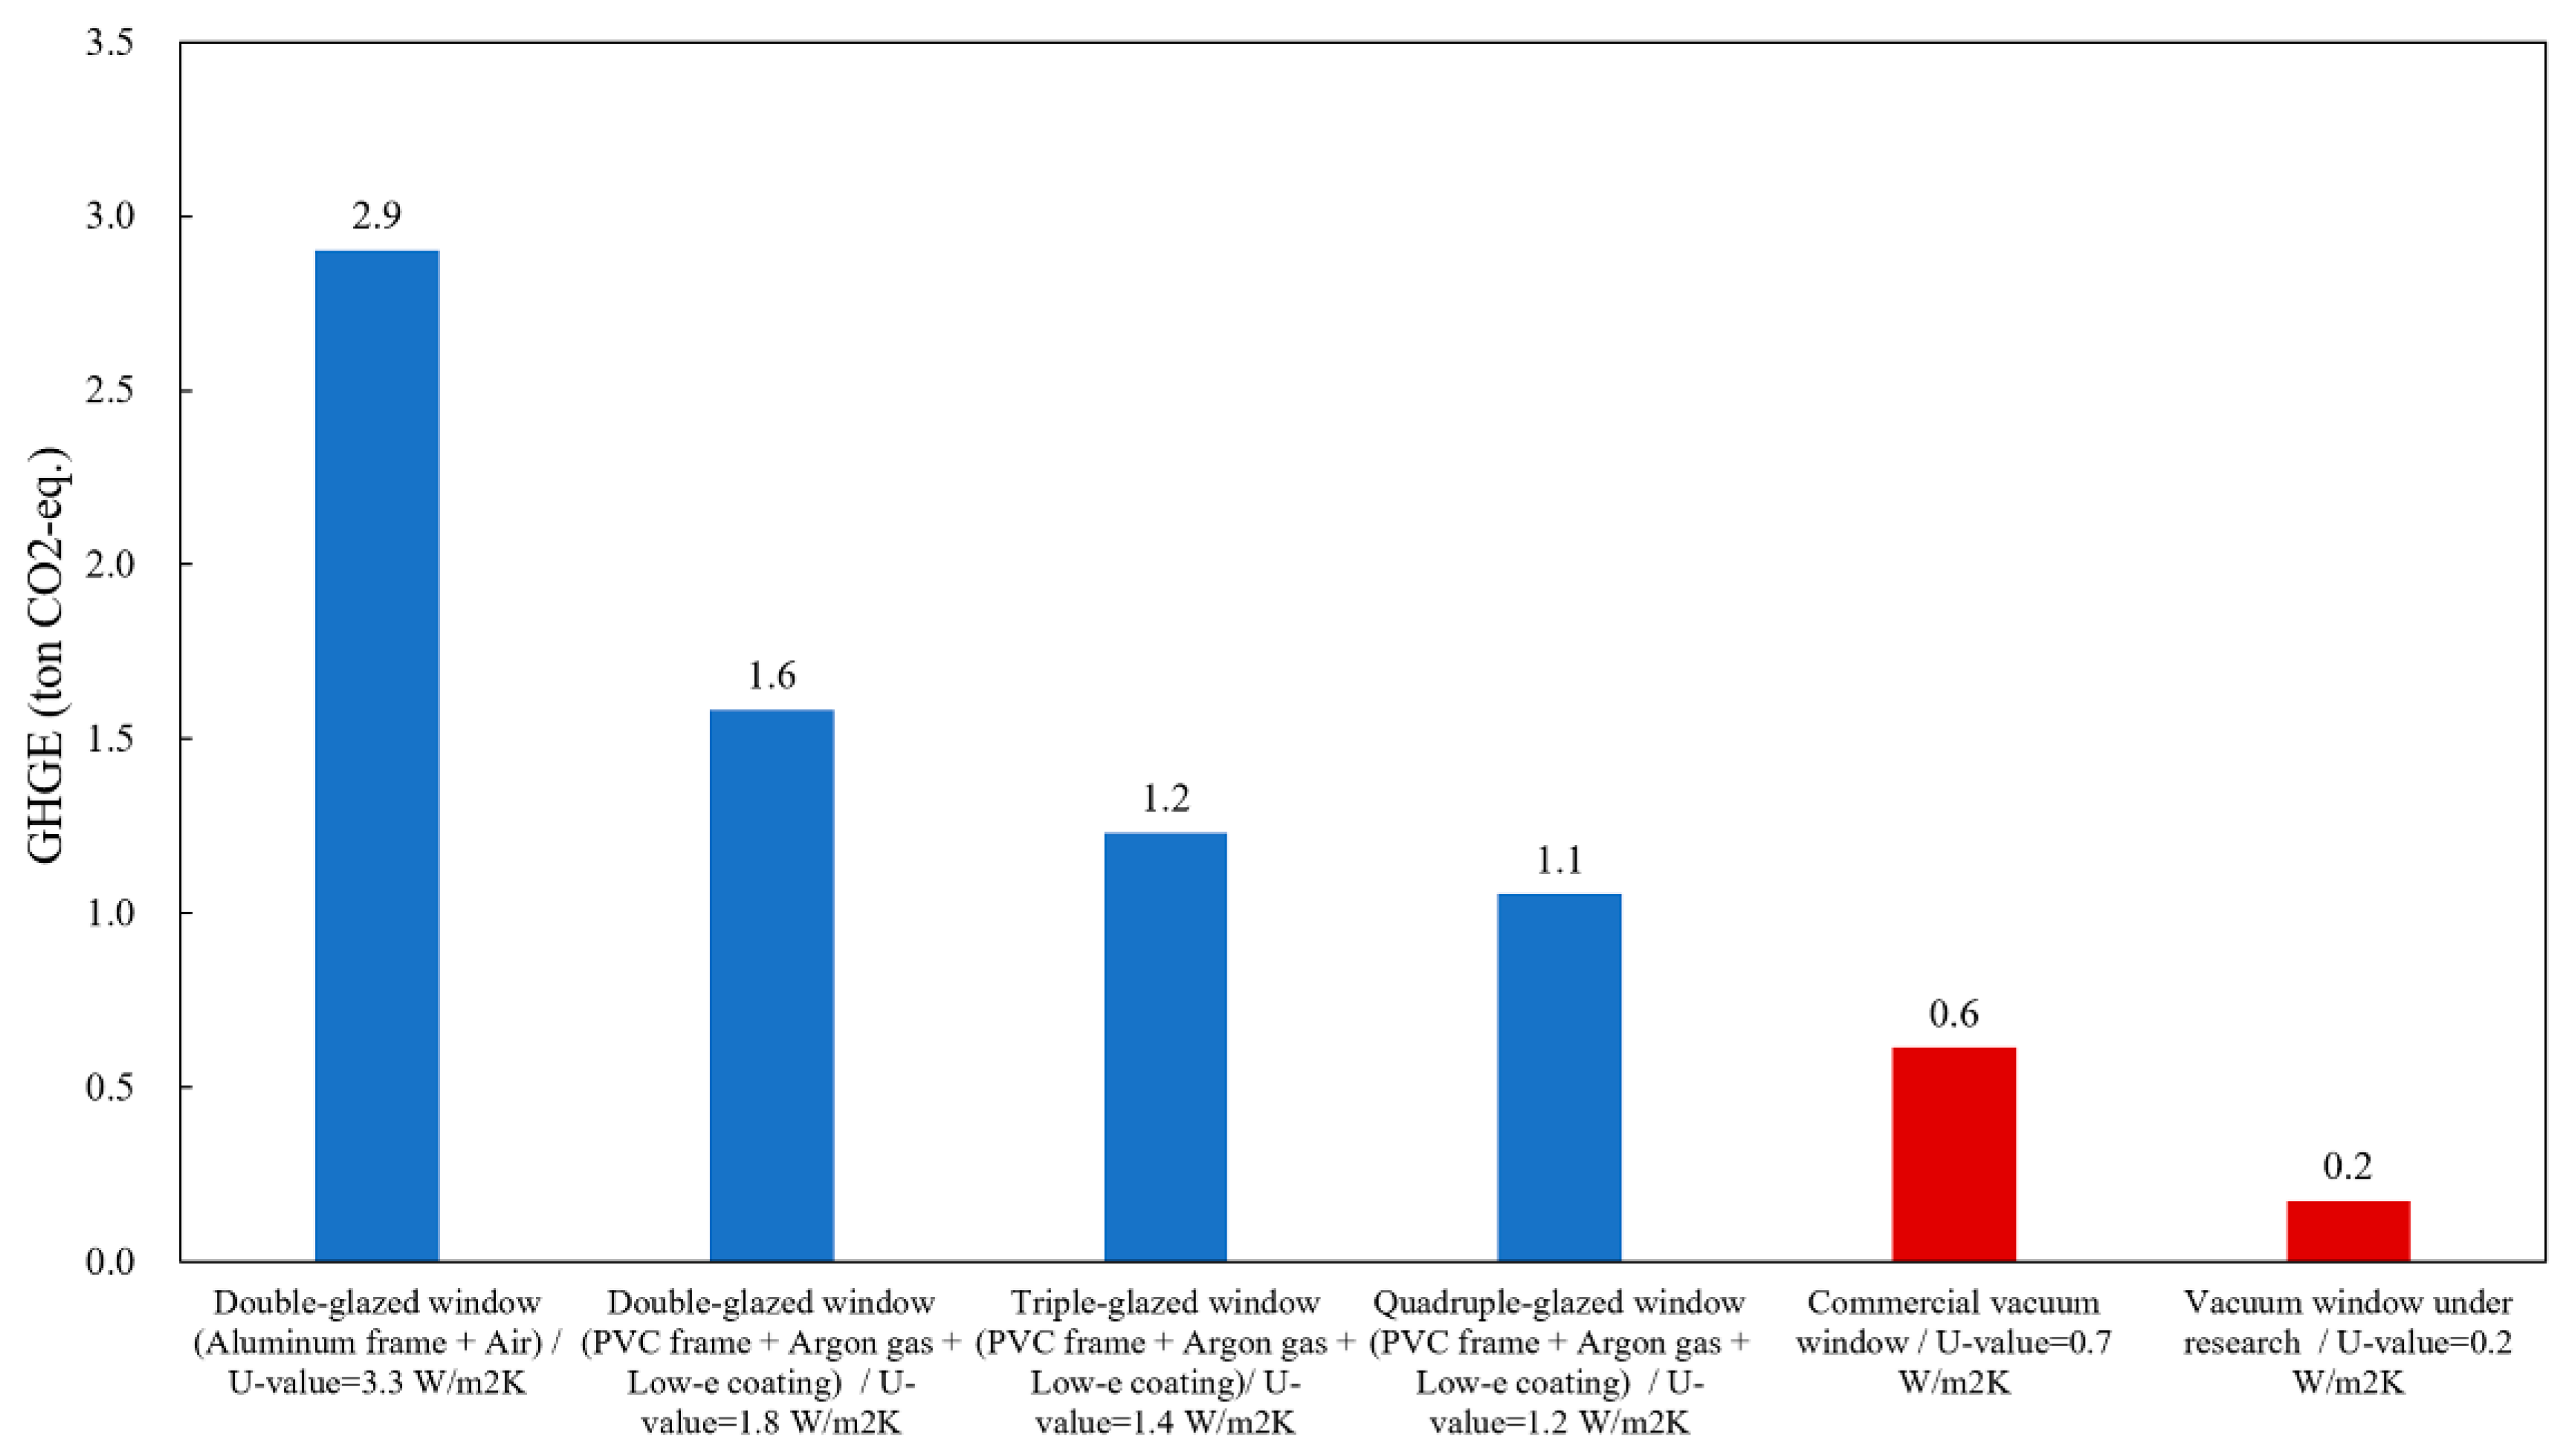
Figure 9.
Total annual GHGEs for apartment buildings in the capital region.

Table 1.
Structure and characteristics of the standard apartment building (excluding public space).
| Structure | Number of Households | Number of Floors | Width (m) | Height (m) | Envelope Area (m2) | Window Area (m2) | Window Ratio (%) |
|---|---|---|---|---|---|---|---|
| Reinforced concrete | 60 | 15 | 41.5 | 46.8 | 3290 | 1316 | 40 |
Table 2.
Structures and U-values of IG and VIG applied to the standard apartment building.
| No. | Window Type | Window Structure | U-Value (W/m2·K) |
|---|---|---|---|
| 1 | Double-glazed window (standard) | Aluminum frame + air | 3.3 |
| 2 | Double-glazed window | PVC frame + argon gas + low-e coating | 1.8 |
| 3 | Triple-glazed window | PVC frame + argon gas + low-e coating | 1.4 |
| 4 | Quadruple-glazed window | PVC frame + argon gas + low-e coating | 1.2 |
| 5 | VIG I | Commercial VIG | 0.7 |
| 6 | VIG II | VIG under research | 0.2 |
Table 3.
Cooling and heating periods calculated by the degree day method.
| Month | Total Days (Days) | Cooling Period (Days) | Non-Cooling and Heating Period (Days) | Heating Period (Days) |
|---|---|---|---|---|
| 1 | 31 | 0 | 0 | 31 |
| 2 | 28 | 0 | 0 | 28 |
| 3 | 31 | 0 | 0 | 31 |
| 4 | 30 | 0 | 3 | 27 |
| 5 | 31 | 6 | 15 | 10 |
| 6 | 30 | 23 | 7 | 0 |
| 7 | 31 | 30 | 1 | 0 |
| 8 | 31 | 31 | 0 | 0 |
| 9 | 30 | 14 | 16 | 0 |
| 10 | 31 | 0 | 6 | 25 |
| 11 | 30 | 0 | 0 | 30 |
| 12 | 31 | 0 | 0 | 31 |
| Total | 365 | 104 | 48 | 213 |
© 2020 by the authors. Licensee MDPI, Basel, Switzerland. This article is an open access article distributed under the terms and conditions of the Creative Commons Attribution (CC BY) license (http://creativecommons.org/licenses/by/4.0/).
Share and Cite
MDPI and ACS Style
Baek, S.; Kim, S. Potential Effects of Vacuum Insulating Glazing Application for Reducing Greenhouse Gas Emission (GHGE) from Apartment Buildings in the Korean Capital Region. Energies 2020, 13, 2828. https://doi.org/10.3390/en13112828
AMA Style
Baek S, Kim S. Potential Effects of Vacuum Insulating Glazing Application for Reducing Greenhouse Gas Emission (GHGE) from Apartment Buildings in the Korean Capital Region. Energies. 2020; 13(11):2828. https://doi.org/10.3390/en13112828
Chicago/Turabian StyleBaek, Sanghoon, and Sangchul Kim. 2020. "Potential Effects of Vacuum Insulating Glazing Application for Reducing Greenhouse Gas Emission (GHGE) from Apartment Buildings in the Korean Capital Region" Energies 13, no. 11: 2828. https://doi.org/10.3390/en13112828
Note that from the first issue of 2016, this journal uses article numbers instead of page numbers. See further details here.