Impact of Electric Vehicle Charging Strategy on the Long-Term Planning of an Isolated Microgrid
by
 , , and
Jean-Michel Clairand
1,* ,
,
Carlos Álvarez-Bel
2 ,
,
Javier Rodríguez-García
2 and
Guillermo Escrivá-Escrivá
2,*
1
Facultad de Ingeniería y Ciencias Aplicadas, Universidad de las Américas—Ecuador, Quito 170122, Ecuador
2
Institute for Energy Engineering, Universitat Politècnica de València, 46022 València, Spain
*
Authors to whom correspondence should be addressed.
Energies 2020, 13(13), 3455; https://doi.org/10.3390/en13133455
Submission received: 17 May 2020
/
Revised: 8 June 2020
/
Accepted: 12 June 2020
/
Published: 3 July 2020
(This article belongs to the Special Issue Integration and Management of Distributed Energy Resources in Power Systems)
Abstract
:Isolated microgrids, such as islands, rely on fossil fuels for electricity generation and include vehicle fleets, which poses significant environmental challenges. To address this, distributed energy resources based on renewable energy and electric vehicles (EVs) have been deployed in several places. However, they present operational and planning concerns. Hence, the aim of this paper is to propose a two-level microgrid problem. The first problem considers an EV charging strategy that minimizes charging costs and maximizes the renewable energy use. The second level evaluates the impact of this charging strategy on the power generation planning of Santa Cruz Island, Galapagos, Ecuador. This planning model is simulated in HOMER Energy. The results demonstrate the economic and environmental benefits of investing in additional photovoltaic (PV) generation and in the EV charging strategy. Investing in PV and smart charging for EVs could reduce the by 13.58%, but a reduction in the of the EV charging strategy would result in up to 3.12%.
1. Introduction
Islands and remote communities face electrical power generation issues due to their geographical location [1,2]. Electrical generation often relies on diesel generators, which create environmental and logistics concerns. Diesel generation generate high greenhouse gas emissions. Moreover, diesel needs to be transported to isolated places, which presents risks such as spills in islands. To address such issues, renewable energy sources (RESs) have been implemented in various places in the world. In particular, several efforts have been performed to integrate RESs in isolated microgrids to mitigate the dependency on fossil fuels [3,4]. However, this integration presents some challenges. RES generation presents significant variations and uncertainties, which leads to instability issues. Thus, several researchers have proposed various control solutions [5,6].
Electric vehicles (EVs) have also been emerging as an efficient solution to mitigate pollution concerns in transportation, especially in isolated regions, where car fuels presents logistics concerns. However, a significant penetration of EVs also leads to grid problems, such as power losses [7], voltage deviations [8], and decrease of power quality [9]. Thus, various strategies have proposed to address those problems, which include minimization of electricity costs [10], the participation in ancillary services [9], peak shaving and valley filling [11]. In particular, some works have considered the integration of EVs in the operation of microgrids [12,13,14,15].
HOMER Pro is a software that provides a robust optimization tool to provide microgrid planning solutions, for both generation and energy storage. It has been developed by Peter Lilienthal in 2009 at NREL. It has already been used by several researchers for microgrid planning studies in various case studies and applications. Some researchers have studied the planning of microgrids, which could be disconnected from the grid. For example, in [16], the planning study of lithium-ion and lead-acid batteries in microgrids was carried out, which allows providing reliable power supply and storing excess power during high demand periods. The results indicate that lithium-ion batteries are a better solution between the two technologies. The authors of [17] performed the techno-economic feasibility study of a microgrid for an academic institution. The authors of [18] performed a techno-economic analysis for various locations for an off-grid renewable hybrid energy system to produce power and hydrogen.
Some other works used HOMER to provide solutions to isolated or rural regions. In these cases, microgrids must be isolated from the main grid or result more beneficial to invest in distributed generation and energy storage instead of transmission and distribution lines. Thus, for example in [19], HOMER was used to demonstrate that renewable-based microgrids have lower net present cost () than diesel-based microgrids in rural areas. The authors of [20] studied a wind-to-hydrogen system for Arctic remote locations compared to diesel systems. In [21], the economic feasibility of microgrids in islanded areas of Egypt are studied considering different fuel options. The authors of [22] demonstrate the feasibility of renewable energy in diesel-based microgrids in the Canadian Arctic. In [23], a hybrid energy microgrid optimization model for a microbank in a remote rural residential area is studied. The PV feasibility in microgrids in Iraq are performed in [24]. The authors of [25] developed a decision-making approach for planning and assessment of hybrid renewable energy-based microgrid with techno-economic optimization in Egypt. In [26], a PV/Stirling battery system planning was performed in Bolivia. The planning study of a remote island in Bangladesh is performed in [27]. The configuration of these microgrids and others are summarized in Table 1.
Although these works and others propose potential solutions for isolated microgrid, only few works have investigated the addition of EV loads in the microgrid planning problem. For example, the authors of [39] studied the design of EV charging stations in a microgrid. In a previous work [38], the optimal power generation planning of Galapagos’ microgrid was performed considering the introduction of EVs and induction stoves. However, the planning considered only uncoordinated charging of the EVs. To the best of the authors’ knowledge, only [40] has considered a charging strategy in the planning problem. However, this paper studied the case of a residential and campus microgrid, whose generation challenges are different from a real islanded microgrid.
Galapagos is a protected Ecuadorian volcanic archipelago, where the people who stay or visit the islands have an adverse effect on their fragile climate due to its scarce resources and eco-system fragility. Therefore, Galapagos is a protected area; in particular due to population growth and tourism, the past Ecuadorian Government has adopted several policies to protect it. This unsustainable model of growth makes it a concern to provide facilities such as electricity [41]. The Ecuadorian government has decided to develop the “Cero Combustibles Fósiles” system to reduce the consumption of fuel in the islands progressively. Thus, in the context of policies for changing the energy matrix, the government of Ecuador installed RES generation in islands, such as solar and wind. In addition, because of the environmental considerations, the Government has considered to replace combustion cars to electric ones, but this substitution does not only include conventional cars, but also buses and motorcycles.
In previous works, a charging strategy for EVs was proposed for the Galapagos Islands [42]. The aim of this work is to study the impact of this strategy in the microgrid planning. The contributions of this paper are highlighted as follows:
- The impact of a charging strategy is studied in the long-term investments of generation and storage of a microgrid.
- A formal planning tool is developed based on real data.
- This study considers different kinds of EVs such as buses and motorcycles, which have different power, and energy characteristics, and users’ different behaviors.
2. Background
Power system planning is defined as a process whose aim is to decide both on new and on the upgrade of existing system elements, in order to adequately meet the expected future loads [43]. In particular, power generation planning of microgrid follows optimal generation configuration and has to meet various constraints and take into consideration uncertainties [44]. The optimal generation configuration includes minimizing both costs and emissions, considering power quality and reliability. Generation and storage considerations affect problem constraints. Isolated microgrids planning is similar to other microgrids, but the connection to a main grid is not possible so distribution considerations are not included. Moreover, reliability issues have to be taken into account. Power generation mix selection and sizing, equipment siting, and generation scheduling are the main problems in long-term planning for microgrids [44].
Various methods and tools exist for microgrid planning. In particular for the power generation and storage planning, HOMER Energy Pro 3.13 is an established tool, which is used for this work [45]. This software allows finding the lowest Net Present Cost for each scenario.
where the capital recovery factor () is defined as the ratio of an annuity:
and:
The total annualized costs is defined as the sum of total discounted costs of capital costs , operations and maintenance , and energy consumption , for year y.
emissions are defined as the sum of emission factors for by the total energy served from each generator:
HOMER allows the determination of microgrid energy resources the technological viability of a microgrid and its life cycle costs [45]. It allows determining different outputs, like and emissions. In that context, the user must define required input data, such as microgrid location, load (e.g., EV load), equipment costs, generation search space, and maintenance costs. Microgrid systems such as photovoltaics, wind turbines, diesel generators and others are considered. Sensitivity analyzes of variables can also be carried out which allow determining their effect on planning outputs. The constraints that should be included are generation limits, new generation capacity, operation and maintenance schedules, useful-life of generation sources and batteries, supply–demand balance and generation adequacy limits, among others.
3. Operation Problem Definition
The planning problem is decomposed into two levels. The first one, which is dedicated to the scheduling of EVs considering microgrid generation constraints. The second one considers the long-term investments in distributed generation and storage. Figure 1 depicts the two-level problem.
3.1. EV Charging Strategy
The methodology is presented in detail in [42,46]. Many protected areas policies have been developed to reduce the emissions, which are linked to both RES and EV penetration growth. But, if there is not a satisfactory RES control device and an intelligent EV charging strategy, the system operator (SO) could have issues. To address this, a smart charging strategy was introduced in [42]. It is assumed that the EV aggregator will manage all the EVs of the isolated microgrid and it will interact with the SO to satisfy grid conditions and reducing user costs. Moreover, the EV charging is considered the responsibility of the EV aggregator, while the management of RES generation will be in charge of the SO.
Since EVs generate a new significant load it is necessary to provide efficient tools to avoid grid issues. When the RES penetration is high, it might be beneficial to charge the EVs with high available RES capacity, which may lead to excess output power when the residential demand (excluding EVs) is too low. It is important that the EVs are not charged when there is insufficient RES and the residential load is high. Thus, an electricity cost for EV users was proposed. If RES power is high, electricity prices for charging EVs will be lower, and if RES power is low, electricity prices will be high to avoid diesel consumption for generation. It should be noted that these electricity prices will be for charging EVs, while residential load (except EVs) must follow its own tariff.
The regular real energy prices should be between a minimum and maximum values, and the average value should be considered according to characteristics of the market conditions of the case study [47].
The proposed daily EV specific electricity cost considers minimum and maximum values, and , which are given by the EV aggregator. The EV proposed specific electricity cost considers a daily mean equal to the mean value given by the Ecuadorean regulator for the residential load.
The difference of the residential load and RES generation is used for the calculation of the EV electricity cost, including PV power and Wind Power , is assumed:
Daily negative values of indicate a RES power excess. If the RES power meets exactly the electric load , will be null. A positive value will indicate that the load demand is not meet due to lack of RES power and it is crucial to provide diesel generation. Thus, the proposed charging mechanism for EV is built based on the trend of during a day. Moreover, the electricity prices have to be positive for the case study. A system of equations need to be solved to consider the trend of considering positive values. This mathematical model has to be solved by the EV aggregator with the forecasted values. The forecasting is believed to be extremely accurate.
Let us consider the vectors of decision variables of cars, motorcycles, and buses: P, P and P, which correspond to the charging power rate.
The sum of the load of all kind of vehicles at interval k defines the total load of EVs:
The energy required to charge all EVs within one day (kWh) is defined:
The sum of all charging costs for every time intervals k in a day defines the EV Daily costs.
Through adjusting the curve size of , the specific cost is achieved and adapting to a new interval, as depicted in Figure 2.
3.2. Optimization Problem for the Charging Strategy
The model maximizes the energy consumption in excess of RES by EVs and minimizes the generation of diesel electricity by charging EVs.
This problem is equivalent in minimizing EV daily costs.
The following constraints are considered:
Constraint (11) refers to the supply–demand balance in the grid, (12) limits the EV charging power rate between 0 to the maximum power, and (13) specifies the energy needed that the EV aggregator has to meet.
The problem is solved by a linear optimization for each EV.
3.3. Electricity Costs
The electricity is supplied by Empresa Eléctrica Provincial Galapagos (Elecgalapagos), which is a local distribution company. There is an integrated vertical electricity sector in Ecuador, and thus no wholesale market for electricity. For each category of consumer there is a tariff that does not relate to the actual cost of generation, distribution and transmission in real time. The electricity cost has been fixed at 9.1 c$/kWh for al customers in Galapagos [47].
3.4. EV Load Modeling
Based on [48], the need was shown for the Galapagos Islands to purchase different kinds of EVs such as typical cars, motorcycles and buses. Their load patterns are modeled differently based on their required energy and the charging power [49].
3.4.1. Number of EVs from Each Kind
For the study, only the types of vehicles that could be replaced by electrics are considered. Based on [42], distances and schedules were studied to obtain the various EV characteristics that are summarized in Table 2. The assumed models were the S-4100 or motorcycle, the BYD K9 for bus, and the Kia Soul EV for car [50,51,52]. In Galapagos, cars and taxis are mostly used for tourism travels, and have rigid schedules, which are considered in the model.
3.4.2. Plug Duration
For each EV i, the plug duration , is assumed to be twice as long as the duration of charging at the maximum charging power . This statement was taken on the basis of EV users’ behavior. In particular, data from travel patterns and the rigid schedules from travel companies were considered [48]:
3.5. Implementation
The duration between EV i is connected to the charging station and the time of departure is defined as . In this case:
The duration in which their EVs are plugged to perform the smart charging is defined as .
In this sense:
HOMER requires an hourly dataset for 365 days in a year, which means 8760 time intervals. Thus, the charging strategy model runs for every respective day, by 24 time intervals per day. This is included as an input for the secondary load.
4. Long-Term Planning Problem
In this section, the long-term planning problem of Santa Cruz and Baltra islands is presented, which is the lower level. Figure 3 illustrates te proposed configuration of the microgrid.
4.1. Residential Load
HOMER allows defining primary and secondary loads as part of the supply–demand balance constraint. The primary load selected is the current residential load and the secondary load is an EV load as explained above.
4.2. Diesel Generation
The Diesel Generation information was included as per [38]. Seven diesel generators from Caterpillar have an installed capacity of 13.77 kWh and a total installation capacity of 5.26 MW at maximum energy output [53]. Four Hyundai diesel generators with a total cost of USD 1.5 million each have been built, and an installed capacity of 1.7 MW each, with a maximum efficiency of 15.5 kWh/gallon [53]. The corresponding models were modeled for HOMER based on available manufacturer data sheets due that they were not available in the HOMER library. The minimum load ratio is assumed to be 25% due to technical constraints [54].
At least one generator is always running to avoid reliability issues. The two Hyundai generator were assumed to have a remaining life of 75,000 and 80,000 h, respectively [42]. Due to a lack of details, the rest of the life of the Caterpillar generators was expected to be 40,000 h. The valve set and repair is carried out every 2500 h, with downtimes being 24 h and major maintenance overhaul every 20,000 h, with downtimes of 72 h [55]. In 2015 the overall cost of service and maintenance for all diesel generators was USD 195,000, with an output of 7.41 MW [55], which can be estimated at 26,316 $/MW per year. Since the microgrid is off-grid, the operating reserves are assumed to be 10% of the diesel generation load, and 25% of the solar output.
4.3. PV and Battery
The next information was included in the HOMER model: capacity, solar profile, costs, lifetime, and ac or dc connection. Real information from solar generation of Galapagos was used.
The PV plant is located near the main town in Santa Cruz Island, Puerto Ayora. The installed PV power is of 1500 kWp. The installation cost of PV in Galapagos is 7067 $/kW, and the operation and maintenance cost of each PV panel is 9.66 $/yr.
Another PV plant in Baltra island is modeled, which has a power capacity of 200 kWp and an battery system of 4300 kWh. It has a dc connection and the total cost was of USD 9,390,000 [58]. The capital cost of PV plant was USD 1,420,000 and the battery system of USD 7,970,000. Since only 80% of the initial capital costs are estimated, the PV replacement costs can be estimated to be 5653 $/kW.
The hourly solar generation profile from HOMER’s solar database, considering the latitude and longitude of Santa Cruz Island (0038 S and 9021 W), was taken as input. Figure 5 depicts the annual average daily radiation and clearness index.
4.4. Wind
In Baltra Island, three U57 wind generators were installed, with a hub height of 68 m connected to the electric network of the island of Santa Cruz, through a 34.5 kV line. The installed capacity of every wind turbine is 750 kW and the total wind power is thus 2.25 MW. The power curve of the wind turbine was modeled on the information of the provider [61], due to the absence of this model in the HOMER libraries.
In accordance with [62] the total deployment costs for all the three turbines and its equipment was 27,655,606 $/yr, and 80% of this value was used as replacement costs. The maintenance cost of an individual turbine was estimated at USD 61,323 [55].
The hourly wind profile of VAISALA Energy [63] was selected as input since the information is reliable. Figure 6 depicts the monthly average wind profile. Thus, in [38], it was shown that it is not profitable to invest in more wind turbines, so just the existing ones are modeled in the planning model.
4.5. New EV Demand
The new secondary load here corresponds to the EV charging strategy simulation over one year. In Figure 7, the calculated EV load for 100% penetration of EVs in Santa Cruz is depicted. Observe that the load presents huge variations that correspond to the fluctuations of wind and sun during the year. Moreover, from Figure 7b, it should be noted that big amounts of time, the power remains in low values, which correspond to hours 18 to 21 where there are few EVs charging.
4.6. Additional Inputs for the Planning
5. Results and Discussion
To evaluate the impact of the charging strategy in the long-term planning of the microgrid, three scenarios of different penetration levels of EVs are studied (25%, 50%, and 100%) for all kinds of the total number of Table 2. For each scenario, three cases are evaluated:
- Case A: No investment is performed (using the existing generation configuraion) and no charging strategy is considered.
- Case B: The optimal power generation planning is solved with uncoordinated charging.
- Case C: The optimal power generation planning is solved with the proposed charging strategy.
Note that in [38], it was shown that the optimal planning results were obtained for increasing the new PV capacity, since new diesel generators, wind turbines, and energy storage, resulted in higher . Thus, only new PV investments were considered.
5.1. Costs and Emissions Comparisons
The results of the optimal generation configuration are presented in Table 3. Note that and emissions are lower for all EV penetration levels in case C. It should be highlighted that emissions only correspond to generation, which means that transportation emissions will be significantly. To obtain the exact amount of reduction in transportation, a driving model should be studied; however, this is not the main purpose of this work.
5.2. Daily Operation
Figure 8 illustrates the daily operation of the different generation systems, considering 100% of EV penetration. It is observed that there is a clear reduction of diesel generation for hours 9 to 15, where the PV generation is high. However, the highest load is observed during night hours, where the diesel generation is at maximum levels. Battery is almost not used by the model, since it results in higher due to its high initial capital cost.
5.3. Sensitivity Analysis: Diesel Costs
In the power generation planning of microgrids, various data input could suffer uncertainties, which could affect the results. In particular, diesel price in the 20-year planning horizon is uncertain, and it could impact on the cost and emission results. To address this uncertainty, a sensitivity analysis of diesel prices was carried out. Based on the results, the diesel prices could grow up to 100%, so an increase of 50% and 100% was considered in the planning horizon. Assuming the same transportation cost of 0.50 $/L (in the end prices), the future diesel prices will be of 2.26 $/L and 2.84 $/L, respectively.
To compare the cases A and C, and B and C, the percentage changes in and were calculated:
Note that no comparison is done between cases A and B, since the goal is to study the impact of the charging strategy in the long-term planning.
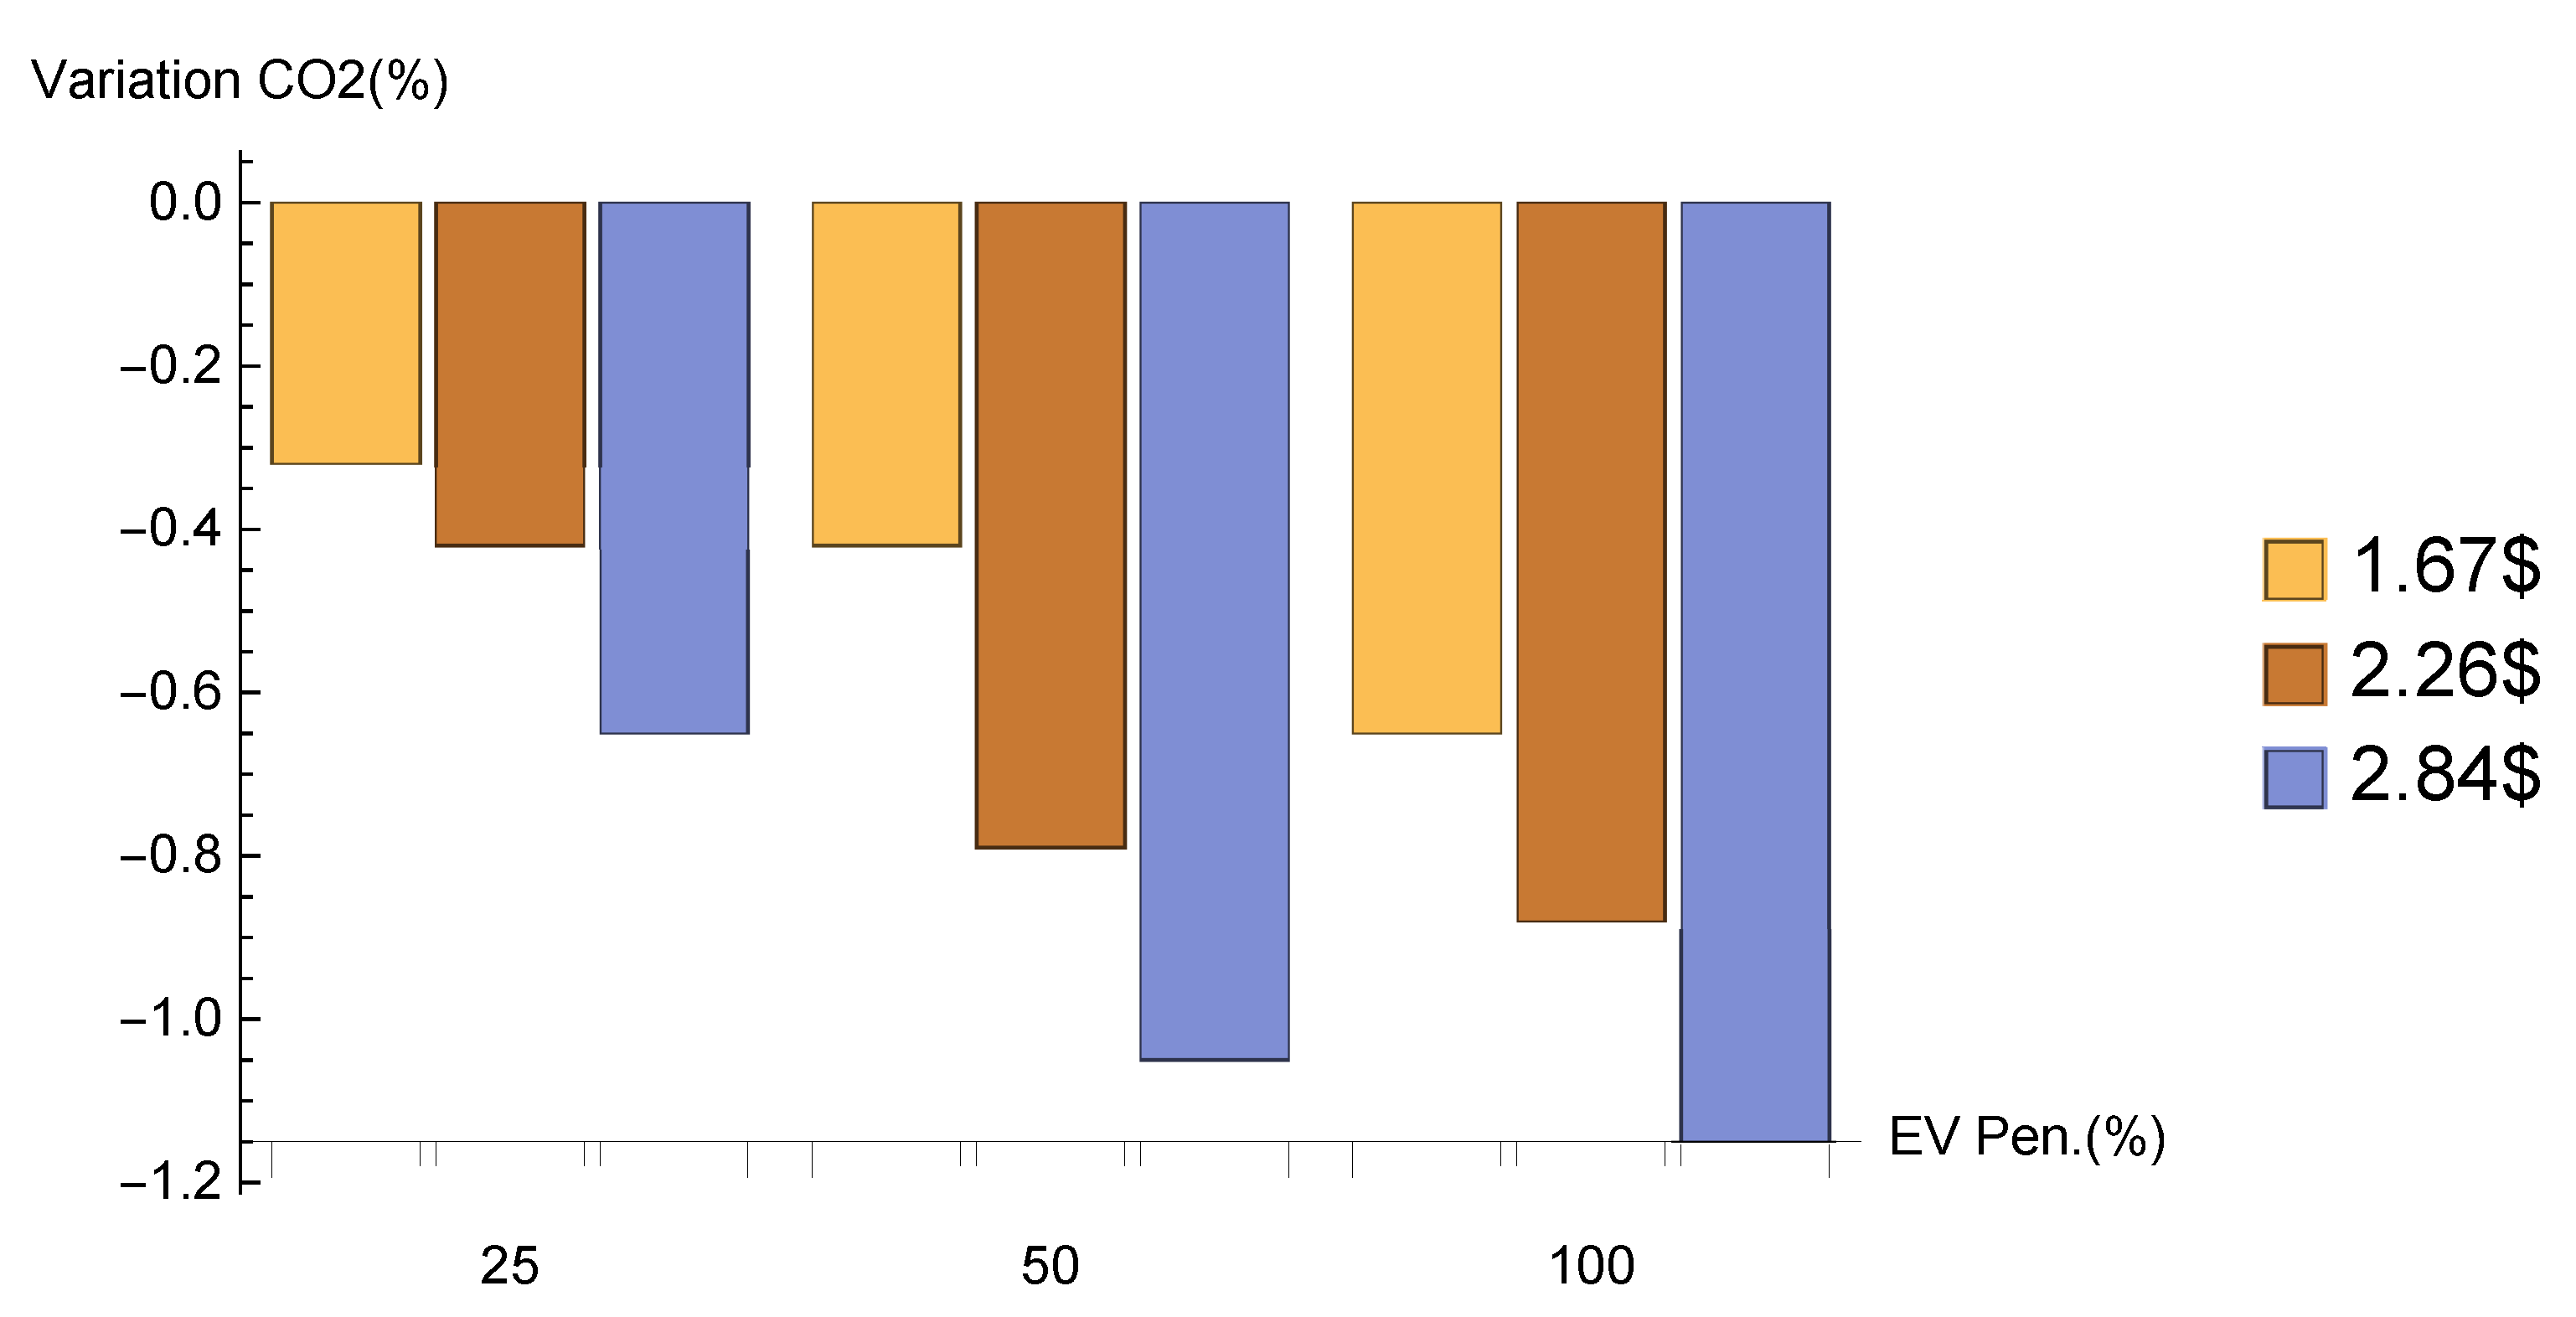
Figure 9 and Figure 10 depict the variations for various EV penetration levels and various diesel prices, between cases A and C, and between cases B and C respectively. Figure 11 and Figure 12 depict the variations for various EV penetration levels and various diesel prices, between cases A and C, and between cases B and C respectively.
Observe that all the changes are negative, which shows that the EV charging strategy, all the and emissions decrease, resulting beneficial for the planners. Moreover, an increase of diesel prices leads to a decrease of and , indicating that it is better to invest in new PV generation and adopting EV charging strategy. However, in Figure 10, there is no relationship observed between an increase of diesel prices in the variation of . All the values are negative, indicating that for all the cases, the charging strategy will result in a lower , especially for 100% EV penetration, and will not be affected by diesel prices in the future. Moreover, the variations of are low between cases B and C (lower than 2% for EV penetrations of 25% and 50%), and reach only 3% for 100% penetration of EVs. In Figure 12, it is observed that an increase of diesel prices leads to a decrease of , which is beneficial for the pristine environment, however the variations are also relatively low.
6. Conclusions
This paper presented a two-stage power generation planning of a microgrid, considering new EV charging loads. In the first stage, a charging strategy that minimizes the use of diesel for electricity generation is described. In the second stage, the impact of this new load is then analyzed in the power generation planning problem of a microgrid. The case study of the Santa Cruz Island in the Galapagos Islands, Ecuador is considered. Moreover, to consider diesel price uncertainties, a sensitivity analysis of various projected prices in the planning period is performed.
The results indicate that investing in new PV generation and adopting EV charging strategies for a new EV fleet will result in lower for the microgrid, especially if the EV penetration is high. However, the benefits in the investments of the EV charging strategy are low compared to the benefits of investing in new PV generation. Investing in PV and in the smart charging for EVs could decrease the by 13.58%, but the decrease of the of the EV charging strategy results in up to 3.12%. Diesel prices would not have a clear impact in the investment costs of both new PV generation and the adoption of the EV charging strategy.
Author Contributions
Conceptualization, J.-M.C.; Data curation, J.-M.C., J.R.-G.; Formal analysis, J.-M.C.; Investigation, J.-M.C.; Methodology, J.-M.C.; Supervision, C.Á.-B., J.R.-G., G.E.-E.; Validation, C.Á.-B., J.R.-G., G.E.-E.; Writing—original draft, J.-M.C.; Writing—review and editing, J.R.-G. All authors have read and agreed to the published version of the manuscript.
Funding
This research received no external funding
Conflicts of Interest
The authors declare no conflict of interest.
Abbreviations
The following abbreviations are used in this manuscript:
| CO | Carbon dioxide |
| EV | Electric Vehicle |
| RES | Renewable Energy Source |
| PV | Photovoltaic |
| SOC | State-of-Charge |
References
- Arriaga, M.; Cañizares, C.A.; Kazerani, M. Renewable Energy Alternatives for Remote Communities in Northern Ontario, Canada. IEEE Trans. Sustain. Energy 2012, 4, 661–670. [Google Scholar] [CrossRef]
- Eras-Almeida, A.A.; Egido-Aguilera, M.A. Hybrid renewable mini-grids on non-interconnected small islands: Review of case studies. Renew. Sustain. Energy Rev. 2019, 116, 109417. [Google Scholar] [CrossRef]
- Mahmud, M.A.P.; Huda, N.; Farjana, S.H.; Lang, C. Techno-Economic Operation and Environmental Life-Cycle Assessment of a Solar PV-Driven Islanded Microgrid. IEEE Access 2019, 7, 111828–111839. [Google Scholar] [CrossRef]
- Huy, P.D.; Ramachandaramurthy, V.K.; Yong, J.Y.; Tan, K.M.; Ekanayake, J.B. Optimal placement, sizing and power factor of distributed generation: A comprehensive study spanning from the planning stage to the operation stage. Energy 2020, 195, 117011. [Google Scholar] [CrossRef]
- Bahaj, A.S.; James, P.A. Electrical Minigrids for Development: Lessons from the Field. Proc. IEEE 2019, 107, 1967–1980. [Google Scholar] [CrossRef] [Green Version]
- Nikmehr, N. Distributed robust operational optimization of networked microgrids embedded interconnected energy hubs. Energy 2020, 199, 117440. [Google Scholar] [CrossRef]
- Clement-Nyns, K.; Haesen, E.; Driesen, J. The impact of Charging plug-in hybrid electric vehicles on a residential distribution grid. IEEE Trans. Power Syst. 2010. [Google Scholar] [CrossRef] [Green Version]
- Wang, G.; Xu, Z.; Wen, F.; Wong, K.P. Traffic-constrained multiobjective planning of electric-vehicle charging stations. IEEE Trans. Power Deliv. 2013, 28, 2363–2372. [Google Scholar] [CrossRef]
- Rezaeimozafar, M.; Eskandari, M.; Amini, M.H.; Moradi, M.H.; Siano, P. A Bi-Layer Multi-Objective Techno-Economical Optimization Model for Optimal Integration of Distributed Energy Resources into Smart/Micro Grids. Energies 2020, 13, 1706. [Google Scholar] [CrossRef] [Green Version]
- Clairand, J.M.; Rodríguez-García, J.; Álvarez-Bel, C. Assessment of Technical and Economic Impacts of EV User Behavior on EV Aggregator Smart Charging. J. Mod. Power Syst. Clean Energy 2020, 8, 356–366. [Google Scholar] [CrossRef]
- Yang, H.; Pan, H.; Luo, F.; Qiu, J.; Deng, Y.; Lai, M.; Dong, Z.Y. Operational Planning of Electric Vehicles for Balancing Wind Power and Load Fluctuations in a Microgrid. IEEE Trans. Sustain. Energy 2017, 8, 592–604. [Google Scholar] [CrossRef]
- Savio, D.A.; Juliet, V.A.; Chokkalingam, B.; Padmanaban, S.; Holm-Nielsen, J.B.; Blaabjerg, F. Photovoltaic integrated hybrid microgrid structured electric vehicle charging station and its energy management approach. Energies 2019, 12, 168. [Google Scholar] [CrossRef] [Green Version]
- Jin, C.; Sheng, X.; Ghosh, P. Optimized Electric Vehicle Charging With Intermittent Renewable Energy Sources Chenrui. IEEE J. Sel. Top. Signal Process. 2014, 8, 1063–1072. [Google Scholar] [CrossRef]
- Honarmand, M.; Zakariazadeh, A.; Jadid, S. Integrated scheduling of renewable generation and electric vehicles parking lot in a smart microgrid. Energy Convers. Manag. 2014, 86, 745–755. [Google Scholar] [CrossRef]
- Zhang, T.; Chen, W.; Han, Z.; Cao, Z.; Member, S.; Han, Z.; Cao, Z.; Member, S. Charging scheduling of electric vehicles with local renewable energy under uncertain electric vehicle arrival and grid power price. IEEE Trans. Veh. Technol. 2014, 63, 2600–2612. [Google Scholar] [CrossRef] [Green Version]
- Dhundhara, S.; Verma, Y.P.; Williams, A. Techno-economic analysis of the lithium-ion and lead-acid battery in microgrid systems. Energy Convers. Manag. 2018, 177, 122–142. [Google Scholar] [CrossRef]
- Kumar, A.; Singh, A.R.; Deng, Y.; He, X.; Kumar, P.; Bansal, R.C. Multiyear load growth based techno-financial evaluation of a microgrid for an academic institution. IEEE Access 2018, 6, 37533–37555. [Google Scholar] [CrossRef]
- Abdin, Z.; Mérida, W. Hybrid energy systems for off-grid power supply and hydrogen production based on renewable energy: A techno-economic analysis. Energy Convers. Manag. 2019, 196, 1068–1079. [Google Scholar] [CrossRef]
- Hafez, O.; Bhattacharya, K. Optimal planning and design of a renewable energy based supply system for microgrids. Renew. Energy 2012, 45, 7–15. [Google Scholar] [CrossRef]
- Chade, D.; Miklis, T.; Dvorak, D. Feasibility study of wind-to-hydrogen system for Arctic remote locations—Grimsey island case study. Renew. Energy 2015, 76, 204–211. [Google Scholar] [CrossRef]
- Abo-Elyousr, F.K.; Elnozahy, A. Bi-objective economic feasibility of hybrid micro-grid systems with multiple fuel options for islanded areas in Egypt. Renew. Energy 2018, 128, 37–56. [Google Scholar] [CrossRef]
- Das, I.; Canizares, C.A. Renewable Energy Integration in Diesel-Based Microgrids at the Canadian Arctic. Proc. IEEE 2019, 107, 1838–1856. [Google Scholar] [CrossRef]
- Ayodele, E.; Misra, S.; Damasevicius, R.; Maskeliunas, R. Hybrid microgrid for microfinance institutions in rural areas—A field demonstration in West Africa. Sustain. Energy Technol. Assess. 2019, 35, 89–97. [Google Scholar] [CrossRef]
- Aziz, A.S.; Tajuddin, M.F.N.; Adzman, M.R.; Mohammed, M.F.; Ramli, M.A. Feasibility analysis of grid-connected and islanded operation of a solar PV microgrid system: A case study of Iraq. Energy 2020, 191. [Google Scholar] [CrossRef]
- Elkadeem, M.R.; Wang, S.; Azmy, A.M.; Atiya, E.G.; Ullah, Z.; Sharshir, S.W. A systematic decision-making approach for planning and assessment of hybrid renewable energy-based microgrid with techno-economic optimization: A case study on an urban community in Egypt. Sustain. Cities Soc. 2020, 54, 102013. [Google Scholar] [CrossRef]
- Zabalaga, P.J.; Cardozo, E.; Campero, L.A.; Ramos, J.A.A. Performance analysis of a stirling engine hybrid power system. Energies 2020, 13, 980. [Google Scholar] [CrossRef] [Green Version]
- Masrur, H.; Or, H.; Howlader, R.; Lotfy, M.E. Analysis of Techno-Economic-Environmental Suitability of an Isolated Microgrid System Located in a Remote Island of Bangladesh. Sustainability 2020, 12, 2880. [Google Scholar] [CrossRef] [Green Version]
- Tuballa, M.L.; Abundo, M.L. Prospects of a solar-diesel-grid energy system for Silliman University, Dumaguete City, Philippines. Int. J. Green Energy 2018, 15, 704–714. [Google Scholar] [CrossRef]
- Adefarati, T.; Obikoya, G.D. Techno-economic evaluation of a grid-connected microgrid system. Int. J. Green Energy 2019, 16, 1497–1517. [Google Scholar] [CrossRef]
- Donado, K.; Navarro, L.; Quintero, M.C.G.; Pardo, M. HYRES: A multi-objective optimization tool for proper configuration of renewable hybrid energy systems. Energies 2019, 13, 26. [Google Scholar] [CrossRef] [Green Version]
- Sco Lombardi, F.; Riva, F.; Sacchi, M.; Colombo, E. Enabling combined access to electricity and clean cooking with PV-microgrids: New evidences from a high-resolution model of cooking loads. Energy Sustain. Dev. 2019, 49, 78–88. [Google Scholar] [CrossRef]
- Fulhu, M.; Mohamed, M.; Krumdieck, S. Voluntary demand participation (VDP) for security of essential energy activities in remote communities with case study in Maldives. Energy Sustain. Dev. 2019, 49, 27–38. [Google Scholar] [CrossRef]
- He, L.; Zhang, S.; Chen, Y.; Ren, L.; Li, J. Techno-economic potential of a renewable energy-based microgrid system for a sustainable large-scale residential community in Beijing, China. Renew. Sustain. Energy Rev. 2018, 93, 631–641. [Google Scholar] [CrossRef]
- Veilleux, G.; Potisat, T.; Pezim, D.; Ribback, C.; Ling, J.; Krysztofiński, A.; Ahmed, A.; Papenheim, J.; Pineda, A.M.; Sembian, S.; et al. Techno-economic analysis of microgrid projects for rural electrification: A systematic approach to the redesign of Koh Jik off-grid case study. Energy Sustain. Dev. 2020, 54, 1–13. [Google Scholar] [CrossRef]
- Nnaji, E.C.; Adgidzi, D.; Dioha, M.O.; Ewim, D.R.; Huan, Z. Modelling and management of smart microgrid for rural electrification in sub-saharan Africa: The case of Nigeria. Electr. J. 2019, 32. [Google Scholar] [CrossRef]
- Markov, K.; Rajaković, N. Multi-energy microgrids with ecotourism purposes: The impact of the power market and the connection line. Energy Convers. Manag. 2019, 196, 1105–1112. [Google Scholar] [CrossRef]
- Sarkar, T.; Bhattacharjee, A.; Samanta, H.; Bhattacharya, K.; Saha, H. Optimal design and implementation of solar PV-wind-biogas-VRFB storage integrated smart hybrid microgrid for ensuring zero loss of power supply probability. Energy Convers. Manag. 2019, 191, 102–118. [Google Scholar] [CrossRef]
- Clairand, J.M.; Arriaga, M.; Cañizares, C.; Alvarez-bel, C. Power Generation Planning of Galapagos Microgrid Considering Electric Vehicles and Induction Stoves. IEEE Trans. Sustain. Energy 2019, 10, 1916–1926. [Google Scholar] [CrossRef]
- Hafez, O.; Bhattacharya, K. Optimal design of electric vehicle charging stations considering various energy resources. Renew. Energy 2017, 107, 576–589. [Google Scholar] [CrossRef]
- Yoon, S.G.; Kang, S.G. Economic microgrid planning algorithm with electric vehicle charging demands. Energies 2017, 10, 1487. [Google Scholar] [CrossRef] [Green Version]
- Eras-Almeida, A.A.; Egido-Aguilera, M.A.; Blechinger, P.; Berendes, S.; Caamaño, E.; García-Alcalde, E. Decarbonizing the Galapagos Islands: Techno-Economic Perspectives for the Hybrid Renewable Mini-Grid Baltra–Santa Cruz. Sustainability 2020, 12, 2282. [Google Scholar] [CrossRef] [Green Version]
- Clairand, J.M.; Rodríguez-García, J.; Álvarez-Bel, C. Electric Vehicle Charging Strategy for Isolated Systems with High Penetration of Renewable Generation. Energies 2018, 11, 3188. [Google Scholar] [CrossRef] [Green Version]
- Seifi, H.; Sepasian, M.S. Power System Planning, Basic Principles. In Electric Power System Planning; Springer: Berlin, Germany, 2011; pp. 1–14. [Google Scholar]
- Gamarra, C.; Guerrero, J.M. Computational optimization techniques applied to microgrids planning: A review. Renew. Sustain. Energy Rev. 2015, 48, 413–424. [Google Scholar] [CrossRef] [Green Version]
- Homer Energy. HOMER Software. 2018. Available online: https://www.homerenergy.com/ (accessed on 15 June 2020).
- Clairand Gómez, J.M. New Strategies for the Massive Introduction of Electric Vehicles in the Operation and Planning of Smart Power Systems. Ph.D. Thesis, Universitat Poltècnica de València, València, Spain, 2018. [Google Scholar] [CrossRef]
- ARCONEL. Pliego Tarifario Para Las Empresas Eléctricas. Technical Report. 2016. Available online: https://www.cnelep.gob.ec/wp-content/uploads/2016/11/Pliego-Tarifarios-2016-Actualizado.pdf (accessed on 15 June 2020).
- Álvarez-Bel, C.; Pesantez-Sarmiento, P.; Rodriguez García, J.; Alcázar-Ortega, M.; Carbonell Carretero, J.; Erazo-Almeida, P.; Morales Jadan, D.X.; Escrivá-Escrivá, G.; Carrillo-Díaz, A.; Piette, M.A.; et al. Análisis Para la Implementación de Redes Inteligentes en Ecuador—Metodología de Previsión de la Demanda Basada en Redes Inteligentes; Editorial Institucional UPV: Valencia, Spain, 2016; p. 287. [Google Scholar]
- Khayatian, A.; Barati, M.; Lim, G. Integrated Microgrid Expansion Planning in Electricity Market with Uncertainty. IEEE Trans. Power Syst. 2017, 70803, 1–9. [Google Scholar] [CrossRef]
- Zelectricvehicle. Z Electric Vehicle: The Performance and Value Leader in Electric Vehicles. 2018. Available online: https://zelectricvehicle.in/ (accessed on 15 June 2020).
- BYD. K9 Electric Transit Bus. 2018. Available online: https://en.byd.com/wp-content/uploads/2019/07/4504-byd-transit-cut-sheets_k9-40_lr.pdf (accessed on 15 June 2020).
- Kia. Kia Soul EV. 2018. Available online: https://www.kia.com/worldwide/vehicles/e-soul.do (accessed on 15 June 2020).
- Paz, C.; Anazco, D. Iluminando al Patrimonio Natural de la Humanidad. Technical Report. 2015. Available online: http://www.elecgalapagos.com.ec/pdf2015/M09/Revistainstitucional.pdf (accessed on 15 June 2020).
- Vintimilla, L.C. Proyecto Eólico San Cristóbal Galápagos—Ecuador. Technical Report. 2013. Available online: https://www.slideserve.com/peggy/proyecto-e-lico-san-crist-bal-islas-gal-pagos (accessed on 15 June 2020).
- Elecgalapagos. Plan de Trabajo Anual—POA 2015. Technical Report. 2015. Available online: http://www.elecgalapagos.com.ec/pdf2015/KO7/PlanOperativoAnual-POA.pdf (accessed on 15 June 2020).
- Sierra, J.C. Estimating road transport fuel consumption in Ecuador. Energy Policy 2016, 92, 359–368. [Google Scholar] [CrossRef]
- Ministerio de Transporte y Obras Publicas. Registro Oficial. Technical Report 386. 2013. Available online: http://www.obraspublicas.gob.ec/wp-content/uploads/downloads/2012/09/SPTMF_resol_carga_gye-galapagos.pdf (accessed on 15 June 2020).
- Elecgalapagos. Proyectos. Available online: http://www.elecgalapagos.com.ec/proyectos (accessed on 15 June 2020).
- Consejo de Gobierno del Regimen Especial de Galapagos. Plan Galapagos. Technical Report. Available online: http://extwprlegs1.fao.org/docs/pdf/ecu166016.pdf (accessed on 15 June 2020).
- Secretaria de Planificacion. Ficha Informativa de Proyecto 2016 Proyecto Fotovoltaico en la Isla Baltra—Archipiélago de Galápagos. Líder. Technical Report. 2016. Available online: http://euroclimaplus.org/intranet/_documentos/repositorio/01Bienal%20ONUCambio%20Clim%C3%A1tico_2016Ecuador.pdf (accessed on 15 June 2020).
- The Wind Power. U57. Available online: https://www.thewindpower.net/turbine_media_en_460_unison_u57.php (accessed on 15 June 2020).
- Vélez-Vega, V.; Cedeño-Gómez, M.; Almeida-Chinga, O. Energía Verde para Galápagos; PROGRAMA LAS Nac. UNIDAS PARA EL Desarro, 2016; p. 10. Available online: http://www.ec.undp.org/content/dam/ecuador/docs/documentosproyectosambiente/pnud_ecREVISTAENERGIAVERDEPARAGALAPAGOS-ilovepdf-compressed.pdf (accessed on 15 June 2020).
- VAISALA. Supporting the Energy Revolution. Available online: https://www.vaisala.com/en/industries-innovation/renewable (accessed on 15 June 2020).
- ARCONEL; MEER. Aspectos de sustentabilidad y sostenibilidad social y ambiental. Plan Maest. Electrif. 2013, 53, 1689–1699. Available online: http://www.regulacionelectrica.gob.ec/wp-content/uploads/downloads/2015/12/Vol4-Aspectos-de-sustentabilidad-y-sostenibilidad-social-y-ambiental.pdf (accessed on 15 June 2020).
- CONELEC (Consejo Nacional de Eléctricidad). Perspectiva y Expansión del Sistema Eléctrico Ecuatoriano, Technical Report. Available online: http://www.regulacionelectrica.gob.ec/plan-maestro-de-electrificacion-2013-2022/ (accessed on 15 June 2020).
Figure 1.
Proposed microgrid planning scheme.
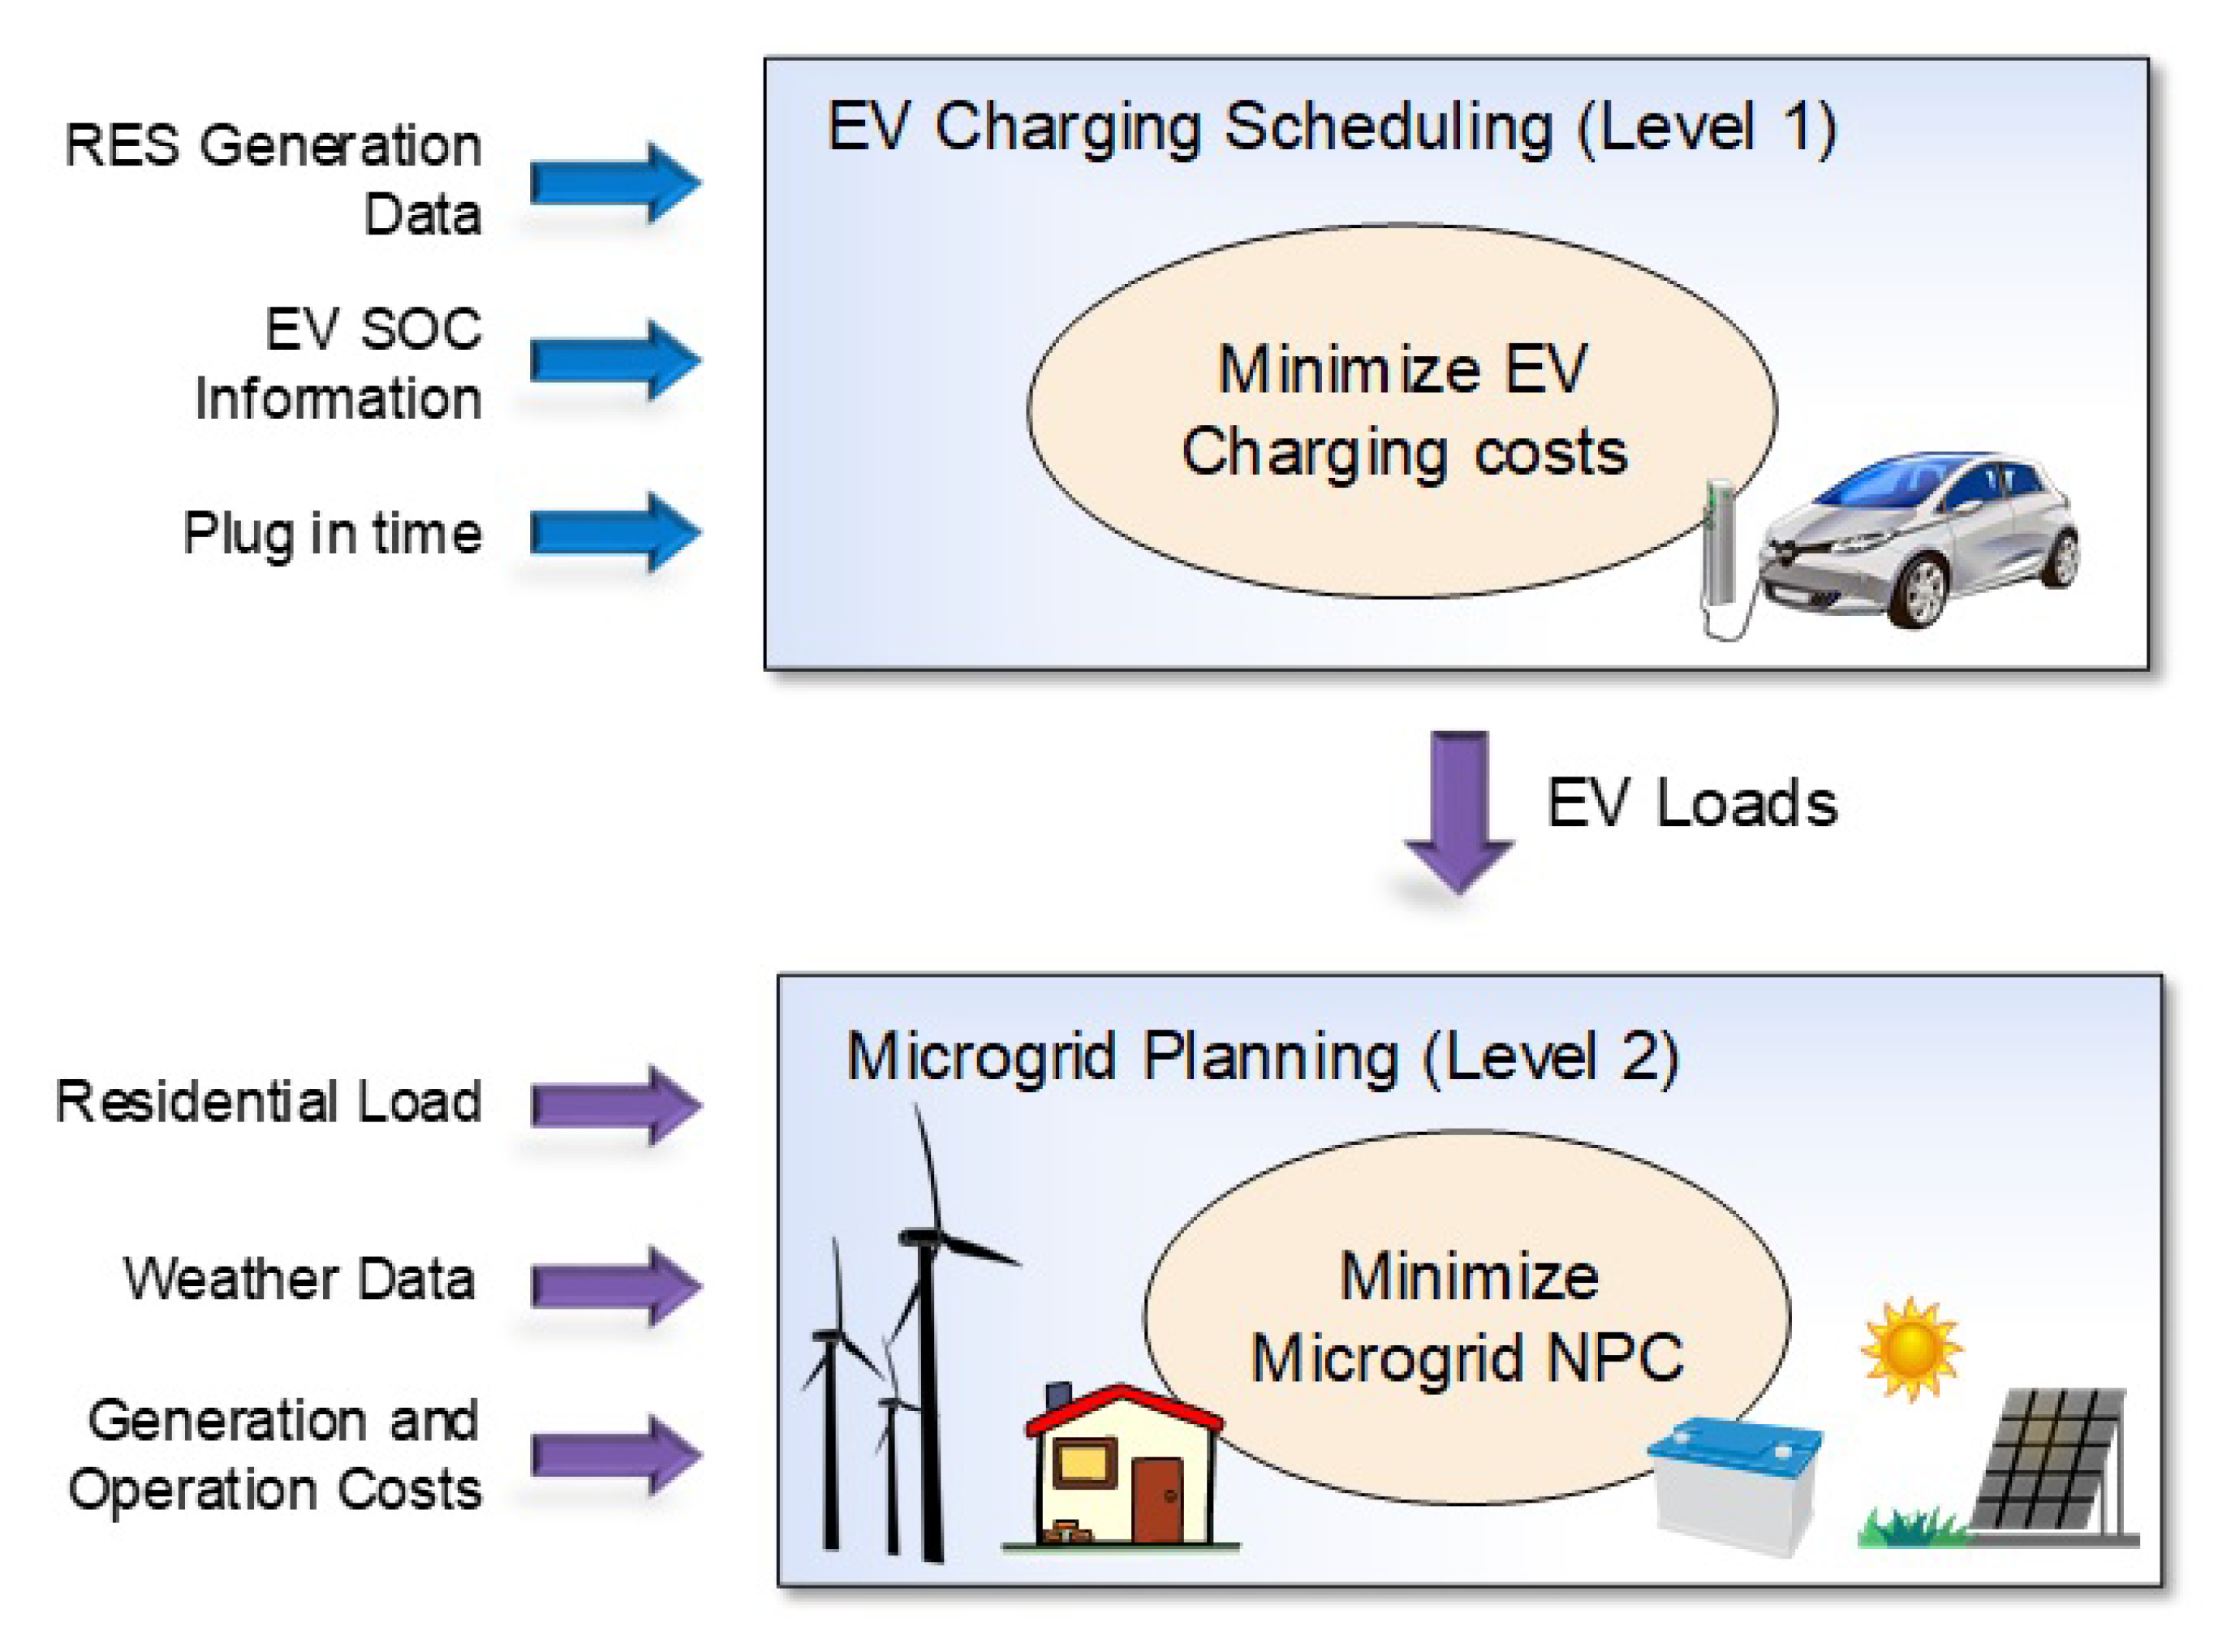
Figure 2.
Residential load and RES power difference (up), and EV charging specific cost (bottom) [42].
Figure 2.
Residential load and RES power difference (up), and EV charging specific cost (bottom) [42].
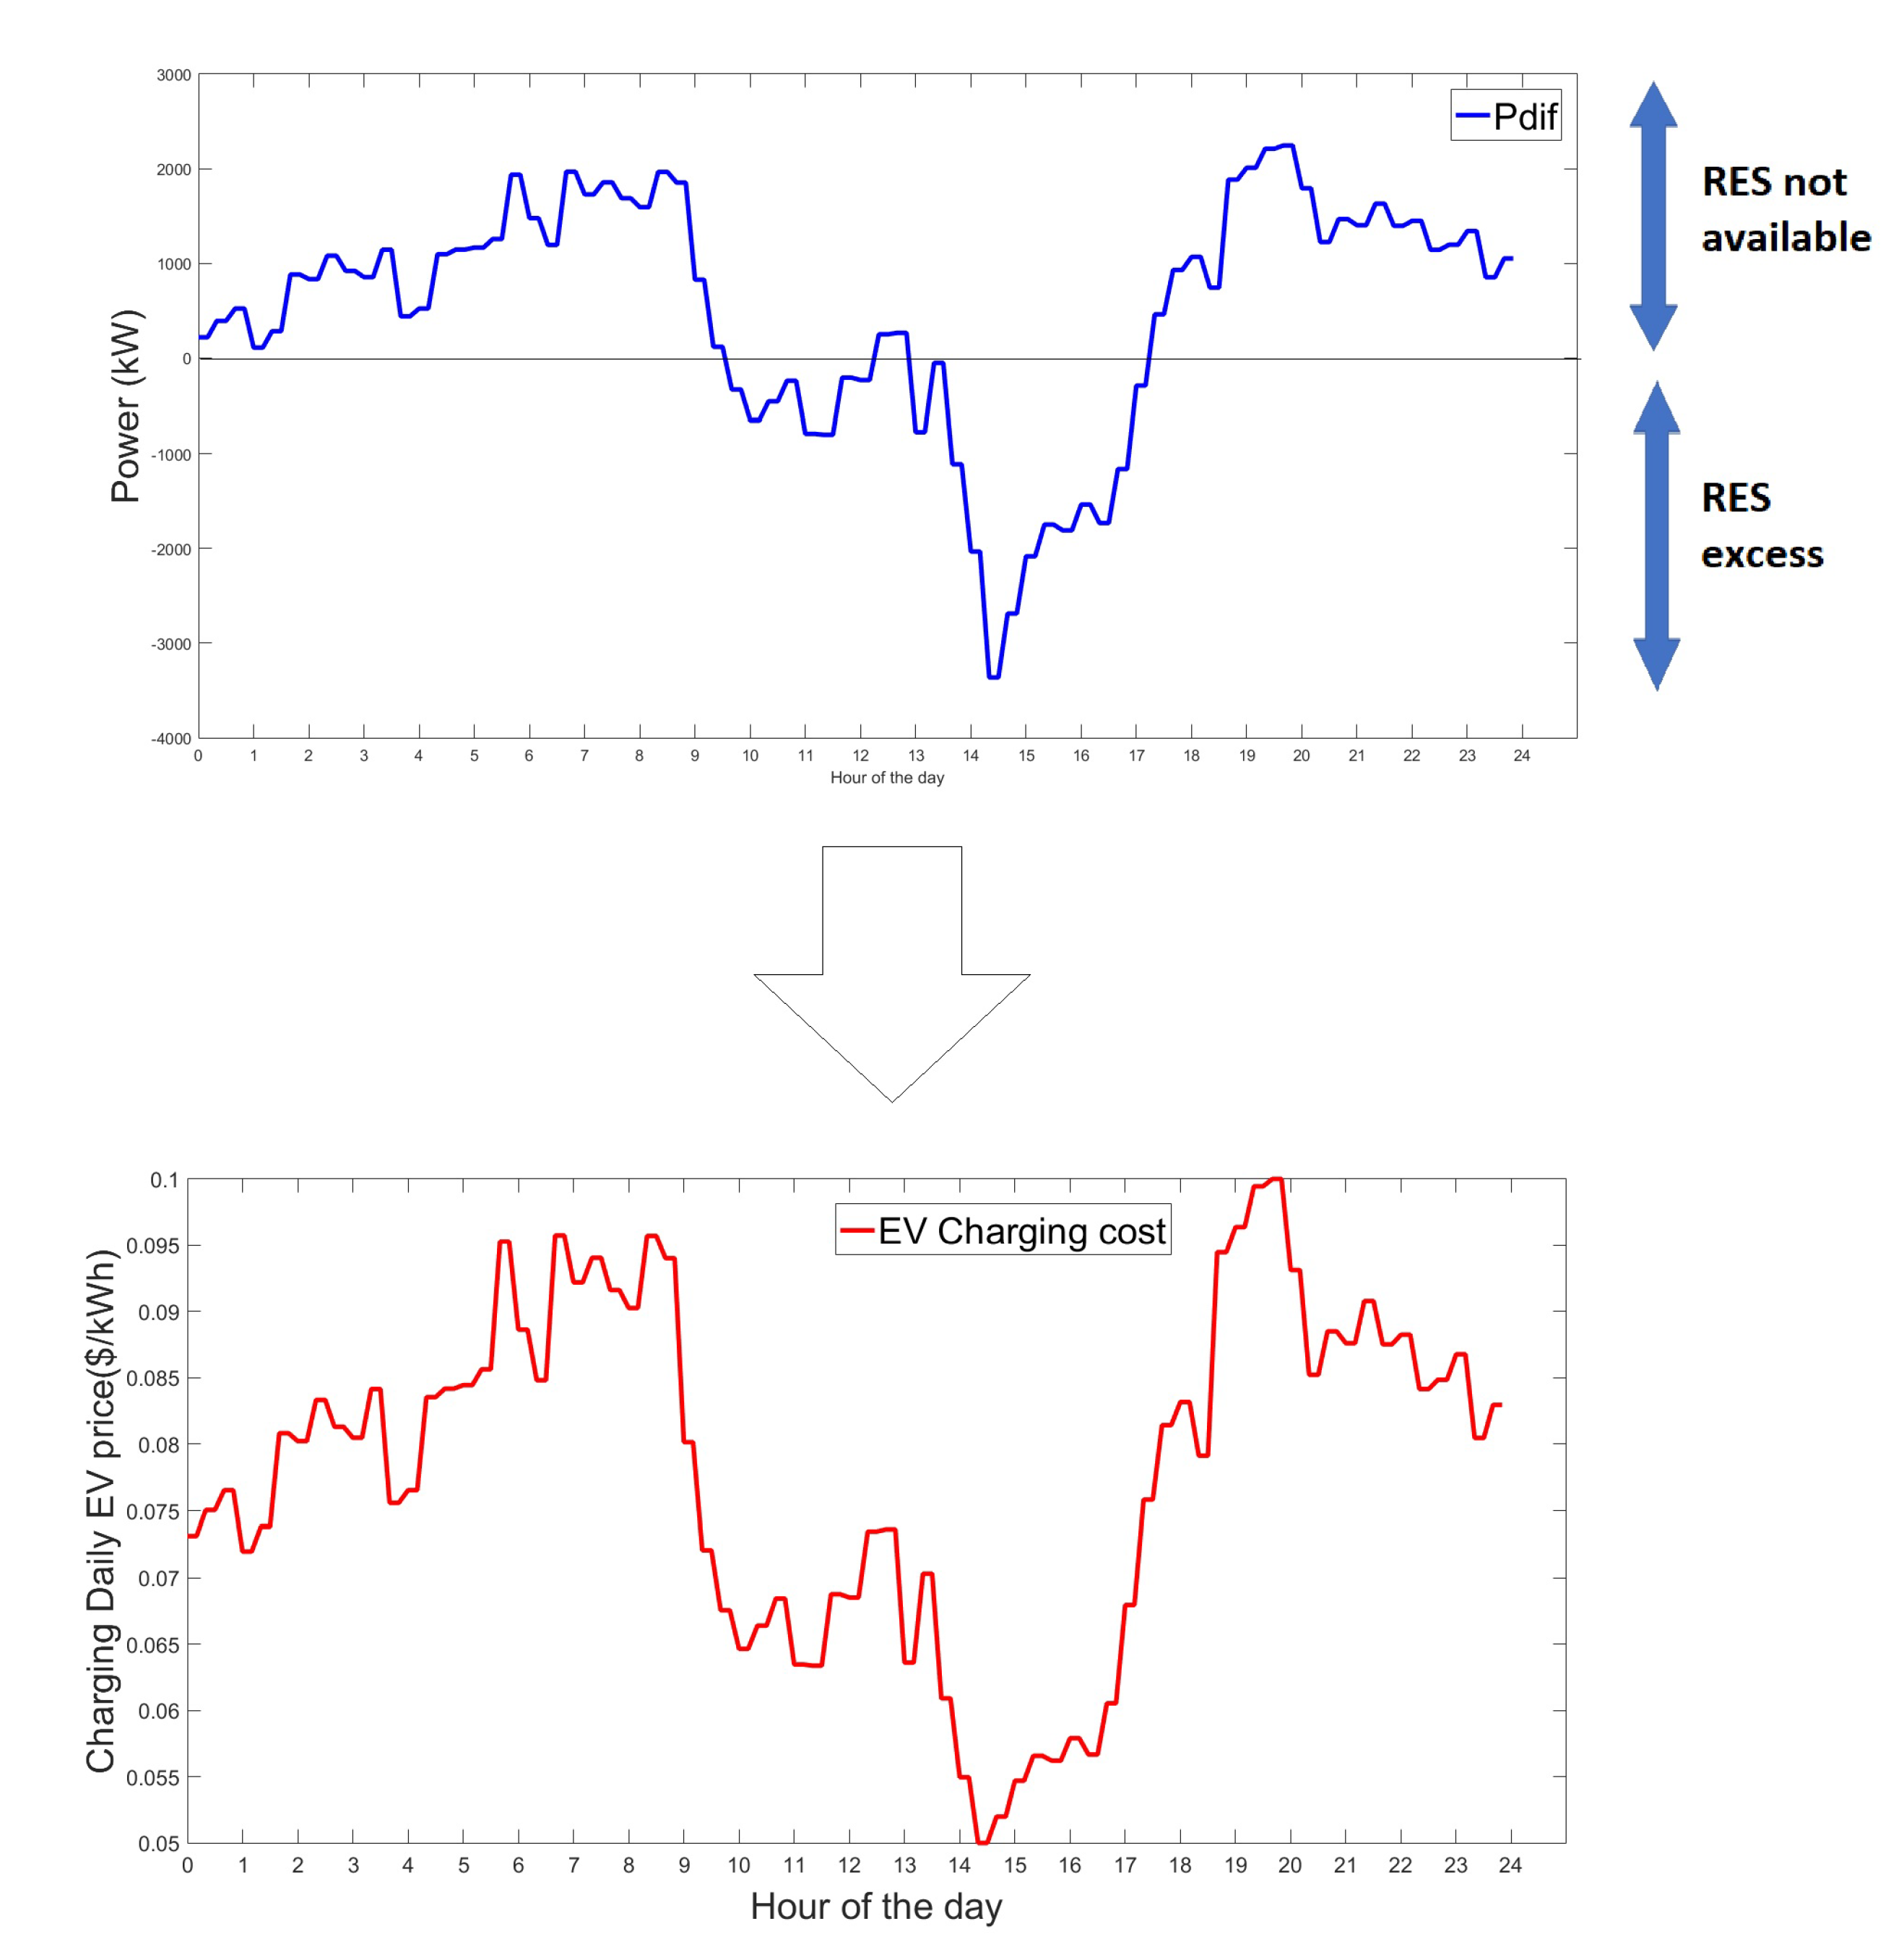
Figure 3.
Configuration of the microgrid.
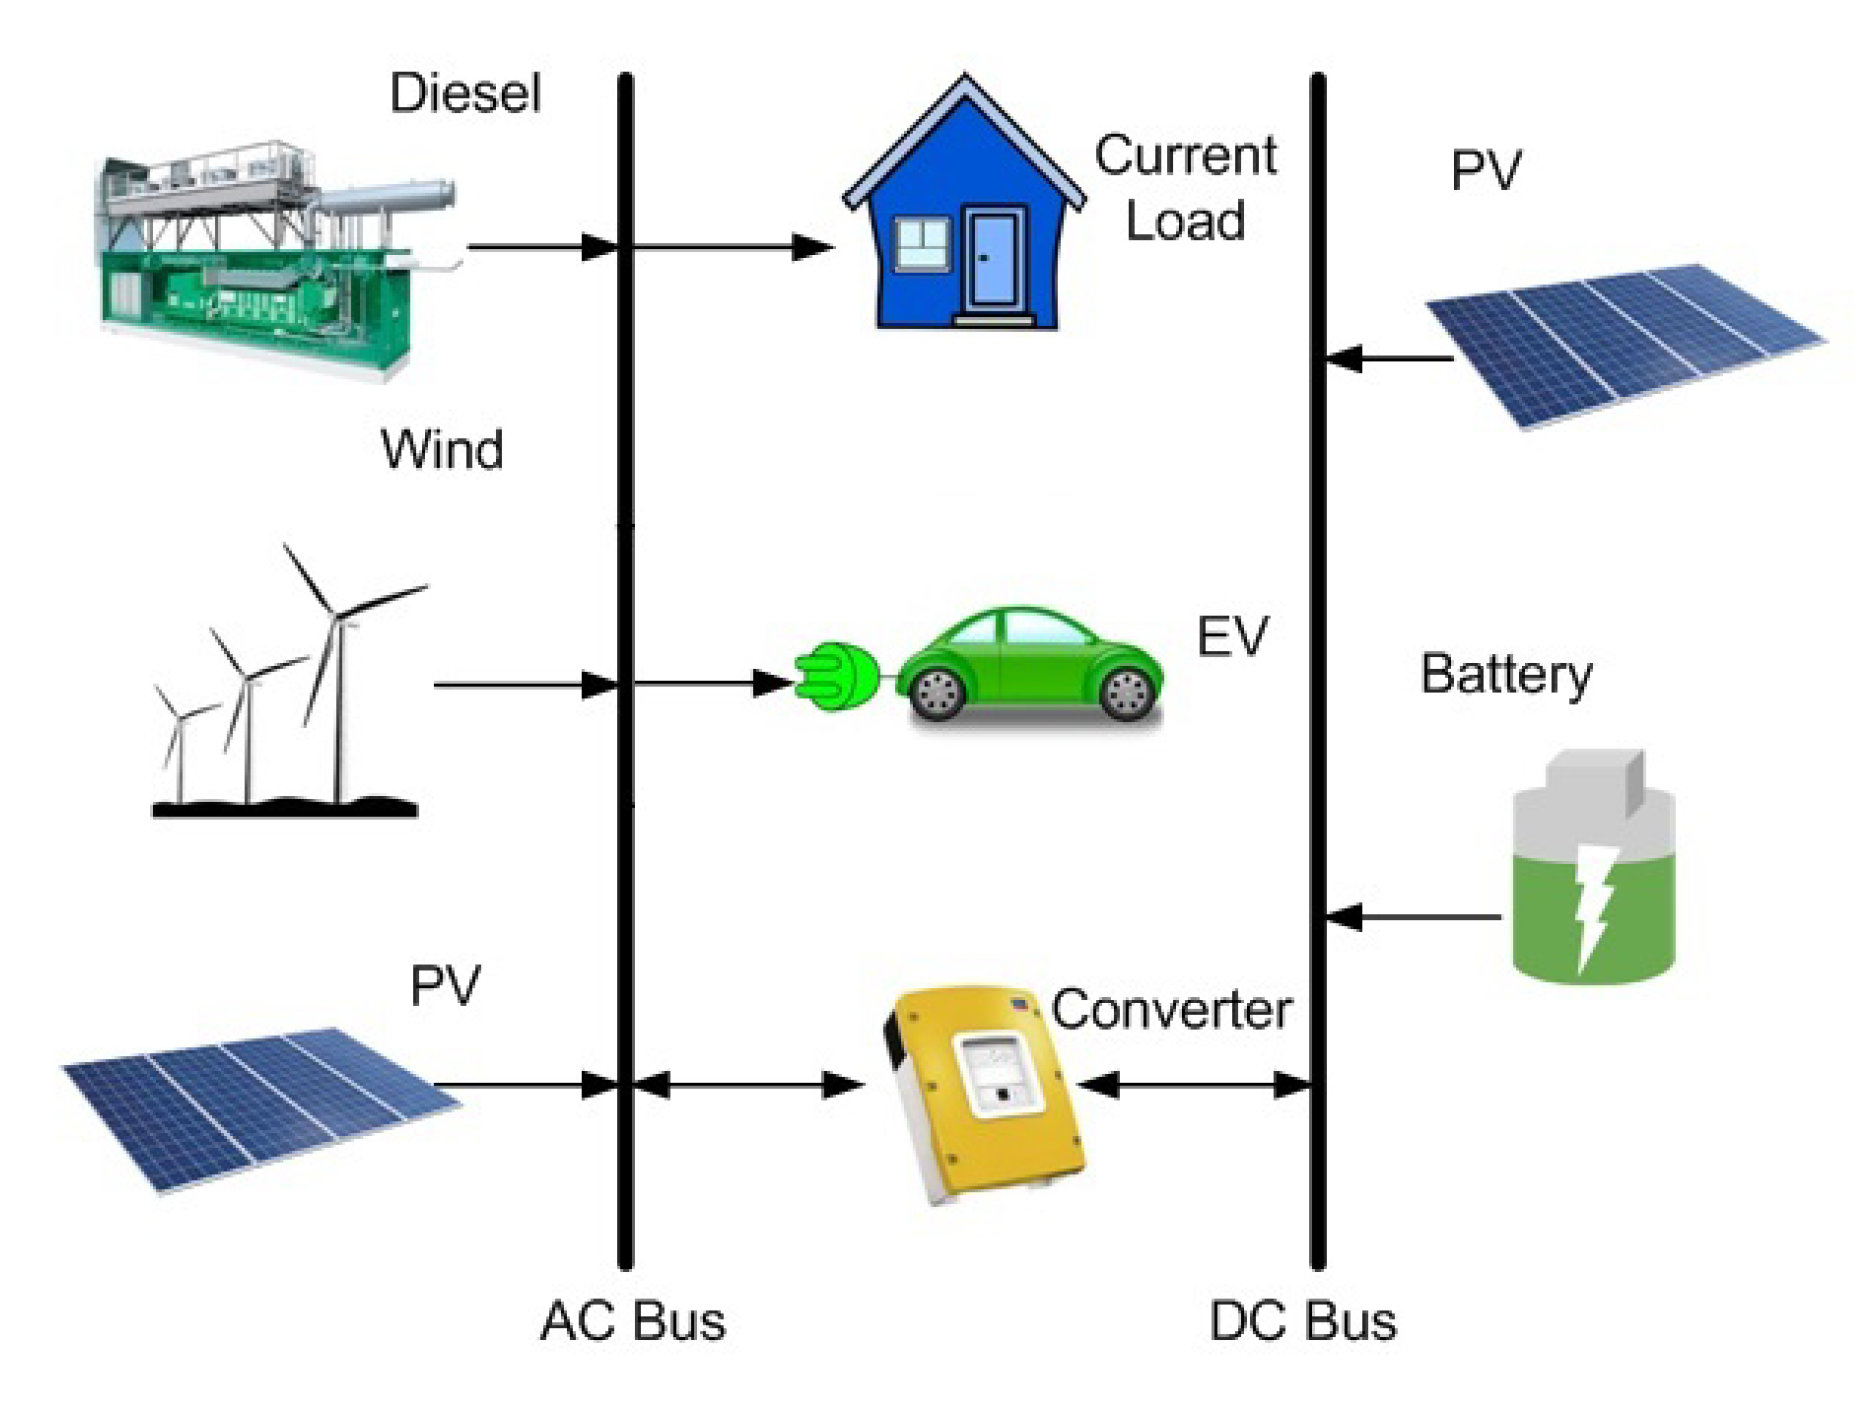
Figure 4.
Existing loads in Santa Cruz, Galapagos: (a) box and whisker plot of monthly profiles; (b) annual load intensity plot; (c) example of a daily profile [38].
Figure 4.
Existing loads in Santa Cruz, Galapagos: (a) box and whisker plot of monthly profiles; (b) annual load intensity plot; (c) example of a daily profile [38].

Figure 5.
Monthly average daily radiation and clearness index [38].
Figure 5.
Monthly average daily radiation and clearness index [38].
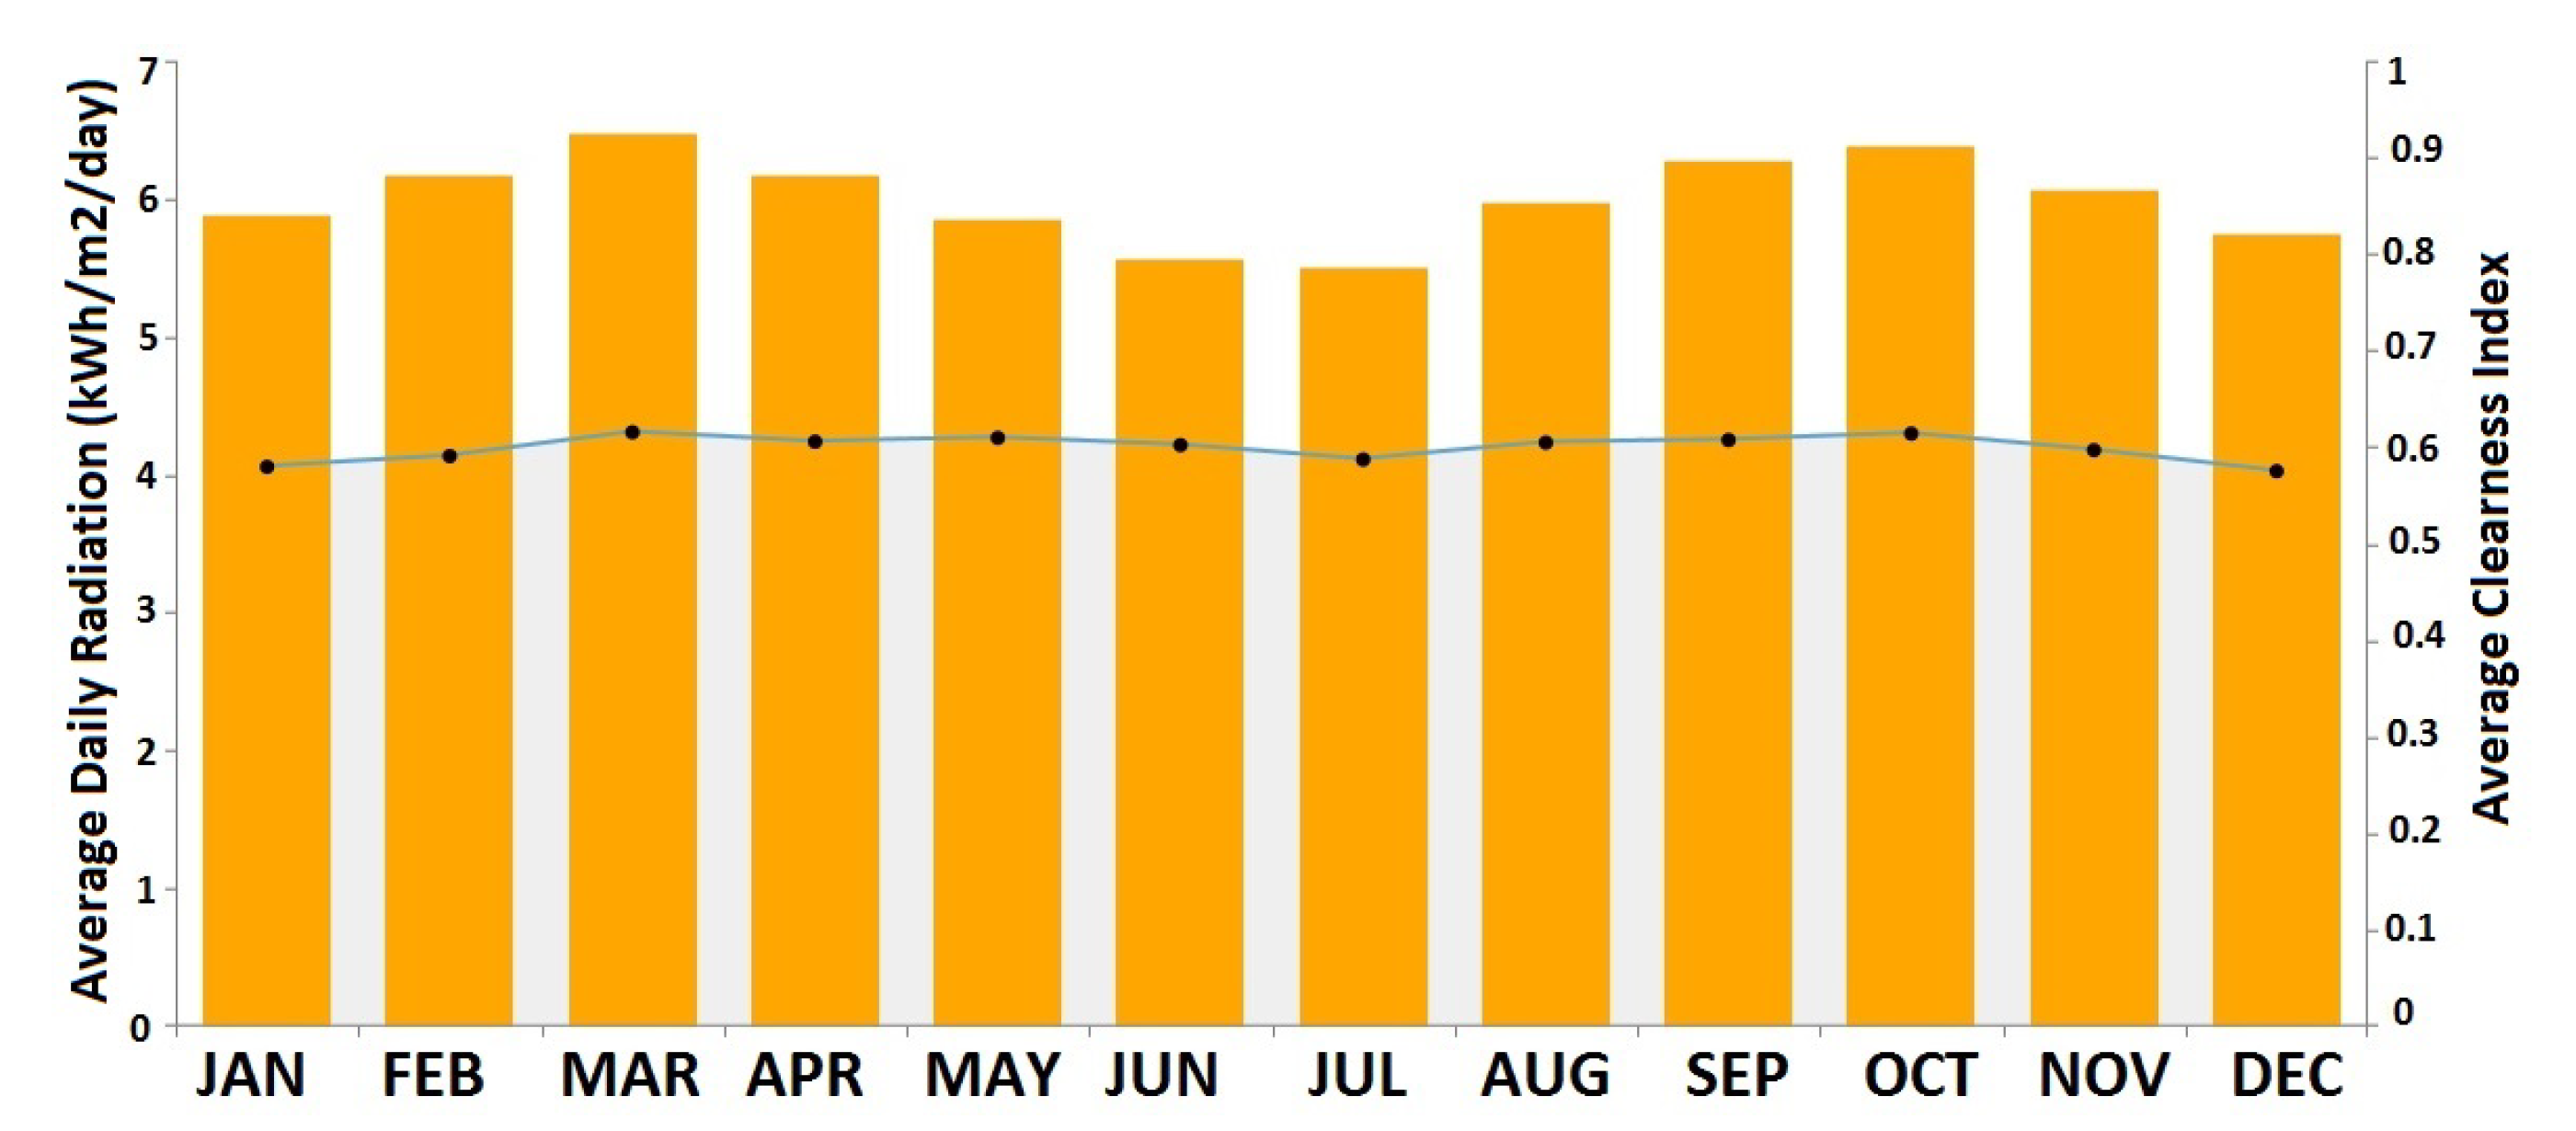
Figure 6.
Monthly average wind speed [38].
Figure 6.
Monthly average wind speed [38].
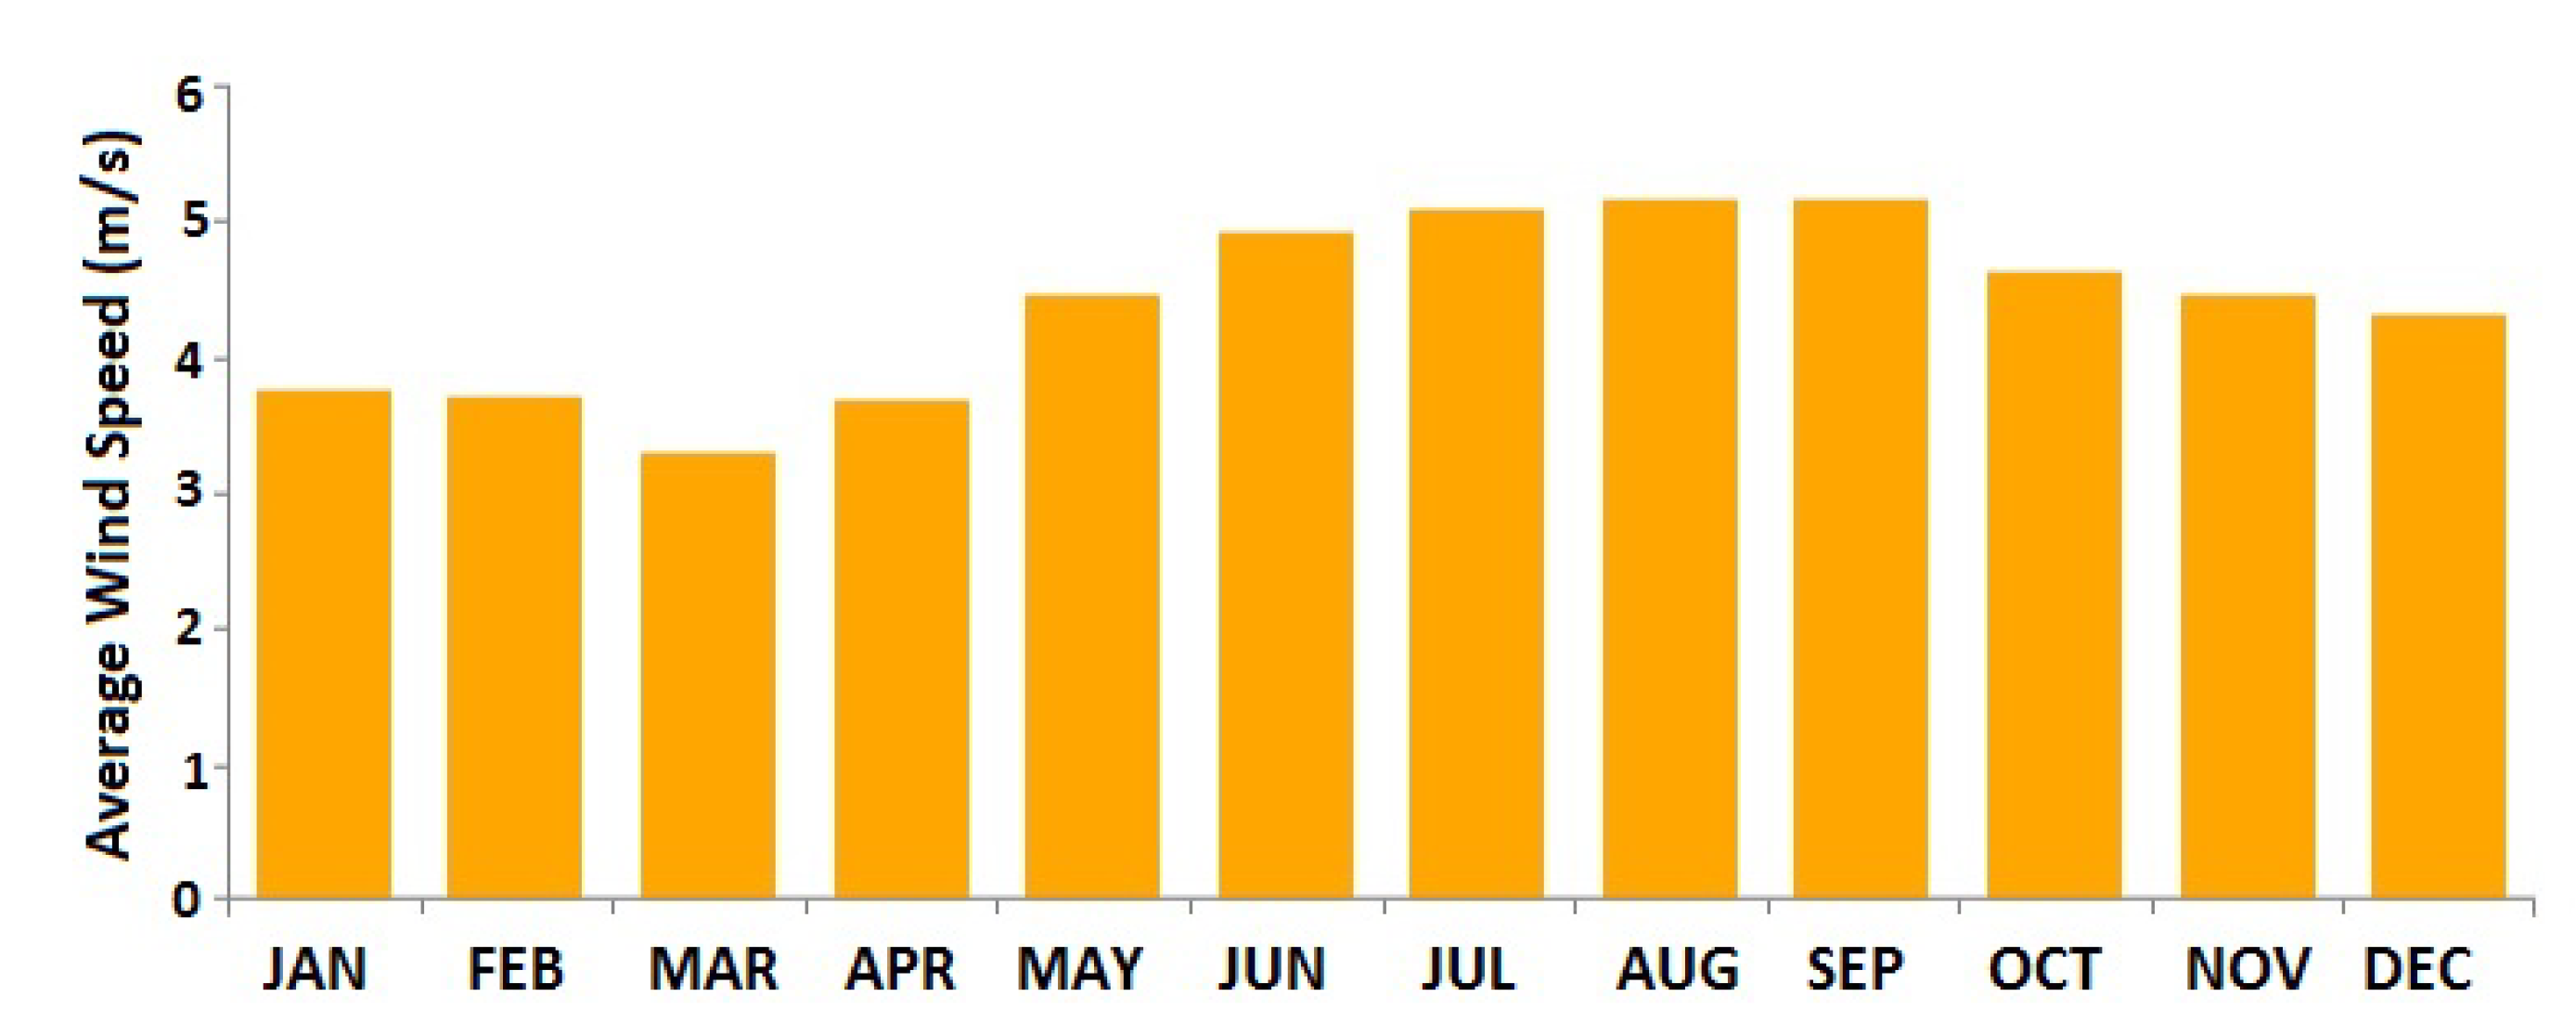
Figure 7.
EV charging load with charging strategy: (a) box and whisker plot of monthly profiles; (b) annual load intensity plot; (c) example of a daily profile.
Figure 7.
EV charging load with charging strategy: (a) box and whisker plot of monthly profiles; (b) annual load intensity plot; (c) example of a daily profile.

Figure 8.
Daily operation.

Figure 9.
variations for different EV penetration levels and diesel prices between cases A and C.

Figure 10.
variations for different EV penetration levels and diesel prices between cases B and C.
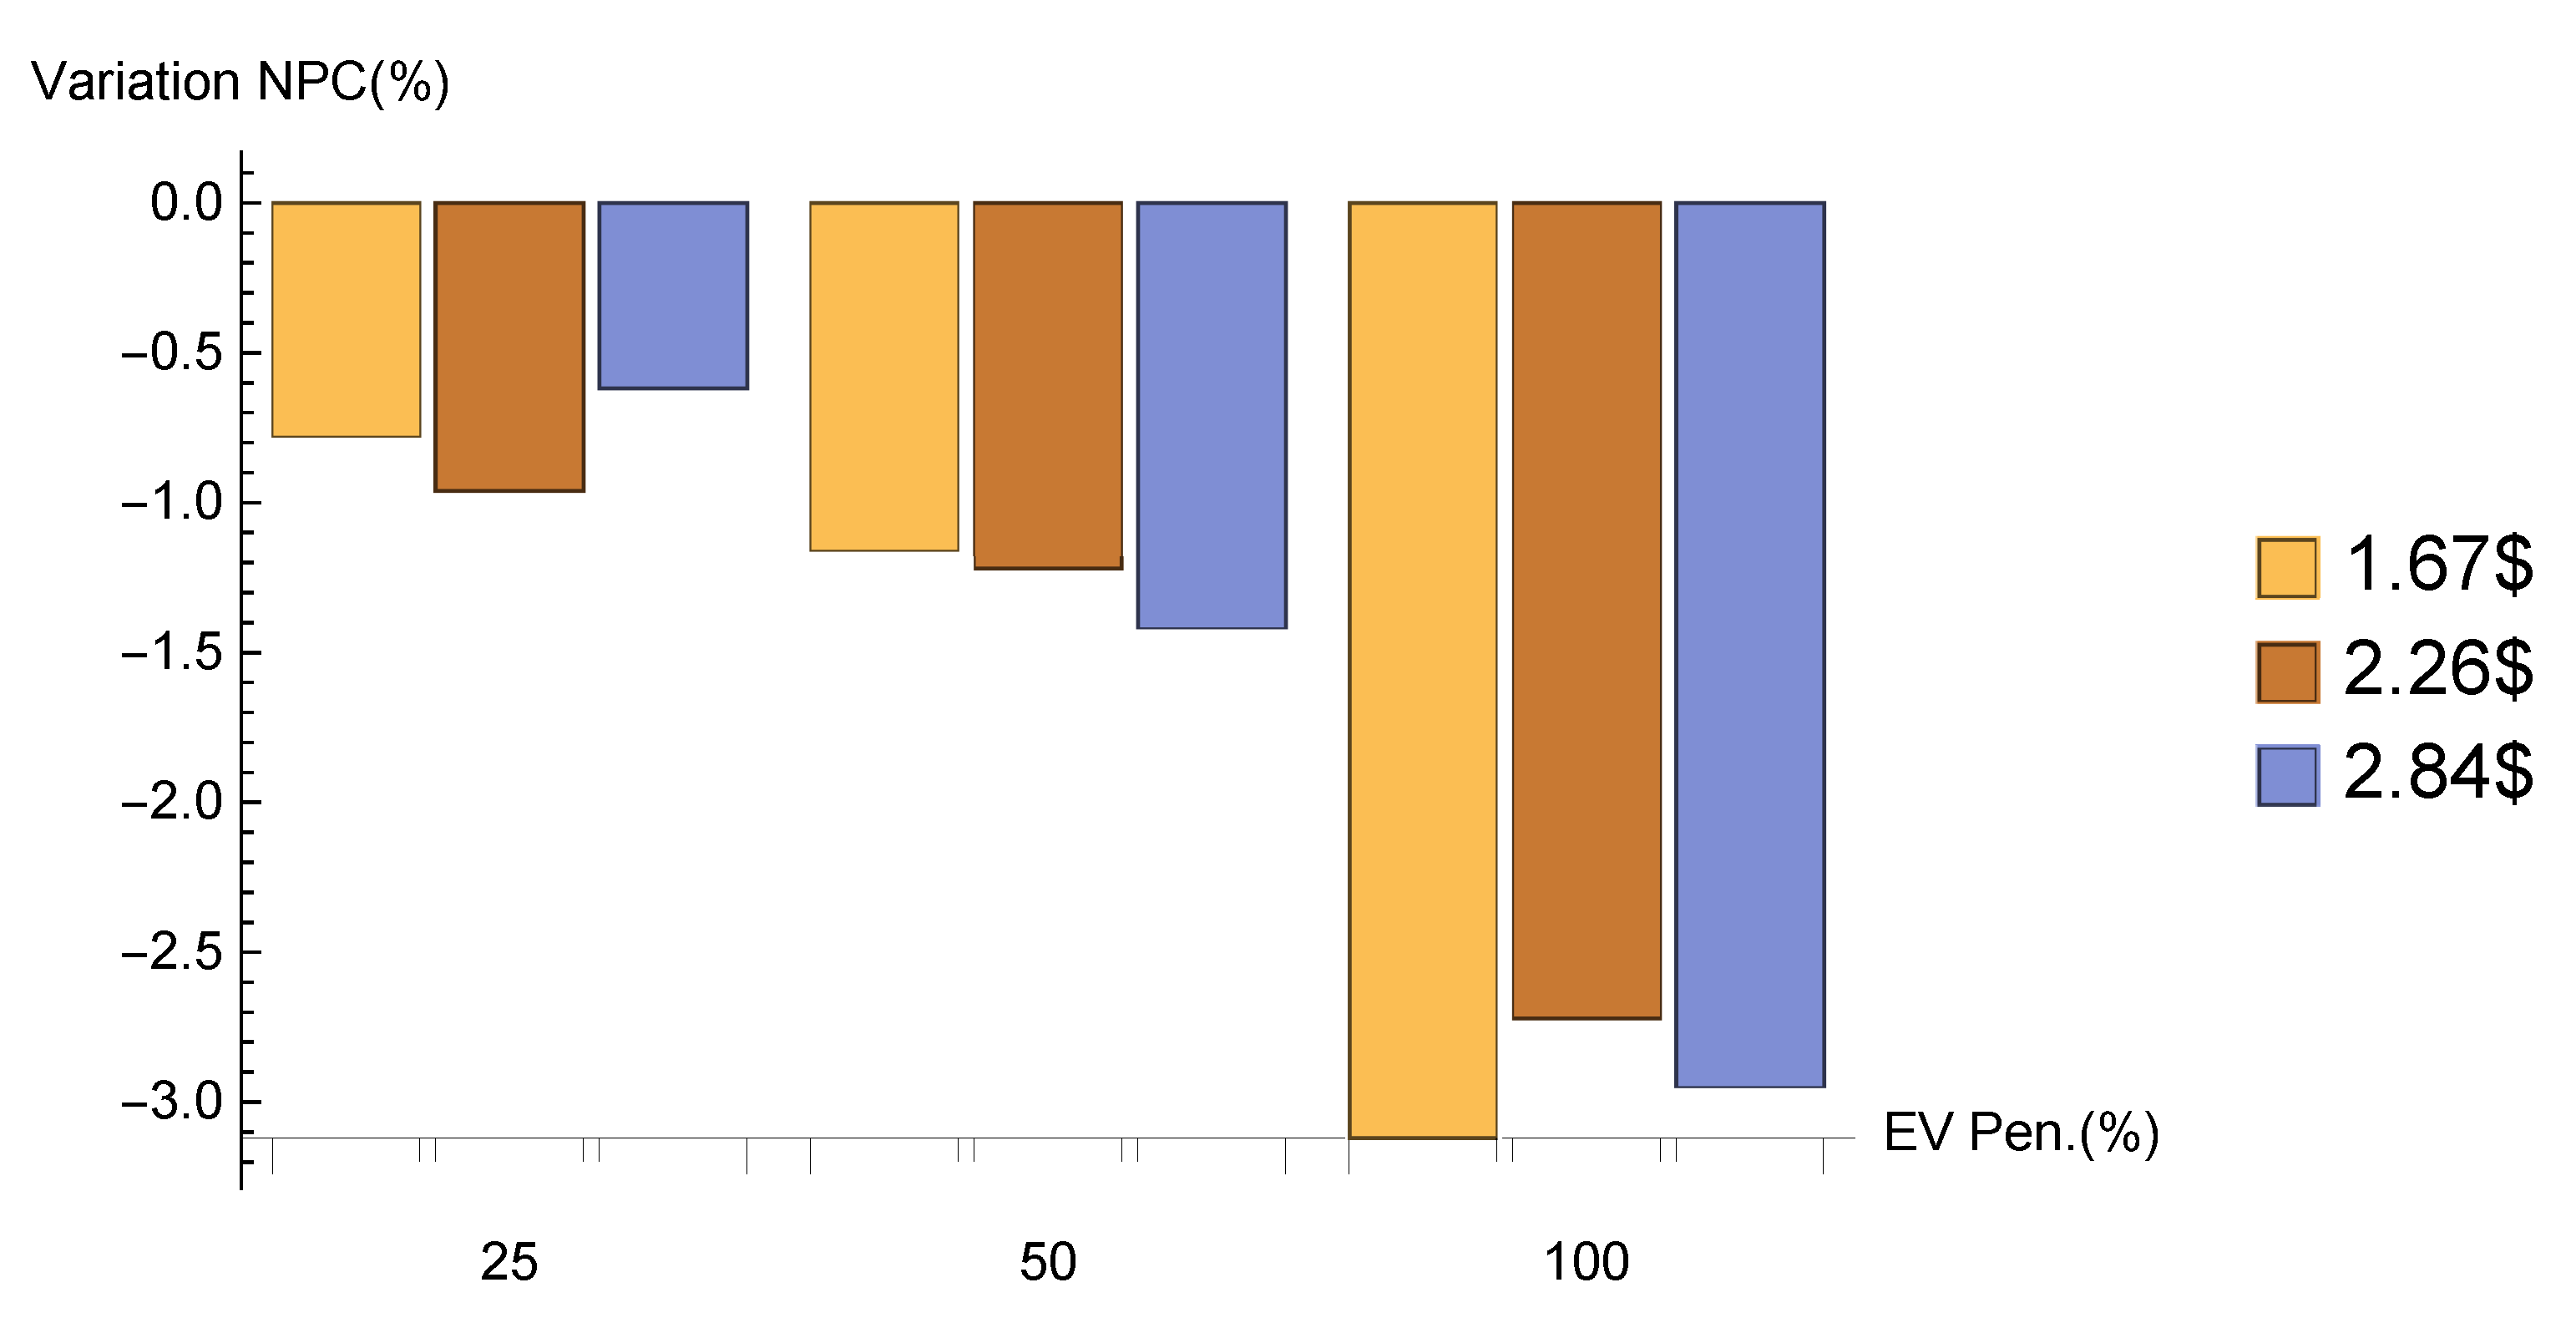
Figure 11.
variations for different EV penetration levels and diesel prices between cases A and C.
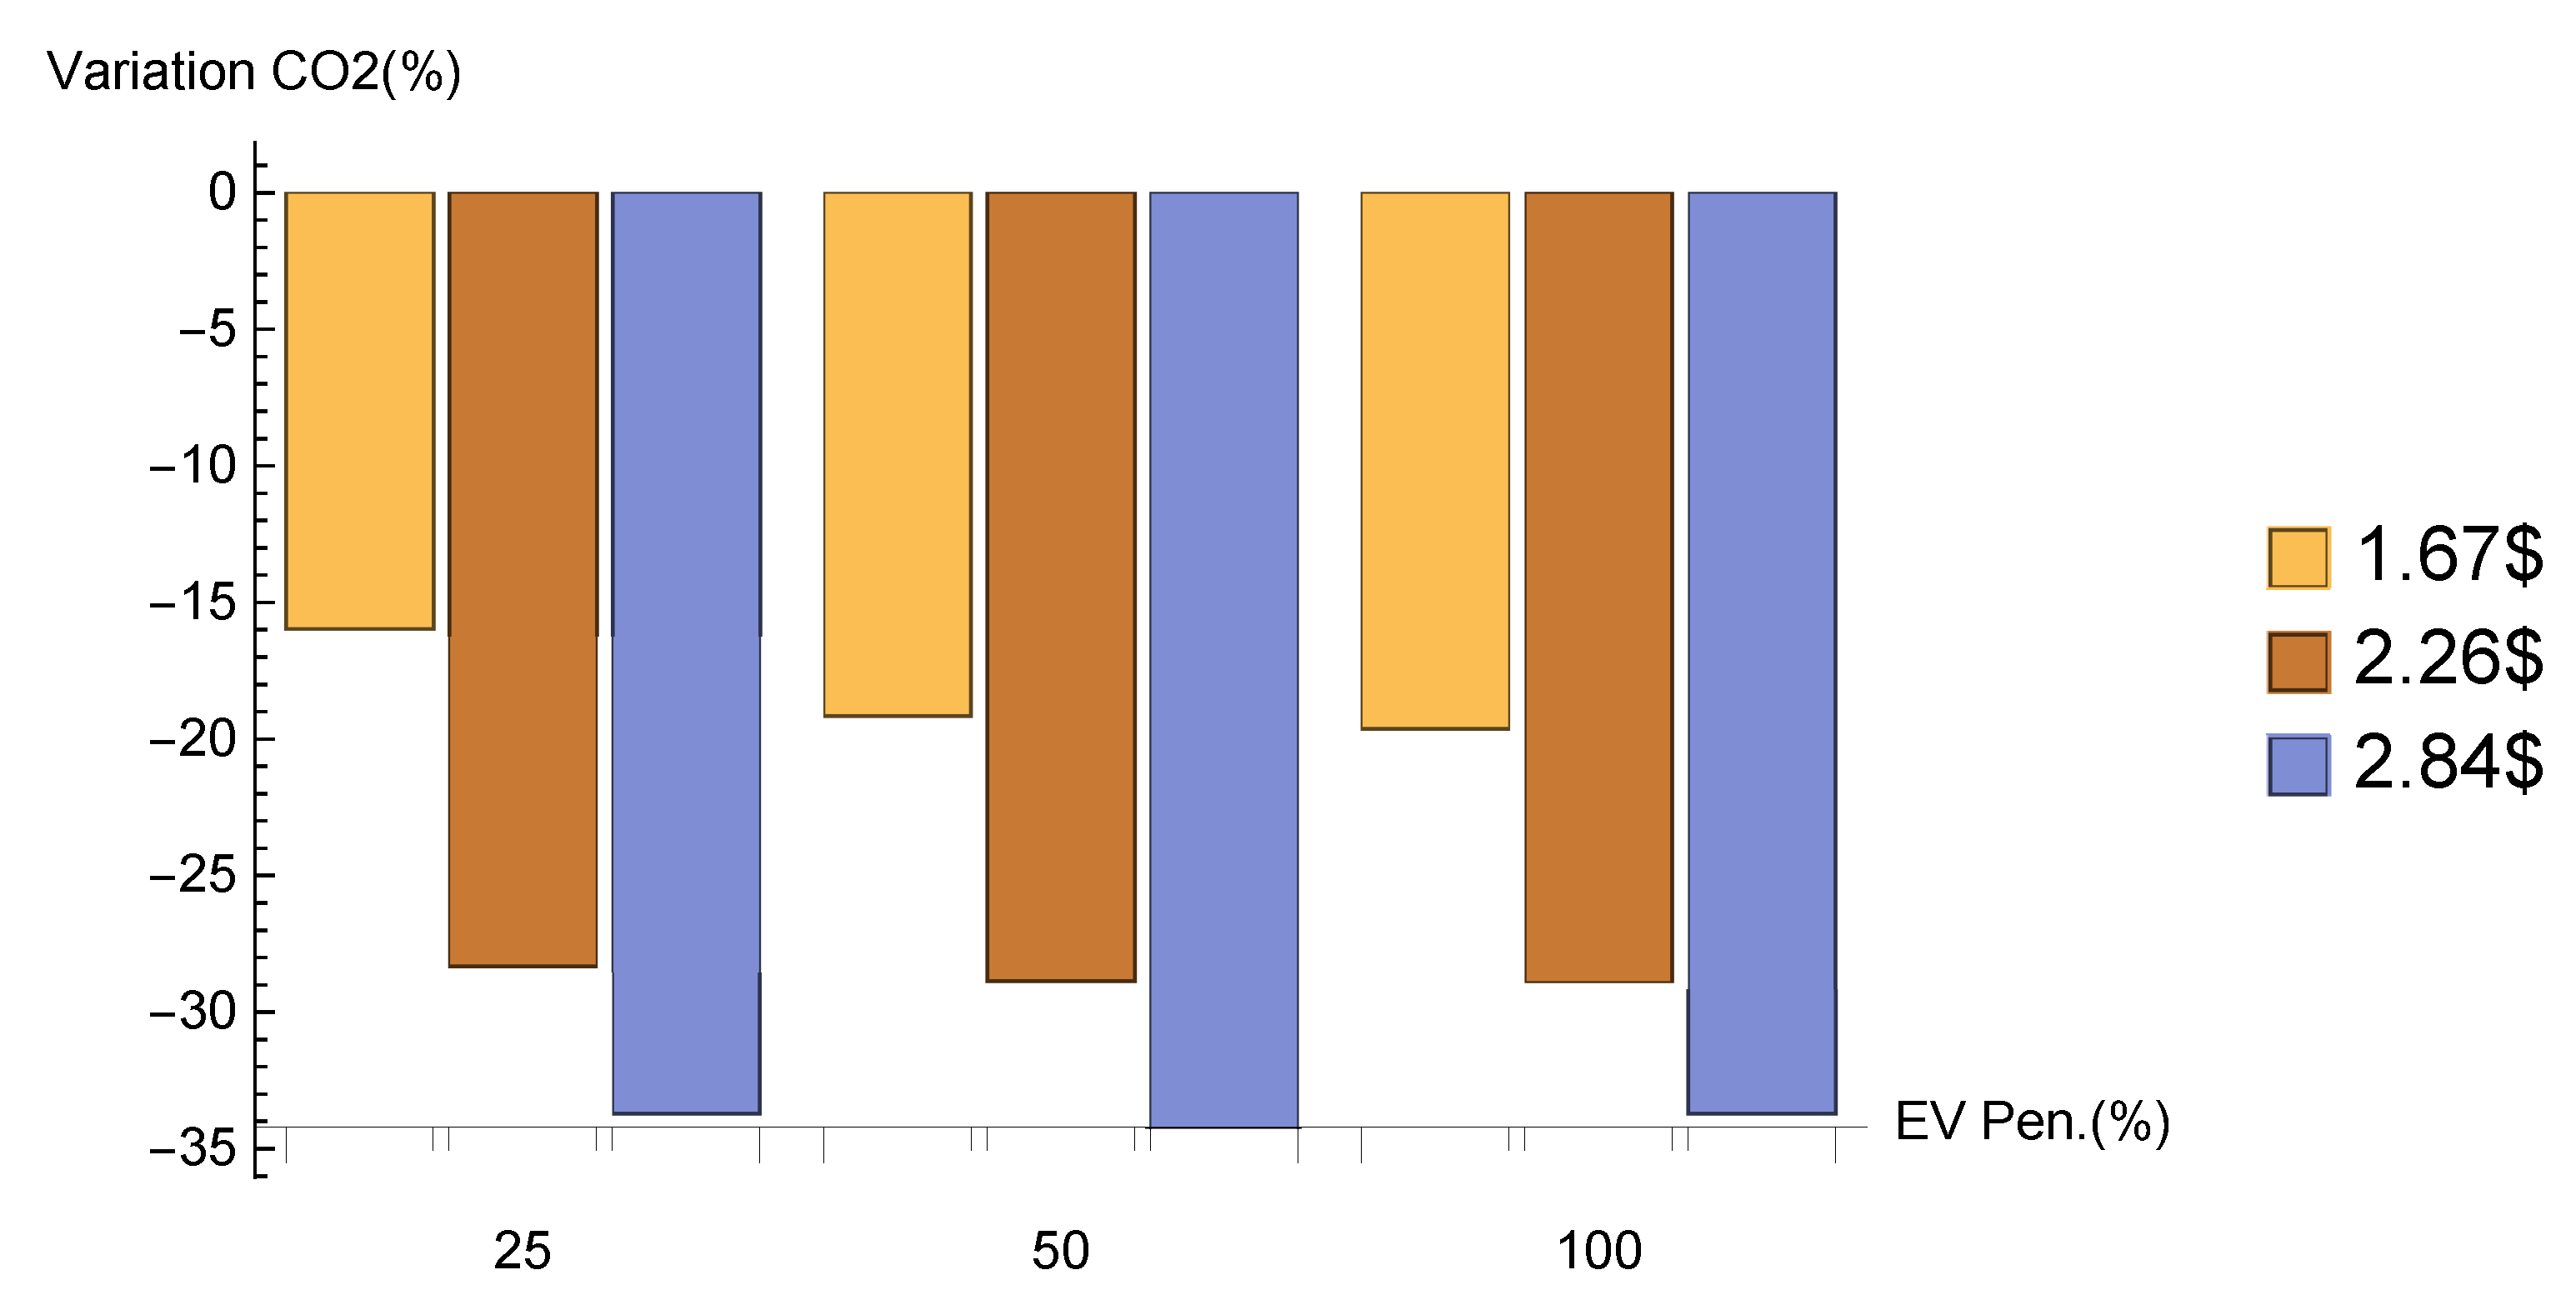
Figure 12.
variations for different EV penetration levels and diesel prices between cases B and C.

Table 1.
Different microgrid configurations using HOMER.
| Ref. | Country | Year | PV | Wind | Diesel | Biogas | Hydro | Battery | Fuel Cell |
|---|---|---|---|---|---|---|---|---|---|
| [16] | India | 2018 | ✓ | ✓ | ✓ | — | — | ✓ | — |
| [17] | India | 2018 | ✓ | ✓ | ✓ | ✓ | — | ✓ | — |
| [18] | Canada, USA, Australia | 2019 | ✓ | ✓ | ✓ | — | — | ✓ | ✓ |
| [19] | Canada | 2012 | ✓ | ✓ | ✓ | — | ✓ | ✓ | — |
| [20] | Iceland | 2015 | — | ✓ | ✓ | — | — | — | ✓ |
| [21] | Egypt | 2018 | ✓ | ✓ | ✓ | ✓ | — | ✓ | ✓ |
| [22] | Canada | 2019 | ✓ | ✓ | ✓ | — | — | ✓ | — |
| [23] | Nigeria | 2019 | ✓ | ✓ | ✓ | — | — | ✓ | — |
| [24] | Iraq | 2020 | ✓ | — | — | — | — | ✓ | — |
| [25] | Egypt | 2020 | ✓ | ✓ | ✓ | — | — | ✓ | ✓ |
| [26] | Bolivia | 2020 | ✓ | ✓ | ✓ | ✓ | — | ✓ | — |
| [27] | Bangladesh | 2020 | ✓ | ✓ | ✓ | — | — | ✓ | — |
| [28] | Philippines | 2018 | ✓ | — | ✓ | — | — | ✓ | — |
| [29] | South Africa | 2019 | ✓ | — | — | — | — | ✓ | — |
| [30] | Colombia | 2019 | ✓ | ✓ | — | — | — | ✓ | — |
| [31] | Tanzania | 2019 | ✓ | — | — | — | — | ✓ | — |
| [32] | Maldives | 2019 | ✓ | ✓ | ✓ | — | — | ✓ | — |
| [33] | China | 2018 | ✓ | ✓ | ✓ | — | — | ✓ | — |
| [34] | Thailand | 2020 | ✓ | — | ✓ | — | — | ✓ | — |
| [35] | Nigeria | 2019 | ✓ | — | — | — | — | ✓ | — |
| [36] | Bosnia and Herzegovina | 2019 | ✓ | — | ✓ | — | — | ✓ | — |
| [37] | India | 2019 | ✓ | ✓ | ✓ | ✓ | — | ✓ | — |
| [38] | Ecuador | 2019 | ✓ | ✓ | ✓ | — | — | ✓ | — |
Table 2.
EV characteristics [38].
Table 2.
EV characteristics [38].
| EV Type | Motorcycle | Bus | Car |
|---|---|---|---|
| N | 611 | 46 | 467 |
| 1 kW | 60 kW | 6.6 kW | |
| 4 kWh | 324 kWh | 27 kWh | |
| 1.7 kWh | 280 kWh | 24 kWh | |
| 16 h 30–20 h 30 | 12 h 00–22 h 00 | 05 h 00–12 h 00 and 22 h 00–02 h 00 |
Table 3.
System costs and emissions at 1.67 $/L diesel.
| [M$] | [kTon/yr] | New PV [MW] | New Capital [M$] | |||||||||
|---|---|---|---|---|---|---|---|---|---|---|---|---|
| EV Pen. [%] | Case | Case | Case | Case | ||||||||
| A | B | C | A | B | C | A | B | C | A | B | C | |
| 25 | 123.69 | 122.61 | 121.66 | 21.44 | 18.55 | 18.49 | 0 | 2.60 | 2.678 | 0 | 14.7 | 15.1 |
| 50 | 140.43 | 139.03 | 137.43 | 24.45 | 20.84 | 20.52 | 0 | 3.24 | 3.18 | 0 | 18.3 | 18 |
| 100 | 173.93 | 172.09 | 166.88 | 30.47 | 25.88 | 25.47 | 0 | 4.12 | 3.652 | 0 | 23.2 | 20.6 |
© 2020 by the authors. Licensee MDPI, Basel, Switzerland. This article is an open access article distributed under the terms and conditions of the Creative Commons Attribution (CC BY) license (http://creativecommons.org/licenses/by/4.0/).
Share and Cite
MDPI and ACS Style
Clairand, J.-M.; Álvarez-Bel, C.; Rodríguez-García, J.; Escrivá-Escrivá, G. Impact of Electric Vehicle Charging Strategy on the Long-Term Planning of an Isolated Microgrid. Energies 2020, 13, 3455. https://doi.org/10.3390/en13133455
AMA Style
Clairand J-M, Álvarez-Bel C, Rodríguez-García J, Escrivá-Escrivá G. Impact of Electric Vehicle Charging Strategy on the Long-Term Planning of an Isolated Microgrid. Energies. 2020; 13(13):3455. https://doi.org/10.3390/en13133455
Chicago/Turabian StyleClairand, Jean-Michel, Carlos Álvarez-Bel, Javier Rodríguez-García, and Guillermo Escrivá-Escrivá. 2020. "Impact of Electric Vehicle Charging Strategy on the Long-Term Planning of an Isolated Microgrid" Energies 13, no. 13: 3455. https://doi.org/10.3390/en13133455
Note that from the first issue of 2016, this journal uses article numbers instead of page numbers. See further details here.