A Study on the Influence of Lithium Plating on Battery Degradation
by
 ,
,
Upender Rao Koleti
*, 
Ashwin Rajan
,
Chaou Tan
,
Sanghamitra Moharana
,
Truong Quang Dinh
and
James Marco
Warwick Manufacturing Group, The University of Warwick, Coventry CV4 7AL, UK
*
Author to whom correspondence should be addressed.
Energies 2020, 13(13), 3458; https://doi.org/10.3390/en13133458
Submission received: 25 May 2020
/
Revised: 26 June 2020
/
Accepted: 29 June 2020
/
Published: 3 July 2020
(This article belongs to the Section D: Energy Storage and Application)
Abstract
:Within Li-ion batteries, lithium plating is considered as one of the main reasons behind the capacity fade that occurs during low temperature and fast charging conditions. Previous studies indicate that plating is influenced by the levels of loss of lithium inventory (LLI) and the loss of active material (LAM) present in a battery. However, it is not clear from the literature on how lithium plating influences battery degradation in terms of LAM and LLI. Quantifying the undesirable impacts of lithium plating can help in understanding its impact on battery degradation and feedback effects of previous lithium plating on the formation of present plating. This study aims to quantify the degradation modes of lithium plating: LLI, LAM at the electrode level. A commercial Li-ion cell was first, aged using two different cases: with and without lithium plating. Second, a degradation diagnostic method is developed to quantify the degradation modes based on their measurable effects on open-circuit voltage (OCV) and cell capacity. The results highlight that LAMNE and LLI levels under the fast charge profile are increased by 10% and 12%, respectively, compared to those under the less aggressive charge profile. Further, limitations of the degradation analysis methods are discussed.
1. Introduction
Lithium-ion batteries, usually employ graphite as their negative electrode (NE) material and have been widely used in mobile devices due to their superior properties, such as high energy density and long cycle life [1,2]. However, metallic lithium deposition on the graphite NE is one of the most severe aging mechanisms in lithium-ion batteries during charging at low temperatures, high states of charge (SOC), high charge voltages and high charge rates [3,4,5]. Towards the end of charging or just after charging, when the negative electrode potential (NEP) rises above the Li reference potential, a portion of the plated lithium is known to return to the electrode. This is called the reversible part of plated lithium [6]. The irreversible component may react further with the electrolyte or become electrically isolated from the electrode, creating a pool of inactive metallic lithium [7].
It is well understood how operating conditions of the battery such as charge current, temperature and aging condition influence the NEP and thus lithium plating [3,8]. On the other hand, although it is known that lithium plating leads to capacity fade, the exact underlying degradation happening to the battery under the influence of lithium plating is not clear. The capacity fade observed at the cell level can result from lithium inventory (LLI) or loss of active material (LAM) at the electrodes or a combination of them [9,10]. The irreversible plating that reacts with the electrolyte or become electrically isolated from the electrode, lead to a reduction of cyclable lithium between the electrodes and thus LLI [11]. In addition, lithium depositions on the NE can damage the SEI layer, which leads to regrowth of the SEI layer [12]. Since the SEI layer growth consumes a portion of cyclable lithium [13,14], this further raises the LLI.
In addition to the LLI, lithium plating may also induce LAM. As discussed within [15], lithium plating increases the volume expansion of the cell. The study proved theoretically and experimentally that plated lithium occupies nearly four times more volume than the volume expansion experienced by the graphite for the same amount of lithium intercalation. In addition, the SEI growth due to its damage inflicted by lithium plating can increase its depositions and thus volume expansion locally [16]. This volume expansion may add to the usual volume changes experienced during cycling, and thus raising mechanical stresses. These mechanical stresses may contribute to active material cracks at the electrode, leading to a LAM at the electrodes—another contributor to capacity fade.
Further, increased mechanical stresses or LAM due to lithium plating may indicate that higher volume-occupying depositions from previous lithium plating can continue to cause mechanical stresses locally and produce long-lasting negative impacts on the battery life. Given all this, it is important to study and quantify the degradation modes (LLI and LAM) in batteries affected by lithium plating. In addition, it helps to understand whether reversible plating that is generally considered as non-detrimental [4] lead to capacity fade as it contributes to volume expansion as well.
Majority of the previous studies focused on the degradation modes (LAM and LLI) analysis in cells that are in either calendar or cycle aging where the operating conditions such as temperature and charge currents are kept within the manufacturer recommended levels [16,17]. The degradation modes identified under these aging conditions cannot be attributed largely to lithium plating as the charge currents are not raised or temperatures are not dropped beyond the recommended limits that could not make lithium plating as a dominant aging mechanism. In contrary, two different studies analyzing the degradation modes of the cycle-aged cells have reported the presence of lithium plating. First one, as discussed within [4], looks at the degradation influence on lithium plating to understand the reasons behind lithium plating occurrence in the later part of cycle aging. The paper reports large levels of LAM at the NE in delithiated state (LAMdeNE) in the early cycles is leading to the saturation of NE lithiation and thus lithium plating. Second one, as reported by [18], attempts to identify the underlying causes that gradually reduced lithium plating with the increasing cycle number while cycling at −22 °C. The qualitative degradation analysis reveals that LLI due to previous lithium plating could reduce lithium plating in the later cycles. The reason is, as LLI rise, lithiation level of the NE toward the end of charging drops or high SOC region of the NE is not accessible anymore. LLI standalone or LLI in a dominating position compared to the LAM (for example, 10% LLI and 6% LAM) could as well reduce the lithium-plating tendency. However, the study is not extended further to look into the other degradation mode, LAM. Therefore, to quantify the degradation modes of lithium plating, a separate study is required.
To study battery degradation in terms of LLI, LAMPE and LAMNE, many researchers use differential voltage (DV) curves (dV/dQ) and incremental capacity (IC) curves (dQ/dV), where dQ stands for the incremental capacity while dV defines for the differential voltage calculated from the battery open circuit voltage (OCV). By comparing the IC or DV curves of a cell at two different aging states, the degradation modes of the battery can be inferred [19,20]. However, from the interpretations of the IC or DV curves, it is difficult to quantify the changes occurring at each electrode when both the electrodes contribute to the cell OCV profile [21].
To overcome the drawbacks of the above methods, a degradation diagnostic technique using the electrode OCV profile was proposed by Birkl et al. [9]. By employing half-cells developed using the electrodes harvested from the cell, each electrode’s OCV as a function of its capacity or lithiation level could be experimentally defined. Based on this information and the cell-level OCV, the lithiation levels at the end of charge (EoC) and the end of discharge (EoD) of the NE and positive electrode (PE) could be identified. These four lithiation levels could be identified for a cell prior to and after aging. It is then possible to quantify the degradation modes of both the individual electrodes and the cell as a whole [9]. However, this diagnostics technique was evaluated with artificially aged cells (LAM and LLI were induced by selecting the electrodes in different sizes from a new cell), its practical application has not been discussed within the literature. In addition, the quantification method used within [9] can be simplified to reduce the complexity by quantifying independently the three degradation modes LLI, LAMNE and LAMPE based on the electrode lithiation levels rather than their offsets at the E°C and EoD.
To study the impact of plating induced degradation and to simplify the degradation procedure, the following objectives are defined for this work:
- To improve the degradation diagnostics model presented in [9] to simplify the quantification procedure of LLI, LAMNE and LAMPE;
- To identify the degradation modes of a commercial cell aged under a fast charge regime and analyze the underlying degradation mechanisms.
The remainder of this study is organized as follows. Section 2 discusses the experimental stage of this research and presents the data acquired. Section 3 presents the methodology in quantifying the battery degradation modes. The degradation modes estimated under the fast charging regime are presented and analyzed in Section 4 by applying the methodology to the data acquired in Section 2. Overall, conclusions of this research are given in the final section.
2. Experimental Setup and Data Acquisition
For this study, a collection of 18,650-type Panasonic BD cells with a rated capacity of 3.1 Ah is used. The NE material is graphite and the PE material is LiNiCoAlO2, commercially known as NCA. To quantify the LAM and LLI, measurement of OCVs of the half-cells (electrodes) and the full-cells is required. The experiments are then categorized into full-cell level and half-cell level tests. At the full-cell level, OCV profiles of the cells are captured prior to and after their fast-charge cycling. For the half-cells, OCV profiles of the electrodes are obtained with the help of harvested electrodes from a pristine full-cell. The detailed setup, experimental procedure and the results for each are presented in the following sections. The experimental data collected in this section is used for the degradation analysis presented in Section 3 and Section 4.
2.1. Full-Cell Experiments
Two test cases employing two sets of full-cells are designed. For each test case, three cells are selected as shown in Table 1 for reproducibility and to minimize influences of cell-to-cell variations on the experimental results. A detailed description of the experimental setup is presented in [22].
Experiments were carried out with the selected cells using a four-step sequence: pre-conditioning, OCV measurement prior to aging, aging and OCV measurement after aging as shown in Table 2. To study lithium plating induced degradation, set A and set B cells are aged differently through the aging test under conditions that potentially could and could induce lithium plating, respectively. The detailed testing conditions of these experiments are given in Table 2.
At Step 1, the new cells are preconditioned as detailed in Table 2 to stabilize their capacity before the OCV measurement is performed [17,23].
At Step 2, the OCV tests are performed at room temperature (25 °C) on the full-cells using the test procedure presented in Table 2. The cells are charged to 4.2 V with CC–CV (C/10 C-rate in the CC and 50-mA-cutoff current in the CV) charge profile and rested for four hours before the OCV measurements are obtained on the following discharge. To capture true OCV over the entire capacity range of the cells, the full cells are discharged incrementally, in steps of 1/120 of the nominal capacity (Q = Qnom/120), by applying small currents (C/20) and subsequently allowing the cell voltage to relax for one hour [24]. Here, Qnom of the cell refers to the maximum capacity when the battery is completely charged. The OCV measurements are recorded at the end of each rest period. This method of OCV measurement is referred to as galvanostatic intermittent titration technique (GITT) [24]. Figure 1a shows the cell voltage and its OCV measurements with respect to the given discharge current profile in Figure 1b. The OCV profile as a function of capacity is then constructed as illustrated in Figure 1c.
At step 3, the aging tests are carried out following Step 3 of Table 2. Both the cell sets A and B are cycled at a low ambient temperature of 5 °C until the average capacity retention level of set A has reduced to 80%. set A is charged with 1 CC–CV and discharged with C/3 CC–CV profile. Relevant current and voltage limits are defined in Table 2. On the other hand, set B is tested under similar operating conditions except for the charge profile. Unlike set A, set B cells are charged with 1C current up to 4.05 V and then smaller charge currents are applied to fully charge the cells to 4.2 V to avoid or reduce the onset of lithium plating [2,25,26]. The capacity characterization procedure that interrupts the fast-charge cycling is kept similar to both the cell sets to minimize its influence on the value of capacity fade [27]. Further details for these tests can be found from [22].
The occurrence of lithium plating on set A cells is confirmed by using the voltage relaxation profile (VRP) method. This method is based on the cell terminal voltage profile in post-charge relaxation influenced by the plating reverse reactions [28,29]. A 2-stage voltage relaxation as shown Figure 2a for a cell in set A indicates the occurrence of lithium plating while a usual single-stage relaxation indicates the absence of plating as shown in Figure 2b for a cell in set B. The working principles of this method and its application are explained further in [22]. The cells from set A lost an average 20% (with a ± 5% variation) capacity by the 52nd cycle. On the other hand, lithium plating is not detected in set B and these cells lost only an average 5.9% (with a ± 0.9% variation) capacity by the 52nd cycle. Figure 2c presents the reduction in capacity trends exhibited by the cells in set A and set B.
After the aging tests, at Step 4, the cells are once again tested for the OCV profiles using the same procedure described in Step 2 of Table 3.
After completing the four-step experimental procedure, one cell from each set, A and B, is randomly selected to open and visually inspect for metallic depositions on the electrode surface. To compare the differences, a new cell is also dismantled. To minimize the risk of safety hazards such as short circuits while opening, first, the cells are fully discharged to 2.5 V with a C/10 discharge current. The cells are then opened in an argon-filled glove box and electrodes are inspected for metallic depositions [30]. Figure 3 shows images of the graphite electrodes of the new cell and the cells selected from sets A and B (tagged as cell A and cell B, respectively). The graphite electrode of the new cell appears mostly black, as expected from a functional fully discharged graphite-based electrode [31]. A few areas exhibiting silvery depositions are found on the graphite electrode of cell B. Meanwhile, much larger and clearly distinguished areas with silver color depositions are observed at the axial edges of cell A. As discussed within [30,31], since the graphite electrode does not appear in silver color at any of its lithiation levels, these depositions can be attributed to lithium plating. It is asserted therefore that cell A is exhibiting at a much higher level of lithium plating compared to cell B.
2.2. Half-Cell Experiments
To measure the OCV of each electrode, half-cells are prepared in a 2032 coin cell format using the electrode materials harvested from the fresh cell of the selected cell type. This new cell is fully discharged to 2.5 V with C/10 current. It is then opened in an argon atmosphere inside a closed glove box to access the jellyroll following the systematic procedure described in Figure 4. Next, the PE and NE samples (active material on the current collectors) are collected from the inner layers of the jellyroll since outer layers experience greater physical stresses during the cell opening process. The active material on these samples is then cleared from one side of each current collector by dissolving the binder of the active material using N-methyl-2-pyrrolidone (NMP).
Six half-cell samples (03 NE-type units and 03 PE-type units) are prepared as described in [24] using a trilayer separator (Ø 19 mm and 25-μm-thickness, Celgard® 2325), LP50 (1-M LiPF6 solved in EC: EMC with 3:7 volume ratios) electrolyte and a lithium foil as a counter electrode. The capacity of each cell is estimated based on the specific capacity of the electrode active material (PE: 180 ± 5 mAh/g, NE: 370 ± 5 mAh/g [32]) and its mass calculated (PE: 38.8 mg, NE: 20.3 mg) from weights of the current collector with and without active material. The capacities of NE and PE half-cells are then theoretically found to be 7.5 ± 0.15 and 6.98 ± 0.16 mAh, respectively [32]. Based on this estimated capacities, the pre-conditioning test with C/10 charge/discharge currents are carried out to measure the actual half-cell capacity.
To support the half-cells OCV tests, Biologic BCS-805 potentiostats are employed and placed in a temperature-controlled room maintained at 25 °C. The potential ranges for the tests are set from 0 to 1 V and 2.8 to 4.3 V for the NE and PE half-cells, respectively. The selected voltage ranges are able to represent the full-cell OCV between 4.2 and 2.7 V [33] and could limit the electrode degradation during the OCV measurement [34,35].
The half-cells are first pre-conditioned for 6 cycles with C/10 current prior to the OCV measurement. Figure 5 shows the voltage, current and capacity profiles of the NE in the preconditioning cycles. The result indicates that the PE half-cells are consistent with their delivered capacity with less than a 0.2% capacity fade/cycle. Conversely, the capacity drop of NE half-cells is more than 0.5% in the first cycle and then reduced over the next cycles (below 0.2% in the sixth cycle). The average capacities delivered in the sixth preconditioning cycle by the NE and PE half-cells are measured to be 7.7 mAh and 7.1 mAh, respectively. A loading ration (LR = N/P = 7.7/7.1) of 1.08 indicates the NE half-cell is having 8% higher capacity than the PE half-cell [21].
The half-cells are then tested for OCV using the GITT procedure similar to the full-cell test procedure except for the voltage limits. Figure 6a,b shows the OCV profiles as a function of discharge capacities per gram for NE and PE half-cells, respectively. While Figure 6c,d shows the OCV profiles as functions of normalized capacities delivered by the NE half-cells (between 0.03 and 0.8 V) and PE half-cells (between 4.3 and 3.35 V). For each NE or PE half-cell group, the root mean square error (RMSE) between any two OCV profiles measured is less than 1 mV. This confirms that the reliability of OCV measurement method as well as the repeatability of the half-cell manufacturing process is acceptable.
The normalized capacity of an electrode can be expressed as the lithiation level (ratio of occupied to available lattice sites in a host structure, ranging from 0 to 1) since the capacity delivered by the electrode is proportional to its lithiation level [24]. As discussed within [9], to enable the degradation diagnostics, tested capacity range (or lithiation range) of the electrodes is normalized between 0 and 1. The relation between half-cell OCVs and lithiation level can be described as in Figure 6 where x refers to the lithiation and delithiation levels of the PE and NE, respectively.
3. Quantification Procedure of LAM and LLI
The theory underlying the LLI and LAM and their effects on the capacity and OCV of the cells and electrode utilization ranges is well covered in the literature [19,21] and will therefore not be addressed here in detail. In brief, LAM at an electrode reduces the available material for lithium intercalation and deintercalation, and thus decreases the electrode capacity. On the other hand, LLI due to parasitic reactions, such as SEI growth, lithium plating, etc. reduces the lithium inventory in a cell; accordingly, lowers the cyclable lithium between the electrodes. LLI or LAM affects the lithiation levels of the electrodes at the EoC and EoD and the capacity delivered between the EoC and EoD. This work presents the extensions of the previous work [9,21] and quantifies the LAM and LLI from the lithiation levels of the electrodes identified using the OCV curves.
For the quantification of LAM and LLI, the electrochemical behavior of the electrode is assumed to be unchanged during the cell aging, i.e., the OCV vs. lithiation of the electrode remains the same. Similar assumptions have been made within [21,33]. With this assumption, the OCV profiles of the electrodes are captured by using the harvested electrodes from a new full-cell.
To quantify LLI and LAM between two aging levels of a cell, identification of each electrode’s lithiation range used at each aging level is necessary. An approach to identify the used lithiation range by fitting the OCV of the full cell from the OCVs of the two electrodes is presented in Section 3.1. Next, the proposed quantification procedure of LAM and LLI using the identified lithiation use ranges of the electrodes is described in Section 3.2.
3.1. Cell OCV Fitting
3.1.1. Identify the Cell OCV Fitting Range
The full cells are characterized, in terms of OCV between 4.2 and 2.5 V. However, in this work, the cell OCV range used for the degradation analysis is limited within 4.2 and 3.3 V. As shown in Figure 7a, the relaxation behavior of the cell voltage is analyzed by tracking its variation towards the end of relaxation period to verify whether the selected one-hour relaxation period is sufficient for the battery to equilibrate resulting in the correct OCV measurements. When the OCV is above 3.3 V, the cell voltage changes in the last fifteen minutes of the rest period are well below 1 mV. This indicates that the battery has reached equilibrium and the OCV measurement is reliable. On the other hand, for OCV voltages below 3.3 V, the battery voltage change is still noticeable in the last 15 min of the 1-hour relaxation period, and thus the OCV measurement is less reliable. The reason for the insufficient 1 h relaxation time at lower SOCs can be explained by the anode overhang effect that deals with the lithium transfer between the active and passive parts of the anode as discussed within [36,37]. Further, improved relaxation at lower SOCs for the aged cell compared to the new cell (Figure 7a) indicates that the effect of anode overhang reduces as the cell ages [27].
Considering the relaxation behavior, cell voltage levels corresponding to the EoC and EoD are redefined as 4.2 and 3.3 V. Figure 7b shows that capacities delivered between these two limits for a cell (3.045 Ah against the total capacity of 3.196 Ah before the aging tests and 2.46 Ah against the total capacity of 2.53 Ah after the aging tests) represent more than 95% of the of total capacity.
The OCV profile against the delivered capacity between the EoC and EoD must be identified. At the full-cell level, OCV is measured (defined as Ecell_meas) in 120 equal intervals of capacity delivered (Qmeas), as shown earlier in Figure 1. Full cell capacity (Qmax) is the capacity delivered by the cell when discharged from 4.2 V to 2.5 V. The measured capacity vector and its corresponding OCV vector is represented as:
where Ecell_meas,i is the OCV of the full cell at the measured capacity level Qmeas,i, i = 1,2, …,121.
Qmeas = 0: Qmax/120: Qmax
Ecell_meas = Ecell_meas,1, Ecell_meas,2, …, Ecell_meas,121
A curve fitting method based on Root Mean Square Error (RMSE) and spline is applied to this measurement to represent Ecell_meas as a function of Qmeas as shown in Equation (1). The fitness using this function is less than 0.1 mV.
Ecell_meas = f1(Qmeas)
Since the OCV profiles between 4.2 and 3.3 V are of interest for the analysis in this work, the capacity delivered (Qmax_use) by the time the cell OCV reduced to 3.3 V is identified using Equation (2).
Qmax_use = f1−1(3.3)
Next, the delivered capacity within 4.2 and 3.3 V is normalized to define the SOCuse ranging from 1 to 0. From Equations (1) and (2), the OCV profile within 4.2 and 3.3 V (referred as Ecell where Ecell ⊆ Ecell_meas) can be then expressed as a function of SOCuse as:
Ecell = f1((1 − SOCuse)* Qmax_use)
3.1.2. Identification of Electrode OCV Use Range
For the full-cell OCV profile between the EoC and EoD limits, OCV profile range and lithiation limits for each electrode is identified to enable the degradation analysis. As detailed in Section 2.2, OCV of the PE is measured (tagged EPE) between 4.3 and 2.8 V at 120 steps of lithiation level (XPE) ranging from 0 to 1. Similarly, OCV of the NE is measured (tagged ENE) between 0 and 1 V in 120 steps of lithiation level (XNE) ranging from 1 to 0. The measured OCV profiles and lithiation levels are represented as:
where H stands for PE or NE and EH,i is the OCV of the PE or NE at the lithiation level, XH,i. The curve fitting approach used on the full cell OCV is applied to the vectors EH and XH to develop a fit function fH as represented by:
XPE = 0:1/120:1
XNE = 1: − 1/120:0
EH = EH,1, EH,1, …, EH,121
EH = fH(XH)
For the selected full cell OCV range, lithiation level of each electrode at the EoC and the EoD are defined as XH,EoC and XH,EoD respectively where H stands for NE or PE. The following iterative procedure (IP) is applied to obtain these four unknown lithiation levels from the multiple combinations within their range of 0 to 1.
IP Step 1: For a selected combination of lithiation limits and using Equation (4), OCV of each electrode (tagged as ÊH) as a function of cell level SOCuse is generated by:
ÊH,SOC = fH(XH,EoC + (XH,EoD − XH,EoC)*(1 − SOCuse))
Here, SOCuse = 1: −0.01:0
IP Step 2: The OCV of the full cell (Êcell) is subsequently calculated based on the OCVs of the PE and the NE between their identified lithiation limits according to:
Êcell,SOC = ÊPE,SOC − ÊNE,SOC
IP Step 3: The measured cell voltage and calculated voltage over the SOCuse range are compared using the RMSE:
The RSME depends on the four lithiation levels, i.e., XPE,EoC, XPE,EoD XNE,EoC and XNE,EoD. To identify the combination of lithiation limits that produces a least RMSE value, all the possible combinations of lithiation limits with a resolution of 0.001 between 0 and 1 are verified by repeating the IP steps one to three. Figure 8 summarizes the procedure to identify the lithiation limits of the electrodes.
3.2. Quantification of LAM and LLI
A simplified diagnostic method to quantify the degradation modes using lithiation utilization ranges of the electrodes at two different aging levels of a cell is developed for the quantification of LAM and LLI as explained in this section.
3.2.1. LLI Calculation
Lithium inventory (LI) of a cell at a working point is the sum of the lithium amounts at the PE (LIPE) and NE (LINE):
LI = LIPE + LINE
LI of an electrode is calculated using its current lithiation level and the capacity delivered by the electrode between its lithiation use range limits.
Figure 9a shows the XNE,EoC and XPE,EoC at EoC while Figure 9b shows the XNE,EoD and XPE,EoD at EoD for a cell before the aging tests using the procedure presented in Section 3.1.2. Here, the capacity delivered by the cell before the aging is 2.91 Ah, which is normalized to 1 unit of lithium transfer (Ltr) between the electrodes. The LI level of an electrode (LIA where A stands for PE or NE) at a working point can be then derived as:
where, Ccurr and Cpre are the capacities delivered by the cell at the current aging level and before aging tests, respectively.
Using Equation (9), LIPE and LINE of cell A1 are obtained as 0.029 and 1.103, respectively at the EoC. Then, the LI of the cell is calculated as 1.132 units using Equation (8). Application of this procedure to find the LI at the EoD also results in the same value at a given cell aging level since transfer of lithium from one electrode to the other does not change the total lithium present in the cell.
By comparing the full-cell LI levels at two different aging conditions, the LLI can be derived as:
where, LIpost and LIpre denote the full-cell LI levels after and before aging, respectively.
3.2.2. LAM Calculation
LAM indicates the percentage of active material lost between two different aging levels of a cell. This can be defined as:
where mA_pre and mA_post are the masses of an electrode before and after aging, respectively. Here, A stands for NE or PE. Here, the mass considered for the electrode refers to the active electrode material that is in contact with the current collector and excludes any residues of electrolyte or depositions of the SEI layer. Since the mass of active electrode material is proportional to the capacity it can deliver, Equation (12) can be represented as:
where CA_pre,max and CA_post,max are the maximum capacities delivered by the electrode NE or PE before and after aging, respectively. Since capacity supported by an electrode is in linear relation with its lithiation level, this maximum-capacity can be computed as:
here, XA_max is the maximum lithiation level of the electrode and ΔCA is the capacity delivered by the electrode NE or PE for a lithiation change of ΔXA. Thus, Equation (13) can be converted into a new form:
where, ΔCA_pre and ΔCA_post are the capacities delivered by the electrode before and after aging for a lithiation range utilization of ΔXA_pre and ΔXA_post, respectively.
Here, factor ΔC is the capacity delivered by the full-cell between the EoC and EoD and ΔX is obtained from the identified lithiation limits of the electrodes for the full-cell OCV profile between the EoC and EoD. Consequently, the LAM levels at the PE and NE are derived using Equation (15).
4. Degradation Analysis: Results and Discussion
4.1. Identification of Electrode Utilization Range
Following the procedure described in Section 3.1, useable ranges of the electrodes are identified for all the full-cells before and after their aging tests. For example, XPE,EoC, XPE,EoD XNE,EoC and XNE,EoD values of cell A1 before the aging test are identified as 0.95%, 93.2%, 86.95% and 8.45%, respectively. From this identified lithiation use ranges of the electrodes, the LR that indicates the electrode balance is calculated as 1.015 (N/P = 86/84.8). This vale is about 7% lower than the LR value identified from the electrode level capacities as discussed in Section 2.2. Results published by Birkl et al. [24] as well show this mismatch that show a LR value of 1.02 from the matching results for a new cell against the LR value of 1.15 (or 3.18 Ah/2.78 Ah) from the half-cell capacities. This mismatch may originate from two sources. First, at cell level, the electrodes can have different surface areas because of the differences in their lengths and widths [21]. While both the half-cells are prepared with same surface areas in this work. Second, both PE and NE half-cells are not tested for their respective entire voltage ranges to capture the actual capacity levels.
Figure 10a shows the comparison between the measured (dotted blue line) and the estimated result (green line) of the OCV and useable range of the electrodes (between the star points of the red line for the NE and purple line for the PE) of that set A’s cell. Further, to verify the quality of fitness, DV curves are compared (Figure 10b) for the measured and estimated cell voltages that show a close fit.
In addition, DV curve at the cell-level is compared with the DV curves of the electrodes to understand whether the cell-level DV can reveal the electrode-level degradation modes. Conventional degradation analysis using cell level DV or IC curves relies on the position and magnitude of local peaks and valleys of the curves. As can be seen from the DV curves in Figure 10b, two significant peaks from the NE DV curve marked as N1 and N2 are aligned with the cell level DV peaks C2 and C3. Meanwhile, only the peak P1 from the PE DV curve is aligned with the peak C1 of the cell DV curve. Other peaks P2 and P3 of the PE are not observable at the cell level DV curves due to the strong influence of NE peaks N1 and N2 (as per Figure 10b).
As discussed within [38], while using the cell level DV curve, at least two peaks for each electrode are necessary to quantify the degradation of the corresponding electrode. Since the position of the NE peaks (N1 and N2) can be identified with the full cell DV curves from the peaks C2 and C3, LAM at NE can be quantified (discussed in Section 4.2) using the DV curves at the cell level without the need for electrode level information. On the contrary, only one peak of the PE can be identified from the full cell DV curve. Hence, it is not possible to quantify the LAM at PE with the full cell DV curves alone. As a result, LLI quantification is also deemed to be not possible if LAM at PE occurs in the lithiated state.
Further, changes in the magnitude of a particular electrode peak cannot be identified from the corresponding cell level peak although their positions are aligned. For example, magnitude of the peak C2 that corresponds to peak N1 is the sum of the DV magnitudes of PE and NE at that position. Taking a simple case of a certain amount of LLI at the NE, the peak N1 whose magnitude is similar in both the aging levels can now occur at a different DV level of the PE. This can result in the change of peak C2 level although the magnitude of peak N1 is unchanged. Therefore, the changes in the magnitude of a peak at cell level DV curve as the cell ages cannot be attributed to the corresponding electrode peak when both the electrodes have a dynamic DV profiles. These drawbacks of the cell IC or DV curves is addressed by including the OCV profiles and lithiation limits of the electrodes.
Meanwhile, Figure 10c,d shows the voltage and DV curves with the fit data for the same cell after it lost 20% capacity through cycling. The results highlight that compared to the new cell (RMSE = 1.60 mV), the OCV fitting on the aged cell is less accurate (RMSE = 4.7 mV). Such results are seen across the cells as shown in Table 3. Similarly, mismatch in terms of DV curves between the measured and estimated cell voltages is significantly higher in the aged state (as seen Figure 10d) compared to its unused state (as seen Figure 10b).
One potential reason for the error increase for the aged cells is the changes in the electrochemical behavior of the electrodes. For the PE, the active electrode material NCA is a compound of nickel, cobalt, aluminum and oxygen. With the dissolution of Ni at the higher voltage levels of PE (>4.2 V) [39], structure of the electrode can change over the battery aging. This can modify the PE OCV profile. On the other hand, activation of passivated lithium depositions at the NE may influence it OCV profile. As per [37], a portion of the lithium dispositions that are electrically disconnected, but mechanically connected to the electrode may slowly establish electrical contact with the electrode after the fast-charging tests. This may influence the OCV profile measured immediately after the fast charge cycling since the GITT procedure with a low C-rate (C/20) discharge coupled with rest periods takes more than 120 h. Therefore, the negative electrode OCV vs. lithiation map may differ from the pristine NE electrode.
When fitting full-cell OCV of the aged cells, the half-cell OCVs collected on the electrodes harvested from a new cell are still used, and therefore it does not account the changes occurring to the electrodes. This may explain why the OCV fitting for the aged cells can have higher levels of fitting errors.
On the other hand, through the cycle aging, drop in the lithiation use rage of the PE (from 86% to 77.25%) or the LR level (from 1.015 to 0.915) is observed as seen from Figure 10a,c for the cell A1. This indicates that the cell has experienced LAM at the NE [21], although it does not allow quantifying the LAM directly.
4.2. Application of the Degradation Diagnostics
The selected cells are aged under two different conditions as presented in Section 2. set A cells are cycled under the plating induced conditions where the VRP method is used to confirm the occurrence of lithium plating. set B cells are cycled with the less aggressive charge profile where plating is not detected. Levels of degradation in terms of LLI, LAMNE and LAMPE for set A and set B cells are calculated as described in Section 3.2 and their values are shown in Figure 11a,b, respectively. Following observations have been obtained from that result:
- Higher levels of LLI (circa 19.4%) are observed for set A cells compared to set B cells (circa 7.3%) as shown in Figure 11. This could be explained through the following reasons. First, set A cells had higher levels of lithium plating (see Figure 3). Part of the plated lithium becomes irreversible, leading to LLI. Second, the increased LAM could raise the LLI level since LAM could occur in the lithiated state. Third, the plated lithium could crack the SEI layer, resulting in further growth of the SEI layer consuming cyclable lithium [40].
- Increased levels of LAM at the NE are observed under lithium plating. The LAM levels at NE of set A cells are significantly higher (an average of 16.2%, Figure 11) than those of set B cells (an average of 6.1%, Figure 11b). However, relatively low, the LAM levels in set B indicates that there could be some amount of lithium plating that is below the detectable level. As discussed within [29], the VRP method fails to detect lithium plating levels lower than 2.5%. Visual inspection of the electrodes (Figure 3) as detailed in Section 2.1 as well indicate relatively lower levels of lithium metal depositions in set B cells compared to that of set A cells.The LAM difference between the two sets as seen from Figure 11 indicates that higher the capacity fade under the influence of lithium plating, larger the LAM for two reasons. First, set A cells are charged with an aggressive current profile and found with much higher levels of lithium depositions and capacity fade compared to set B cells (see Figure 3). Second, other possible aging mechanisms such as binder decomposition and graphite exfoliation at the NE [41,42] that cause LAM may not induce such high levels of LAM given these cells are only tested for 52 cycles [4].In addition to the quantification of degradation modes using the proposed electrodes OCV profiles, IC–DV curves are also compared for degradation analysis. Figure 12a,b shows the evolution of IC and DV curves, respectively for the cell A1. In the DV curves, the cell capacity delivered between the peaks C2 and C3 is equal to the capacity delivered by the NE electrode between the peaks N1 and N2. Therefore, the percentage of capacity reduction between these peaks can be used to indicate the percentage of LAMNE. As seen from figure, the capacity between the peaks C2 and C3 has dropped by 15.6% (1.086 Ah compared to 1.285 Ah) which suggests that LAMNE is 15.6%. On the other hand, LAMNE estimated for the same cell using the electrode OCV profiles is 17.8%. The large levels of LAMNE calculated from both techniques highlights that mechanical stress has increased under lithium plating.Increased levels of LAM under the influence of lithium plating can originate from two possible sources. One, as discussed earlier, volume expansion due to the lithium metal depositions in the early cycles can raise the mechanical stresses within the cell and lead to LAM in the first moment. Second, as discussed within [43], formation of localized layers due to passivated lithium depositions or electrically isolated LAM in the early cycles may further increase the mechanical stresses locally which in turn can raise the LAM further.
- LAMNE is higher than LAMPE for each cell in set A (as per Figure 11) and the average LAMNE across the set A cells is 16.2% while the average LAMPE is only 8.9%. Since lithium plating occurs at the NE and metal depositions could stay between the NE and the separator, it can be reasonably assumed that the NE experiences higher levels of mechanical stresses compared to the PE ([3,12]). Therefore, it follows that mechanical stresses impact on the NE could be higher than the PE.
- The results also highlight that LAMNE levels are comparable to the LLI levels in the aged cells. For example, cell number one from set A lost 17.8% LAMNE and 19.4% LLI. LAM can occur in lithiated condition, which means LLI along with it or in the delithiated state. Since lithium plating occurs towards the end of charging or near to full lithiation of the electrode, mechanical stresses could rise remarkably in the lithiated state of NE. This could result in higher levels of LAM in the lithiated state (LAMliNE). As discussed within [44], the shift of valley points in the IC curve (*C2 and *C3) that correspond to the peaks C2 and C3 in the DV curve (or the peaks N1 and N2 of the NE) towards higher cell voltages (as seen from Figure 12a) as well indicates the dominance of LAMliNE. Therefore, significant levels of LLI may come from LAMliNE and the contribution of irreversible lithium plating to the total LLI can be much lower than the LLI from the LAM. This analysis indicates that most lithium plating can become reversible and LAMliNE can be a major result of lithium plating. However, this initial conclusion needs further study to quantify the LLI from LAM.
In summary, LLI and LAMNE are significant in the cells with lithium plating. These important findings help to confirm the theoretical understanding of increased mechanical stresses under lithium plating. Unlike the previous studies [4,12] indicating that LLI is the dominant outcome of lithium plating, this study demonstrates that LAMliNE is the most critical degradation mode under the influence of lithium plating. This observation is useful in improving the knowledge about lithium plating and its influence on the battery aging and consequently helpful in deriving fast charging strategies.
4.3. Research Challenges and Future Work
4.3.1. Impact of Electrode Degradation
As the battery degrades the RMSE of OCV fitting started rising. There is a possibility of electrochemical changes in the electrodes that could affect the results because the method depends on the OCV measurements using the electrodes harvested from a new cell. The electrochemical changes such as structural changes in the electrode can modify their OCV profiles that may be affecting the fitting results. In addition, these electrochemical changes may affect the accuracy of the degradation modes estimation. To confirm the reason behind the increased fitting errors for the aged cells and to assess the influence of electrochemical changes on the quantification accuracy of the degradation modes, a further half-cell OCV comparative study on both new and aged cells is needed.
4.3.2. Impact of Lithium Metal Depositions
This work found that material cracking in the form of LAM at the NE increases under lithium plating. Based on this principle, it is assumed that previous lithium plating occurrence could continue to cause damage to the battery. However, a further study is needed to confirm whether lithium plating has a long-lasting impact on battery degradation.
4.3.3. Loading Ration Mismatch
As mentioned in Section 4.1, there is a mismatch between the LR values identified from the electrode level capacities and matching results. Identifying and accounting the sources that contribute to mismatch will help to affirm the matching procedure employed. Further study is required to quantify the surface areas and capacities of both the electrodes in a full-cell and include the LR factor in the matching procedure accordingly.
5. Conclusions
Different aging mechanisms such as SEI growth, lithium plating and mechanical stresses in lithium-ion cells are known to result in three classifications of degradation modes, namely: LLI, LAMPE and LAMNE. Quantification of these modes can help in identifying the underlying damage to the cell under selected operating conditions such as low temperatures or high charge currents. This work has proposed a two-stage method to simplify the quantification process of these degradation modes. First, using the OCV profiles of a cell and its electrodes, utilization voltage range of each electrode are identified. This procedure is applied to the cell at two different aging levels. Second, quantification of degradation modes is carried out based on the identified electrode utilization ranges and the capacities delivered at two different aging levels. LLI is calculated based on the changes to the lithium inventory present in the cell. On the other hand, LAM at each electrode is derived using its scaling effect on the electrode utilization range. The authors assert that the presented diagnostic technique has potential for applications to other lithium-ion cells using different chemistries.
For the first time, this procedure of quantifying the degradation modes using the OCV measurements and capacities is applied to a cell aged under lithium plating. Previously, LLI is considered as a dominant degradation mode under lithium plating. However, the results in this work highlight that lithium plating results in significant LAMNE in addition to the LLI. This confirms that lithium plating raises the mechanical stresses in the cell. This study, therefore, underpins a better understanding of lithium plating, supporting the future development of optimal charging protocols to minimize battery degradation.
Author Contributions
The Conceptualization, U.R.K., T.Q.D. and J.M.; methodology, U.R.K. and A.R.; validation, U.R.K.; formal analysis, U.R.K.; investigation, S.M. and C.T.; resources, J.M.; data curation, U.R.K.; writing—original draft preparation, U.R.K.; writing—review and editing, J.M. and T.Q.D.; supervision, J.M. and T.Q.D. All authors have read and agreed to the published version of the manuscript.
Funding
This research received no external funding.
Conflicts of Interest
The authors declare no conflicts of interest.
Abbreviations
| BMS | Battery management system |
| CC–CV | Constant current followed by constant voltage |
| DV | Differential voltage |
| EV | Electric vehicle |
| IC | Incremental capacity |
| LAM | Loss of active material |
| LFP | Lithium iron phosphate |
| LI | Lithium inventory |
| LLI | Loss of lithium inventory |
| NCA | Lithium nickel cobalt aluminum oxide |
| NE | Negative electrode |
| NEP | Negative electrode potential |
| NMC | Nickel manganese cobalt oxide |
| OCV | Open circuit voltage |
| SEI | Solid electrolyte interface |
| SOH | State of health |
| SOC | State of charge |
| VRP | Voltage relaxation profile |
References
- Anseán, D.; Gonzalez, M.; Viera, J.C.; García, V.; Blanco, C.; Valledor, M. Fast charging technique for high power lithium iron phosphate batteries: A cycle life analysis. J. Power Sources 2013, 239, 9–15. [Google Scholar] [CrossRef]
- Guo, Z.; Liaw, B.; Qiu, X.; Gao, L.; Zhang, C. Optimal charging method for lithium ion batteries using a universal voltage protocol accommodating aging. J. Power Sources 2015, 274, 957–964. [Google Scholar] [CrossRef]
- Legrand, N.; Knosp, B.; Desprez, P.; Lapicque, F.; Raël, S. Physical characterization of the charging process of a Li-ion battery and prediction of Li plating by electrochemical modelling. J. Power Sources 2014, 245, 208–216. [Google Scholar] [CrossRef]
- Anseán, D.; Dubarry, M.; Devie, A.; Liaw, B.; García, V.; Viera, J.; González, M. Operando lithium plating quantification and early detection of a commercial LiFePO4 cell cycled under dynamic driving schedule. J. Power Sources 2017, 356, 36–46. [Google Scholar] [CrossRef] [Green Version]
- Yang, X.-G.; Leng, Y.; Zhang, G.; Ge, S.; Wang, C.-Y. Modeling of lithium plating induced aging of lithium-ion batteries: Transition from linear to nonlinear aging. J. Power Sources 2017, 360, 28–40. [Google Scholar] [CrossRef]
- Smart, M.C.; Ratnakumar, B.V. Effects of Electrolyte Composition on Lithium Plating in Lithium-Ion Cells. J. Electrochem. Soc. 2011, 158, A379. [Google Scholar] [CrossRef]
- Waldmann, T.; Hogg, B.-I.; Kasper, M.; Grolleau, S.; Couceiro, C.G.; Trad, K.; Matadi, B.P.; Wohlfahrt-Mehrens, M. Interplay of Operational Parameters on Lithium Deposition in Lithium-Ion Cells: Systematic Measurements with Reconstructed 3-Electrode Pouch Full Cells. J. Electrochem. Soc. 2016, 163, A1232–A1238. [Google Scholar] [CrossRef]
- Vetter, J.; Novak, P.; Wagner, M.; Veit, C.; Möller, K.-C.; Besenhard, J.; Winter, M.; Wohlfahrt-Mehrens, M.; Vogler, C.; Hammouche, A. Ageing mechanisms in lithium-ion batteries. J. Power Sources 2005, 147, 269–281. [Google Scholar] [CrossRef]
- Birkl, C.R.; Roberts, M.R.; McTurk, E.; Bruce, P.G.; Howey, D.A. Degradation diagnostics for lithium ion cells. J. Power Sources 2017, 341, 373–386. [Google Scholar] [CrossRef]
- Sarasketa-Zabala, E.; Aguesse, F.; Villarreal, I.; Rodríguez-Martínez, L.M.; López, C.M.; Kubiak, P. Understanding Lithium Inventory Loss and Sudden Performance Fade in Cylindrical Cells during Cycling with Deep-Discharge Steps. J. Phys. Chem. C 2014, 119, 896–906. [Google Scholar] [CrossRef]
- Waldmann, T.; Hogg, B.-I.; Wohlfahrt-Mehrens, M. Li plating as unwanted side reaction in commercial Li-ion cells—A review. J. Power Sources 2018, 384, 107–124. [Google Scholar] [CrossRef]
- Uhlmann, C.; Illig, J.; Ender, M.; Schuster, R.; Ivers-Tiffée, E. In situ detection of lithium metal plating on graphite in experimental cells. J. Power Sources 2015, 279, 428–438. [Google Scholar] [CrossRef]
- Park, H.; Yoon, T.; Kim, Y.; Gil Lee, J.; Kim, J.; Kim, H.-S.; Ryu, J.H.; Kim, J.J.; Oh, S.M.; Lee, J.G. Thermal Behavior of Solid Electrolyte Interphase Films Deposited on Graphite Electrodes with Different States-of-Charge. J. Electrochem. Soc. 2015, 162, A892–A896. [Google Scholar] [CrossRef]
- Collins, J.; Gourdin, G.; Foster, M.; Qu, D. Carbon surface functionalities and SEI formation during Li intercalation. Carbon 2015, 92, 193–244. [Google Scholar] [CrossRef]
- Bitzer, B.; Gruhle, A. A new method for detecting lithium plating by measuring the cell thickness. J. Power Sources 2014, 262, 297–302. [Google Scholar] [CrossRef]
- Dubarry, M.; Truchot, C.; Liaw, B.; Gering, K.; Sazhin, S.; Jamison, D.; Michelbacher, C. Evaluation of commercial lithium-ion cells based on composite positive electrode for plug-in hybrid electric vehicle applications. Part II. Degradation mechanism under 2C cycle aging. J. Power Sources 2011, 196, 10336–10343. [Google Scholar] [CrossRef]
- Dubarry, M.; Truchot, C.; Cugnet, M.; Liaw, B.Y.; Gering, K.; Sazhin, S.; Jamison, D.; Michelbacher, C. Evaluation of commercial lithium-ion cells based on composite positive electrode for plug-in hybrid electric vehicle applications. Part I: Initial characterizations. J. Power Sources 2011, 196, 10328–10335. [Google Scholar] [CrossRef]
- Petzl, M.; Kasper, M.; Danzer, M.A. Lithium plating in a commercial lithium-ion battery—A low-temperature aging study. J. Power Sources 2015, 275, 799–807. [Google Scholar] [CrossRef]
- Dubarry, M.; Liaw, B. Identify capacity fading mechanism in a commercial LiFePO4 cell. J. Power Sources 2009, 194, 541–549. [Google Scholar] [CrossRef]
- Smith, A.J.; Dahn, J.R. Delta Differential Capacity Analysis. J. Electrochem. Soc. 2012, 159, A290–A293. [Google Scholar] [CrossRef]
- Dubarry, M.; Truchot, C.; Liaw, B. Synthesize battery degradation modes via a diagnostic and prognostic model. J. Power Sources 2012, 219, 204–216. [Google Scholar] [CrossRef]
- Koleti, U.R.; Zhang, C.; Malik, R.; Dinh, T.Q.; Marco, J. The development of optimal charging strategies for lithium-ion batteries to prevent the onset of lithium plating at low ambient temperatures. J. Energy Storage 2019, 24, 100798. [Google Scholar] [CrossRef]
- Stroe, D.-I.; Swierczynski, M.J.; Stroe, A.-I.; Kær, S.K. Generalized Characterization Methodology for Performance Modelling of Lithium-Ion Batteries. Batteries 2016, 2, 37. [Google Scholar] [CrossRef] [Green Version]
- Birkl, C.R.; McTurk, E.; Roberts, M.R.; Bruce, P.G.; Howey, D.A. A Parametric Open Circuit Voltage Model for Lithium Ion Batteries. J. Electrochem. Soc. 2015, 162, A2271–A2280. [Google Scholar] [CrossRef] [Green Version]
- Waldmann, T.; Kasper, M.; Wohlfahrt-Mehrens, M. Optimization of Charging Strategy by Prevention of Lithium Deposition on Anodes in high-energy Lithium-ion Batteries—Electrochemical Experiments. Electrochim. Acta 2015, 178, 525–532. [Google Scholar] [CrossRef]
- Keil, P.; Jossen, A. Charging protocols for lithium-ion batteries and their impact on cycle life—An experimental study with different 18650 high-power cells. J. Energy Storage 2016, 6, 125–141. [Google Scholar] [CrossRef]
- Wilhelm, J.; Seidlmayer, S.; Keil, P.; Schuster, J.; Kriele, A.; Gilles, R.; Jossen, A. Cycling capacity recovery effect: A coulombic efficiency and post-mortem study. J. Power Sources 2017, 365, 327–338. [Google Scholar] [CrossRef]
- Koleti, U.R.; Zhang, C.; Quang Dinh, T.; Marco, J.; Amietszajew, T.; Malik, R. A new concept to improve the lithium plating detection sensitivity in lithium-ion batteries. Int. J. Smart Grid Clean Energy 2019, 8, 505–516. [Google Scholar]
- Von Lüders, C.; Zinth, V.; Erhard, S.V.; Osswald, P.J.; Hofmann, M.; Gilles, R.; Jossen, A. Lithium plating in lithium-ion batteries investigated by voltage relaxation and in situ neutron diffraction. J. Power Sources 2017, 342, 17–23. [Google Scholar] [CrossRef]
- Bach, T.; Schuster, S.F.; Fleder, E.; Müller, J.; Brand, M.J.; Lorrmann, H.; Jossen, A.; Sextl, G. Nonlinear aging of cylindrical lithium-ion cells linked to heterogeneous compression. J. Energy Storage 2016, 5, 212–223. [Google Scholar] [CrossRef]
- Gallagher, K.G.; Dees, D.W.; Jansen, A.; Abraham, D.P.; Kang, S.-H. A Volume Averaged Approach to the Numerical Modeling of Phase-Transition Intercalation Electrodes Presented for LixC6. J. Electrochem. Soc. 2012, 159, A2029–A2037. [Google Scholar] [CrossRef]
- Nitta, N.; Wu, F.; Lee, J.T.; Yushin, G. Li-ion battery materials: Present and future. Mater. Today 2015, 18, 252–264. [Google Scholar] [CrossRef]
- Lu, T.; Luo, Y.; Zhang, Y.; Luo, W.; Yan, L.; Xie, J. Degradation Analysis of Commercial Lithium-Ion Battery in Long-Term Storage. J. Electrochem. Soc. 2017, 164, A775–A784. [Google Scholar] [CrossRef]
- Ge, H.; Aoki, T.; Ikeda, N.; Suga, S.; Isobe, T.; Li, Z.; Tabuchi, Y.; Zhang, J. Investigating Lithium Plating in Lithium-Ion Batteries at Low Temperatures Using Electrochemical Model with NMR Assisted Parameterization. J. Electrochem. Soc. 2017, 164, A1050–A1060. [Google Scholar] [CrossRef]
- Stiaszny, B.; Ziegler, J.C.; Krauß, E.E.; Zhang, M.; Schmidt, J.P.; Ivers-Tiffée, E. Electrochemical characterization and post-mortem analysis of aged LiMn2O4–NMC/graphite lithium ion batteries part II: Calendar aging. J. Power Sources 2014, 258, 61–75. [Google Scholar] [CrossRef]
- Lewerenz, M.; Warnecke, A.; Sauer, D.U. Introduction of capacity difference analysis (CDA) for analyzing lateral lithium-ion flow to determine the state of covering layer evolution. J. Power Sources 2017, 354, 157–166. [Google Scholar] [CrossRef]
- Epding, B.; Rumberg, B.; Jahnke, H.; Stradtmann, I.; Kwade, A. Investigation of significant capacity recovery effects due to long rest periods during high current cyclic aging tests in automotive lithium ion cells and their influence on lifetime. J. Energy Storage 2019, 22, 249–256. [Google Scholar] [CrossRef]
- Han, X.; Ouyang, M.; Lu, L.; Li, J.; Zheng, Y.; Li, Z. A comparative study of commercial lithium ion battery cycle life in electrical vehicle: Aging mechanism identification. J. Power Sources 2014, 251, 38–54. [Google Scholar] [CrossRef]
- Mohanty, D.; Dahlberg, K.; King, D.M.; David, L.; Sefat, A.S.; Wood, D.L.; Daniel, C.; Dhar, S.; Mahajan, V.; Lee, M.; et al. Modification of Ni-Rich FCG NMC and NCA Cathodes by Atomic Layer Deposition: Preventing Surface Phase Transitions for High-Voltage Lithium-Ion Batteries. Sci. Rep. 2016, 6, 26532. [Google Scholar] [CrossRef] [Green Version]
- Petzl, M.; Danzer, M.A. Nondestructive detection, characterization, and quantification of lithium plating in commercial lithium-ion batteries. J. Power Sources 2014, 254, 80–87. [Google Scholar] [CrossRef]
- Sethuraman, V.; Van Winkle, N.; Abraham, D.; Bower, A.; Guduru, P.R. Real-time stress measurements in lithium-ion battery negative-electrodes. J. Power Sources 2012, 206, 334–342. [Google Scholar] [CrossRef] [Green Version]
- Choi, J.; Ryou, M.-H.; Son, B.; Song, J.; Park, J.-K.; Cho, K.Y.; Lee, Y.M. Improved high-temperature performance of lithium-ion batteries through use of a thermally stable co-polyimide-based cathode binder. J. Power Sources 2014, 252, 138–143. [Google Scholar] [CrossRef]
- Lewerenz, M.; Warnecke, A.; Sauer, D.U. Post-mortem analysis on LiFePO 4 |Graphite cells describing the evolution & composition of covering layer on anode and their impact on cell performance. J. Power Sources 2017, 369, 122–132. [Google Scholar] [CrossRef]
- Marongiu, A.; Nlandi, N.; Rong, Y.; Sauer, D.U. On-board capacity estimation of lithium iron phosphate batteries by means of half-cell curves. J. Power Sources 2016, 324, 158–169. [Google Scholar] [CrossRef]
Figure 1.
Open-circuit voltage (OCV) measurement on cell A1 by incremental discharge and subsequent relaxation: (a) Cell voltage and OCV measurements; (b): incremental discharge current; (c): cell OCV as a function of capacity.
Figure 1.
Open-circuit voltage (OCV) measurement on cell A1 by incremental discharge and subsequent relaxation: (a) Cell voltage and OCV measurements; (b): incremental discharge current; (c): cell OCV as a function of capacity.

Figure 2.
Cell cycling: cell voltage relaxation profiles in post-charge for (a) cell A1; (b) cell B1 and (c) evolution of average capacity retention levels with cycle number for set A and set B cells.
Figure 2.
Cell cycling: cell voltage relaxation profiles in post-charge for (a) cell A1; (b) cell B1 and (c) evolution of average capacity retention levels with cycle number for set A and set B cells.
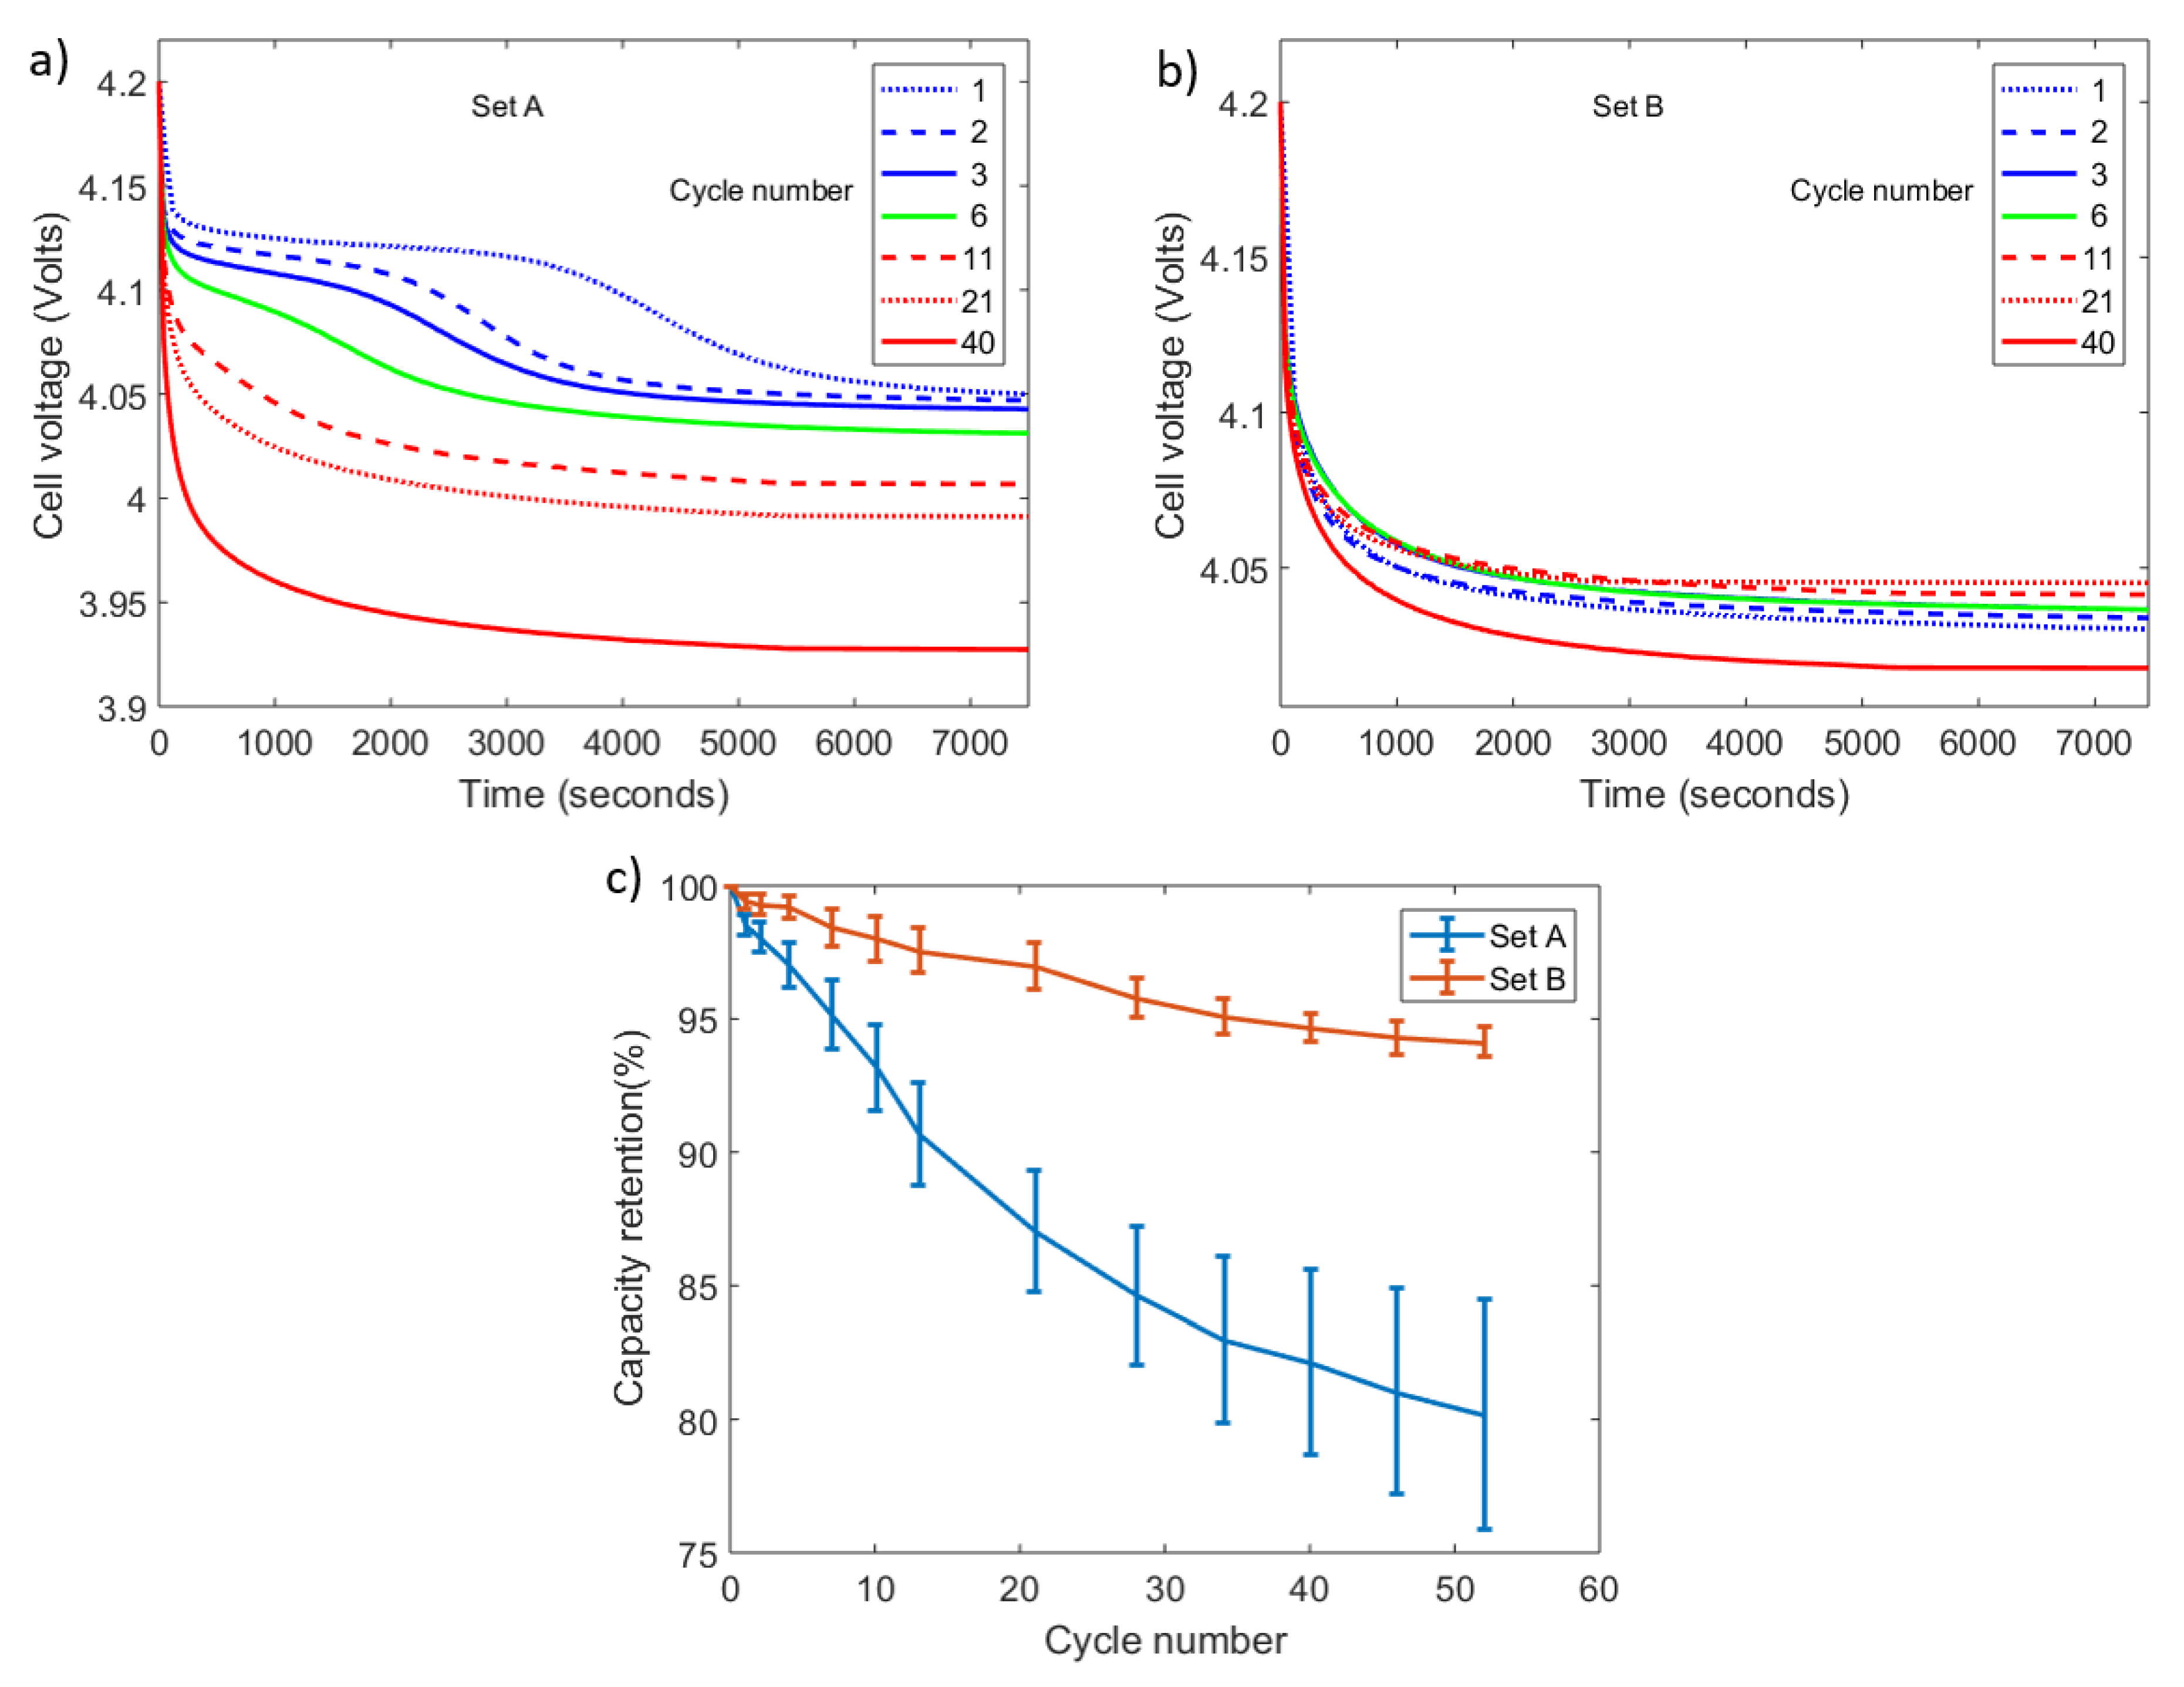
Figure 3.
Photographs of graphite electrodes: (a) new cell; (b) cell B; (c) cell A.
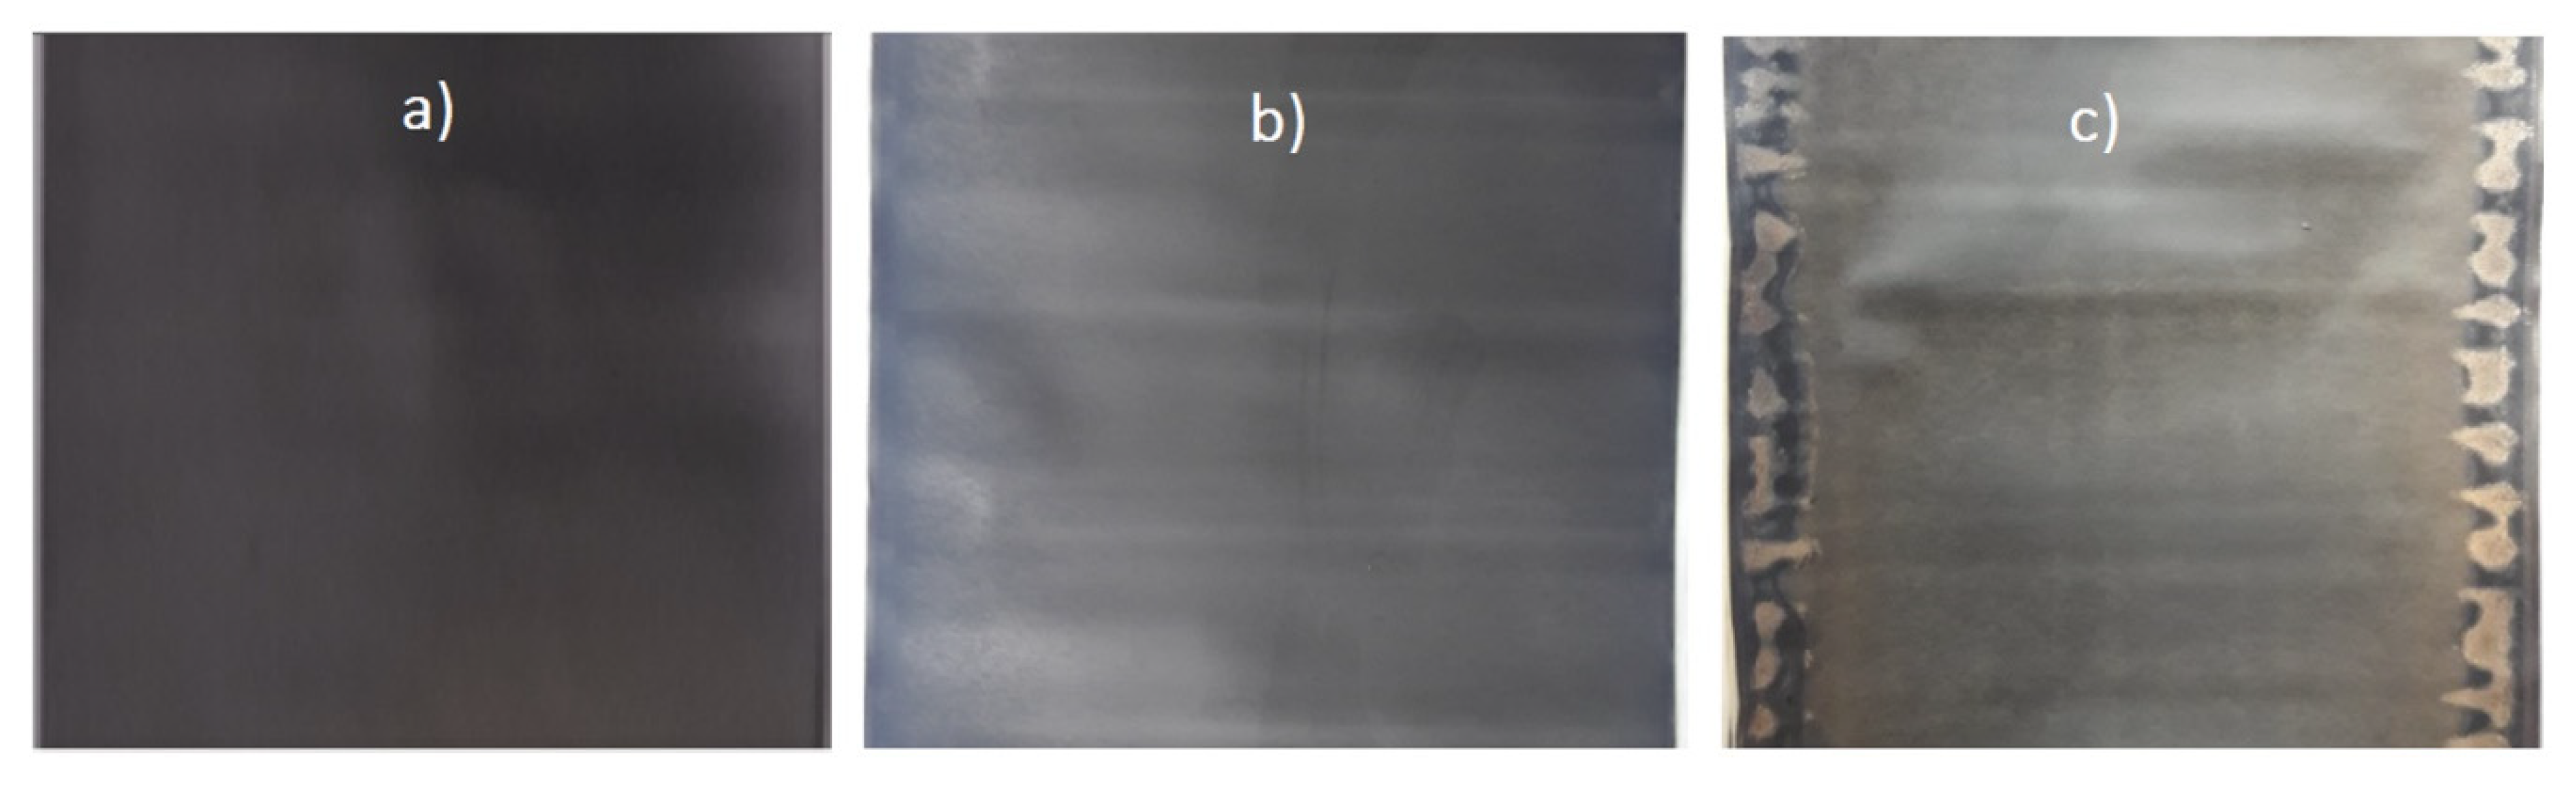
Figure 4.
The 18650 cell opening process illustration.
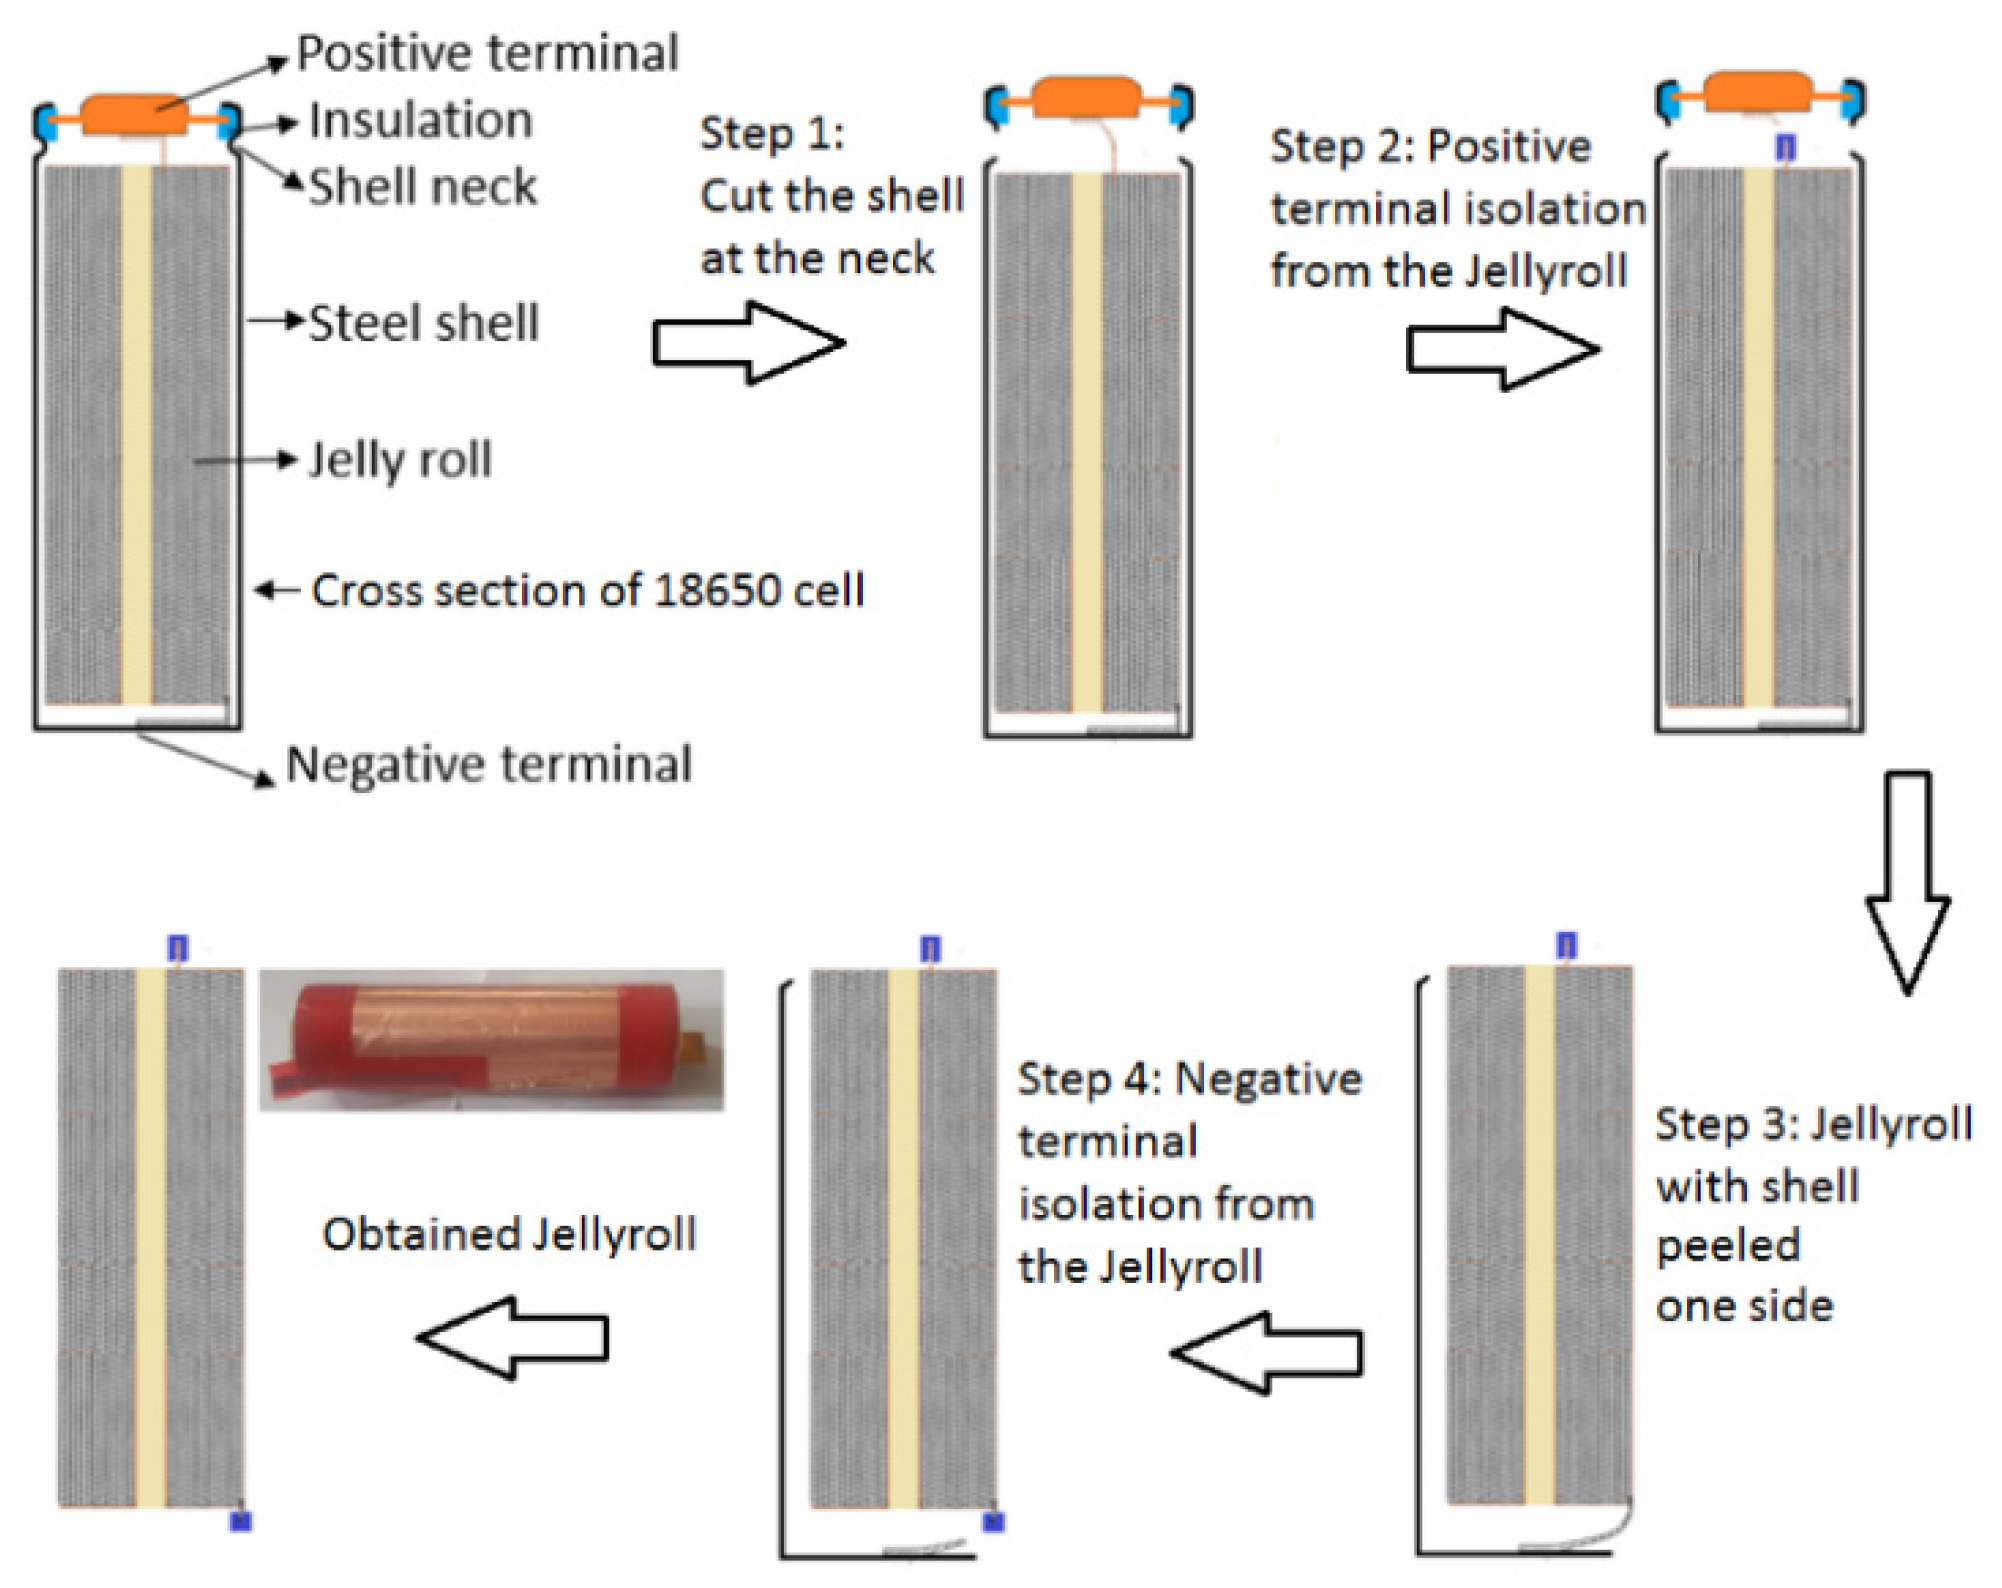
Figure 5.
Half-cell preconditioning: (a) voltage, (b) current and (c) capacity profiles measured on a negative electrode (NE) half-cell whose active electrode mass is 20.21 mg. Positive currents and capacities indicate the discharge or delithiation of the electrode.
Figure 5.
Half-cell preconditioning: (a) voltage, (b) current and (c) capacity profiles measured on a negative electrode (NE) half-cell whose active electrode mass is 20.21 mg. Positive currents and capacities indicate the discharge or delithiation of the electrode.

Figure 6.
OCV profiles: OCV vs. discharge capacity profile of a (a) NE and (b) PE half-cell; OCV vs. normalized capacity for (c) NE and (d) PE half-cells.
Figure 6.
OCV profiles: OCV vs. discharge capacity profile of a (a) NE and (b) PE half-cell; OCV vs. normalized capacity for (c) NE and (d) PE half-cells.
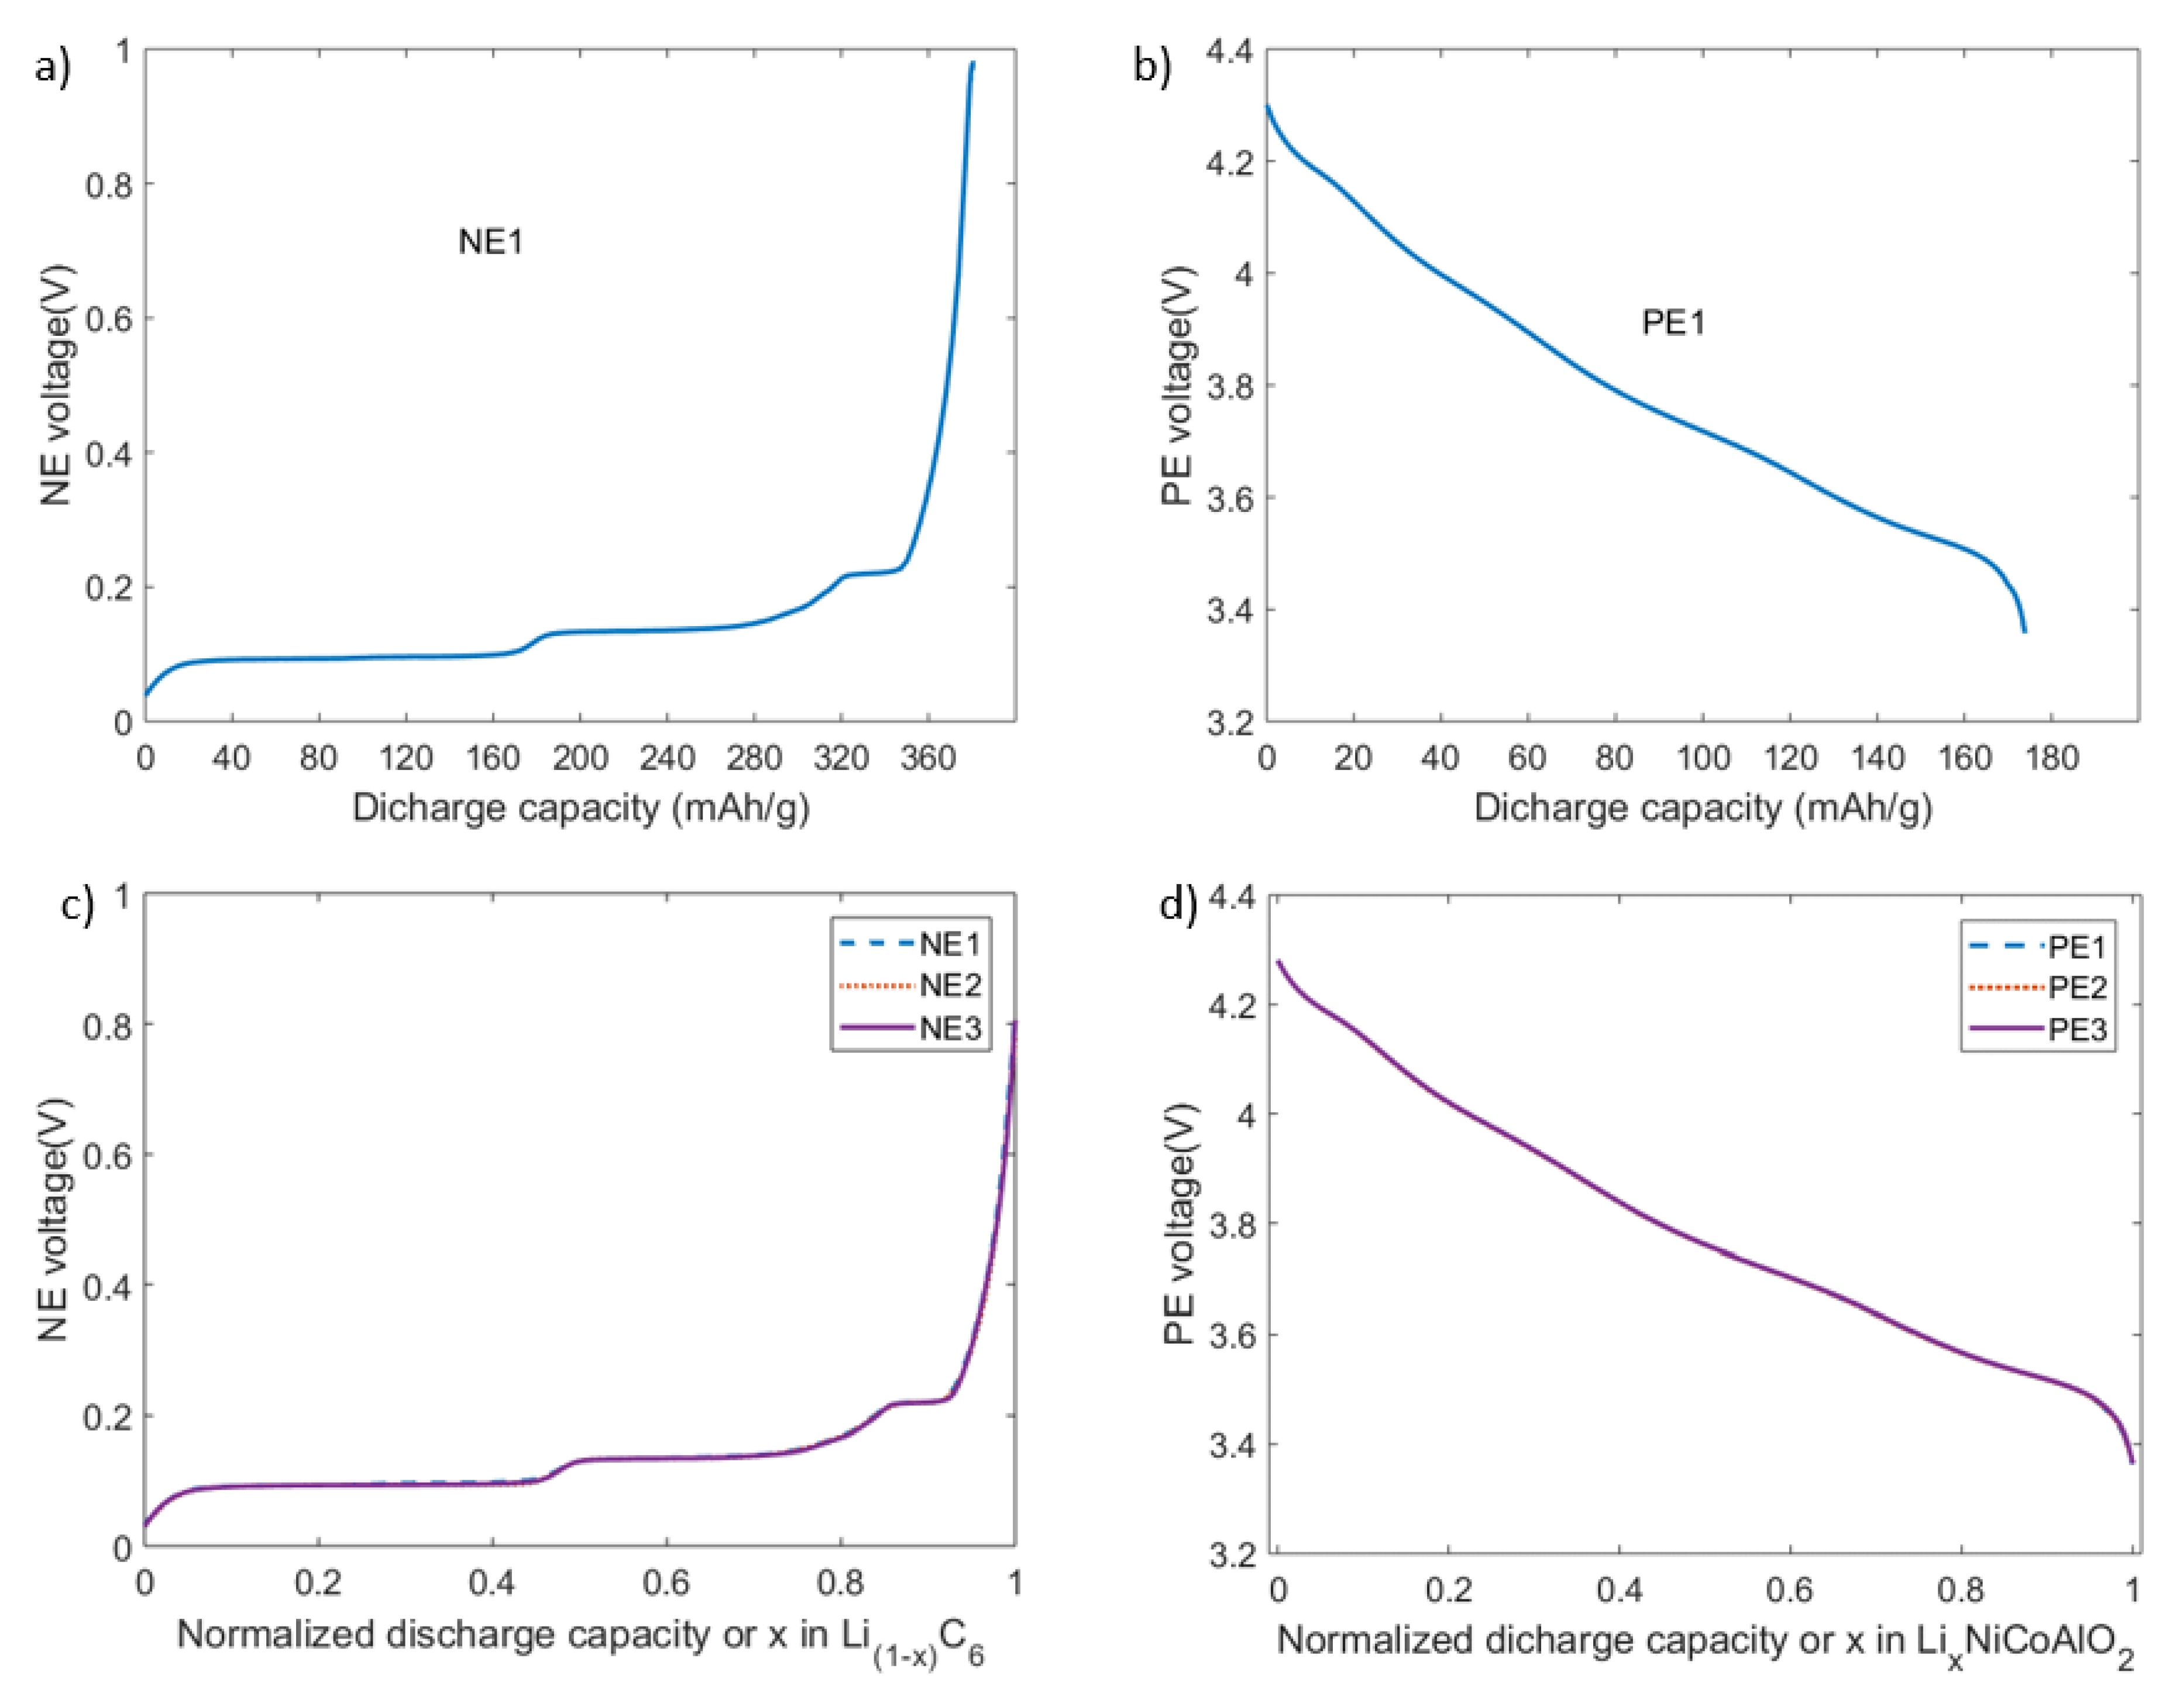
Figure 7.
Full-cell OCV range selection. (a) Change in cell voltage in the last fifteen minutes of the one-hour relaxation during OCV characterization; (b) cell OCV vs. delivered capacity and the selected voltage range (between the two red dots) for cell A1.
Figure 7.
Full-cell OCV range selection. (a) Change in cell voltage in the last fifteen minutes of the one-hour relaxation during OCV characterization; (b) cell OCV vs. delivered capacity and the selected voltage range (between the two red dots) for cell A1.
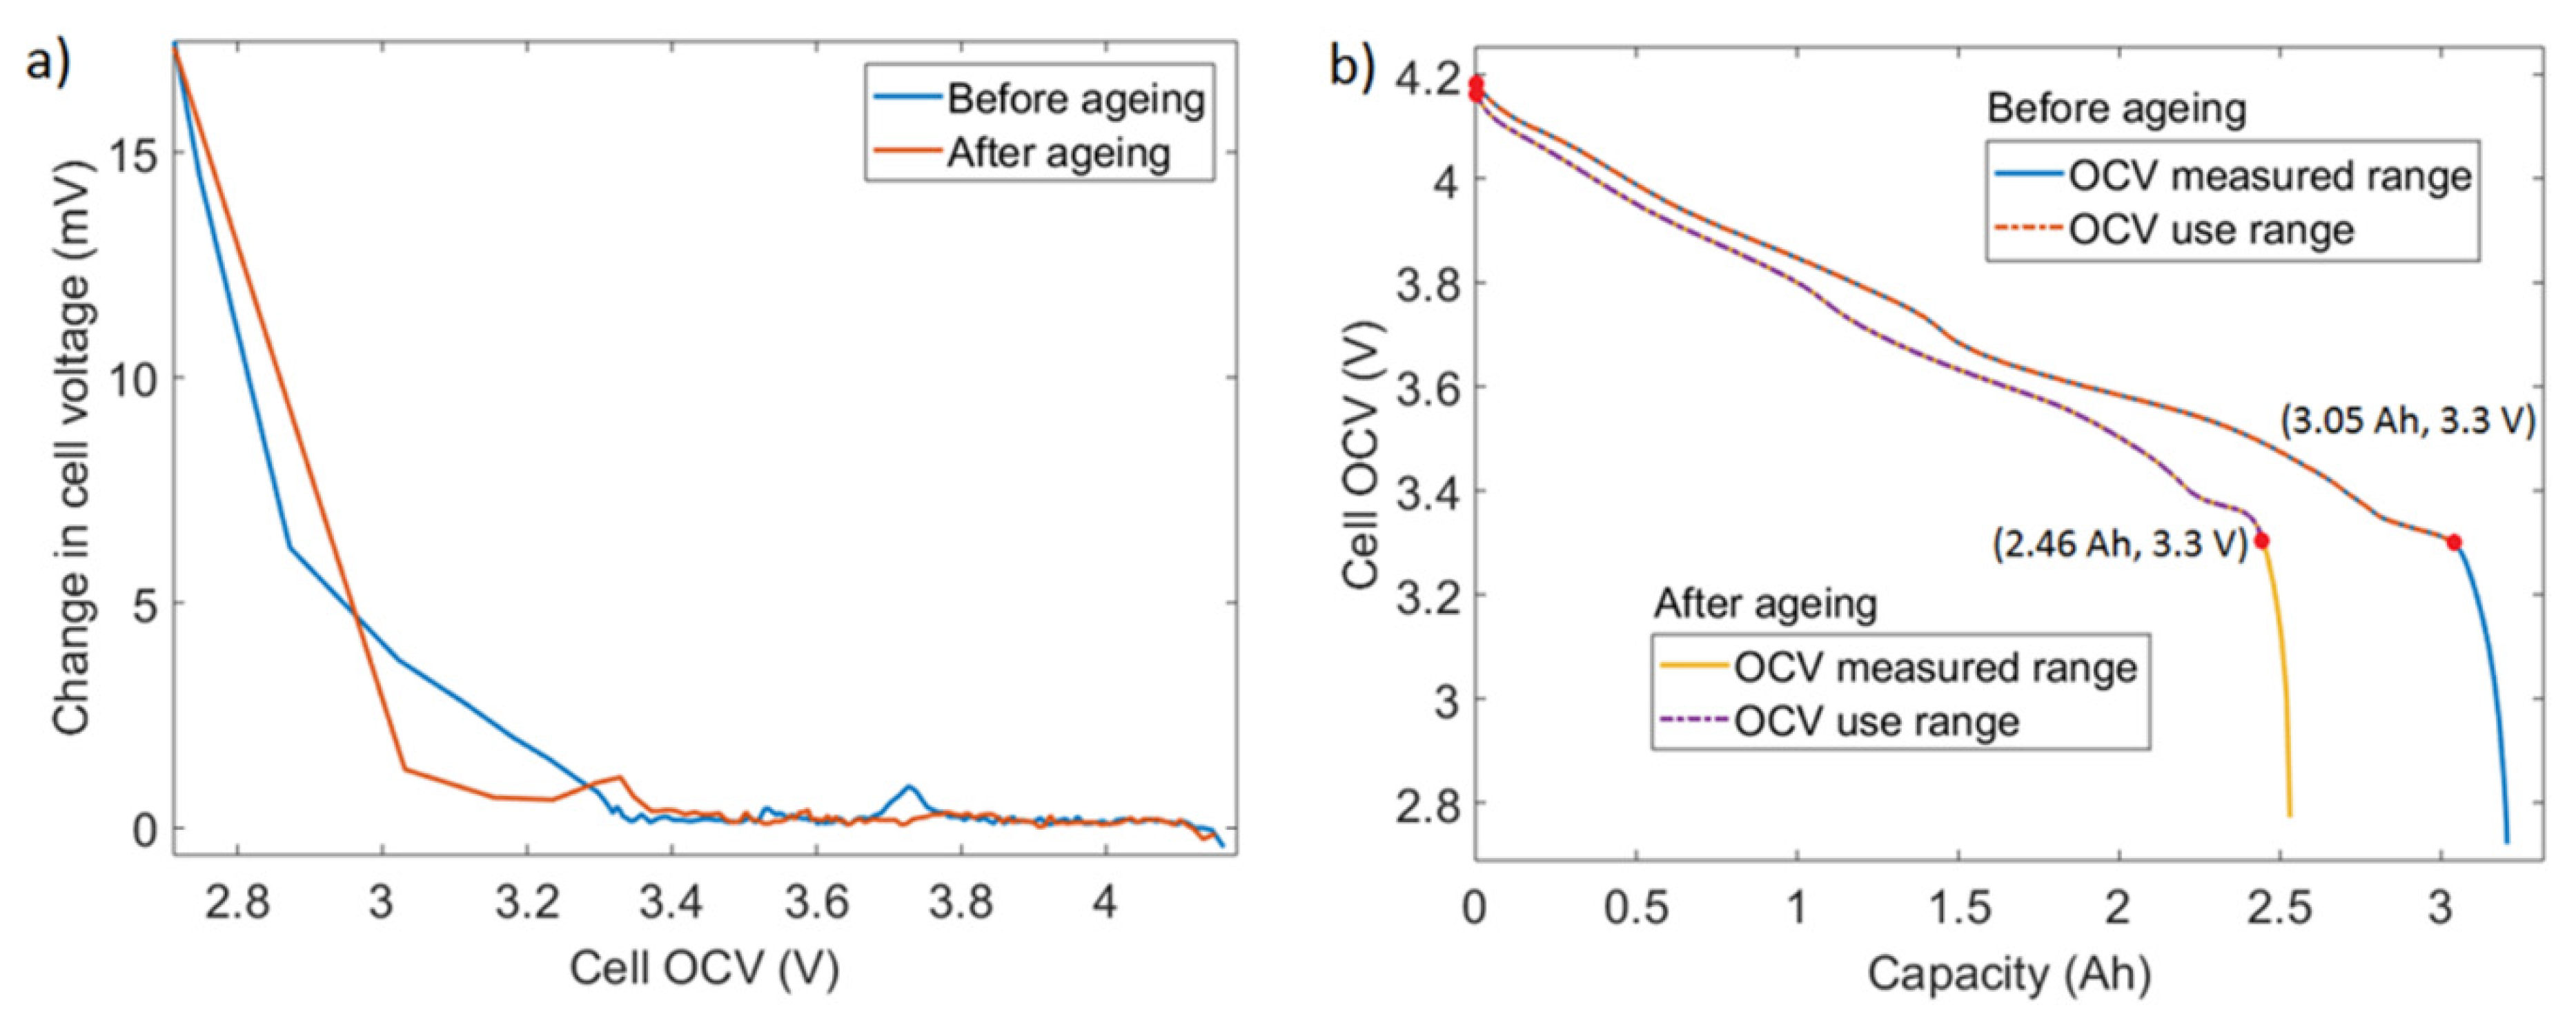
Figure 8.
Flow chart for the identification of electrode utilization ranges.

Figure 9.
Lithiation levels of PE and NE for cell A1 at: (a) charged state (EoC) and (b) discharged state (EoD).
Figure 9.
Lithiation levels of PE and NE for cell A1 at: (a) charged state (EoC) and (b) discharged state (EoD).
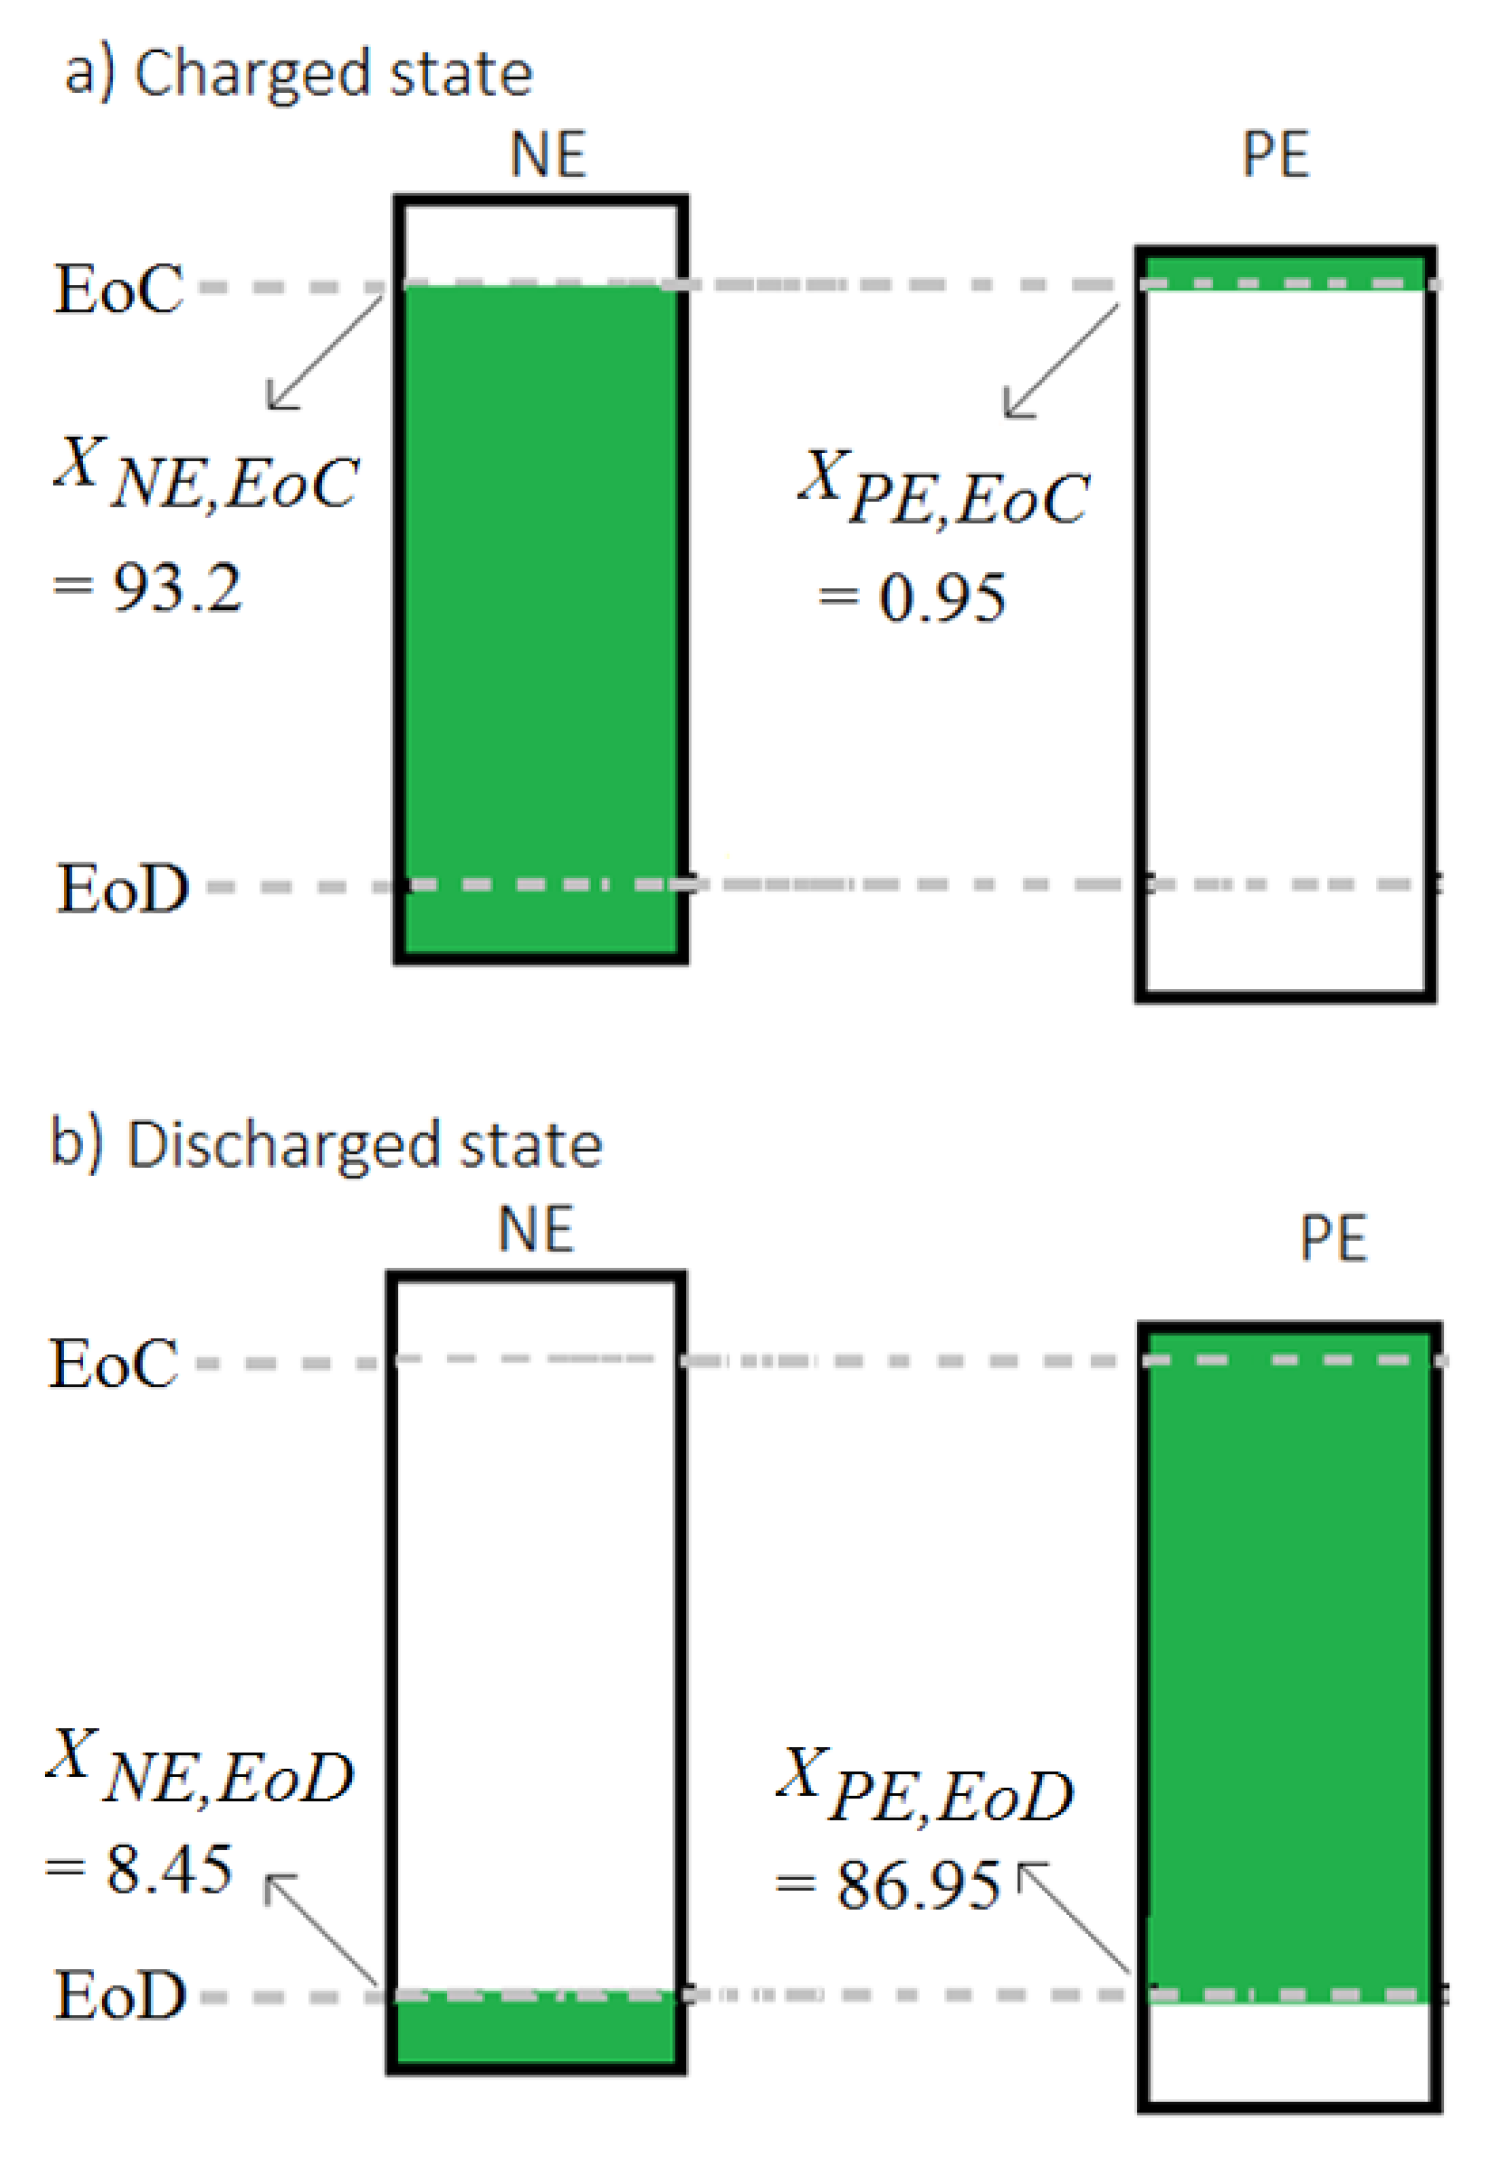
Figure 10.
Results of electrode capacity range fitting on cell A1. (a) voltage and (b) differential voltage (DV)-matching prior to the aging; (c) voltage and (d) DV-matching after the aging. The start marks with values indicate the electrode lithiation levels at the EoC and EoD.
Figure 10.
Results of electrode capacity range fitting on cell A1. (a) voltage and (b) differential voltage (DV)-matching prior to the aging; (c) voltage and (d) DV-matching after the aging. The start marks with values indicate the electrode lithiation levels at the EoC and EoD.

Figure 11.
Loss of active material (LAM) and lithium inventory (LLI) levels: (a) set A cells; (b) set B cells.
Figure 11.
Loss of active material (LAM) and lithium inventory (LLI) levels: (a) set A cells; (b) set B cells.
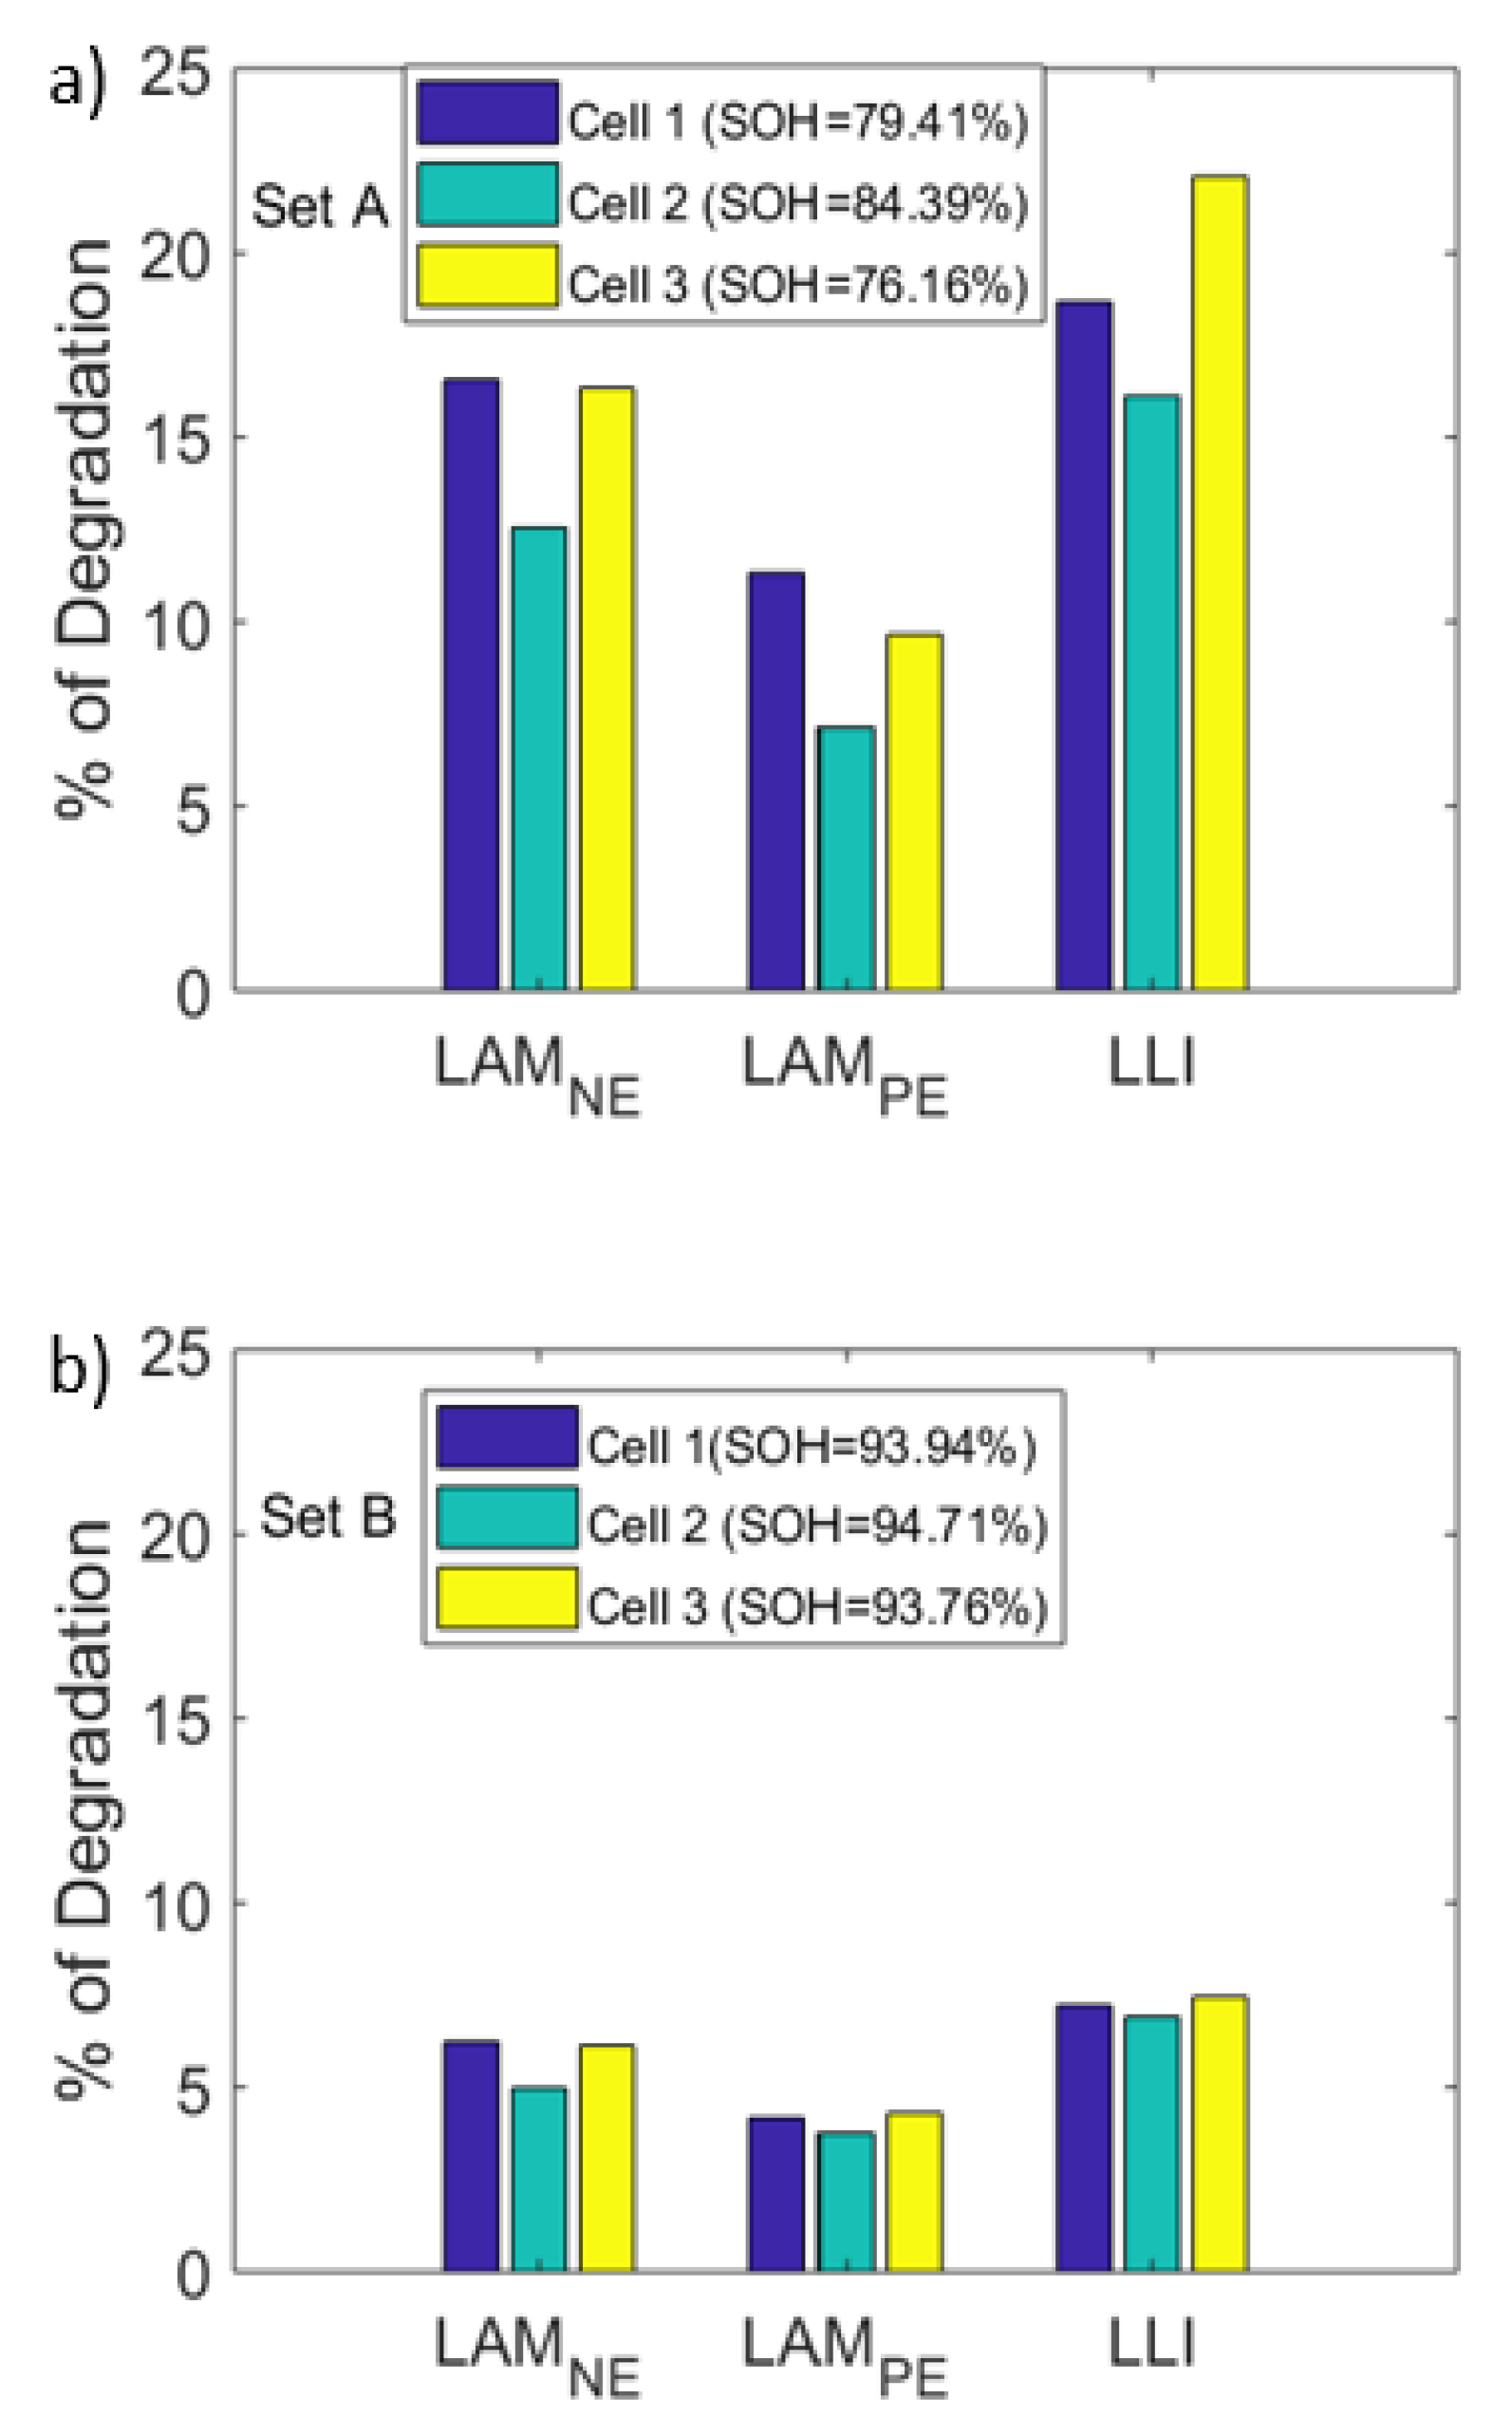
Figure 12.
(a) IC and (b) DV curves of the first cell in set A at two different aging levels.


Table 1.
Cell level test cases.
| Test Case | Cells Used (Group: Cell Marking) |
|---|---|
| Case 1: Cells aged under fast charging regime | Three new cells (set A: A1, A2, A3) |
| Case 2: Cells aged under less aggressive charging regime | Three new cells (set B: B1, B2, B3) |
Table 2.
Full cell test procedure.
| Test Sequence | Sub-Step No. | Exp. Setup | Current/Voltage | Control Limits |
|---|---|---|---|---|
| Step 1: Preconditioning tests | 1.1 | Soak to 25 °C | – | t > 4 h |
| 1.2 | Constant current charge | C/3 current | V > 4.2 V | |
| 1.3 | Constant voltage charge | 4.2 V | I < C/60 | |
| 1.4 | Rest | – | t > 1 h | |
| 1.5 | Constant current discharge | C/3 current | V < 2.5 V | |
| 1.6 | Constant voltage discharge | 2.5 V | I < C/60 | |
| 1.7 | Rest | – | t > 1 h | |
| 1.8 | Repeat steps 1.2 to 1.7 | – | Cycle number ≤ 6 | |
| Step 2: OCV tests before aging | 2.1 | Soak to 25 °C | – | t > 4 h |
| 2.2 | Constant current charge | C/10 current | V > 4.2 V | |
| 2.3 | Constant voltage charge | 4.2 V | I < C/60 | |
| 2.4 | Rest | – | t > 4 h | |
| 2.5 | Partial constant current discharge | C/20 current | ΔQ > Qnom/120 | |
| 2.6 | Rest | – | t > 1 h | |
| 2.7 | Repeat steps 2.5 & 2.6 until V limit reached | – | V < 2.5 V | |
| Step 3: Cell aging tests | 3.1 | Soak to 5 °C | – | t > 4 h |
| 3.2a: set A | Constant current charge | 1 C current | V > 4.2 V | |
| 3.2b: set A | Constant voltage charge | 4.2 V | I < C/4 | |
| 3.2a: set B | Constant current charge | 1 C current | V > 4.05 V | |
| 3.2b: set B | Constant voltage charge | 4.05 V | I < C/4 | |
| 3.2c: set B | Constant current charge | C/4 current | V > 4.2 V | |
| 3.3 | Rest | – | t > 4 h | |
| 3.4 | Constant current discharge | C/3 current | V < 2.5 V | |
| 3.5 | Rest | – | t > 1 h | |
| 3.6 | Repeat steps 3.2 to 3.5 until set A capacity drops to 80% | – | V < 2.5 V | |
| Step 4: OCV tests after aging | Follows the same procedure as step 2 |
Table 3.
Cell OCV fitting errors using the OCVs of the electrodes.
| Test Case | SOH (%) | Cell Number | RMSE (mV) | Max Error (mV) |
|---|---|---|---|---|
| set A (aggressive charge profile) | 100 | 1 | 1.60 | 5.3 |
| 100 | 2 | 1.81 | 6.0 | |
| 100 | 3 | 1.81 | 6.0 | |
| 78.86 | 1 | 4.70 | 17.8 | |
| 84.39 | 2 | 3.80 | 12.2 | |
| 78.41 | 3 | 4.20 | 15.1 | |
| set B (less aggressive charge profile) | 100 | 1 | 1.89 | 5.5 |
| 100 | 2 | 1.71 | 5.7 | |
| 100 | 3 | 1.51 | 5.6 | |
| 93.94 | 1 | 2.01 | 7.9 | |
| 94.71 | 2 | 1.81 | 8.4 | |
| 93.76 | 3 | 1.99 | 7.2 |
© 2020 by the authors. Licensee MDPI, Basel, Switzerland. This article is an open access article distributed under the terms and conditions of the Creative Commons Attribution (CC BY) license (http://creativecommons.org/licenses/by/4.0/).
Share and Cite
MDPI and ACS Style
Koleti, U.R.; Rajan, A.; Tan, C.; Moharana, S.; Dinh, T.Q.; Marco, J. A Study on the Influence of Lithium Plating on Battery Degradation. Energies 2020, 13, 3458. https://doi.org/10.3390/en13133458
AMA Style
Koleti UR, Rajan A, Tan C, Moharana S, Dinh TQ, Marco J. A Study on the Influence of Lithium Plating on Battery Degradation. Energies. 2020; 13(13):3458. https://doi.org/10.3390/en13133458
Chicago/Turabian StyleKoleti, Upender Rao, Ashwin Rajan, Chaou Tan, Sanghamitra Moharana, Truong Quang Dinh, and James Marco. 2020. "A Study on the Influence of Lithium Plating on Battery Degradation" Energies 13, no. 13: 3458. https://doi.org/10.3390/en13133458
Note that from the first issue of 2016, this journal uses article numbers instead of page numbers. See further details here.