An Energy Preservation Index for Evaluating the Rockburst Potential Based on Energy Evolution


1
School of Mechanics and Civil Engineering, China University of Mining and Technology, Xuzhou 221116, China
2
State Key Laboratory for Geomechanics and Deep Underground Engineering, China University of Mining and Technology, Xuzhou 221116, China
*
Author to whom correspondence should be addressed.
Energies 2020, 13(14), 3636; https://doi.org/10.3390/en13143636
Submission received: 26 May 2020
/
Revised: 10 July 2020
/
Accepted: 10 July 2020
/
Published: 15 July 2020
Abstract
:The estimation of rockburst potential has attracted great attention in the field of rock mechanics and engineering. In this study, an original energy preservation index is proposed to evaluate the rockburst potential in view of the energy evolution characteristics of rock materials. To investigate the energy evolution during rock deformation and failure, a number of cyclic uniaxial compression experiments on five kinds of rocks were carried out. The results showed that the curves of energy evolution exhibited obvious stages and there were significantly different weakening degrees for different rock materials embodied by the decreasing degrees of the ratios of elastic strain energy to dissipated strain energy at the weakening stage. Then, the energy preservation index was further formulated based on the decreasing ratio. Furthermore, by analyzing the acoustic emission activities at the failure stage and failure modes of the five rock materials, the rockburst potential was analyzed according to the energy preservation index.

1. Introduction
Rockburst poses severe risks to the safety of underground excavations. During the exploitation of mineral resources, rockbursts may lead to secondary hazards such as gas outbursts and dust explosions [1]. With the growing intensity and mining depth in resource exploitation, cases of rockburst hazards have been increasing in recent years [2,3]. Rockburst mechanisms have been explicated from the viewpoints of rock strength, stress–strain curves, and mineral compositions [4,5,6,7]. However, there are still no widely accepted rockburst potential indices in rock mechanics. The entire process of rock deformation is always accompanied by the energy conversion. Rock failure is an outcome of instantaneous elastic energy release accumulated in rocks [8,9,10,11]. Hence, from the perspective of strain energy, studies on the rock deformation and failure can more accurately reveal the nature of the rock failure.
In terms of strain energy, there have been plenty of studies on the energy release and energy accumulation to evaluate rockburst potential. Conventional rockburst indices based on energy theory include the strain energy storage index, energy release rate, and the bursting efficiency ratio. The strain energy storage index is the simplest rock-burst liability indicator and is defined as the ratio of elastic energy to dissipation energy () in the stress level of 80–90% of the peak strength [12]. For the convenience of calculation, Gong et al. [13] proposed the peak-strength strain energy storage index for rockburst potential. Cook [14] proposed the energy release rate for the first time when studying the rock stability problem in a gold mine. The energy release rate represents the energy releases per unit volume from the rock failure [15]. Additionally, the bursting efficiency ratio was also proposed as the ratio of the throw energy of fragments to maximum elastic strain energy [12]. The idea of throw energy evaluation was originally suggested by Drzewiecki, and it was based on the experimental determination of the mass and throw radius (flight length) of each detectable coal fragment after the brittle failure of a sample under uniaxial compression [12]. Pan [16] proposed a burst energy index to analyze the rockburst potential of coal. The index refers to the ratio of the accumulated strain energy before peak point to the dissipated energy after peak point, and it is based on stress–strain curves under uniaxial compression. Furthermore, the effective burst energy index was put forward, and it combines the strain energy storage index and the burst energy index [17]. The index can be expresses as the ratio of , where the elastic strain energy is represented at the peak point and the dissipated energy is after the peak point. Additionally, the surplus energy index was also applied to analyze rockburst potential and expressed with the ratio of surplus energy to the dissipated energy after the peak point [18]. Surplus energy refers to the difference between the elastic energy at the peak point and the dissipated energy after the peak point. Additionally, the energy emission speed was also considered for the evaluation of rockburst potential [19,20]. The energy emission speed comprehensively considers strain energy and dynamic failure time. As a result of various studies, in recent years, it has been widely accepted that the strain energy stored in a rock’s mass plays an important role in inducing rockburst. Beck and Brady [21] pointed out that the potential for rock failure and the strain energy density distribution in the rock are the most relevant parameters that affect the occurrence of induced seismicity. By tracking the energy density evolution, the local energy release rate was proposed to predict the intensity of the rockburst [22]. The property and quantity of energy accumulation in rocks were examined by [23]. Mansurov [24] pointed out that induced seismicity (rockburst) and its temporal and space changes can be considered as temporal flows with a magnitude of energy that is added to each seismic event. A triaxial compression system was conducted to simulate the failure process of released stress by confining pressure reduction methods. The results showed that the strain energy was absorbed and stored during the loading stage in the rock. The energy was sufficiently large to cause failure when it was released [25]. Su et al. [26] investigated the rockburst in a circular tunnel under high in-situ stress conditions with a numerical method coupled with the rock failure process theory and discontinuous deformation theory. They indicated that much of the strain energy may be released through rockbursts if the elastic module of rock blocks has not fundamentally changed, there are some long cracks, and there are a small quantity of dispersed failure points. Many strategies to evaluate rockburst potential from energy balance in rock engineering have focused on the energy state at failure points and residual points. The energy evolution characteristics during rock deformation are lacking. Different evolution paths may lead to the same energy states at failure and residual points. However, few studies have investigated the rockburst potential from the view of energy evolution, which maybe become an effective way to evaluate rockburst potential.
In present study, we introduce the energy preservation index, which was determined with the decreasing ratio of at the weakening stage. A number of cyclic uniaxial compression tests were carried out for five kinds of rocks. Based on the experimental data, the energy evolution characteristics of five rock materials were analyzed. On the basis of the energy evolution, the energy preservation index could be obtained. Furthermore, in view of acoustic emission features at the failure stage and the failure modes of five rock materials, the rockburst potential was analyzed according to the energy preservation index.
2. Strain Energy Calculation of One Cycle
The loading process of a specimen can be considered a thermodynamic process [27]. It is assumed that the deformation of a specimen is a closed system without heat dissipation. Therefore, based on the first and second law of thermodynamics, external work is transformed into elastic strain energy and dissipated energy [28], that is:
where is the total input strain energy, is the reversible elastic strain energy, and is the irreversible dissipated energy.
Figure 1 is a typical stress–strain curve under loading–unloading conditions. It also shows the relationship between and in the axial direction. The area under the unloading curve represents , as embodied by the shadow area by the points. The area between the loading and unloading curves represents and is marked by the shadow area by lines. can be stored as internal energy in the material during the loading process and is released as recoverable strain during the unloading process. is induced by elastic–plastic damage originating from plastic strain and elastic damage in the material, and it is unrecoverable during both the loading and unloading processes.
For uniaxial compression, input strain energy occurs only in axial direction. Therefore, the strain energy can be obtained by the following form [29]:
3. Test Materials and Methods
3.1. Specimen Preparation
According to the strength and stiffness characteristics of rocks, five materials—including granite, red sandstone, coal, gypsum, and a high-water material—were chosen to perform the uniaxial cyclic loading–unloading tests. The specimens for granite, red sandstone, coal, and gypsum were taken from Jier Mine at Yanzhou area, a quarry in Xuzhou, Pingdingshan Mine, and Pizhou Gypsum Mine, respectively. The high-water material was mixed with lime powder and cement in definite proportions. The five materials were processed into standard cylinder specimens with diameter 50 mm and height 100 mm (Figure 2). Table 1 lists the basic physical properties of the five materials.
3.2. Experimental Instrument and Method
The uniaxial cyclic loading–unloading experiments were performed on an MTS816 electro-hydraulic servo-controlled rock testing system. The machine has a compression load capacity of 1459 KN and a maximum stroke of ±100 mm. The system consists of the loading system, a controller, and a computer system, as shown in Figure 3a. It can record real-time load and displacement. A PCI-2 acoustic emission system with dynamic range larger than 85 dB and signal amplitude of 100 dB was employed to collect the acoustic emission signal, as shown in Figure 3c.
Firstly, uniaxial compression tests of the 5 kinds of rocks were carried out to obtain the uniaxial compressive strength (UCS). According to the obtained UCS, 30 loading–unloading cycles were designed for each specimen in the uniaxial cyclic tests. The specimen was loaded and unloaded until failure at a constant force loading rate. The loading process within the nth load–unload cycle is shown in Figure 4. The amplitudes of load for each cycle were increased by the loading step (d). The strength and loading schemes of different rocks are listed in Table 2. At the same time, both the acoustic emission and stress–strain relationships were recorded synchronously.
4. Experimental Results and Analysis
4.1. Stress–Strain Curves Characteristics
The Figure 5 shows the stress–strain relationships for various lithologies under uniaxial cyclic experiments. Significant differences were noticed for the rocks. The UCS of granite, red sandstone, gypsum, coal, and the high-water material were 134.14, 84.37, 25.52, 14.10, and 5.97 MPa, respectively. The peak strains of granite, red sandstone, gypsum, coal, and the high-water material were 0.0104, 0.0150, 0.00569, 0.00602, and 0.0113, respectively. At the post-peak failure stage, the slope of the stress drop of red sandstone and granite was dramatic (see Figure 5a,b). On the contrary, a relatively slow stress drop was observed in the other three rock materials.
As displayed in Figure 5, the hysteresis phenomena of the five rocks were similar but diverse. At the initial stage of loading, the hysteresis loops under cyclic stressing were oval in shape. The hysteresis loops gradually showed pointed leaf shapes as the loading increased. The hysteresis loop reflects the non-elastic mechanism of the rocks affected by the process of crack formation and development [30]. The inelastic mechanism controls the rate and the mode of energy dissipation [31]. The hysteresis phenomena of gypsum (Figure 5e) and the high-water material (Figure 5d) were more obvious than that of red-sandstone, coal, and granite (Figure 5a–c). This indicated that the plastic deformations of gypsum and the high-water material were more than those of the other three rocks during compression. It is noteworthy that the existence of the mutation stage in the red sandstone and granite was caused by the inhomogeneity of the samples.
4.2. Energy Evolution Characteristics
Using Equations (2) and (4), the energy evolution for the rocks was obtained, as presented in Figure 6. The energy evolution patterns of the five rocks were similar. The curves of energy evolution had no obvious crack closure stage. During the elastic deformation process, most of the input strain energy accumulated in the rock units in form of elastic energy, and a small proportion dissipated as inside elastic damage and elastic–plastic damage. There was almost no change for dissipated energy in the elastic stage. When entering the crack initiation stage, the elastic energy still kept increasing, just as before. However, the dissipated energy obviously increased due to the crack initiation. Once the crack damage stage was reached, the dissipated energy displayed a more dramatic rise resulting from the crack initiation and coalescence. The elastic energy remained almost constant, as in the crack initiation stage except for the high-water material. The elastic energy of the high-water material suffered drops before failure due to its strengthening plasticity. In conclusion, rock lithology is a control factor of energy evolution. The elastic energy density kept increasing during the whole loading process except for the strong plastic material. The dissipated energy density started to increase slowly when entering the crack initiation stage while distinctly increasing at the crack damage stage. The increase rate of the dissipated energy was closely related to the rock brittleness. The differences in energy evolution are expanded on below. Figure 6 shows the evolution of the total input energy, elastic energy, and dissipated energy of every rock.
As shown in Table 3, every rock showed different energy evolution characteristics. Firstly, the total input energy represented the capacity of accumulating strain energy. The results showed that rocks with greater strength possessed a greater capacity of accumulating strain energy. Secondly, the larger elastic energy density indicated a greater occurrence of elastic deformation, and the lager dissipated energy implied more occurrences of damage. However, the separate elastic energy density and dissipated energy density for different kinds of rock materials showed no comparability. The generation of unit elastic deformation or damage required different energy absorption and dissipation for different rock materials.
Previous studies have shown that brittle rocks fail with a small amount of strain that mainly occurs in the elastic region, while ductile rocks undergo a large plastic strain without losing their bearing capacity before failure [32]. Therefore, the elastic energy ratio and the dissipated energy ratio can reflect deformation characteristics at failure. Because the thermal dissipation was neglected in our energy calculations, the dissipation energy ratio was essentially complementary to the elastic energy ratio. Hence, only the dissipation energy ratio was calculated, as follows:
The results of are shown in Figure 7. The evolution of exhibited three obvious stage characters. In the crack closure stage, is at a higher level due to compression of fissures. As the load increased, decreased in the elastic stage. In this stage, the dissipated energy ratio for gypsum and red sandstone were around 18%, and it was 10% for coal, gypsum, and the high-water material. While entering the crack initiation stage, experienced a sharp increase for the high-water material and gypsum. There was also a small increase for red sandstone. However, there was no significant change for coal and granite. At the peak point, was 0.57 for the high-water material, 0.25 for gypsum, 0.14 for red sandstone, 0.067 for coal, and 0.049 for granite; the results are summarized in Figure 8. In general, the elastic energy was always in a dominant position during the deformation process. It seemed that the more brittle rocks had a lower dissipation energy ratio but a higher elastic energy ratio at failure.
4.3. The Energy Preservation Index
As mentioned above, the rate of dissipation energy during the crack initiation and crack damage stages showed obvious differences between the five rock materials, as is clearly shown in Figure 9. The rate of dissipation energy represented the speed of damage. It was found that the damage degree of the five rock materials had great differences. It was unreasonable to study the rockburst potential from just one aspect of elastic energy or dissipated energy. Therefore, to further understand the differences in energy balance for the rocks, the ratio of elastic strain energy to dissipated energy () was analyzed. It is defined as Equation (6):
The evolutions of for different rocks during the entire deformation process are shown in Figure 10. The of the five rocks all increased at first and then decreased with the increase of deformation. At the initial stage, showed a slight drop due to the compression of fissure. When the elastic deformation stage came, increased to accumulate elastic energy at a descending rate. As damage increased, began to decrease due to the initiation and joint of cracks inside the rocks. The extent of crack development depended on the extent of dissipated and accumulated energy. Damage weakened the ability of the energy preservation of the rock. Lithology was found to be a major factor affecting the damage evolution and energy evolution modes. When more energy was dissipated, less elastic energy was accumulated, which meant less energy could be released at failure, as with the high-water material and gypsum. Inversely, when less energy was dissipated, more elastic energy was accumulated, which implied more energy was released at failure, as with granite. Another two modes of energy evolution were personified by the coal and red sandstone. For the mode of red sandstone, there was more absorbed elastic energy and more dissipated energy. As for the mode of coal, there was relatively less elastic absorption and less energy dissipation. As discussed above, the energy accumulated for rock rupture was depended on the interaction between the absorbed elastic energy and the dissipated energy. We defined the interaction as the energy preservation ability of rocks. Therefore, the ability of energy preservation can affect the storage energy used for release at failure and, thus, further affect rockburst potential.
As mentioned above, the decreasing ratio of can effectively characterize the energy preservation ability of rocks during the weakening stage. In fact, the energy preservation ability of rocks determines their rockburst potential. A stronger ability of energy preservation means a higher rockburst potential. Therefore, the decreasing ratio of is proposed as the strain energy preservation index (). Figure 11 shows the calculation method for . is obtained by:
Based on , of each rock specimen are given according to Equation (7) (see Table 4). In the weakening stage, the of the high-water material decreased from 9.39 to 0.703 and reduced by 92.5%. The of gypsum dropped by 44.61% from 5.36 to 2.96. For red sandstone, fell by 14.56% from 7.42 to 6.33. There was also a 7.81% decrease of for coal. Additionally, it should be noticed that the fall of the last cycle for granite was not considered in the weakening stage because the granite was destroyed at this cycle. From the stress–strain curve of granite, it can be seen that the peak stress was equal to the stress of the last cycle. The reason why it is not unstable at this circle is the hysteretic behaviors in rocks and the sudden unloading process. Therefore, the drop ratio of for granite was 2.2%. In summary, of the five rocks were ranked as granite, coal, red sandstone, gypsum and the high-water material. Accordingly, the rockburst potential of the five rocks was also in this order, as presented in the previous section.
Gong et al. developed an energy storage index () to assess rockburst potential [13]. The index was defined as , corresponding to the peak compressive strength of the rock specimen. Based on the experimental data, the index was calculated for the five rock materials, as shown in Figure 12.
From Figure 12, it can be seen that the index corresponded well to the index for all rock materials. The index represents the strain energy storage ability. Additionally, the bigger index implies a stronger energy storage ability and a greater rockburst potential. At the meantime, the bigger index implied the stronger strain energy preservation ability and the greater rockburst potential. The results showed that the index was a good index for evaluating the rockburst potential. The index will be instrumental in forecasting rockbursts, and forecasting is an important component in safety management.
5. Analysis of Rockburst Based on
Rockburst is a dynamic instability process resulting from instantaneous elastic energy release accumulated in rocks [8,9,10,11]. Acoustic emission (AE) can capture and record the energy dissipation process during the entire loading process [33,34]. Thus, the AE characteristics of rock samples in the failure process were studied for the evaluation of the rockburst potential. AE parameters include AE count, amplitude, rise time, duration time, and AE energy rate. Those parameters have been widely applied to analyze the AE characteristics and evaluate the damage of materials [35,36,37]. The AE energy rate can be proportional to the true energy [38]. The AE energy is preferred for analyzing the AE characteristics over the AE count. Therefore, The AE energy and cumulative AE energy were chosen to analyze the AE test results, as shown in Figure 13.
As shown in Figure 13, at the fracture failure stage, AE energy increased rapidly on account of the original cracks’ growth, the initiation of numerous cracks, and crack convergence. Compared to the other four rocks, the energy–time curve of the high-water material was less hopping Owing to the bonding properties between particles, the high-water material was difficult to destroy. The failure duration of the high-water material was obviously longer than that of the other four rocks. The energy–time curves for granite, coal, red sandstone, and gypsum all show small step changes, especially when entering the yield stage. At the fracture failure stage, the step amplitudes of the cumulative AE energy were 1.57 × 10⁵ for granite, 1.94 × 10⁴ for red sandstone, 8.34 × 10⁴ for coal, 1.15 × 10³ for gypsum, and 4.93 × 10³ for the high-water material.
The more released energy per unit time at the failure stage implies the severer failure. The step amplitude at the failure stage, and the failure durations of the rocks are listed in Table 5. As shown, the granite had the maximum step amplitude at the failure stage, followed by coal, red sandstone, the high-water material, and gypsum. From the stress–strain curves, the failure duration can be obtained. The failure durations were 0.5 s for granite, 0.8 s for red sandstone, 1 s for coal, 1.5 s for gypsum, and 8 s for the high-water material. The released strain energy per unit time was ranked as granite, coal, red sandstone, gypsum, and the high-water material in decreasing order. This implies that the failure intensity was also ranked as granite, coal, red sandstone, gypsum, and the high-water material.
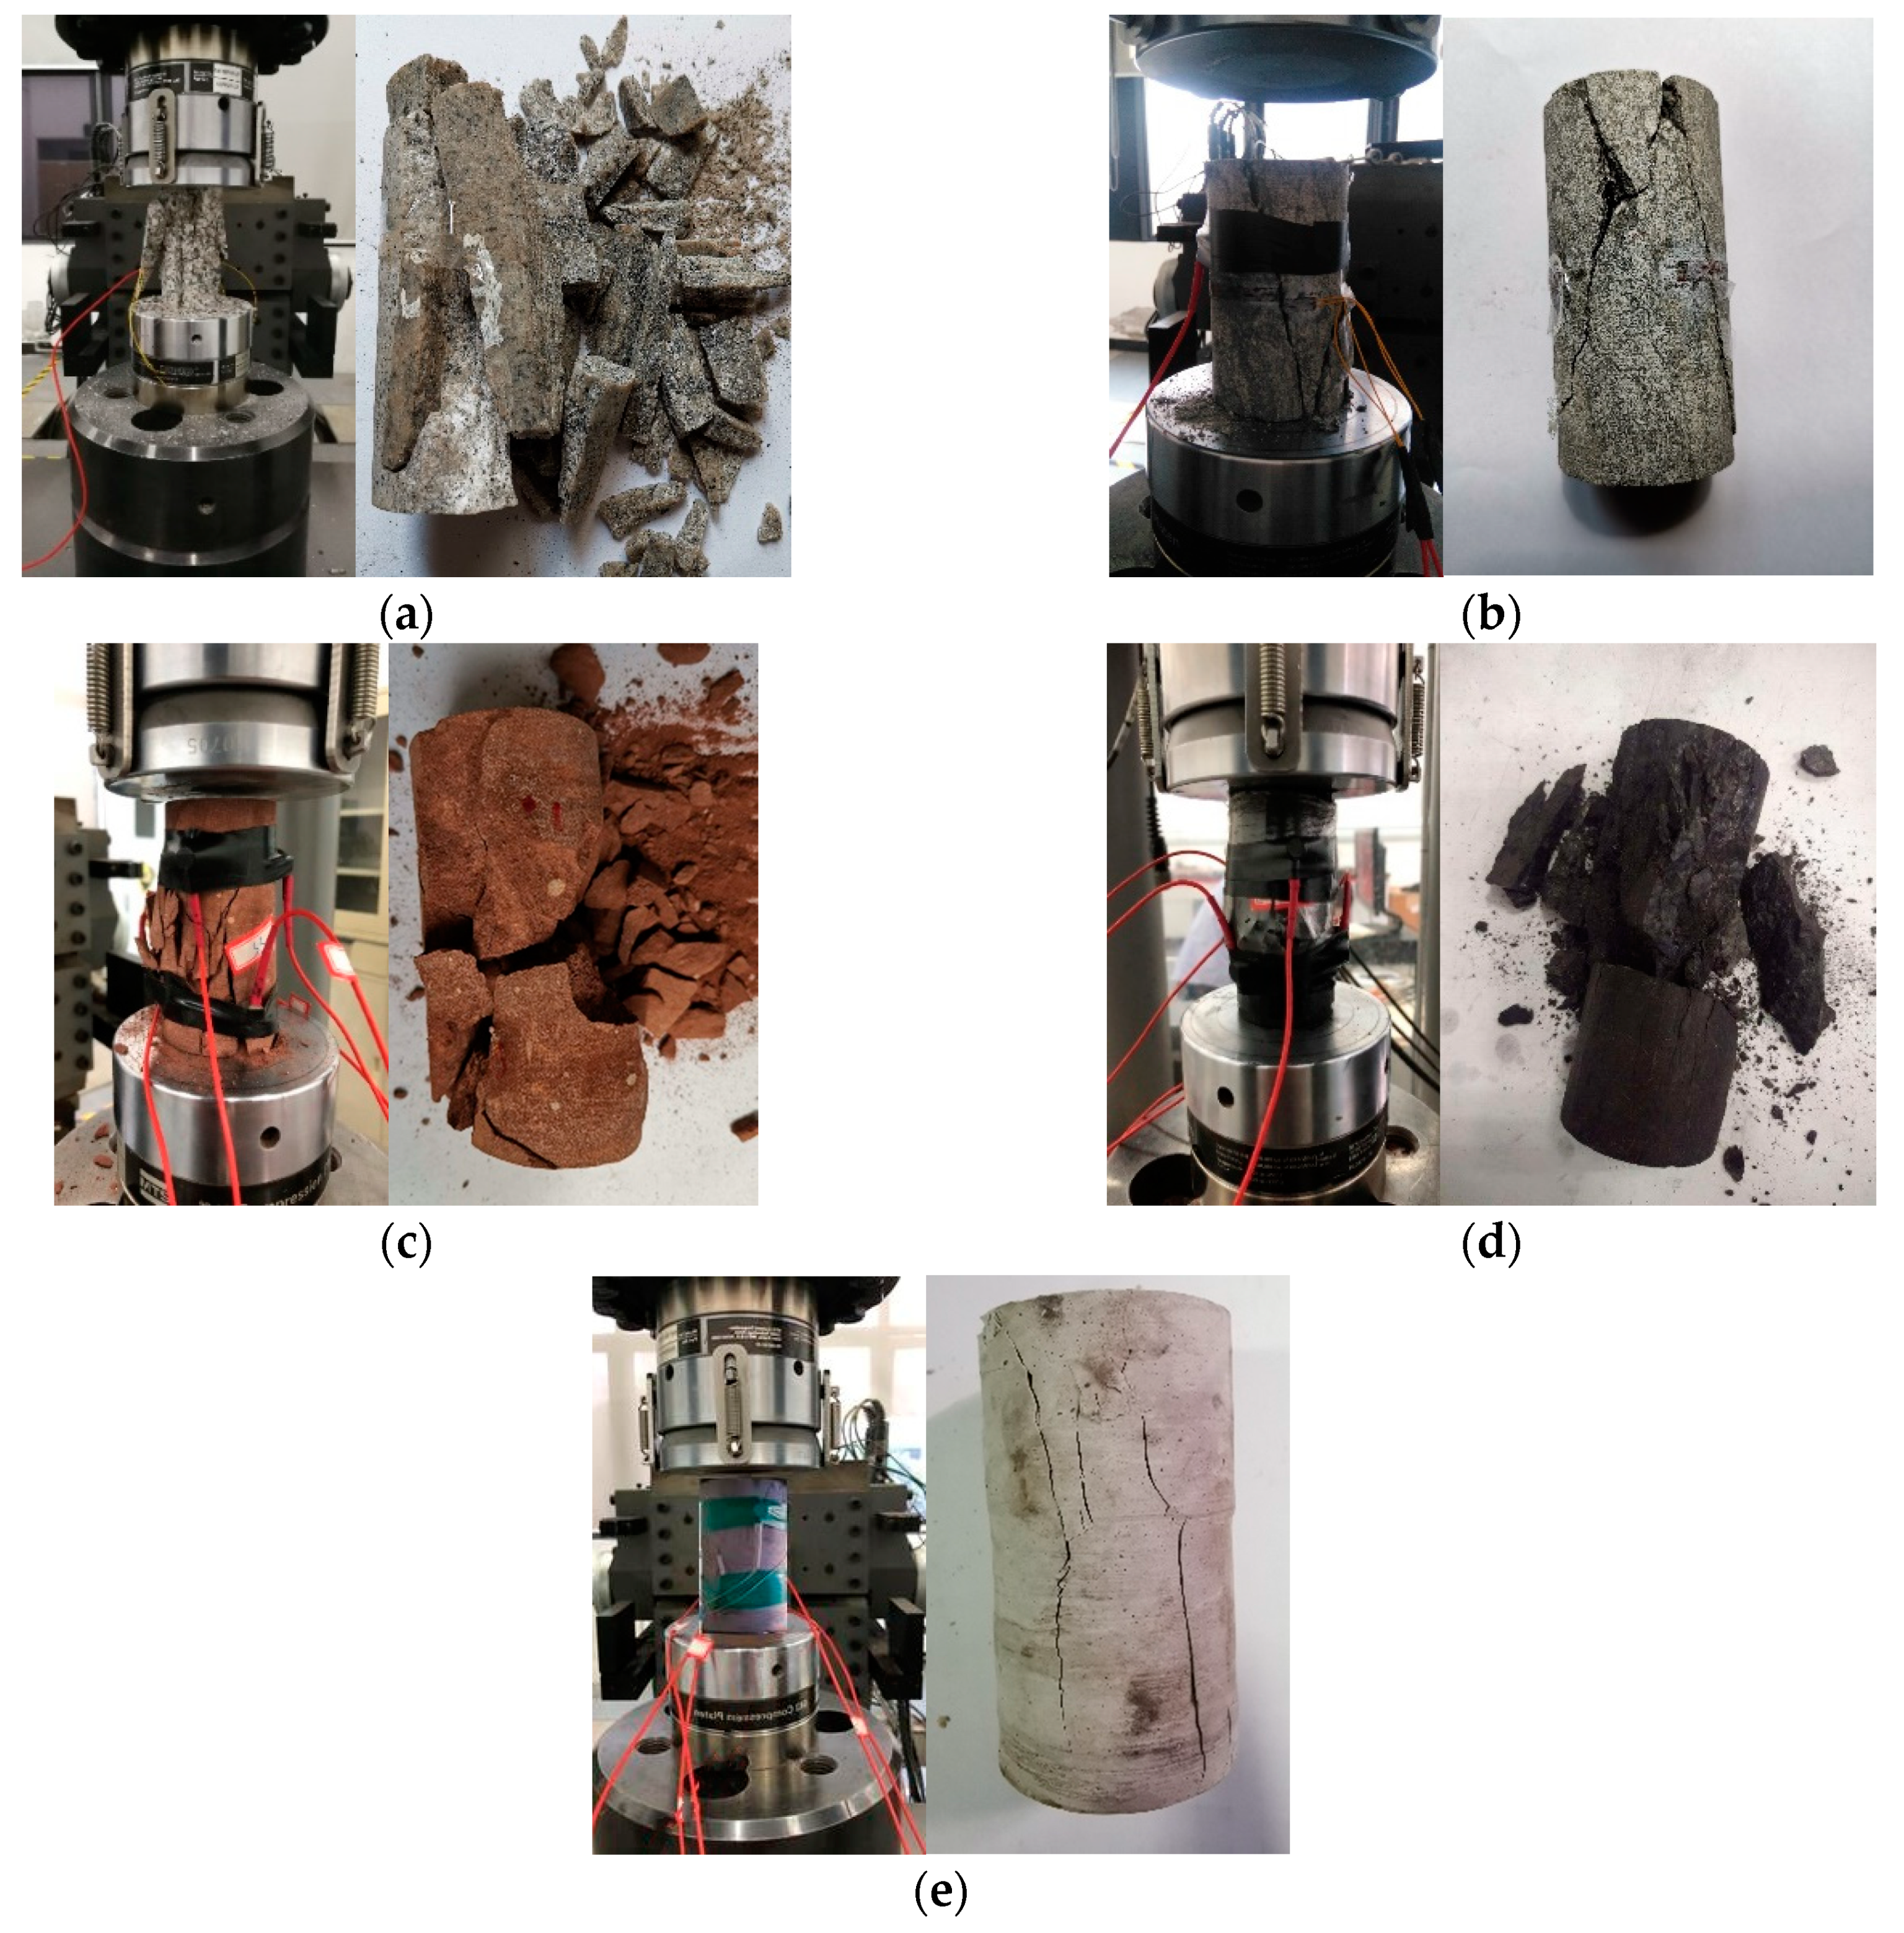
In addition to the AE characteristics, the failure mode is also an important feature that reflects rockburst potential [13]. Figure 14 presents the failure modes of the five rock materials. The high-water material was almost integrated with small-scale cracks across the sample after failure, which demonstrated that the high-water material has no burst potential. For gypsum, only a macroscopic crack and a small amount of rock fragments were formed at failure. These phenomena indicated that gypsum has a weak rockburst potential. However, a large quantity of rock fragments were produced at failure for coal, red sandstone, and granite. The failure of granite showed more obvious ejection phenomenon, as shown in Figure 14a. Therefore, the rockburst potential of coal, red sandstone, and granite was high, and the rockburst potential of granite was higher than that of coal and red sandstone.
After the analysis of the AE characteristics and the failure modes, the rockburst potential was able to be graded into four levels: no, weak, relatively strong, and strong. The statistical results are listed in Table 6. A index greater than 0.978 indicates a strong rockburst potential with high-level release energy and more fragments at failure, such as with granite. A index between 0.85 and 0.92, such as that for coal and red sandstone, represents a relatively strong rockburst potential. The index of gypsum was 0.55, corresponding to a weak rockburst potential. There was no rockburst potential for a index below 0.076, as exhibited by the high-water material.
As shown in Table 6, the index was a good index for describing the rockburst potential. Compared to the criterion with the index, the evaluation of rockburst potential for relatively brittle rocks by the index was more sensitive. However, the weaknesses of the method proposed in this paper are the lack of energy analyses in the post-peak stage due to the uncontrollability of post-peak deformation under uniaxial compression. The influence of the stiffness of the loading system was also neglected in the analysis of rock failure. Additionally, due to the kind of the laboratory experiments performed, a field rockburst case analysis was missing. In view of those weaknesses, future experiments and analyses will be improved. The proposed method should be verified by a case study, including a rockburst in an underground space before it can be used to evaluate the rockburst potential for a large-scale project.
6. Conclusions
Based on the uniaxial compression and cyclic loading–unloading uniaxial compression tests of five rock materials, the stress–strain curves and energy evolution processes of five rock materials were analyzed. The energy preservation index was defined with a decreasing ratio of . In addition, the AE characteristics and failure mode were discussed. The main conclusions are shown as follows:
(1) The energy evolution characteristics were analyzed based on the stress–strain relationship. The results showed that the more brittle rocks had the higher elastic energy proportion and the lower dissipated energy proportion. Additionally, the ductile rocks showed a faster energy dissipation before failure.
(2) Based on the energy evolution characteristics, an energy preservation index () was proposed. This index revealed the weakening degree each rock material at the weakening stage. In addition, according to the AE characteristics and failure modes, the actual rockburst potentials of five kinds of rocks were analyzed. It was revealed that the index is a good index that can contribute to the assessment of rockburst potential.
Author Contributions
Conceptualization, methodology, resources, validation, and project administration, F.G., L.G., and Z.Z.; software and investigation, L.G., and Y.X.; formal analysis and writing—original draft, L.G. and Y.X.; writing—review, editing, and supervision, L.G. All authors have read and agreed to the published version of the manuscript.
Funding
This research was funded by the Fluidization Mining for Deep Coal Resources, grant number 3021802; the National Natural Science Foundation of China, grant number 51604260 and Jiangsu Province Science Foundation for Youths, grant number BK20180653.
Acknowledgments
We thank Peng Hou, from Purdue University, USA, for editing the English text of a draft of this manuscript.
Conflicts of Interest
The authors declare no conflict of interest.
References
- Cai, W.; Dou, L.; Zhang, M.; Cao, W.; Shi, J.; Feng, L. A fuzzy comprehensive evaluation methodology for rock burst forecasting using microseismic monitoring. Tunn. Undergr. Sp. Tech. 2018, 80, 232–245. [Google Scholar] [CrossRef]
- Xie, H. Research framework and anticipated results of deep rock mechanics and mining theory. Adv. Eng. Sci. 2017, 49, 1–16. [Google Scholar]
- Jiang, Y.; Zhao, Y.; Wang, H.; Zhu, J. A review of mechanism and prevention technologies of coal bumps in China. J. Rock. Mech. Geotec. Eng. 2017, 9, 180–194. [Google Scholar] [CrossRef]
- Li, Z.; He, X.; Dou, L.; Song, D.; Wang, G.; Xu, X. Investigating the mechanism and prevention of coal mine dynamic disasters by using dynamic cyclic loading tests. Saf. Sci. 2019, 115, 215–228. [Google Scholar] [CrossRef]
- Wang, G.; Gong, S.; Dou, L.; Cai, W.; Yuan, X.; Fan, C. Rockburst mechanism and control in coal seam with both syncline and hard strata. Saf. Sci. 2019, 115, 320–328. [Google Scholar] [CrossRef]
- Zhang, C.; Canbulant, I.; Tahmasebinia, F.; Hebblewhite, B. Assessment of energy release mechanisms contributing to coal burst. Int. J. Min. Sci. Technol. 2017, 27, 43–47. [Google Scholar] [CrossRef]
- Zhai, S.; Su, G.; Yin, S.; Zhao, B.; Yan, L. Rockburst characteristics of several hard brittle rocks: A true triaxial experimental study. J. Rock. Mech. Geotec. Eng. 2020, 12, 279–296. [Google Scholar] [CrossRef]
- Xie, H.; Li, L.; Peng, R.; Ju, Y. Energy analysis and criteria for structural failure of rocks. J. Rock. Mech. Geotec. Eng. 2009, 1, 11–20. [Google Scholar] [CrossRef] [Green Version]
- Peng, R.; Ju, Y.; Wang, J.; Xie, H.; Gao, F.; Mao, L. Energy dissipation and release during coal failure under conventional triaxial compression. Rock. Mech. Rock. Eng. 2015, 48, 509–526. [Google Scholar] [CrossRef]
- Wang, P.; Xu, J.; Fang, X.; Wang, P. Energy dissipation and damage evolution analyses for the dynamic compression failure process of red-sandstone after freeze-thaw cycles. Eng. Geol. 2017, 221, 104–113. [Google Scholar] [CrossRef]
- Hou, P.; Gao, F.; Yang, Y.; Zhang, X.; Zhang, Z. Effect of the layer orientation on mechanics and energy evolution characteristics of shales under uniaxial loading. Int. J. Min. Sci. Technol. 2016, 26, 857–862. [Google Scholar] [CrossRef]
- Kidybinski, A. Bursting liability indices of coal. Int. J. Rock. Mech. Min. 1981, 18, 295–304. [Google Scholar] [CrossRef]
- Gong, F.; Yan, J.; Li, X.; Luo, S. A peak-strength strain energy storage index for rockburst potential of rock materials. Int. J. Rock. Mech.Min. 2019, 117, 76–89. [Google Scholar] [CrossRef]
- Cook, N.G.M. The design of underground excavations. In Proceedings of the Eighth Rock Mechanics Symposium, Minneapolis, MN, USA, 15–17 September 1966. [Google Scholar]
- Xiao, Q.; Liu, J.; Lei, S.; Gao, B. A new method for calculating energy release rate in tunnel excavation subjected to high in situ stress. Perspec. Sci. 2016, 7, 292–298. [Google Scholar]
- Pan, J. Relationship between deformation and failure of coal and its burst potential under uniaxial compression. Saf. Coal Mines 2006, 37, 1–4. [Google Scholar]
- Zhu, F.; Pan, C.; Guo, R. A new rock burst index–effective impact energy index. J. Min. Saf. Eng. 2002, 19, 83–84. [Google Scholar]
- Tang, L.; Pan, C.; Wang, W. Surplus energy index for analyzing rockburst potential. J. Cent. South Univ. 2002, 33, 129–132. [Google Scholar]
- Xu, J.; Jiang, J.; Xu, N.; Liu, Q.; Gao, Y. A new energy index for evaluating the potential of rockburst and its engineering application. Eng. Geol. 2017, 230, 46–54. [Google Scholar] [CrossRef]
- Zhang, X.; Feng., G.; Kang, L.; Yang, S. Method to determine burst potential of coal rock by residual energy emission speed. J. China Coal Soc. 2009, 34, 1165–1168. [Google Scholar]
- Beck, D.A.; Brady, B.H.G. Evaluation and application of controlling parameters for seismicity events in hard-rock mines. Int. J. Rock Mech. Min. Sci. 2002, 39, 633–642. [Google Scholar] [CrossRef]
- Jiang, Q.; Feng, X.; Xiang, T.; Su, G. Rockburst characteristics and numerical simulation based on a new energy index: A case study of a tunnel at 2500 m depth. Bull. Eng. Geol. Environ. 2010, 69, 381–388. [Google Scholar] [CrossRef]
- Wang, J.; Park, H.D. Comprehensive prediction of rockburst based on analysis of strain energy in rocks. Tunn. Undergr. Space Technol. 2016, 16, 49–57. [Google Scholar] [CrossRef]
- Mansurov, V.A. Prediction of rockbursts by analysis of induced seismicity data. Int. J. Rock Mech. Min. Sci. 2001, 38, 893–901. [Google Scholar] [CrossRef]
- Hua, A.; You, M. Rock failure due to energy release during unloading and application to underground rock burst control. Tunn. Undergr. Space Technol. 2001, 16, 241–246. [Google Scholar] [CrossRef]
- Sun, J.; Zhu, Q.; Li, W. Numerical simulation of rock burst in circular tunnels under unloading conditions. J. China Univ. Min. Technol. 2007, 17, 552–556. [Google Scholar] [CrossRef]
- Xie, H.; Ju, Y.; Li, L.; Peng, R. Energy mechanism of deformation and failure of rock masses. Chin. J. Rock Mech. Eng. 2008, 27, 1729–1740. [Google Scholar]
- Liang, C.; Wu, S.; Li, X.; Xin, P. Effects of strain rate on fracture characteristics and mesoscopic failure mechanisms of granite. Int. J. Rock Mech. Min. 2015, 76, 146–154. [Google Scholar] [CrossRef]
- Wang, Y.; Cui, F. Energy evolution mechanism in process of sandstone failure and energy strength criterion. J. Appl. Geophys. 2018, 154, 21–28. [Google Scholar] [CrossRef]
- Chen, Y.; Wang, S.; Wang, E. Quantitative study on stress-strain hysteretic behaviors in rocks. Chin. J Rock Mech. Eng. 2007, 26, 4066–4072. [Google Scholar]
- Chen, Y.; Wang, S. Elastoplastic response of saturated rocks subjected to multilevel cyclic loading. Rock Soil Mech. 2010, 31, 1030–1034. [Google Scholar]
- Zhang, D.; Ranjith, P.; Perera, M.S.A. The brittleness indices used in rock mechanics and their application in shale hydraulic fracturing: a review. J. Petrol Sci. Eng. 2016, 143, 158–170. [Google Scholar] [CrossRef]
- Liu, S.; Li, X.; Li, Z.; Chen, P.; Yang, X.; Liu, Y. Energy distribution and fractal characterization of acoustic emission (AE) during coal deformation and fracturing. Measurement 2019, 136, 122–131. [Google Scholar] [CrossRef]
- Meng, Q.; Zhang, M.; Han, L.; Pu, H.; Nie, T. Effects of acoustic emission and energy evolution of rock specimens under the uniaxial cyclic loading and unloading compression. Rock Mech. Rock Eng. 2016, 49, 3873–3886. [Google Scholar] [CrossRef]
- Blagoveshchenskii, V.V.; Panin, I.G. Acoustic emission at interaction of gliding deformation with point obstacles. Phys. Solid State 2017, 59, 1554–1556. [Google Scholar] [CrossRef]
- Wang, X.; Wu, S.; Ge, H.; Sun, Y.; Zhang, Q. The complexity of the fracture network in failure rock under cyclic loading and its characteristics in acoustic emission monitoring. J. Geophys. Eng. 2018, 15, 2091–2103. [Google Scholar] [CrossRef] [Green Version]
- Li, D.; Wang, E.; Kong, X.; Wang, X.; Zhang, C.; Jia, H.; Wang, H.; Qian, J. Fractal characteristics of acoustic emissions from coal under multi-stage true-triaxial compression. J. Geophys. Eng. 2018, 15, 2021–2032. [Google Scholar]
- Kim, J.S.; Lee, K.S.; Cho, W.J.; Choi, H.J.; Cho, G.C. A comparative evaluation of stress-strain and acoustic emission methods for quantitative damage assessments of brittle rock. Rock Mech. Rock Eng. 2015, 48, 495–508. [Google Scholar] [CrossRef]
Figure 1.
Calculation of dissipative energy and elastic energy in a cycle.

Figure 2.
Prepared rock samples for uniaxial cyclic compression tests.
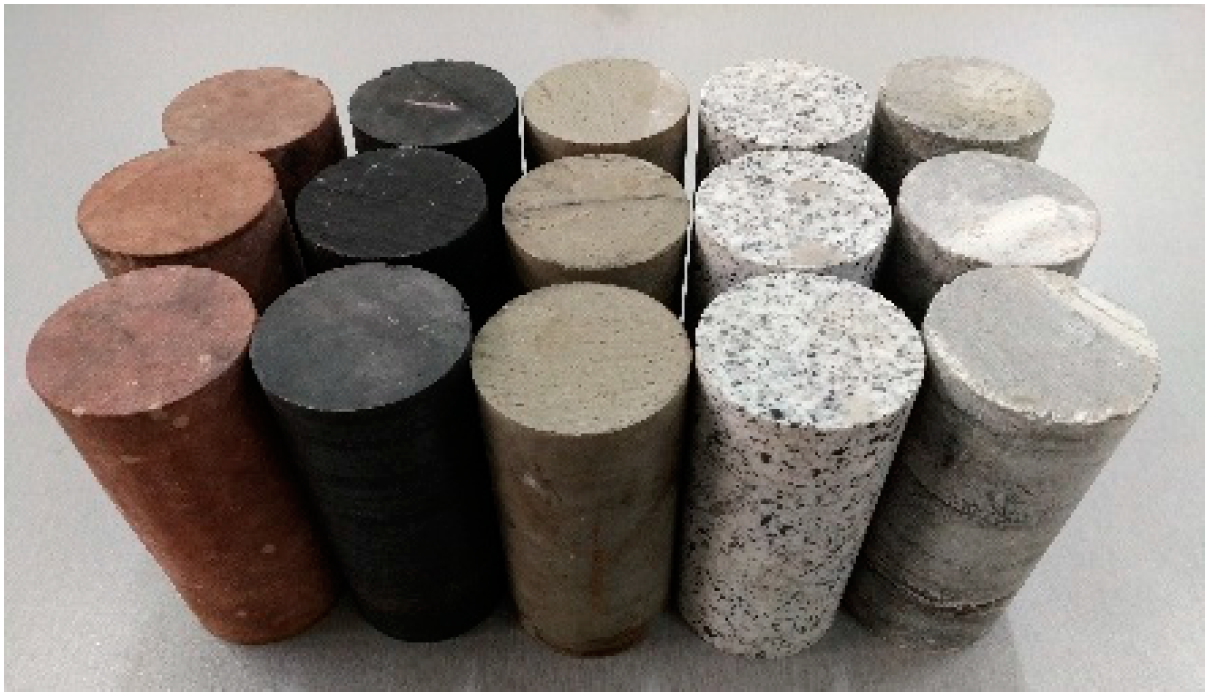
Figure 3.
Photos of experimental system. (a) Loading system, (b) specimen pedestal, and (c) specimen pedestal.
Figure 3.
Photos of experimental system. (a) Loading system, (b) specimen pedestal, and (c) specimen pedestal.

Figure 4.
Typical stress–strain curve with the nth load–unload cycle.
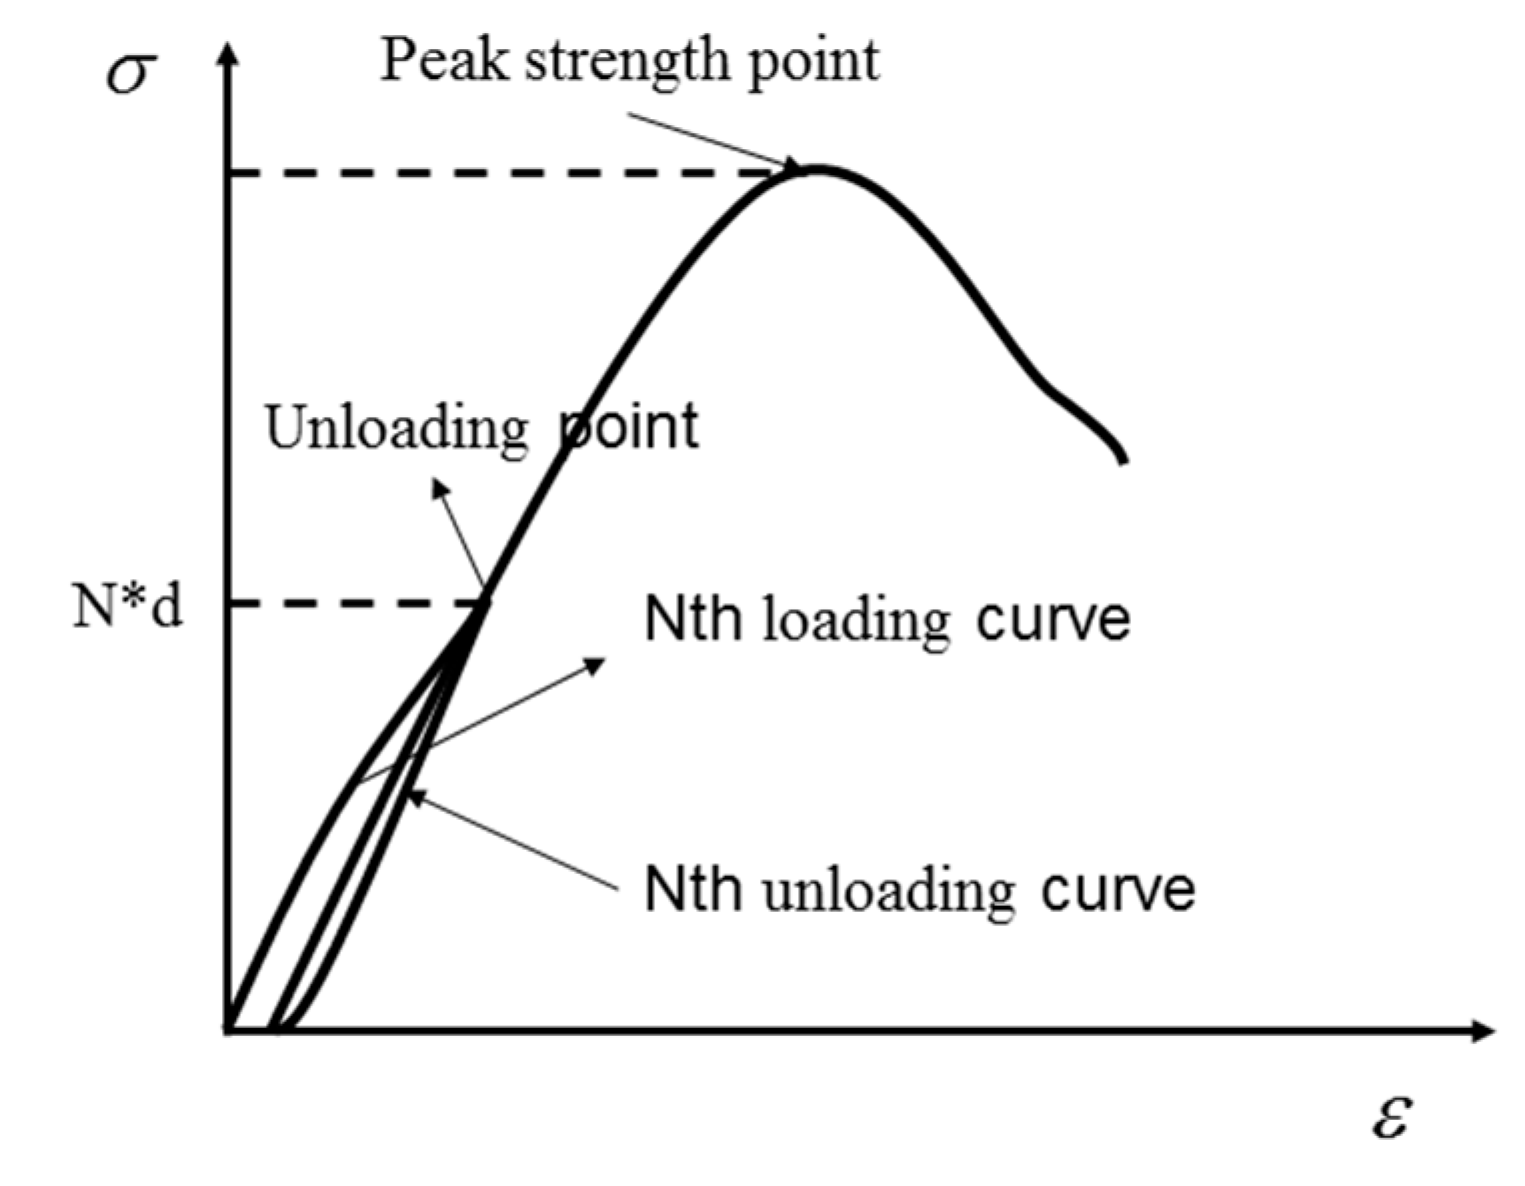
Figure 5.
Stress–strain curves of uniaxial cyclic experiments for different rocks. (a) Red sandstone, (b) granite, (c) coal, (d) high-water material, and (e) gypsum.
Figure 5.
Stress–strain curves of uniaxial cyclic experiments for different rocks. (a) Red sandstone, (b) granite, (c) coal, (d) high-water material, and (e) gypsum.
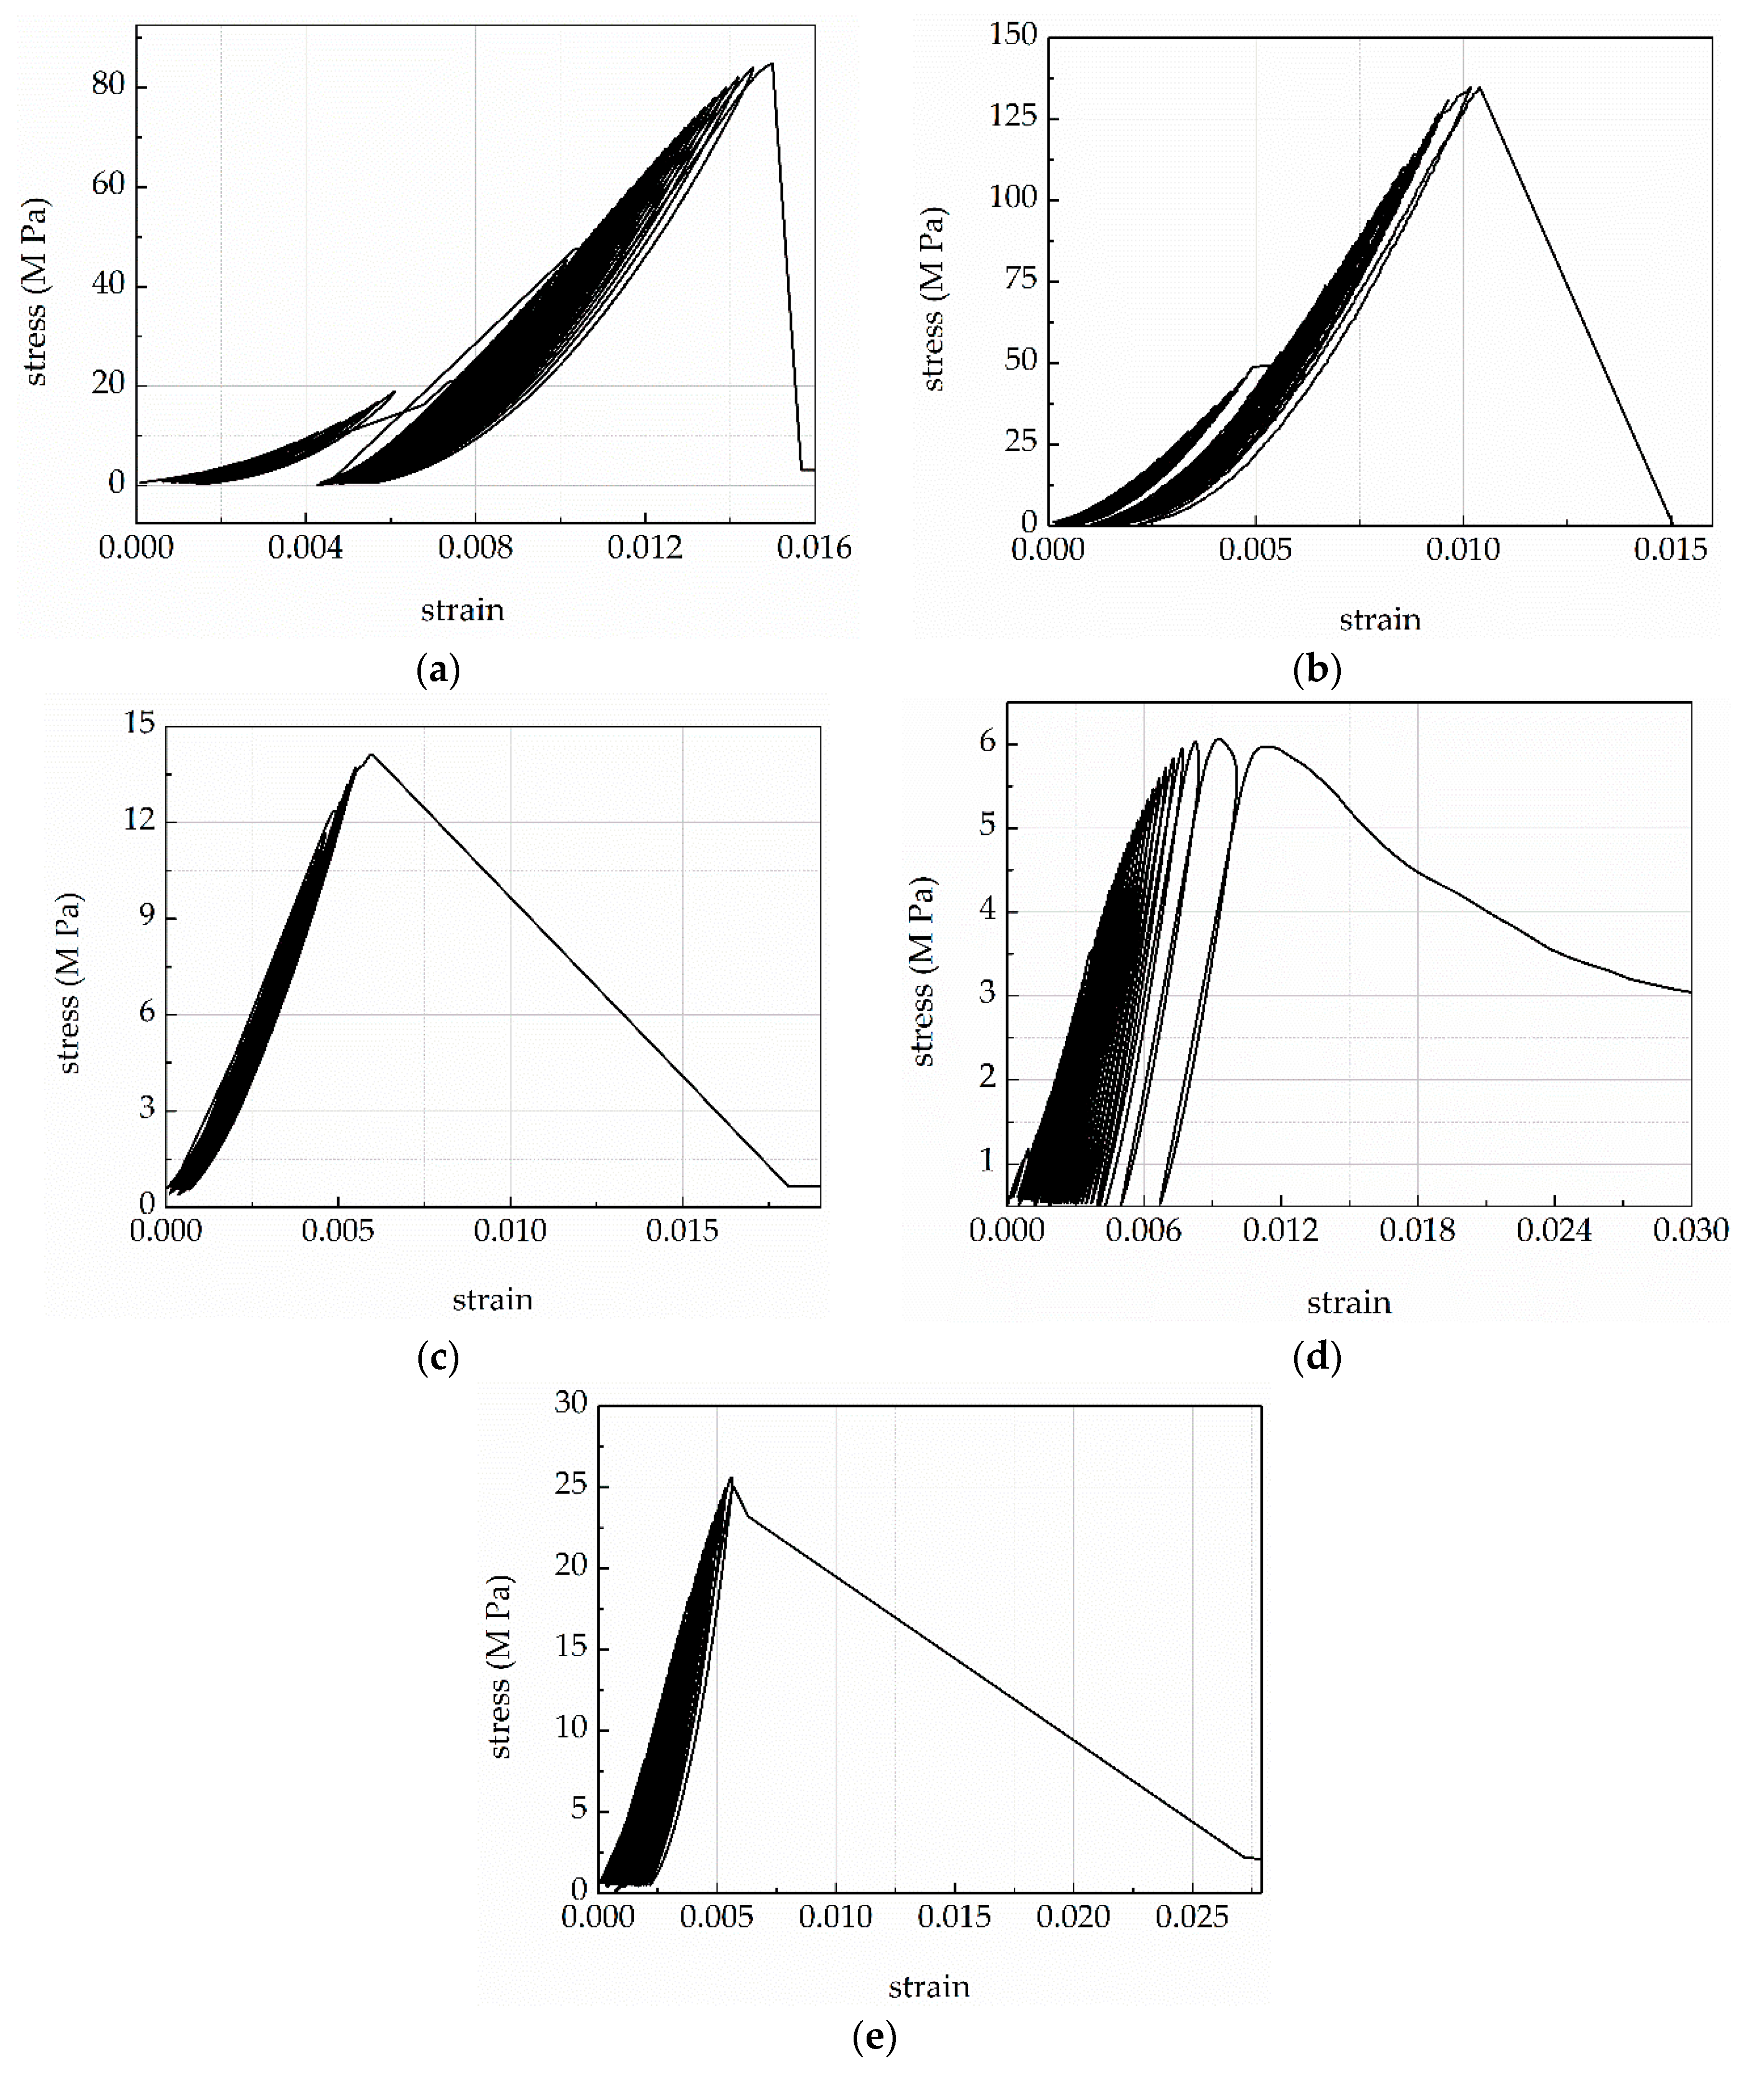
Figure 6.
Energy evolution processes for different rocks. (a) Red sandstone, (b) granite, (c) coal, (d) gypsum, and (e) high-water material.
Figure 6.
Energy evolution processes for different rocks. (a) Red sandstone, (b) granite, (c) coal, (d) gypsum, and (e) high-water material.
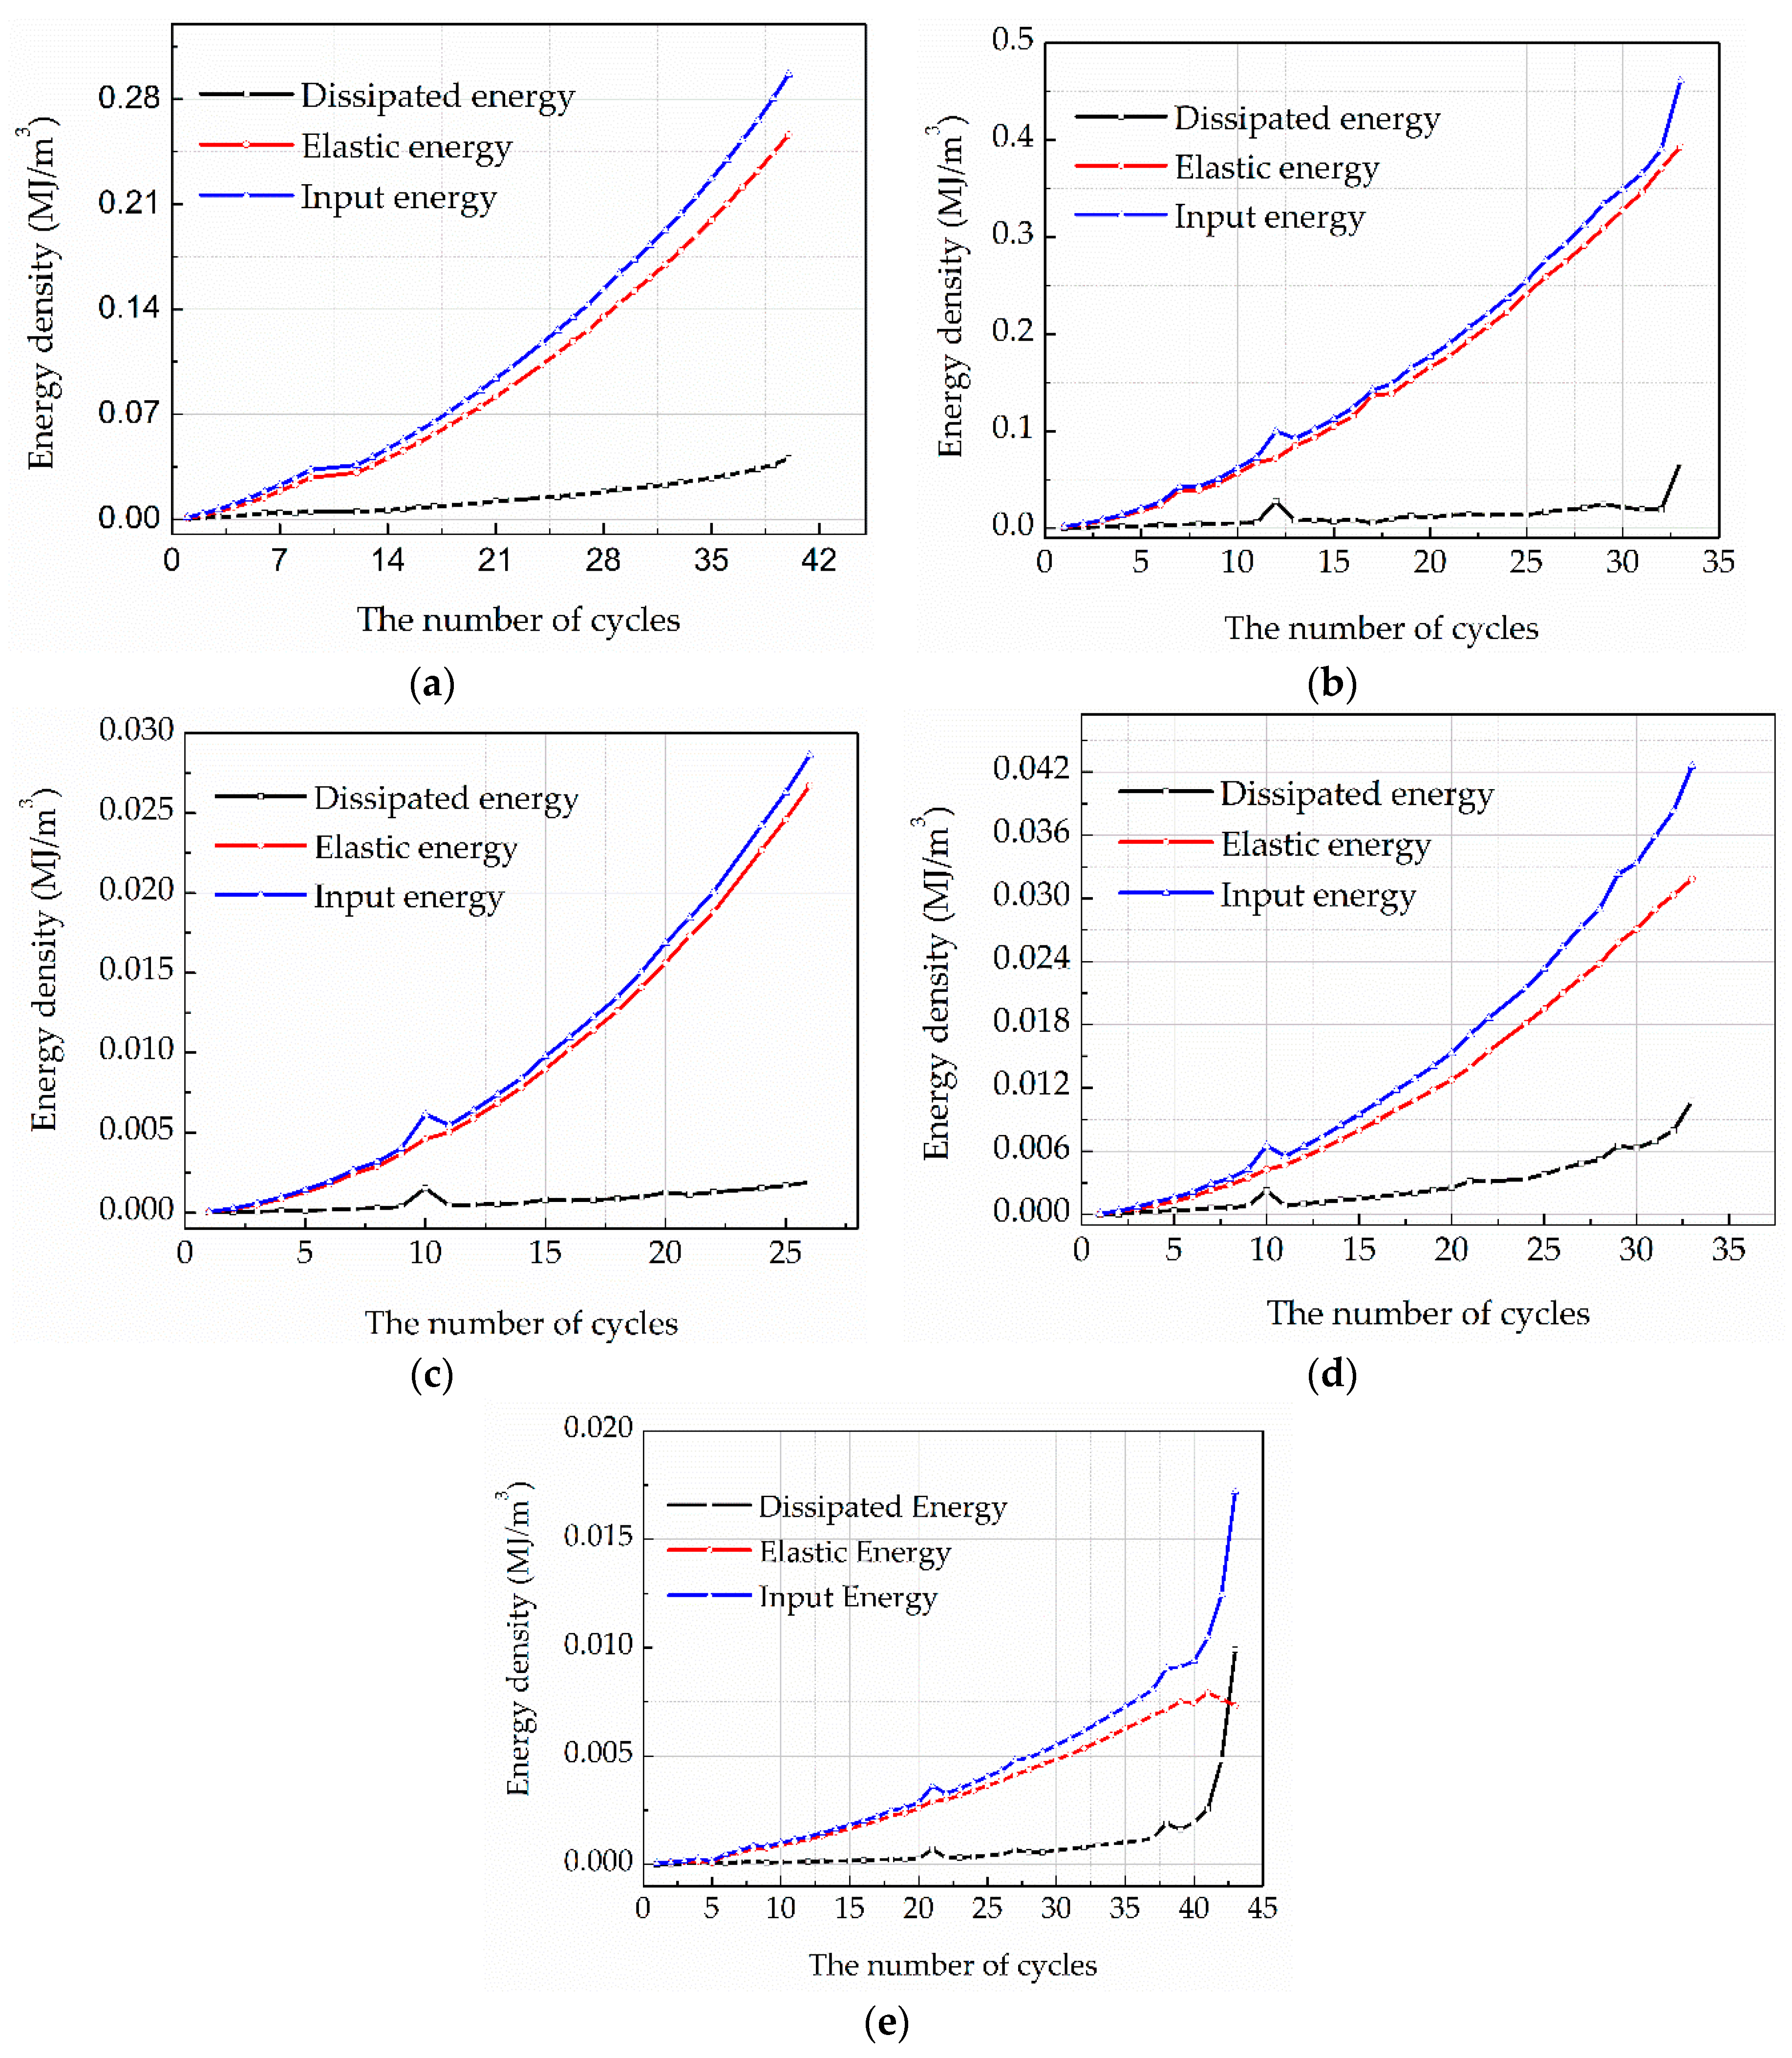
Figure 7.
Evolution of the ratio of dissipated energy to total input energy for the rocks.
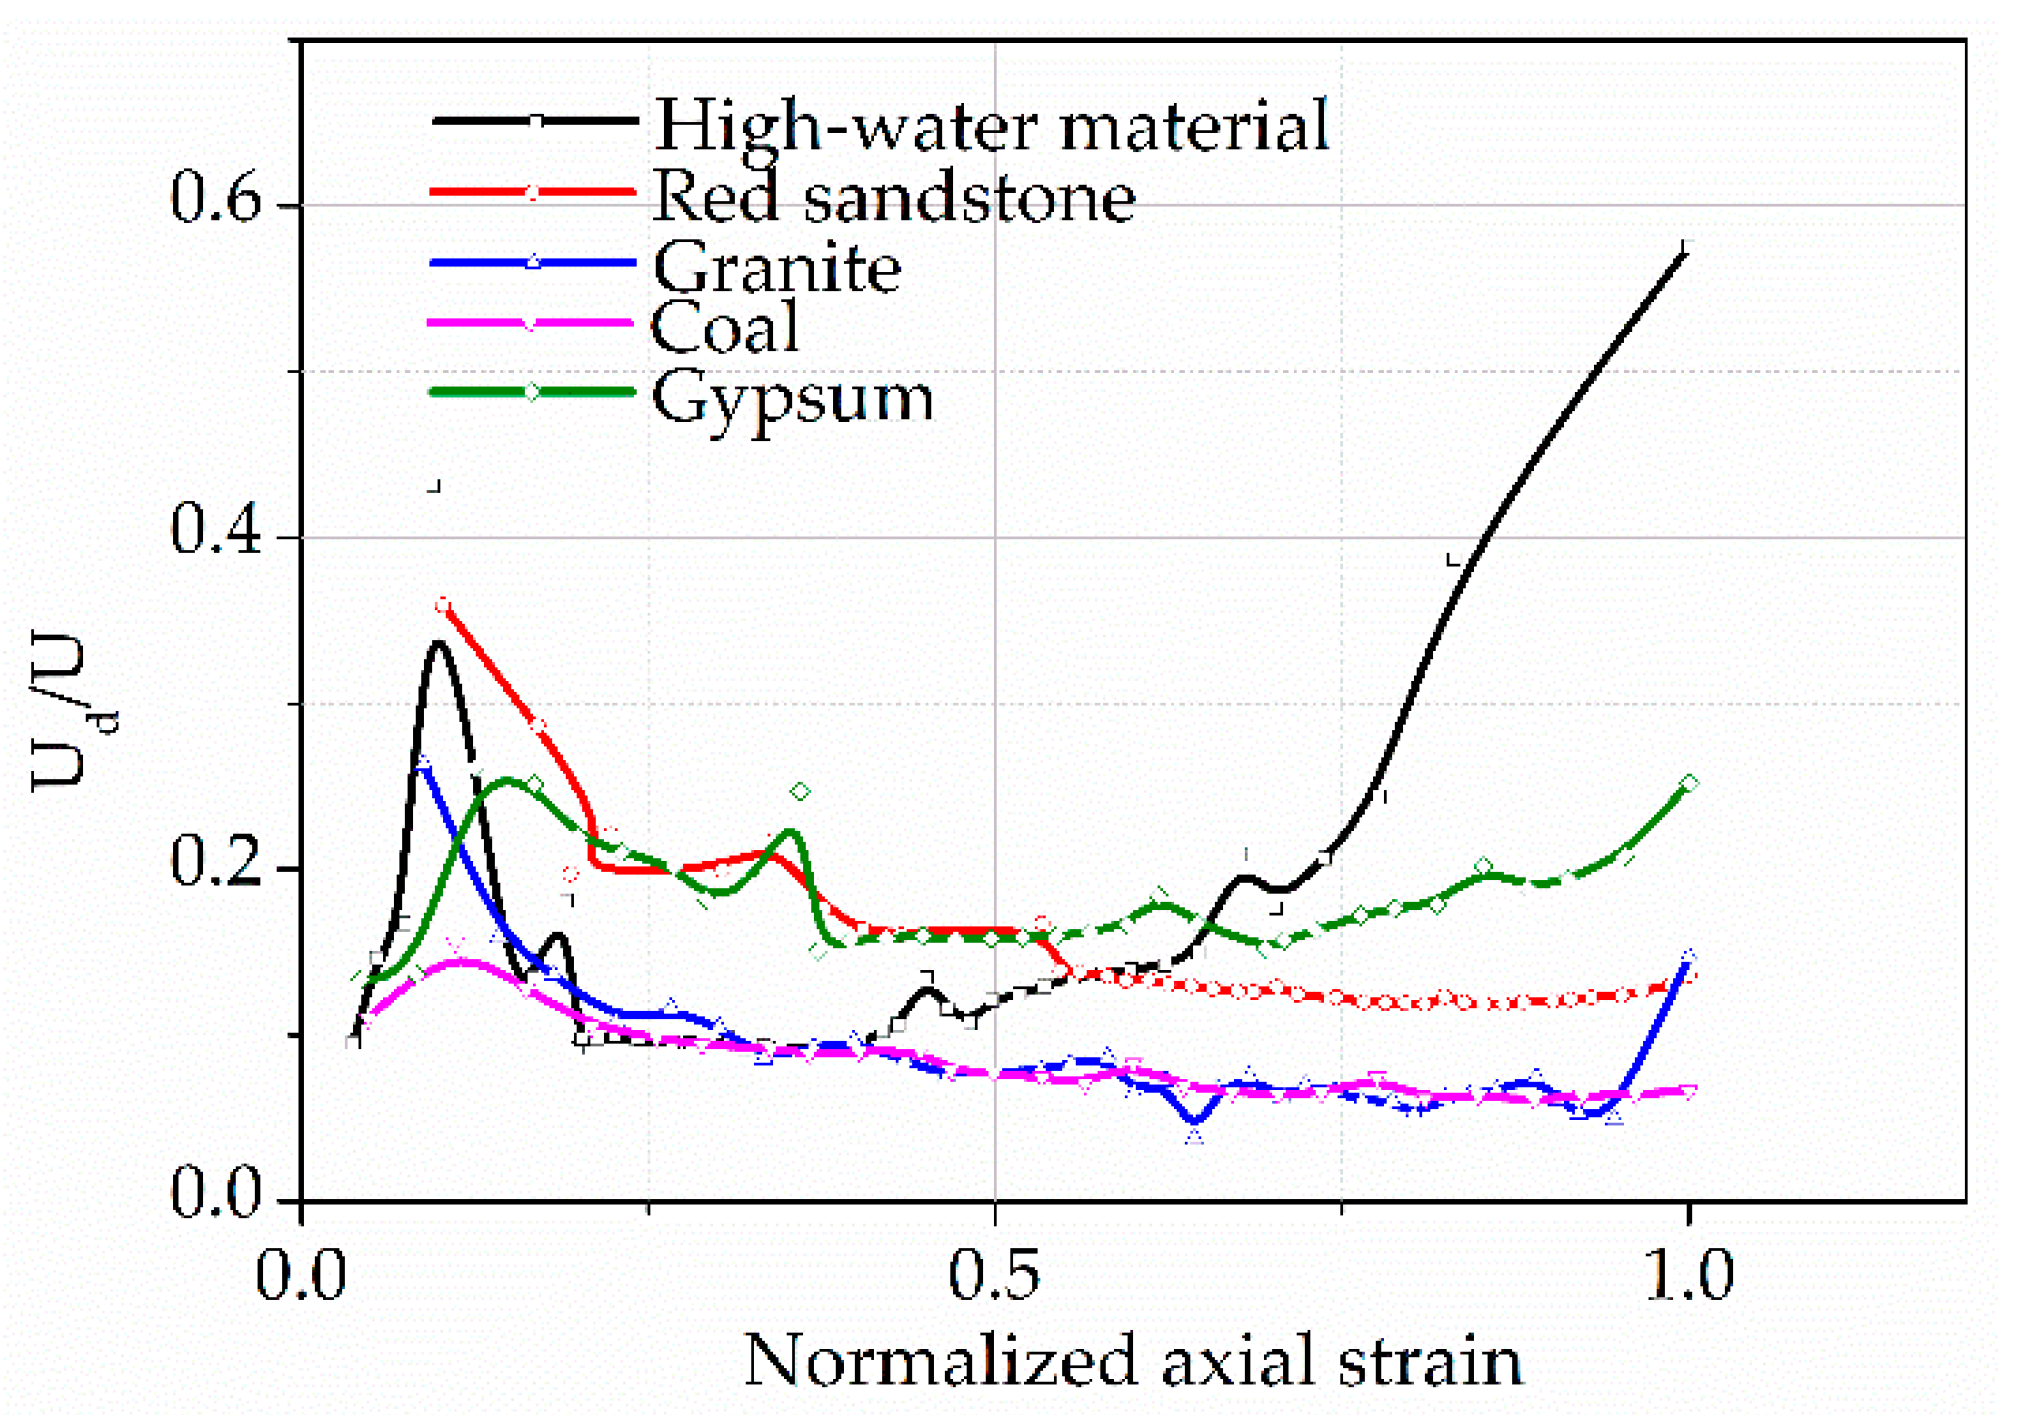
Figure 8.
The dissipation energy ratios and elastic energy ratios for the five rock materials.

Figure 9.
Variation of dissipated energy for different rocks.

Figure 10.
Evolution of the ratio of elastic strain energy to dissipated energy () for the rocks.
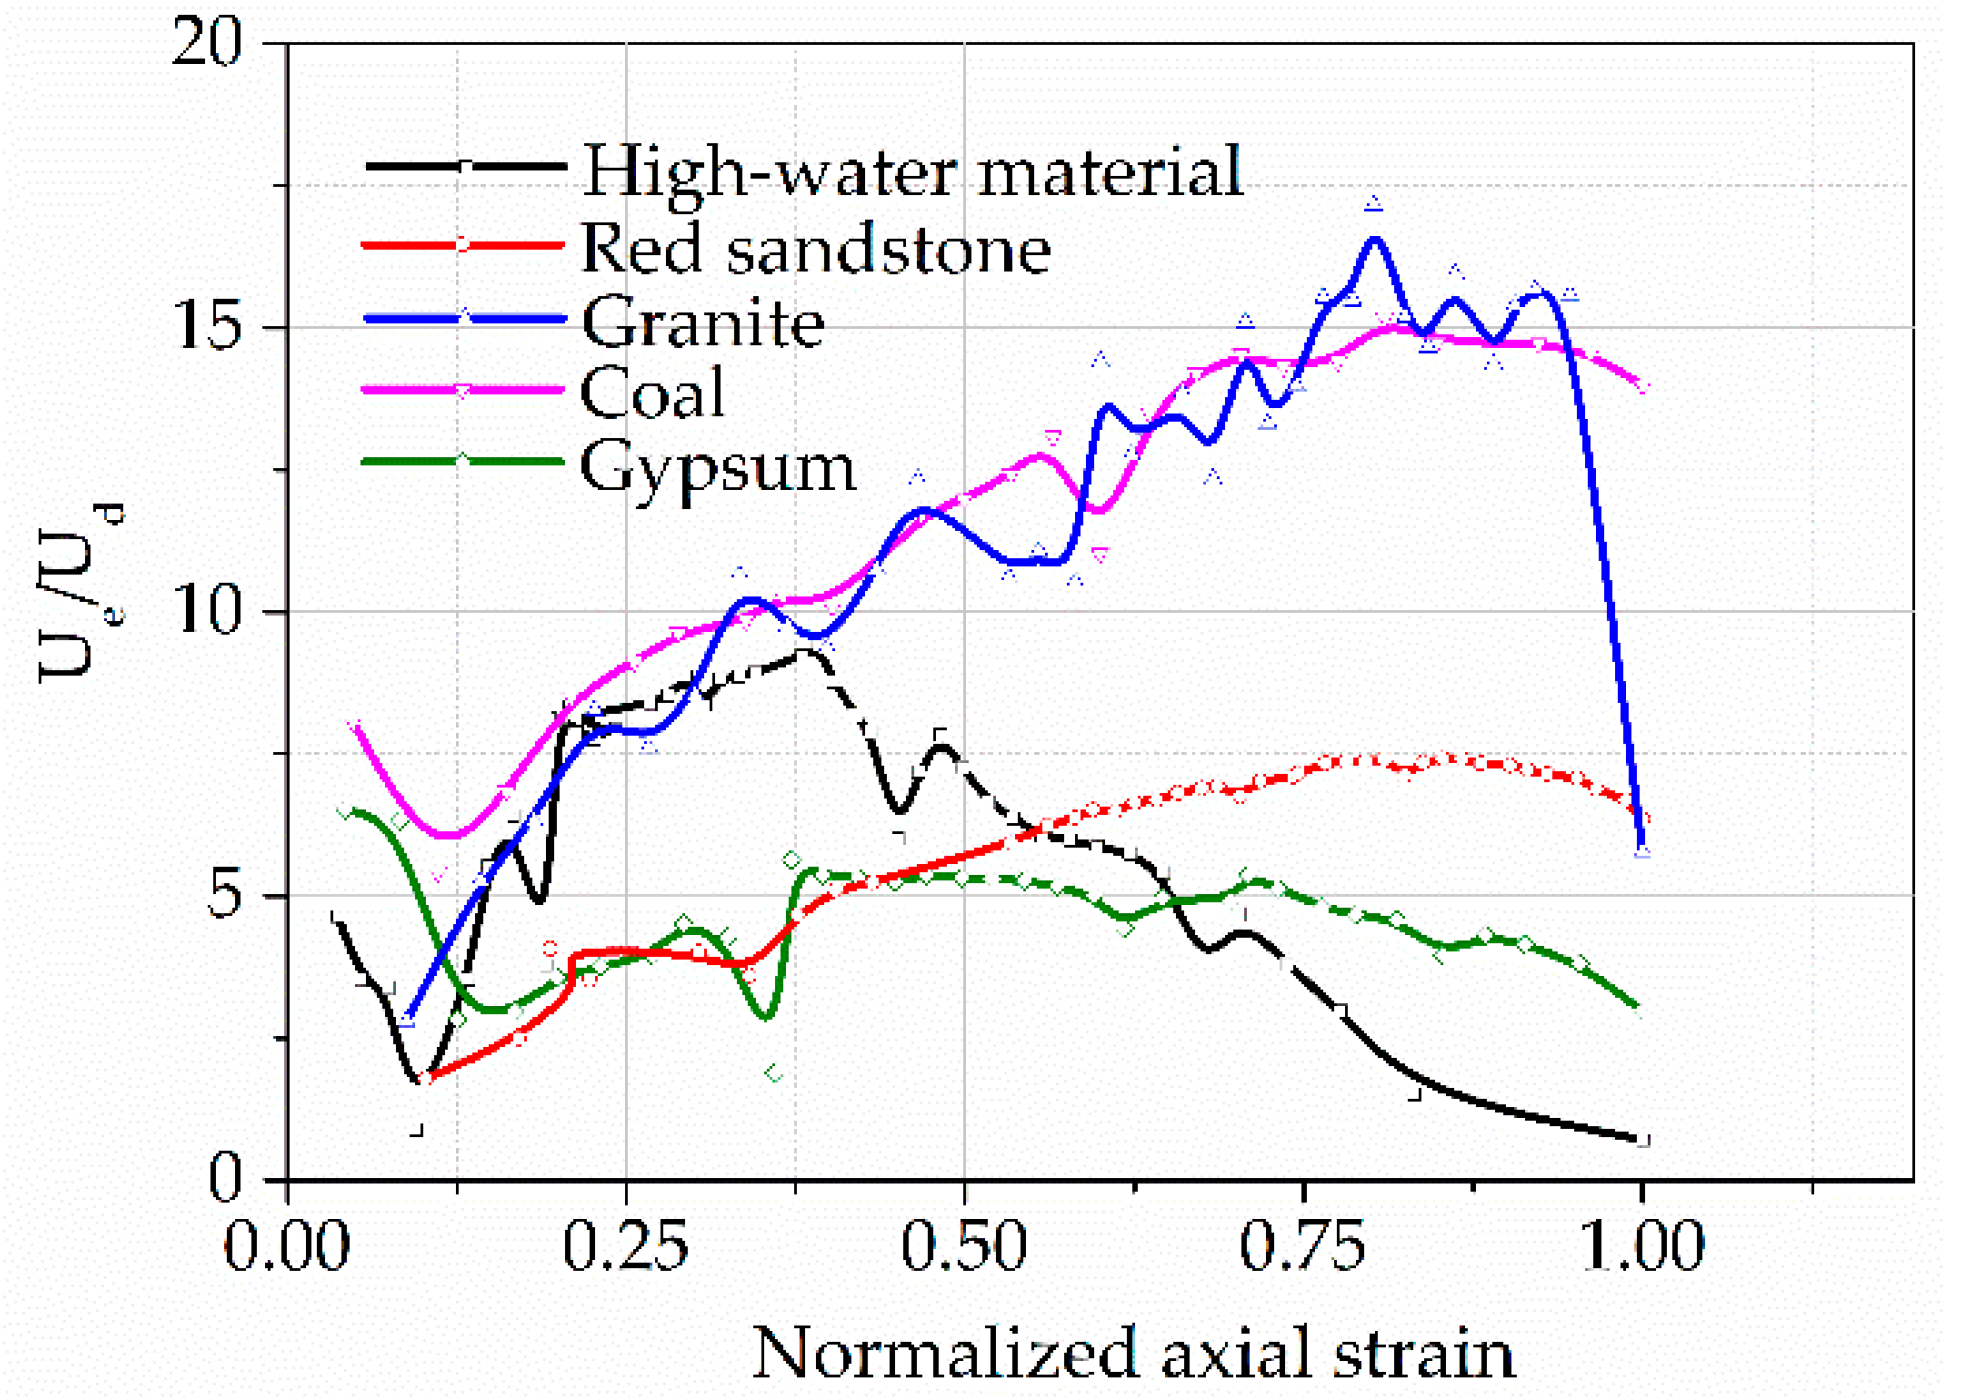
Figure 11.
Calculation of the energy preservation index.

Figure 12.
The indexes for rockburst tendency of five rock materials.

Figure 13.
Cumulative acoustic emission (AE) energy and AE energy rate with respect to time. (a) Granite, (b) coal, (c) high-water material, (d) red sandstone, and (e) gypsum.
Figure 13.
Cumulative acoustic emission (AE) energy and AE energy rate with respect to time. (a) Granite, (b) coal, (c) high-water material, (d) red sandstone, and (e) gypsum.

Figure 14.
Failure mode of five rock materials. (a) Granite, (b) gypsum, (c) red sandstone, (d) coal, and (e) high-water material.
Figure 14.
Failure mode of five rock materials. (a) Granite, (b) gypsum, (c) red sandstone, (d) coal, and (e) high-water material.

Table 1.
Physical properties of rock specimens.
| Lithology | Specimen Number | Diameter/mm | Height/mm | Weight/g | Longitudinal Wave Speed/Km·s−1 |
|---|---|---|---|---|---|
| Red sandstone | S1 | 49.49 | 100.33 | 474.56 | 2.358 |
| S2 | 49.35 | 100.38 | 481.47 | 2.632 | |
| S3 | 49.70 | 100.22 | 475.53 | 2.315 | |
| Gypsum | G1 | 49.32 | 100.20 | 439.99 | 4.808 |
| G2 | 49.30 | 100.30 | 434.33 | 4.032 | |
| G3 | 49.33 | 100.10 | 438.22 | 4.630 | |
| Granite | g1 | 50.00 | 100.30 | 510.31 | 3.676 |
| g2 | 49.70 | 100.16 | 506.56 | 3.731 | |
| g3 | 49.90 | 100.23 | 508.49 | 3.676 | |
| Coal | C1 | 49.30 | 100.00 | 231.52 | 1.852 |
| C2 | 49.16 | 99.60 | 232.64 | 1.838 | |
| C3 | 49.19 | 99.74 | 235.55 | 1.880 | |
| High-water material | H1 | 49.42 | 98.64 | 238.55 | 1.724 |
| H2 | 47.90 | 96.72 | 236.55 | 1.724 | |
| H3 | 48.30 | 98.22 | 237.64 | 1.761 |
Table 2.
Strength and loading parameters for different rocks. UCS: uniaxial compressive strength.
| Lithology | Red Sandstone | Gypsum | Granite | Coal | High-Water Material |
|---|---|---|---|---|---|
| UCS/M Pa | 60 | 25 | 120 | 15 | 6 |
| Loading step/KN | 4.00 | 1.5 | 8 | 1 | 0.5 |
| Loading rate/(KN/s) | 1 | 1 | 1 | 1 | 1 |
Table 3.
Strain energy density at peak point for the five rock materials.
| Rock Type | Granite | Red Sandstone | Coal | Gypsum | High-Water Material |
|---|---|---|---|---|---|
| Total input energy (MJ/mm3) | 0.461 | 0.297 | 0.0286 | 0.0426 | 0.0172 |
| Elastic energy (MJ/mm3) | 0.393 | 0.256 | 0.0267 | 0.0319 | 0.0073 |
| Accumulative dissipated energy (MJ/mm3) | 0.409 | 0.659 | 0.0242 | 0.0969 | 0.0369 |
Table 4.
The strain energy preservation indices of five rock materials.
| Rock Type | Granite | Red Sandstone | Coal | Gypsum | High-Water Material |
|---|---|---|---|---|---|
| 15.94 | 7.42 | 15.17 | 5.36 | 9.393 | |
| 15.58 | 6.33 | 13.99 | 2.96 | 0.703 | |
| (%) | 97.8 | 85.4 | 92.2 | 55.4 | 7.6 |
Table 5.
The failure duration and the step amplitude at the failure stage for five rock materials.
| Rock Type | Granite | Coal | Red Sandstone | Gypsum | High-Water Material |
|---|---|---|---|---|---|
| Step amplitude at failure | 1.57 × 10⁵ | 8.34 × 10⁴ | 1.94 × 10⁴ | 1.15 × 10³ | 4.93 × 10³ |
| Failure duration (s) | 0.5 | 1 | 0.8 | 1.5 | 8 |
| Released energy per unit time | 3.14 × 10⁵ | 8.34 × 10⁴ | 2.43 × 10⁴ | 7.67 × 10² | 6.16 × 10² |
Table 6.
The failure characteristics of five rock materials.
| Rock Type | AE Energy | Failure Mode | Rockburst Proneness | |
|---|---|---|---|---|
| Granite | Great | Numerous fragments | 0.978 | High |
| Coal | Relatively great | Numerous fragments | 0.922 | Relatively high |
| Red sandstone | Relatively great | Numerous fragments | 0.854 | Relatively high |
| Gypsum | Minor | A macroscopic | 0.554 | Low |
| High-water material | Minimum | Small cracks | 0.076 | No |
© 2020 by the authors. Licensee MDPI, Basel, Switzerland. This article is an open access article distributed under the terms and conditions of the Creative Commons Attribution (CC BY) license (http://creativecommons.org/licenses/by/4.0/).
Share and Cite
MDPI and ACS Style
Gao, L.; Gao, F.; Xing, Y.; Zhang, Z. An Energy Preservation Index for Evaluating the Rockburst Potential Based on Energy Evolution. Energies 2020, 13, 3636. https://doi.org/10.3390/en13143636
AMA Style
Gao L, Gao F, Xing Y, Zhang Z. An Energy Preservation Index for Evaluating the Rockburst Potential Based on Energy Evolution. Energies. 2020; 13(14):3636. https://doi.org/10.3390/en13143636
Chicago/Turabian StyleGao, Lin, Feng Gao, Yan Xing, and Zhizhen Zhang. 2020. "An Energy Preservation Index for Evaluating the Rockburst Potential Based on Energy Evolution" Energies 13, no. 14: 3636. https://doi.org/10.3390/en13143636
Note that from the first issue of 2016, this journal uses article numbers instead of page numbers. See further details here.