The Membrane-Less Microbial Fuel Cell (ML-MFC) with Ni-Co and Cu-B Cathode Powered by the Process Wastewater from Yeast Production


Institute of Environmental Engineering and Biotechnology, Faculty of Natural Sciences and Technology, University of Opole, Kominka Str. 6, 45-032 Opole, Poland
*
Authors to whom correspondence should be addressed.
Energies 2020, 13(15), 3976; https://doi.org/10.3390/en13153976
Submission received: 17 June 2020
/
Revised: 20 July 2020
/
Accepted: 23 July 2020
/
Published: 2 August 2020
(This article belongs to the Special Issue Microbial Fuel Cells II)
Abstract
:Research related to measurements of electricity production was combined with parallel wastewater parameter reduction in a membrane-less microbial fuel cell (ML-MFC) fed with industry process wastewater (from a yeast factory). Electrodes with Ni–Co and Cu–B catalysts were used as cathodes. A carbon electrode (carbon cloth) was used as a reference due to its widespread use. It was demonstrated that all analyzed electrodes could be employed as cathodes in ML-MFC fed with process wastewater from yeast production. Electricity measurements during ML-MFC operations indicated that power (6.19 mW) and current density (0.38 mA·cm−2) were the highest for Ni–Co electrodes. In addition, during the exploitation of ML-MFC, it was recorded that the chemical oxygen demand (COD) removal per time for all types of electrodes was similar to the duration of COD decrease in the conditions for wastewater aeration. However, the COD reduction curve for aeration took the most favorable course. The concentration of NH4+ in ML-MFC remained virtually constant throughout the measurement period, whereas NO3− levels indicated almost complete removal (with a minimum increase in the last days of cell exploitation).
1. Introduction
For many years, studies have been focused on a technology that can offer both energy and raw material production in a process of bioconversion from liquid waste. Such a solution could apply microbial fuel cells (MFCs) that could provide manners of generating electricity directly from biodegradable raw materials using bacterial or fungal cells [1,2]. The volume of energy accumulated in sewage is nine times higher than that needed for its utilization by conventional methods, and microbiological cells are the adequate technology to enable the use of this potential [1,3,4,5]. MFCs are bio-electrochemical systems (devices) in which bacteria are applied as catalysts for the oxidation of organic and inorganic matter, and for generating electricity [1,6]. In MFCs, oxidation of organic material occurs on the anode, and the results of this reaction include e−, H+ ions, and CO2. An example reaction for pure glucose can be defined as follows [1,7,8].
Many microorganisms grow on MFC electrodes, and some of them are not fully identified. The familiar microorganisms include bacteria from the groups Alfaproteobacteria, Betaproteobacteria, Gammaproteobacteria, Deltaproteobacteria, Clostridia, Bacteroidetes, Flavobacteria, Sphingobacteria, Deferribacteres, Spirochaetes, Planctomycetes, Nitrospirales, and fungi from Saccharomyces or Pichia [9,10,11,12,13,14,15]. However, it is increasingly common to apply bacteria to MFCs [1,5,16].
In the future, MFC technology could become a part of the energy system using waste products for purposes of electricity generation [1,4,5,10,11,12,13,14,15,16,17,18,19]. However, the first research concerned with the production of electricity by microorganisms was already carried out at the beginning of the 20th century [20]. At that time, such studies were considered a mere curiosity, and research in this area did not significantly develop. It was not until the 1960s that this concept was revived, after it was noted that microorganisms could provide a source of electricity [6,21,22]. However, at that time, adequate MFC operating parameters were not satisfied. In recent years, research concerned with the use of MFCs has been revived. Such studies include various directions and issues related to the use of various types of organic substances, varieties of materials applicable for electrodes, and different cell designs [1,2,4,7,23,24,25,26]. The variety of directions followed in the research leads to the increase in the performance of the cells and obtained current density, and a significant fall in the costs of their production. Research concerned with current density has allowed this value to increase from 0.1 mW·m−2 in the 1990s [13] to 1500 mW·m−2 [27], and in some cases up to 5850 mW·m−2, at the beginning of the 21st century [28]. Quite evidently, we should emphasize here that such values were recorded in cells fed with pure homogeneous substrates such as glucose or acetate, which simulated the organic substances contained in liquid waste. In the case of cells applying a mixture of organic compounds as fuel, i.e., actual wastewater, where the content of organic biomass is usually much smaller, unfortunately much lower values were obtained, most commonly in the range 260–450 mW·m−2 [3,29]. Research is still being performed into aspects of the performance of MFCs and attempts are being made to improve the existing technology. The undoubted goal is to create such a cell that is capable of generating the highest amount of energy with the lowest possible energy input [30]. There are many biological, physical, and chemical parameters that affect the operation of MFCs. One of these parameters is the type of fuel for an MFC, i.e., a biodegradable source of organic matter, ranging from pure compounds (e.g., acetate, glucose, cysteine, or ethanol) to mixtures comprising organic compounds, including liquid municipal and animal waste, leachate landfills, and liquid waste of agricultural and industrial origin [27,31,32,33]. Industrial wastewater is particularly useful for application in MFCs due to its constant composition. Yeast wastewater could form an example of such wastewater, as it is treated in dual-stage (anaerobic) biological wastewater treatment plants and, in many cases, it is employed to play the role of organic fertilizer in agriculture [34,35,36,37,38]. This wastewater is characterized by a high content of nitrogen, phosphorus, and organic compounds (i.e., substances necessary for bacteria to thrive), and thus it can be used in MFC technology [35,37]. Another parameter is associated with the material applied to build the electrodes. In MFCs, carbon materials (cloth, felt, brushes, etc.) are most commonly utilized, often with the addition of platinum or gold, due to the high catalytic activity of these metals [33,39,40,41,42,43,44,45,46,47]. However, the addition of platinum as well as gold leads to a considerable increase in the price of electrodes. For that reason, to reduce the electricity production and wastewater treatment costs, it is required to search for other catalysts that do not contain valuable metals [48,49,50,51,52,53,54,55]. Due to the fact that microorganisms [1] play the role of the anode catalyst, it is crucial to adjust appropriate cathode catalysts, although there has been research using metal electrodes as MFC cathodes with success [1,25,26,49,56,57]. The next parameter affecting the cell’s performance is the ion-selective transport membrane (PEM). PEM determines the efficient transport of protons towards the cathode, but its small surface can form an impediment, leading to a decrease in the rate of reactions in the cell [58,59]. The membrane (PEM) plays the role of an element that significantly increases the cost of MFCs. For this reason, constant analysis deciding on the feasibility of their use is under way, and efforts are being carried out with the goal of designing much cheaper cells excluding PEMs [60,61,62,63]. This work explored areas related to research carried out into the use of Ni–Co and Cu–B electrodes in a membrane-less microbial fuel cell (ML-MFC) fed with yeast process wastewater.
2. Materials and Methods
Process wastewater derived from yeast production was applied for the present research. Yeast wastewater from vacuum filters was used in the measurements. Such filters are applied to extract water from yeast milk. This wastewater has the smallest concentration of pollutants of all process wastewater generated in the yeast production process [34]. Figure 1 presents the site where wastewater applied and the measurements were generated (Figure 1, W5).
In Table 1, a summary of the initial parameters of wastewater deployed in the measurements can be found (W5 in Figure 1).
The measurement methodology involved measurements of both the variations in wastewater parameters: chemical oxygen demand (COD), NH4+, NO3− and electrical measurements (power, cell voltage, current density) related to ML-MFC operation.
Measurements of sewage parameters were carried out for three different reactors: without aeration (R1), with aeration (R2), and an MFC (R3). The applied reactors R1 and R2 had a capacity of 15 L. In R1, the sewage was in contact with air only through the interface of the wastewater. In R3, the wastewater was constantly aerated (240 L·h−1). The third reactor (R3) was a ML-MFC. The measurements were carried out until 90% of the COD reduction efficiency was obtained [64]. Figure 2 presents the three reactors, R1, R2, and R3, used in the measurements.
Figure 3 shows the diagram and components of the ML-MFC (R3) applied in the measurements.
The ML-MFC took the shape of a pipe (120 × 250 mm). The level of wastewater in the MFC was about 200 mm. A plexiglass pipe was used in the design of the cell plexi (7 in Figure 3). From the bottom, the pipe was closed with a plug made with 3D-printing technology and sealed with silicone. The anode section contained the wastewater intake (11 in Figure 3), and the cathode section contained the wastewater outflow (1 in Figure 3). ML-MFC was combined with the external wastewater tank by the intake and outtake of the wastewater. Wastewater was slowly circulated (0.05 L·h−1) in a closed loop. The volume of sewage in the entire system was 15 L (ML-MFC + an external tank), which corresponded to the capacity of the other reactors (Figure 2). The cell was divided into an anode (in the lower part) and a cathode (in the upper part). As a consequence of the location of the cathode chamber in the upper part of the cell, the possibility of anode aeration was largely eliminated. After the aeration of the cathode chamber, air was drained directly into the environment. In addition, the chambers (sections) were separated by a layer of glass wool and glass balls (2 and 3 in Figure 3) [62,63]. This procedure was designed to separate the aerated part (cathode space) from the unaerated section (anode space). To ensure that the glass wool and beads were kept at a given location, a spatial ABS (acrylonitrile butadiene styrene) plastic mesh was installed under a layer of mineral wool. This mesh was made by 3D printing and ensured the free flow of wastewater. ABS material in filament form (diameter 1.75 mm) was used as material for 3D printer. The 3D print was made with high accuracy (single print layer, 0.09 mm). The air was fed directly under the cathode. The cathode aeration performance was 5 L·h−1.
In this research, the role of the anode was played by a carbon cloth, whereas the cathode was an electrode (copper mesh) with a Ni–Co catalyst (15% Co), an electrode (copper mesh) with a Cu–B catalyst (9% B), or a carbon cloth applied as the reference for the Ni–Co and Cu–B cathodes. The surface area of the anode was 15 cm2, whereas for the anode it was 10 cm2. The ML-MFC had an external charge in the form of an external 100 Ω resistor.
Ni–Co and Cu–B electrodes were designed and manufactured by electrolytic melt deposition [65,66]. A mixture comprised mainly of NiSO4 and CoSO4 was utilized to obtain the alloy of Ni–Co [65,67]. For the purpose of conducting electrochemical deposition, the temperatures of 293–323 K, at a current density of 1–3 A·dm−2 and a pH of 2.0–5.5, were used [25,65]. The mixture consisting mainly of NaBH4 and CuSO4 was utilized to obtain the Cu–B alloys [26]. To conduct this process, the temperatures of 355–365 K, at a current density 1–3 A·dm−2 and a pH of 2.0–5.0, were applied [26,66]. For the purpose of ensuring appropriate wettability of the copper mesh, it underwent washing with 25% aqueous KOH before the application process of electrolytic deposition of the alloy. Subsequently the copper mesh was washed in acetic acid and later in alcohol.
Measurements in the first two reactors (R1 and R2 in Figure 2) included measurements of wastewater parameters (COD, NH4+, and NO3−), whereas the measurements related to the ML-MFC included both analysis of wastewater parameters and electrical parameters (COD, NH4+, and NO3−, and power, current density, and cell voltage). Measurements of the wastewater parameters and the cell voltage were carried out at one day intervals. Each such measurement was carried out in ten trials. The wastewater parameters (COD, NH4+, and NO3−) can be determined by the analytical methods [68,69,70], however in this work, the colorimetric methods were used for the measurement of COD, NH4+, and NO3−. All measurements were carried out at 20 °C.
To prepare the 3D objects (plastic mesh and MFC plug) for printing, and for printing the spatial plastic mesh and the MFC plug, (4 and 6 in Figure 3) a M200 printer with Z-Suite software (Zortrax S.A, Olsztyn, Poland) was used. During measurements of the wastewater parameter a HI 83224 colorimeter (HANNA Instruments, Woonsocket, RI, USA) was used. During measurements of the current and cell voltage, an 8840A multimeter (Fluke Corporation, Everett, WA, USA) was used. For measurements of the current density a System 500 potentiostat (Amel S.l.r., Milano, Italy) with CorrWare software (Scribner Associates Inc., Southern Pines, NC, USA) was used.
3. Results and Discussion
Figure 4 contains details of the reduction of COD over time for the three types of reactors and the three types of ML-MFC cathodes (R1, R2 and R3 in Figure 2).
As we can see from Figure 4, a COD removal rate of 90% (1050 mg⋅L−1) from the initial value for the reactor without aeration (R1 in Figure 2) took 37 days. In the case of the reactor with aeration, the COD reduction to the assumed level (i.e., removal by 90%) took 17 days (R2 in Figure 2), which is about half of the time recorded for the case of reactor without aeration. The removal rate of this parameter by 90% (19, 20, and 21 days depending on the type of electrode) for the ML-MFC was similar to the removal time in the process with aeration. It should be noted that, for all cathodes applied in the testing (Ni–Co, Cu–B, carbon cloth), the time it took for COD concentration to decrease in ML-MFC was similar. Despite the same COD reduction time for an aerated reactor (R2 in Figure 2) and for the ML-MFC (R3 in Figure 2), the curve characteristics for aeration were much more favorable. In the initial phase, the increase in the COD reduction rate took a shorter period of time. A removal efficiency of 80% (up to 2100 mg⋅L−1) was obtained after just four days. After this time, the COD reduction rate decreased considerably. When the ML-MFC was used, the COD reduction remained virtually constant throughout the measurement period. The differences in the rate of reduction of this parameter for different catalysts were small. We should note, however, that for Ni–Co catalyst, 50% efficiency of COD reduction (up to 5250 mg⋅L−1) was obtained over the first eight days, whereas for Cu–B catalysts and carbon cloth took over 9 and 10 days, respectively. After 11 days, however, COD concentration dropped the fastest when carbon cloth was applied as the cathode.
Figure 5 presents details of the variations in NH4+ concentration over time. The variations in concentration were recorded for the three types of reactors and the three types of ML-MFC cathode (Ni–Co, Cu–B, carbon cloth).
Analysis of measurements of the shift in NH4+ concentration demonstrated that, only in the case of aeration (R2 in Figure 2) using yeast effluent, was it reduced by 70%. For the reactor without aeration (R1 in Figure 2), NH4+ levels remained constant throughout the measurement period. However, during measurements using the ML-MFC (R3 in Figure 2) for all cathodes used (Ni–Co, Cu–B, carbon cloth), a slight increase in NH4+ concentration was recorded.
Figure 6 contains details of the shift in concentration of NO3− over time. The variations in concentration were recorded for the three types of reactors and the three types of ML-MFC cathode (Ni–Co, Cu–B, carbon cloth).
During the measurement of shifts in NO3− concentration in the ML-MFC (for all cathodes used: Ni–Co, Cu–B, and carbon cloth), it was observed that this level was reduced by 70% within 12 days, but that after that time, the concentration started to increase again. The increase in concentration after 12 days was, however, insignificant, and dependent on the type of the cathode applied in the test.
The increase in NH4+ concentration was due to the capture of hydrogen ions by the ammonia particle (occurring, e.g., during putrefaction) [71,72,73], whereas the increase in NO3− (Figure 5 and Figure 6) concentration resulted from the nitrification process during bacterial growth [1,73,74].
The cell voltage (with a Cu–B, Ni–Co, or carbon cloth cathode) obtained during the operation of the ML-MFC (Figure 3) is shown in Figure 7. Measurements were made at one-day intervals.
As demonstrated in Figure 7, the cell voltage for each type of cathode was at a similar level. However, slightly higher voltage (0.1 V on average) was noted for the cathode with a Ni–Co catalyst, as well as the one comprising carbon cloth. Higher voltage for the Ni–Co cathode was noted especially in the early days of the operation of the ML-MFC cell. When Cu–B catalyst was used, the cell voltage was noticeably lower (compared to the use of Ni–Co and C catalysts) after 8 days of the operation of the ML-MFC.
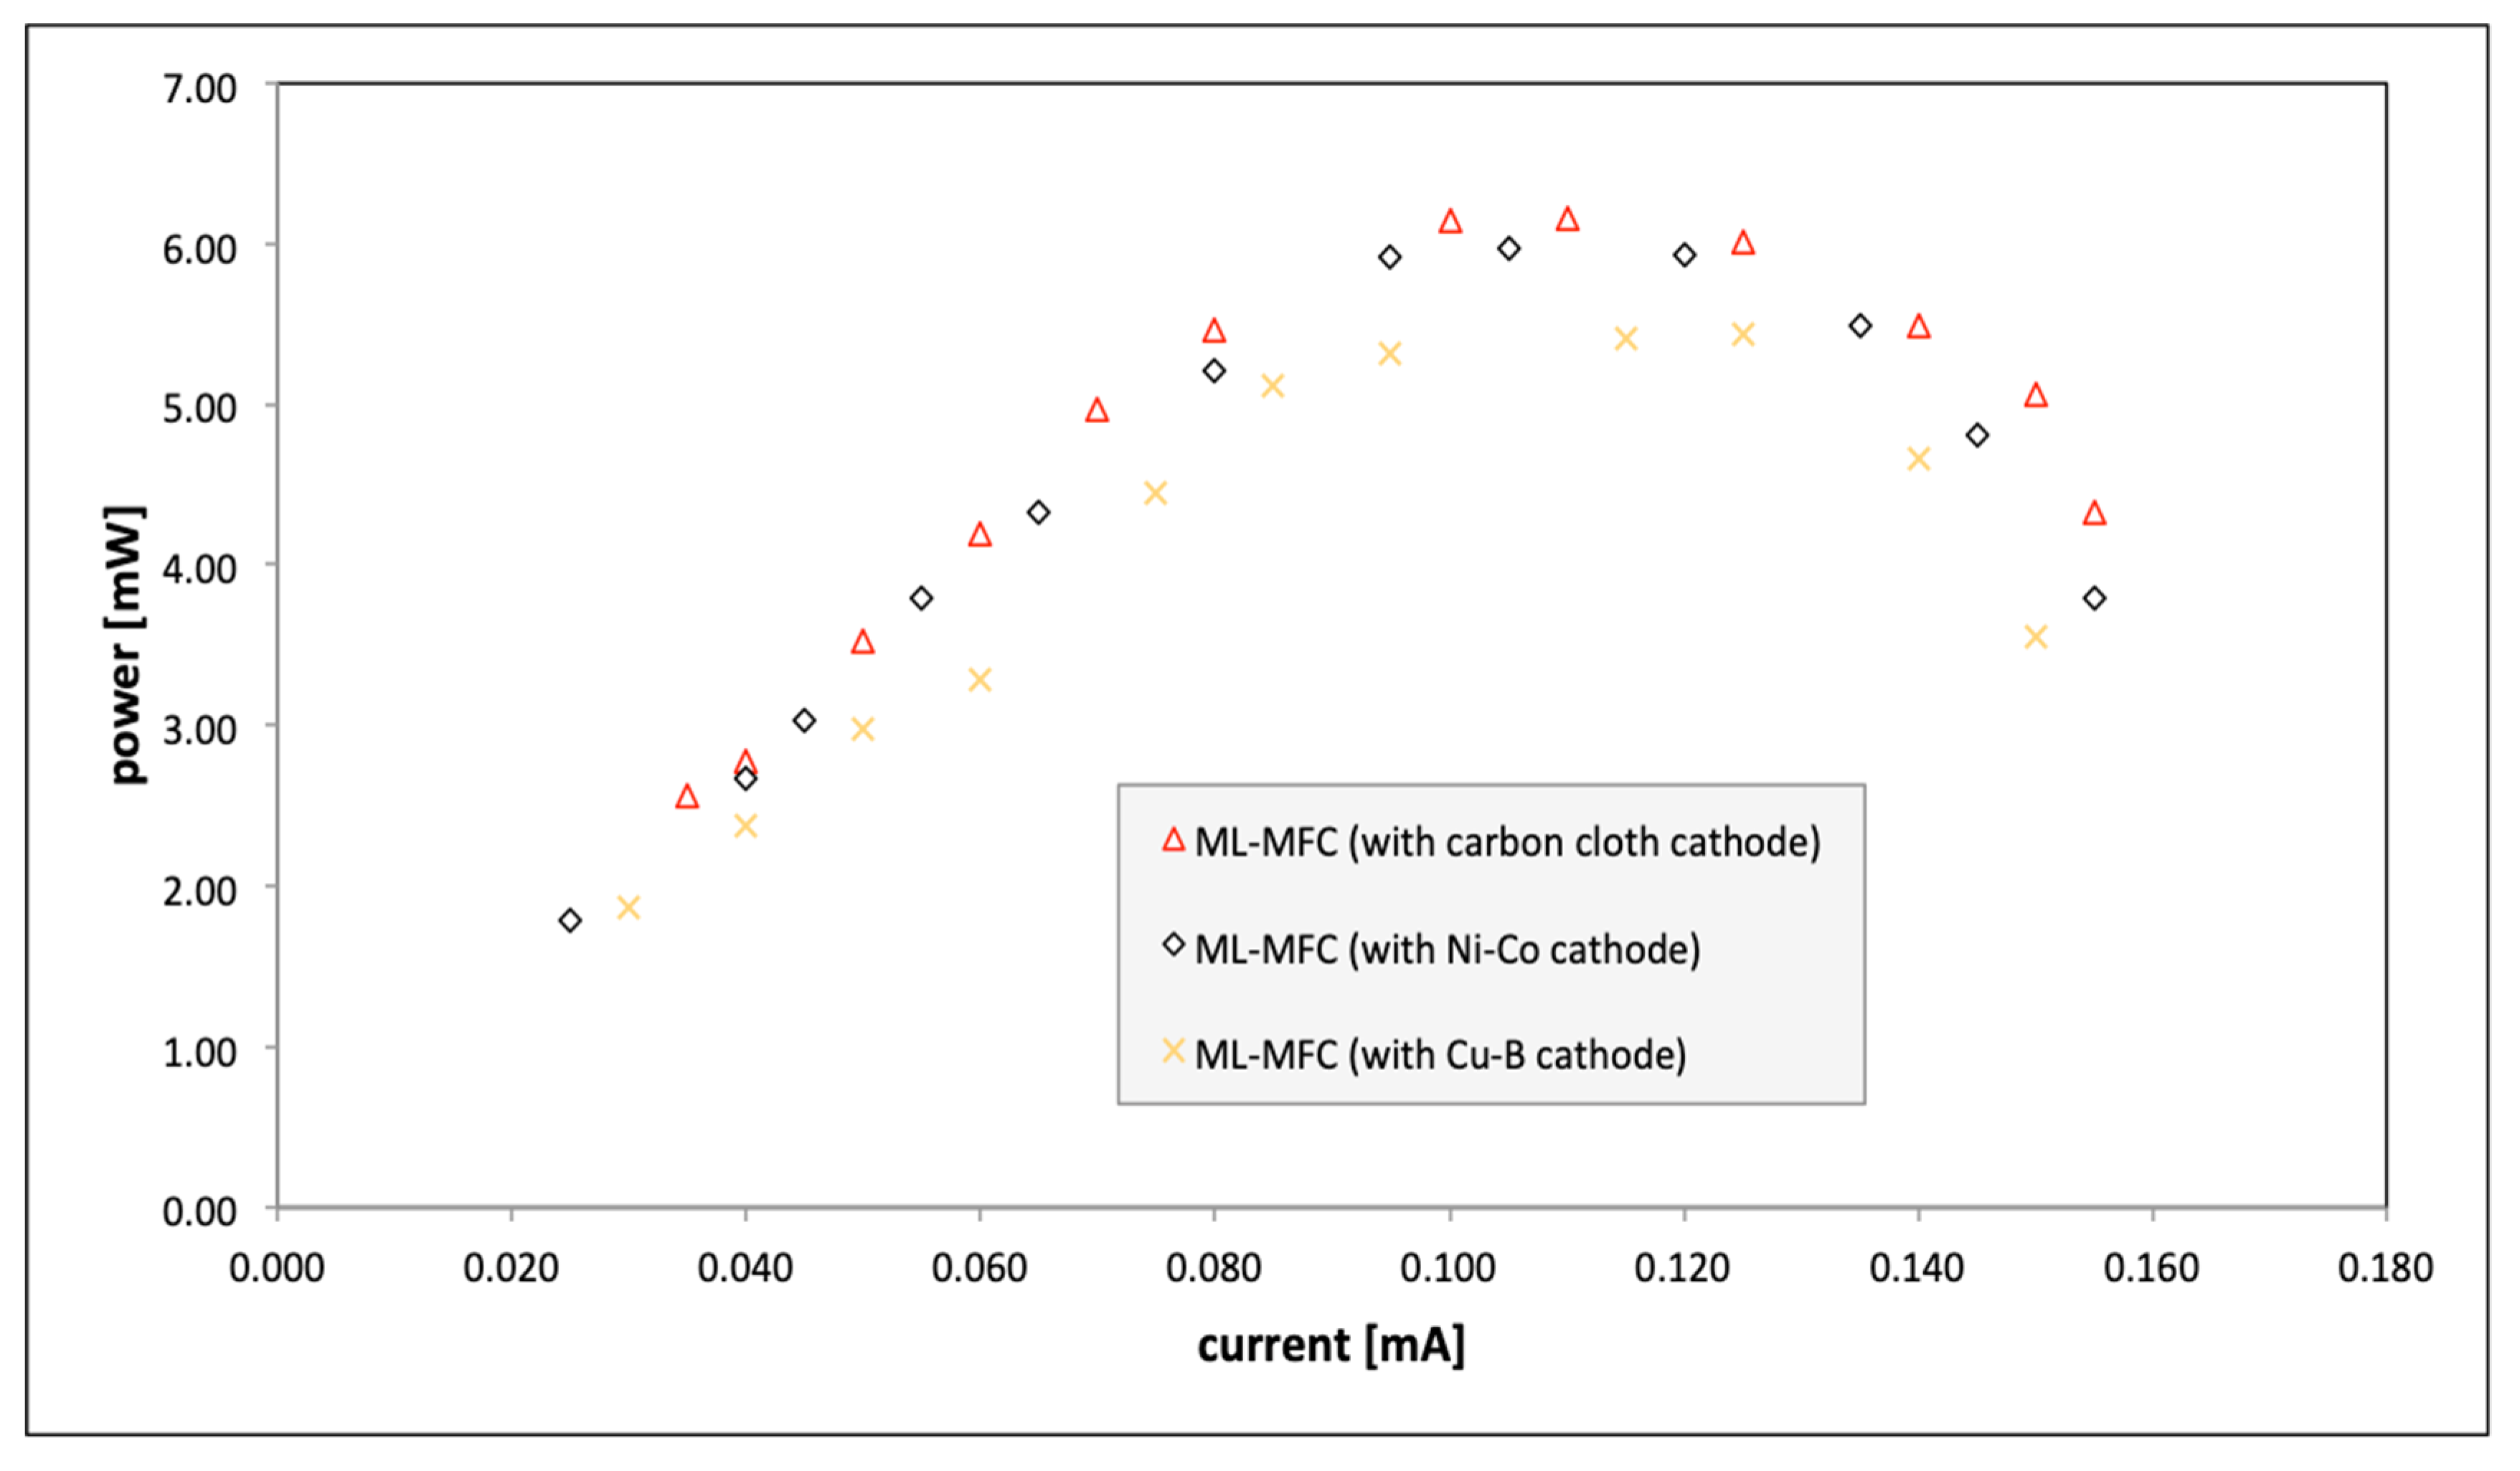
The power curves of the ML-MFC (with a Cu–B, Ni–Co, or carbon cloth cathode) obtained during the operation of the ML-MFC (Figure 3) is shown in Figure 8.
ML-MFC power measurements demonstrated that the highest values were more clearly obtained for electrodes (cathodes) made of carbon cloth and Ni–Co catalysts (Figure 8, black and red markers). When the cathode with a Cu–B catalyst was applied, the power output was clearly lower (Figure 8, yellow markers). In addition, based on the cell voltage, current level, and electrode surface, the maximum current densities obtained in the ML-MFC (Figure 3) for the various cathodes used were calculated. The following results were recorded: 0.38 mA·cm−2 and power output of 6.19 mW for the Ni–Co catalyst (Figure 8, red markers), 0.32 mA·cm−2 and a power output of 5.43 mW for the Cu–B catalyst (Figure 8, yellow markers), and 0.19 mA·cm−2 and a power output of 5.99 mW for the carbon cloth catalyst (Figure 8, black markers), respectively. Table 2 summarizes the electrical parameters of the ML-MFC for different types of cathodes.
4. Conclusions
The measurements demonstrated that the assumed level of 90% COD concentration removal was obtained by all investigated reactors (Figure 4). However, the time needed to remove the COD was different for each type of reactor. The most adequate characteristics of the COD removal curve were recorded for the reactor with aeration (Figure 4, blue markers). At this point, we should note that the final COD removal rate equal to 90% for the ML-MFC was similar to that of the reactor with aeration for all types of cathodes used (Figure 4, red, black, and yellow markers). However, the shortest removal time was obtained by a Ni–Co catalyst (Figure 4, red markers). In the case of the measurements of NH4+ concentration for ML-MFC cells, this parameter did not decrease and the concentration level even slightly increased (Figure 5). The measurements of the variations in NO3− concentration in the ML-MFC (for all cathodes used: Ni–Co, Cu–B, and carbon cloth) demonstrated that after 12 days this parameter was reduced by 70%; however, after that time the concentration began to increase again (Figure 6). Cell voltage measurements indicated that for all cathodes the ML-MFC voltage remained at a similar level (0.9–1.0 V) for about 2 to 12 days. After 14 day, the voltage began to gradually decrease to about 0.8 V (the lowest for the Cu–B cathode). We can also note that the highest values were obtained for the Ni–Co cathode (similar values were obtained for the carbon cloth), whereas the lowest values were obtained for the Cu–B cathode. The highest ML-MFC power values were also obtained using a Ni–Co cathode, although the parameters were similar to those obtained using a carbon fabric cathode. A similar result was recorded when the levels of the current density were recorded.
On the basis of the results of the testing, we can conclude that the cathode with the Ni–Co catalyst was just as suitable for use in the L-MFC as the carbon cloth cathode. The Cu–B alloy had a slightly poorer performance parameters, and noticeably deteriorated after several days of the operation of the ML-MFC (cell voltage, current density).
Author Contributions
Data curation, B.W. and P.P.W.; investigation, B.W. and P.P.W.; methodology, B.W. and P.P.W.; writing—original draft, P.P.W. and B.W.; writing—review and editing, P.P.W. and B.W.; supervision, B.W. and P.P.W. All authors have read and agreed to the published version of the manuscript.
Funding
This research received no external funding.
Conflicts of Interest
The authors declare no conflict of interest.
References
- Logan, B. Microbial Fuel Cells; Wiley: Hoboken, NJ, USA, 2008. [Google Scholar]
- Rabaey, K.; Verstraete, W. Microbial fuel cells: Novel biotechnology for energy generation. Trends Biotechnol. 2005, 23, 291–298. [Google Scholar] [CrossRef] [PubMed]
- Cusick, R.D.; Kim, Y.; Logan, B.E. Energy capture from thermolytic solutions in microbial reverse-electrodialysis cells. Science 2012, 335, 1474–1477. [Google Scholar] [CrossRef] [PubMed] [Green Version]
- Franks, A.E.; Nevin, K.P. Microbial fuel cells, a current review. Energies 2010, 3, 899. [Google Scholar] [CrossRef]
- Flimban, S.G.A.; Ismail, I.M.I.; Kim, T.; Oh, S.-E. Overview of recent advancements in the microbial fuel cell from fundamentals to applications: Design, major elements, and scalability. Energies 2019, 12, 3390. [Google Scholar] [CrossRef] [Green Version]
- Berk, R.S.; Canfield, J.H. Bioelectrochemical energy conversion. Appl. Microbiol. 1964, 12, 10–12. [Google Scholar] [CrossRef] [Green Version]
- Liu, H.; Ramnarayanan, R.; Logan, B.E. Production of electricity during wastewater treatment using a single chamber microbial fuel cell. Environ. Sci. Technol. 2004, 38, 2281–2285. [Google Scholar] [CrossRef]
- Rabaey, K.; Alterman, P.; Clauwaert, P.; de Schamphelaire, L.; Boon, N.; Verstraete, W. Microbial fuel cells in relation to conventional anaerobic digestion technology. Eng. Life Sci. 2006, 6, 285–292. [Google Scholar]
- Chiao, M.; Lam, K.B.; Lin, L. Micromachined microbial and photosynthetic fuel cells. J. Micromech. Microeng. 2006, 16, 2547–2553. [Google Scholar] [CrossRef]
- Lee, J.; Phung, N.T.; Chang, I.S.; Kim, B.H.; Sung, H.C. Use of acetate for enrichment of electrochemically active microorga-nisms and their 16S rDNA analyses. FEMS Microbiol. Lett. 2003, 223, 185–191. [Google Scholar] [CrossRef] [Green Version]
- Mitra, P.; Hill, G.A. Continuous microbial fuel cell using a photoautotrophic cathode and a fermentative anode. Can. J. Chem. Eng. 2012, 90, 1006–1010. [Google Scholar] [CrossRef]
- Prasad, D.; Arun, S.; Murugesan, M.; Padmanaban, S.; Satyana- rayanan, R.S.; Berchmans, S.; Yegnaraman, V. Direct electron transfer with yeast cells and construction of a mediatorless microbial fuel cells. Biosens. Bioelectron. 2007, 22, 2604–2610. [Google Scholar] [CrossRef] [PubMed]
- Kim, H.J.; Park, H.S.; Hyun, M.S.; Chang, I.S.; Kim, M.; Kim, B.H. A mediator-less microbial fuel cell using a metal reducing bacterium Shewanella Putrefaciens. Enzym. Microb. Technol. 2002, 30, 145–152. [Google Scholar] [CrossRef]
- Park, H.S.; Kim, B.H.; Kim, H.S.; Kim, H.J.; Kim, G.T.; Kim, M.; Chang, I.S.; Park, Y.K.; Chang, H.I. A novel electrochemically active and Fe(III)-reducing bacterium phylogenetically related to Clostridium butyricum isolated from a microbial fuel cell. Anaerobe 2001, 7, 297–306. [Google Scholar] [CrossRef]
- Pham, C.A.; Jung, S.J.; Phung, N.T.; Lee, J.; Chang, I.S.; Kim, B.H.; Yi, H.; Chun, J. A novel electrochemically active and Fe(III)-reducing bacterium phylogenetically related to Aeromonas hydrophila isolated from a microbial fuel cell. FEMS Microbiol. Lett. 2003, 223, 129–134. [Google Scholar] [CrossRef] [Green Version]
- Schaetzle, O.; Barrière, F.; Baronian, K. Bacteria and yeasts as catalysts in microbial fuel cells: Electron transfer from microorganisms to electrodes for green electricity. Energy Environ. Sci. 2008, 1, 607–620. [Google Scholar] [CrossRef]
- Sivasankar, V.; Mylsamy, P.; Omine, K. Microbial Fuel Cell Technology for Bioelectricity, 1st ed.; Springer: Berlin, Germany, 2018. [Google Scholar]
- Permana, D. Performance of Single Chamber Microbial Fuel Cell (SCMFC) for biological treatment of tofu wastewater. In Proceedings of the IOP Conference Series: Earth and Environmental Science, Saint Petersburg, Russia, 17–18 April 2019; Volume 277, p. 012008. [Google Scholar] [CrossRef]
- Min, B.; Logan, B.E. Continuous electricity generation from domestic wastewater and organic substrates in a flat plate microbial fuel cell. Environ. Sci. Technol. 2004, 38, 5809–5814. [Google Scholar] [CrossRef]
- Potter, M.C. Electrical effects accompanying the decomposition organic compounds. Proc. R. Soc. Lond. Ser. B 1911, 84, 260–276. [Google Scholar] [CrossRef]
- Davis, J.B.; Yarbrough, H.F., Jr. Preliminary experiments on a microbial fuel cell. Science 1962, 137, 615–616. [Google Scholar] [CrossRef]
- Lewis, K. Symposium on bioelectrochemistry of microorganisms: IV. Biochemical fuel cells. Bacteriol. Rev. 1966, 30, 101–113. [Google Scholar] [CrossRef]
- Logan, B.E.; Hamelers, B.; Rozendal, R.; Schroder, U.; Keller, J.; Verstraete, W.; Rabaey, K. microbial fuel cells: Methodology and technology. Environ. Sci. Technol. 2006, 40, 5181–5192. [Google Scholar] [CrossRef]
- Min, B.; Cheng, S.; Logan, B.E. Electricity generation using membrane and salt bridge microbial fuel cells. Water Res. 2005, 39, 1675–1686. [Google Scholar] [CrossRef] [PubMed]
- Włodarczyk, P.P.; Włodarczyk, B. Preparation and analysis of Ni–Co catalyst use for electricity production and COD reduction in microbial fuel cells. Catalysts 2019, 9, 1042. [Google Scholar] [CrossRef] [Green Version]
- Włodarczyk, P.P.; Włodarczyk, B. Wastewater treatment and electricity production in a microbial fuel cell with Cu–B alloy as the cathode catalyst. Catalysts 2019, 9, 572. [Google Scholar] [CrossRef] [Green Version]
- Logan, B.E.; Regan, J.M. Electricity-producing bacterial communities in microbial fuel cells. Trends Microbiol. 2006, 14, 512–518. [Google Scholar] [CrossRef] [PubMed]
- Rosenbaum, M.; Zhao, F.; Schröder, U.; Scholz, F. Interfacing electrocatalysis and biocatalysis with tungsten carbide: A high-performance, noble-metal-free microbial fuel cell. Angew. Chem. Int. Ed. 2006, 45, 6658–6661. [Google Scholar] [CrossRef] [PubMed]
- Wen, Q.; Wu, Y.; Cao, D.; Zhao, L.; Sun, Q. Electricity generation and modeling of microbial fuel cell from continuous beer brewery wastewater. Bioresour. Technol. 2009, 100, 4171–4175. [Google Scholar] [CrossRef] [PubMed]
- Juang, D.F.; Lee, C.H.; Hsueh, S.C.; Chou, H.Y. Power generation capabilities of microbial fuel cells with different oxygen supplies in the cathodic chamber. Appl. Biochem. Biotechnol. 2012, 167, 714–731. [Google Scholar] [CrossRef]
- Logan, B.E. Exoelectrogenic bacteria that power microbial fuel cells. Nat. Rev. Microbiol. 2009, 7, 375–381. [Google Scholar] [CrossRef]
- Pant, D.; Van Bogaert, G.; Diels, L.; Vanbroekhoven, K. A review of the substrates used in microbial fuel cells (MFCs) for sustainable energy production. Bioresour. Technol. 2010, 101, 1533–1543. [Google Scholar] [CrossRef]
- Wang, X.; Feng, Y.J.; Lee, H. Electricity production from beer brewery wastewater using single chamber microbial fuel cell. Water Sci. Technol. 2008, 57, 1117–1121. [Google Scholar] [CrossRef]
- Włodarczyk, B.; Włodarczyk, P.P. Analysis of the potential of an increase in yeast output resulting from the application of additional process wastewater in the evaporator station. Appl. Sci. 2019, 9, 2282. [Google Scholar] [CrossRef] [Green Version]
- Kalyuzhnyi, S.; Gladchenko, M.; Starostina, E.; Shcherbakov, S.; Versprille, A. Combined biological and physico-chemical treatment of baker’s yeast wastewater. Water Sci. Technol. 2005, 52, 175–181. [Google Scholar] [CrossRef]
- Catalkaya, E.C.; Sengul, F. Application of box-wilson experimental design method for the photodegradation of bakery’s yeast industry with UV/H2O2 and UV/H2O2/Fe(II) process. J. Hazard. Mater. 2006, 128, 201–207. [Google Scholar] [CrossRef] [PubMed]
- Zub, S.; Kurisso, T.; Menert, A.; Blonskaja, V. Combined biological treatment of high-sulphate wastewater from yeast production. Water Environ. J. 2008, 22, 274–286. [Google Scholar] [CrossRef]
- Gengec, E.; Kobya, M.; Demirbas, E.; Akyol, A.; Oktor, K. Optimization of baker’s yeast wastewater using response surface methodology by electrocoagulation. Desalination 2012, 286, 200–209. [Google Scholar] [CrossRef]
- Wu, W.; Niu, H.; Yang, D.; Wang, S.-B.; Wang, J.; Lin, J.; Hu, C. Controlled layer-by-layer deposition of carbon nanotubes on electrodes for microbial fuel cells. Energies 2019, 12, 363. [Google Scholar] [CrossRef] [Green Version]
- Sudirjo, E.; Buisman, C.J.; Strik, D.P. Activated carbon mixed with marine sediment is suitable as bioanode material for spartina anglica sediment/plant microbial fuel cell: Plant growth, electricity generation, and spatial microbial community diversity. Water 2019, 11, 1810. [Google Scholar] [CrossRef] [Green Version]
- Ling, J.; Xu, Y.; Lu, C.; Lai, W.; Xie, G.; Zheng, L.; Talawar, M.P.; Du, Q.; Li, G. Enhancing stability of microalgae biocathode by a partially submerged carbon cloth electrode for bioenergy production from wastewater. Energies 2019, 12, 3229. [Google Scholar] [CrossRef] [Green Version]
- Liu, Y.; Harnisch, F.; Fricke, K.; Schroeder, U.; Climent, V.; Feliu, J.M. The study of electrochemically active microbial biofilms on different carbon-based anode materials in microbial fuel cells. Biosens. Bioelectron. 2010, 25, 2167–2171. [Google Scholar] [CrossRef]
- Yuan, Y.; Zhou, S.; Zhuang, L. Polypyrrole/carbon black composite as a novel oxygen reduction catalyst for microbial fuel cells. J. Power Sources 2010, 195, 3490–3493. [Google Scholar] [CrossRef]
- Zuo, K.; Liang, S.; Liang, P.; Zhou, X.; Sun, D.; Zhang, X.; Huang, X. Carbon filtration cathode in microbial fuel cell to enhance wastewater treatment. Bioresour. Technol. 2015, 185, 426–430. [Google Scholar] [CrossRef] [PubMed]
- Erbay, C.; Yang, G.; de Figueiredo, P.; Sadr, R.; Yu, C.; Han, A. Three-dimensional porous carbon nanotube sponges for high-performance anodes of microbial fuel cells. J. Power Sources 2015, 298, 177–183. [Google Scholar] [CrossRef] [Green Version]
- Asensio, Y.; Montes, I.B.; Fernández-Marchante, C.M.; Lobato, J.; Cañizares, P.; Rodrigo, M.A. Selection of cheap electrodes for two-compartment microbial fuel cells. J. Electroanal. Chem. 2017, 785, 235–240. [Google Scholar] [CrossRef]
- Penteado, E.D.; Fernández-Marchante, C.M.; Zaiat, M.; Cañizares, P.; Gonzalez, E.R.; Rodrigo, M.A. Influence of carbon electrode material on energy recovery from winery wastewater using a dual-chamber microbial fuel cell. Environ. Technol. 2017, 38, 1333–1341. [Google Scholar] [CrossRef]
- Sanchez, D.V.P.; Huynh, P.; Kozlov, M.E.; Baughman, R.H.; Vidic, R.D.; Yun, M. Carbon nanotube/platinum (Pt) sheet as an improved cathode for microbial fuel cells. Energy Fuels 2010, 24, 5897–5902. [Google Scholar] [CrossRef]
- Martin, E.; Tartakovsky, B.; Savadogo, O. Cathode materials evaluation in microbial fuel cells: A comparison of carbon, Mn2O3, Fe2O3 and platinum materials. Electrochim. Acta 2011, 58, 58–66. [Google Scholar] [CrossRef] [Green Version]
- Morris, J.M.; Jin, S.; Wang, J.; Zhu, C.; Urynowiczcz, M.A. Lead dioxide as an alternative catalyst to platinum in microbial fuel cells. Electrochem. Commun. 2007, 9, 1730–1734. [Google Scholar] [CrossRef]
- Liew, K.B.; Daud, W.R.W.; Ghasemia, M.; Leong, J.X.; Lim, S.S.; Ismail, M. Non-Pt catalyst as oxygen reduction reaction in microbial fuel cells: A review. Int. J. Hydrog. Energy 2014, 39, 4870–4883. [Google Scholar] [CrossRef]
- Zhang, L.; Liu, C.; Zhuang, L.; Li, W.; Zhou, S.; Zhang, J. Manganese dioxide as an alternative cathodic catalyst to platinum in microbial fuel cells. Biosens. Bioelectron. 2009, 24, 2825–2829. [Google Scholar] [CrossRef]
- Santoro, C.; Lei, Y.; Li, B.; Cristianid, P. Power generation from wastewater using single chamber microbial fuel cells (MFCs) with platinum-free cathodes and pre-colonized anodes. Biochem. Eng. J. 2012, 62, 8–16. [Google Scholar] [CrossRef]
- Wang, Z.; Huang, H.; Liu, H.; Zhou, X. Self-sustained electrochemical promotion catalysts for partial oxidation reforming of heavy hydrocarbons. Int. J. Hydrog. Energy 2012, 37, 17928–17935. [Google Scholar] [CrossRef]
- Huang, H.; Wang, Z.; Zhou, X.; Liu, H.; Wei, Y.; Pramuanjaroenkij, A.; Bordas, A.; Page, M.; Cai, S.; Zhang, X. Development and study of self-sustained electrochemical promotion catalysts for hydrocarbon reforming. In ECS Transactions, 2nd ed.; Electrochemical Society Inc.: Pennington, NJ, USA, 2013; Volume 58, pp. 243–254. [Google Scholar] [CrossRef]
- Osorio de la Rosa, E.; Vázquez Castillo, J.; Carmona Campos, M.; Barbosa Pool, G.R.; Becerra Nuñez, G.; Castillo Atoche, A.; Ortegón Aguilar, J. Plant microbial fuel cells–based energy harvester system for self-powered IoT applications. Sensors 2019, 19, 1378. [Google Scholar] [CrossRef] [PubMed] [Green Version]
- Dumas, C.; Mollica, A.; Féron, D.; Basséguy, R.; Etcheverry, L.; Bergel, A. Marine microbial fuel cell: Use of stainless steel electrodes as anode and cathode materials. Electrochim. Acta 2006, 53, 468–473. [Google Scholar] [CrossRef] [Green Version]
- Chae, K.J.; Choi, M.; Ajayi, F.F.; Park, W.; Chang, I.S.; Kim, I.S. Mass transport through a proton exchange membrane (Nafion) in microbial fuel cells. Energy Fuels 2008, 22, 169–176. [Google Scholar] [CrossRef]
- Oh, S.E.; Logan, B.E. Proton exchange membrane and electrode surface areas as factors that affect power generation in microbial fuel cells. Appl. Microbiol. Biotechnol. 2006, 70, 162–169. [Google Scholar] [CrossRef]
- Tsai, H.Y.; Wu, C.C.; Lee, C.Y.; Shih, E.P. Microbial fuel cell performance of multiwall carbon nanotubes on carbon cloth as electrodes. J. Power Sources 2009, 194, 199–205. [Google Scholar] [CrossRef]
- Tardast, A.; Najafpour, G.D.; Rahimnejad, M.; Amiri, A. Bioelectrical power generation in a membrane less microbial fuel cell. World App. Sci. J. 2012, 16, 179–182. [Google Scholar]
- Ghangrekar, M.M.; Shinde, V.B. Performance of membrane-less microbial fuel cell treating wastewater and effect of electrode distance and area on electricity production. Bioresour. Technol. 2007, 98, 2879–2885. [Google Scholar] [CrossRef]
- Jang, J.K.; Pham, T.H.; Chang, I.S.; Kang, K.H.; Moon, H.; Cho, K.S.; Kim, B.H. Construction and operation of a novel mediator- and membrane-less microbial fuel cell. Process. Biochem. 2004, 39, 1007–1012. [Google Scholar] [CrossRef]
- Huggins, T.; Fallgren, P.H.; Jin, S.; Ren, Z.J. Energy and performance comparison of microbial fuel cell and conventional aeration treating of wastewater. J. Microb. Biochem. Technol. 2013, 6, 1–5. [Google Scholar] [CrossRef] [Green Version]
- Włodarczyk, P.P.; Włodarczyk, B. Ni-Co alloy as catalyst for fuel electrode of hydrazine fuel cell. China-USA Bus. Rev. 2015, 14, 269–279. [Google Scholar] [CrossRef] [Green Version]
- Włodarczyk, B.; Włodarczyk, P.P. Comparsion of Cu-B alloy and stainless steel as electrode material for microbial fuel cell. In Renewable Energy Sources: Engineering, Technology, Innovation ICORES 2018; Wróbel, M., Jewiarz, M., Szlęk, A., Eds.; Springer Nature Switzerland AG: Basel, Switzerland, 2020; pp. 1057–1063. [Google Scholar] [CrossRef]
- Włodarczyk, P.P.; Włodarczyk, B. Microbial fuel cell with Ni-Co cathode powered with yeast wastewater. Energies 2018, 11, 3194. [Google Scholar] [CrossRef] [Green Version]
- Fogelman, S.; Zhao, H.; Blumenstein, M. A rapid analytical method for predicting the oxygen demand of wastewater. Anal. Bioanal. Chem. 2006, 386, 1773–1779. [Google Scholar] [CrossRef] [PubMed]
- Hermanowicz, W.; Dojlido, J.; Dożańska, W.; Koziorowski, B.; Zerbe, J. Fizyczno-Chemiczne Badanie Wody I Ścieków; Arkady: Warszawa, Poland, 1999. [Google Scholar]
- Gadzała-Kopciuch, R.; Buszewski, B. Fizykochemiczne Metody Analizy W Chemii Środowiska; Wydawnictwo Uniwersytetu Mikołaja Kopernika: Toruń, Poland, 2003. [Google Scholar]
- Bielański, A. Podstawy Chemii Nieorganicznej; Wydawnictwo Naukowe PWN: Warsaw, Poland, 2013. [Google Scholar]
- Schweda, E. Chemia Nieorganiczna; Wydawnictwo Medpharm: Wrocław, Poland, 2014. [Google Scholar]
- Łomotowski, J.; Szpindor, A. Nowoczesne Systemy Oczyszczania Ścieków; Arkady: Warsaw, Poland, 2002. [Google Scholar]
- Ren, Z.; Yan, H.; Wang, W.; Mench, M.M.; Regan, J.M. Characterization of microbial fuel cells at microbially and electrochemically meaningful time scales. Environ. Sci. Technol. 2011, 45, 2435–2441. [Google Scholar] [CrossRef]
Figure 1.
Source of wastewater (W5) applied in measurements: W1, wastewater after clarification of the molasses; W2, wastewater after the first centrifugation of the wort; W3, wastewater after the second centrifugation of the wort; W4, wastewater after the third centrifugation of the wort; W5, wastewater after obtaining yeast on vacuum filters. Yp is yeast for packaging and distribution.
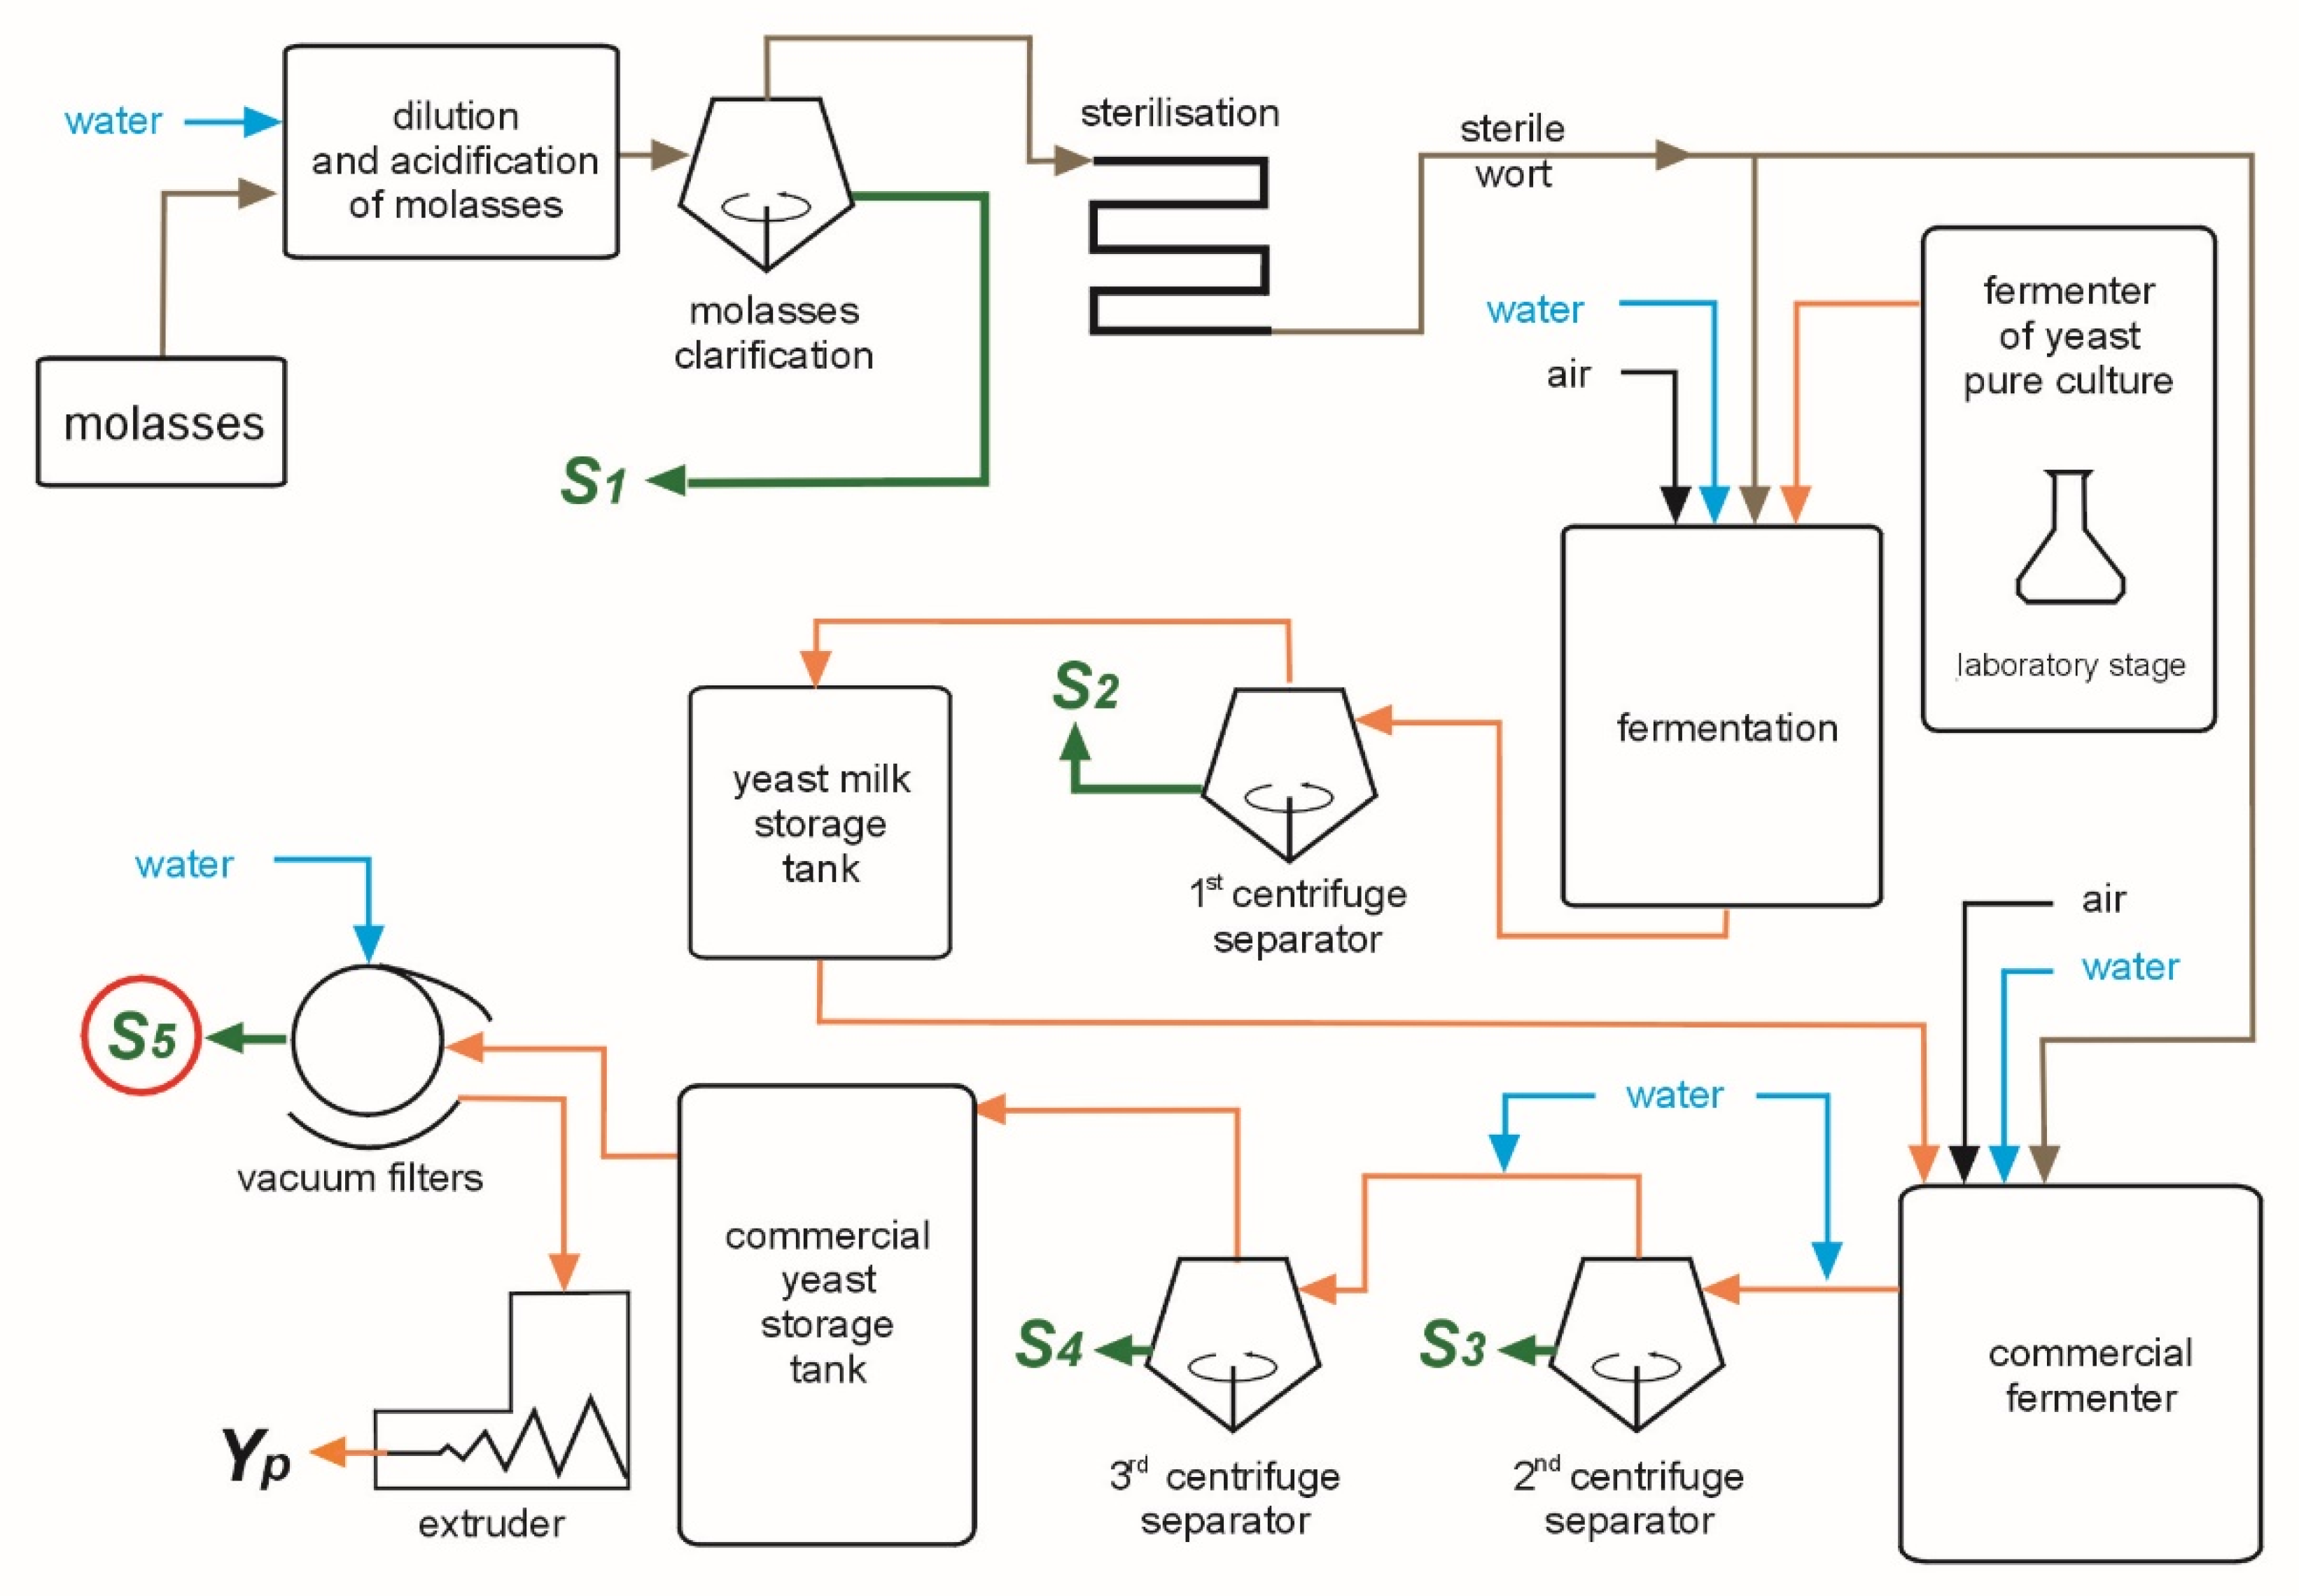
Figure 2.
Reactors applied for measurements of wastewater parameters: (R1) without aeration, (R2) with aeration, and (R3) a membrane-less microbial fuel cell (ML-MFC).
Figure 2.
Reactors applied for measurements of wastewater parameters: (R1) without aeration, (R2) with aeration, and (R3) a membrane-less microbial fuel cell (ML-MFC).
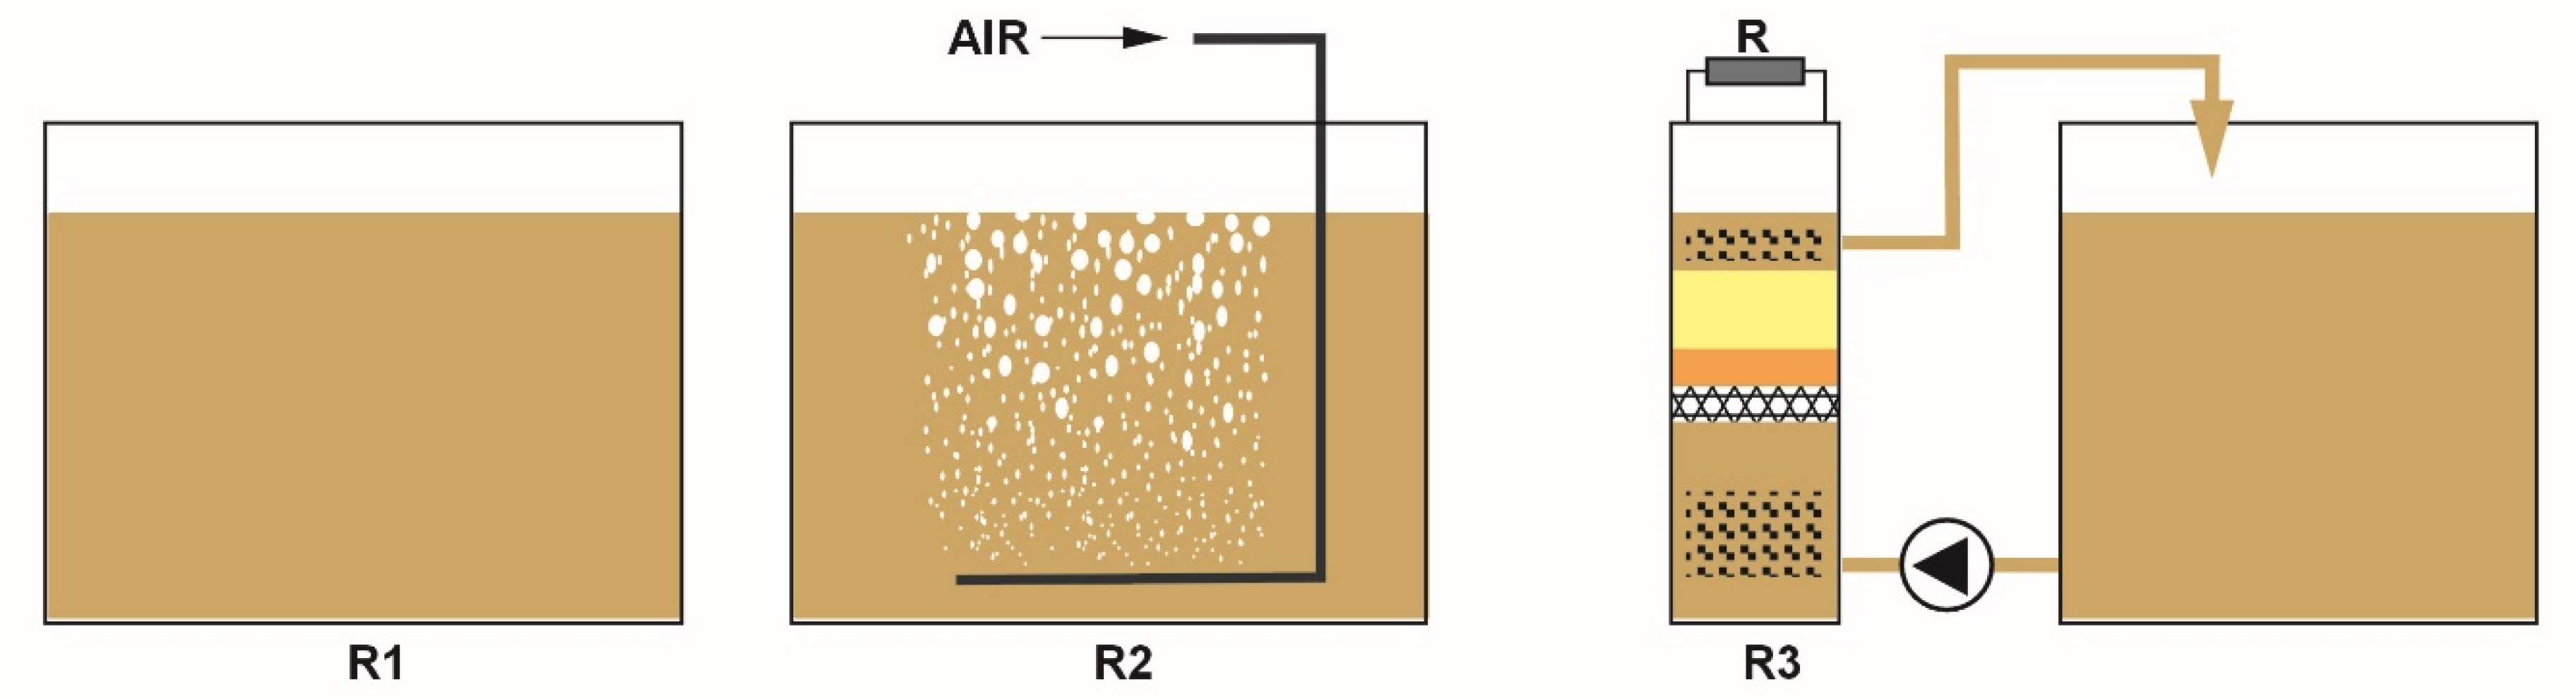
Figure 3.
Scheme of the ML-MFC applied in measurements: 1—wastewater outflow (to wastewater tank); 2—glass balls; 3—glass wool; 4—plastic mesh; 5—anode; 6—plug; 7—plexiglass pipe; 8—cathode; 9—pipe with holes; 10—air intake; 11—wastewater intake (from wastewater tank); 12—cathode section; 13—anode section; and R—load.

Figure 4.
Decrease in COD over time for three types of reactors: R1, R2, and R3, and for three types of ML-MFC cathode: Ni–Co, Cu–B, and carbon cloth.
Figure 4.
Decrease in COD over time for three types of reactors: R1, R2, and R3, and for three types of ML-MFC cathode: Ni–Co, Cu–B, and carbon cloth.
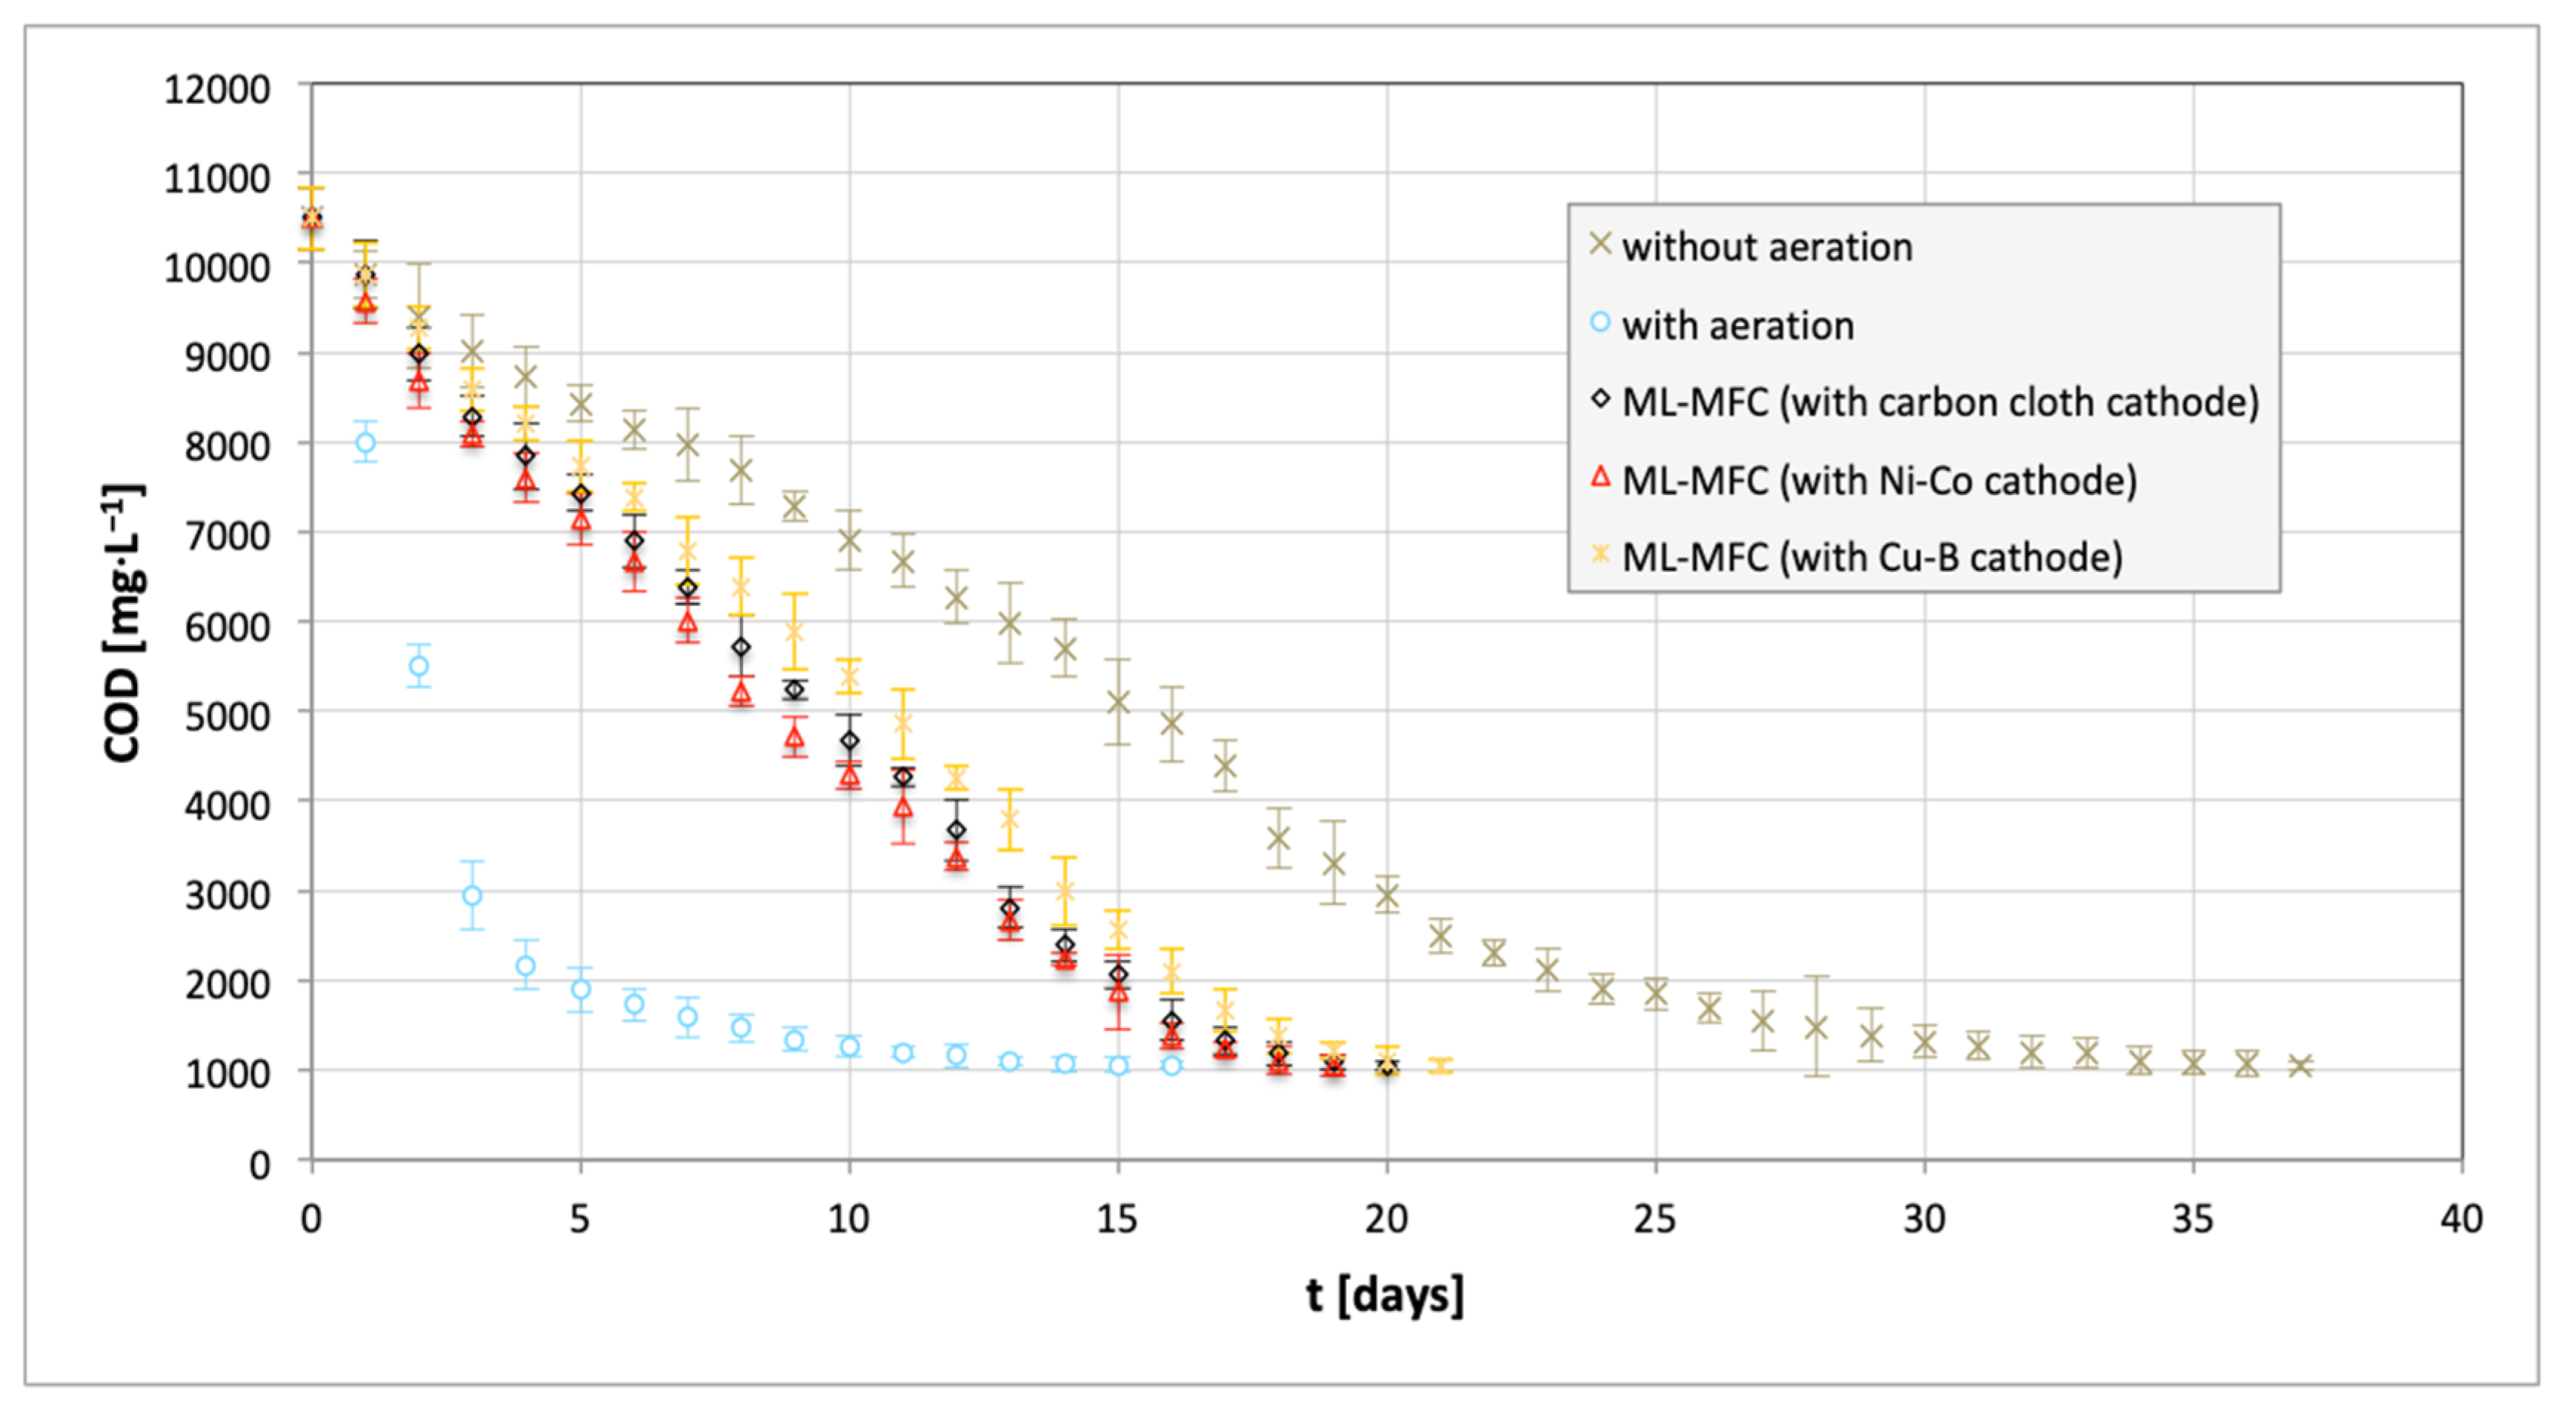
Figure 5.
Shift in concentration of NH4+ over time for three types of reactors: R1, R2, and R3. Measurements for ML-MFC were carried out for three types of cathode (Ni–Co, Cu–B, and carbon cloth).
Figure 5.
Shift in concentration of NH4+ over time for three types of reactors: R1, R2, and R3. Measurements for ML-MFC were carried out for three types of cathode (Ni–Co, Cu–B, and carbon cloth).
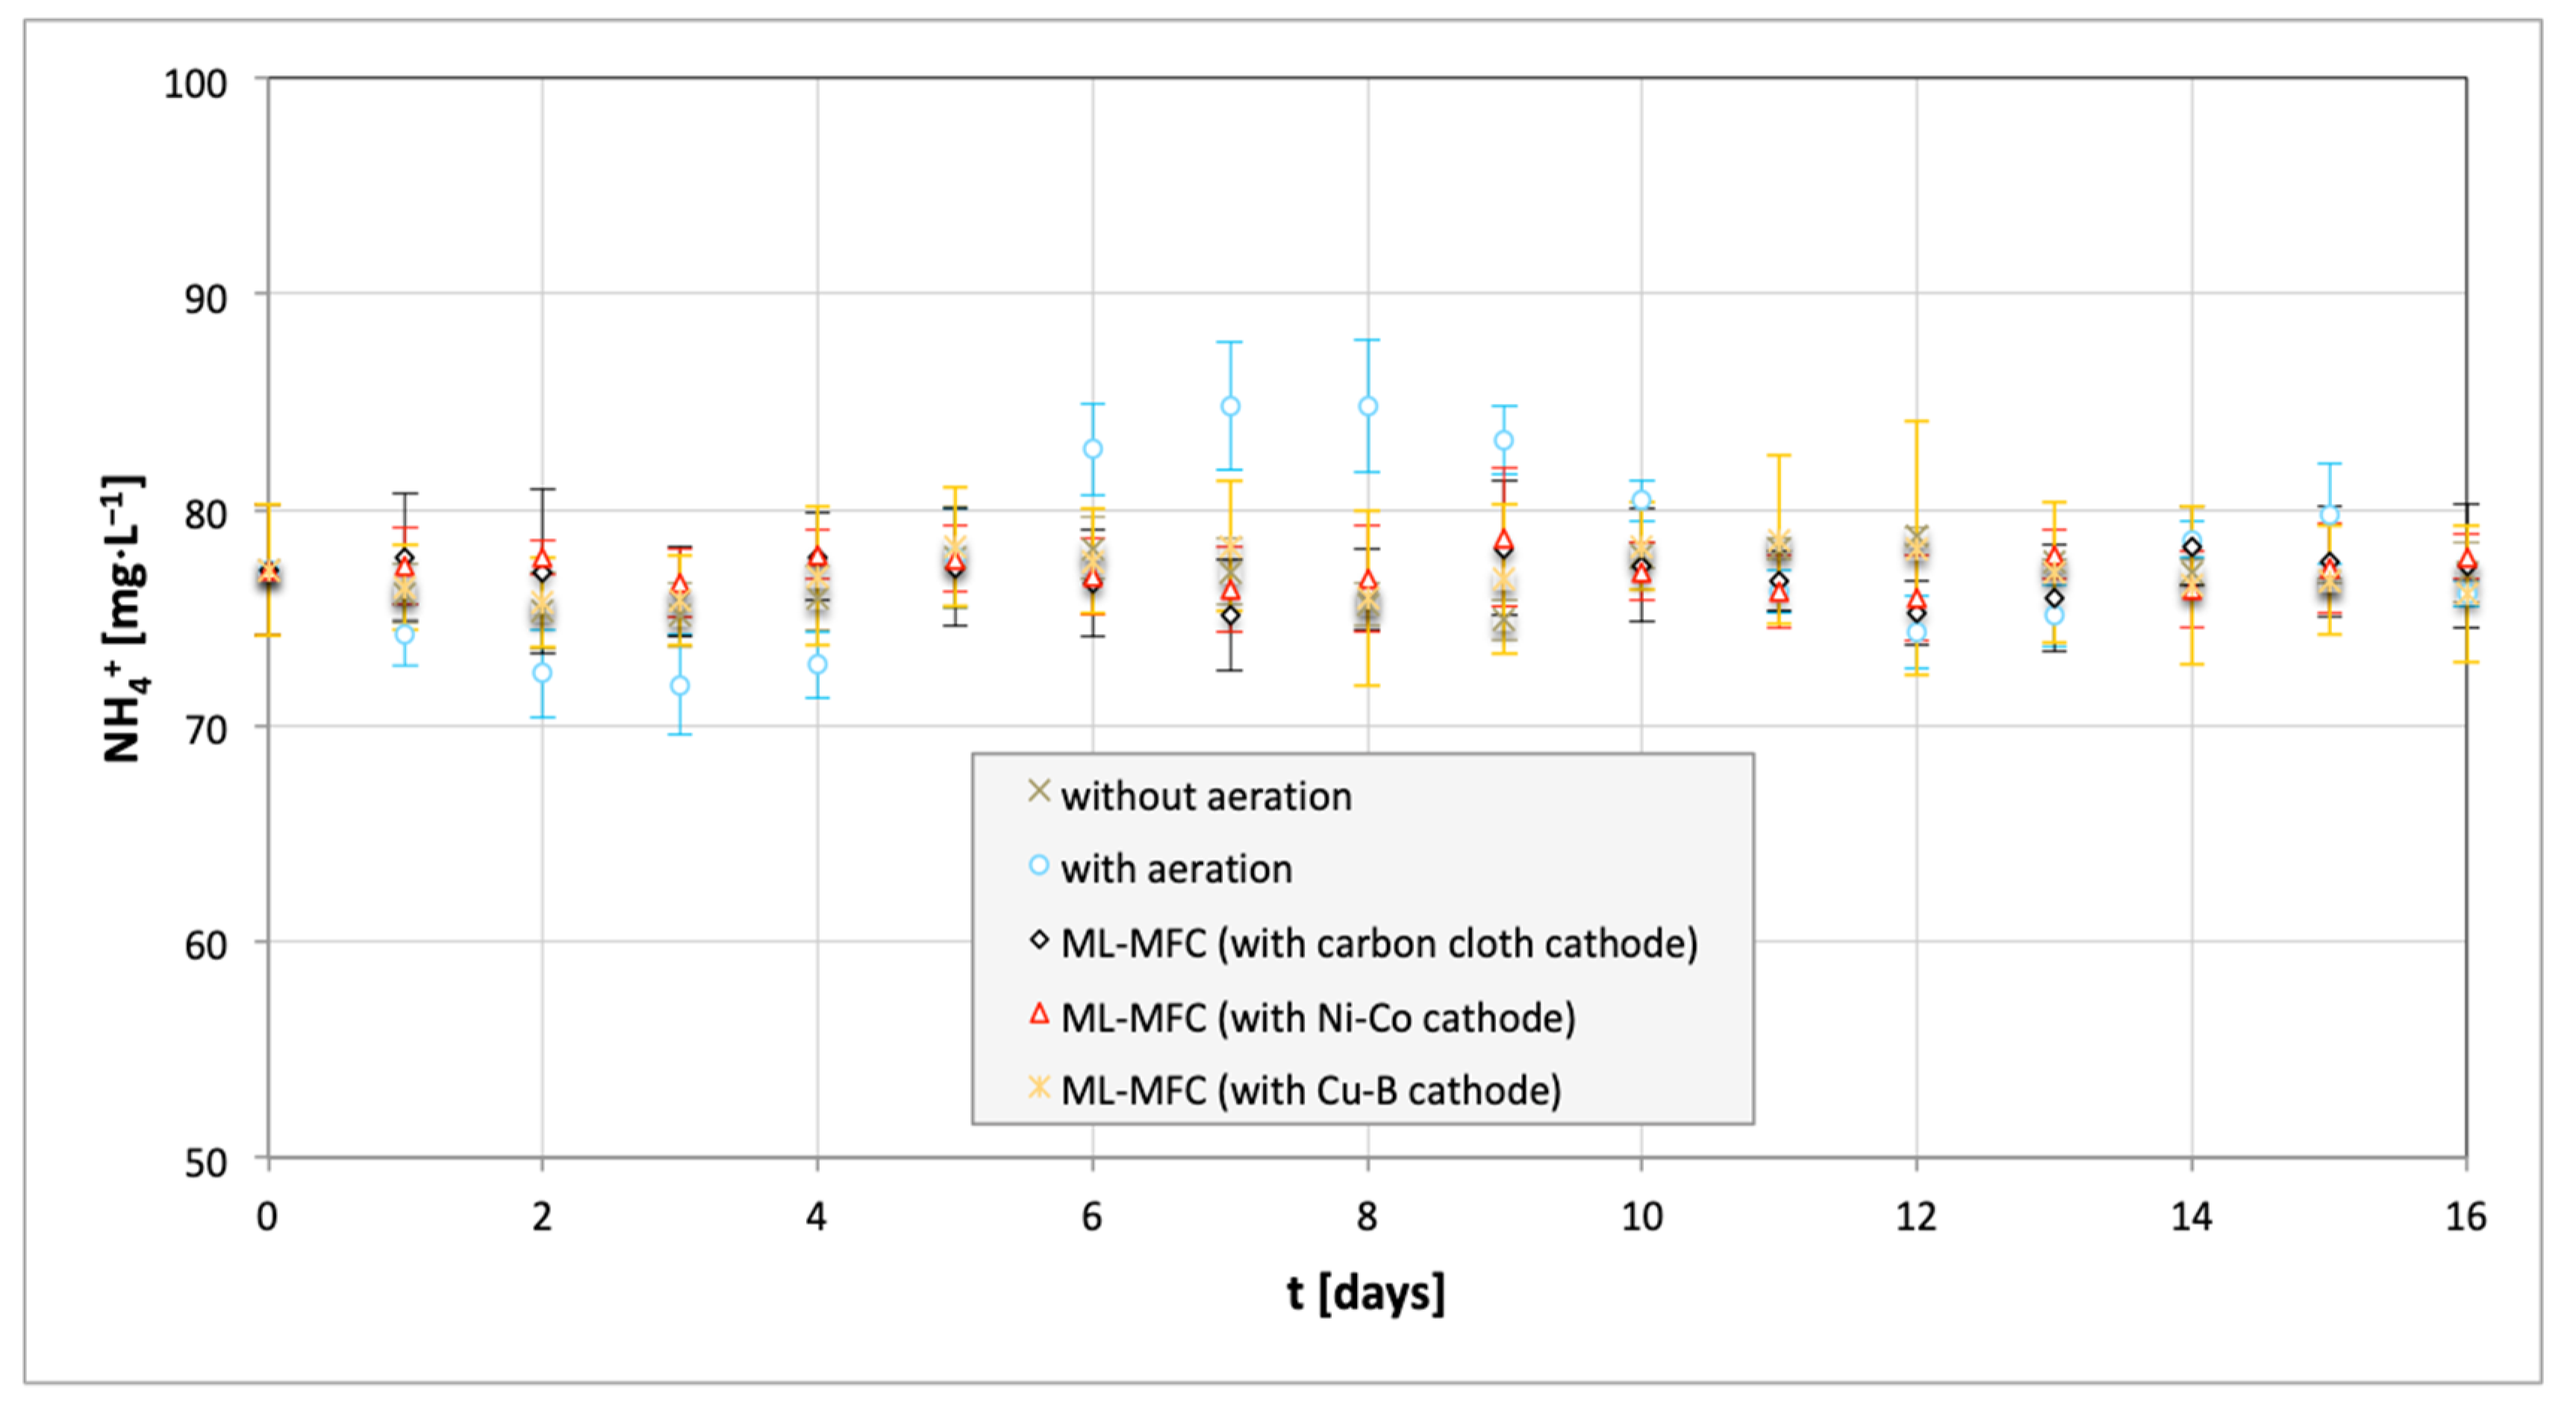
Figure 6.
Shift in concentration of NO3− over time for three types of reactors: R1, R2, and R3. Measurements for ML-MFC were carried out for three types of cathode (Ni–Co, Cu–B, and carbon cloth).
Figure 6.
Shift in concentration of NO3− over time for three types of reactors: R1, R2, and R3. Measurements for ML-MFC were carried out for three types of cathode (Ni–Co, Cu–B, and carbon cloth).
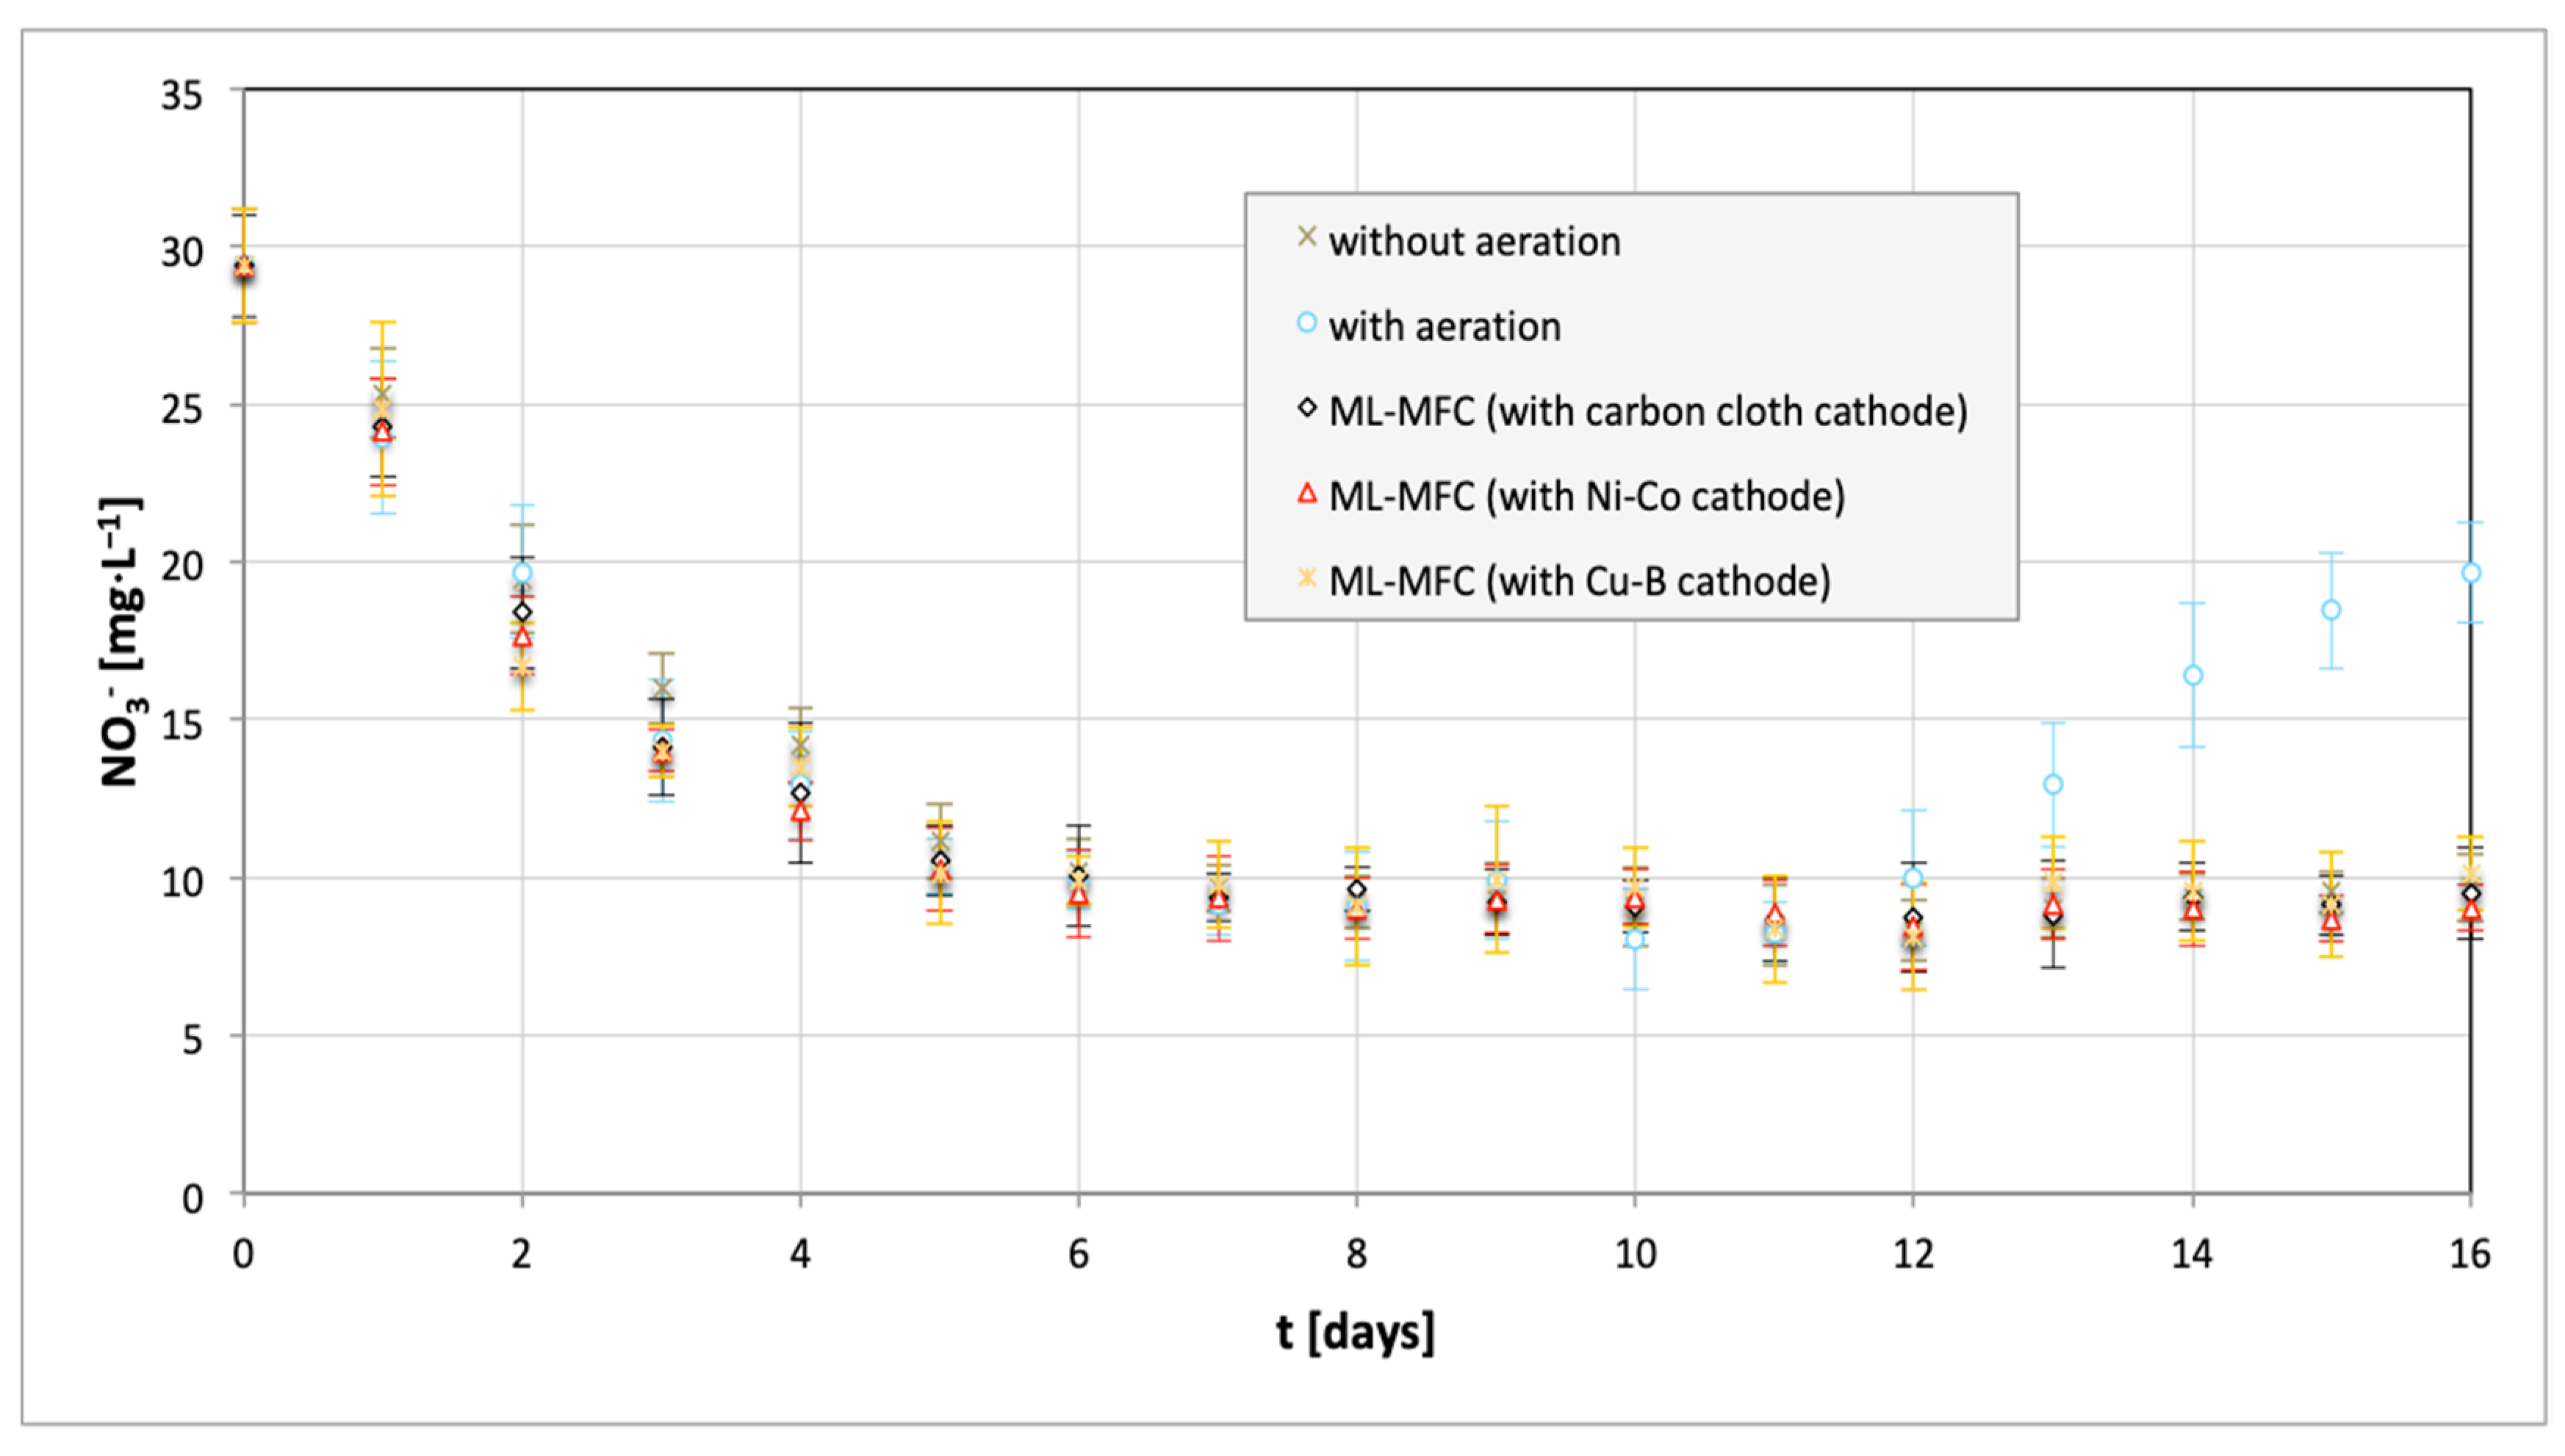
Figure 7.
Cell voltage of the ML-MFC in time: red marker—with Ni–Co cathode, black marker—carbon cloth cathode, yellow marker—Cu–B cathode.
Figure 7.
Cell voltage of the ML-MFC in time: red marker—with Ni–Co cathode, black marker—carbon cloth cathode, yellow marker—Cu–B cathode.
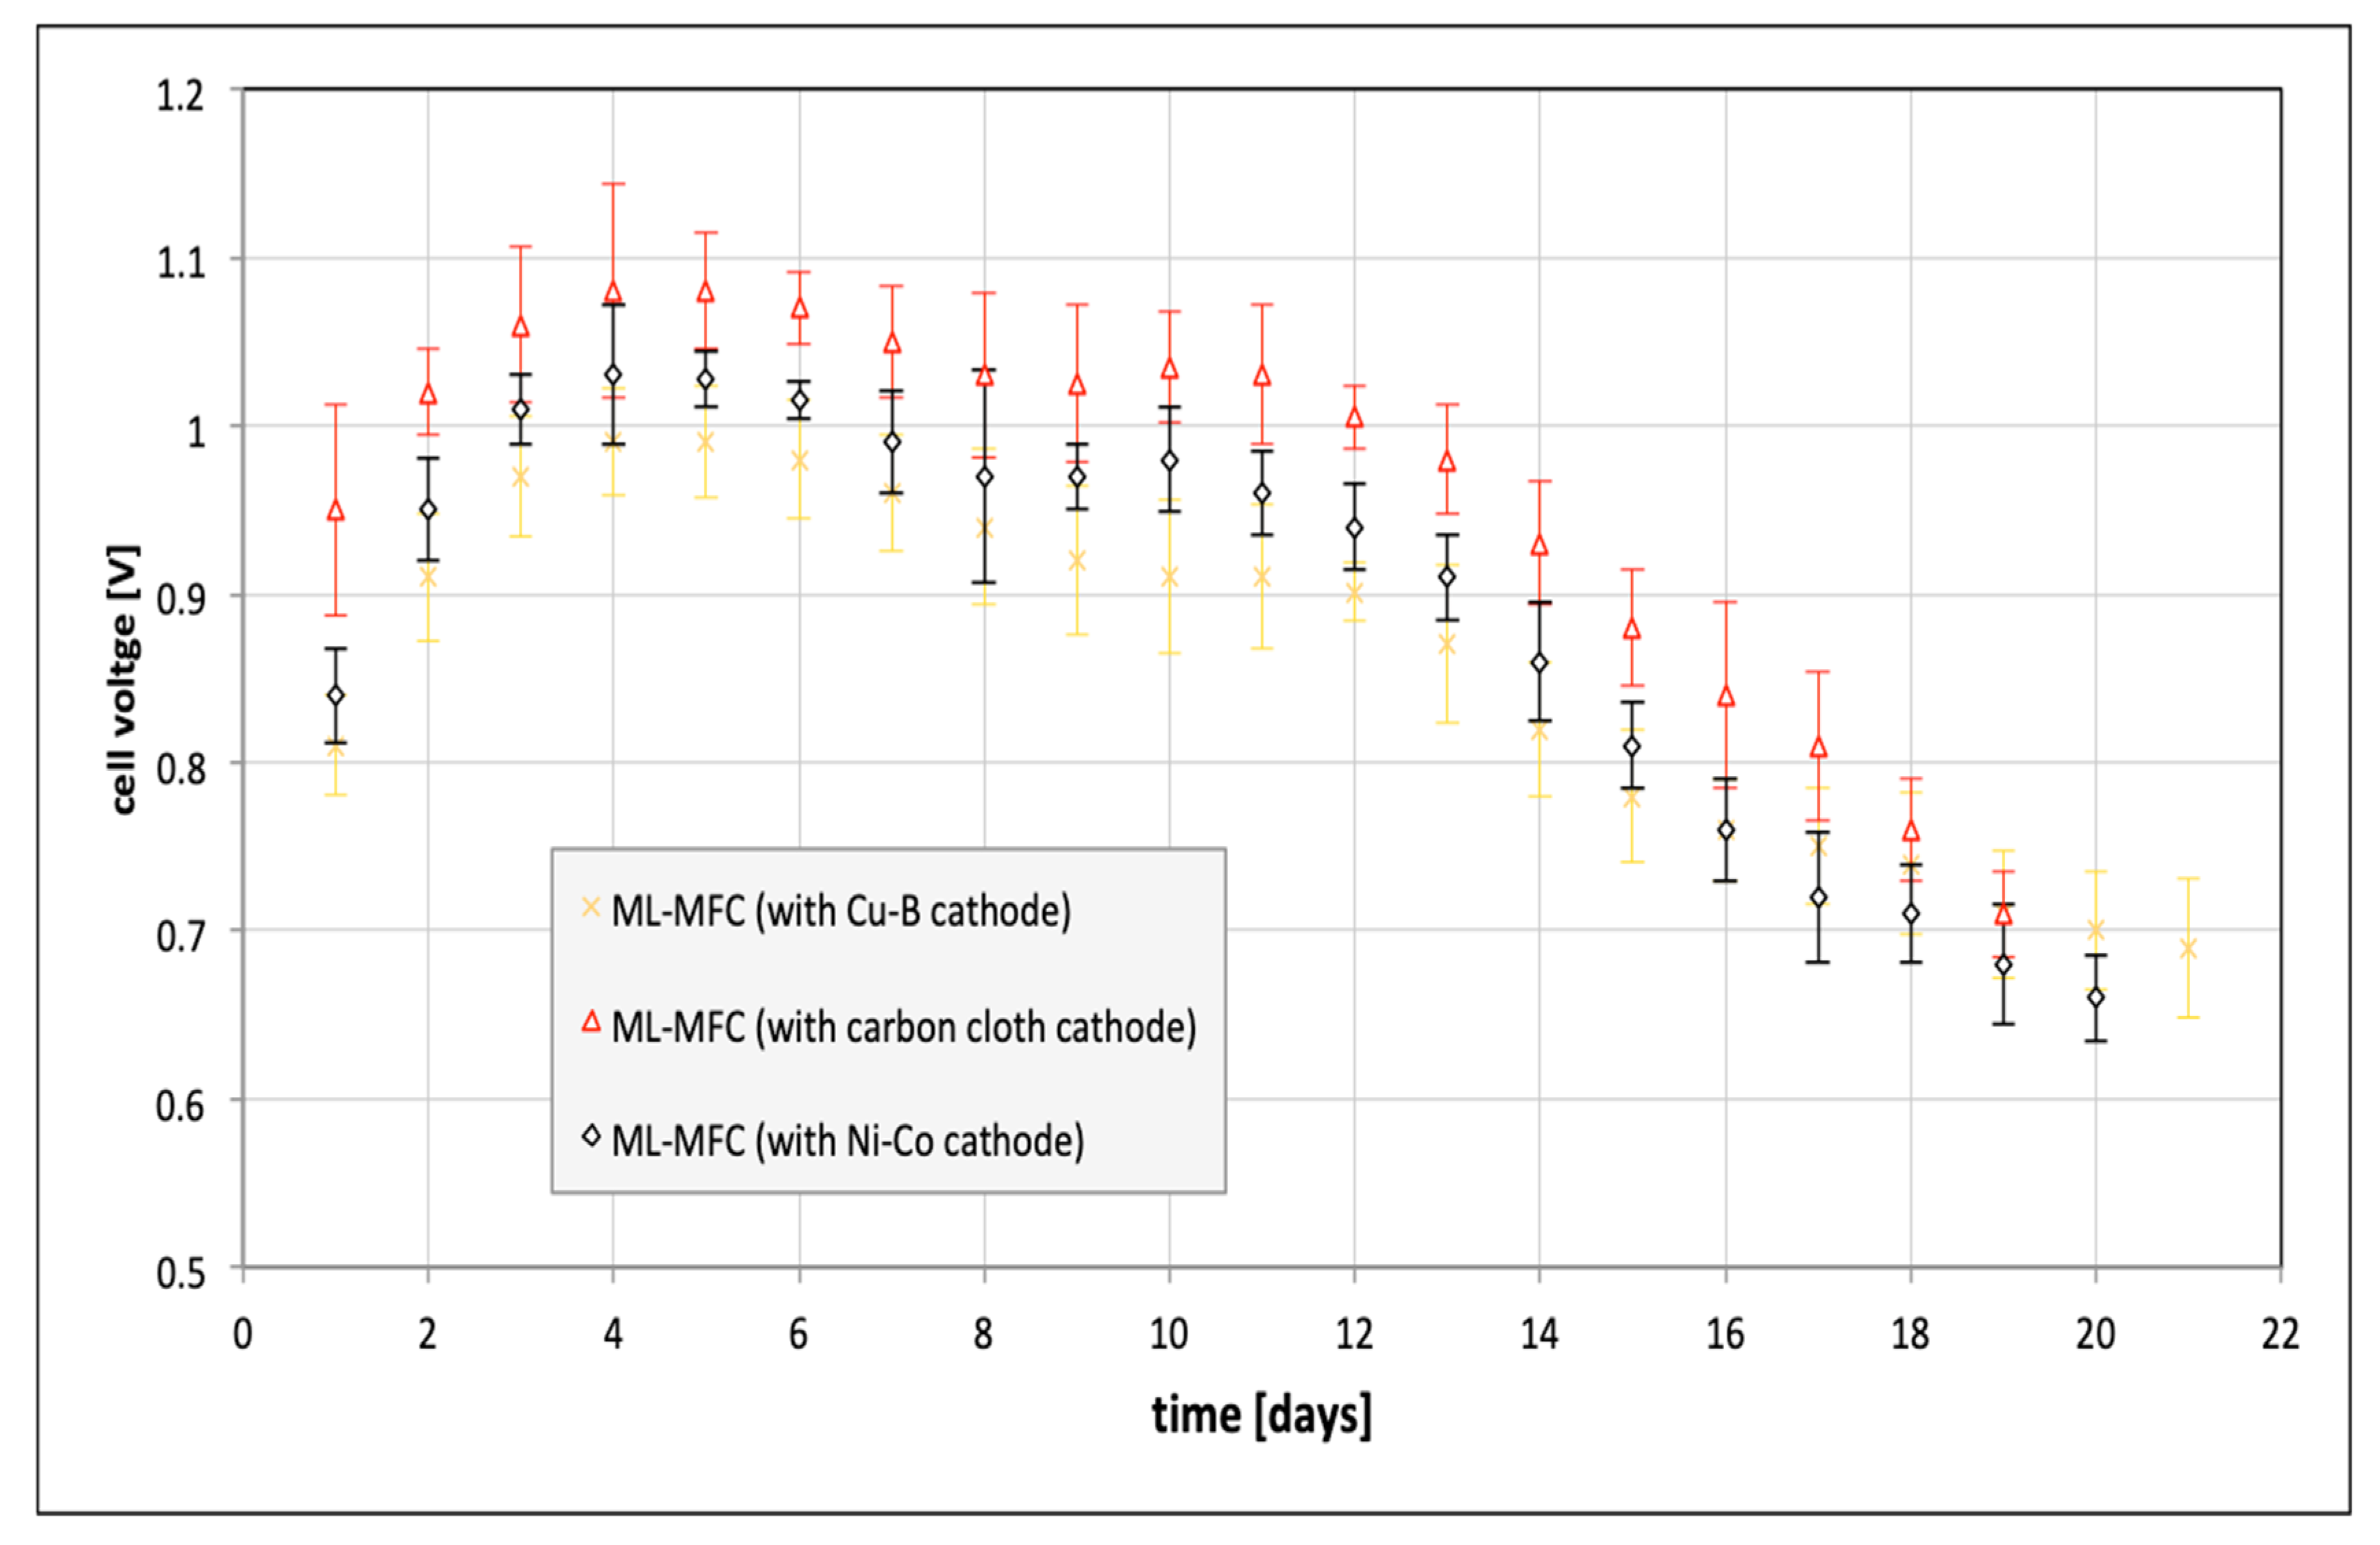
Figure 8.
Power curves of the ML-MFC and effects of the cathode material.

Table 1.
Initial parameters of process wastewater used in research, yeast process wastewater derived from vacuum filters.
Table 1.
Initial parameters of process wastewater used in research, yeast process wastewater derived from vacuum filters.
| Parameter | Value |
|---|---|
| COD [mg⋅L−1] | 10,500 ± 347 |
| NH4+ [mg⋅L−1] | 77.2 ± 3.3 |
| NO3− [mg⋅L−1] | 29.4 ± 1.8 |
| pH | 6.0–7.0 |
Table 2.
Electrical parameters of the ML-MFC for different types of cathodes.
| Electrode | Current Density [mA·cm−2] | Power [mW] |
|---|---|---|
| carbon cloth | 0.19 | 5.99 |
| Ni–Co | 0.38 | 6.19 |
| Cu–B | 0.32 | 5.43 |
© 2020 by the authors. Licensee MDPI, Basel, Switzerland. This article is an open access article distributed under the terms and conditions of the Creative Commons Attribution (CC BY) license (http://creativecommons.org/licenses/by/4.0/).
Share and Cite
MDPI and ACS Style
Włodarczyk, B.; Włodarczyk, P.P. The Membrane-Less Microbial Fuel Cell (ML-MFC) with Ni-Co and Cu-B Cathode Powered by the Process Wastewater from Yeast Production. Energies 2020, 13, 3976. https://doi.org/10.3390/en13153976
AMA Style
Włodarczyk B, Włodarczyk PP. The Membrane-Less Microbial Fuel Cell (ML-MFC) with Ni-Co and Cu-B Cathode Powered by the Process Wastewater from Yeast Production. Energies. 2020; 13(15):3976. https://doi.org/10.3390/en13153976
Chicago/Turabian StyleWłodarczyk, Barbara, and Paweł P. Włodarczyk. 2020. "The Membrane-Less Microbial Fuel Cell (ML-MFC) with Ni-Co and Cu-B Cathode Powered by the Process Wastewater from Yeast Production" Energies 13, no. 15: 3976. https://doi.org/10.3390/en13153976
Note that from the first issue of 2016, this journal uses article numbers instead of page numbers. See further details here.