Study on Fast Cold Start-Up Method of Proton Exchange Membrane Fuel Cell Based on Electric Heating Technology

1
School of Aerospace Engineering and Applied Mechanics, Tongji University, Shanghai 200092, China
2
School of Automotive Studies, Tongji University, Shanghai 200092, China
*
Authors to whom correspondence should be addressed.
Energies 2020, 13(17), 4456; https://doi.org/10.3390/en13174456
Submission received: 7 July 2020
/
Revised: 19 August 2020
/
Accepted: 19 August 2020
/
Published: 28 August 2020
(This article belongs to the Section F: Electrical Engineering)
Abstract
:In order to realize the low temperature and rapid cold start-up of a proton exchange membrane fuel cell stack, a dynamic model containing 40 single proton exchange membrane fuel cells is established to estimate the melting time of the proton exchange membrane fuel cell stack as well as to analyze the melting process of the ice by using the obtained liquid–solid boundary. The methods of proton exchange membrane electric heating and electrothermal film heating are utilized to achieve cold start-up of the proton exchange membrane fuel cell (PEMFC). The fluid simulation software fluent is used to simulate and analyze the process of melting ice. The solidification and melting model and multi-phase flow model are introduced. The pressure-implicit with splitting of operators algorithm is also adopted. The results show that both the proton exchange membrane electric heating technology and the electrothermal film heating method can achieve rapid cold start-up. The interior ice of the proton exchange membrane fuel cell stack melts first, while the first and 40th pieces melt afterwards. The ice melting time of the proton exchange membrane fuel cell stack is 32.5 s and 36.5 s with the two methods, respectively. In the end, the effect of different electrothermal film structures on cold start-up performance is studied, and three types of pore diameter electrothermal films are established. It is found that the electrothermal film with small holes melts completely first, and the electrothermal film with large holes melts completely last.
1. Introduction
Proton exchange membrane fuel cells (PEMFCs) are a novel power generation technology which has a broad application prospect. Since its power generation reaction is not restricted by the Carnot Cycle, so the theoretical power generation efficiency of the fuel cell could reach 80%. Considering the internal resistance and fuel utilization (currently 80–85%) and other factors, the final direct power generation efficiency can reach 45–60%. PEMFCs also have the advantages of low operating temperature, fast start-up, simple structure, convenient operation and zero emissions, etc. Nowadays, PEMFC is mainly used in large power generation equipment, household power stations, standby electric supply, transportation and aerospace fields. At the same time, PEMFCs do not have technological shortcomings such as a long charging time and the short range of lithium-ion battery electric vehicles [1]. Thus, it has gradually attracted more attention in the field of new energy vehicles and is considered as an important direction for the sustainable development of the future automobile industry. PEMFC, as vehicle power, could work efficiently in the complex environments such as start-stop, cold start-up (or sub-zero start-up), high potential, voltage cycling, high current, air impurities and so on. As it is often inevitable that a vehicle will drive below 0 °C, cold start-up conditions pose the biggest challenge to fuel cell vehicles in the winter which is the serious bottleneck restricting the commercial use of fuel cells [2]. Therefore, the successful commercialization of PEMFCs in automotive applications must achieve the goal of rapid start-up at low temperatures, that is, “cold start-up” of a PEMFC. The reason for the start-up failure below zero is generally considered to be that the water of the reaction freezes inside the catalyst layer which results in a decrease in the catalytic activity of the catalyst layer and impeded oxygen transfer. The chemical reaction would stop because the reaction site is blocked. Moreover, icing may lead to serious damage of the structure of the membrane electrode assembly (MEA) [3,4,5]. Therefore, the realization of the technology for cold start-up is an important factor for the application of PEMFC in automobiles.
In 2010, the US Department of Energy proposed specific technical indicators for the fuel cells’ cold start-up process. At −20 °C, the fuel cells reached 90% of their rated power within 30 s after start-up [6]. The US Energy Agency plans to realize the self-starting of the power system of PEMFCs at −30 °C in 2020 and reach 50% output power within 30 s. According to the “Thirteenth Five-Year Plan”, China plans to break through −30 °C fuel cell storage and start-up technologies in 2020. On the other hand, fuel cell vehicles from Toyota Motor Corporation and Honda Motor Corporation have achieved cold start-up of −37 °C and −30 °C, respectively [7]. United Technologies Corporation (UTC) achieved 34% of its power within 30 s at −30 °C [6]. The “Sequel” fuel cell vehicle launched by General Motors also achieved a successful start-up at −20 °C, which can provide power after 30 s of start-up. In China, the fuel cell units have only initially realized the fuel cell system storage and start-up at −10 °C [8].
In recent decades, a large number of numerical and experimental studies have been performed on the cold start-up characteristics of PEMFC. At present, the main methods to solve the low temperature cold start of the fuel cell vehicles are to adjust the intake parameters, DC resistance heating, coolant heating, hot air purging hydrogen/oxygen catalytic reaction in the PEMFC, etc.
Du et al. [9] proposed the maximum power cold start-up method for accomplishing PEMFC cold start-up. The results show that the maximum power cold start-up mode has a stronger starting ability compared with the constant voltage and current modes when the maximum power cold start method is utilized. Kim et al. [10] adopted the hydrogen-purge PEMFC method at cathode side during cold start-up process. Their study results show that the hydrogen-purge method can effectively remove the cathode water and enhance the cold start-up performance of a PEMFC. Hou et al. [5] investigated the process of PEMFC freeze degradation utilizing 20 freeze/thaw cycles of two fuel cells; gas purging was adopted immediately, which indicated that the risk of freezing/thawing cycle can be reduced by reducing the water content of the catalyst. Moreover, to assist PEMFC start-up from −20 °C, Guo et al. [11] adopted an anodic hydrogen–oxygen catalytic reaction, which was studied by establishing a 3D heterogeneous cold start-up method of hydrogen–oxygen catalytic reaction. The results show that the heating position of the electrode has no significant effect on the catalytic reaction, and the starting current density is moderate. At the same time, the humidification of the anode also reduces the ohmic potential of the film, which improves the cold start-up behavior. By considering the influence of the different preheating methods and control strategies for PEMFC stack cold start-up [12], Zhan et al. proposed a phase-in preheating method. It is found that the corresponding optimal preheating method is to preheat the stack by air and end plates simultaneously.
Although these methods have achieved the cold start-up to some extent, the cold start-up time is still too long, and there is still a lot of room for improvement.
Nanoscale carbon materials containing carbon nanotubes (CNTs) [13,14,15,16,17,18,19] and graphene [20,21,22,23,24,25,26,27,28] have been widely used recently based on their outstanding electrical conductivity, relative structural stability and high heating efficiency, which make it possible to realize cold start to PEMFC.
Li et al. [29] prepared graphene nanosheets and found that the steady-state temperature of the films increases from 32 to 139 °C while the applied voltage rises from 5 to 30 V. Luo et al. [30] prepared electrothermal films, which present sensitive electrothermal behavior, and a steady-state temperature of 140 °C at 10 V. Su et al. [31] prepared multiwalled carbon nanotubes (MWCNT) film with electro-thermal effects, which exhibited excellent electrothermal effect and a high conductivity. The temperature of film is up to 60 °C within 60 s under an applied voltage of 30 V to promote the fast speed melting of ice within 34 s. Sun et al. [32] adopted a novel method to produce high performance graphene films for heating applications. The films show excellent heating and defogging performances, and reach a steady-state temperature of 127.5 °C when 40 V is exerted for 60 s.
So far, the studies on cold start-up of fuel cells only mainly focus on the single fuel cell, and there are very few studies regarding the melting process of the internal ice of the PEMFC stack and the method of electric heating to achieve cold start-up. In this paper, we introduce the constant power density as the input condition and utilize two heating methods to achieve cold start-up: one is to heat by the proton exchange membrane (PEM), and another is by the electrothermal membrane (ETF) inserted between the gas diffusion layer and the flow channel. Numerical calculations are carried out as follows: a two-phase non-steady-state model for cold start of a 40-layer two-dimensional PEMFC stack is established to track the solid/liquid interface and analyze the melting process in a PEMFC stack. Based on this model, the PEMFC stack heating and melting process is analyzed under the condition of residual water in the reactor before the start-up and the melting time of the PEMFC stack is predicted. Furthermore, a three-dimensional model of an actual single fuel cell is established and the ETF is placed on the flow channel. At last, the effect of different ETF hole sizes is studied for the cold start-up.
2. Model
2.1. Model Equation
- (1)
- The energy conservation equation in the solid region (such as end plates and gas flow channel) within the PEMFC stack is expressed bywhere are the density, enthalpy, thermal conductivity, and temperature of the solid region material, respectively.
- (2)
- The two liquid/solid phases in the fluid may coexist. Therefore, the volume of fluid (VOF) model as well as the solidification and melting model are used to observe the water/ice boundary and control the melting process.
The volume fraction of each kind of the fluids can be tracked by utilizing the VOF model. A continuity equation for the volume fraction of one (or more) of the phases is adopted to monitor the interface(s) between the phases. For the phase, this equation is given by
where is the mass transfer from phase to phase , is the mass transfer from phase to phase , and is the source term. The volume fraction equation will not be used to solve for the primary phase due to the reason that the volume fraction of the primary-phase will be calculated according to the following constraints
The problem of solidification and melting fluid flow within a certain temperature or temperature range can be solved by the solidification and melting model. Instead of tracking the liquid–solid boundary, the liquid–solid mushy zone is considered porous and its porosity is equal to the liquid fraction.
The energy equation in the liquid region is shown as
where , , are the energy, enthalpy and density of q-phase water, respectively. The q-phase and enthalpy can be represented by sensible enthalpy and enthalpy variation in the solidification and melting model, which is given by
where is the reference enthalpy, is the reference temperature, is the specific heat, represents the latent heat of liquid water and is the volume fraction of the liquid which is expressed by
where is the temperature at which water starts to freeze, is the temperature at which liquid begins to melt, is the separation coefficient of solute , which is the concentration ratio of the solid to liquid interface, is the mass fraction of solute and is the liquid limit surface gradient after considering the It is assumed that the last component of the mixture is a solvent and the other components are solutes.
- (3)
- The energy equation of the porous media (such as gas diffusion layer, proton exchange membrane, and electrothermal membrane) in a PEMFC stack is as followswhere the total energy of the fluid is defined as , the total energy of the solid medium is defined as , is the porosity of the porous medium, is the temperature of the porous medium region, is the source term, is the effective thermal conductivity of the medium, is the thermal conductivity of the liquid phase and is the thermal conductivity of the solid phase.
All the above unit of variables are summarized in Appendix C.
2.2. Numerical Implementations
The commercial code ANSYS Fluent is used; all source terms of the governing equations S, thermal conductivity K, heat transfer convection coefficient, are calculated based on the study of electrothermal film [13]. Both the proton exchange membrane (PEM) and electrothermal film (ETF) of the volume power density are 1 × 10⁷ W/m3, the PEM thermal conductivity K is 0.18 . The detailed calculation procedure about thermal power density and thermal conductivity is shown in Appendix B. The heat transfer convection coefficient is shown in Figure 1, where the , , , represent the heat transfer convection coefficient in top side, bottom side, left sides and right sides of the PEMFC stack, respectively. The corresponding values are 7.16 , 3.58 , 4.89 , 4.89 respectively. The detailed calculation process of the heat transfer convection coefficients are shown in Appendix A.
A pressure-based solver is adopted, which employs an algorithm belonging to the general method category, called the projection method [33]. The detailed solving process is shown in Figure 2.
The pressure-implicit with splitting of operators (PISO) pressure–velocity coupling algorithm is utilized, which is based on the higher degree of the approximate relation between the corrections for pressure and velocity. In the iterative process, all the equations are solved for a given time-step, until the convergence criteria are met. The detailed iteration process is shown in Figure 3.
2.2.1. PEMFC Stack Geometries and Properties
This paper establishes a two-dimensional PEMFC stack, which consists of 40 single PEMFCs connected in series. Each PEMFC consists of a cathode/anode bipolar plate (BP), a cathode/anode gas flow channel (GFC), a cathode/anode gas diffusion layer (GDL), a cathode/anode catalyst layer (CL), and a proton exchange membrane (PEM). The melting process of the ice is assumed to occur in the boundary area between the cathode/anode GFC and the GDL. The model structure of the PEMFC stack is shown in Figure 4, where the structure dimensions and material parameters are given in Table 1.
2.2.2. Meshing and Boundary
Due to an existing large number of meshing points, Figure 5a only shows the computational mesh of two single PEMFCs, Figure 5b shows the half of one single fuel cell meshing points. As a sufficient quantity of mesh is conducive to improve the calculation accuracy, several kinds of meshing size have been designed, which are 200 μm, 100 μm, 50 μm, 40 μm, 35 μm, 30 μm, 10 μm, respectively. We took ice melting time as the research object, and finally found that the meshing sizes of 200 μm, 100 μm, and 50 μm were quite different; the minimum difference between them reached up to 20%, while the results for 40 μm, 35 μm, 30 μm, and 10 μm were almost the same. We finally chose a meshing edge length of 40 μm for improving calculation efficiency. In order to simplify the model and reduce the calculation time, 1/2 model is adopted and a geometric/symmetric condition is applied at the bottom surface of the PEMFC stack. On the other hand, convection heat transfer coefficient is used to the all external surfaces of the PEMFC stack, and the detailed boundary conditions are represented in Appendix A.
The boundary conditions for the numerical simulation are as follows
where is the thermal conductivity of the material, is the heat exchange coefficient of the outer surface of the material to air, is the external ambient temperature, and is the outer surface temperature of the material.
3. Results and Discussions
3.1. The Results of PEMFC Stack Heating with Proton Exchange Membrane
The water in the gas flow channel (GFC) freezes easily. In order to study the melting process, the ice with a thickness of 0.1 mm is built on the gas flow channel. This part of the article takes the PEM as a heat source and applies a constant thermal power density of 1 × 10⁷ ; the ambient temperature of 263 K is set to observe the ice melting process and calculating the melting time.
The average temperature distribution of the material center of each layer in the PEMFC stack at different times is given by Figure 6. It can be seen that the temperature of each layer gradually increases with time, the proton exchange membrane (PEM) temperature is the highest, and the temperature of the catalyst layer (CL), gas diffusion layer (GDL), ICE, and gas flow channel (GFC) layers is relatively lower, and the temperature of the bipolar plate (BP) layer is the lowest. It is also apparent that when the temperature rises to 273 K, the ice starts to melt and the complete melting time lasts for about 12 s. Due to the fact that ice needs to absorb heat during the melting process, the temperature curvature of each layer is almost horizontal from the beginning to the end. After the ice is completely melted, the temperature of each layer continues to rise.
The liquid fraction distribution at the center of the ICE layer in the PEMFC stack at different times is given by Figure 7, what can be seen from the figure is the fact that the liquid fraction is 0 before the temperature reaches 273 K. When the temperature arrives at 273 K and the time is 20 s, the ice starts to melt, and as the heating time increases, the liquid fraction of ice increases gradually. When it is heated to 32.5 s, the liquid fraction is 1, which means the ice is completely melted.
In order to observe the overall temperature distribution of the PEMFC Stack, the 16th second is selected to observe the temperature distribution in the vertical direction. The temperature distribution curve of each layer of the PEMFC stack before the overall temperature reached the melting point is displayed in Figure 8. The horizontal ordinate is the distance in the vertical direction of PEMFC stack, including the negative/positive GFC, the ICE, the GDL, the CL, the PEM, and the BP of fuel cell. In addition, the vertical coordinate is the temperature distribution in the vertical direction, it can be clearly seen that the temperature differentiates between the layers in the PEMFC stack. Among them, the average temperature of the BP is the lowest, only 270.5 K, the PEM is the highest, 271.6 K, and GFC is 271.5 K.
The temperature distribution of the PEMFC stack at different times (24 s, 28 s, 32 s) is shown in Figure 9. The ice is located at the middle of the blue area because there is no ice on the edges where the temperature is higher. The temperature distribution of the ice inside is still lower, and the temperature reaches a melting point of 273 K at 24 s. As the heating time increases, the temperature continues to rise and the ice continues to melt. Figure 10 shows the temperature distribution of PEM at different times (24 s, 28 s, 32 s), which can be seen clearly that the temperature gradually increases as computing time extension.
Figure 11 depicts the melting process of the PEMFC stack at different times (24 s, 28 s, 32 s), showing that the temperature of the PEMFC stack reaches 273 K at 24 s, and the ice in PEMFC stack begins to melt. The inner ice melts first and the first and 40th pieces melt last. Most of the ice in the PEMFC stack melts at 28 s, and the ice is basically melted at 32 s. Figure 12 shows the melting process of the ice at different times (24 s, 28 s, 32 s); it can be seen that the ice in the PEMFC stack begins to melt at 24 s, and most of the ice in the PEMFC stack melts at 28 s, and the ice is basically melted at 32 s. The reason why only the top layer is not completely melted is because the top layer cell is in direct contact with the atmosphere, where there exists a natural convective heat dissipation. The complete melting time of ice is 32.5 s.
3.2. The Results of PEMFC Stack Heating with Electrothermal Film
In order to study the melting process and the ice melting time, the ice with a thickness of 0.1 mm is established on the Gas Flow Channel, and the Electrothermal Film (ETF) with a thickness of 0.1 mm is built on the ice. This part of the article takes the ETF as a heat source and sets a constant thermal power density and ambient temperature as 1 × 10⁷ W/m C, 263 K, respectively.
Figure 13 is the average temperature distribution of the material center of each layer in the PEMFC stack at different times. It can be seen that the temperature of each layer gradually increases with time, the ETF temperature is the highest, the temperatures of GDL, CL, PEM, ICE, and GFC layers are relatively lower, and the BP layer has the lowest temperature. What we can also conclude is that when the temperature rises to 273 K, the ice starts to melt, and the whole melting time lasts for about 15 s. From the beginning to the end of the melting, the temperature curvature of each layer is small. This is due to the reason that the ice needs to absorb heat during the melting process. After the ice has completely melted, the temperature of each layer continues to rise.
The liquid fraction distribution of the center of the ICE layer in the inner layer fuel cell of the PEMFC stack at different times is given by Figure 14, from which it can be seen that the liquid fraction is 0 before the temperature reaches 273 K. When the temperature arrives at 273 K and the time is 20 s, the ice starts to melt. As the heating time increases, the liquid fraction of ice gradually rises. When it is heated to 36 s, the liquid fraction is 1 and the ice is completely melted.
In order to observe the overall temperature distribution of the PEMFC Stack, the 16th second is selected to observe the temperature distribution in the vertical direction. Figure 15 is the temperature distribution curve of each layer of the PEMFC stack before the overall temperature reaches the melting point. The horizontal ordinate is the distance in the vertical direction of the PEMFC stack, including the negative/positive GFC, the ICE, the ETF, the GDL, the CL, the PEM, and the BP of the fuel cell, and the vertical coordinate is the temperature distribution in the vertical direction; the temperature differences between the layers in the PEMFC stack can be clearly seen. Among them, the average temperature of the BP is the lowest, only 270.05 K, the ETF is the highest, 271.3 K, and the GFC is 271.1 K.
The temperature distribution of the PEMFC stack at different times (24 s, 32 s, 36 s) is shown in Figure 16. The ice is located at the middle of the blue area. Because there is no ice on the edges, the temperature is higher. However, the temperature distribution of the ice inside is still lower, and the temperature reaches the melting point of 273 K at 24 s. As the heating time increases, the temperature continues to rise and the ice continues to melt. Figure 17 shows the temperature distribution of ETF at different times (24 s, 32 s, 36 s), from which it can be seen clearly that the temperature gradually increases as computing time extends.
Figure 18 shows the melting process of the PEMFC stack at different times (24 s, 32 s, 36 s), showing that the temperature of the PEMFC stack reaches 273 K at 24, and the ice in the PEMFC stack begins to melt. The inner ice melts first and the first and 40th pieces melt last. Most of the ice in PEMFC stack melts at 32 s, and the ice basically melts completely at 36 s. Figure 19 shows the melting process of the ice at different times (24 s, 32 s, 36 s), from which it can be seen that the ice in the PEMFC stack begins to melt at 24 s, most of the ice in PEMFC stack melts at 32 s, and the ice is basically melted at 36 s. The reason why only the top layer is not completely melted is due to the fact that the top layer cell is in direct contact with the atmosphere and there is a natural convective heat dissipation. The complete melting time of ice is 36.5 s.
3.3. The Simulation Results of Different Electrothermal Film Structure
3.3.1. The Three-Dimensional Structure Design of Electrothermal Film
In order to ensure the smooth flow of hydrogen and air, the electrothermal film (ETF) should maintain a certain porosity. The effects of the different ETF structures on the melting time are researched. The structure adopts the same porosity, and ETF with different pore sizes are established. Due to comparative analysis, this paper only builds one fuel cell. The structure is the GFC, ICE, and ETF from the bottom to the top. In order to simplify the model, only one half of a fuel cell is built and symmetric constraints are applied on the top face of the GFC. The dimension of the GFC is 40 mm × 40 mm × 1.6 mm, both the ICE thickness and ETF thickness is 1 mm. In this paper, a constant porosity of 60% is adopted, and the pore sizes from small to large are 0.3 mm, 0.6 mm and 1.2 mm, respectively. A constant power density of 1 × 10⁷ W/m3 is used, and ambient temperature is set as 263 K. The detailed fuel cell structure is shown in Figure 20, and the ETF structure is shown in Figure 21.
3.3.2. Simulation Results
Figure 22 shows the process of the average temperature of each layer of ETF with different pore sizes over time; it can be seen that as the time increases, the temperature of each layer gradually increases, where the temperature of the ETF layer is the highest. The ICE layer is second and the GFC layer is the lowest. It can also be seen that when the temperature rises to 273 K, the ice starts to melt, and the complete melting time lasts for about 10 s. From the beginning to the end of the melting, the temperature curvature of each layer is small. This is because the ice needs to absorb heat during the melting process. After the ice has been completely melted, the temperature of each layer continues to rise. The lower right corner is an enlarged average temperature value of each layer of different ETF pore sizes at 46 s. It can be clearly seen that at the same porosity, the ETF with a hole size of 0.3 mm has the higher temperature compared to the ETF with a 0.6-mm hole size. The temperature of 1.2 mm is the lowest.
Figure 23 shows the liquid fraction distribution of different ETF structures at different times: the liquid fraction is shown to be 0 before the temperature reaches 273 K. When the temperature reaches 273 K, the ice starts to melt. As the heating time increases, the liquid fraction of the ice gradually increases. When the liquid fraction reaches 1, the ice is completely melted. It can also be seen clearly is that the complete melting time of the ETF with different pore sizes is variable. The ETF with a pore size of 0.3 mm melts first, followed by 0.6 mm, and 0.9 mm melts last. The complete melting times are 42 s, 44 s, and 46 s, respectively.
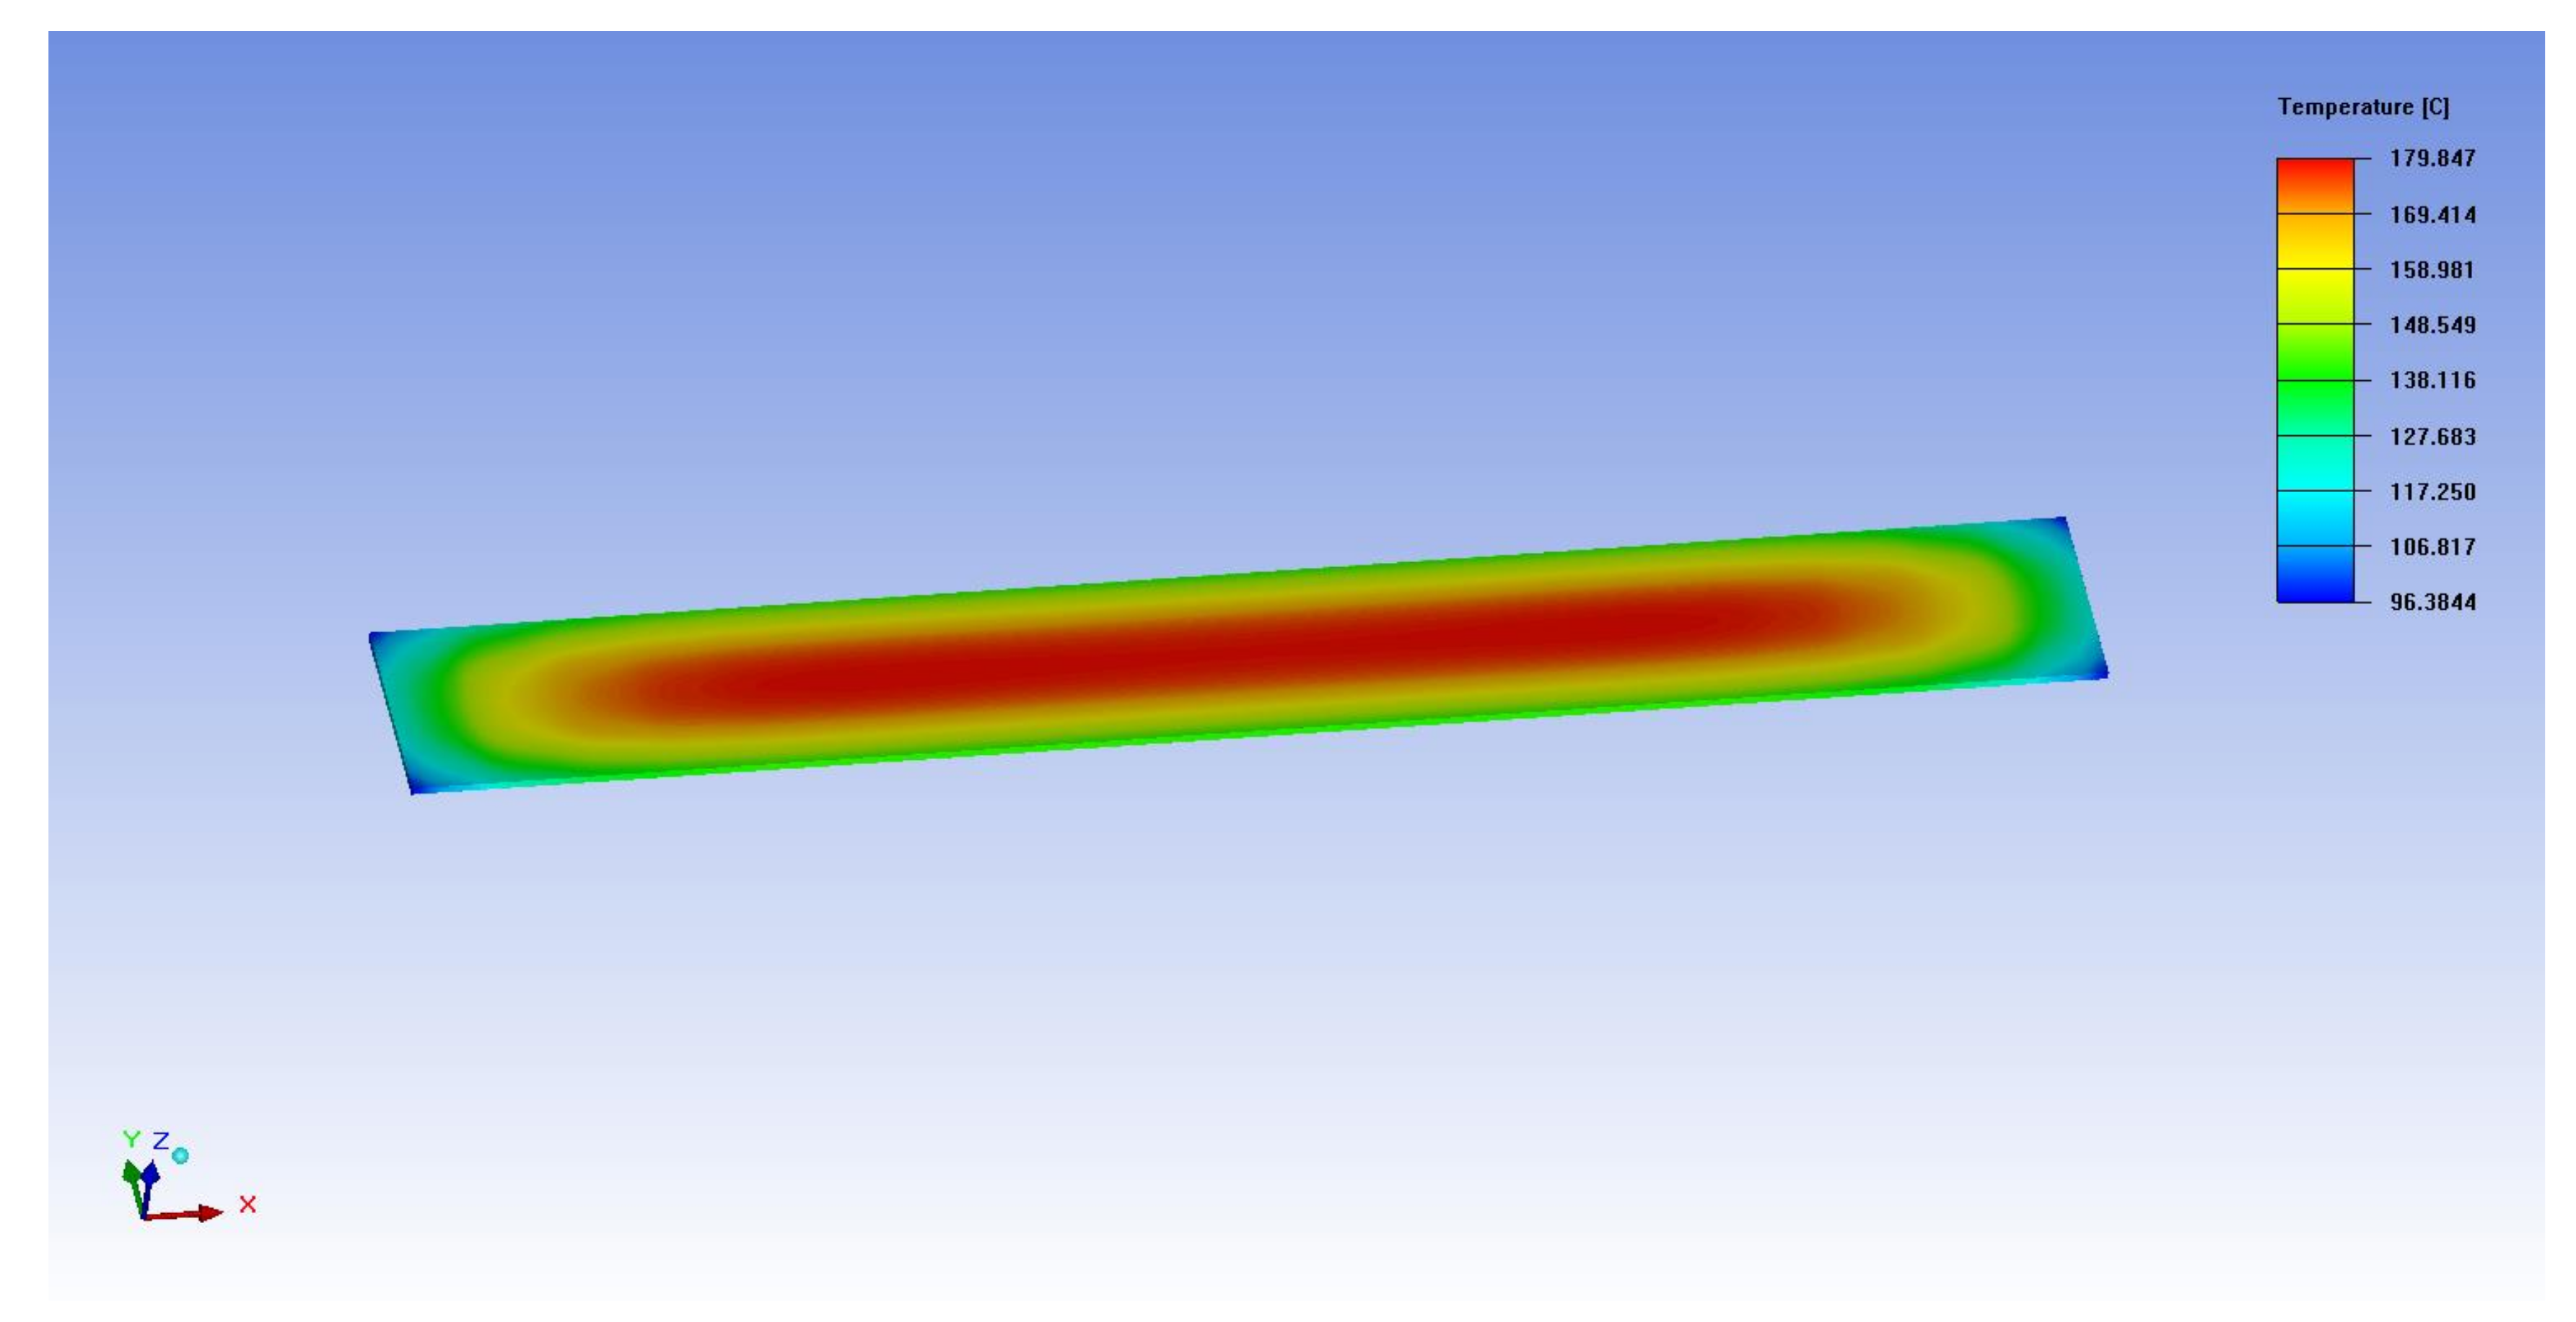
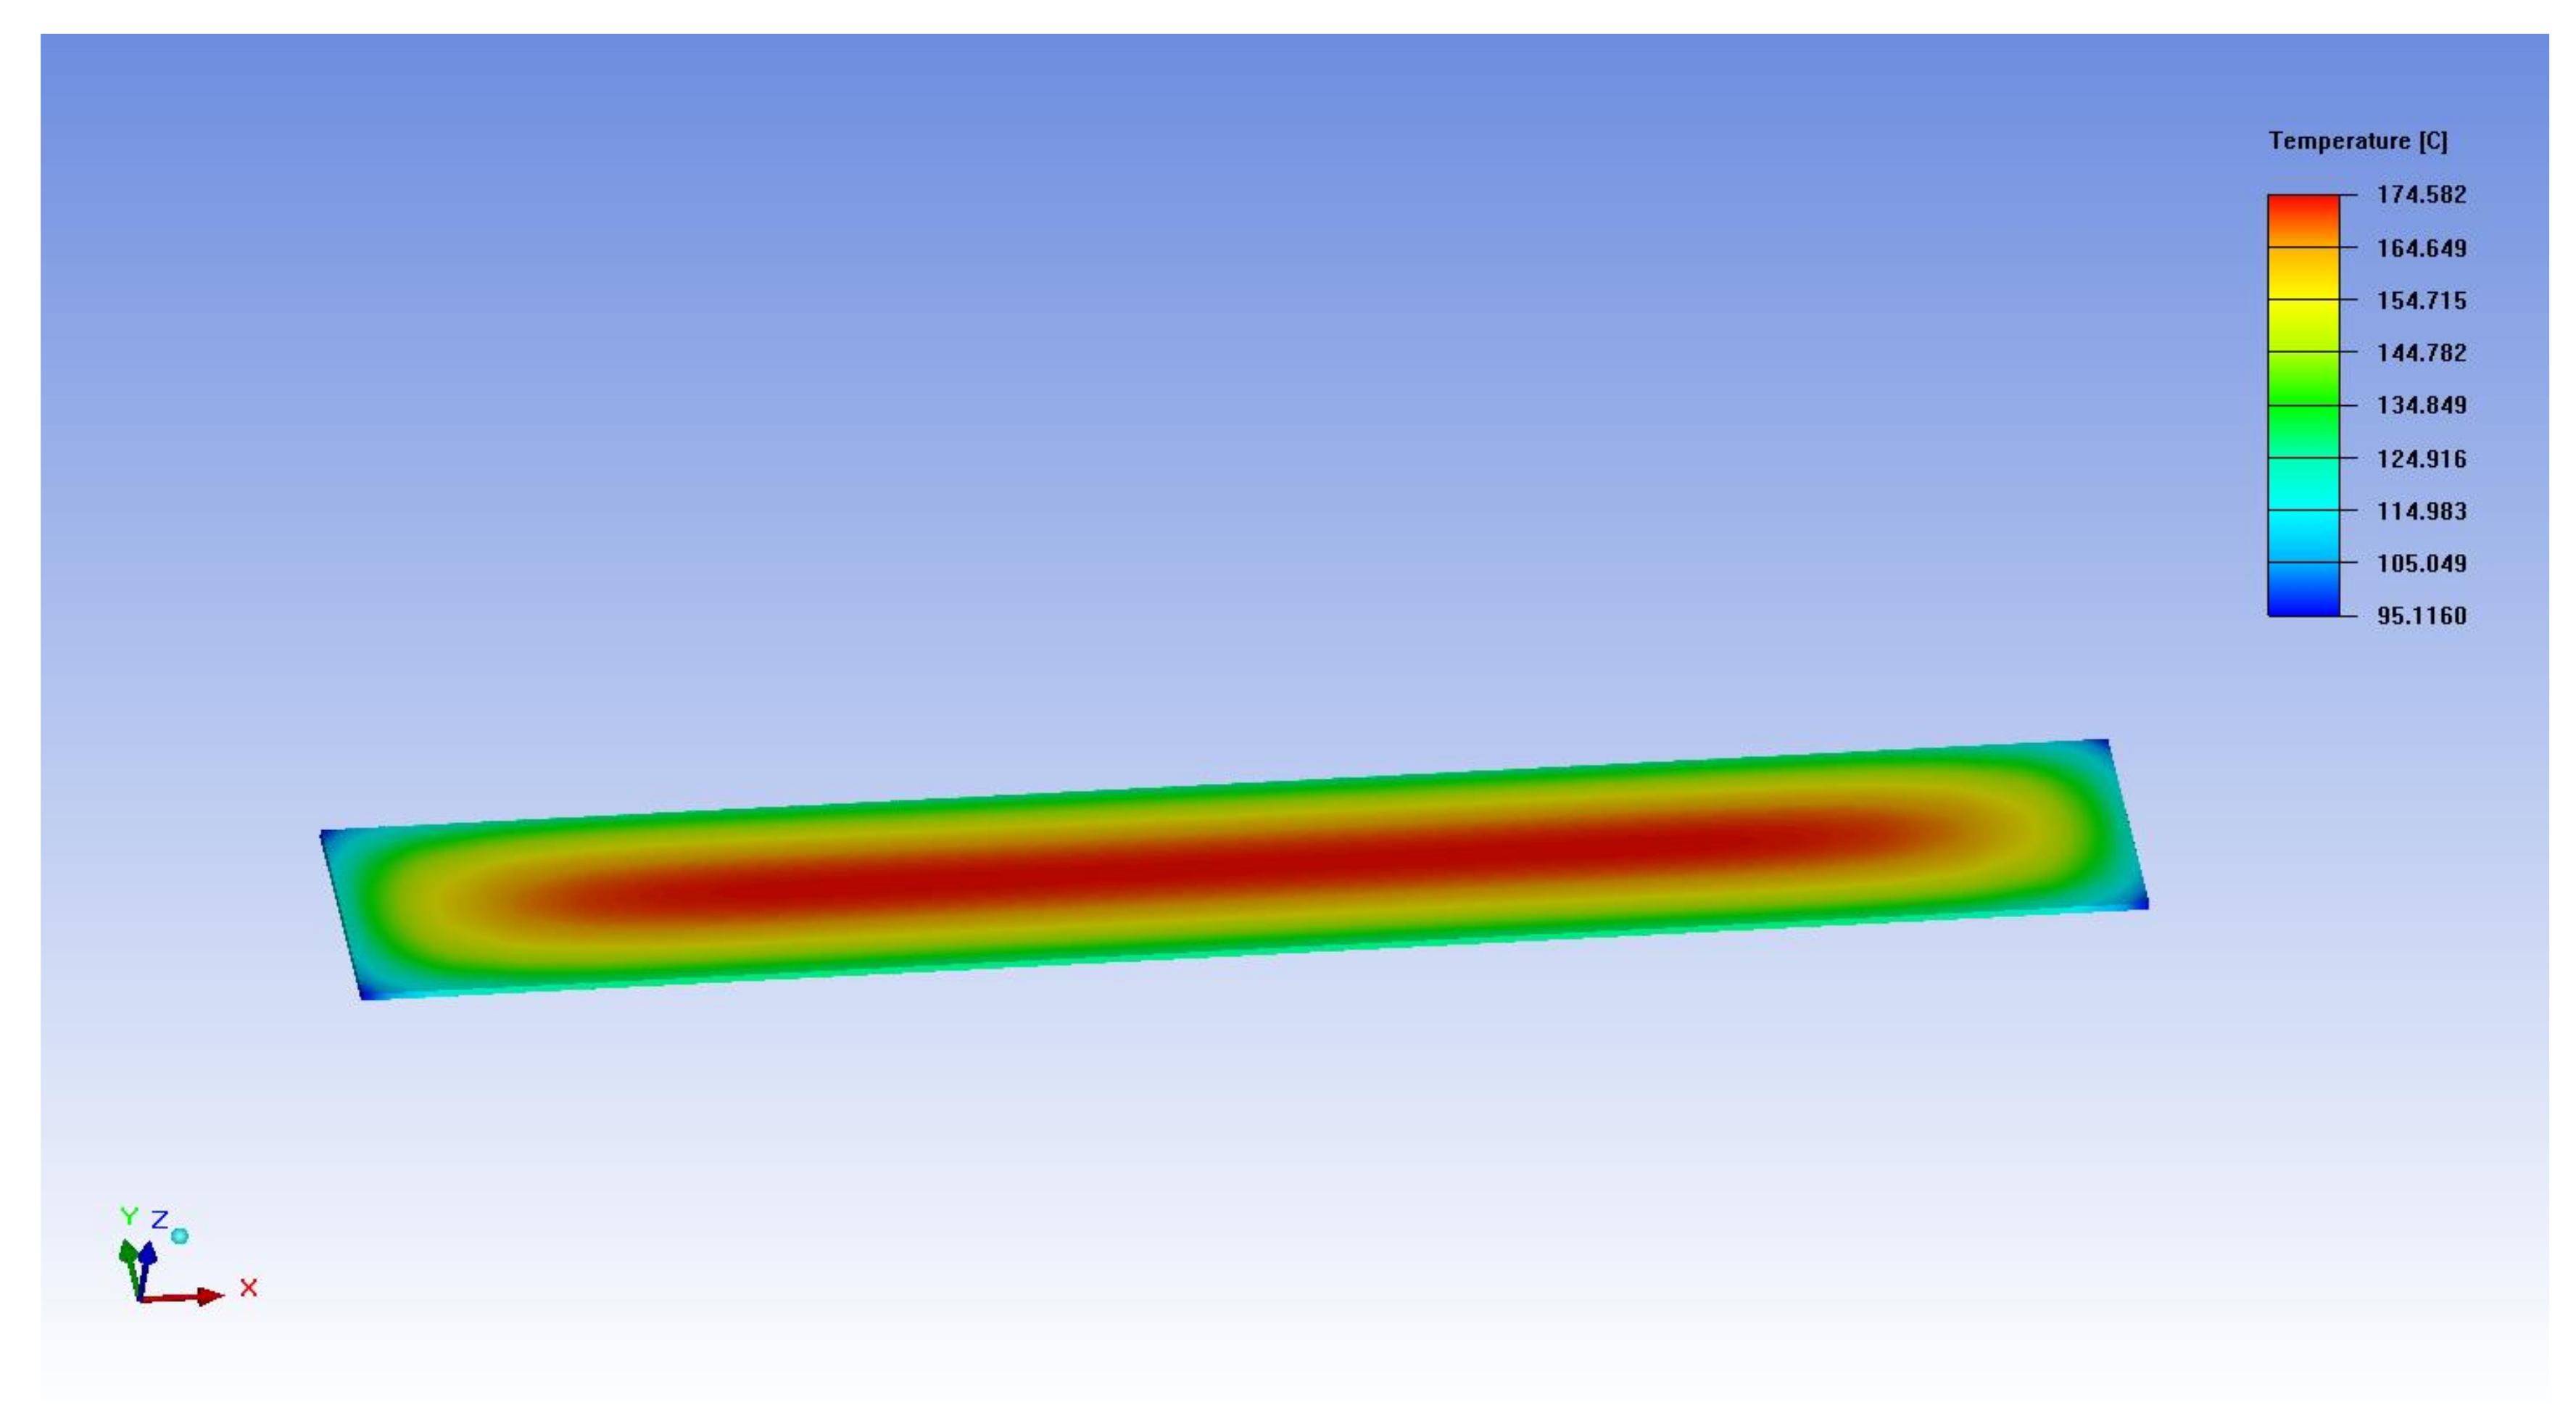
Figure 24, Figure 25, Figure 26 show the overall temperature distribution of the ETF with pore dimensions of 0.3 mm, 0.6 mm and 1.2 mm, respectively. It can be seen that the ETF pore sizes of 0.3 mm, 0.6 mm and 1.2 mm arrive at the melting point after 28 s, 30 s and 32 s, respectively. The final temperature of the PEMFC fuel cell is about 276 K when the ice is completely melted.
Figure 27, Figure 28, Figure 29 shows the distribution of liquid fraction of ice when the hole sizes of the ETF are 0.3 mm, 0.6 mm and 1.2 mm, respectively. It can be seen that the pore size of 0.3 mm melts first, followed by 0.6 mm, and 1.2 mm is the last to completely melt. When the pore sizes of the ETF are 0.3 mm, 0.6 mm and 1.2 mm, the ice initial melting times are 28 s, 30 s and 32 s, respectively. The final melting times are 44 s, 46 s and 48 s, respectively.
4. Conclusions
Based on the solidification and melting model and multi-phase flow model, this paper applies the Fluent software to simulate the melting process of the PEMFC stack. The numerical simulation analysis of the melting process is conducted using the PEM electric heating method and the electrothermal film heating method. The following conclusions were obtained:
- Both the PEM electric heating method and the electrothermal film heating method were able to achieve rapid cold start-up. The ice inside the PEMFC stack melted first, and the first and 40th pieces melted afterwards. The ice melting time of the PEMFC stack of the two methods was 32.5 s and 36.5 s, respectively.
- In order to study the effect of different electrothermal film (ETF) structures on cold start-up performance, ETFs with pore diameters of 0.3 mm, 0.6 mm, and 0.9 mm were established. It was found that the pore size of 0.3 mm melts first, followed by 0.6 mm, and then 1.2 mm. When the pore sizes of the ETF were 0.3 mm, 0.6 mm and 1.2 mm, the ice initial melting times were 28 s, 30 s and 32 s, respectively, and the corresponding final melting times were 44 s, 46 s and 48 s, respectively.
Author Contributions
Conceptualization, W.J. and B.Z.; methodology, W.J.; software, W.J.; validation, B.Z., K.S. and W.J.; formal analysis, W.J.; investigation, W.J.; resources, W.J.; data curation, B.Z.; writing—original draft preparation, W.J.; writing—review and editing, B.Z., K.S. and W.J.; visualization, Y.X.; supervision, R.F.; project administration, R.F.; funding acquisition, Y.X. All authors have read and agreed to the published version of the manuscript.
Funding
This research was funded by [National key Research and development program] grant number [2018YFB0105501].
Conflicts of Interest
The authors declare no conflict of interest.
Appendix A. Determination of the Heat Transfer Coefficient hext
The empirical formula proposed by QuanLi is given
where is the surface convection heat transfer coefficient, is the surface temperature of the material, and is the external ambient temperature. In this paper, is set to 275 K, which is the maximum PEMFC surface temperature. is set to 263 K.
- When = 1.22, = 0.35, represents the vertical surface convection heat transfer coefficient, P = H;
- When = 1.0, = 0.33, represents the convection heat transfer coefficient of horizontal top surface, ;
- When = 0.5, = 0.33, represents the convection heat transfer coefficient of horizontal bottom surface;
- Where L is the length of the horizontal plane, W is the width of the horizontal plane, and H is the vertical height.
The paper uses a 40-layer two-dimensional PEMFC stack with an overall size of 70 mm × 132.8 mm. The actual stack length and width are equal, that is, W = L = 70 mm. It can be deduced that the top and bottom boundary convection heat transfer coefficients are 7.16 and 3.58 , respectively, and vertical boundary convection heat transfer coefficient is 4.89 .
Appendix B. Determination of Thermal Conductivity and Volume Power Density of the ETF
In this paper, the carbon nanotube film is used for the ETF. Young et al. [13] studied the electrothermal performance of the carbon nanotube film and calculated the convective heat transfer coefficient of the carbon nanotube film. The maximum value is 7.4 W/m3. . The ETF actual thickness is 0.1 mm, and the thermal conductivity of the ETF can be calculated according to the following:
where is the thermal conductivity, is the convective heat transfer coefficient of the carbon nanotube film, and is the thickness of the carbon nanotube film.
Young et al. concluded that the carbon nanotube film can be heated to 176 °C when the voltage is 10 V. The paper uses ANSYS-ICEPAK software to establish the same structure as what studied by Young et al. The same voltage is applied at 10 V to reach 176 °C. The thermal conductivity is the reversed calculation of 0.175 , and the calculation result is shown in Figure A1.
In summary, due to the small difference in thermal conductivity between the two methods, the thermal conductivity of the electric heating film is 0.18.
Figure A1.
Calculation result of the thermal conductivity.
Young et al.’s results also show that under the load of 1–2 W, the temperature can be increased to 176 °C The article also uses ANSYS-ICEPAK software, and applies a thermal conductivity of 0.18 to study the loaded power when the temperature rise reaches 176 °C. The calculational results are shown in Figure A2:
The calculation results show that the temperature can reach 176 °C when the power is 1.2 W, so the power of the electric heating film is 1.2 W. According to the actual structure of the electric heating film, the power density is 1 107 .
Figure A2.
The calculation result of temperature.
Appendix C. The Units of Variables

Table A1.
The unit of variables
| Symbol | Variable | Units |
| density of solid | kg m−3 | |
| density of fluid | ||
| density of fulid | ||
| density | ||
| thermal conductivity of the solid phase. | W m−1 K−1 | |
| thermal conductivity of the liquid phase | ||
| effective thermal conductivity of the medium | ||
| the fluid’s volume fraction | ||
| velocity of fluid | m.s−1 | |
| velocity vector | ||
| source term | W.m−3 | |
| source term | ||
| the mass transfer from phase q to phase p | kg | |
| the mass transfer from phase p to phase q | ||
| enthalpy | kJ/kg | |
| enthalpy of fluid | ||
| enthalpy variation | ||
| reference enthalpy | ||
| specific heat | J.kg−1. K−1 | |
| volume fraction of the liquid | ||
| latent heat of liquid water | J.kg−1 | |
| temperature of q-phase | K | |
| temperature of the porous medium region | ||
| outer surface temperature of the material | ||
| external ambient temperature | ||
| temperature of water starts to freeze | ||
| temperature of liquid begins to melt | ||
| porosity of the porous medium | ||
| energy of fluid | J | |
| total energy of the fluid | J | |
| total energy of the solid medium | J | |
| convective heat transfer coefficient | W/(m2 °C) |
References
- Cano, Z.P.; Banham, D.; Ye, S.; Hintennach, A.; Lu, J.; Fowler, M.; Chen, Z. Batteries and fuel cells for emerging electric vehicle markets. Nat. Energy 2018, 3, 279–289. [Google Scholar] [CrossRef]
- Knorr, F.; Sanchez, D.G.; Schirmer, J.; Gazdzicki, P.; Friedrich, K.A. Methanol as antifreeze agent for cold start of automotive polymer electrolyte membrane fuel cells. Appl. Energy 2019, 238, 1–10. [Google Scholar] [CrossRef]
- Li, L.; Wang, S.; Yue, L.; Wang, G. Cold-start icing characteristics of proton-exchange membrane fuel cells. Int. J. Hydrogen Energy 2019, 44, 12033–12042. [Google Scholar] [CrossRef]
- Hou, J.; Yu, H.; Zhang, S.; Sun, S.; Wang, H.; Yi, B.; Ming, P. Analysis of PEMFC freeze degradation at −20 °C after gas purging. J. Power Sources 2006, 162, 513–520. [Google Scholar] [CrossRef]
- Huo, S.; Jiao, K.; Park, J.W. On the water transport behavior and phase transition mechanisms in cold start operation of PEM fuel cell. Appl. Energy 2019, 233–234, 776–788. [Google Scholar] [CrossRef]
- Jiao, K.; Li, X. Three-dimensional multiphase modeling of cold start processes in polymer electrolyte membrane fuel cells. Electrochim. Acta 2009, 54, 6876–6891. [Google Scholar] [CrossRef]
- Jean, B.S.; Marcelo, D.V. Global Change, Energy Issues and Regulation Policies; Integrated Science and Technology Program; Springer: Dordrecht, The Netherlands, 2013. [Google Scholar]
- Jiao, K.; Alaefour, I.E.; Karimi, G.; Li, X. Simultaneous measurement of current and temperature distributions in a proton exchange membrane fuel cell during cold start processes. Electrochim. Acta 2011, 56, 2967–2982. [Google Scholar] [CrossRef]
- Du, Q.; Jia, B.; Luo, Y.Q.; Chen, J.; Zhou, Y.; Jiao, K. Maximum power cold start mode of proton exchange membrane fuel cell. Int. J. Hydrogen Energy 2014, 39, 8390–8400. [Google Scholar] [CrossRef]
- Kim, S.I.; Lee, N.W.; Kim, Y.S.; Kim, M.S. Effective purge method with addition of hydrogen on the cathode side for cold start in PEM fuel cell. Int. J. Hydrogen Energy 2013, 38, 11357–11369. [Google Scholar] [CrossRef]
- Guo, Q.; Luo, Y.Q.; Jiao, K. Modeling of assisted cold start processes with anode catalytic hydrogen–oxygen reaction in proton exchange membrane fuel cell. Int. J. Hydrogen Energy 2013, 38, 1004–1015. [Google Scholar] [CrossRef]
- Zhan, Z.; Yuan, C.; Hu, Z.; Wang, H.; Sui, P.C.; Djilali, N.; Pan, M. Experimental study on different preheating methods for the cold-start of PEMFC stacks. Energy 2018, 162, 1029–1040. [Google Scholar] [CrossRef]
- Jeong, Y.G.; Jeon, G.W. Microstructure and performance of multiwalled carbon nanotube/m-aramid composite films as electric heating elements. ACS Appl. Mater. Interfaces 2013, 5, 6527–6534. [Google Scholar] [CrossRef] [PubMed]
- Janas, D.; Koziol, K.K. Rapid electrothermal response of high-temperature carbon nanotube film heaters. Carbon 2013, 59, 457–463. [Google Scholar] [CrossRef]
- Biercuk, M.J.; Llaguno, M.C.; Radosavljevic, M.; Hyun, J.K.; Johnson, A.T.; Fischer, J.E. Carbon nanotube composites for thermal management. Appl. Phys. Lett. 2002, 80, 2767–2769. [Google Scholar] [CrossRef]
- Jang, H.-S.; Jeon, S.K.; Nahm, S.H. The manufacture of a transparent film heater by spinning multi-walled carbon nanotubes. Carbon 2011, 49, 111–116. [Google Scholar] [CrossRef]
- Yan, J.; Jeong, Y.G. Multiwalled carbon nanotube/polydimethylsiloxane composite films as high performance flexible electric heating elements. Appl. Phys. Lett. 2014, 105, 051907. [Google Scholar] [CrossRef]
- Xiao, Z.; Sheng, C.; Xia, Y.; Yu, X.; Liang, C.; Huang, H.; Gan, Y.; Zhang, J.; Zhang, W. Electrical heating behavior of flexible thermoplastic polyurethane/Super-P nanoparticle composite films for advanced wearable heaters. J. Ind. Eng. Chem. 2019, 71, 293–300. [Google Scholar] [CrossRef]
- Bai, B.C.; Kang, S.C.; Im, J.S.; Lee, S.H.; Lee, Y.-S. Effect of oxyfluorinated multi-walled carbon nanotube additives on positive temperature coefficient/negative temperature coefficient behavior in high-density polyethylene polymeric switches. Mater. Res. Bull. 2011, 46, 1391–1397. [Google Scholar] [CrossRef]
- Zhang, T.Y.; Zhao, H.M.; Wang, D.Y.; Wang, Q.; Pang, Y.; Deng, N.Q.; Cao, H.-W.; Yang, Y.; Ren, T.-L. A super flexible and custom-shaped graphene heater. Nanoscale 2017, 9, 14357–14363. [Google Scholar] [CrossRef]
- Tan, L.; Zeng, M.; Wu, Q.; Chen, L.; Wang, J.; Zhang, T.; Eckert, J.; Rümmeli, M.H.; Fu, L. Direct growth of ultrafast transparent single-layer graphene defoggers. Small 2015, 11, 1840–1846. [Google Scholar] [CrossRef]
- Sui, D.; Huang, Y.; Huang, L.; Liang, J.; Ma, Y.; Chen, Y. Flexible and transparent electrothermal film heaters based on graphene materials. Small 2011, 7, 3186–3192. [Google Scholar] [CrossRef] [PubMed]
- Tian, J.; Yang, J.; Yang, C.; Hao, S. Compression and reduction of graphene oxide aerogels into flexible, porous and functional graphene films. J. Mater. Sci. 2019, 54, 13147–13156. [Google Scholar] [CrossRef]
- An, J.-E.; Jeong, Y.G. Structure and electric heating performance of graphene/epoxy composite films. Eur. Polym. J. 2013, 49, 1322–1330. [Google Scholar] [CrossRef]
- Bae, J.J.; Lim, S.C.; Han, G.H.; Jo, Y.W.; Doung, D.L.; Kim, E.S.; Chae, S.J.; Huy, T.Q.; Van Luan, N.; Lee, Y.H. Heat Dissipation of Transparent Graphene Defoggers. Adv. Funct. Mater. 2012, 22, 4819–4826. [Google Scholar] [CrossRef]
- Shin, K.-Y.; Hong, J.-Y.; Lee, S.; Jang, J. High electrothermal performance of expanded graphite nanoplatelet-based patch heater. J. Mater. Chem. 2012, 22, 23404–23410. [Google Scholar] [CrossRef]
- Dutil, Y.; Rousse, D.R.; Salah, N.B.; Lassue, S.; Zalewski, L. A review on phase-change materials: Mathematical modeling and simulations. Renew. Sustain. Energy Rev. 2011, 15, 112–130. [Google Scholar] [CrossRef]
- Kang, J.; Kim, H.; Kim, K.S.; Lee, S.K.; Bae, S.; Ahn, J.H.; Kim, Y.-J.; Choi, J.-B.; Hong, B.H. High-performance graphene-based transparent flexible heaters. Nano Lett. 2011, 11, 5154–5158. [Google Scholar] [CrossRef]
- Li, C.; Xu, Y.-T.; Zhao, B.; Jiang, L.; Chen, S.-G.; Xu, J.-B.; Fu, X.-Z.; Sun, R.; Wong, C.-P. Flexible graphene electrothermal films made from electrochemically exfoliated graphite. J. Mater. Sci. 2015, 51, 1043–1051. [Google Scholar] [CrossRef]
- Luo, J.; Lu, H.; Zhang, Q.; Yao, Y.; Chen, M.; Li, Q. Flexible carbon nanotube/polyurethane electrothermal films. Carbon 2016, 110, 343–349. [Google Scholar] [CrossRef] [Green Version]
- Su, X.; Li, H.; Lai, X.; Yang, Z.; Chen, Z.; Wu, W.; Zeng, X. Vacuum-assisted layer-by-layer superhydrophobic carbon nanotube films with electrothermal and photothermal effects for deicing and controllable manipulation. J. Mater. Chem. A 2018, 6, 16910–16919. [Google Scholar] [CrossRef]
- Sun, H.; Chen, D.; Ye, C.; Li, X.; Dai, D.; Yuan, Q.; Chee, K.W.A.; Zhao, P.; Jiang, N.; Lin, C.-T. Large-area self-assembled reduced graphene oxide/electrochemically exfoliated graphene hybrid films for transparent electrothermal heaters. Appl. Surf. Sci. 2018, 435, 809–814. [Google Scholar] [CrossRef]
- Chorin, A.J. Numerical solution of navier-stokes equations. Math. Comput. 1968, 22, 745–762. [Google Scholar] [CrossRef]
- Ko, J.; Kim, W.-G.; Lim, Y.-D.; Ju, H. Improving the cold-start capability of polymer electrolyte fuel cells (PEFCs) by using a dual-function micro-porous layer (MPL): Numerical simulations. Int. J. Hydrogen Energy 2013, 38, 652–659. [Google Scholar] [CrossRef]
Figure 1.
The boundary of a proton exchange membrane fuel cell (PEMFC).
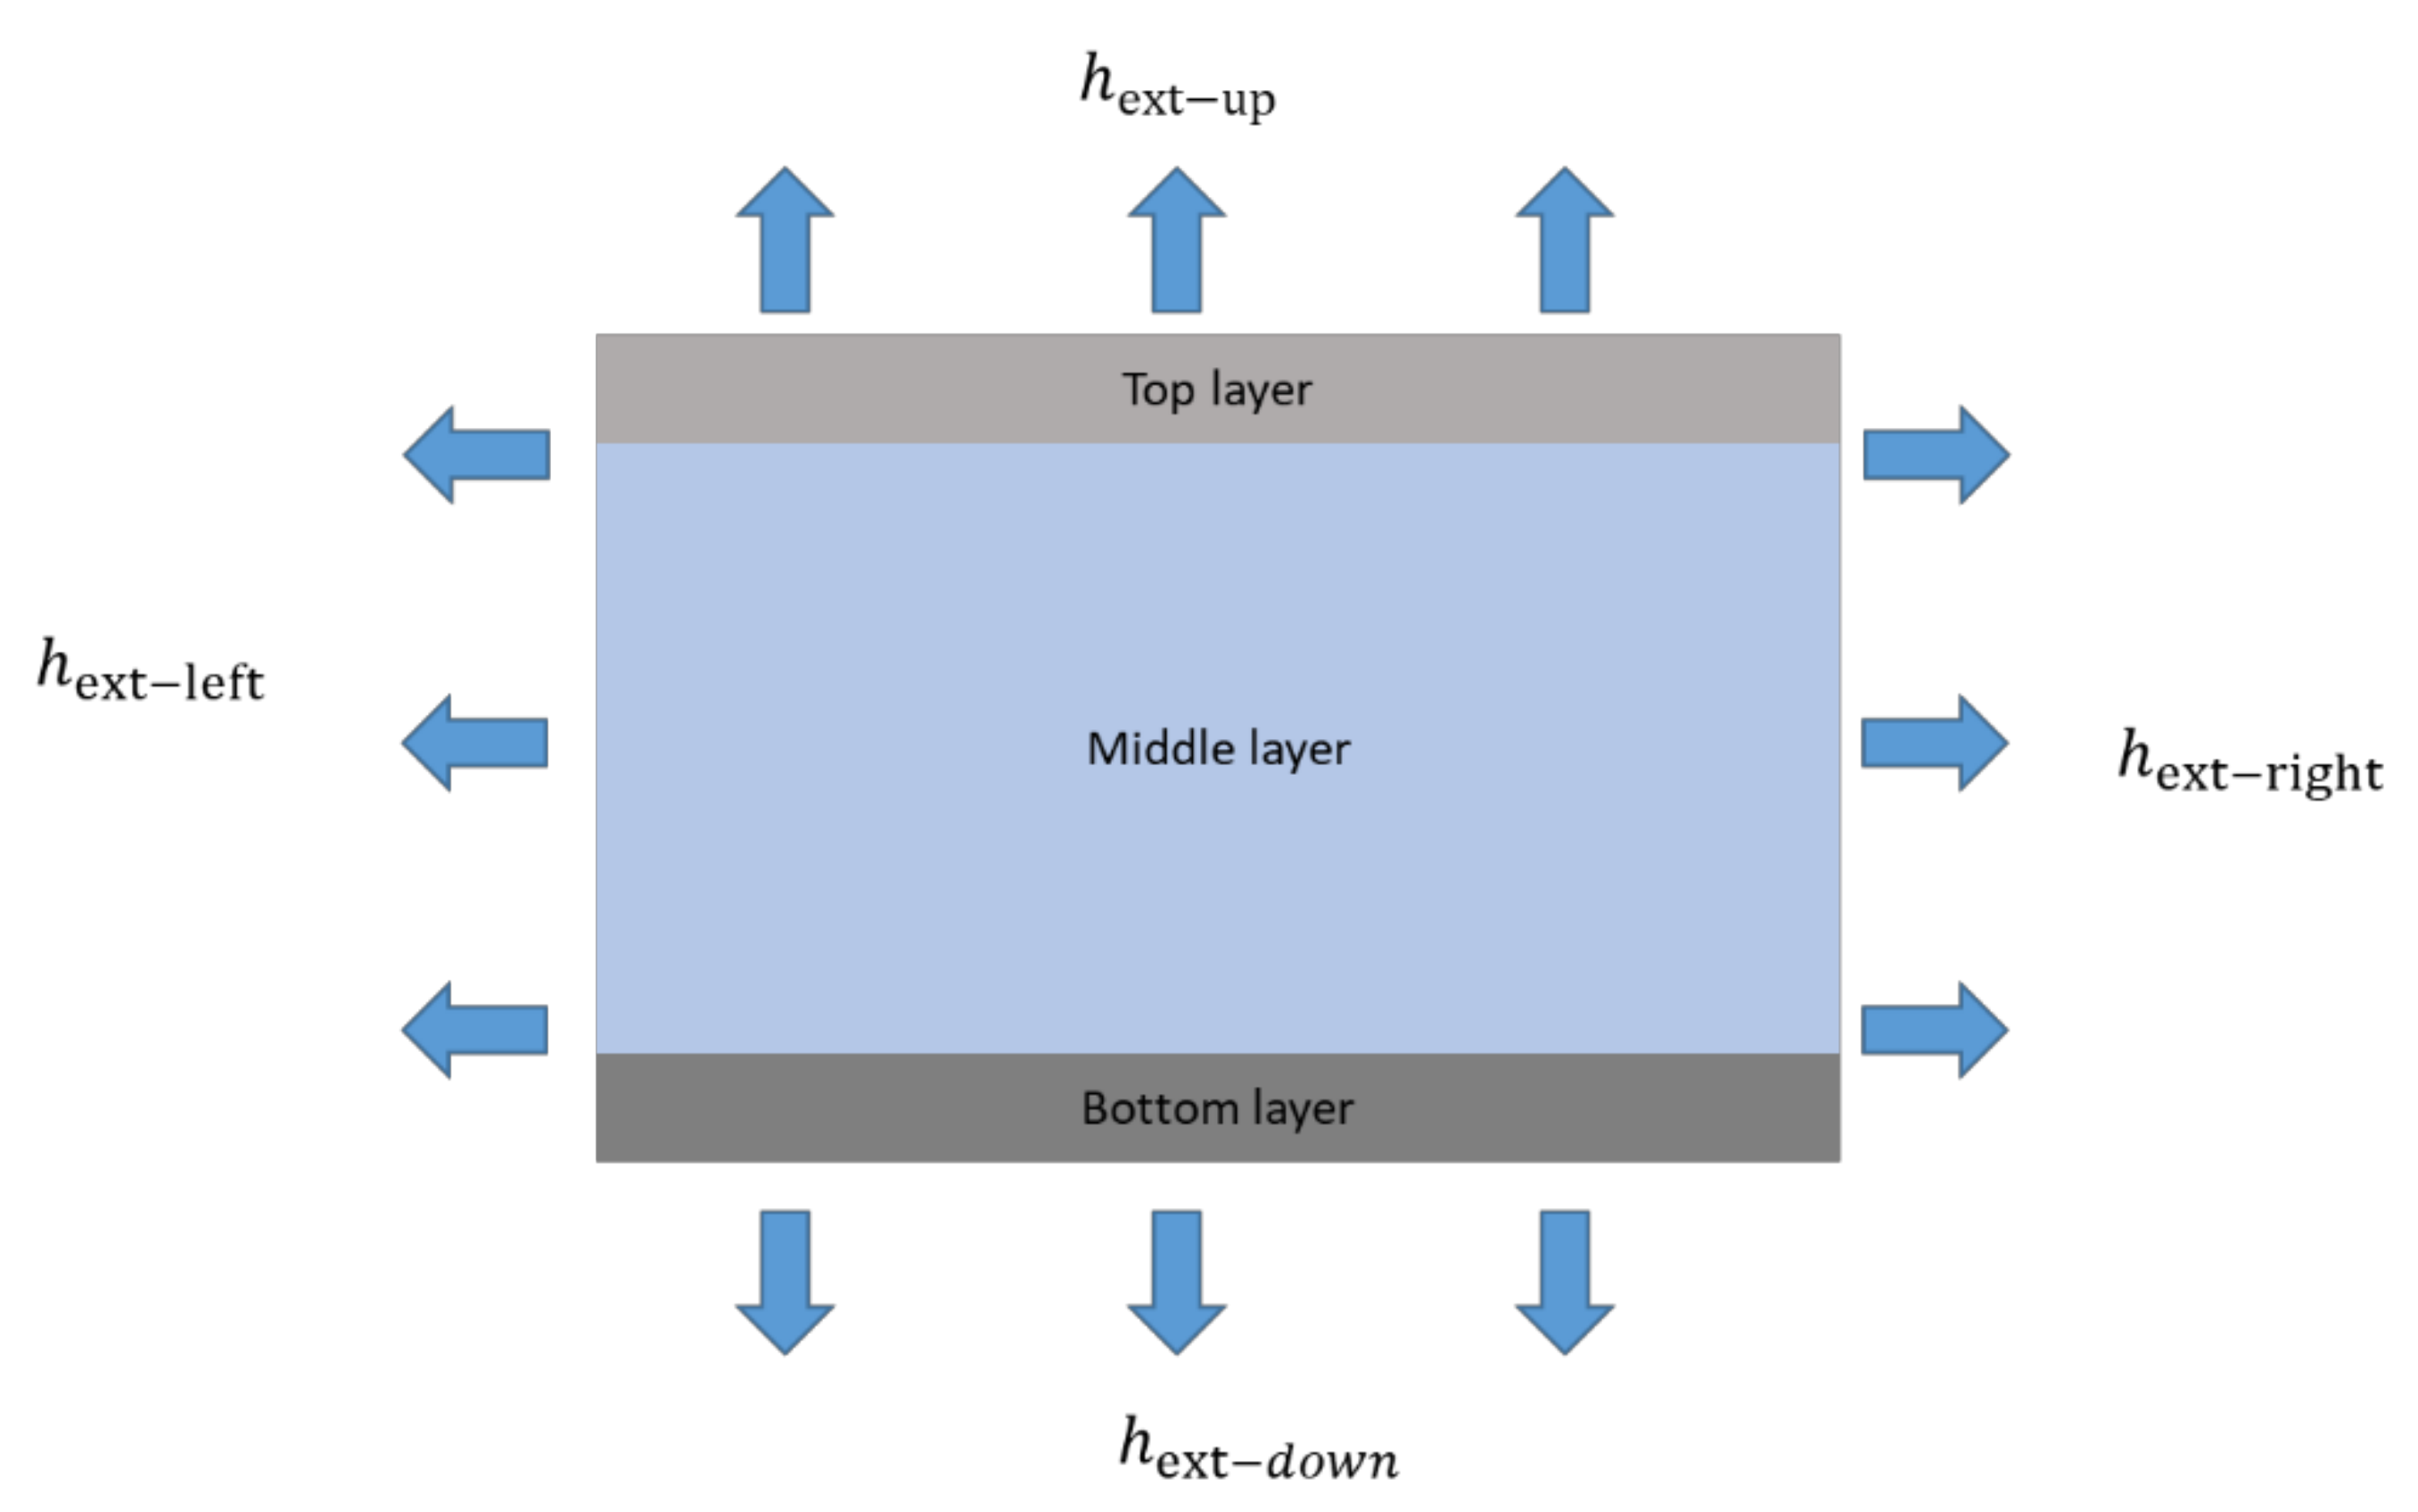
Figure 2.
Pressure-based algorithm.
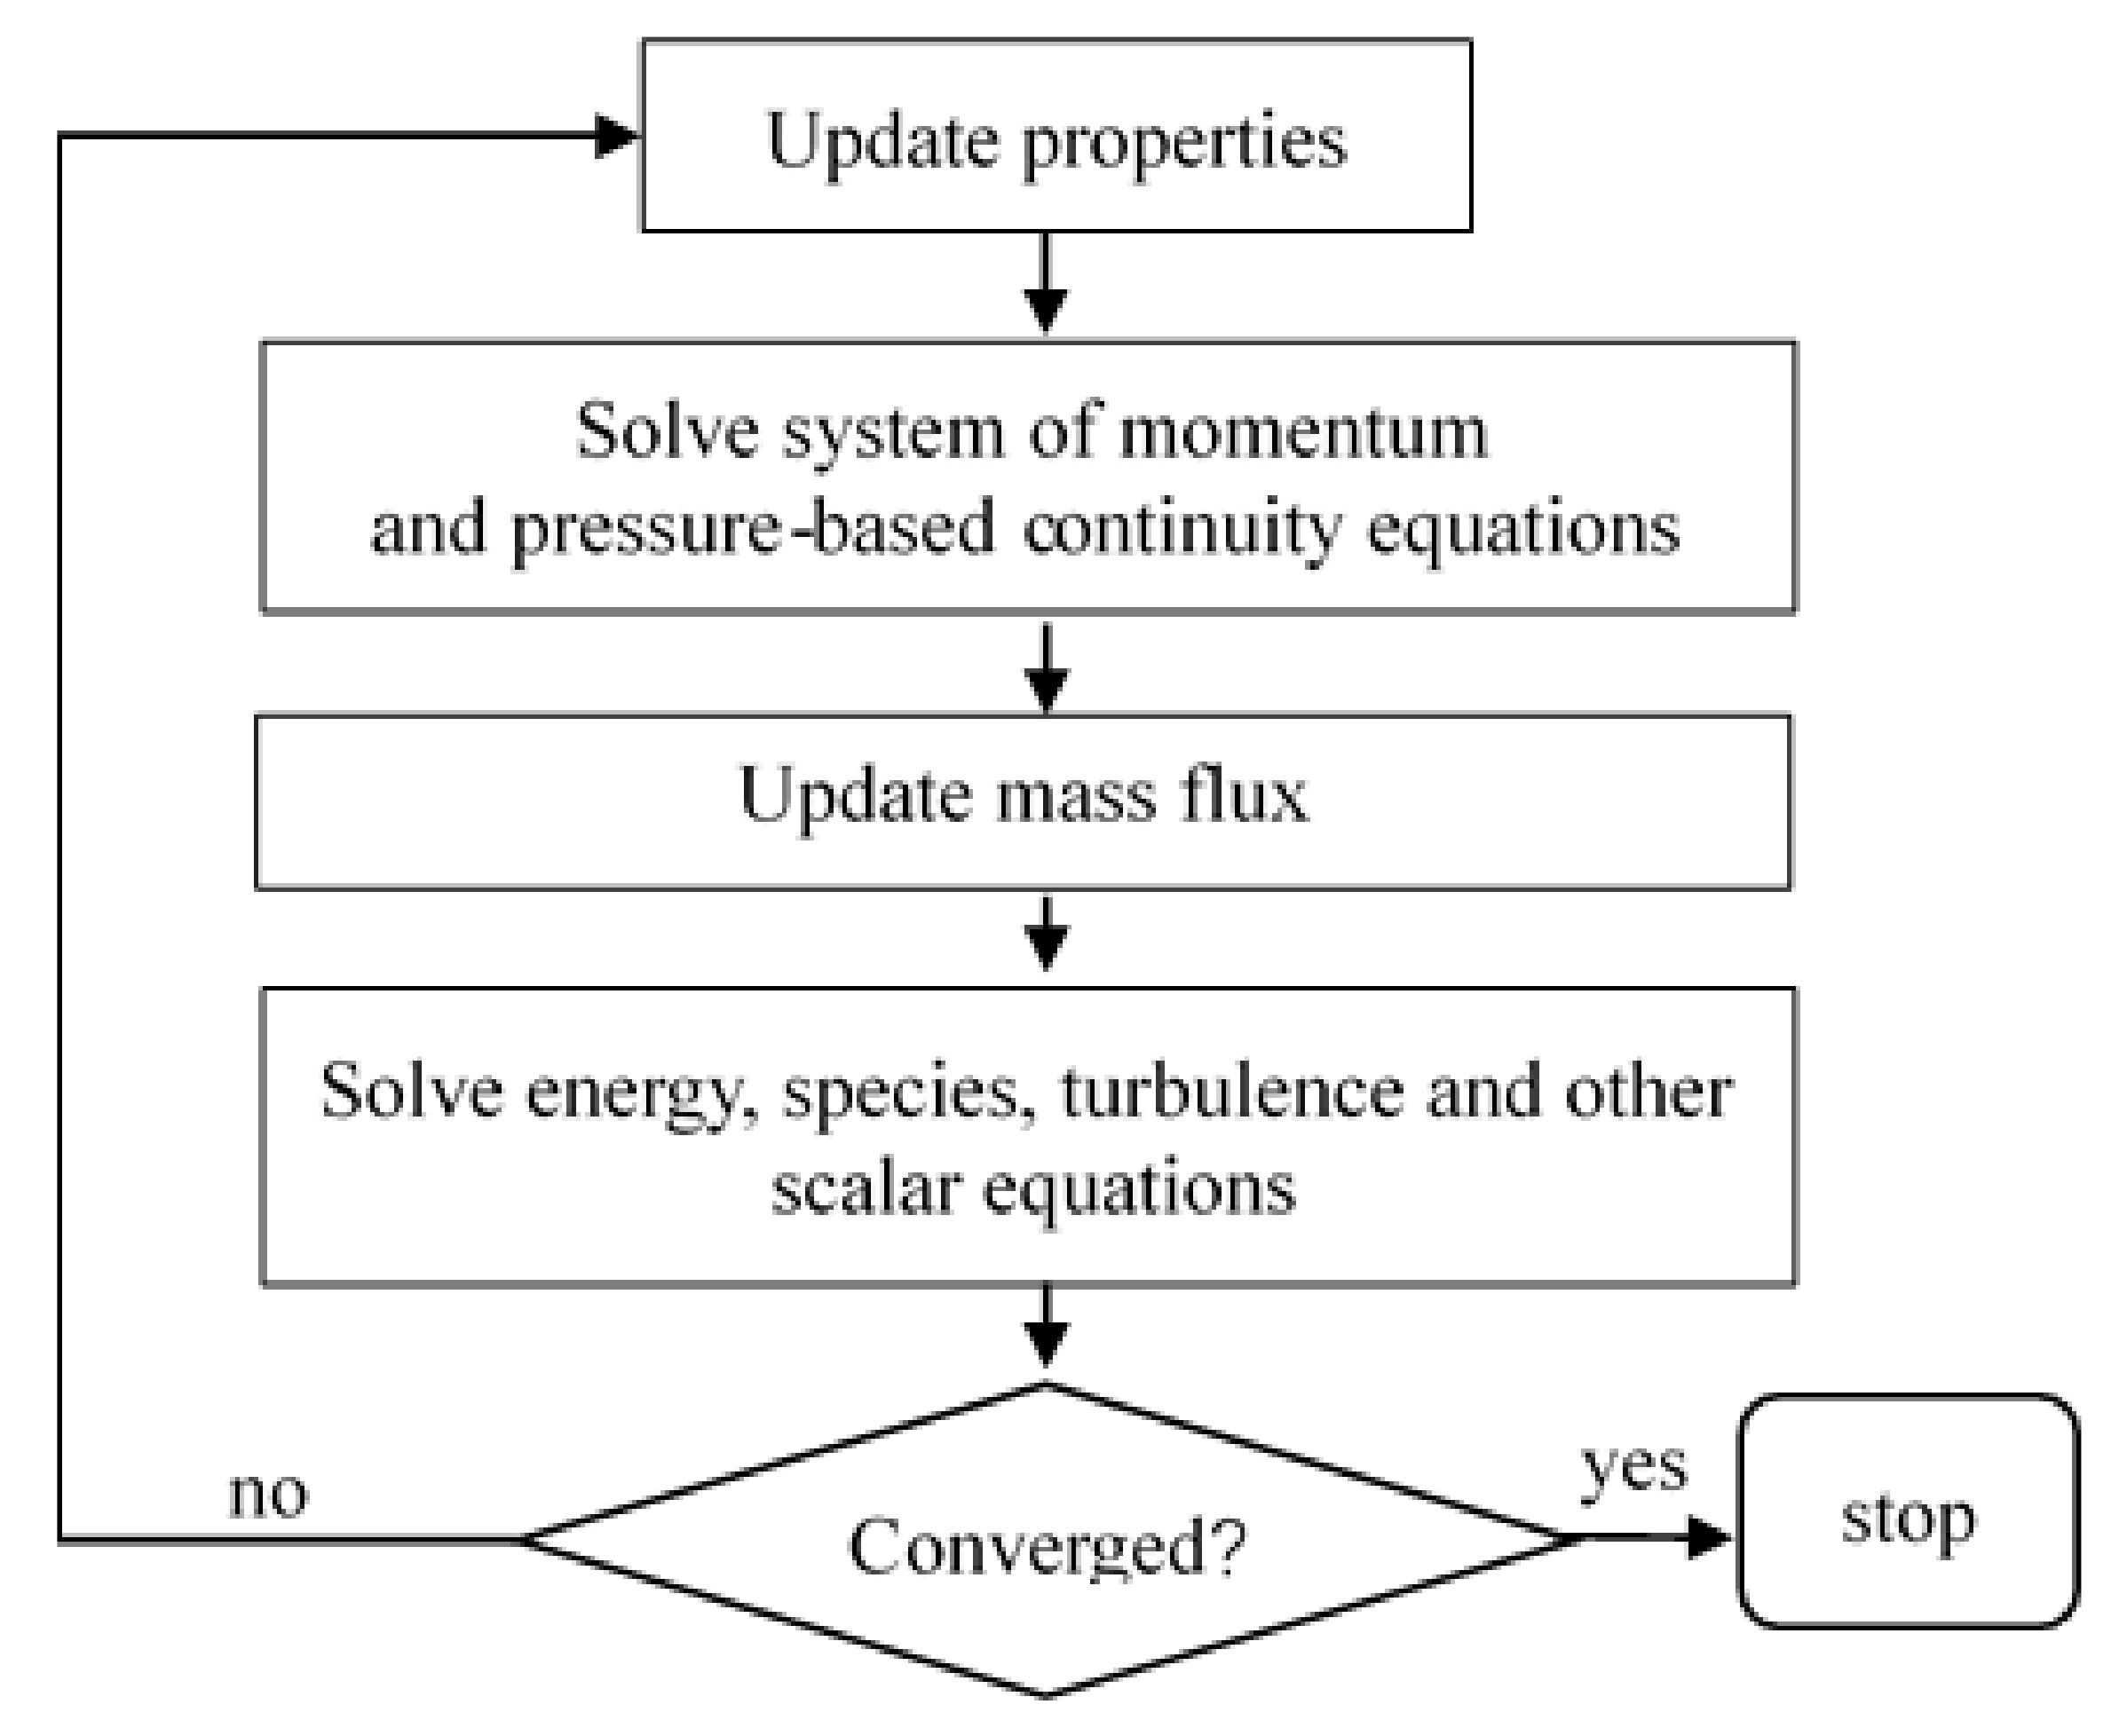
Figure 3.
The pressure-implicit with splitting of operators (PISO) pressure–velocity coupling scheme.
Figure 3.
The pressure-implicit with splitting of operators (PISO) pressure–velocity coupling scheme.
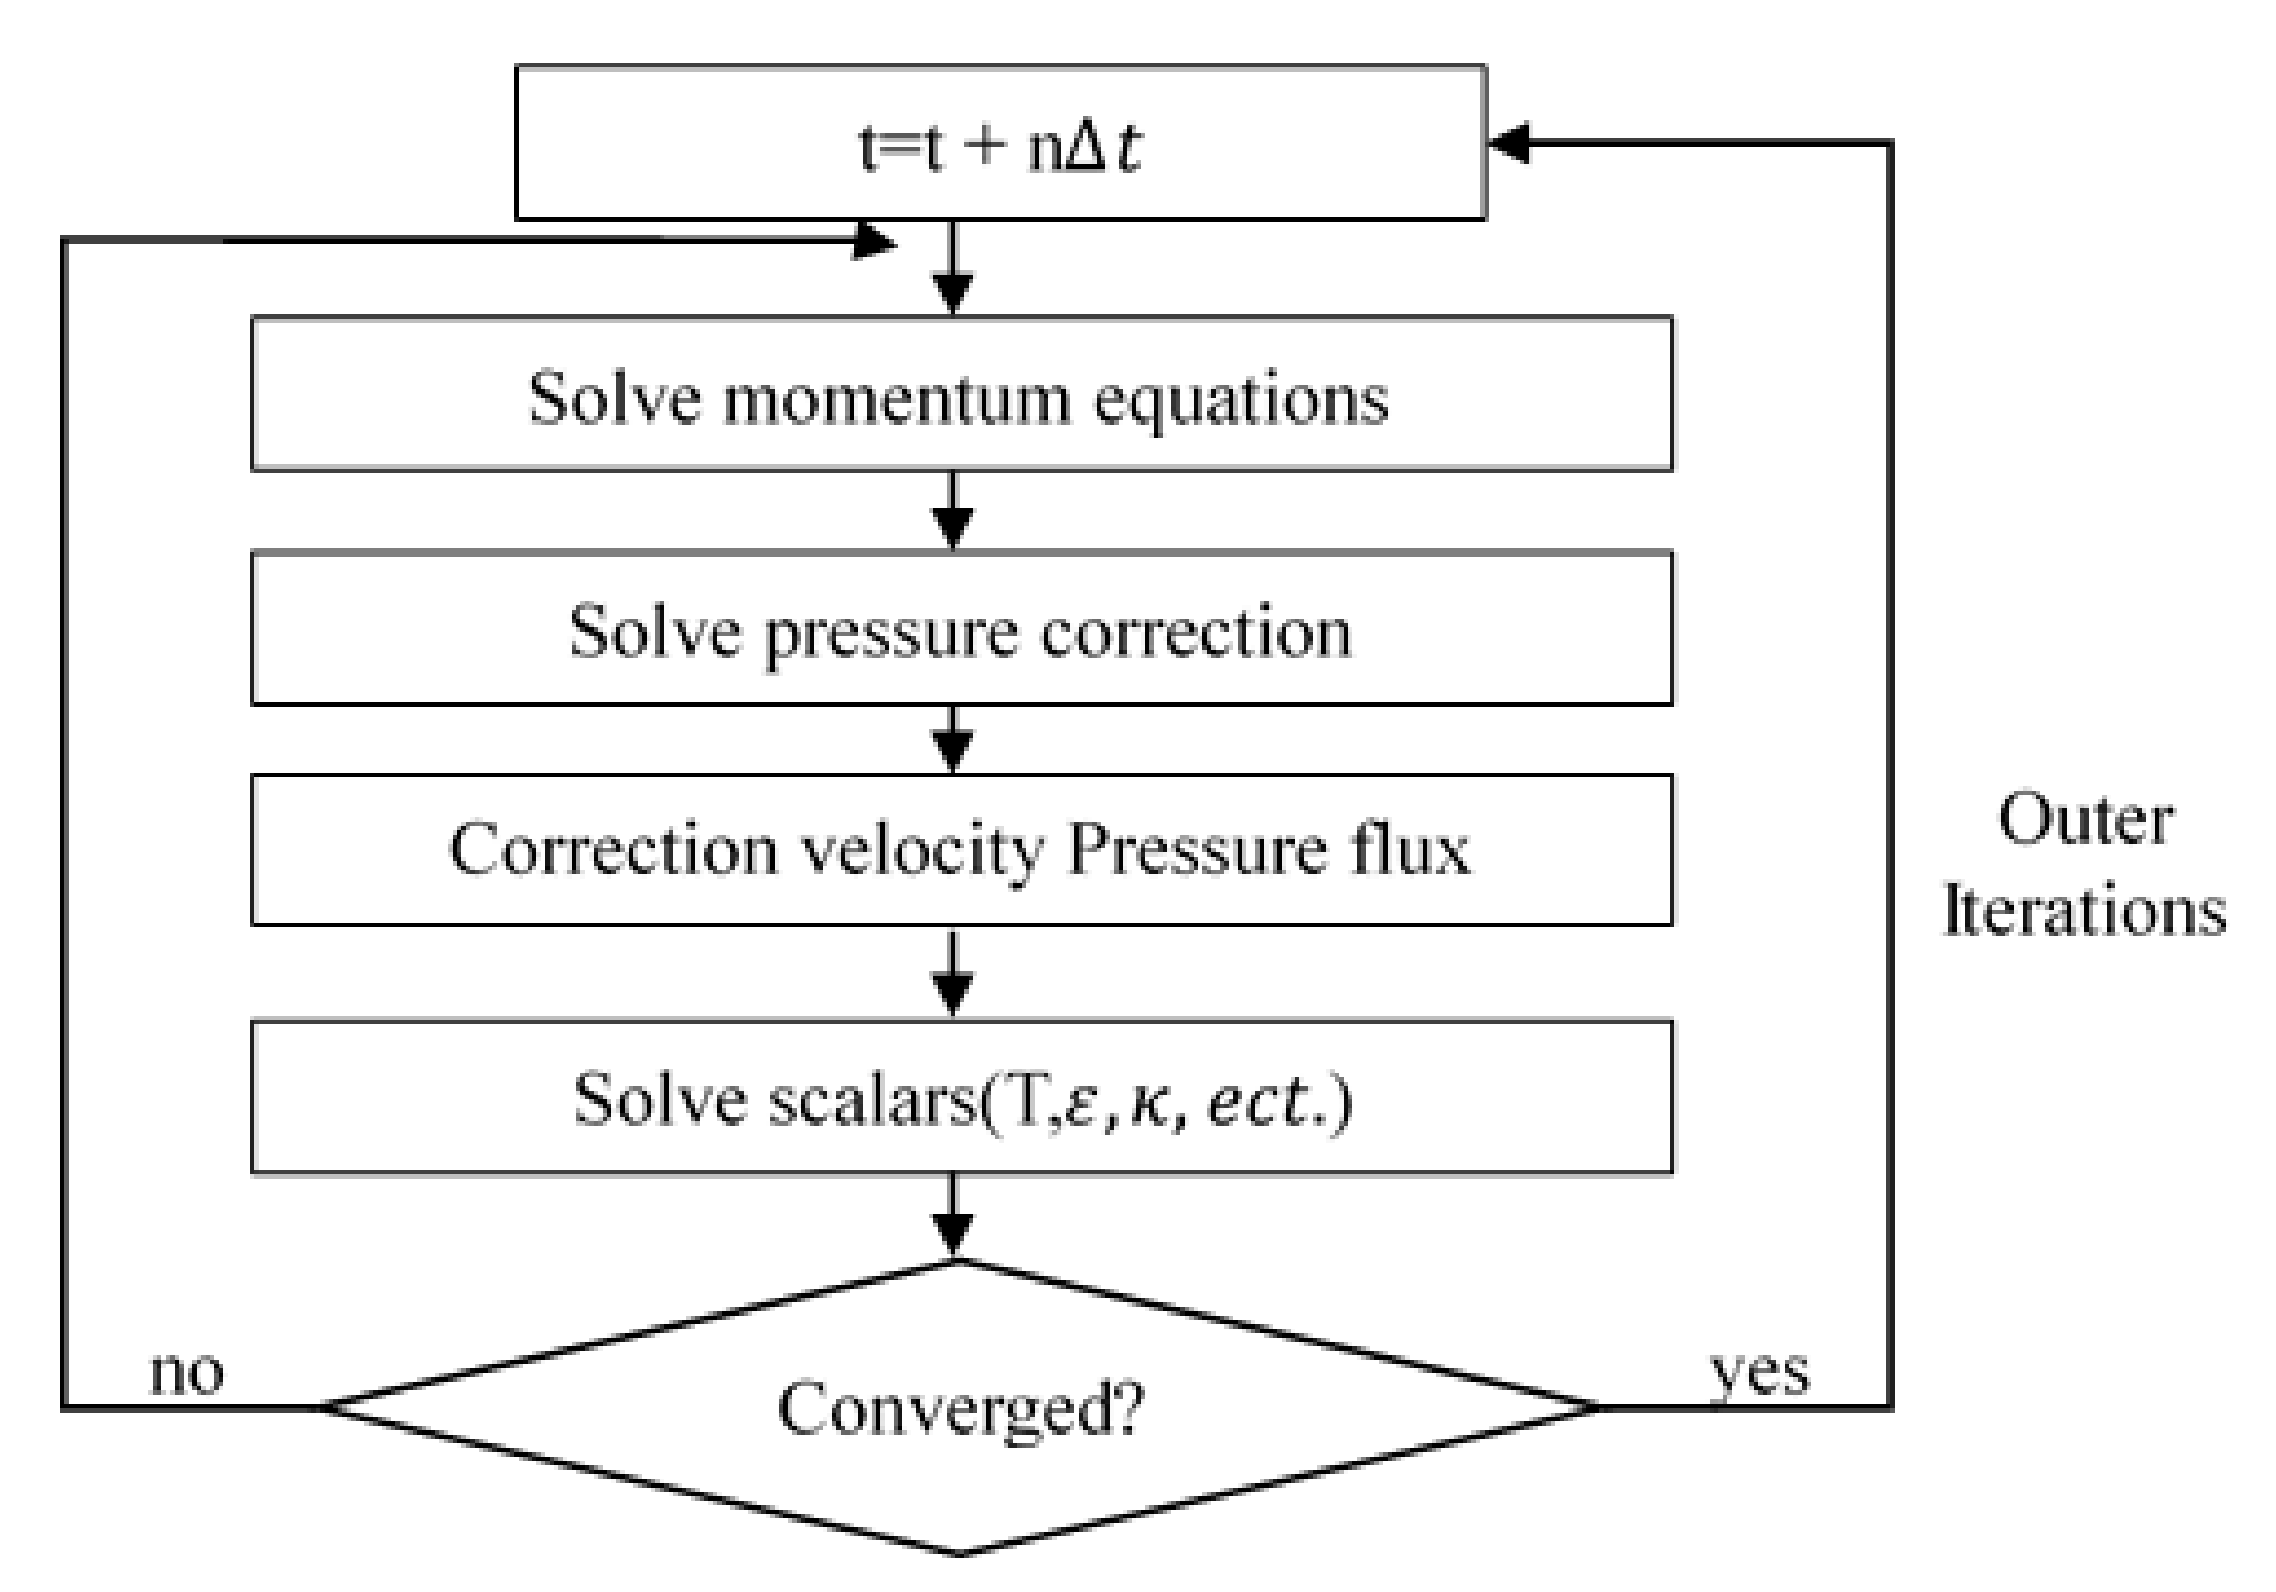
Figure 4.
The structure of a PEMFC stack.
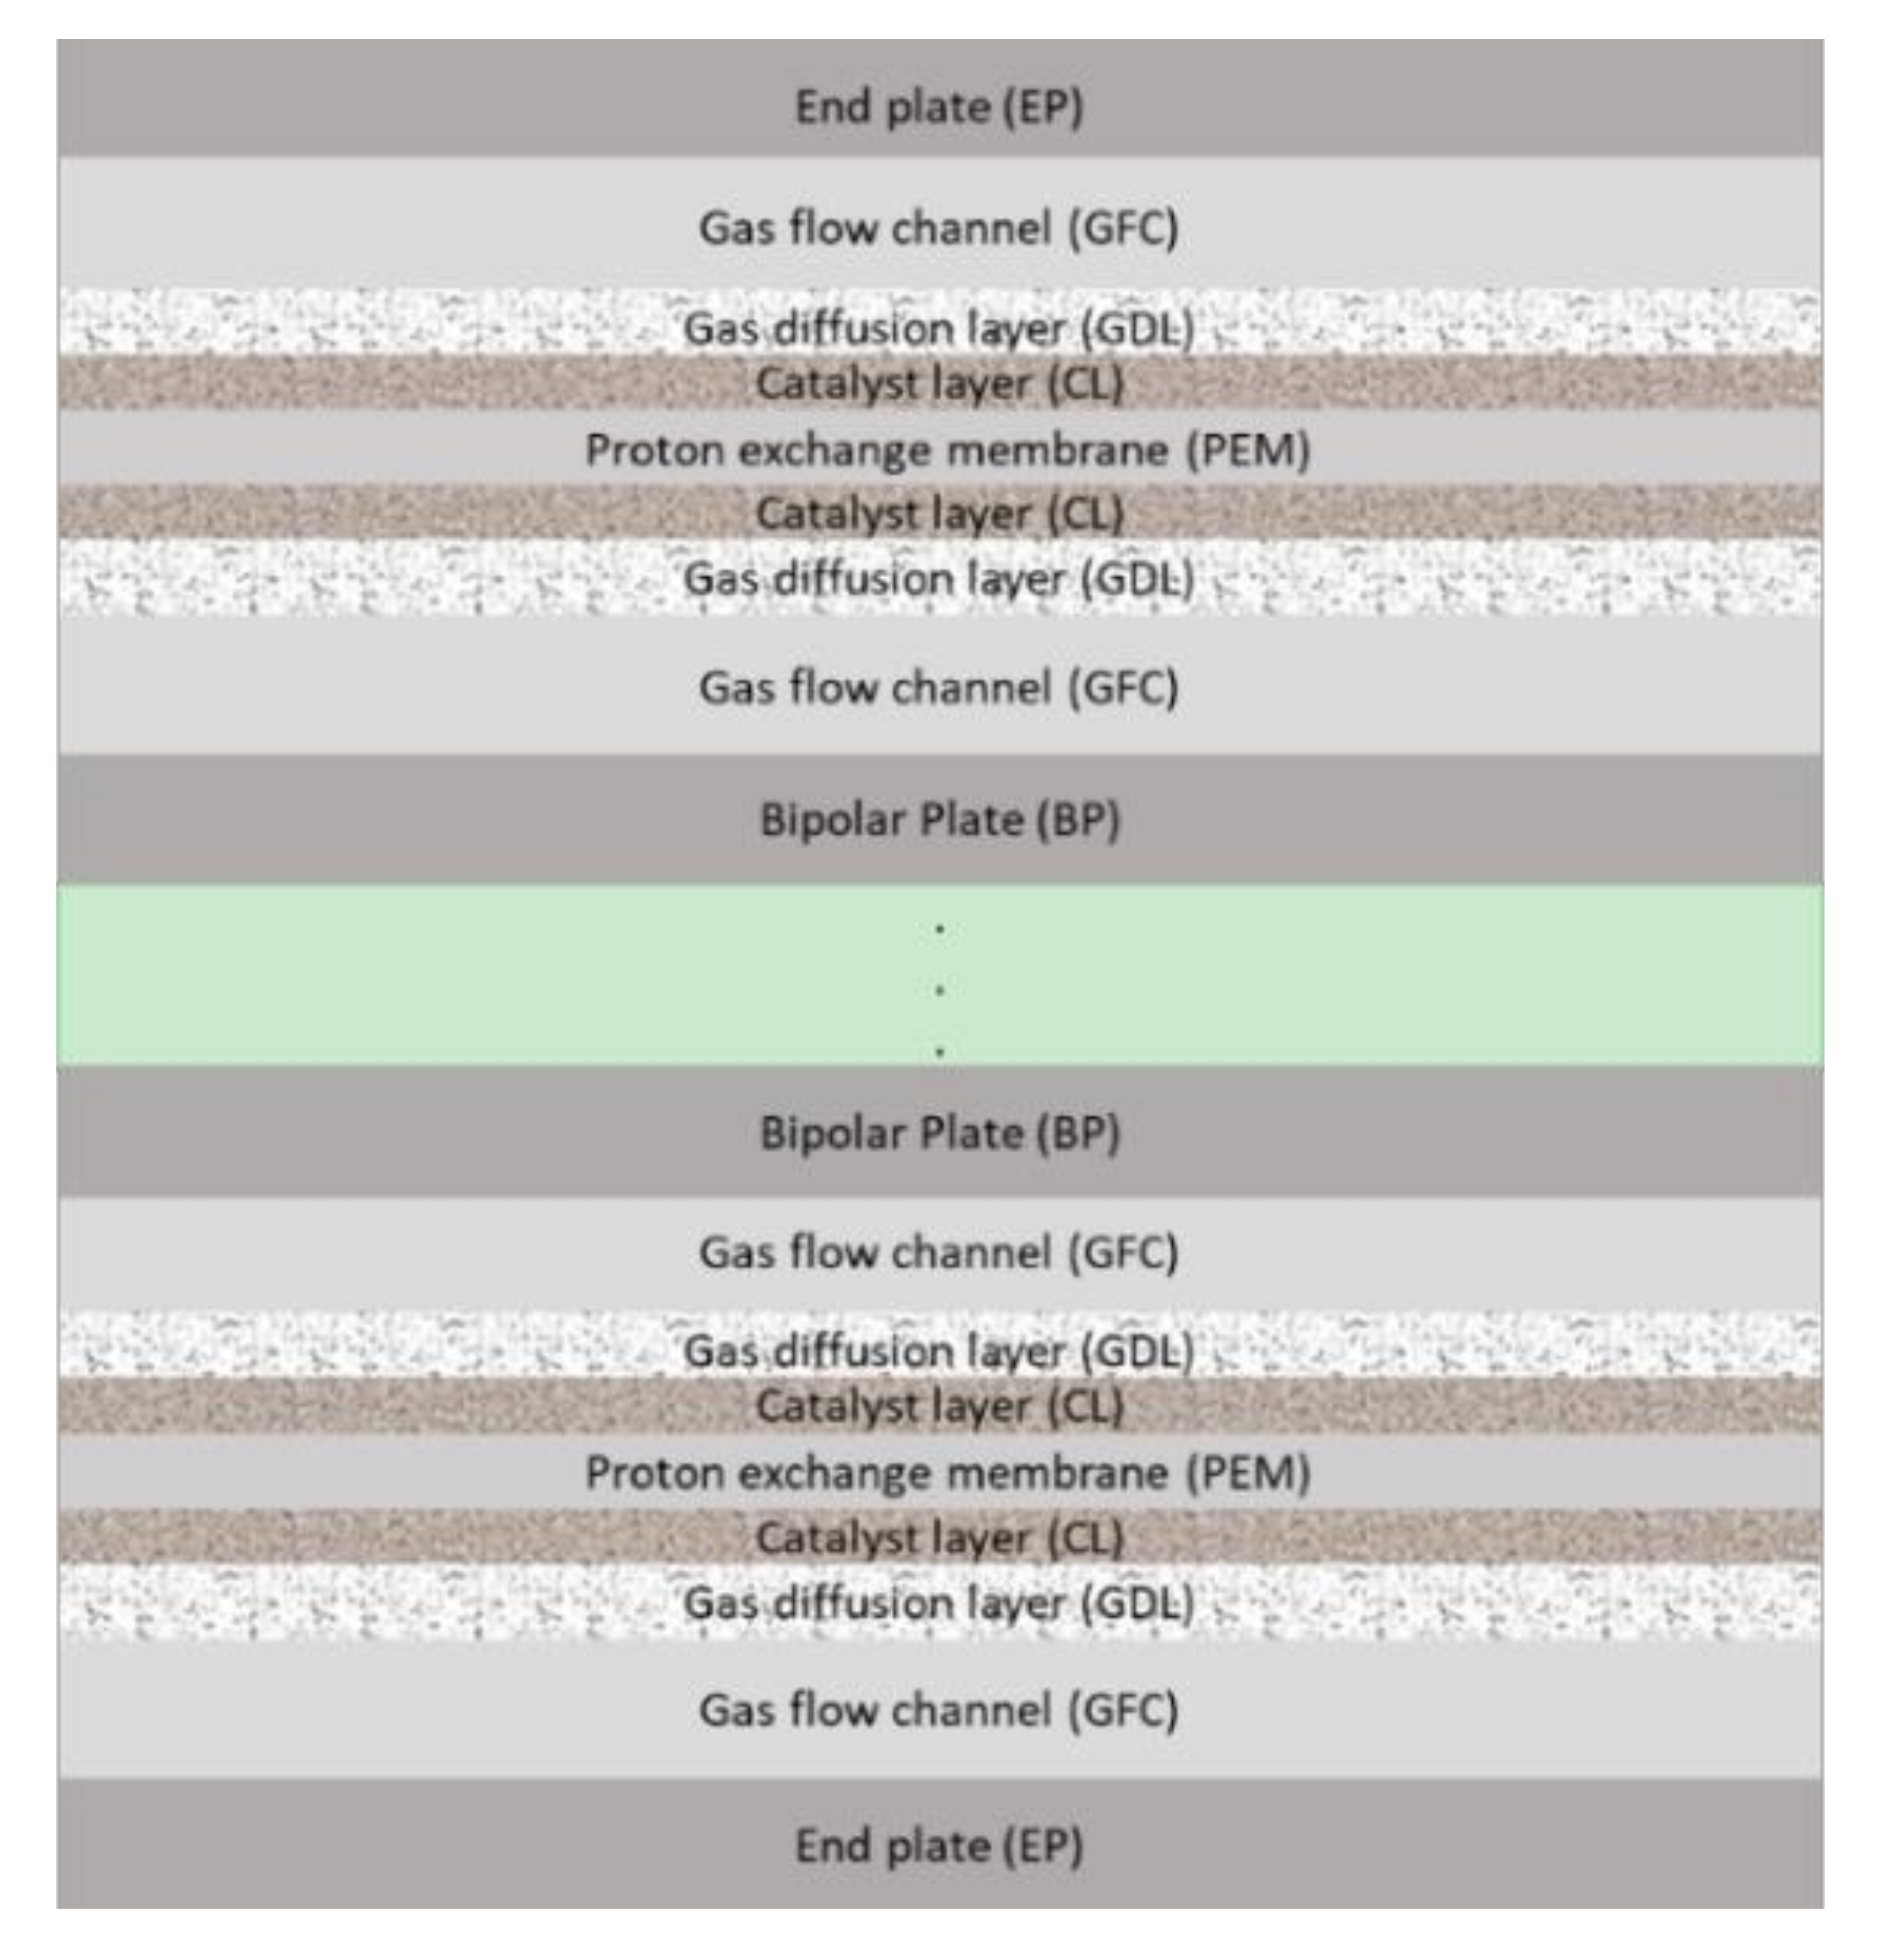
Figure 5.
(a) The meshing points of two single PEMFCs. (b) The meshing points of half of one single PEMFC.
Figure 5.
(a) The meshing points of two single PEMFCs. (b) The meshing points of half of one single PEMFC.
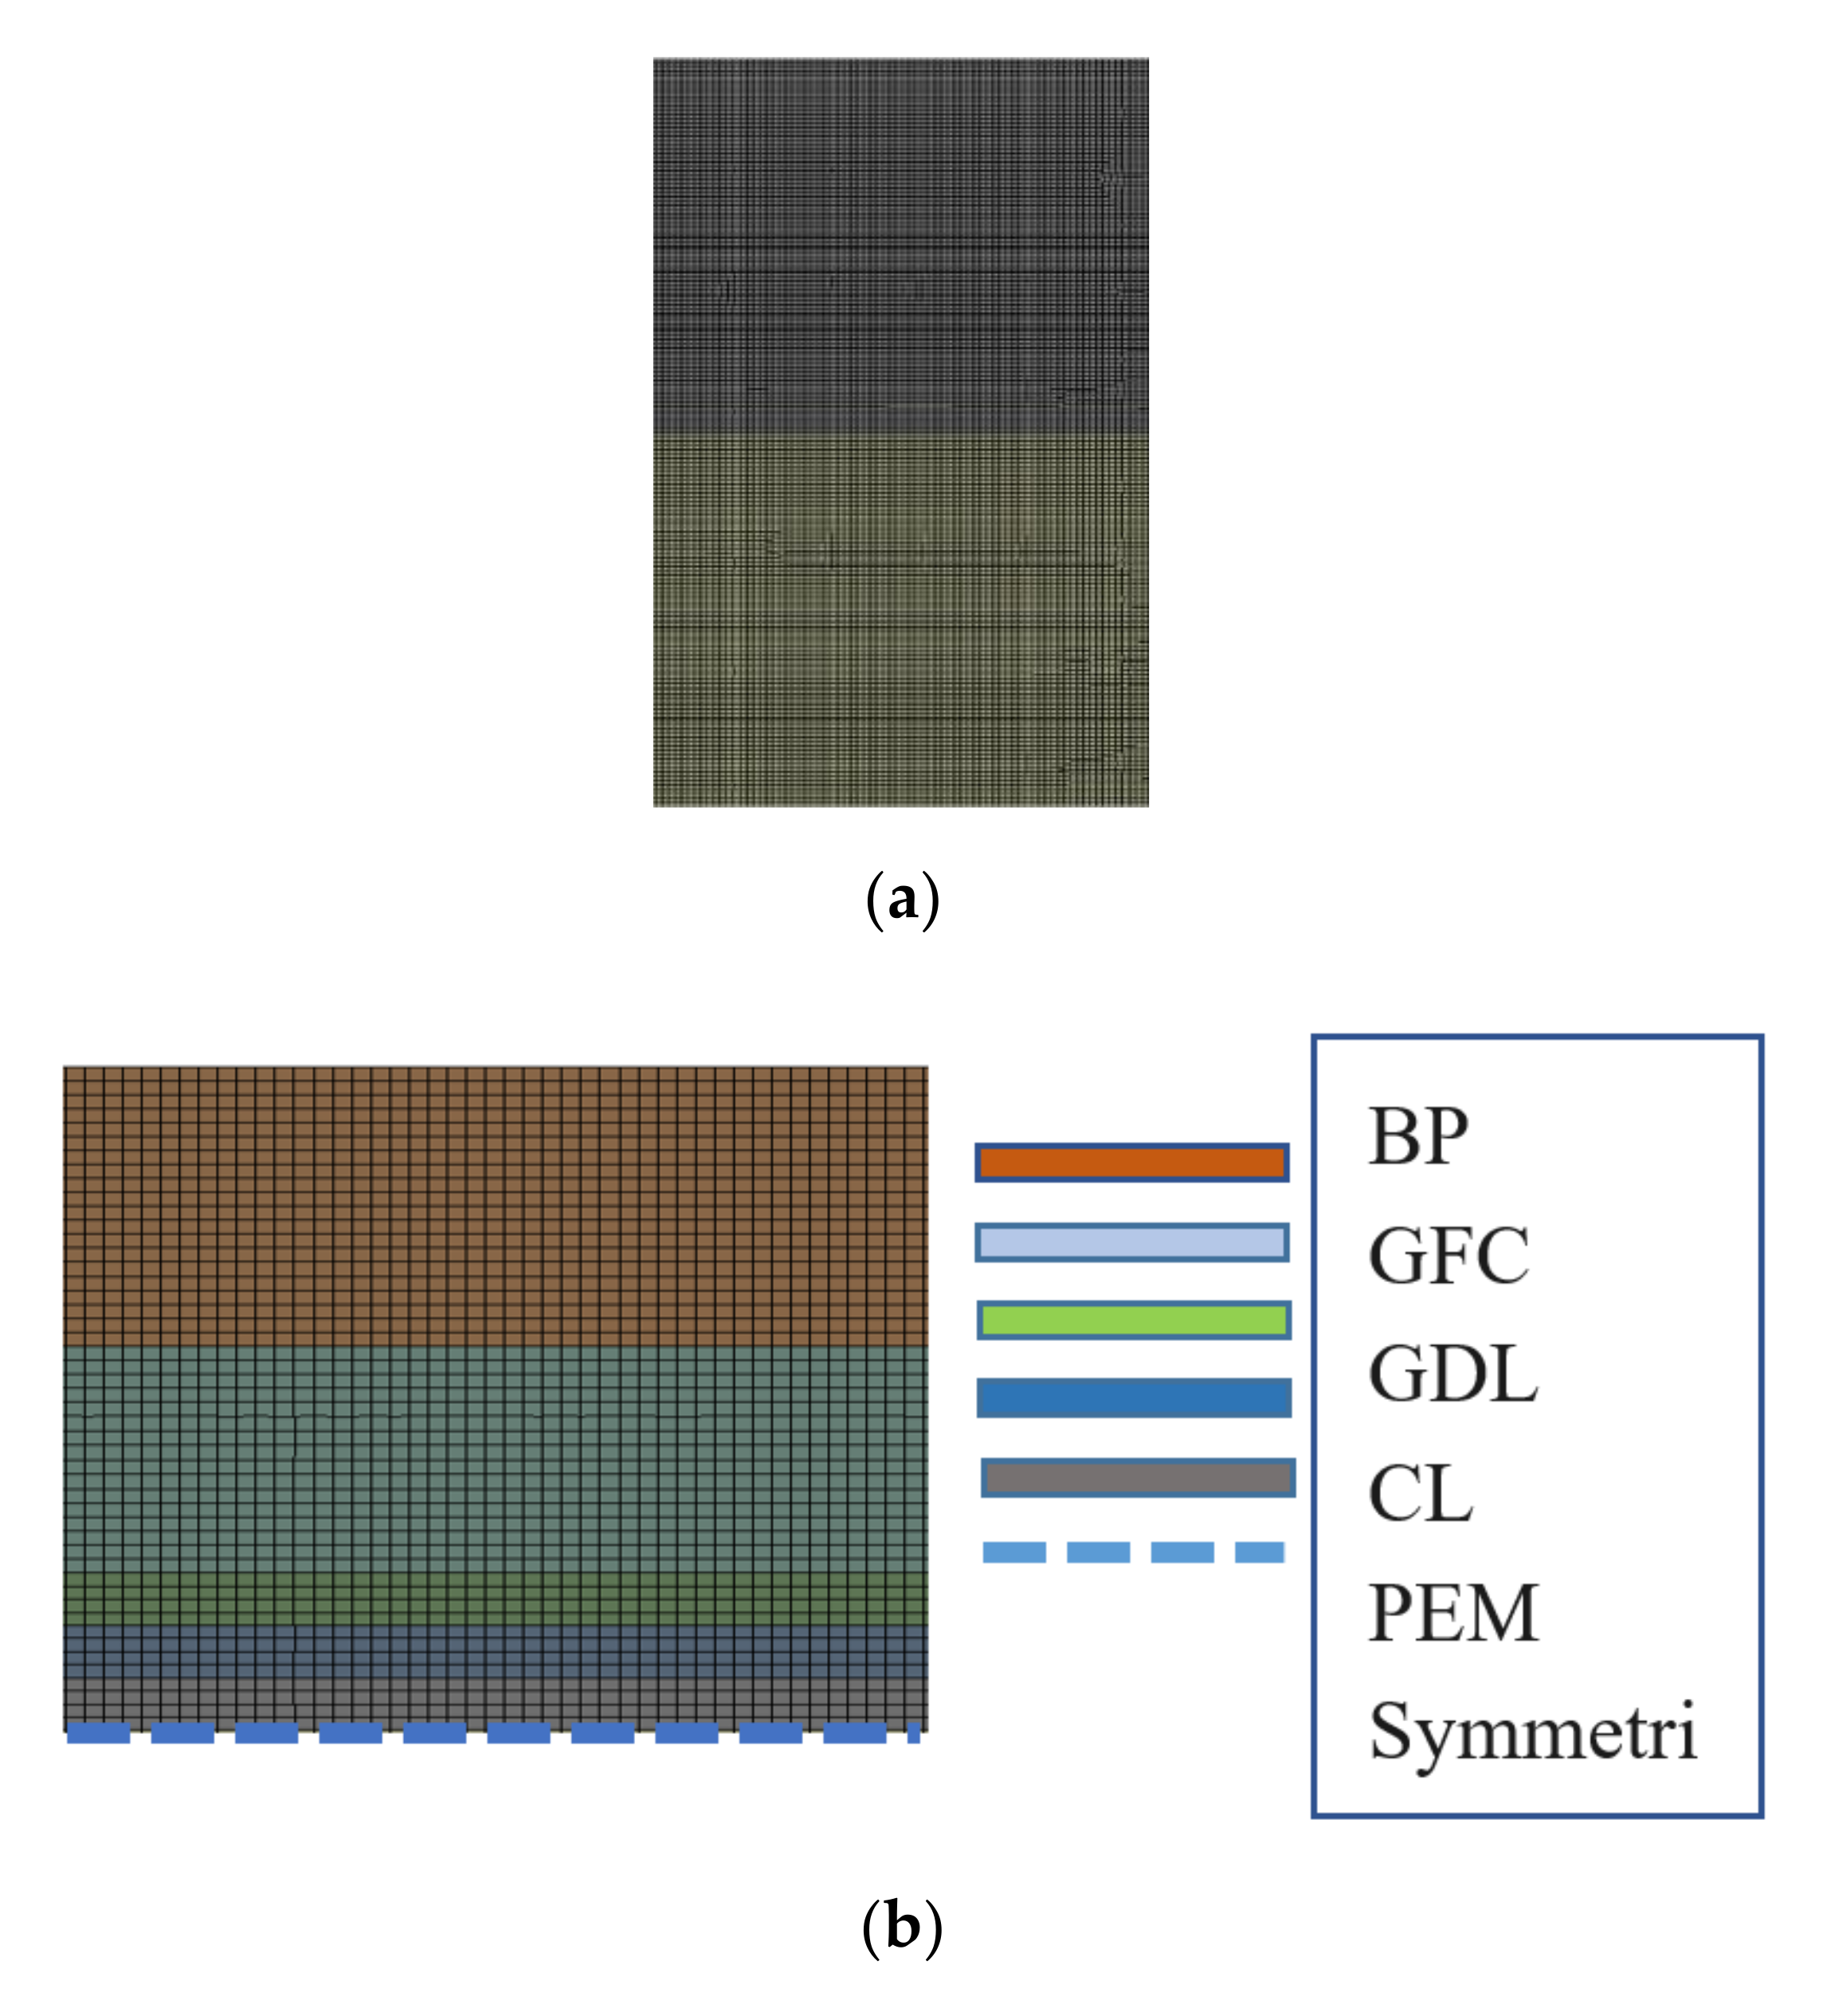
Figure 6.
The average temperature distribution of each layer in the PEMFC stack.
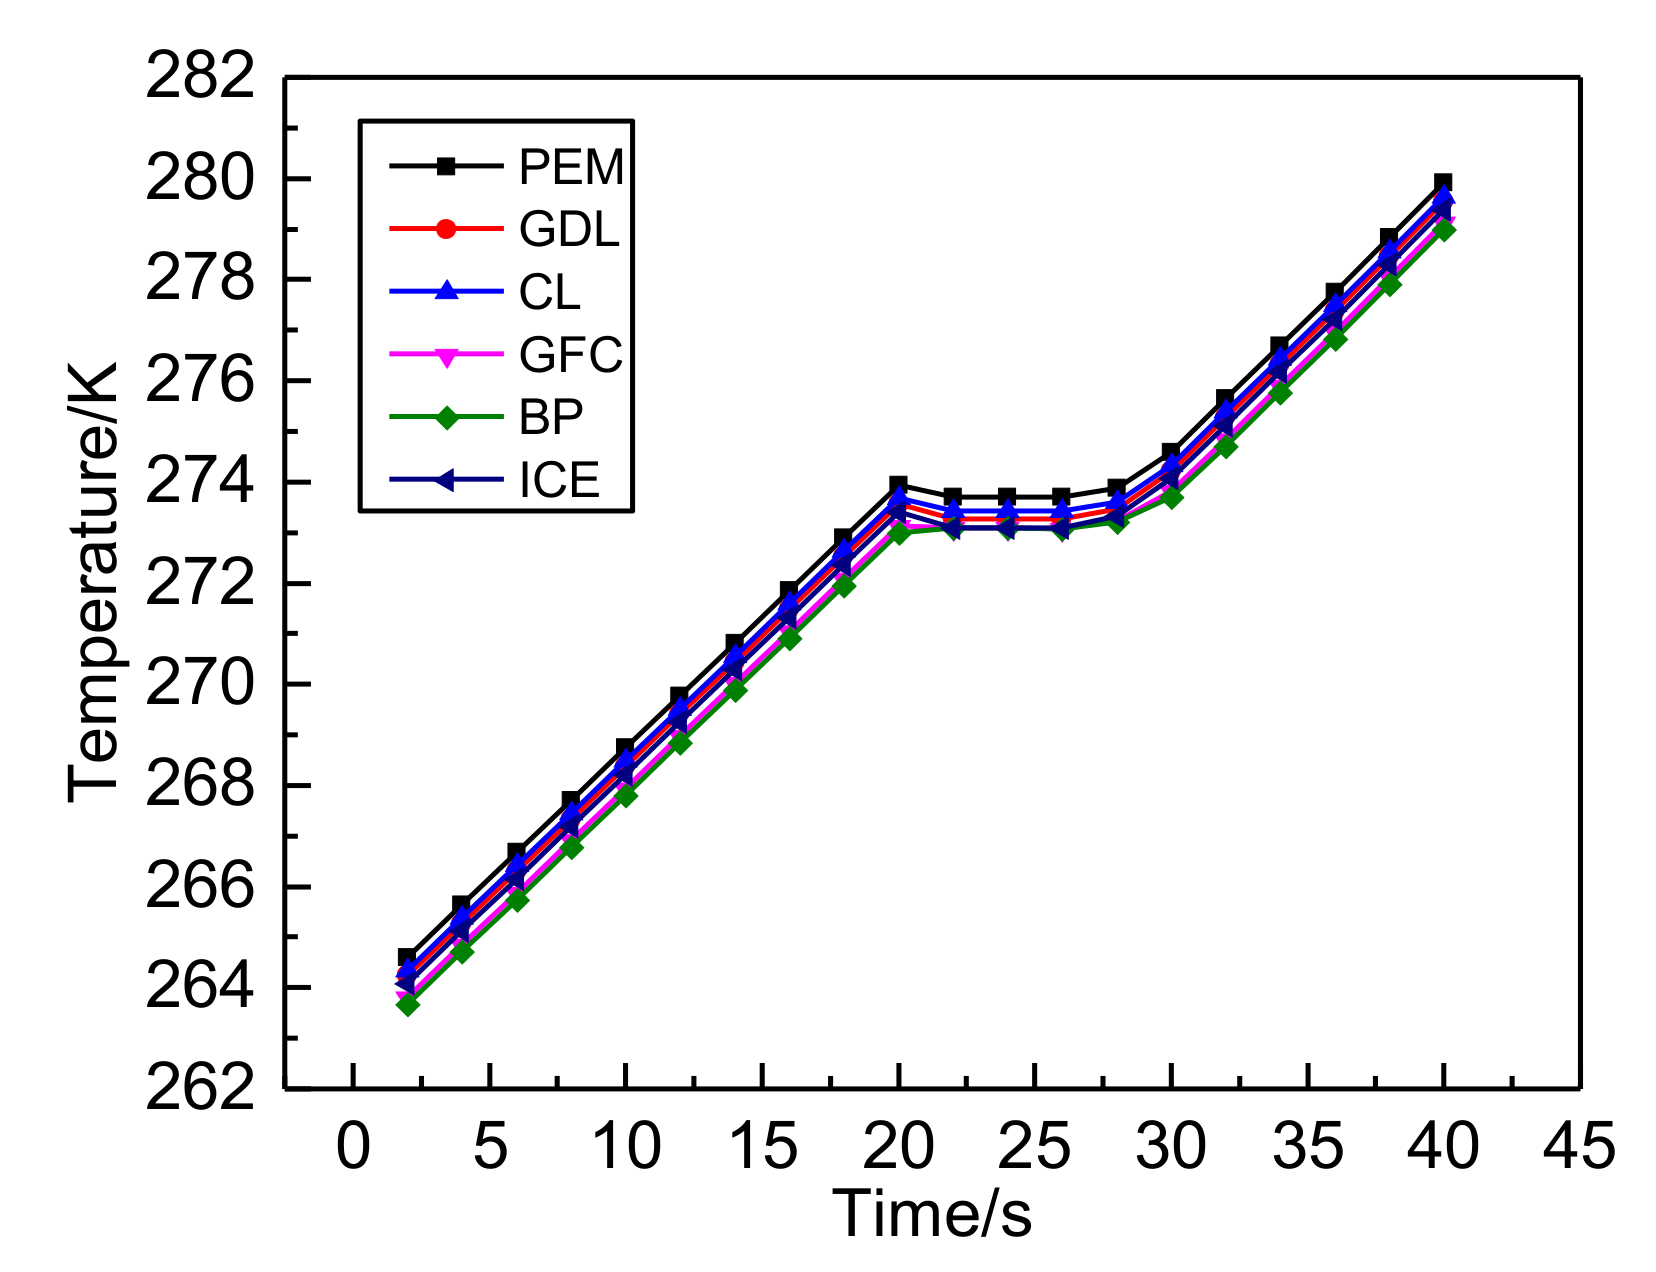
Figure 7.
The liquid fraction distribution of the ICE layer in the PEMFC stack.
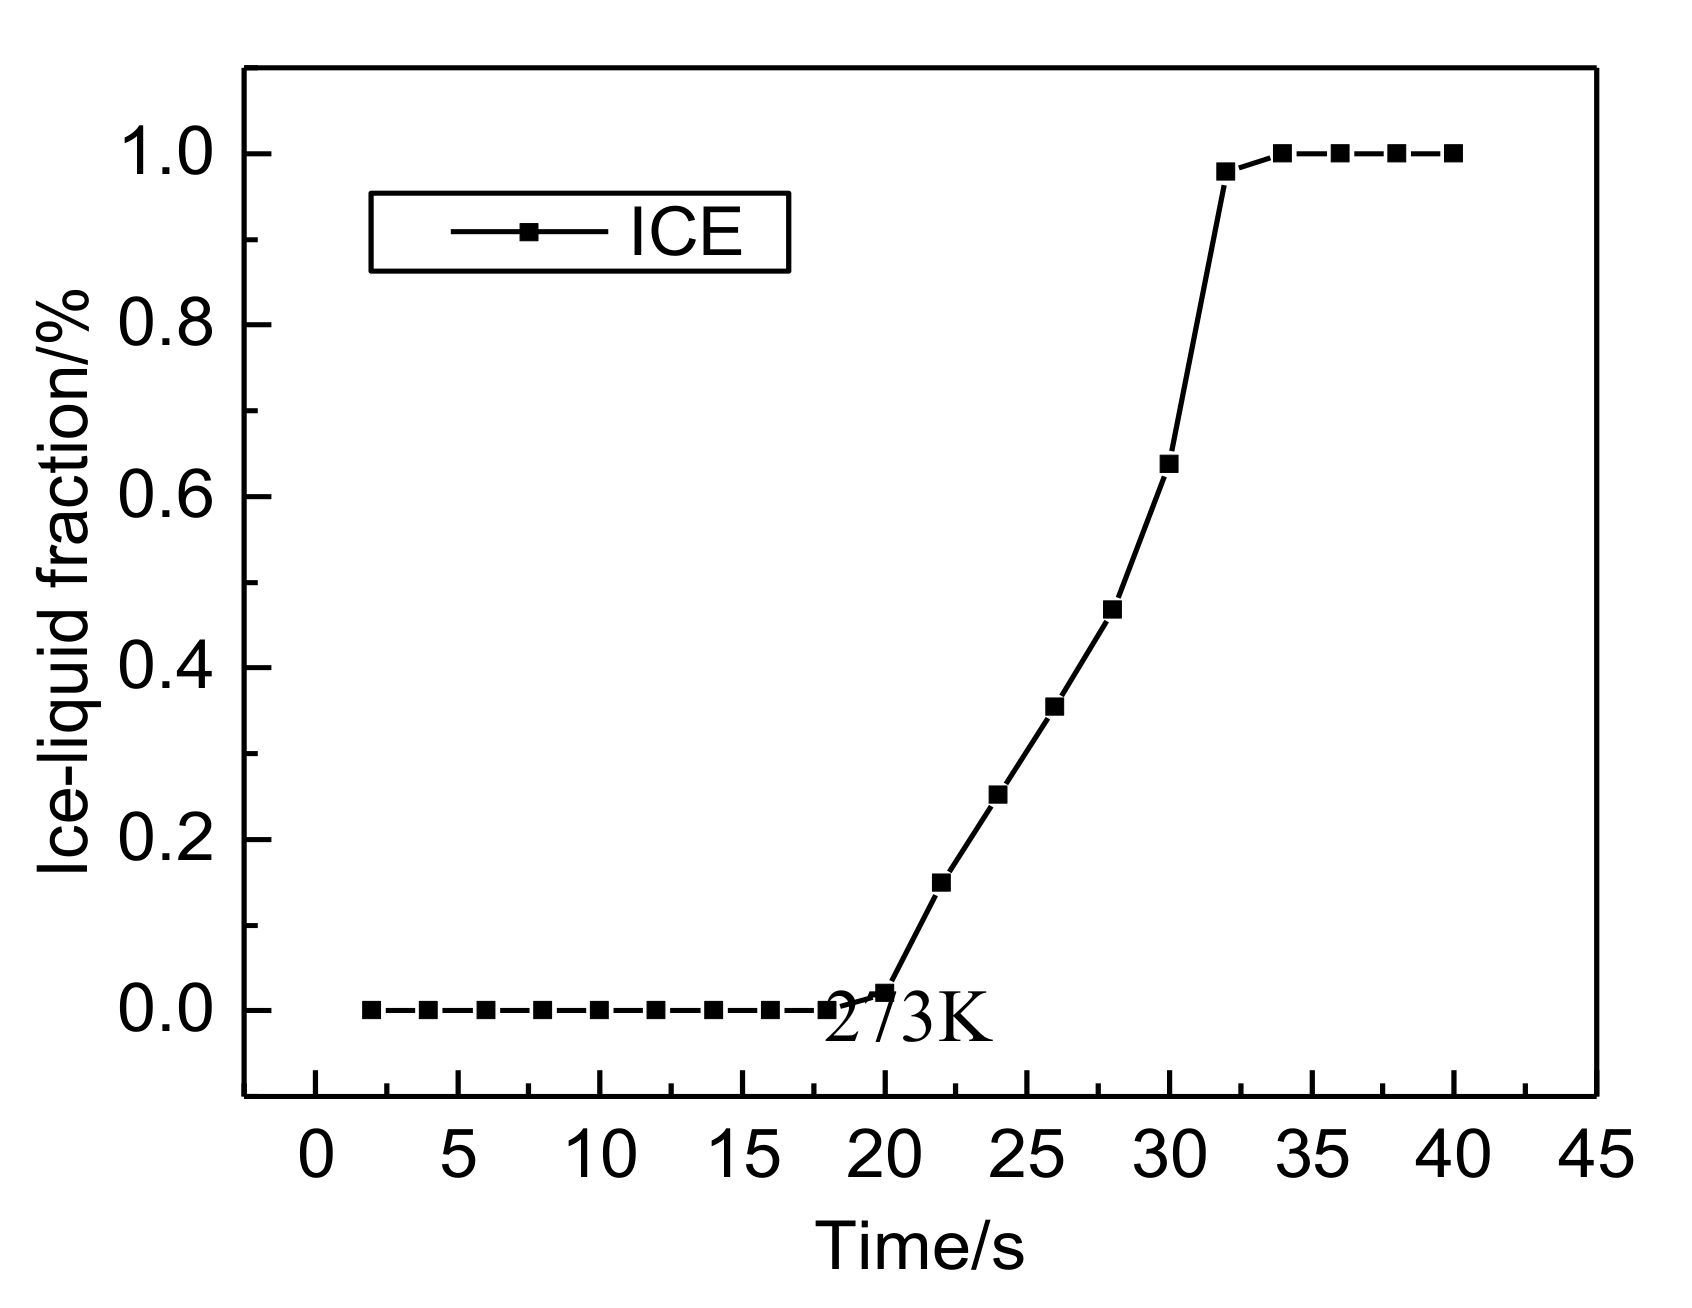
Figure 8.
The temperature distribution in the vertical direction at 16th second.
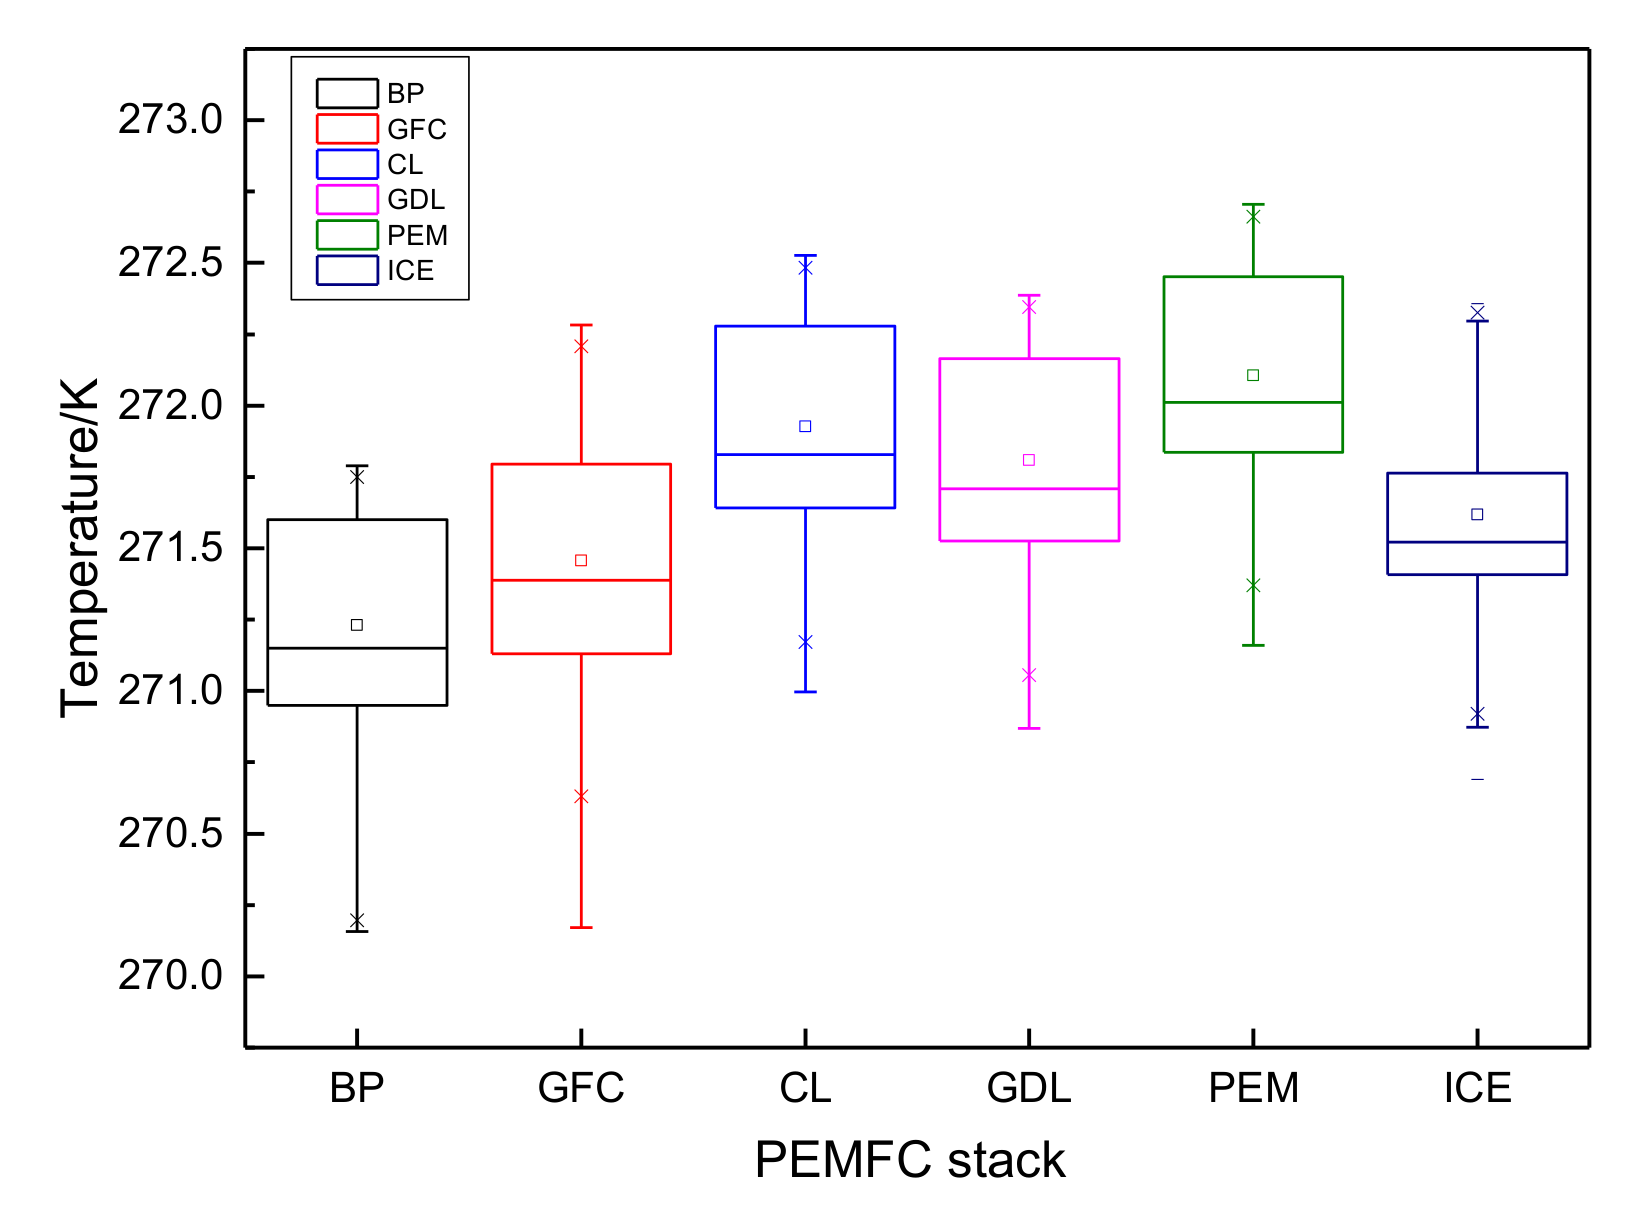
Figure 9.
Temperature contours of the PEMFC stack at different times: (a) t = 24 s, (b) t = 28 s, (c) t = 32 s.
Figure 9.
Temperature contours of the PEMFC stack at different times: (a) t = 24 s, (b) t = 28 s, (c) t = 32 s.

Figure 10.
Temperature contours of the PEM at different times; (a) t = 24 s, (b) t = 28 s, (c) t = 32 s.
Figure 10.
Temperature contours of the PEM at different times; (a) t = 24 s, (b) t = 28 s, (c) t = 32 s.
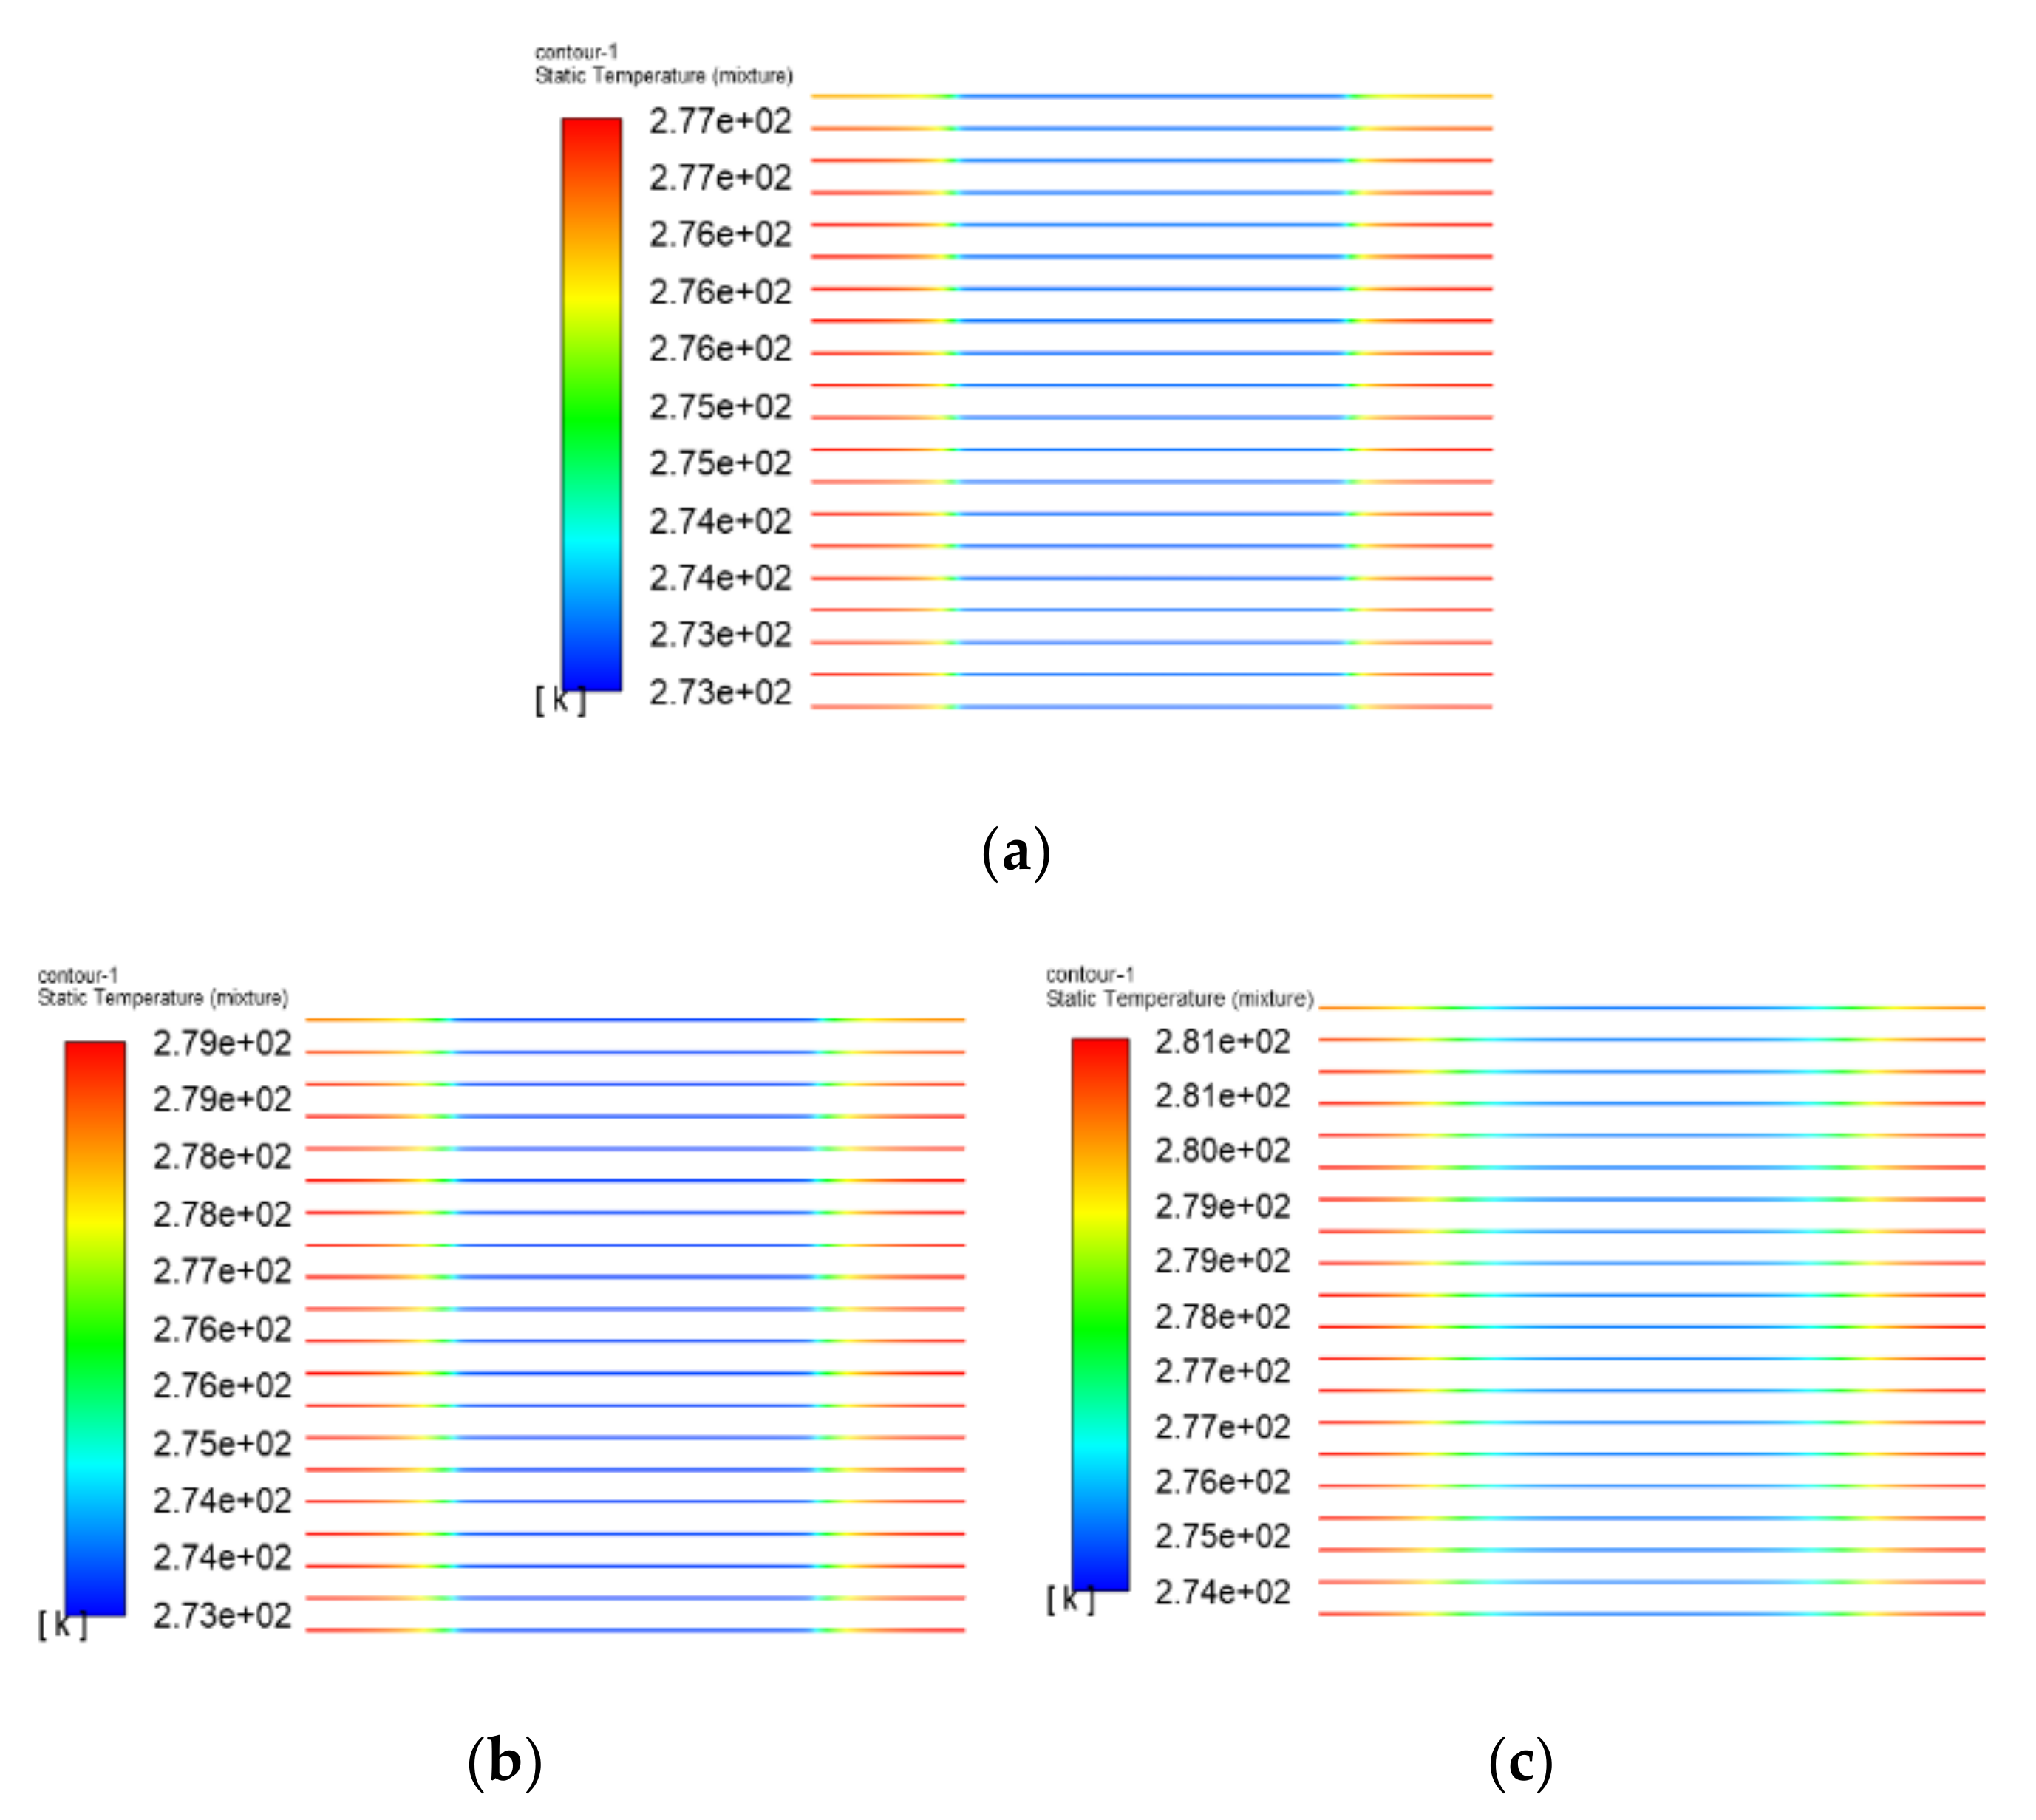
Figure 11.
Liquid fraction contours of the PEMFC stack at different times; (a) t = 24 s, (b) t = 28 s, (c) t = 32 s.
Figure 11.
Liquid fraction contours of the PEMFC stack at different times; (a) t = 24 s, (b) t = 28 s, (c) t = 32 s.
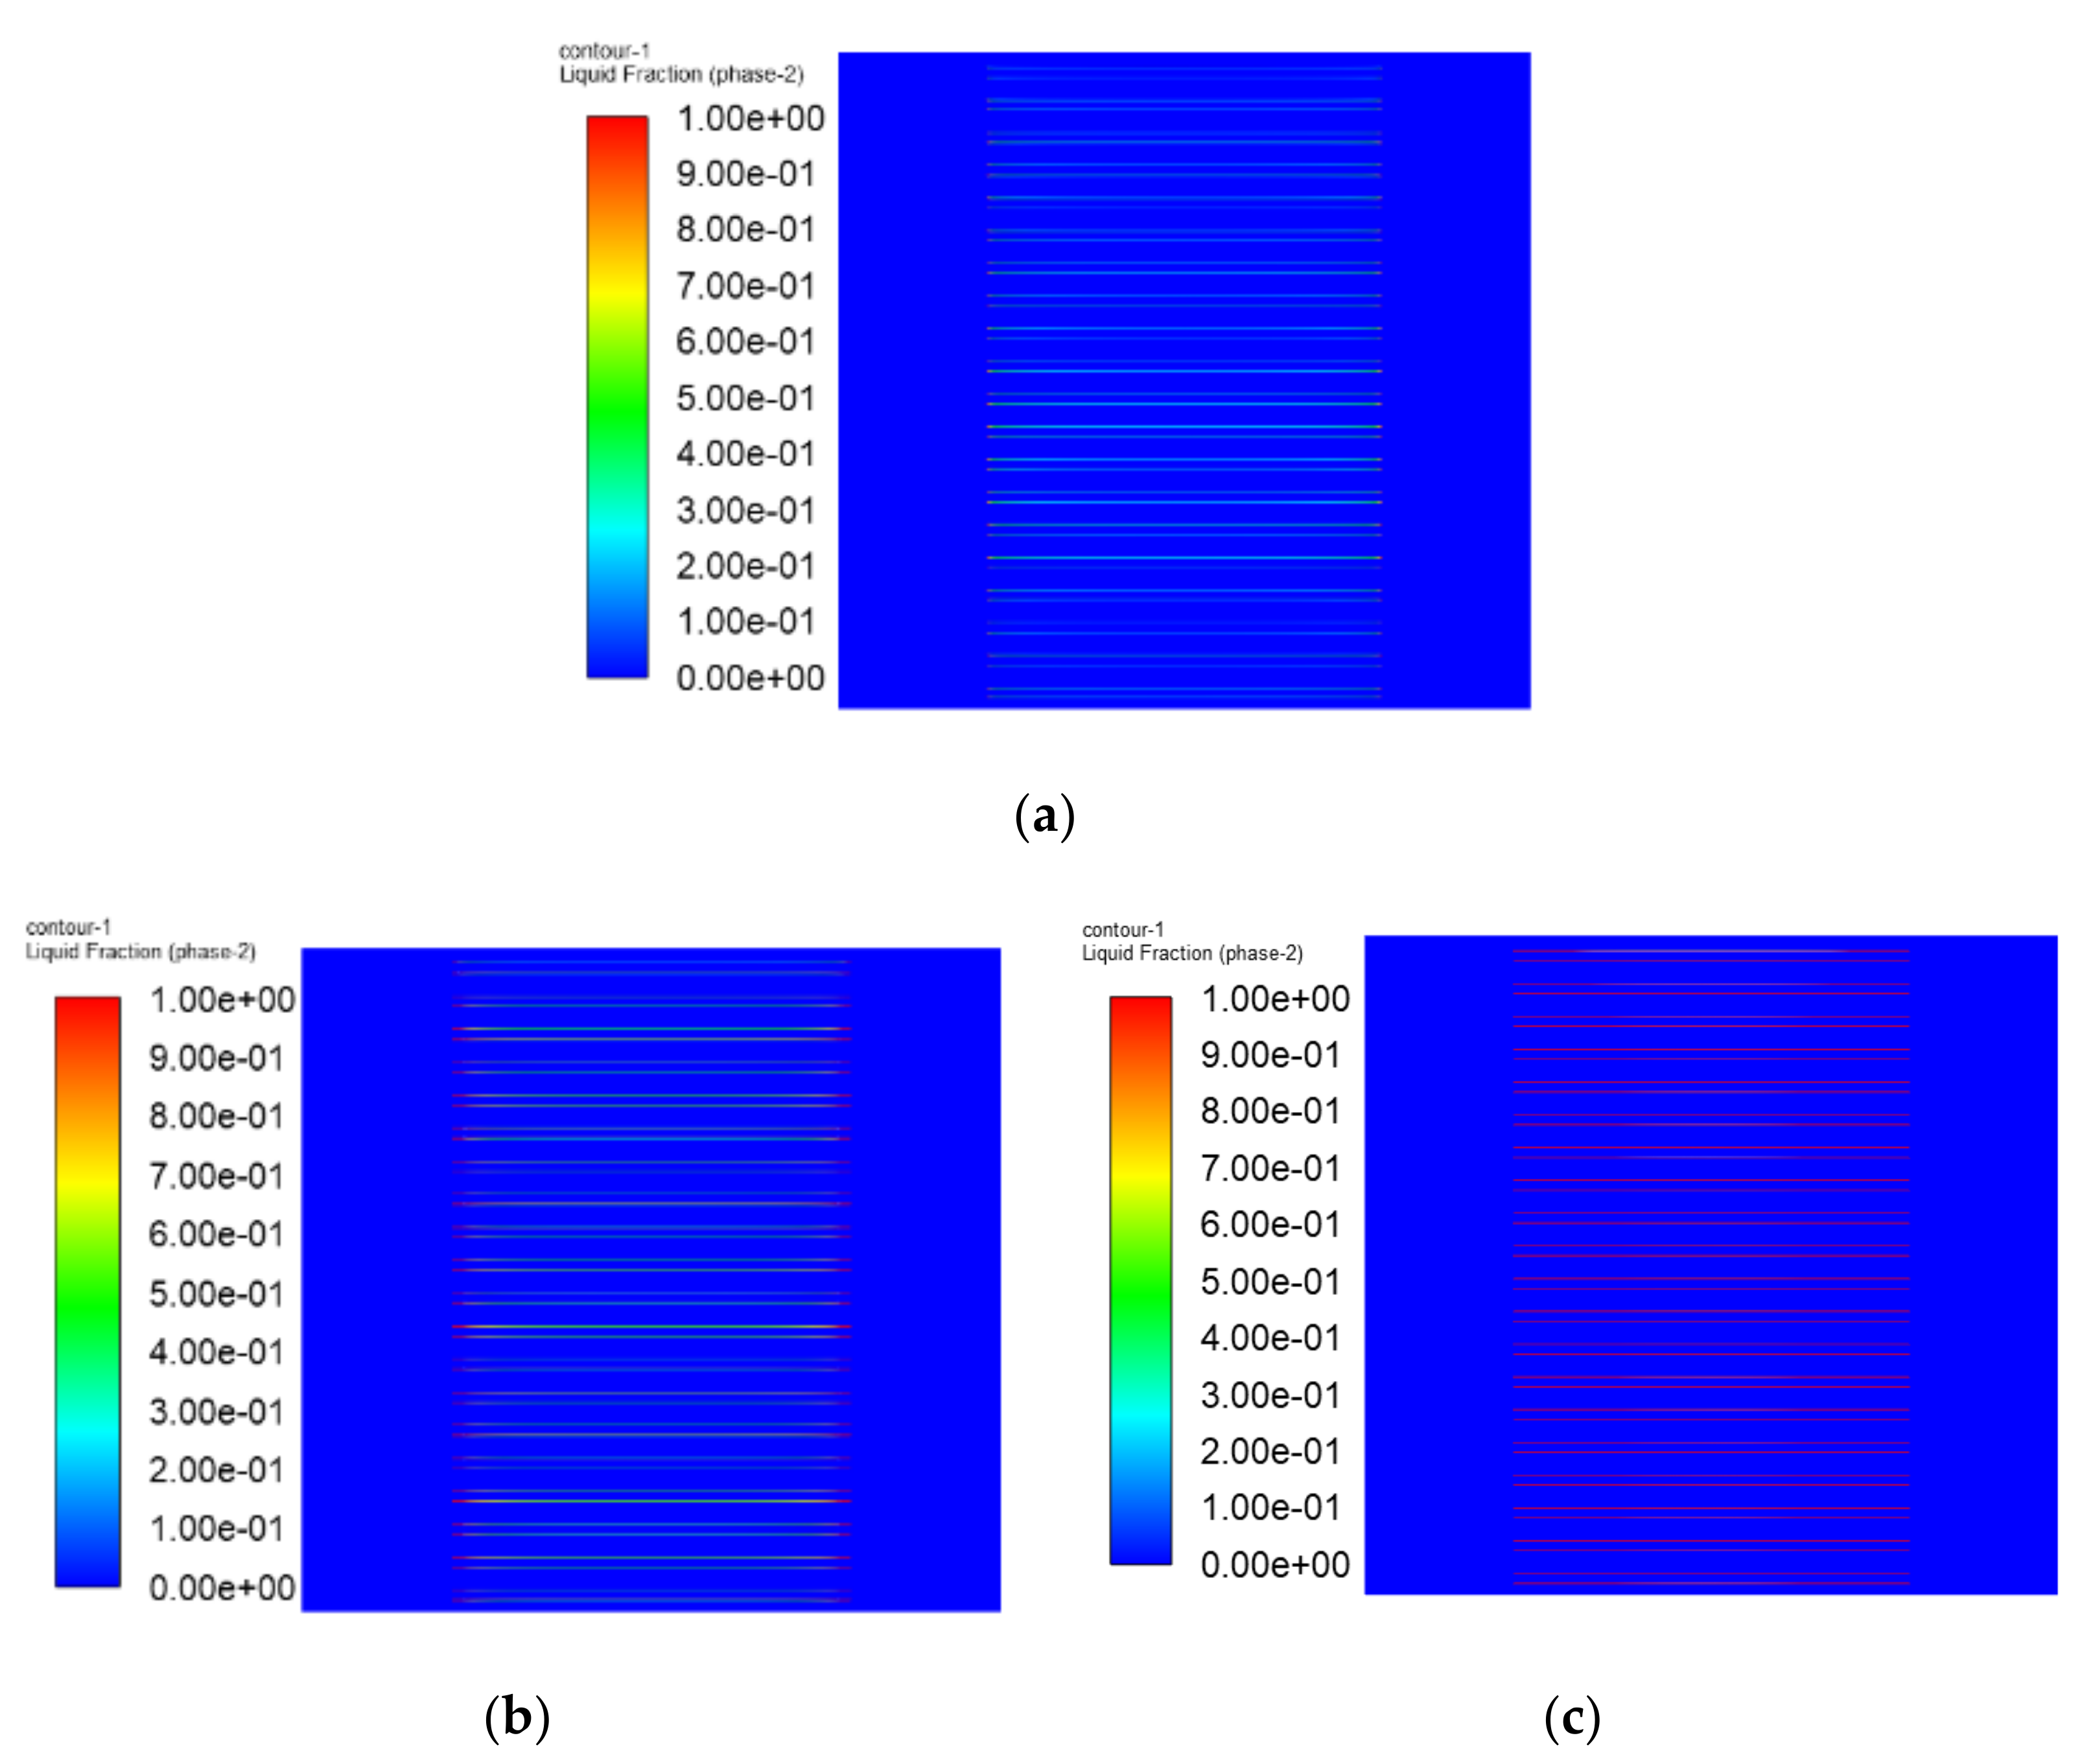
Figure 12.
Liquid fraction contours of the ice at different times; (a) t = 24 s, (b) t = 28 s, (c) t = 32 s.
Figure 12.
Liquid fraction contours of the ice at different times; (a) t = 24 s, (b) t = 28 s, (c) t = 32 s.
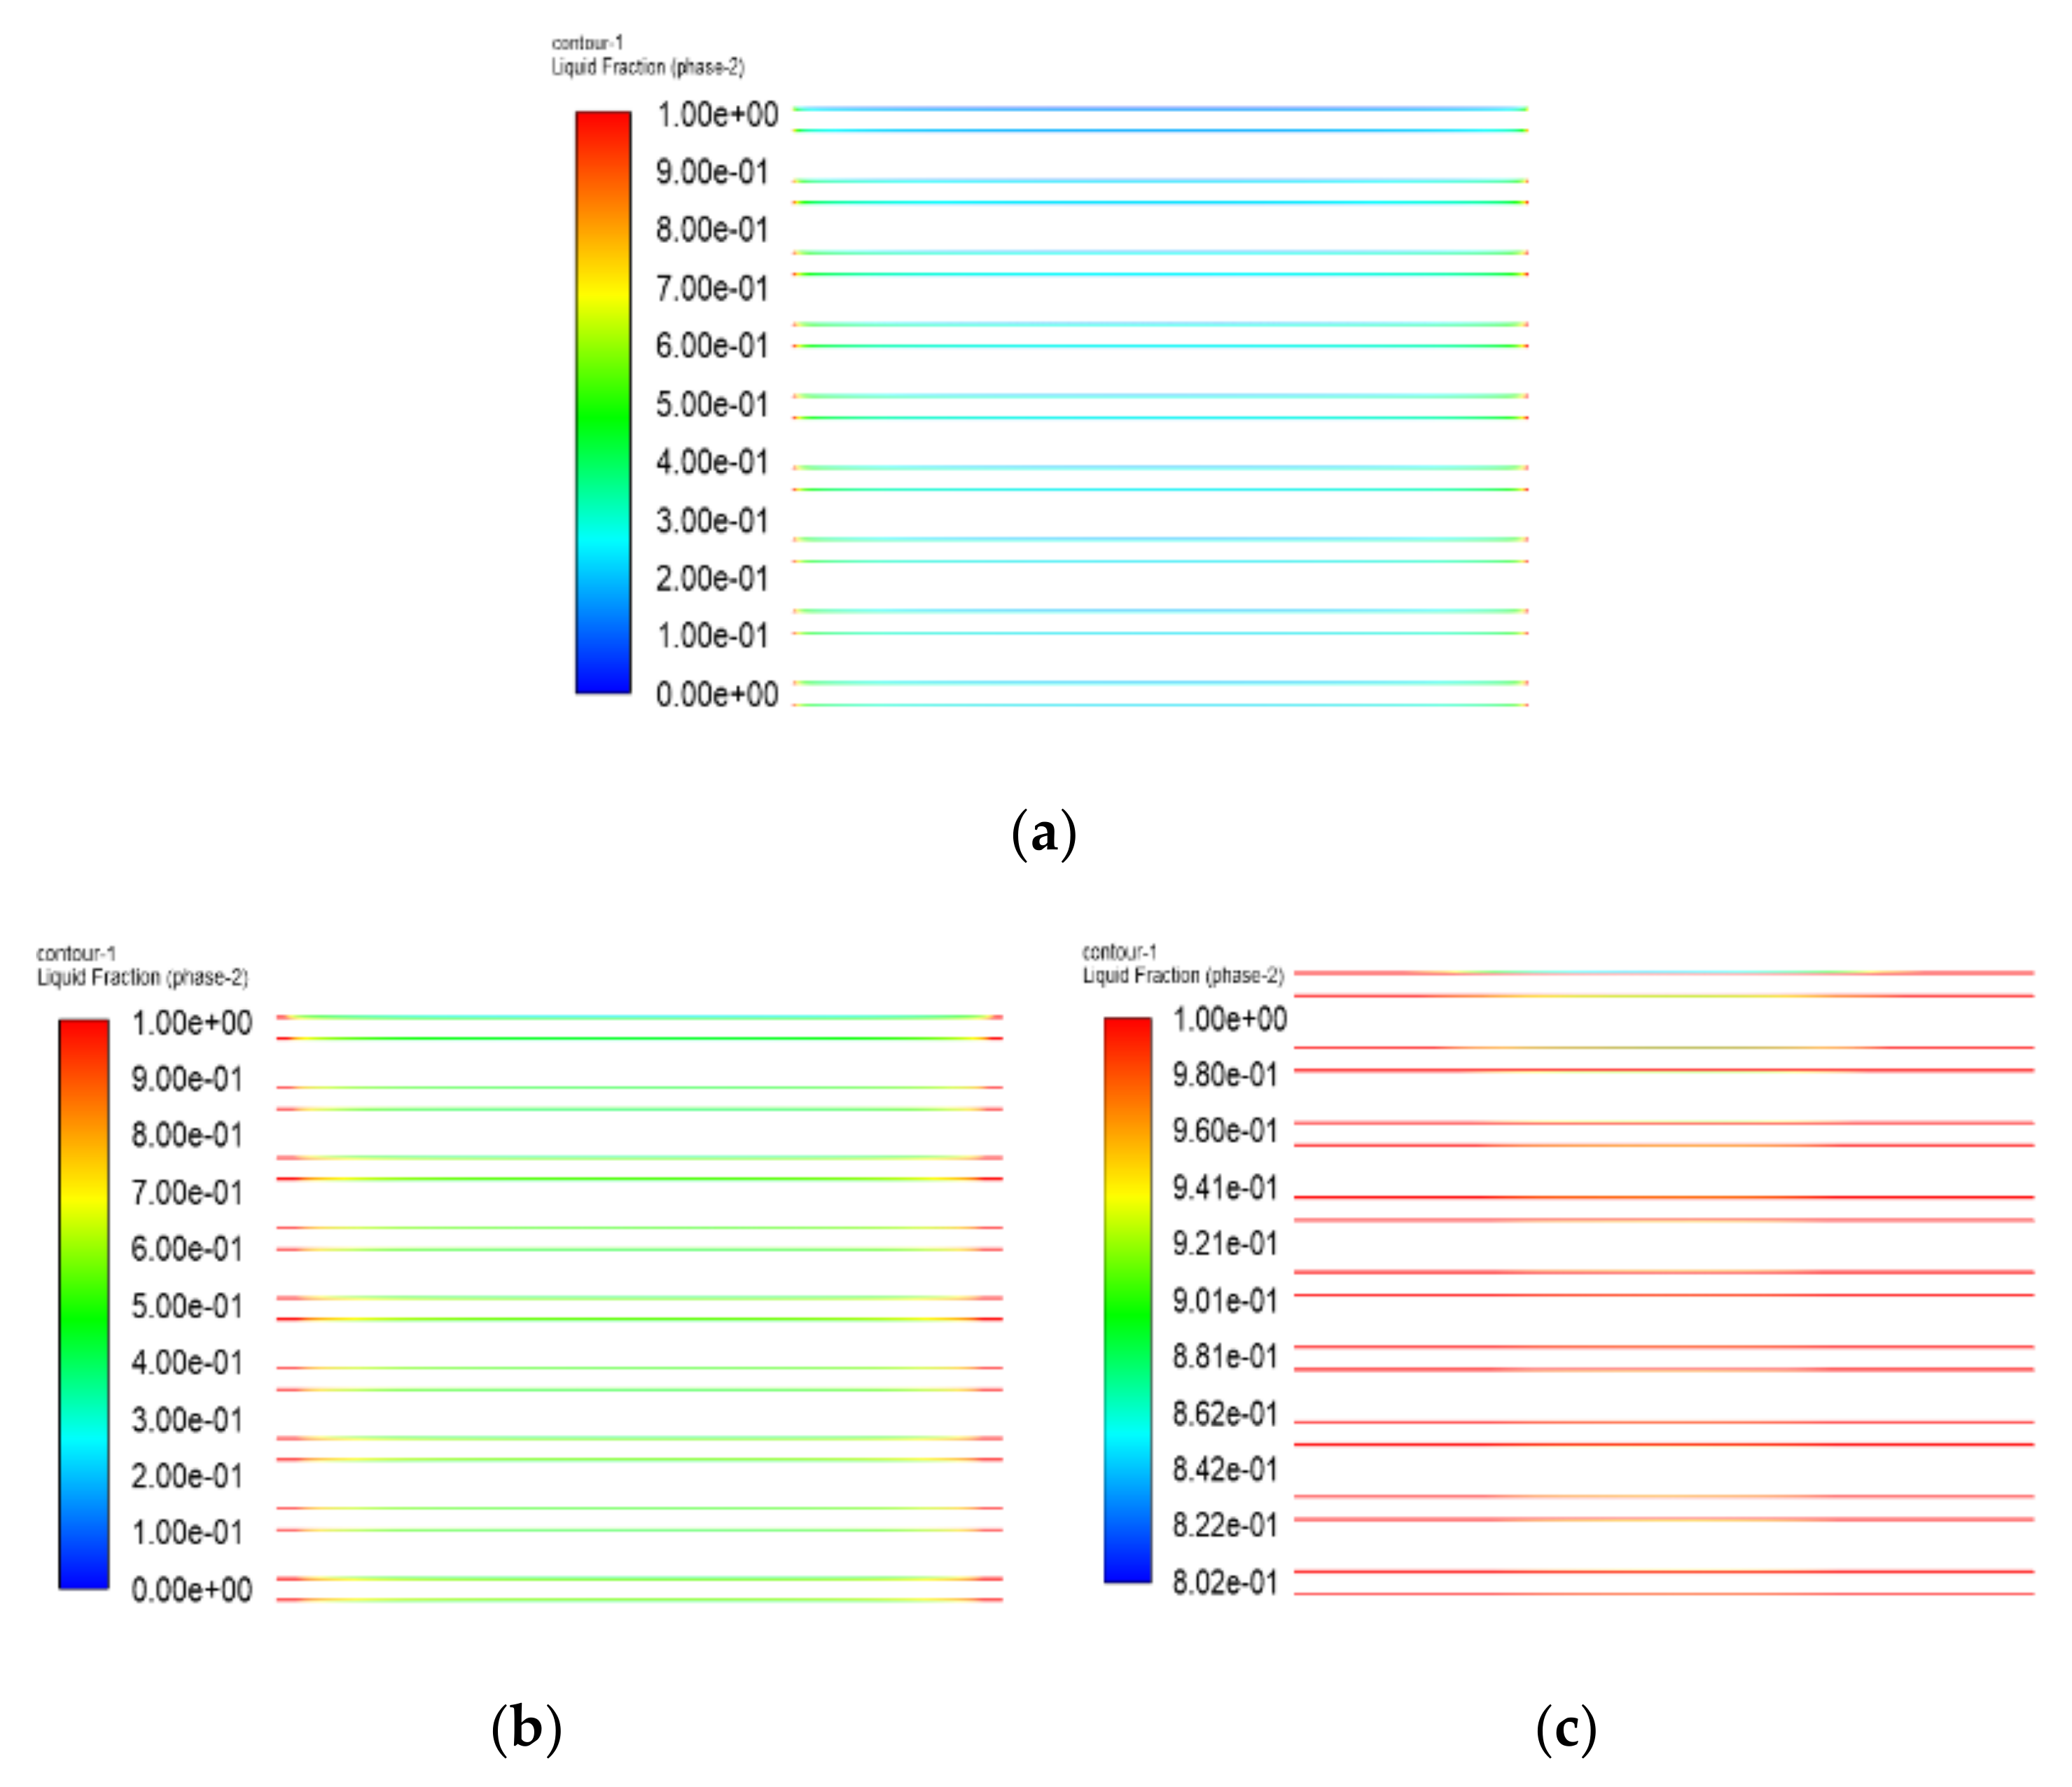
Figure 13.
The average temperature distribution of each layer in the PEMFC stack.
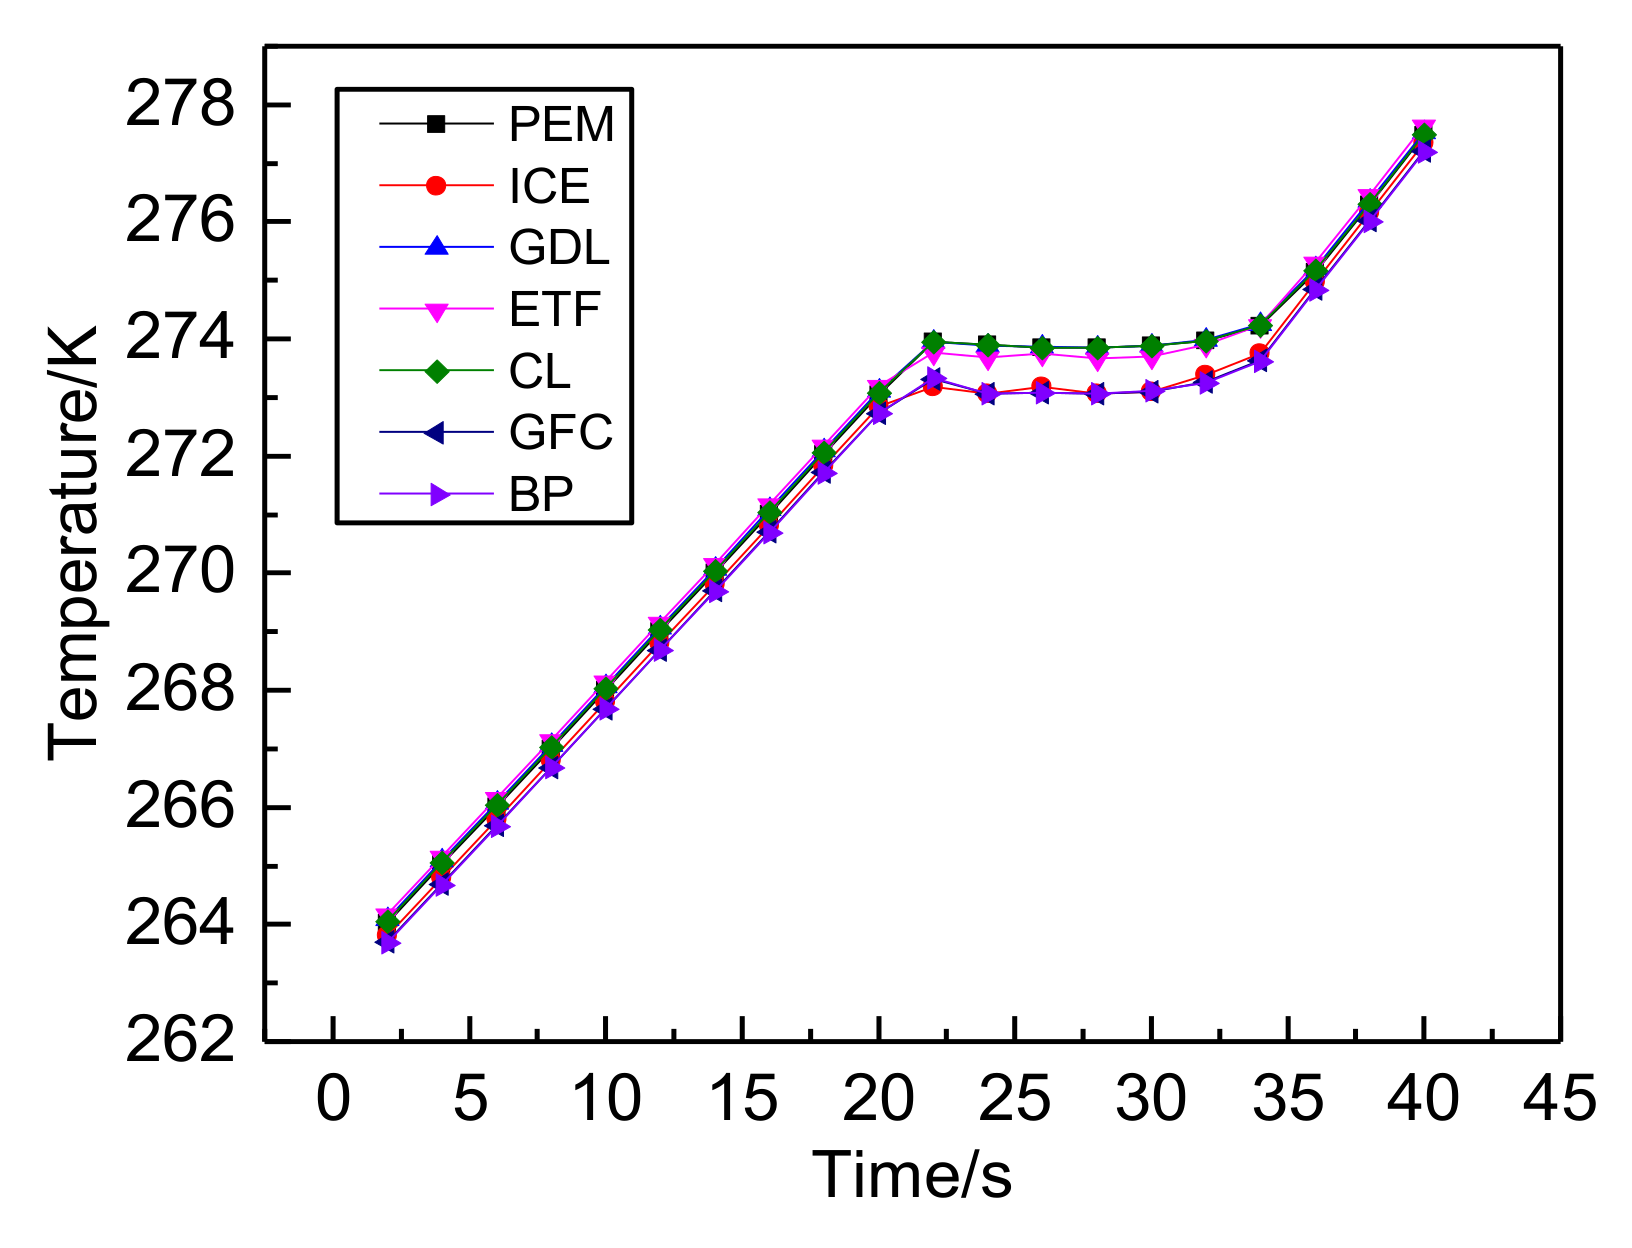
Figure 14.
The liquid fraction distribution of the ICE layer in the PEMFC stack.
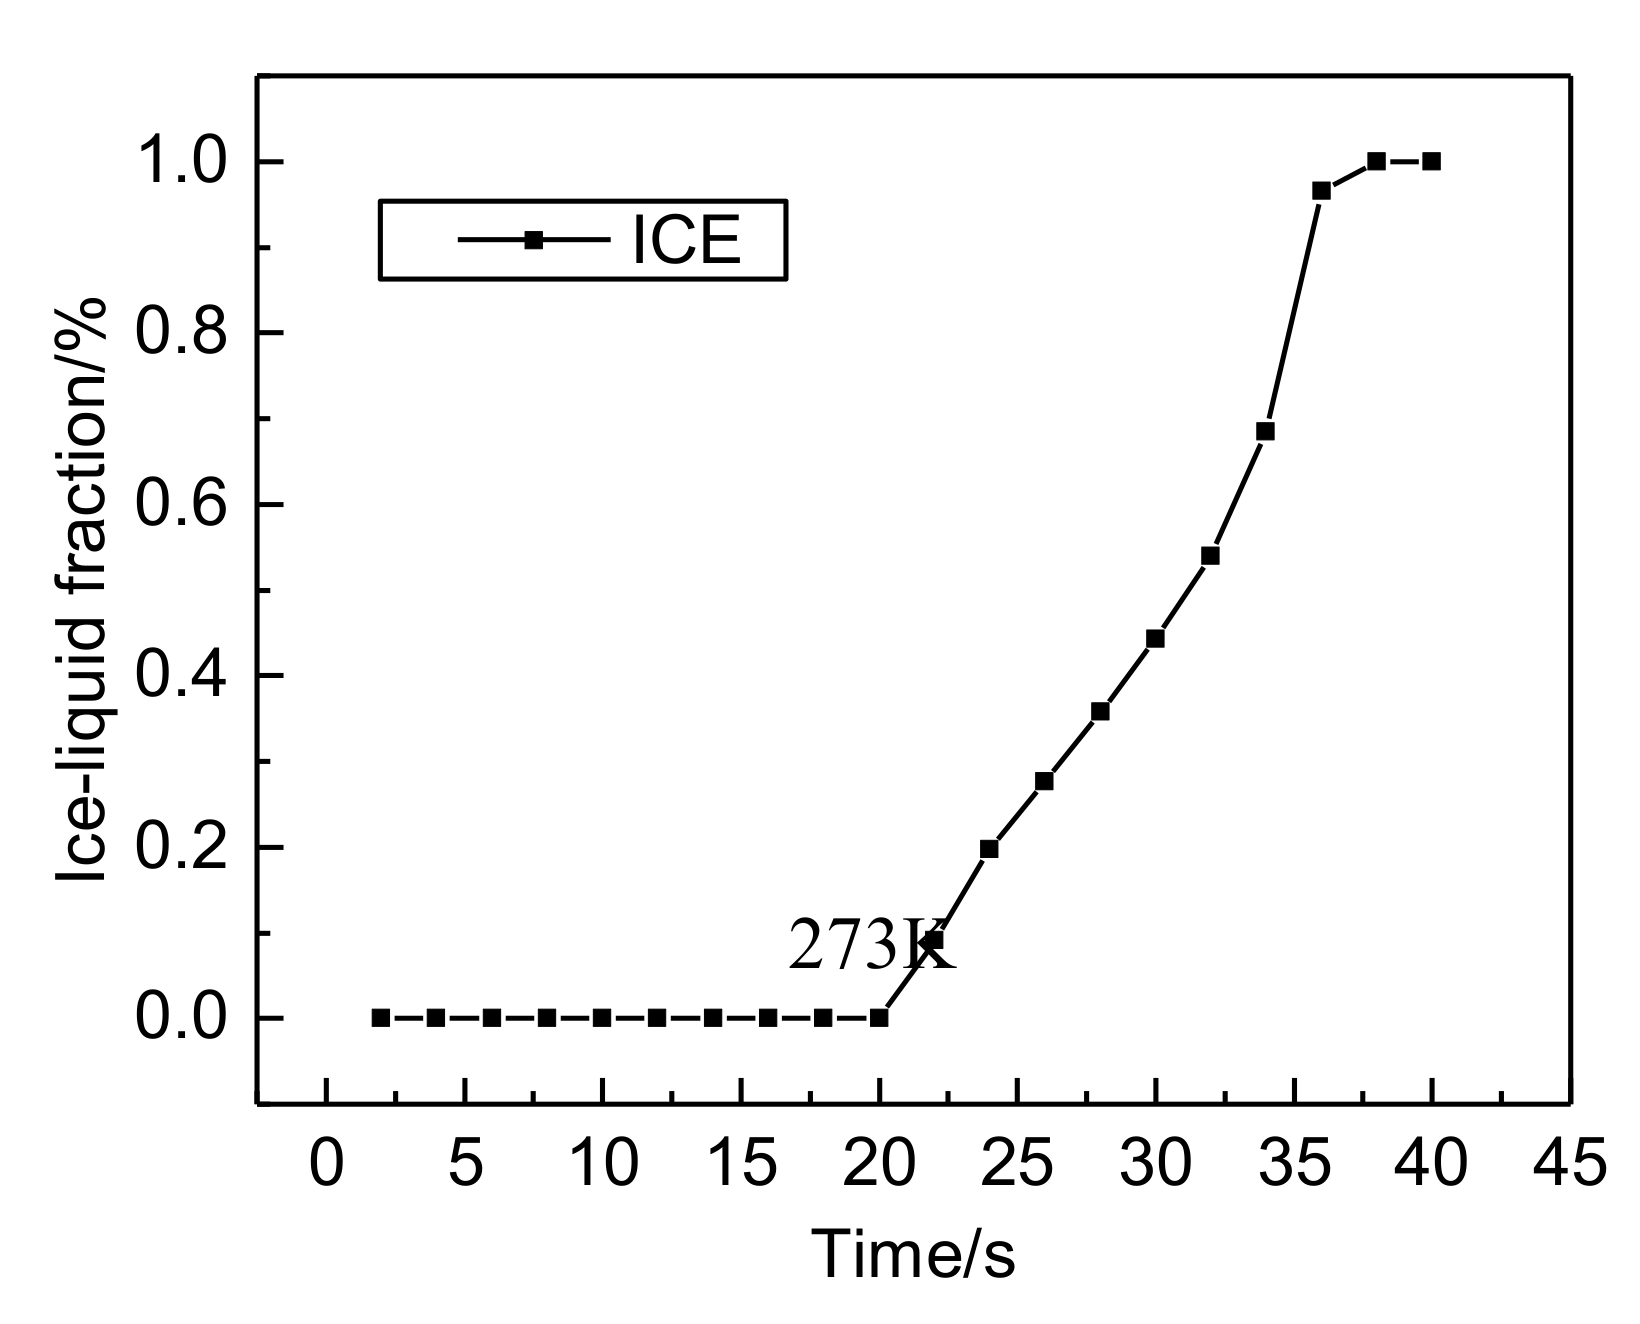
Figure 15.
The temperature distribution in the vertical direction at 16th second.
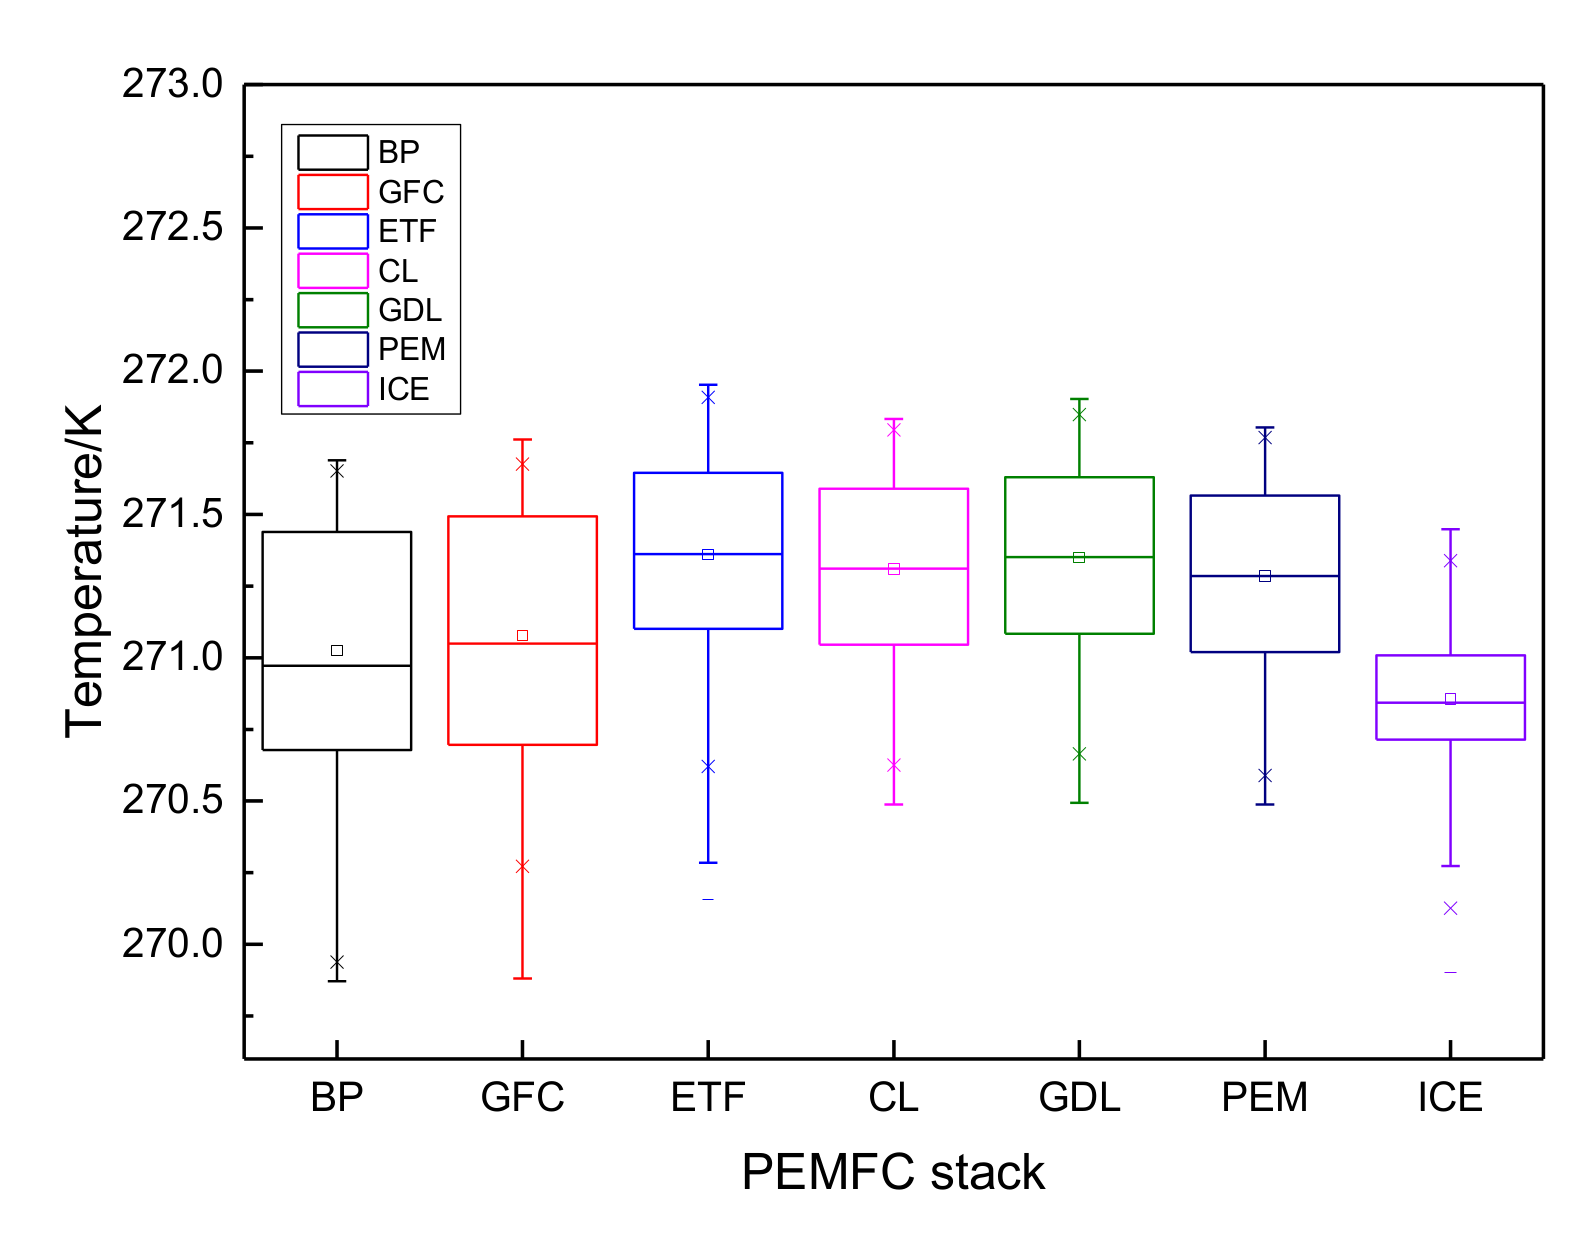
Figure 16.
Temperature contours of the PEMFC stack at different times; (a) t = 24 s, (b) t = 32 s, (c) t = 36 s.
Figure 16.
Temperature contours of the PEMFC stack at different times; (a) t = 24 s, (b) t = 32 s, (c) t = 36 s.


Figure 17.
Temperature contours of the ETF at different times; (a) t = 24 s, (b) t = 32 s, (c) t = 36 s.
Figure 17.
Temperature contours of the ETF at different times; (a) t = 24 s, (b) t = 32 s, (c) t = 36 s.
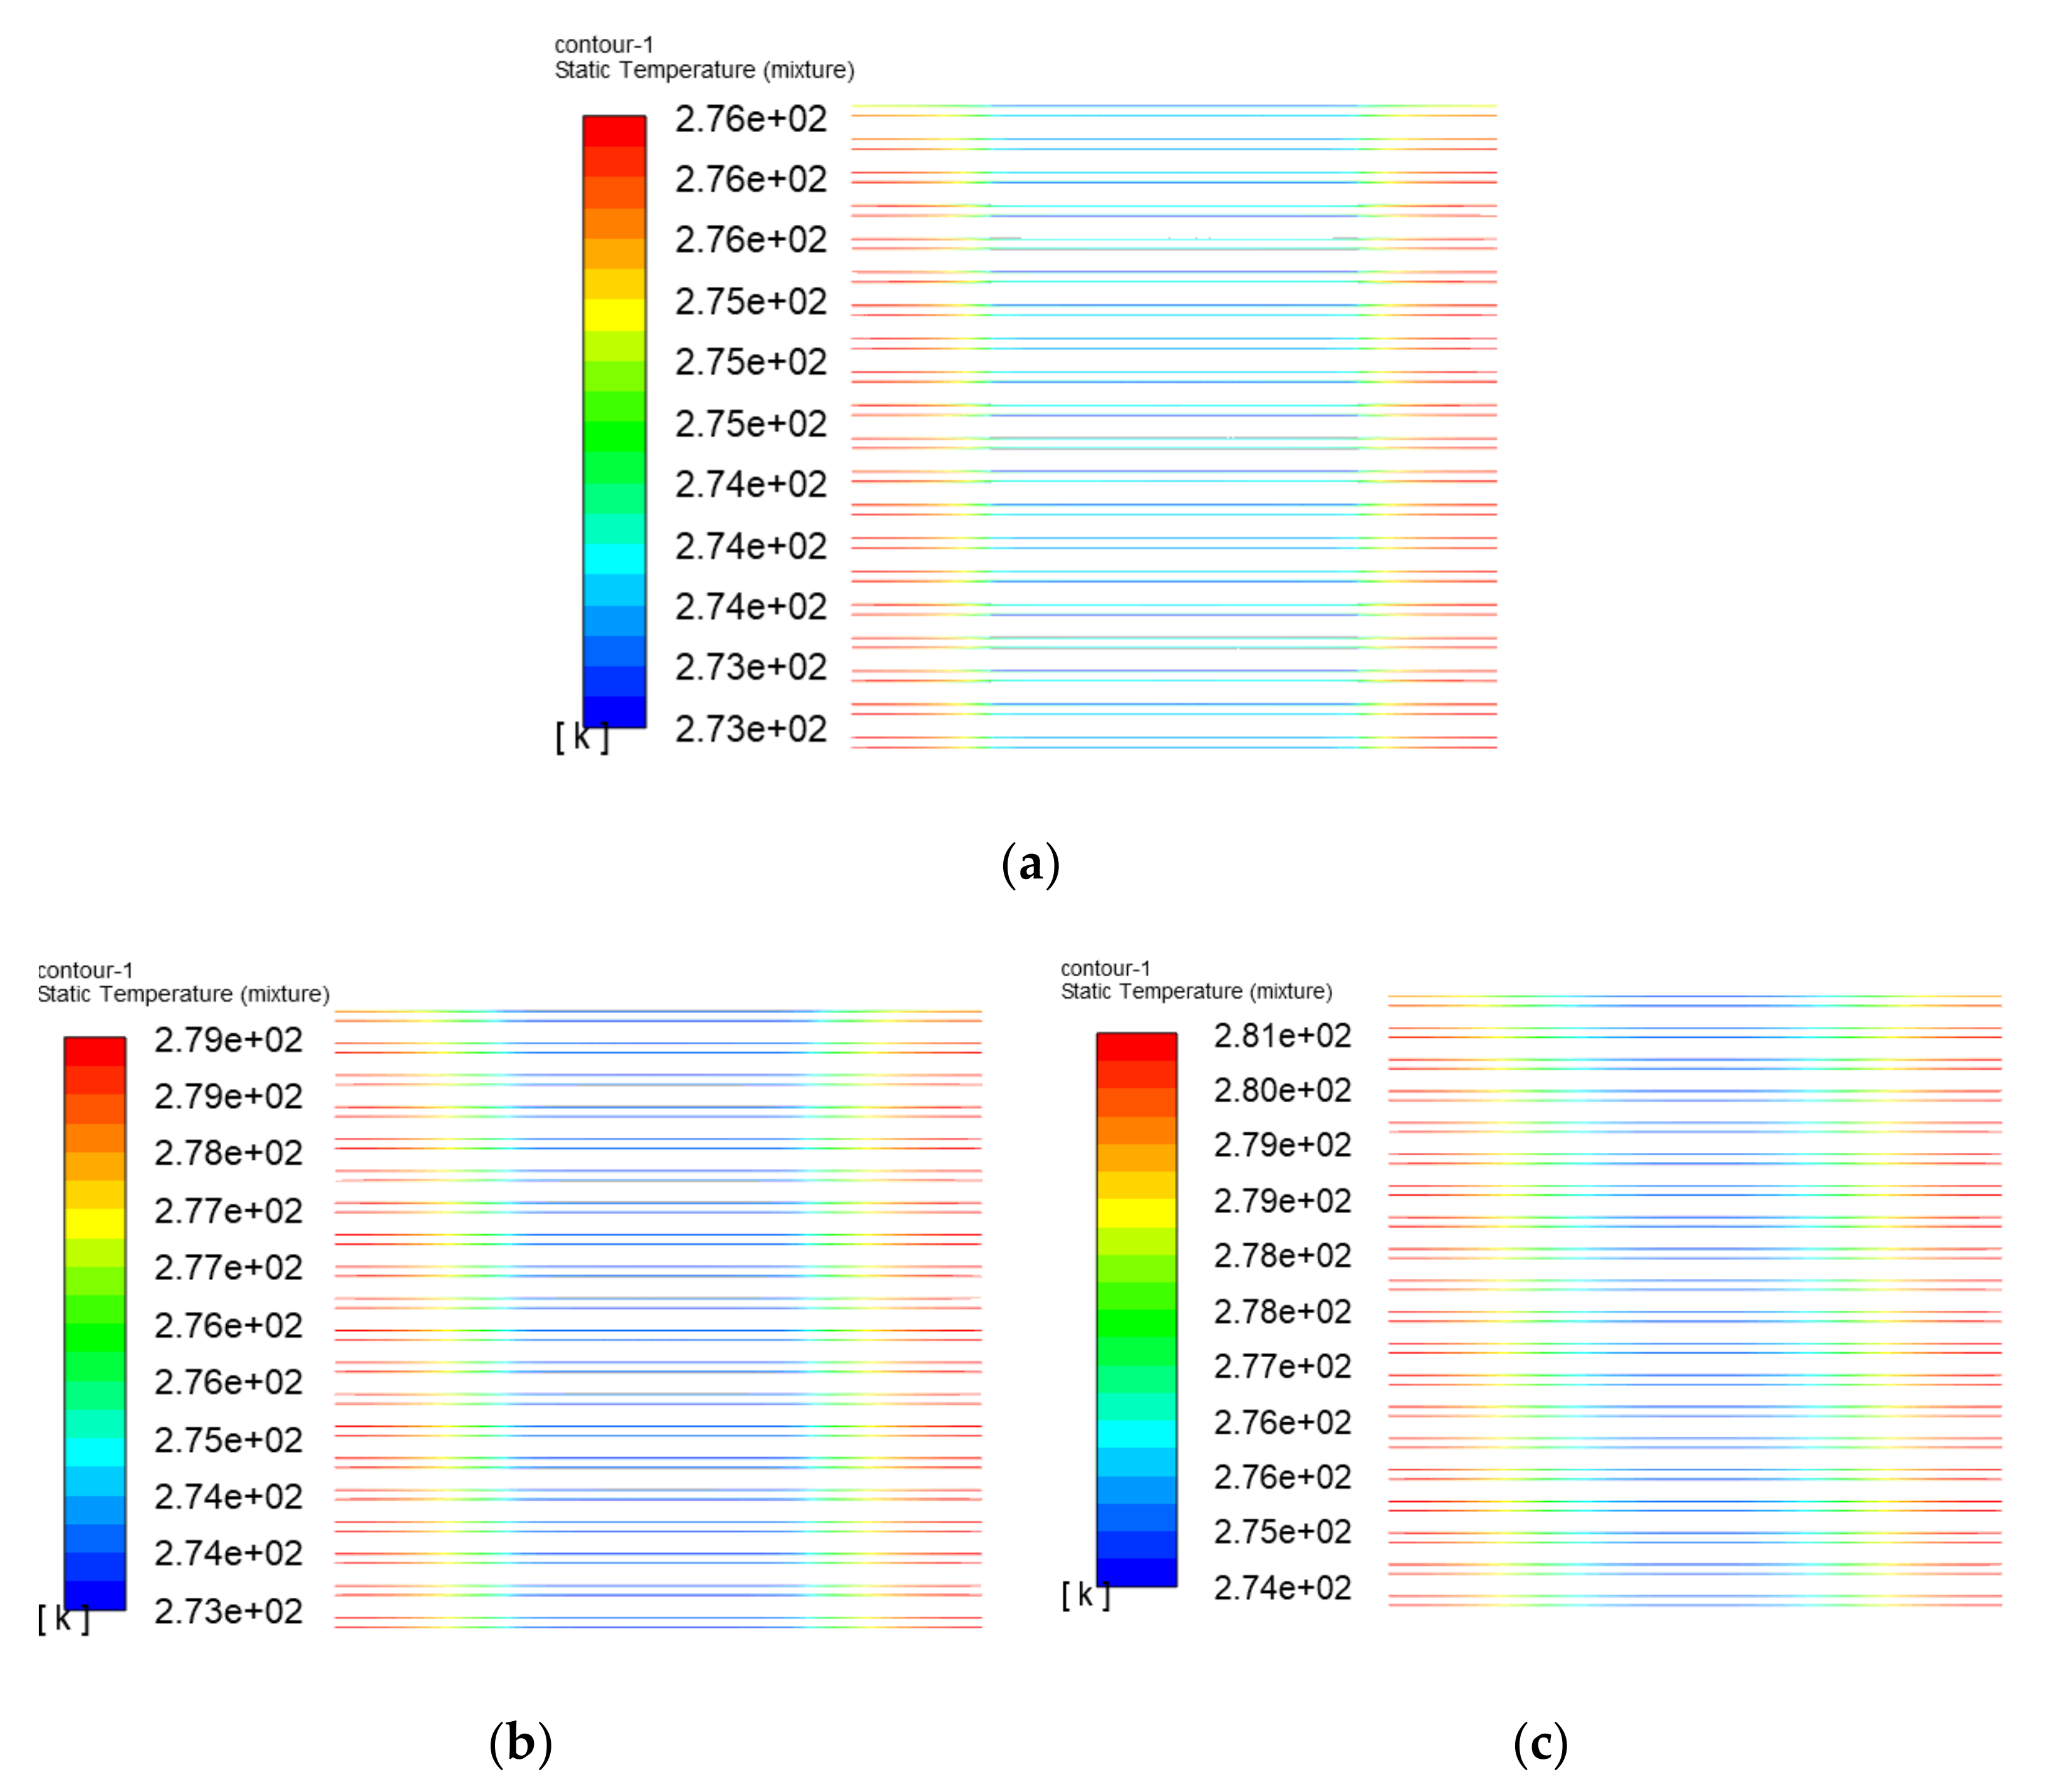
Figure 18.
Liquid fraction contours of the PEMFC stack at different times; (a) t = 24 s, (b) t = 32 s, (c) t = 36 s.
Figure 18.
Liquid fraction contours of the PEMFC stack at different times; (a) t = 24 s, (b) t = 32 s, (c) t = 36 s.
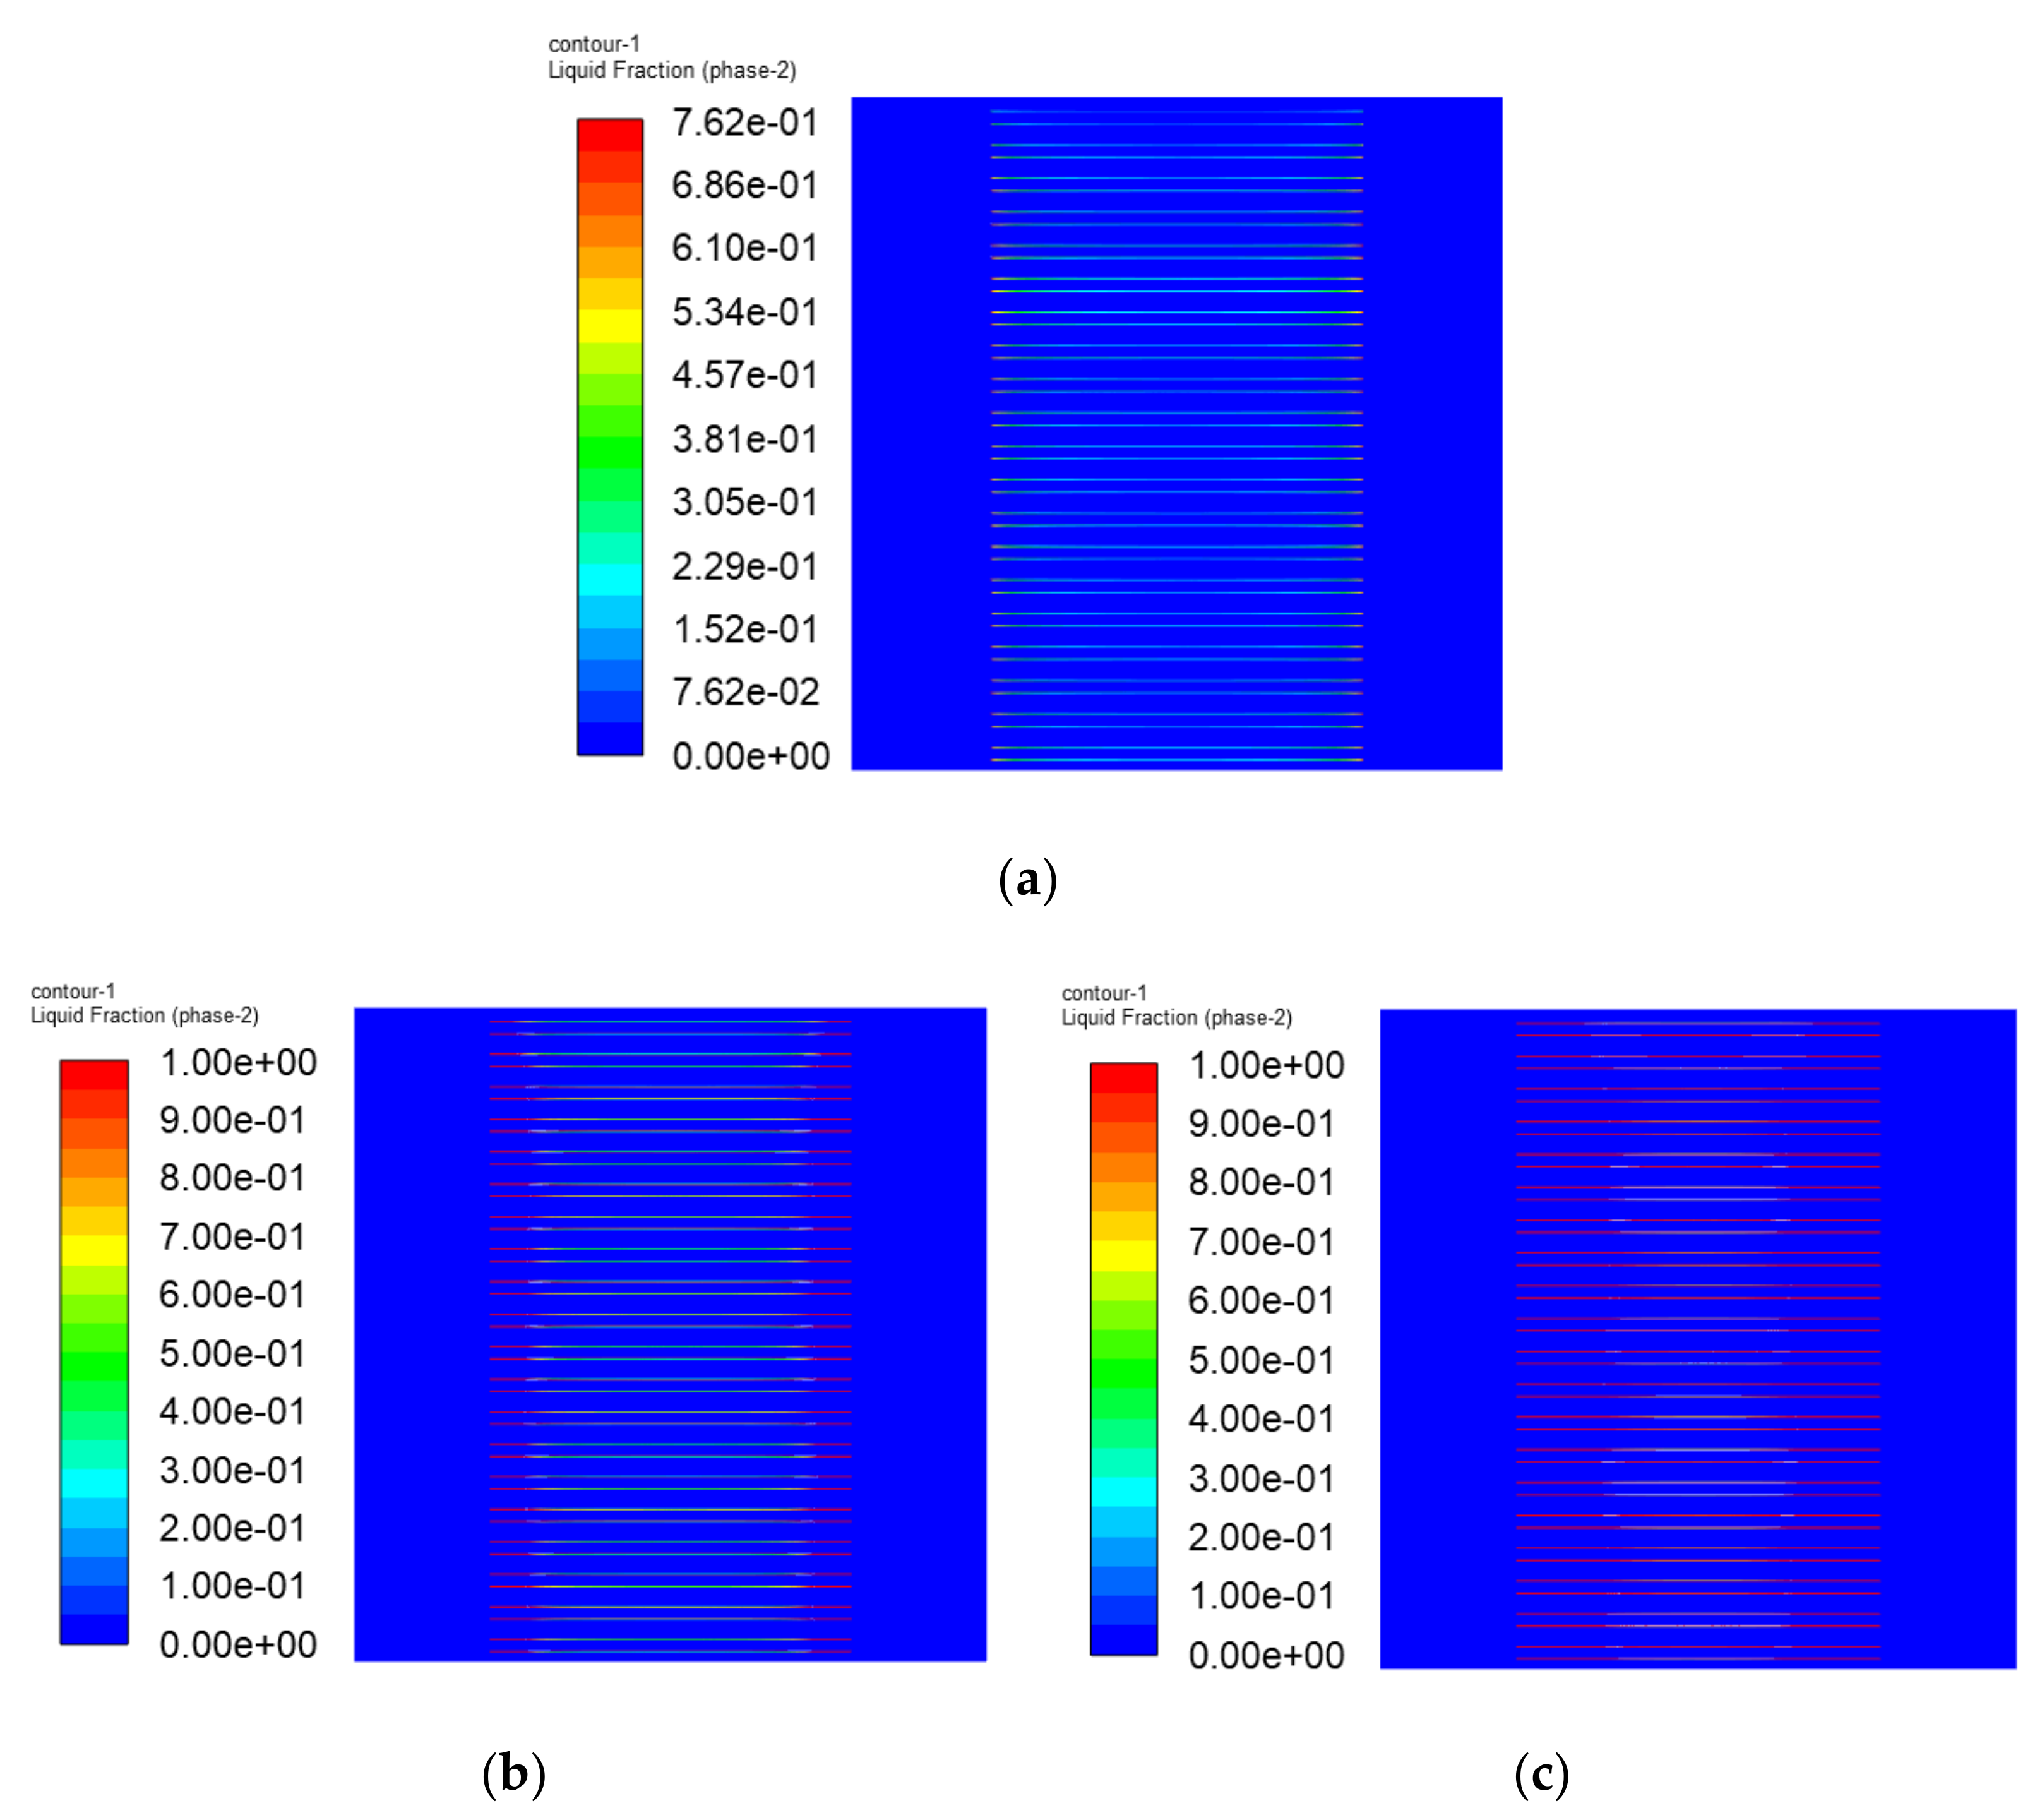
Figure 19.
Liquid fraction contours of ice at different times; (a) t = 24 s, (b) t = 32 s, (c) t = 36 s.
Figure 19.
Liquid fraction contours of ice at different times; (a) t = 24 s, (b) t = 32 s, (c) t = 36 s.
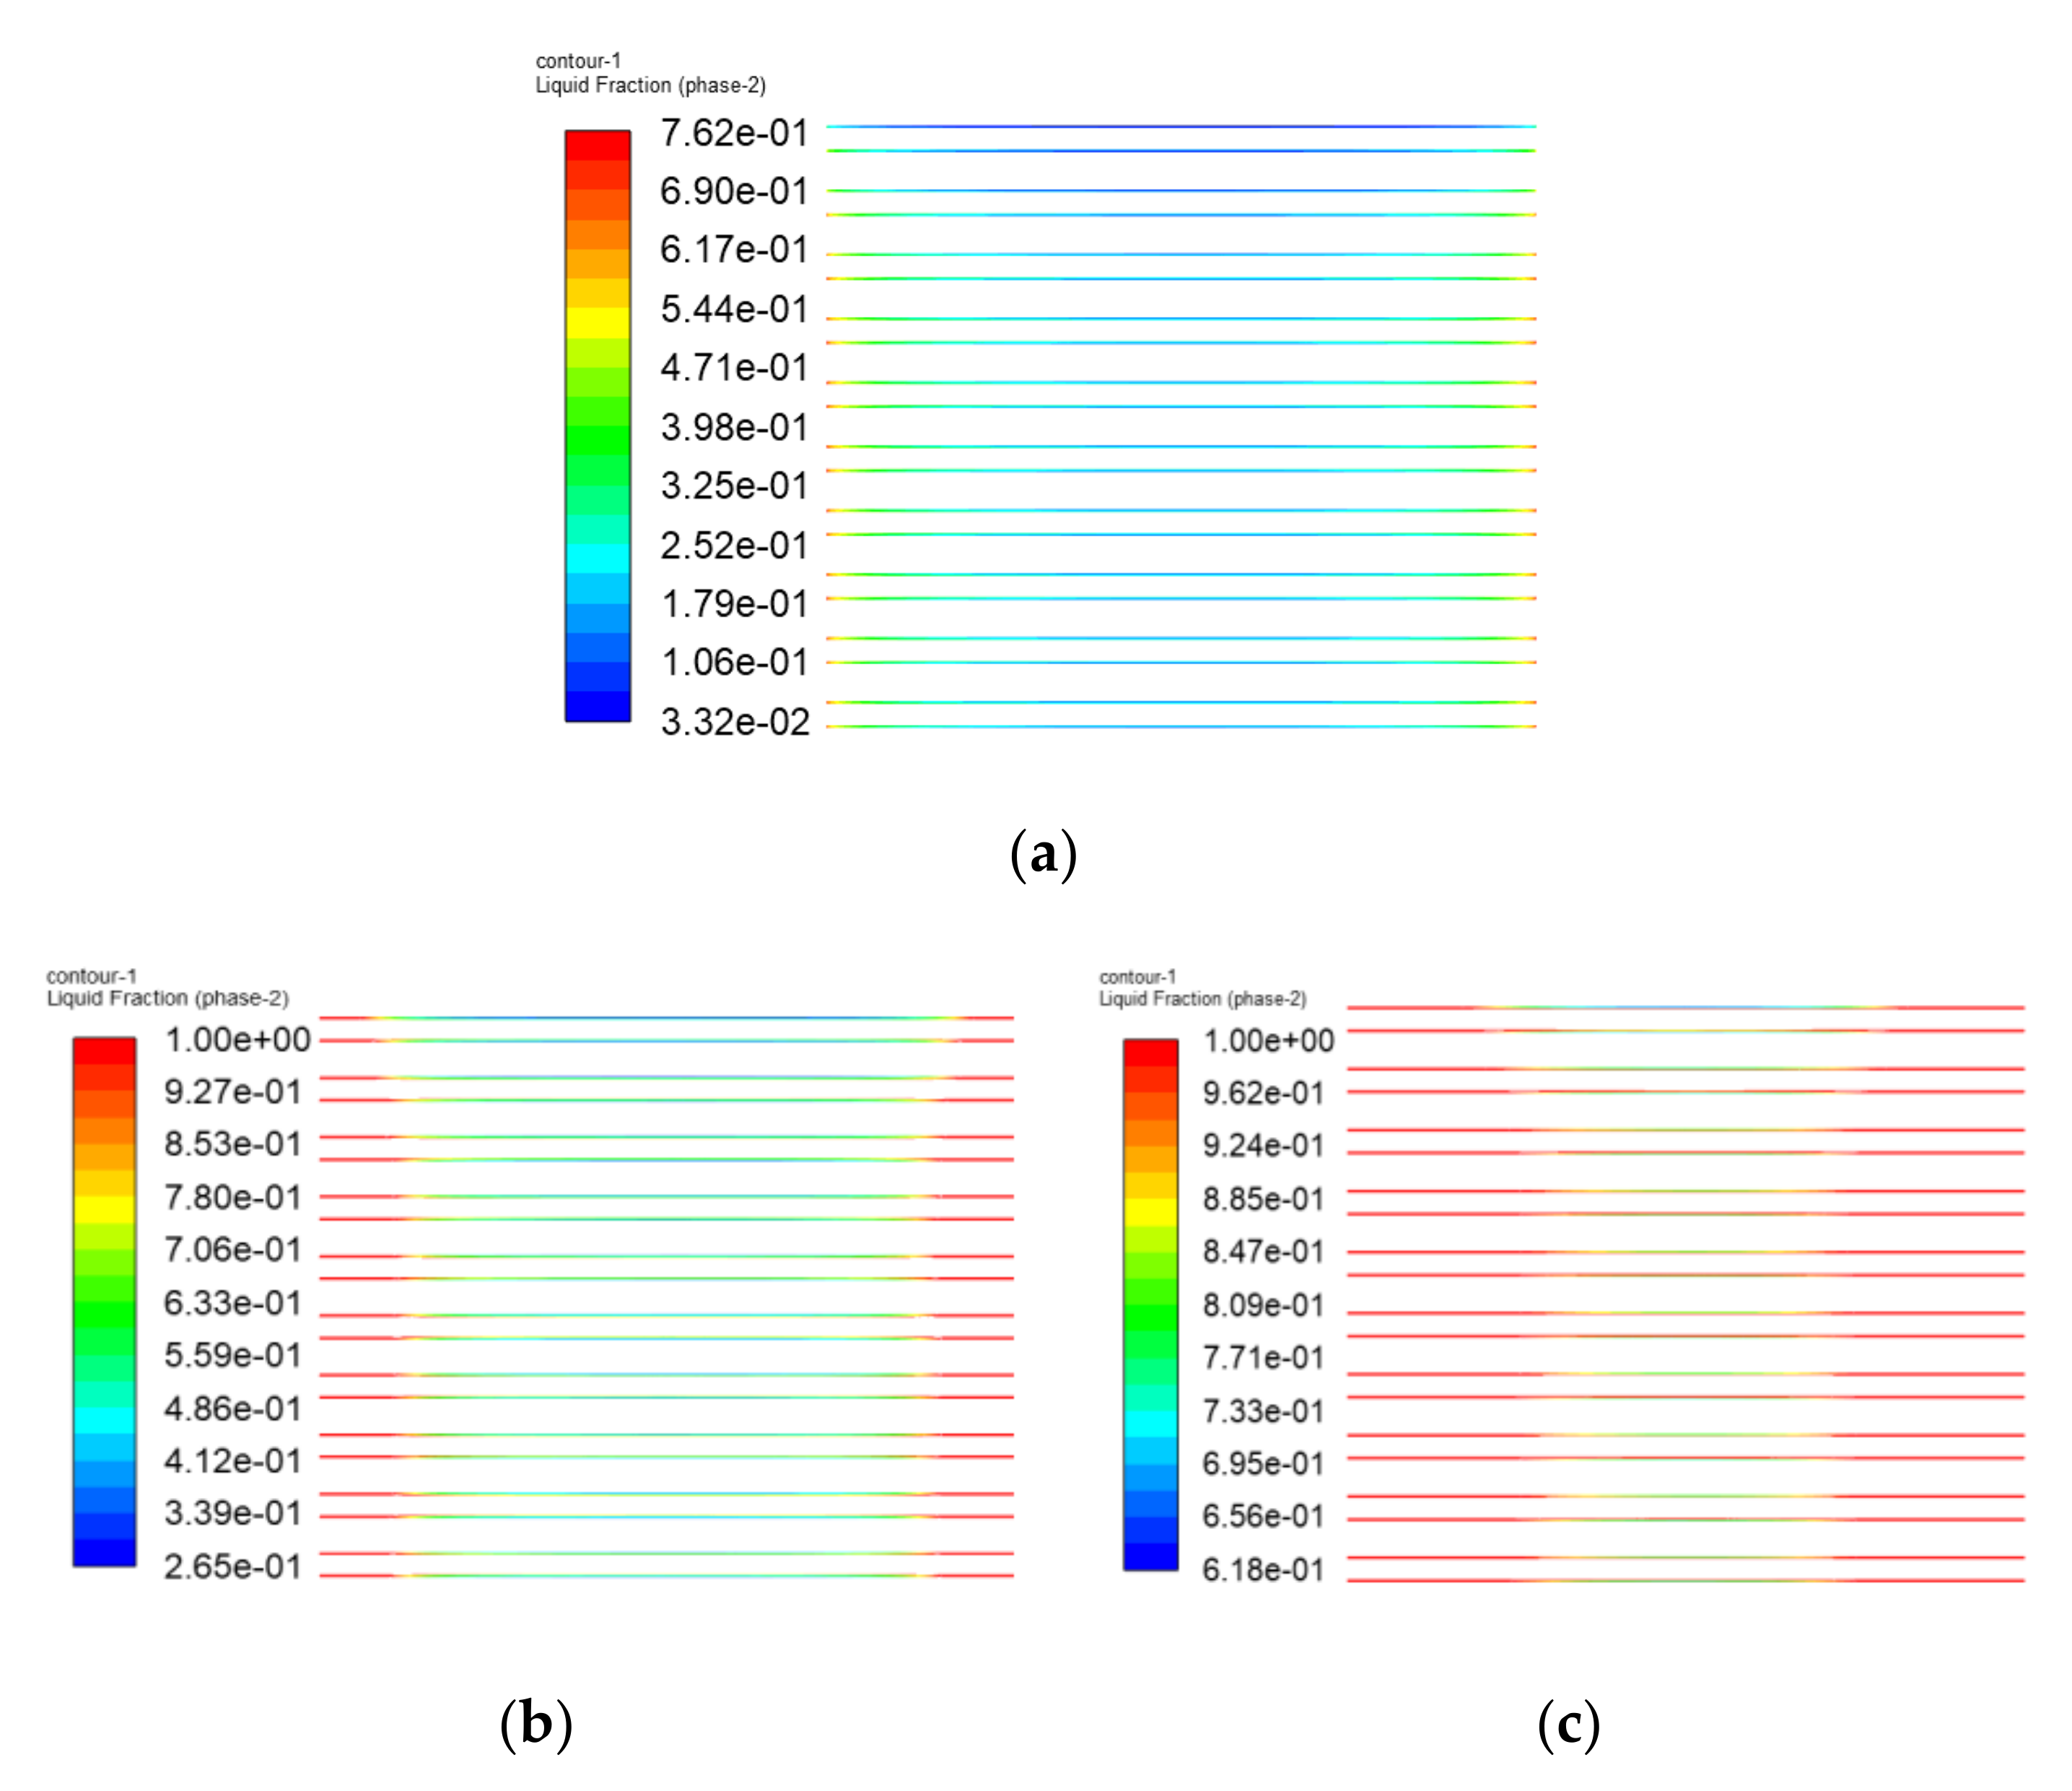
Figure 20.
The three-dimensional structure of the half of fuel cell ((a) pore size = 0.3 mm, (b) pore size = 0.6 mm, (c) pore size = 1.2 mm).
Figure 20.
The three-dimensional structure of the half of fuel cell ((a) pore size = 0.3 mm, (b) pore size = 0.6 mm, (c) pore size = 1.2 mm).
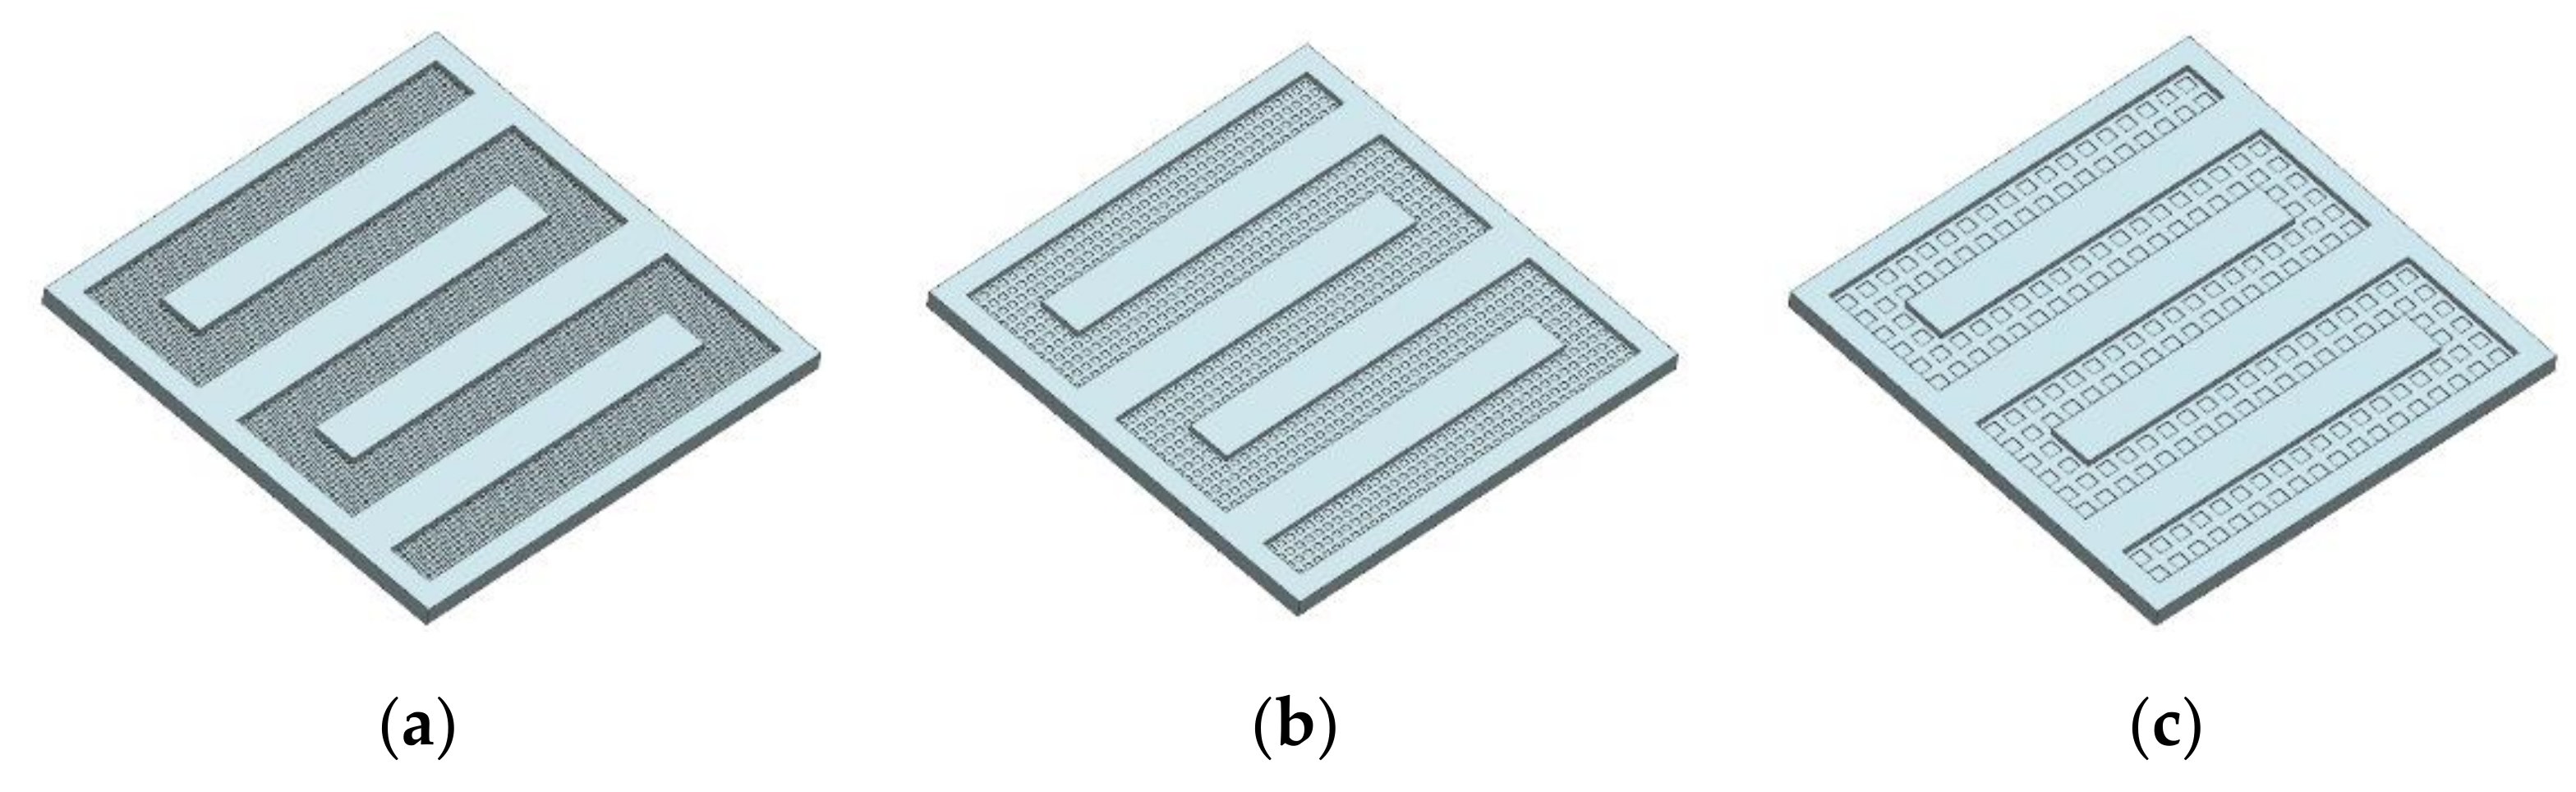
Figure 21.
The three-dimensional structure of electrothermal film ((a) pore size = 0.3 mm, (b) pore size = 0.6 mm, (c) pore size = 1.2 mm).
Figure 21.
The three-dimensional structure of electrothermal film ((a) pore size = 0.3 mm, (b) pore size = 0.6 mm, (c) pore size = 1.2 mm).
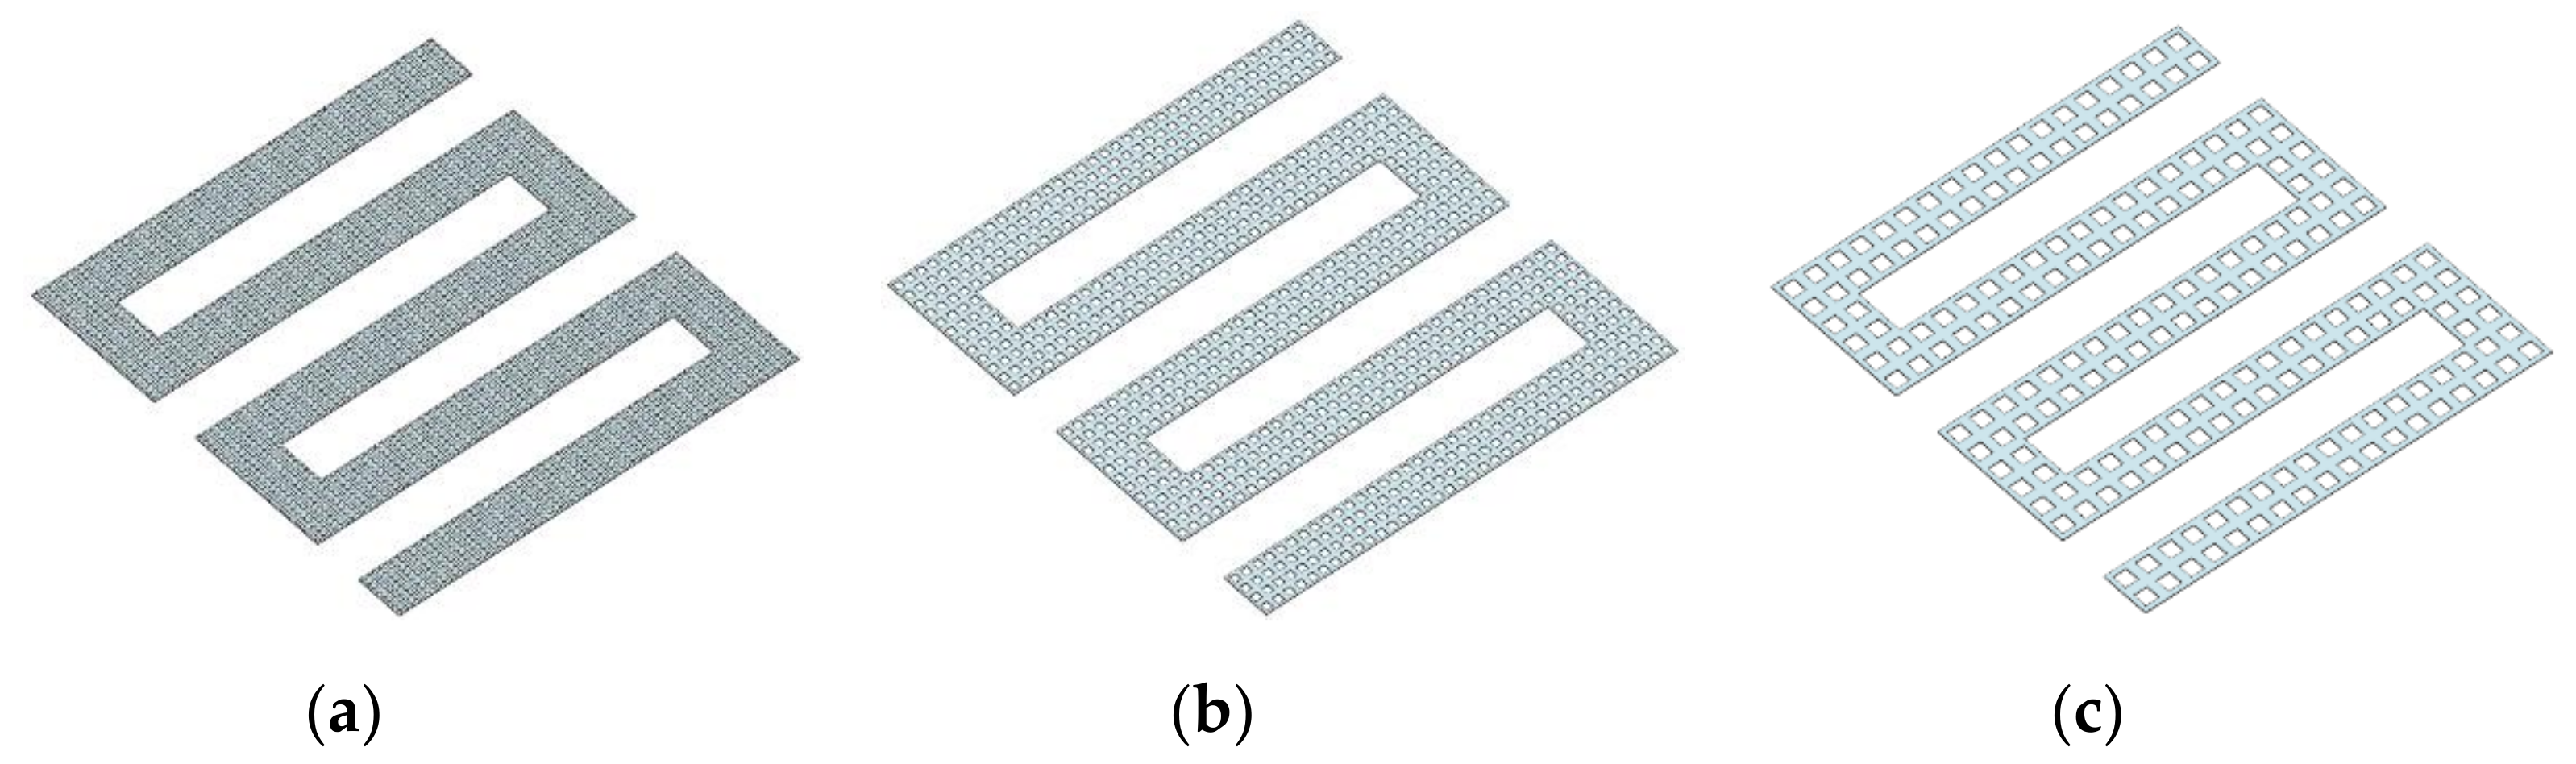
Figure 22.
Average temperature of each layer of ETF with different pore sizes.
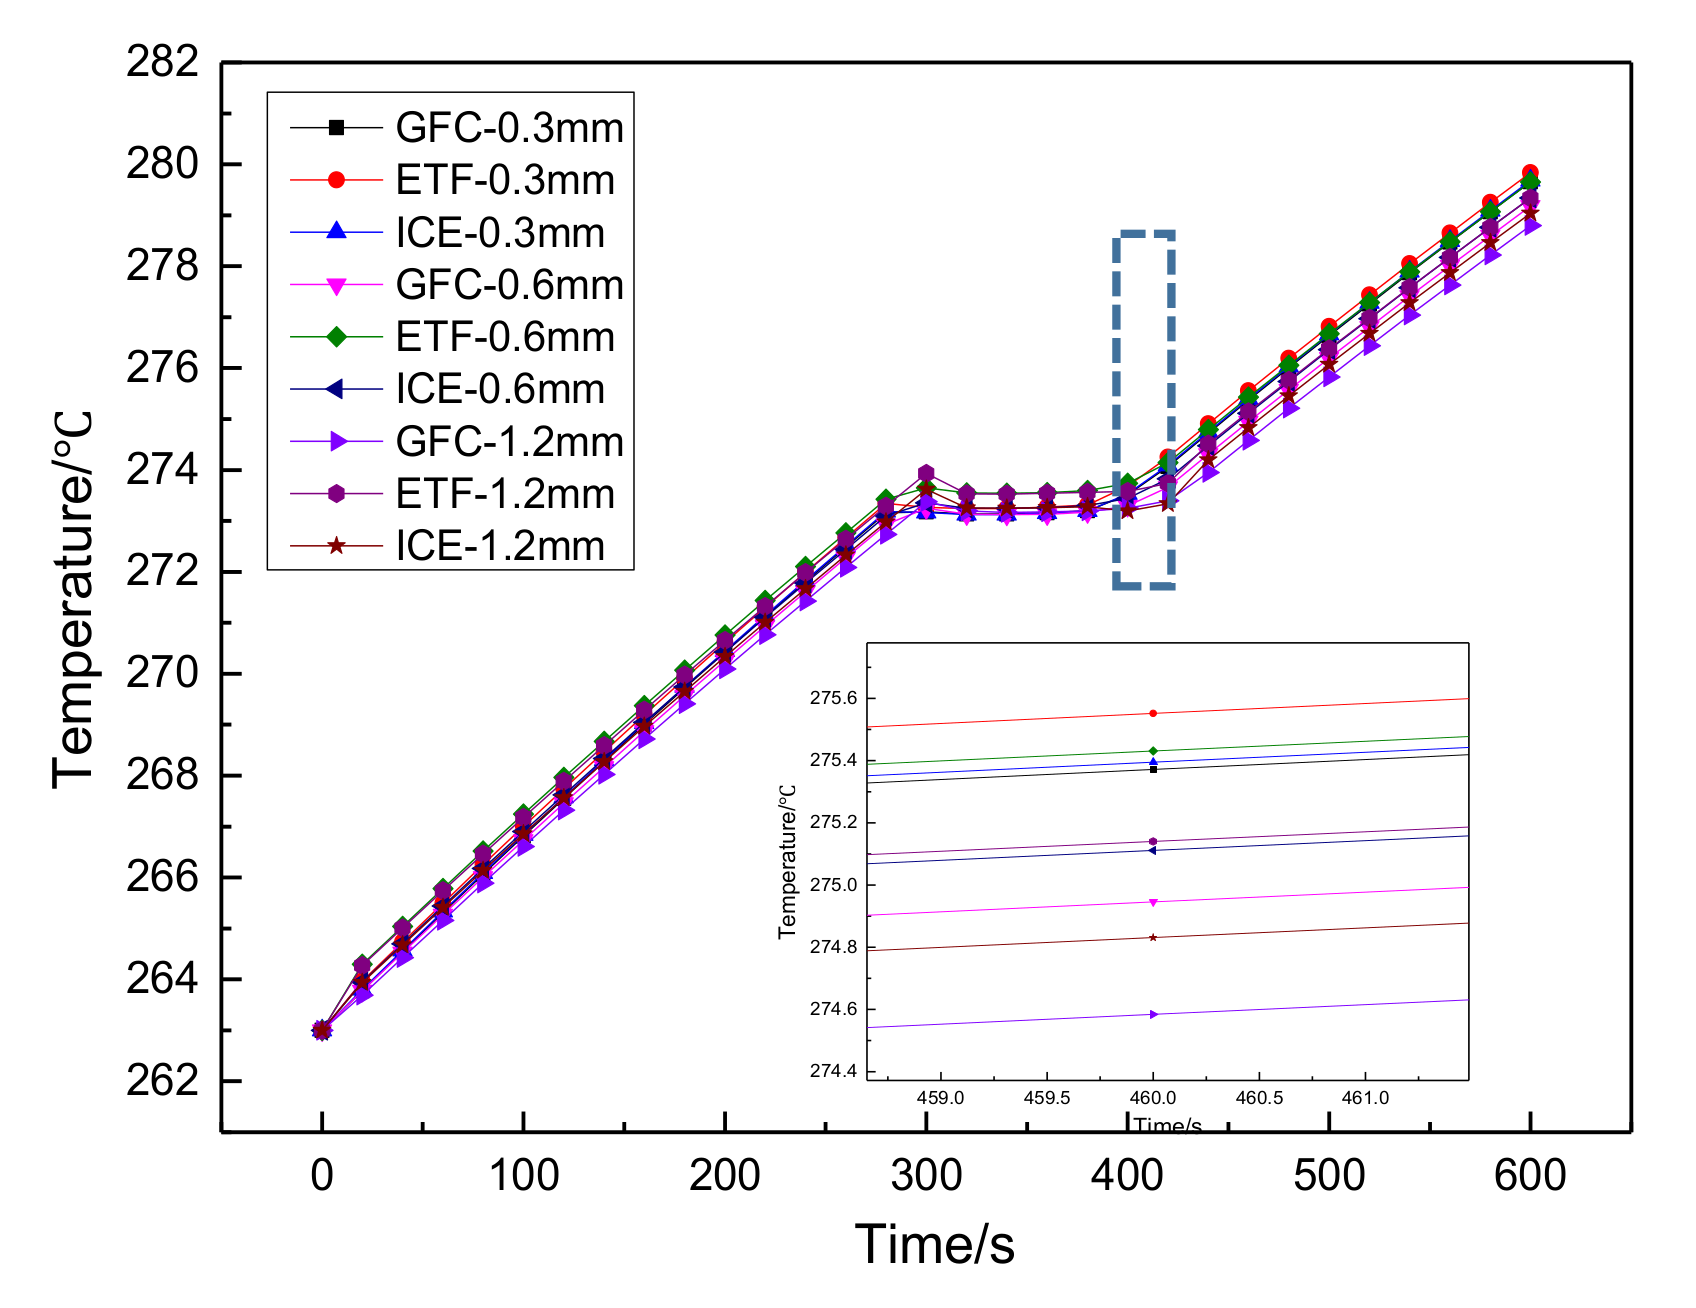
Figure 23.
Liquid fraction distribution of different ETF structures at different times.
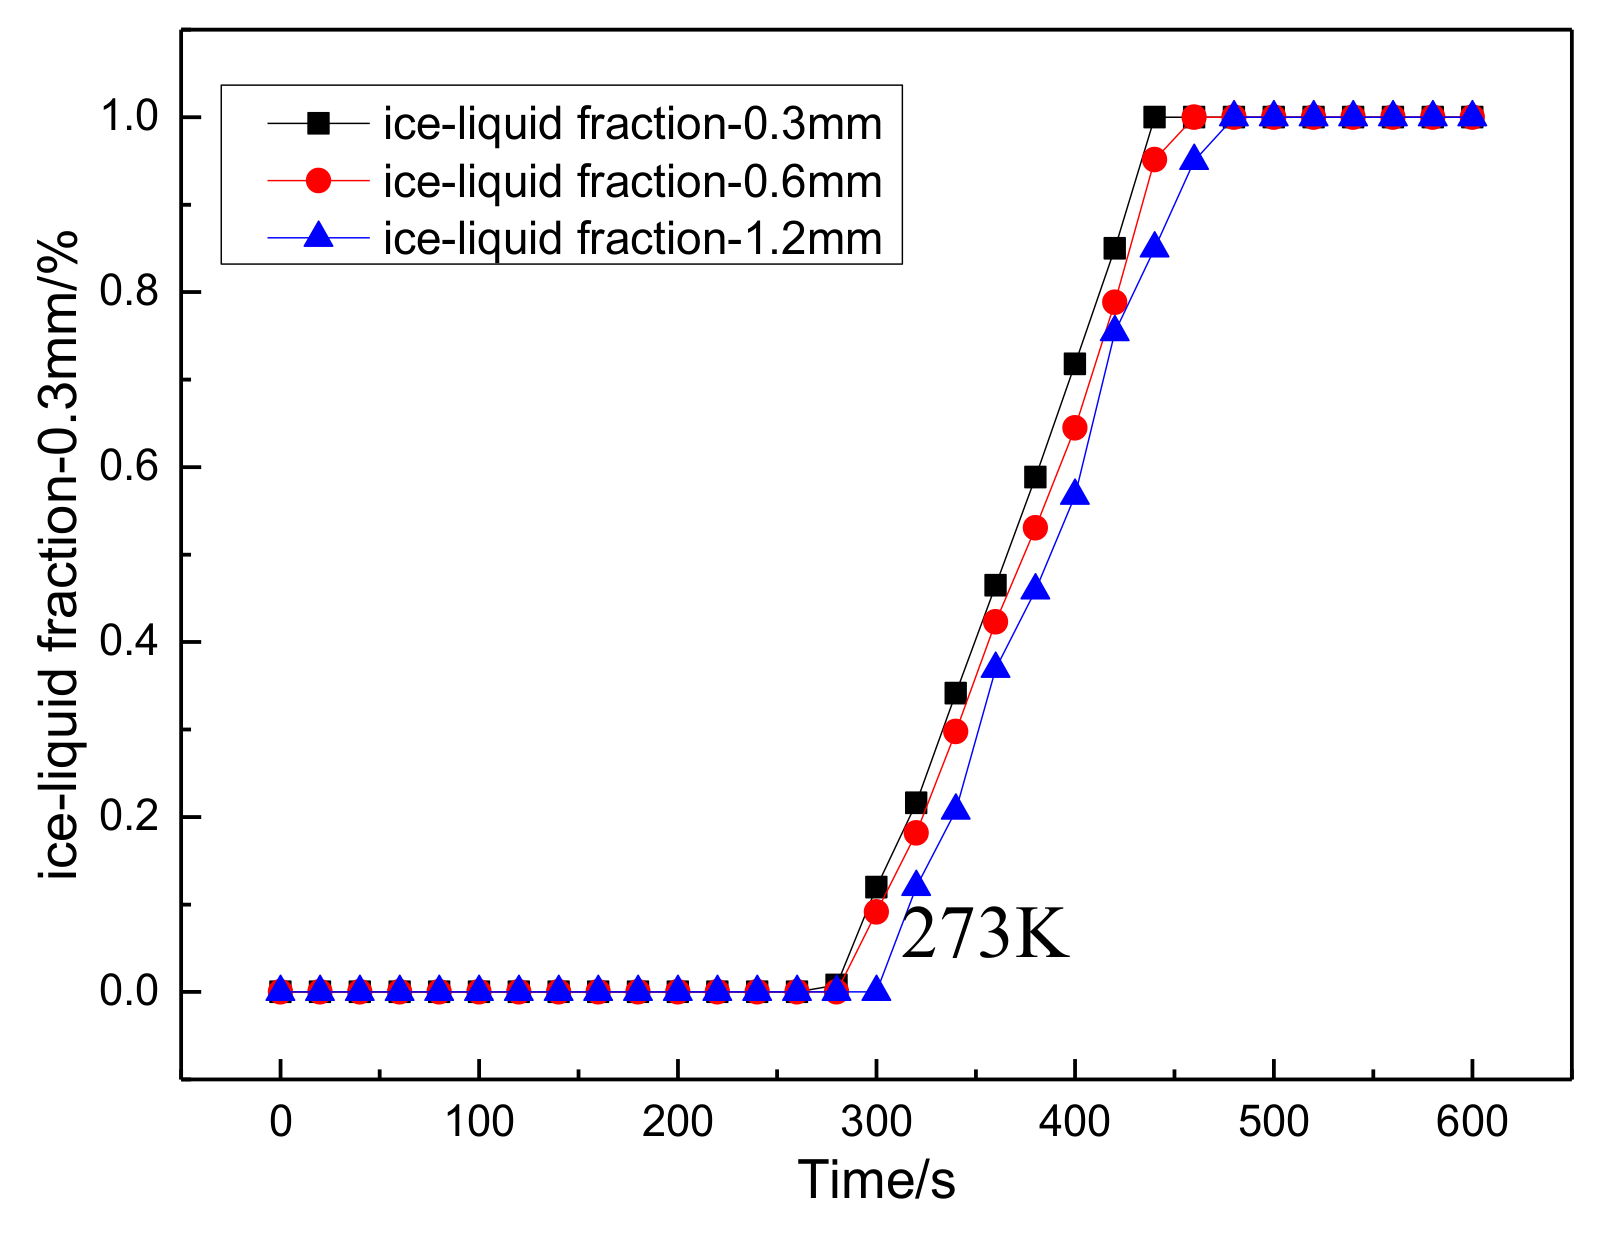
Figure 24.
The fuel cell temperature contours with pore diameter = 0.3 mm at different times; (a) t = 28 s, (b) t = 40 s, (c) t = 44 s.
Figure 24.
The fuel cell temperature contours with pore diameter = 0.3 mm at different times; (a) t = 28 s, (b) t = 40 s, (c) t = 44 s.
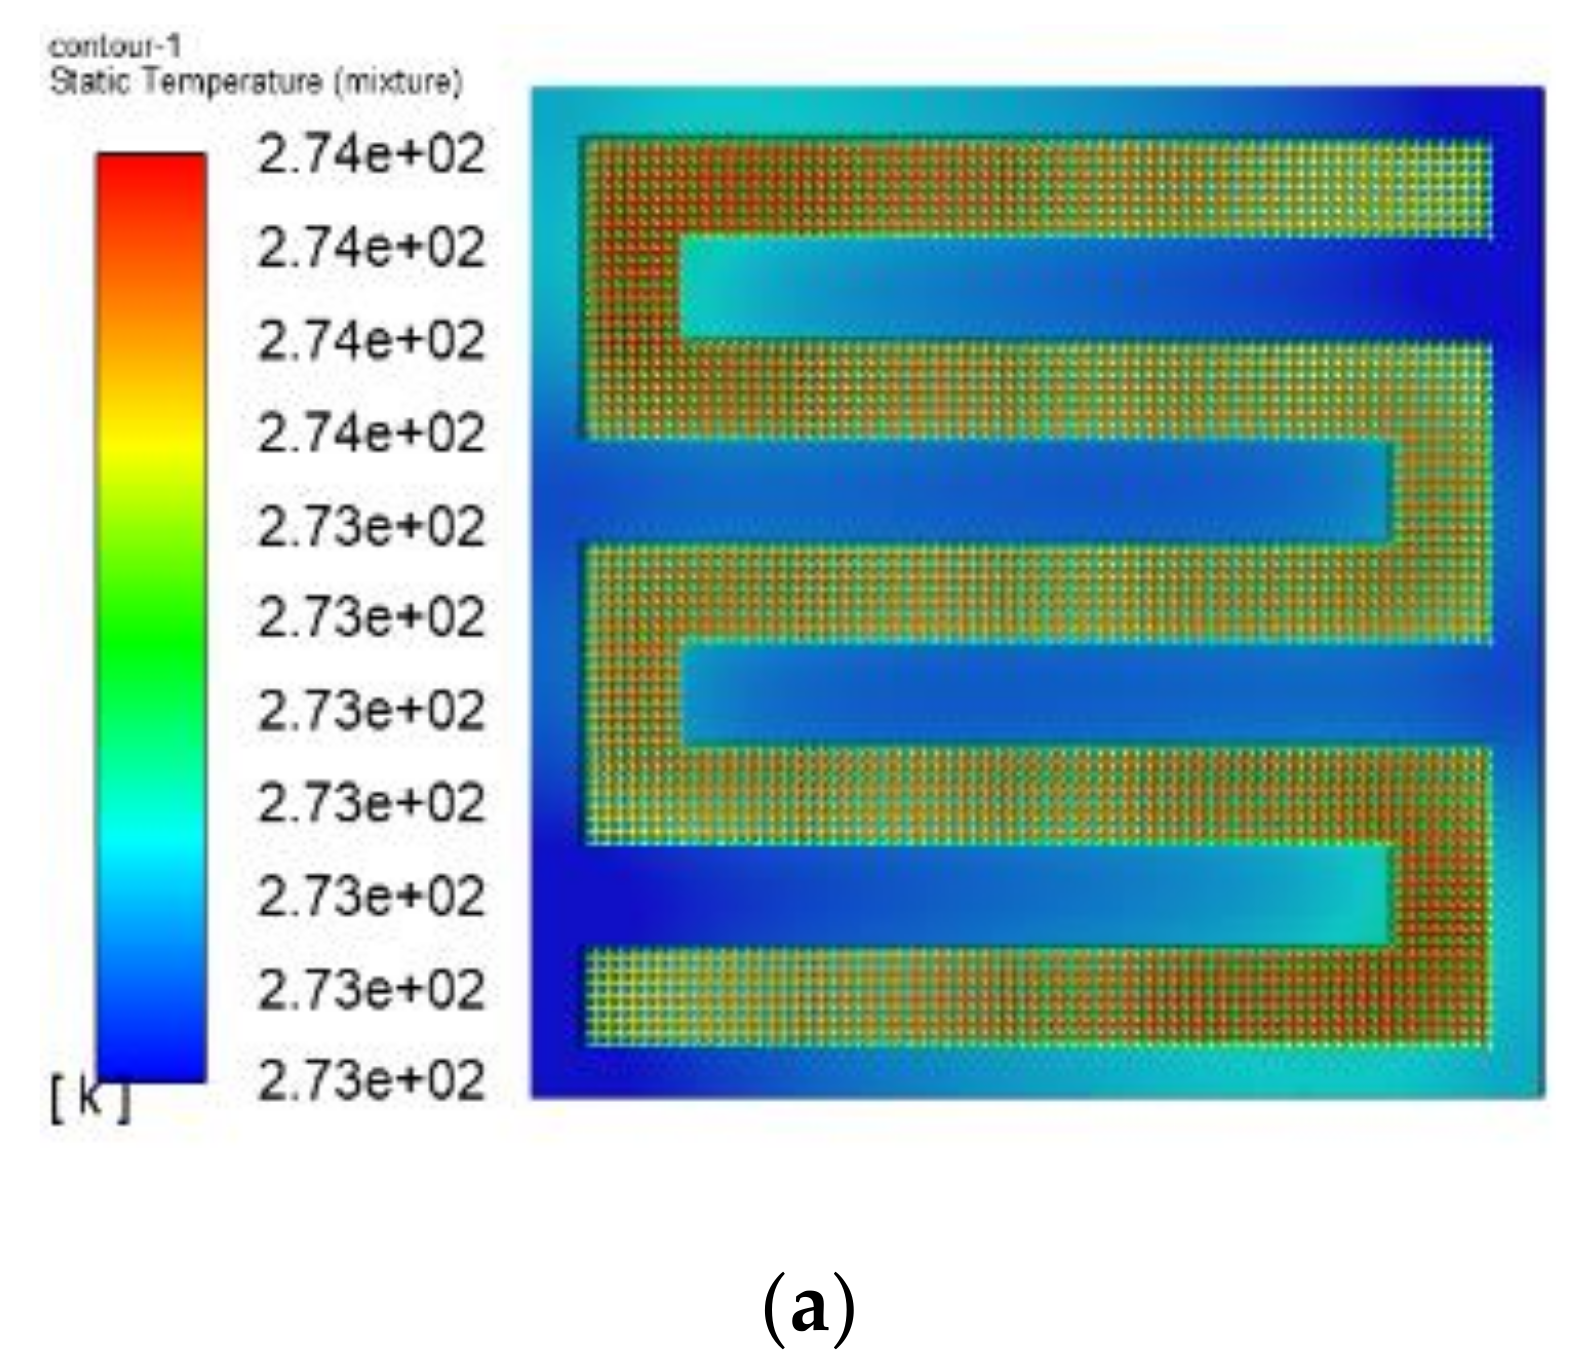
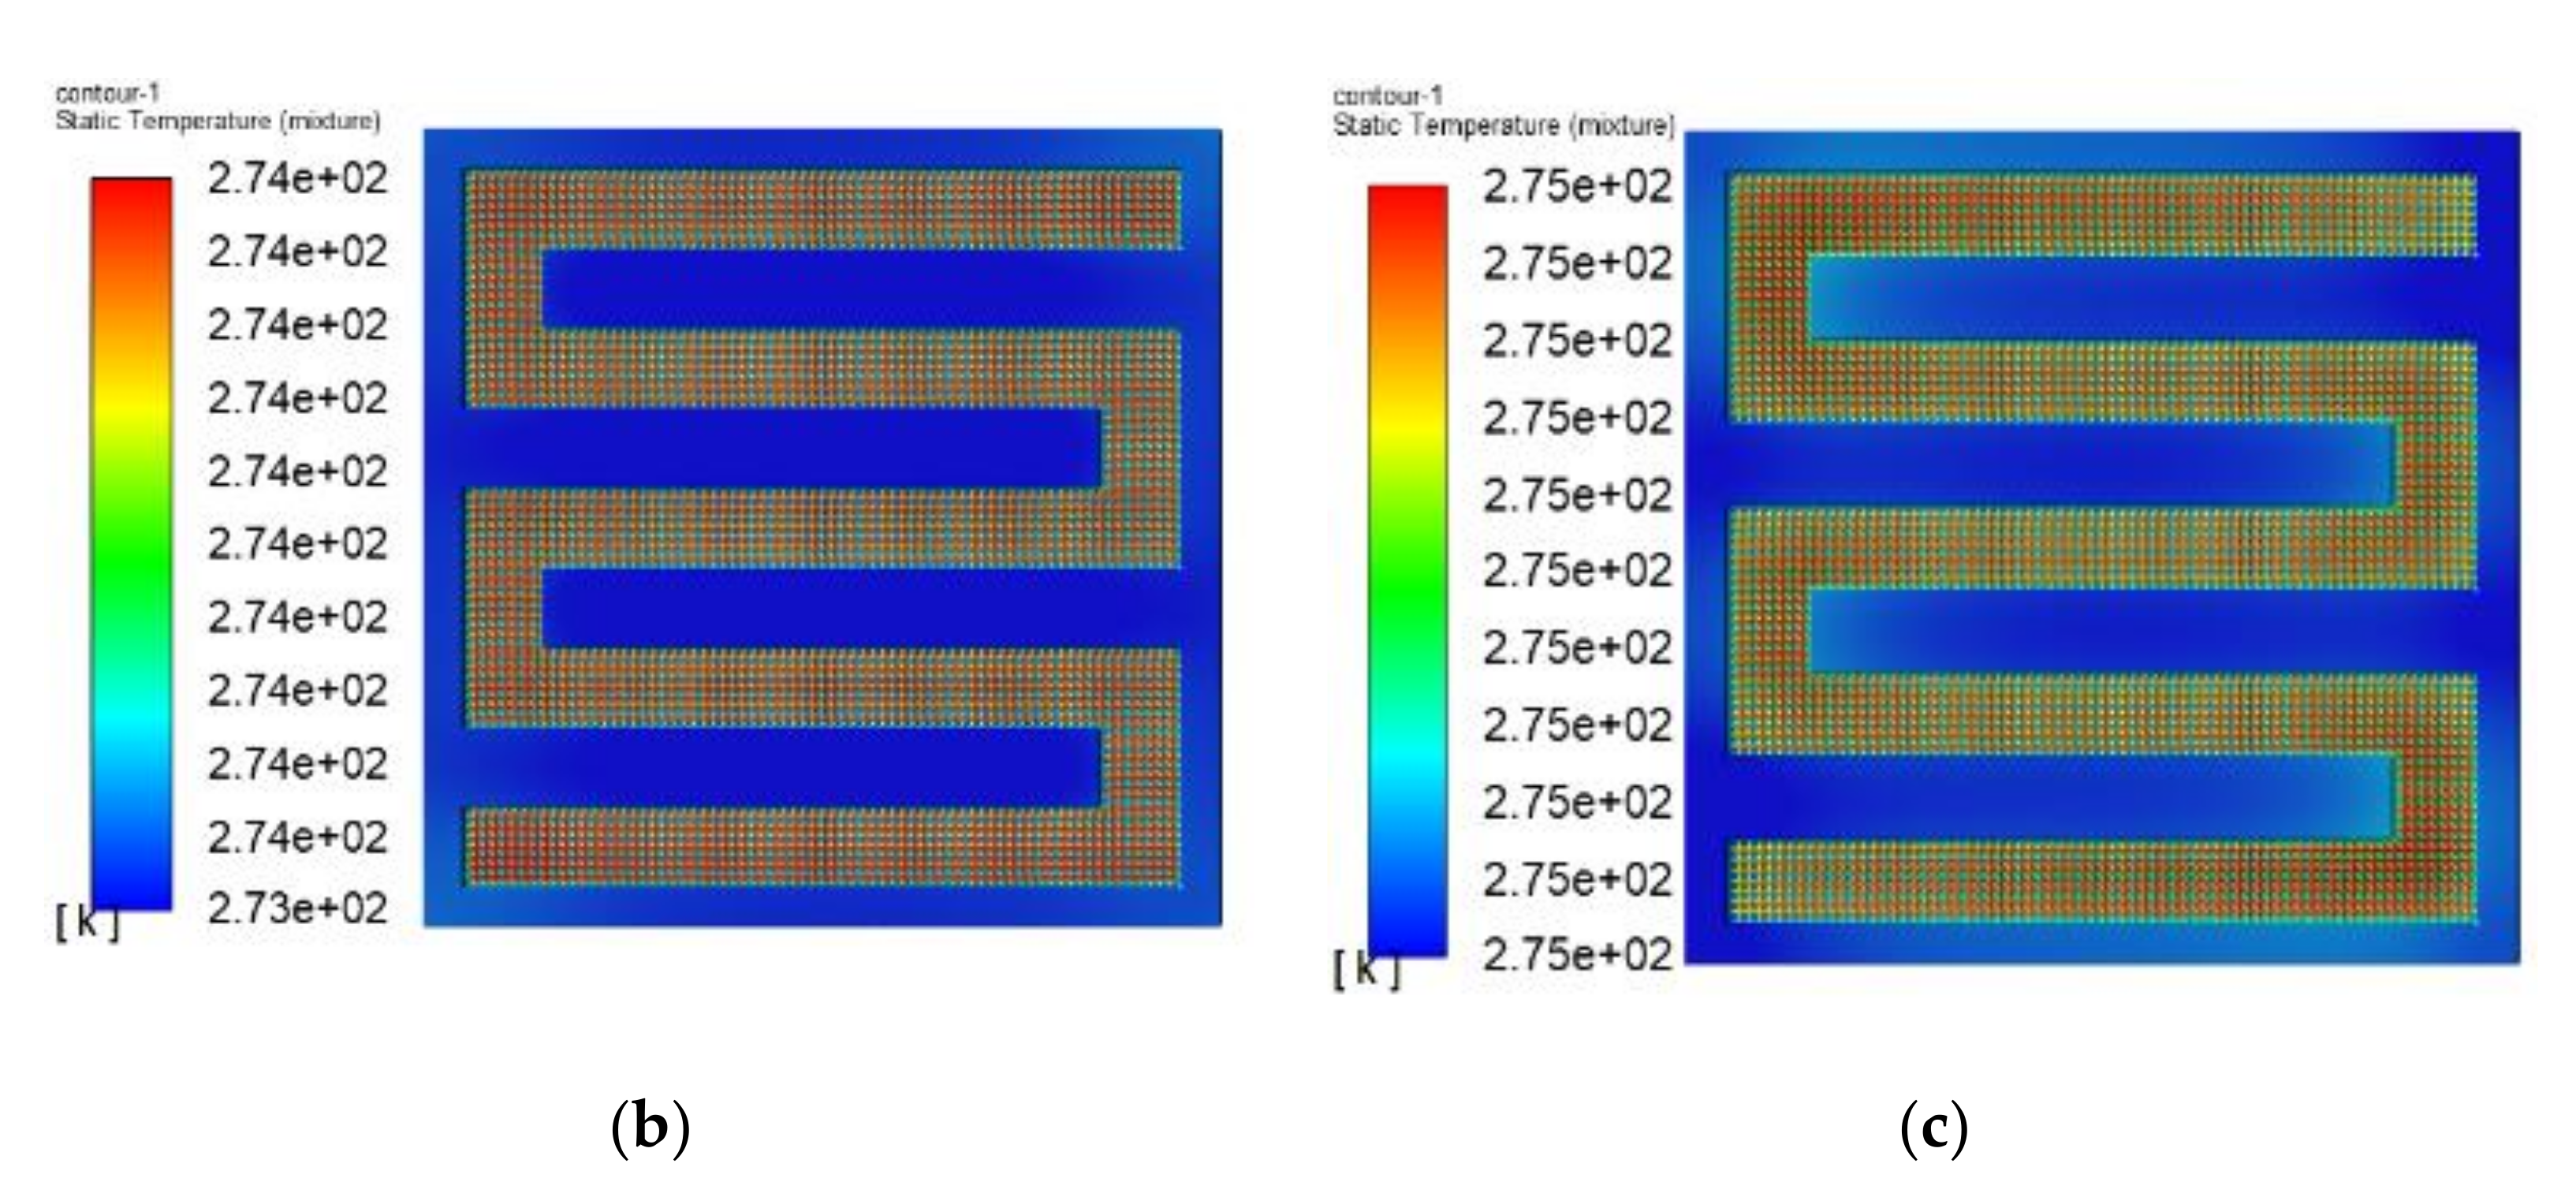
Figure 25.
The fuel cell temperature contours with pore diameter = 0.6 mm at different times; (a) t = 30 s, (b) t = 38 s, (c) t = 46 s.
Figure 25.
The fuel cell temperature contours with pore diameter = 0.6 mm at different times; (a) t = 30 s, (b) t = 38 s, (c) t = 46 s.
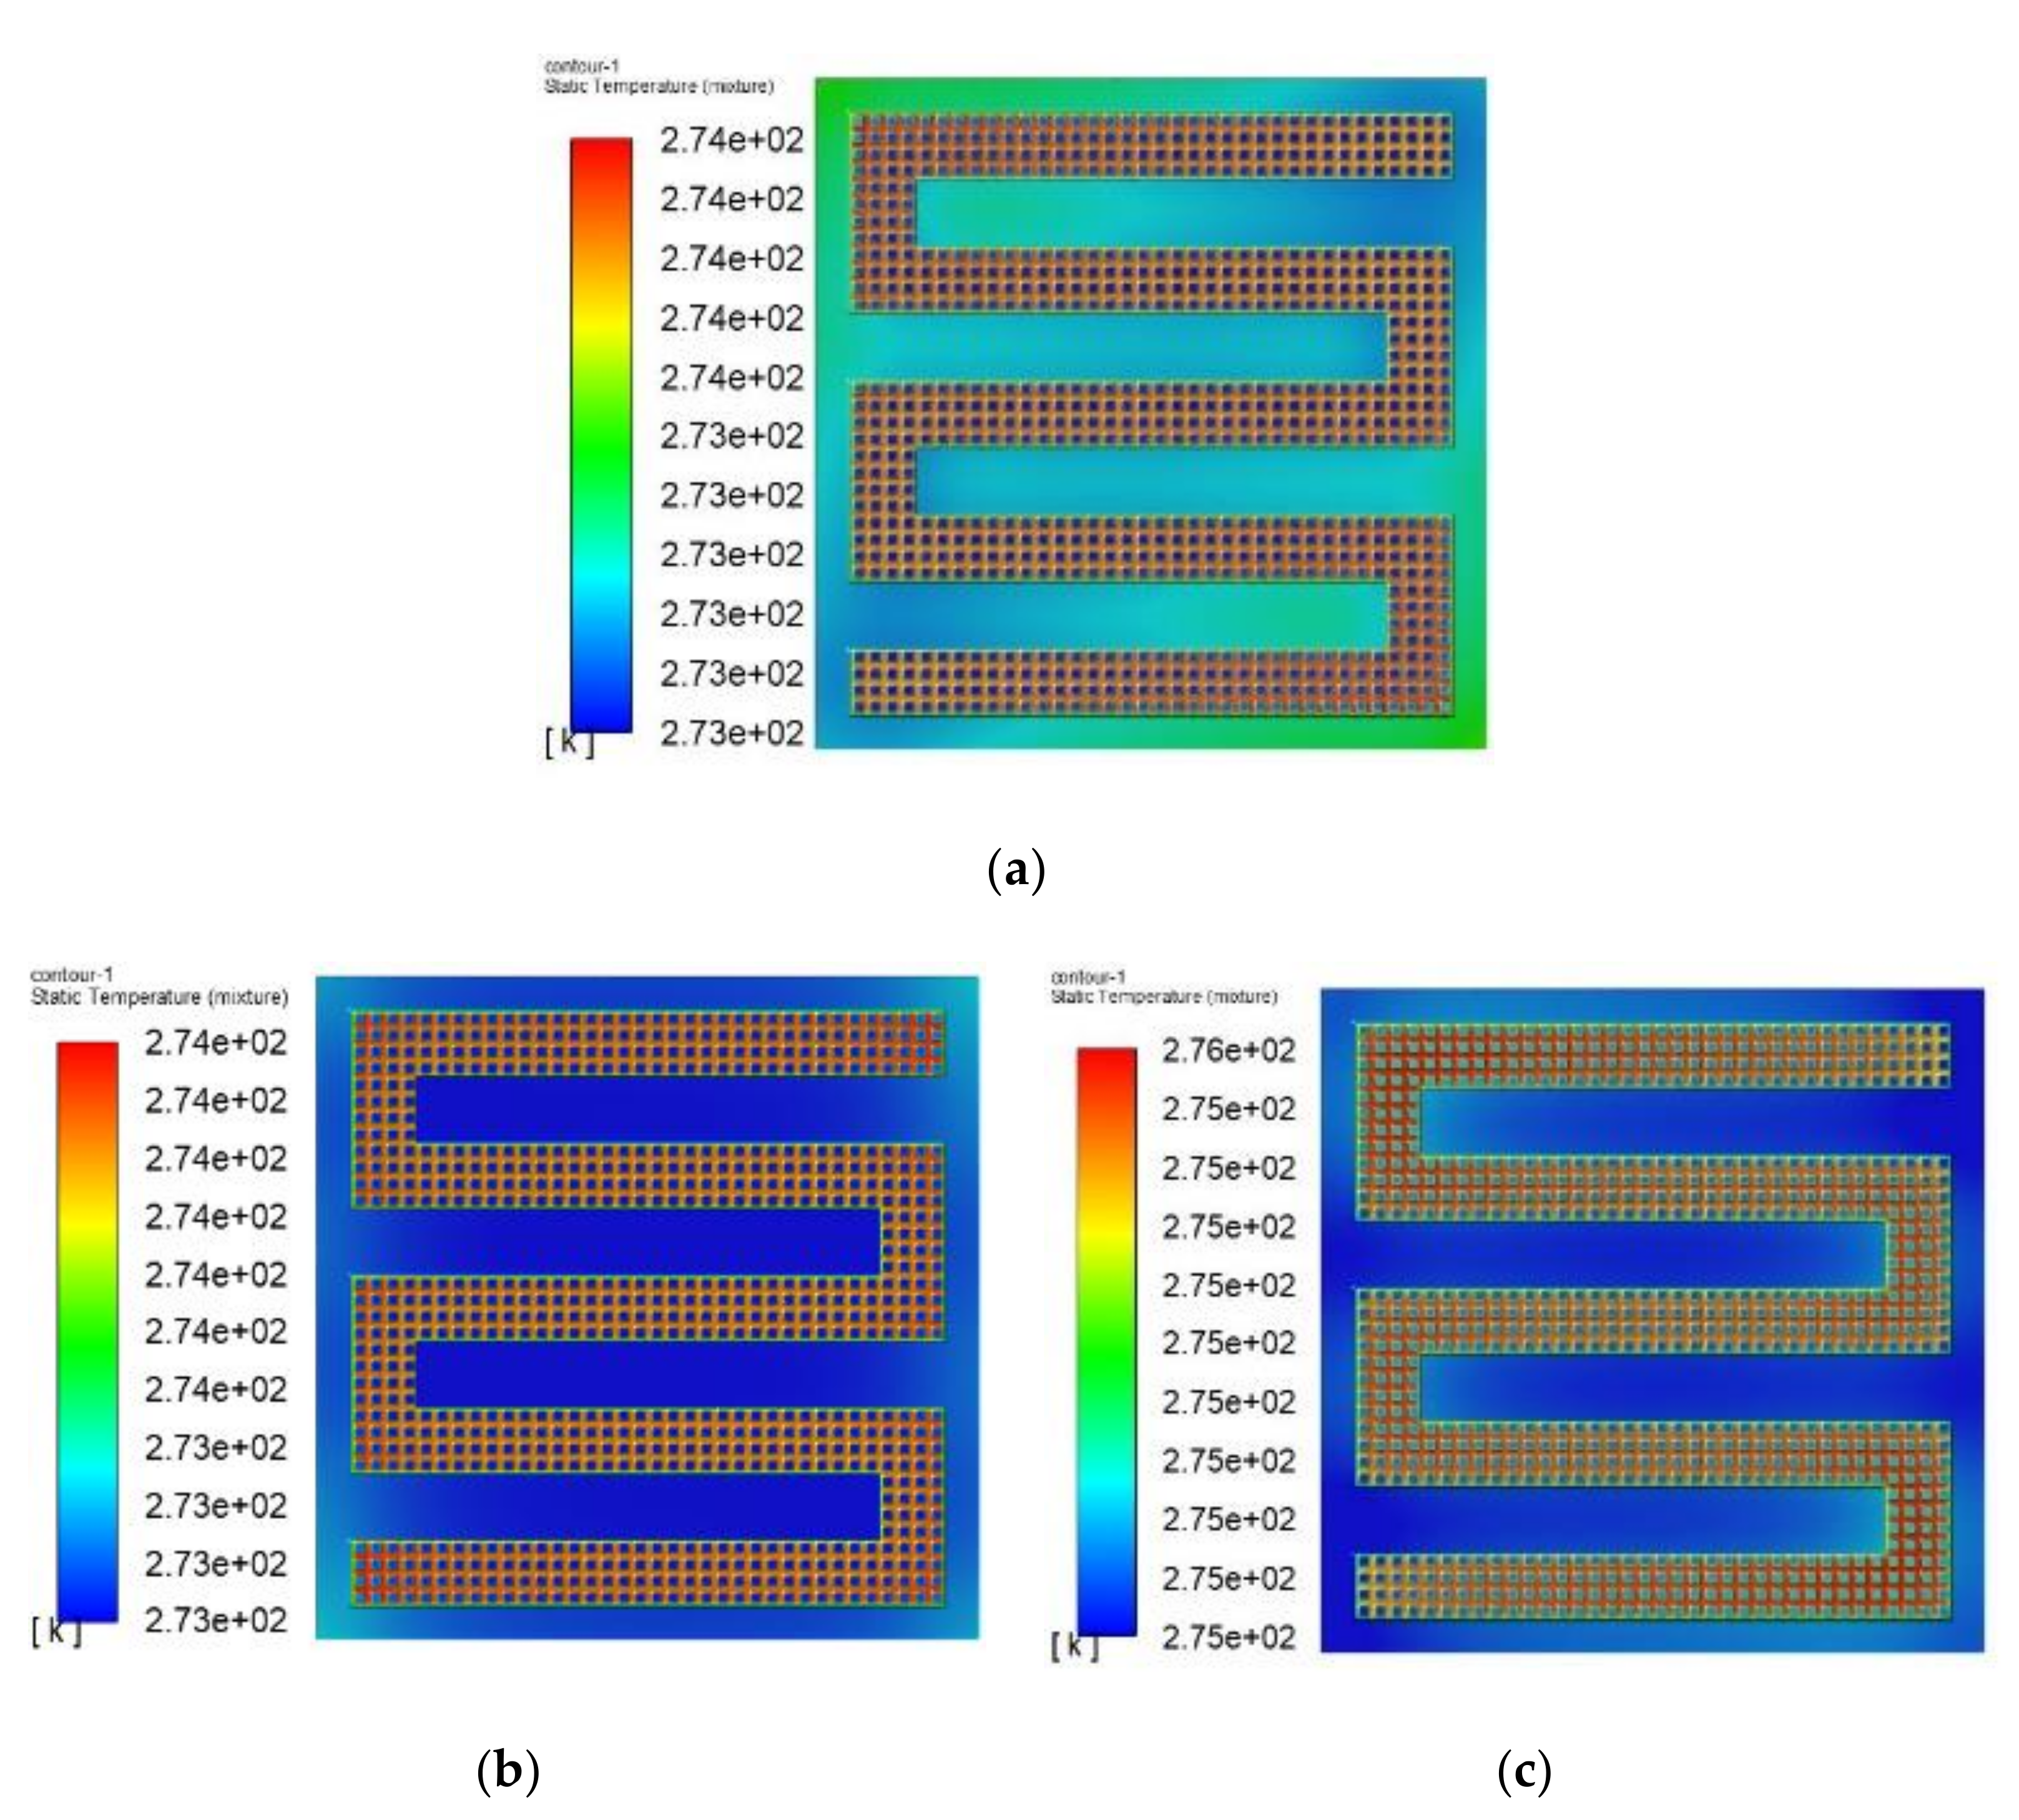
Figure 26.
The fuel cell temperature contours with pore diameter = 1.2 mm at different times; (a) t = 32 s, (b) t = 42 s, (c) t = 48 s.
Figure 26.
The fuel cell temperature contours with pore diameter = 1.2 mm at different times; (a) t = 32 s, (b) t = 42 s, (c) t = 48 s.
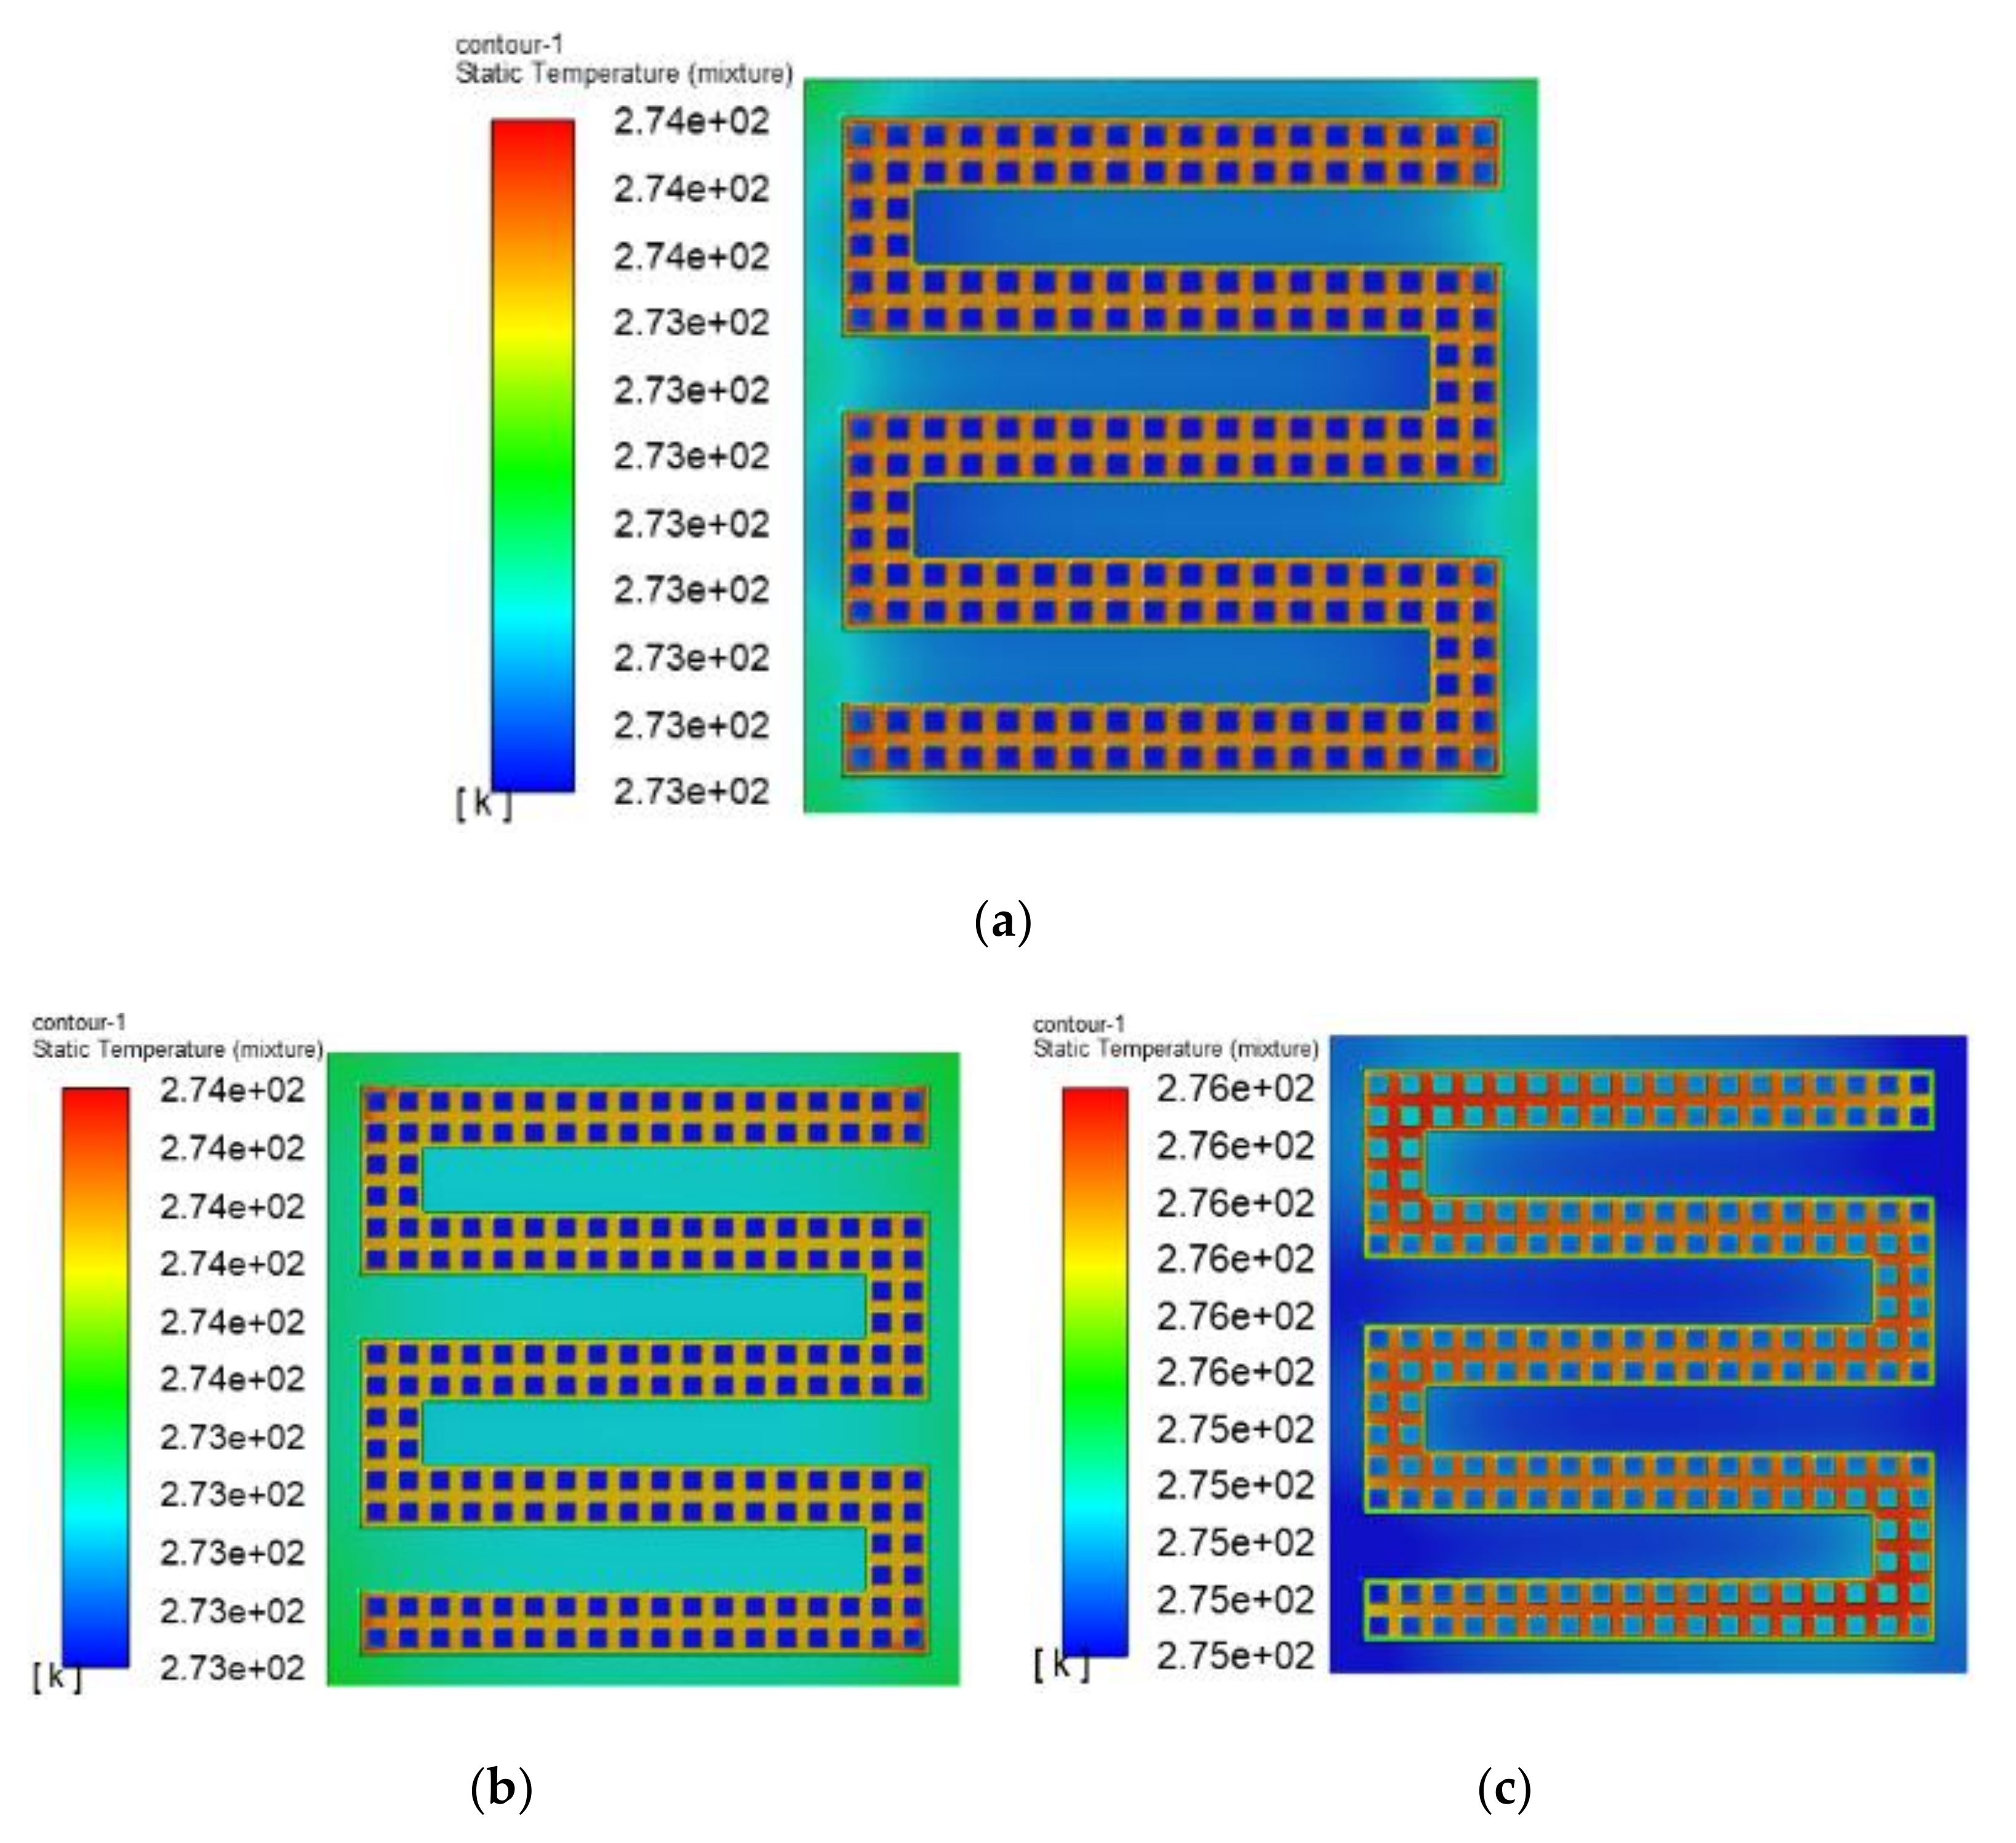
Figure 27.
The fuel cell temperature contours with pore diameter = 0.3 mm at different times; (a) t = 28 s, (b) t = 40 s, (c) t = 44 s.
Figure 27.
The fuel cell temperature contours with pore diameter = 0.3 mm at different times; (a) t = 28 s, (b) t = 40 s, (c) t = 44 s.
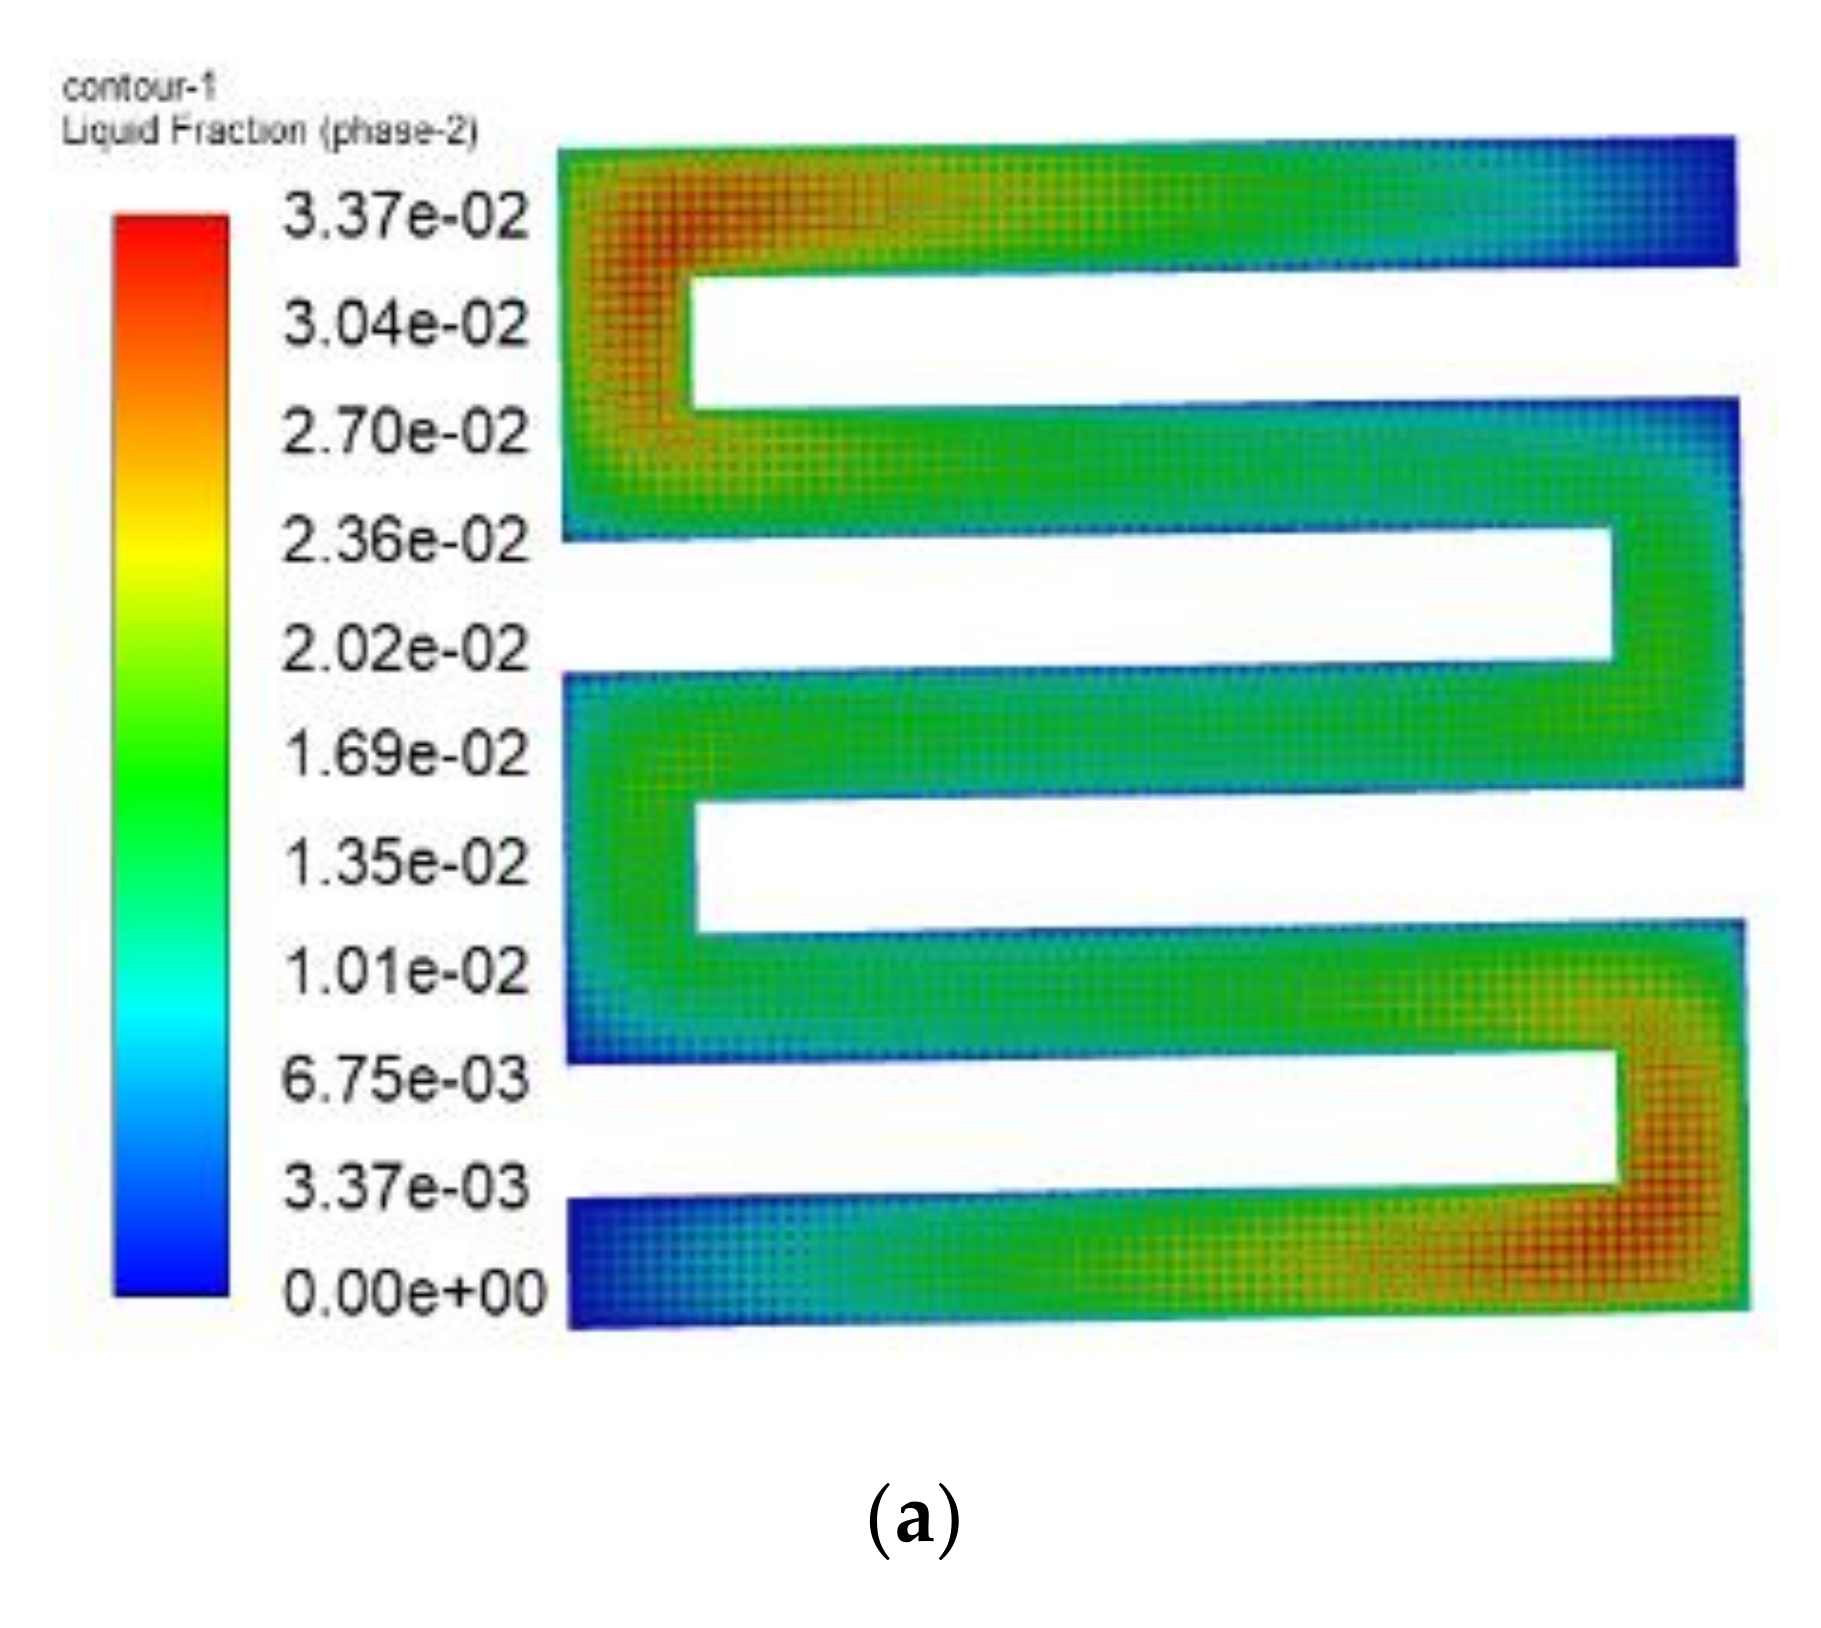
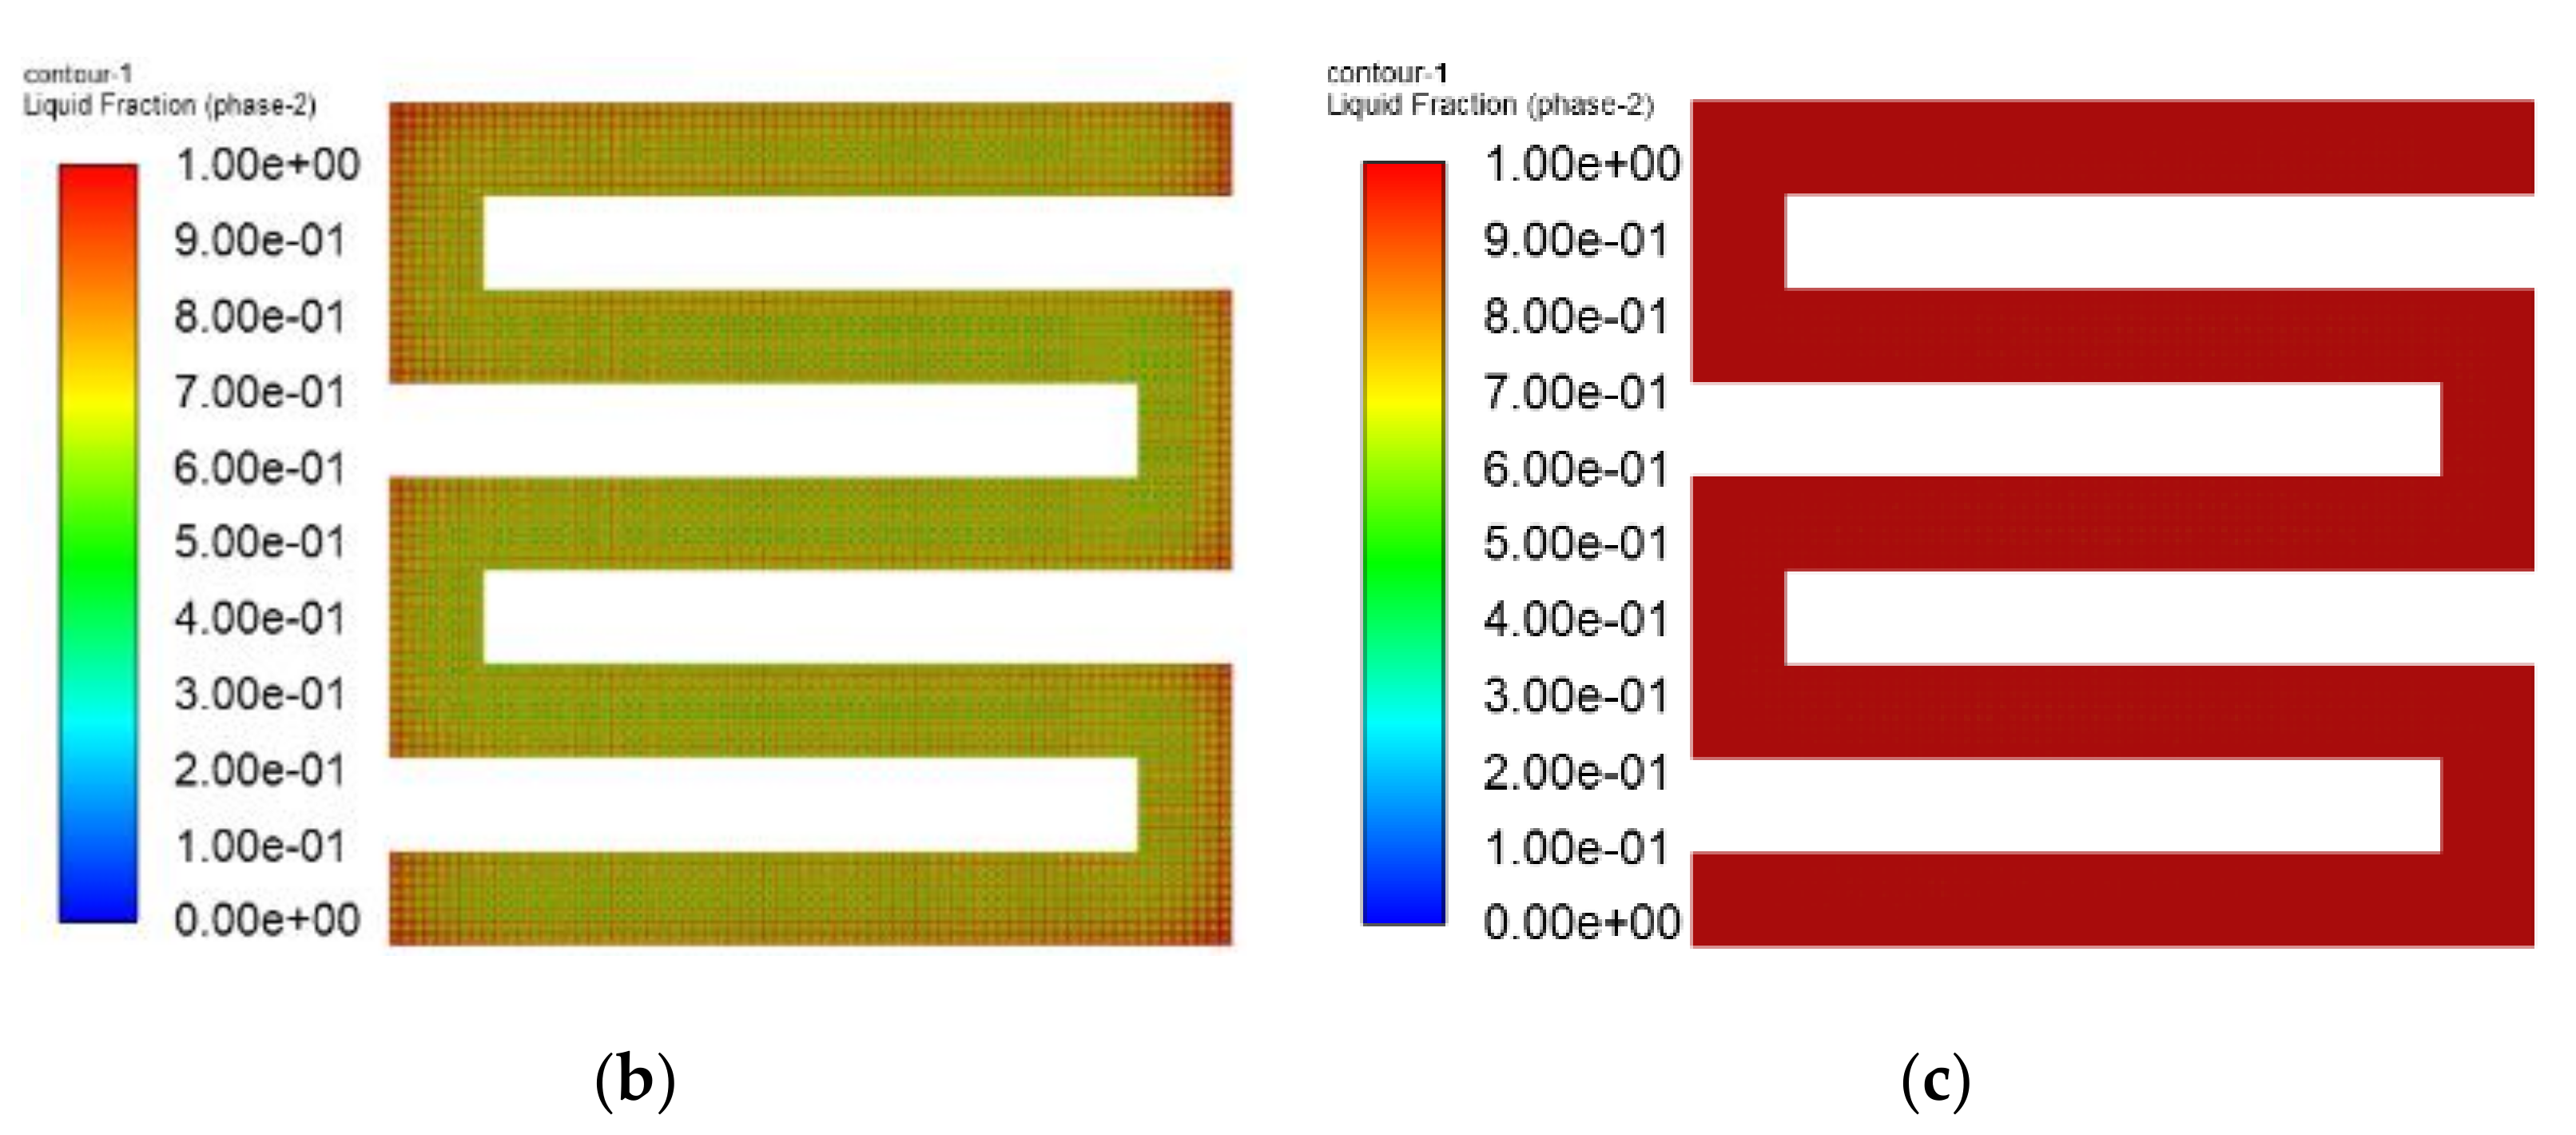
Figure 28.
The fuel cell temperature contours with pore diameter = 0.6 mm at different times; (a) t = 30 s, (b) t = 38 s, (c) t = 46 s.
Figure 28.
The fuel cell temperature contours with pore diameter = 0.6 mm at different times; (a) t = 30 s, (b) t = 38 s, (c) t = 46 s.
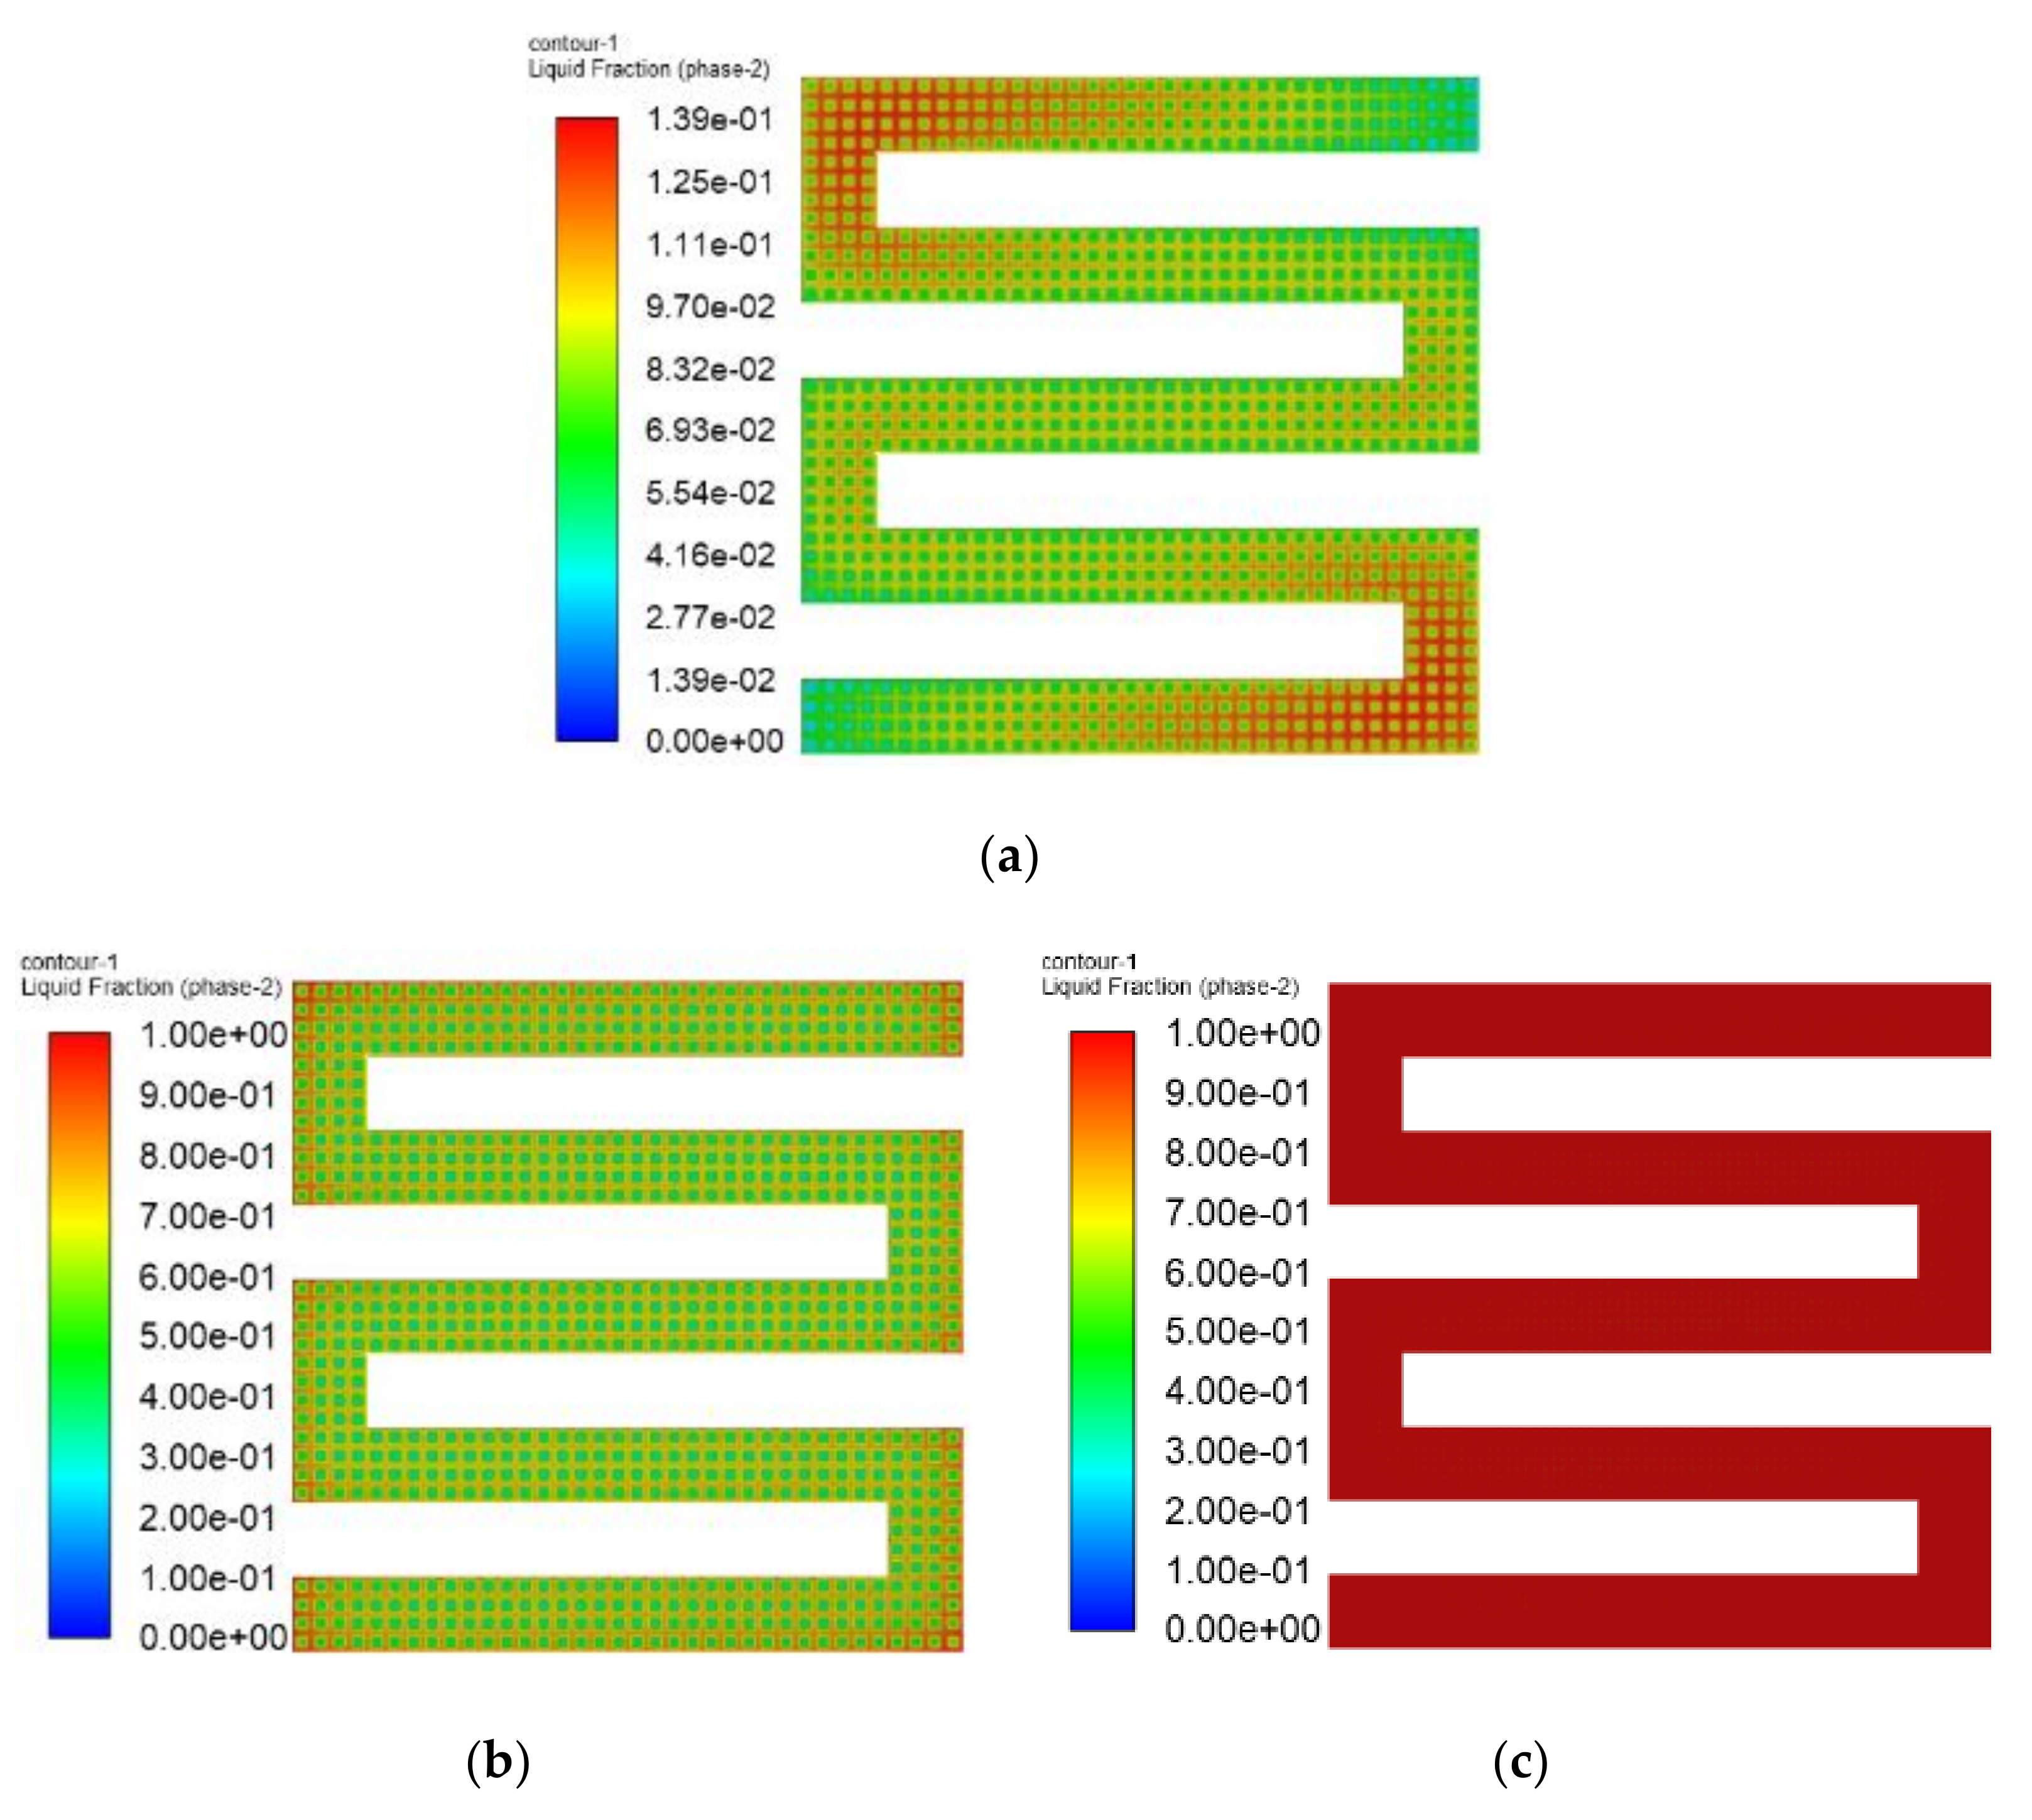
Figure 29.
The fuel cell temperature contours with pore diameter = 1.2 mm at different times; (a) t = 32 s, (b) t = 42 s, (c) t = 48 s.
Figure 29.
The fuel cell temperature contours with pore diameter = 1.2 mm at different times; (a) t = 32 s, (b) t = 42 s, (c) t = 48 s.
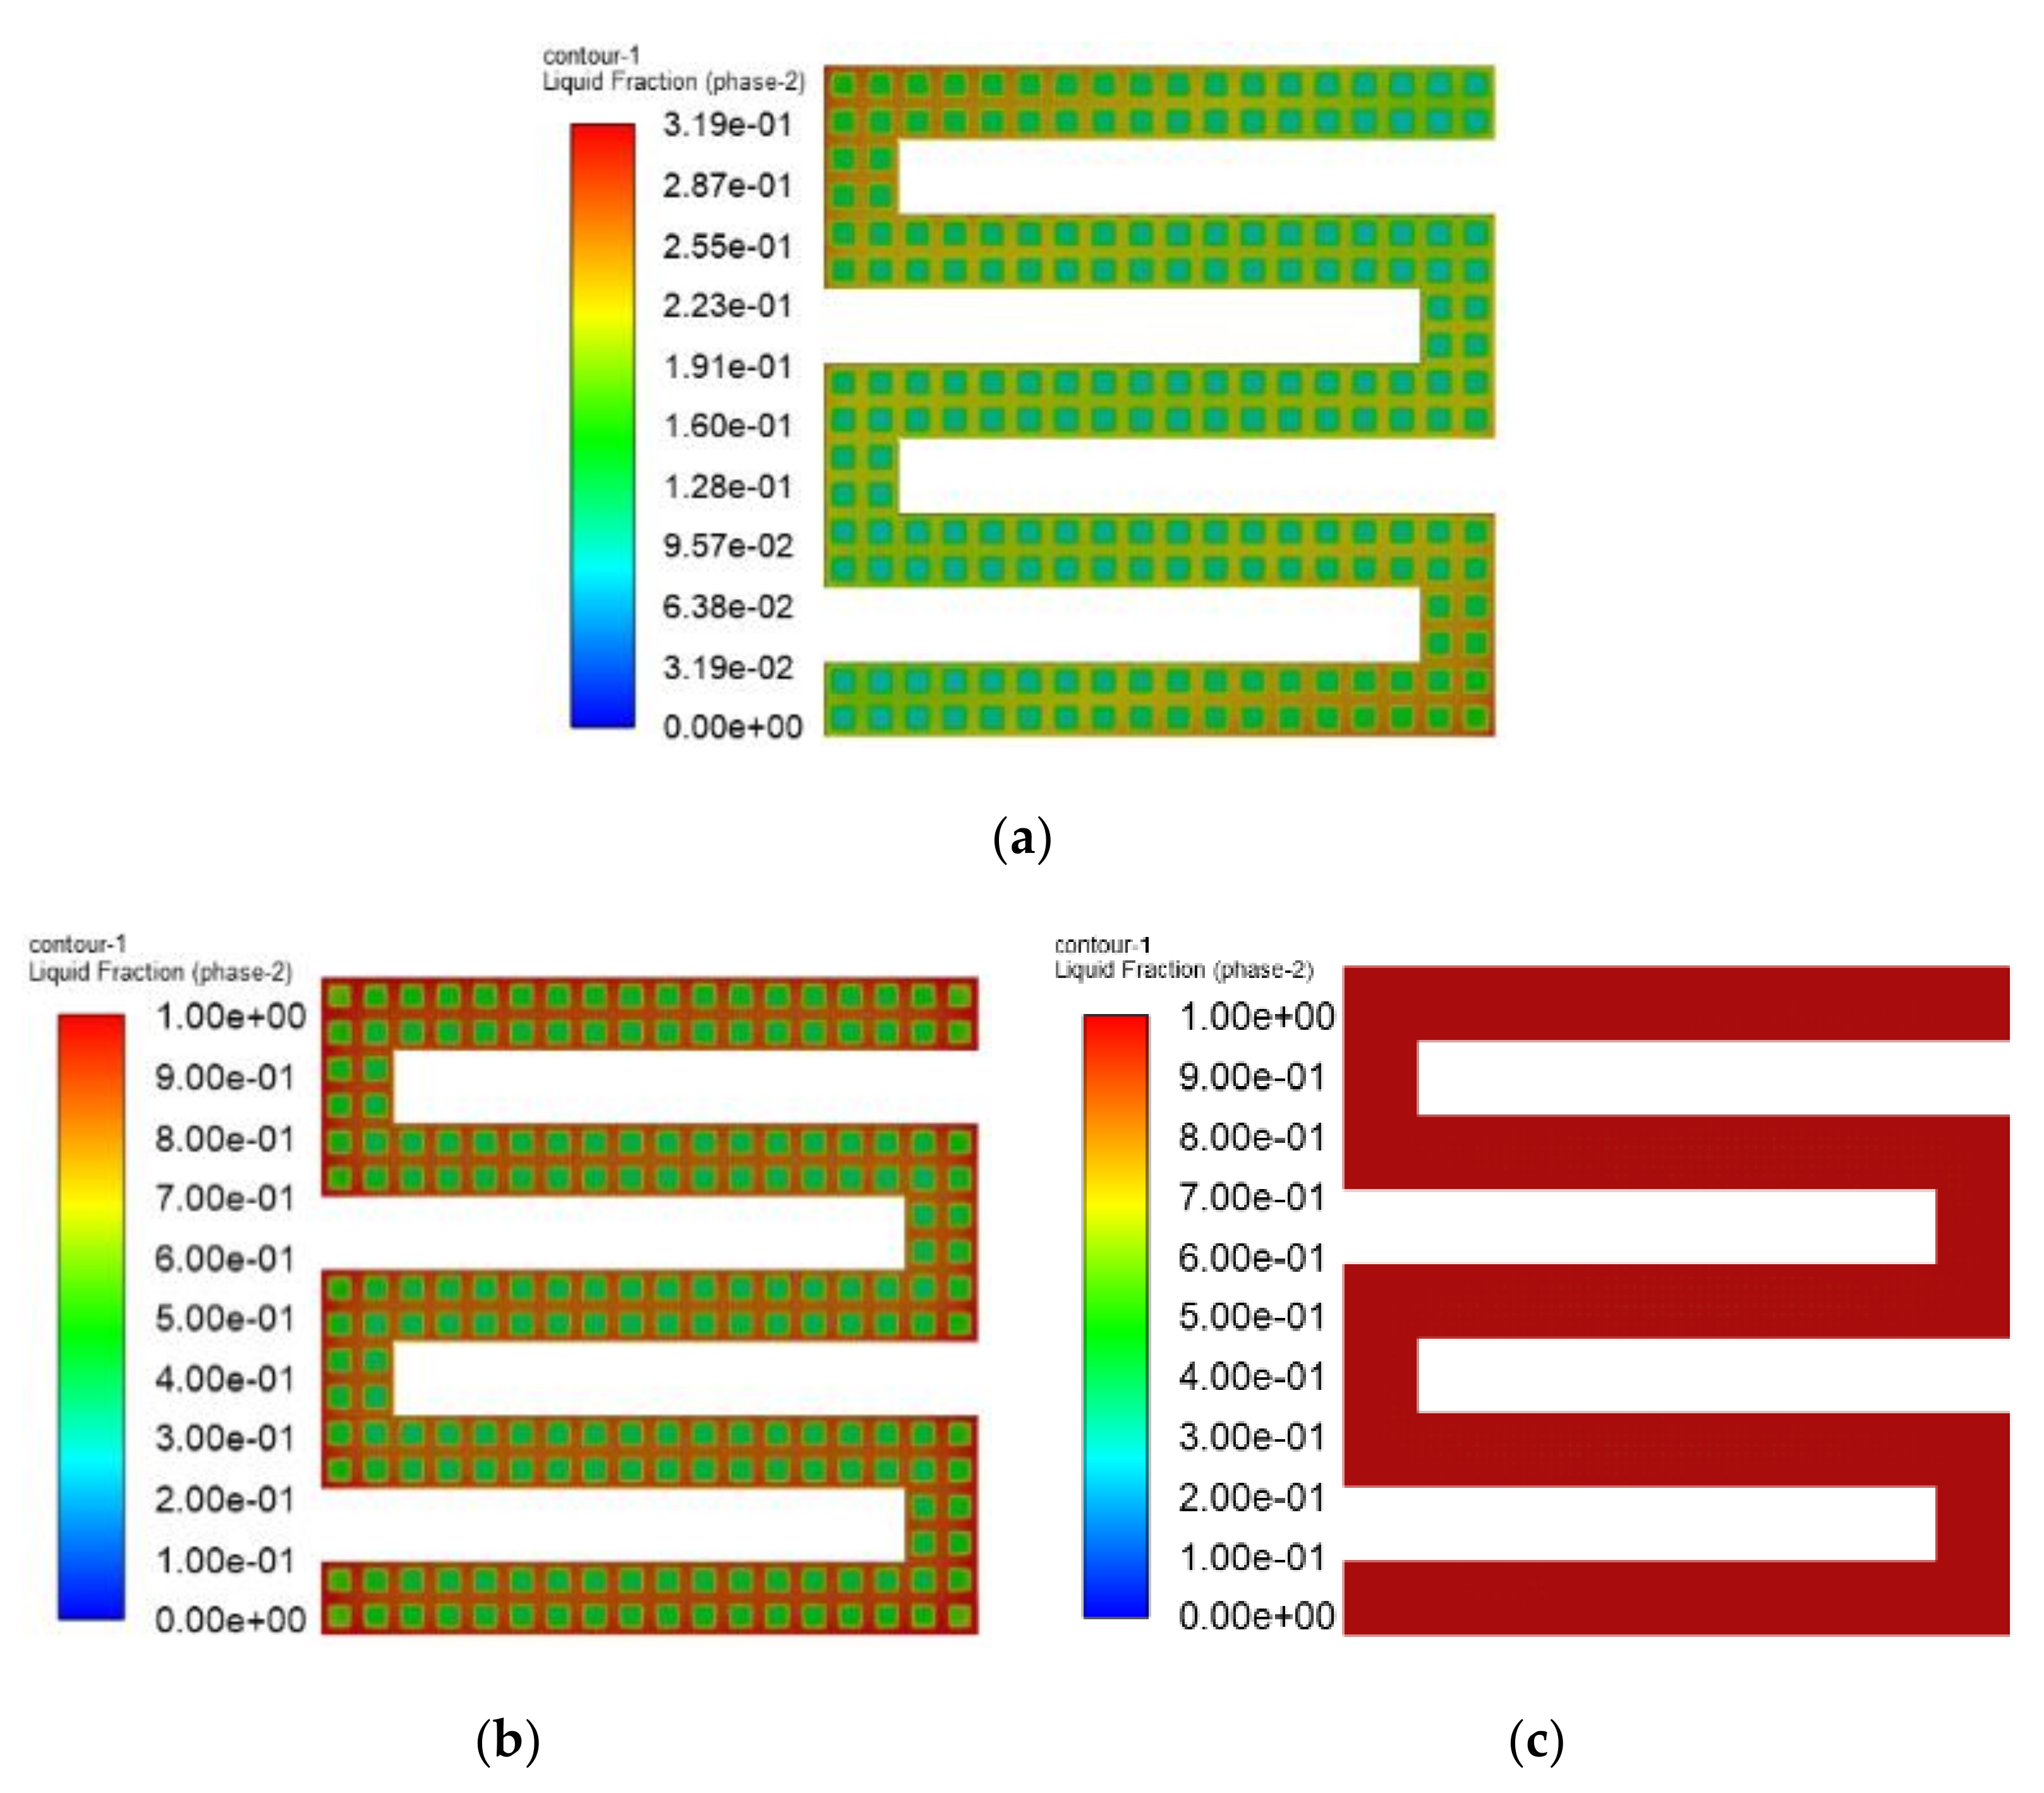
Table 1.
The structure dimensions and material parameters [34].
Table 1.
The structure dimensions and material parameters [34].
| Material | Parameters | Material | Parameters |
|---|---|---|---|
| Density of GDL/(kg. m−3) | 2200 | Density of PEM/(kg. m−3) | 1980 |
| Specific heat capacity of GDL/(J.kg−1. K−1) | 1050 | Specific heat capacity of PEM/(J.kg−1. K−1) | 1050 |
| Thermal conductivity of GDL/(W.m−1. K−1) | 1.5 | Thermal conductivity of PEM/(W.m−1. K−1) | 1.5/0.95 |
| Porosity of GDL | 0.5 | Porosity of PEM | 0.1 |
| Densities of BP, GFC/(kg. m−3) | 1900 | Density of CL/(kg. m−3) | 2000 |
| Specific heat capacities of BP, GFC/(J.kg−1. K−1) | 710 | Specific heat capacity of CL/(J.kg−1. K−1) | 833 |
| Thermal conductivities of BP, GFC/(W.m−1. K−1) | 20 | Thermal conductivity of CL/(W.m−1. K−1) | 1.2 |
| Density of water/(kg. m−3) | 998.2 | Reference temperature of liquid water/K | 298 |
| Specific heat capacity of liquid water/(J.kg−1. K−1) | 4182 | Reference enthalpy of liquid water/(J. kg−1. mol−1) | −2.858 × 10⁸ |
| Thermal conductivity of liquid water/(W.m−1. K−1) | 0.6 | Melting heat/(J.kg−1) | 334,000 |
| Solidus of liquid water/K | 273.15 | Liquidus of liquid water/K | 273.15 |
| Material | Dimension | Material | Dimension |
| GDL (mm × mm) | 70 × 0.15 | PEM (mm × mm) | 70 × 0.3 |
| BP,GFC (mm × mm) | 70 × 0.8 | CL (mm × mm) | 70 × 0.15 |
| ICE (mm × mm) | 50 × 0.1 | ETF (mm × mm) | 70 × 0.1 |
© 2020 by the authors. Licensee MDPI, Basel, Switzerland. This article is an open access article distributed under the terms and conditions of the Creative Commons Attribution (CC BY) license (http://creativecommons.org/licenses/by/4.0/).
Share and Cite
MDPI and ACS Style
Jiang, W.; Song, K.; Zheng, B.; Xu, Y.; Fang, R. Study on Fast Cold Start-Up Method of Proton Exchange Membrane Fuel Cell Based on Electric Heating Technology. Energies 2020, 13, 4456. https://doi.org/10.3390/en13174456
AMA Style
Jiang W, Song K, Zheng B, Xu Y, Fang R. Study on Fast Cold Start-Up Method of Proton Exchange Membrane Fuel Cell Based on Electric Heating Technology. Energies. 2020; 13(17):4456. https://doi.org/10.3390/en13174456
Chicago/Turabian StyleJiang, Wei, Ke Song, Bailin Zheng, Yongchuan Xu, and Ruoshi Fang. 2020. "Study on Fast Cold Start-Up Method of Proton Exchange Membrane Fuel Cell Based on Electric Heating Technology" Energies 13, no. 17: 4456. https://doi.org/10.3390/en13174456
Note that from the first issue of 2016, this journal uses article numbers instead of page numbers. See further details here.