Evaluation of Phase Imbalance Compensation for Mitigating DFIG-Series Capacitor Interaction


1
System Operations, TenneT TSO B.V., 6800 AS Arnhem, The Netherlands
2
Electrical Sustainable Energy, Delft University of Technology, 2628 CD Delft, The Netherlands
*
Author to whom correspondence should be addressed.
Energies 2020, 13(17), 4512; https://doi.org/10.3390/en13174512
Submission received: 3 July 2020
/
Revised: 26 July 2020
/
Accepted: 19 August 2020
/
Published: 1 September 2020
(This article belongs to the Special Issue Hybrid AC/DC Transmission Grids)
Abstract
:The phase imbalance compensation concept is proposed in literature as an alternative way to mitigate classical subsynchronous resonance (SSR) problems in series-compensated transmission lines. However, a fundamental analysis to determine this concept’s ability to mitigate resonances between a doubly-fed induction generator (DFIG) and a series compensated transmission line, i.e., DFIG-SSR, is not reported in literature. Therefore, the objective of this paper is to investigate to which extent phase imbalance compensation is able to mitigate DFIG-SSR. For the phase imbalance compensation scheme, an analytical model that captures the relation between the level of series compensation, the degree of asymmetry between the compensated phases, and the resulting shift in resonance frequency is developed and validated using time domain simulations. Then, an optimisation framework is developed to search for an adequate level of compensation asymmetry, capable of mitigating the adverse interactions. The optimisation allows us to show that, even with the best set of parameters, phase imbalance compensation is not suitable for mitigating DFIG-SSR. The analytical model enables us to explain the underlying physical reasons for this and an attempt is made to explain why this concept is theoretically able to mitigate classical resonance issues. Lastly, directions for future research are identified.
1. Introduction
The sub-synchronous resonance (SSR) between a doubly fed induction generator (DFIG) and a series capacitor is a form of self-excitation and is defined as DFIG-SSR in Reference [1]. This phenomenon was observed in a practical power system for the first time in 2009, where the interactions between a DFIG-based wind farm and a series compensation transmission line in the power system of Texas resulted in a system disturbance [2]. It is worth noting, however, that the theoretical analysis presented in Reference [3] already illustrated the possibility of such adverse interactions in 2003. The DFIG’s impedance can be used to explain the fundamentals of the DFIG-SSR phenomenon. This impedance is formed by the rotor side impedance and the grid side impedance . The impedances of the induction machine and the rotor side converter (RSC) determine the equivalent impedance . On the other hand, is formed by the impedances of the filter and the grid side converter (GSC). Both impedances and are connected in parallel during normal operation [4,5], where the decoupling between the controls of the RSC and GSC is achieved by means of the dc-link. Since practical DFIGs generally have a large , the impedance of the DFIG, , can then be approximated by [5,6,7]. A negative slip, which occurs at sub-synchronous frequencies, will lead to a negative resistance of the DFIG, as viewed from the machine’s stator terminals. When this negative resistance is greater than the resistance provided by the remaining part of the transmission system, existing electromagnetic oscillations can be amplified and grow rapidly. This phenomenon is known as DFIG-SSR.
In Reference [1], the authors presented a critical review of the existing mitigation solutions for DFIG-SSR. In this review, the solutions were categorised in control solutions, hardware solutions, and solutions based on system level coordination. This paper builds further on that classification and aims to evaluate the effectiveness of the phase imbalance compensation (i.e., a potential hardware solution) in mitigating DFIG-SSR. Fixed series compensation is used to increase the transfer capability of a transmission line and can be achieved by using the classical series compensation concept or the phase imbalance compensation (PIC) concept. Compared to the classical series compensation concept, the phase imbalance concept implements an asymmetrical compensation throughout the three phases. This paper focuses on whether the latter can be used for mitigating DFIG-SSR.
DFIG-SSR can be mitigated by increasing the damping (e.g., by means of altered DFIG controller parameters), or by weakening the rotating magnetomotive force (MMF) produced by subsynchronous currents in the armature. The PIC concept was initially developed to mitigate classical SSR using the second method and was initially proposed in Reference [8] with a theoretical case study presented in Reference [9]. The use of the phase imbalance concept for mitigating classical SSR is reported in Reference [10] and for damping inter-area oscillations in Reference [11].
Although briefly touched upon in Reference [12], the ability of the phase imbalance concept in mitigating DFIG-SSR is not yet studied in detail. The goal of this paper is to thoroughly investigate to which extent phase imbalance compensation is able to mitigate DFIG-SSR by weakening the rotating MMF produced by sub-synchronous currents in the armature. For this, first an analytical model that captures the relation between the level of series compensation, the degree of asymmetry between the compensated phases, and the resulting shift in resonance frequency is developed and validated. Next, an optimisation framework is developed to identify the most suitable degrees of asymmetry for mitigating DFIG-SSR. Lastly, to compare the performance of different cases, a performance index is also developed.
The rest of the paper is structured as follows. Section 2 gives a brief overview of the existing hardware solutions for mitigation DFIG-SSR. Section 3 reviews the fundamentals of classical series compensation and lays the basis for understanding the phase imbalance compensation concept. The phase imbalance compensation is introduced in Section 4. The derivation and validation of the analytical model as well as the performance of the imbalance compensation concept are also discussed in Section 4. Lastly, conclusions and directions for future work are discussed in Section 5.
2. Overview of Hardware Solutions for Mitigating DFIG-SSR
Solutions for mitigating DFIG-SSR can be based on (i) modifications in existing control algorithms of the DFIG (i.e., control solutions), (ii) installation of new hardware equipment or modification of existing hardware equipment (i.e., hardware solutions), and (iii) coordination between the power system state and existing or new controls (i.e., system level coordination) [1]. Control solutions are implemented in the power electronics interfaced device under consideration (in this case, the DFIG). Hardware solutions can be divided into flexible AC transmission systems (FACTS) and other methods based on voltage source converters (VSC). Solutions that fall in the category of system level coordination require some type of information from the power system, e.g., damping ratio or short circuit capacity level. Such information can be obtained from measurements or forecasts.
FACTS devices are used for a variety of reasons. An up-to-date overview of practical FACTS applications is given in Reference [13]. Compared to the fixed series capacitor, the thyristor controller series capacitor (TCSC) inherently prevents DFIG-SSR [14] and was used in Reference [15]. On the other hand, when the goal is to mitigate DFIG-SSR by means of any other FACTS device, it will have to be equipped with a supplementary damping controller (SDC). Several of such cases are reported in Reference [1]. Installing a FACTS device (except for TCSC) for mitigating DFIG-SSR is only cost-effective when additional power system support, such as voltage control, is required.
On the other hand, dedicated VSC-based solutions for mitigating DFIG-SSR are developed. A robust sub-synchronous damping controller is reported in Reference [16] and is planned to be commissioned in the Guyuan power system in China.
Lastly, when a battery energy storage system (BESS) includes an SDC, superior damping can be obtained. This is illustrated in Reference [17] for the mitigation of classical SSR. As was the case for the FACTS solutions, installing a BESS only for mitigating DFIG-SSR may not be the most optimum solution. On the other hand, when the BESS is also used to provide system services as reported in Reference [18], it could be a good alternative for more intrusive mitigation solutions.
Readers that are interested in the advantages and disadvantages of various solutions for mitigating DFIG-SSR are encouraged to read the comprehensive review given in Reference [1].
3. Classical Compensation Scheme
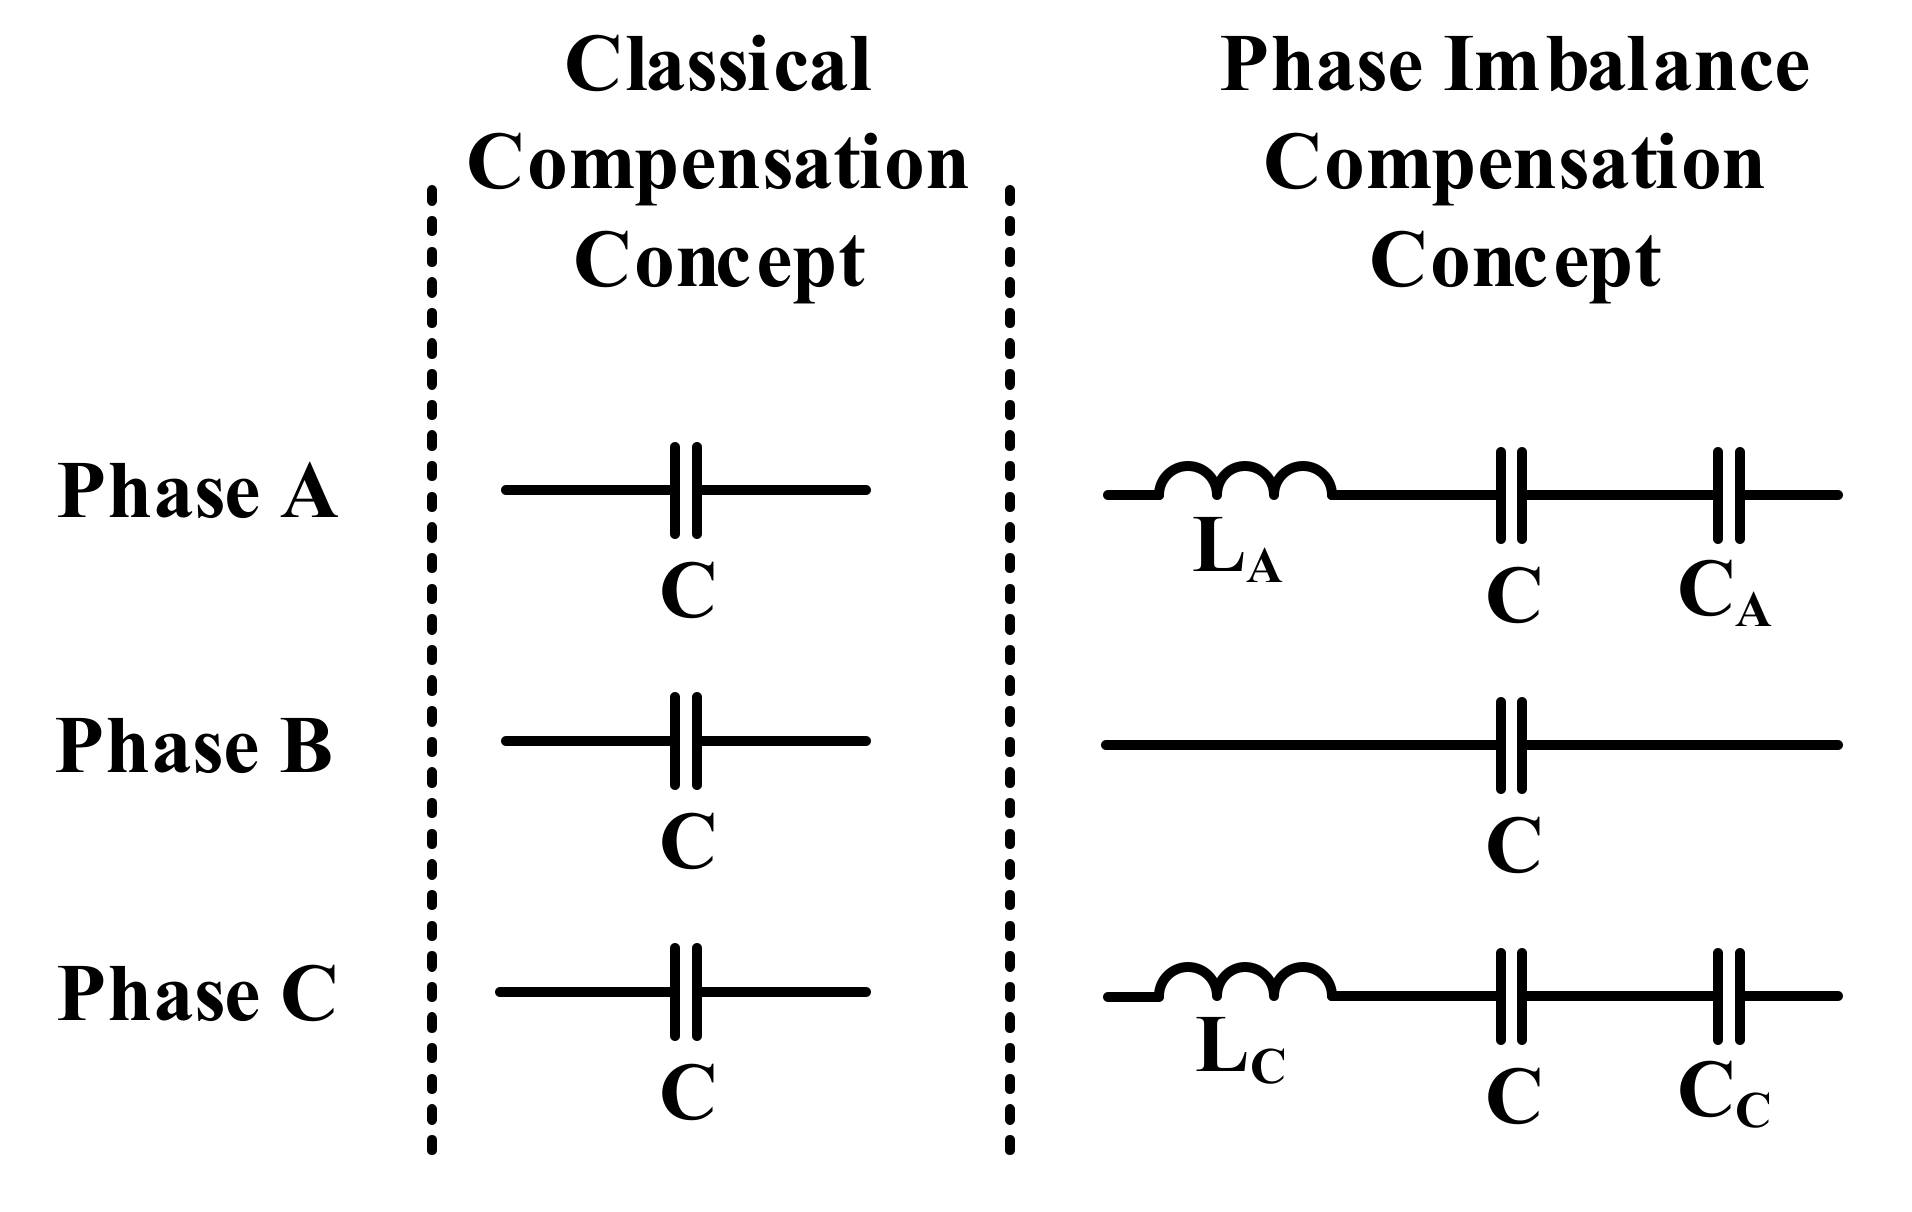
Fixed series compensation can be achieved by means of the classical compensation scheme or the phase imbalance compensation concept. In the classical compensation scheme, the transmission line with series inductance is compensated symmetrically, i.e., the capacitance of the series capacitor is the same across all three phases (see Figure 1). In contrast, the added capacitances and inductances in the phase imbalance concept are not identical to each other, as will be explained in Section 4. Furthermore, the inductances are added to the uncompensated line as part of the phase imbalance concept and are not the phase inductances of the uncompensated line.
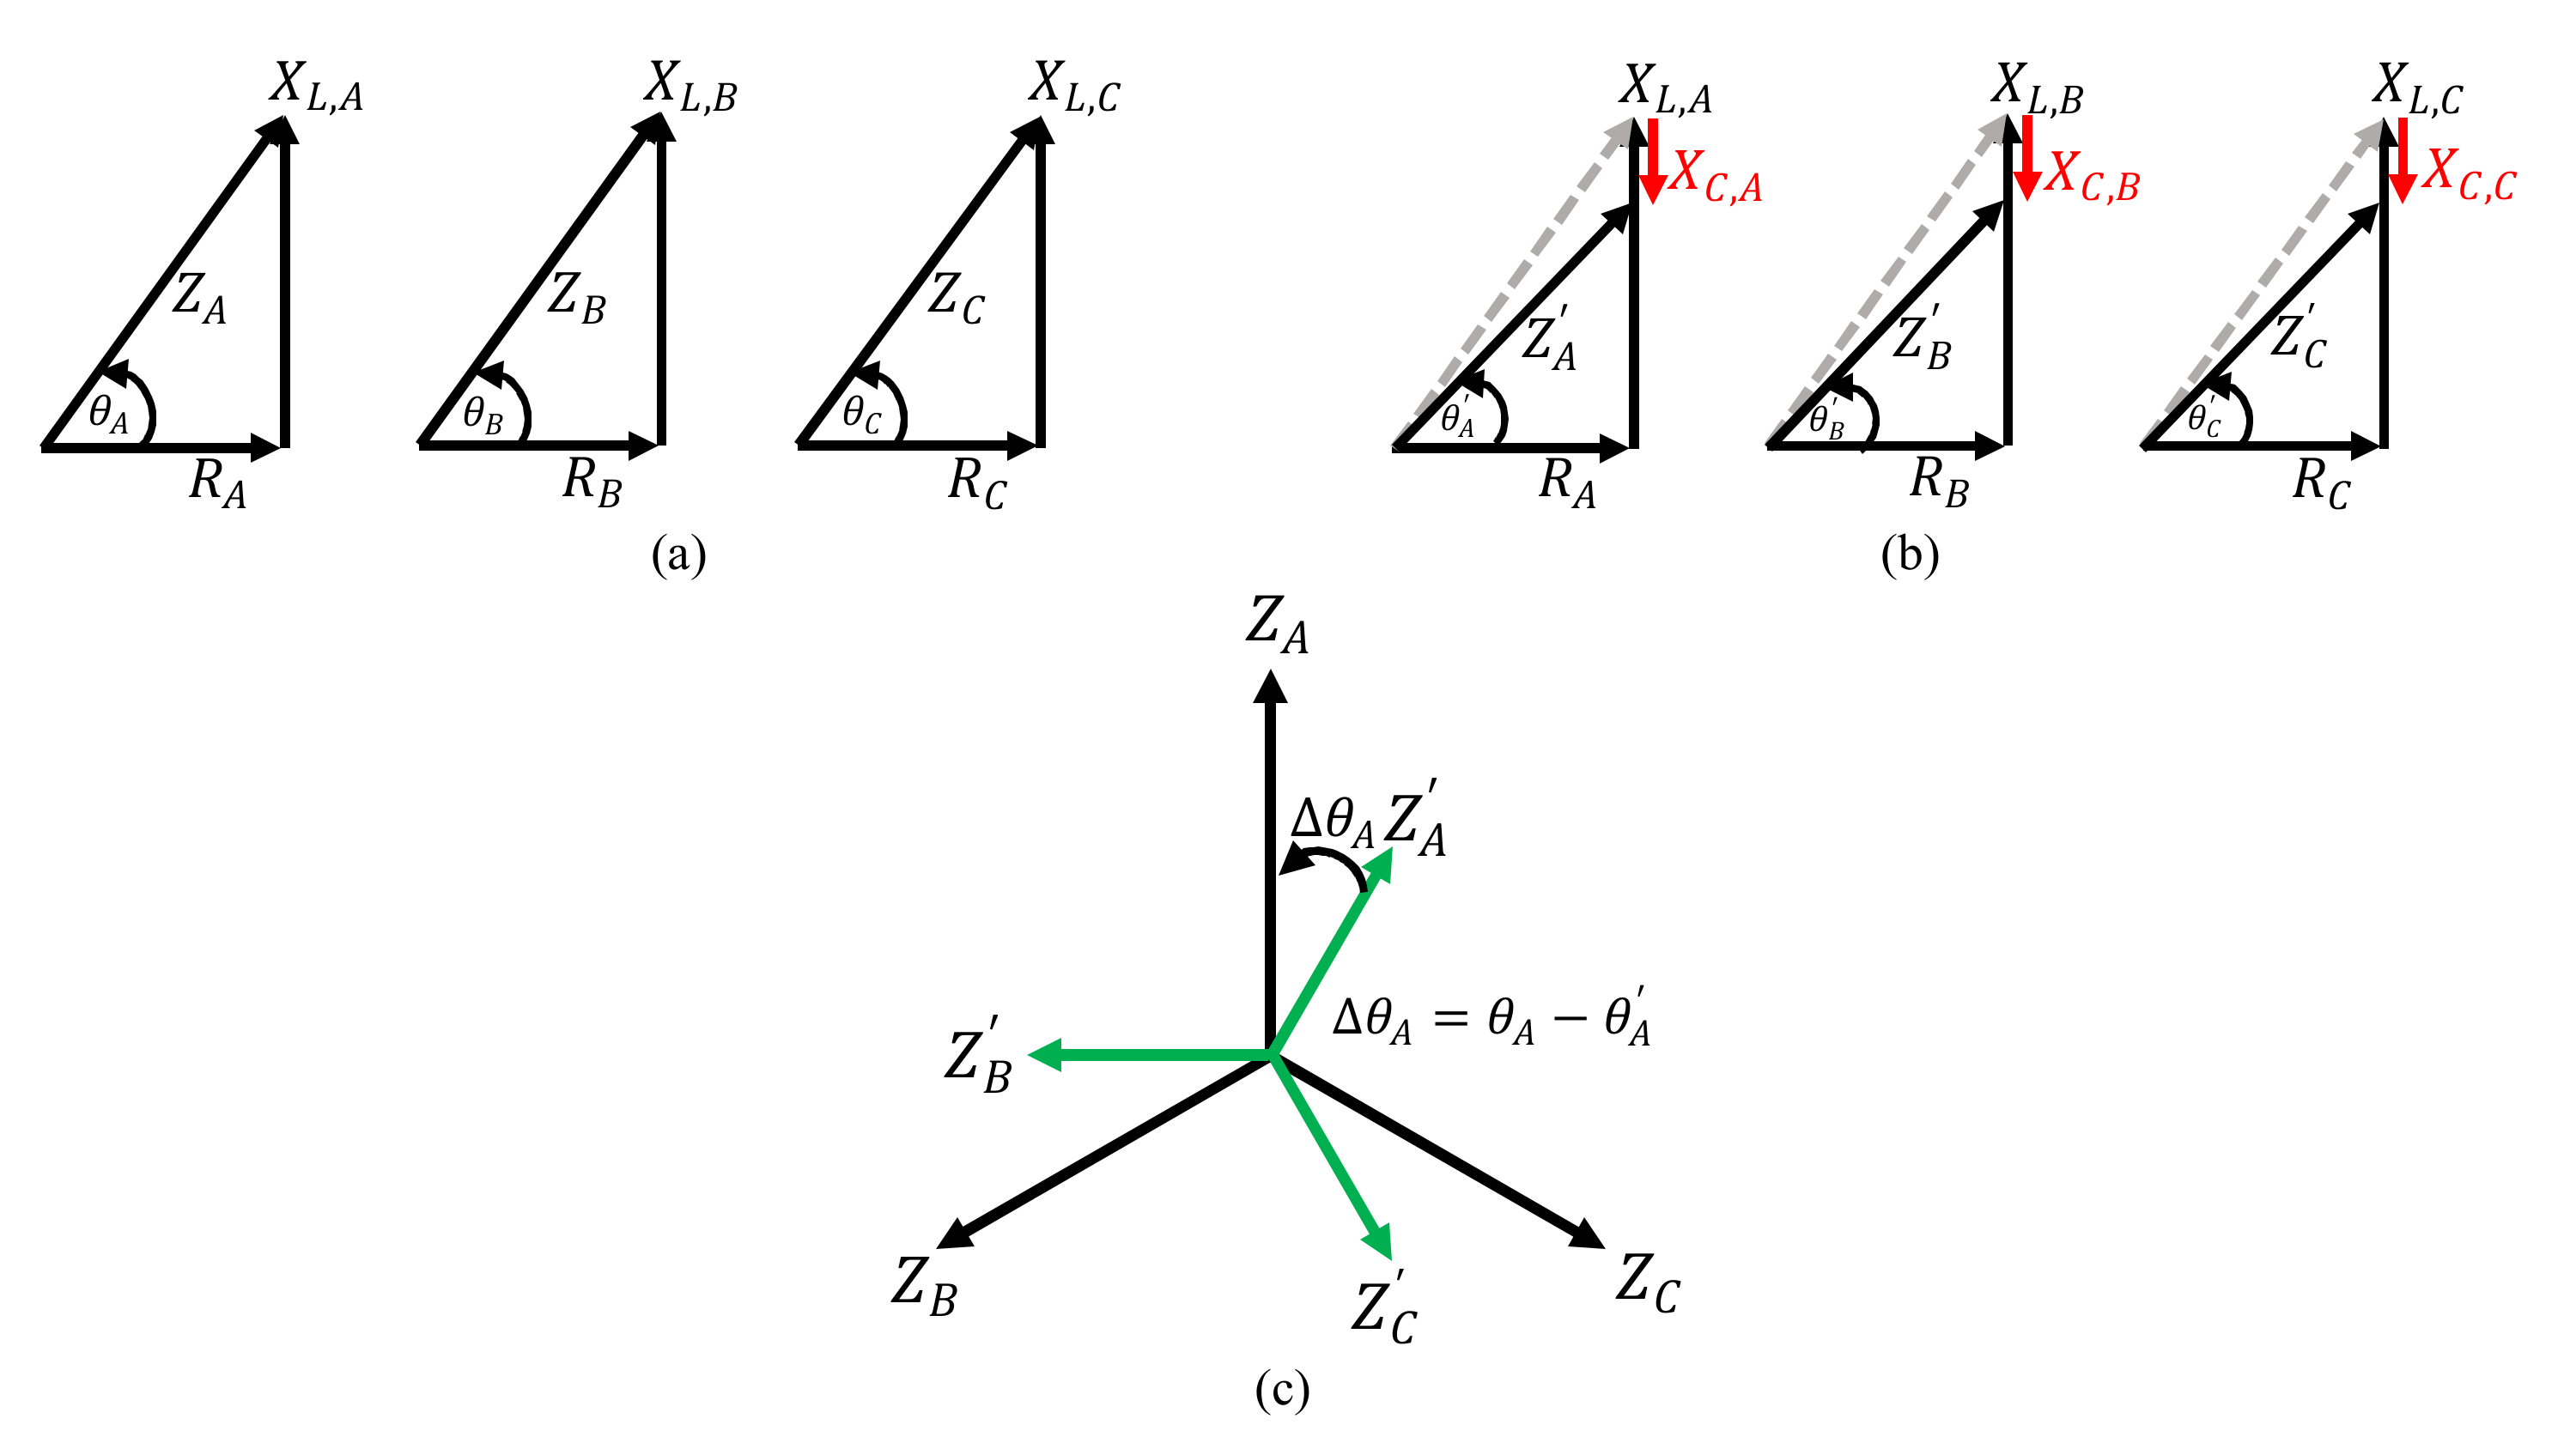
Due to the symmetrical compensation of the three phases, a uniform reduction in the phase reactance is achieved and, as a result, a balanced equivalent impedance across the three phases is obtained. This is shown in Figure 2. The shift in the impedance angle due to the compensation is also shown. In such cases, a disturbance in the grid will produce currents in the sub-synchronous frequency range. The resulting rotating MMF at this frequency will be symmetrical. As will be shown in Section 4, this is different for the phase imbalance compensation concept, where the unbalanced impedances create an asymmetrical rotating MMF at sub-synchronous frequencies.
Due to the symmetry, the resonance frequency is the same for all three phases and is defined as given in Equation (1).
: resonance frequency ()
: transmission line inductance ()
: capacitance of series capacitor ()
The compensation degree , as defined by Equation (2), quantifies the ratio of the series compensation’s capacitive reactance and the line’s inductive reactance .
: compensation degree
: capacitive reactance
: inductive reactance
The resulting change in active power transfer as a function of is defined in Equation (3).
: change in active power transfer
: change in
: compensation degree
At the fundamental frequency , , and , Equation (2) can be rewritten as Equation (4).
The relation between and can be derived by substituting Equation (4) in Equation (1), which results in Equation (5).
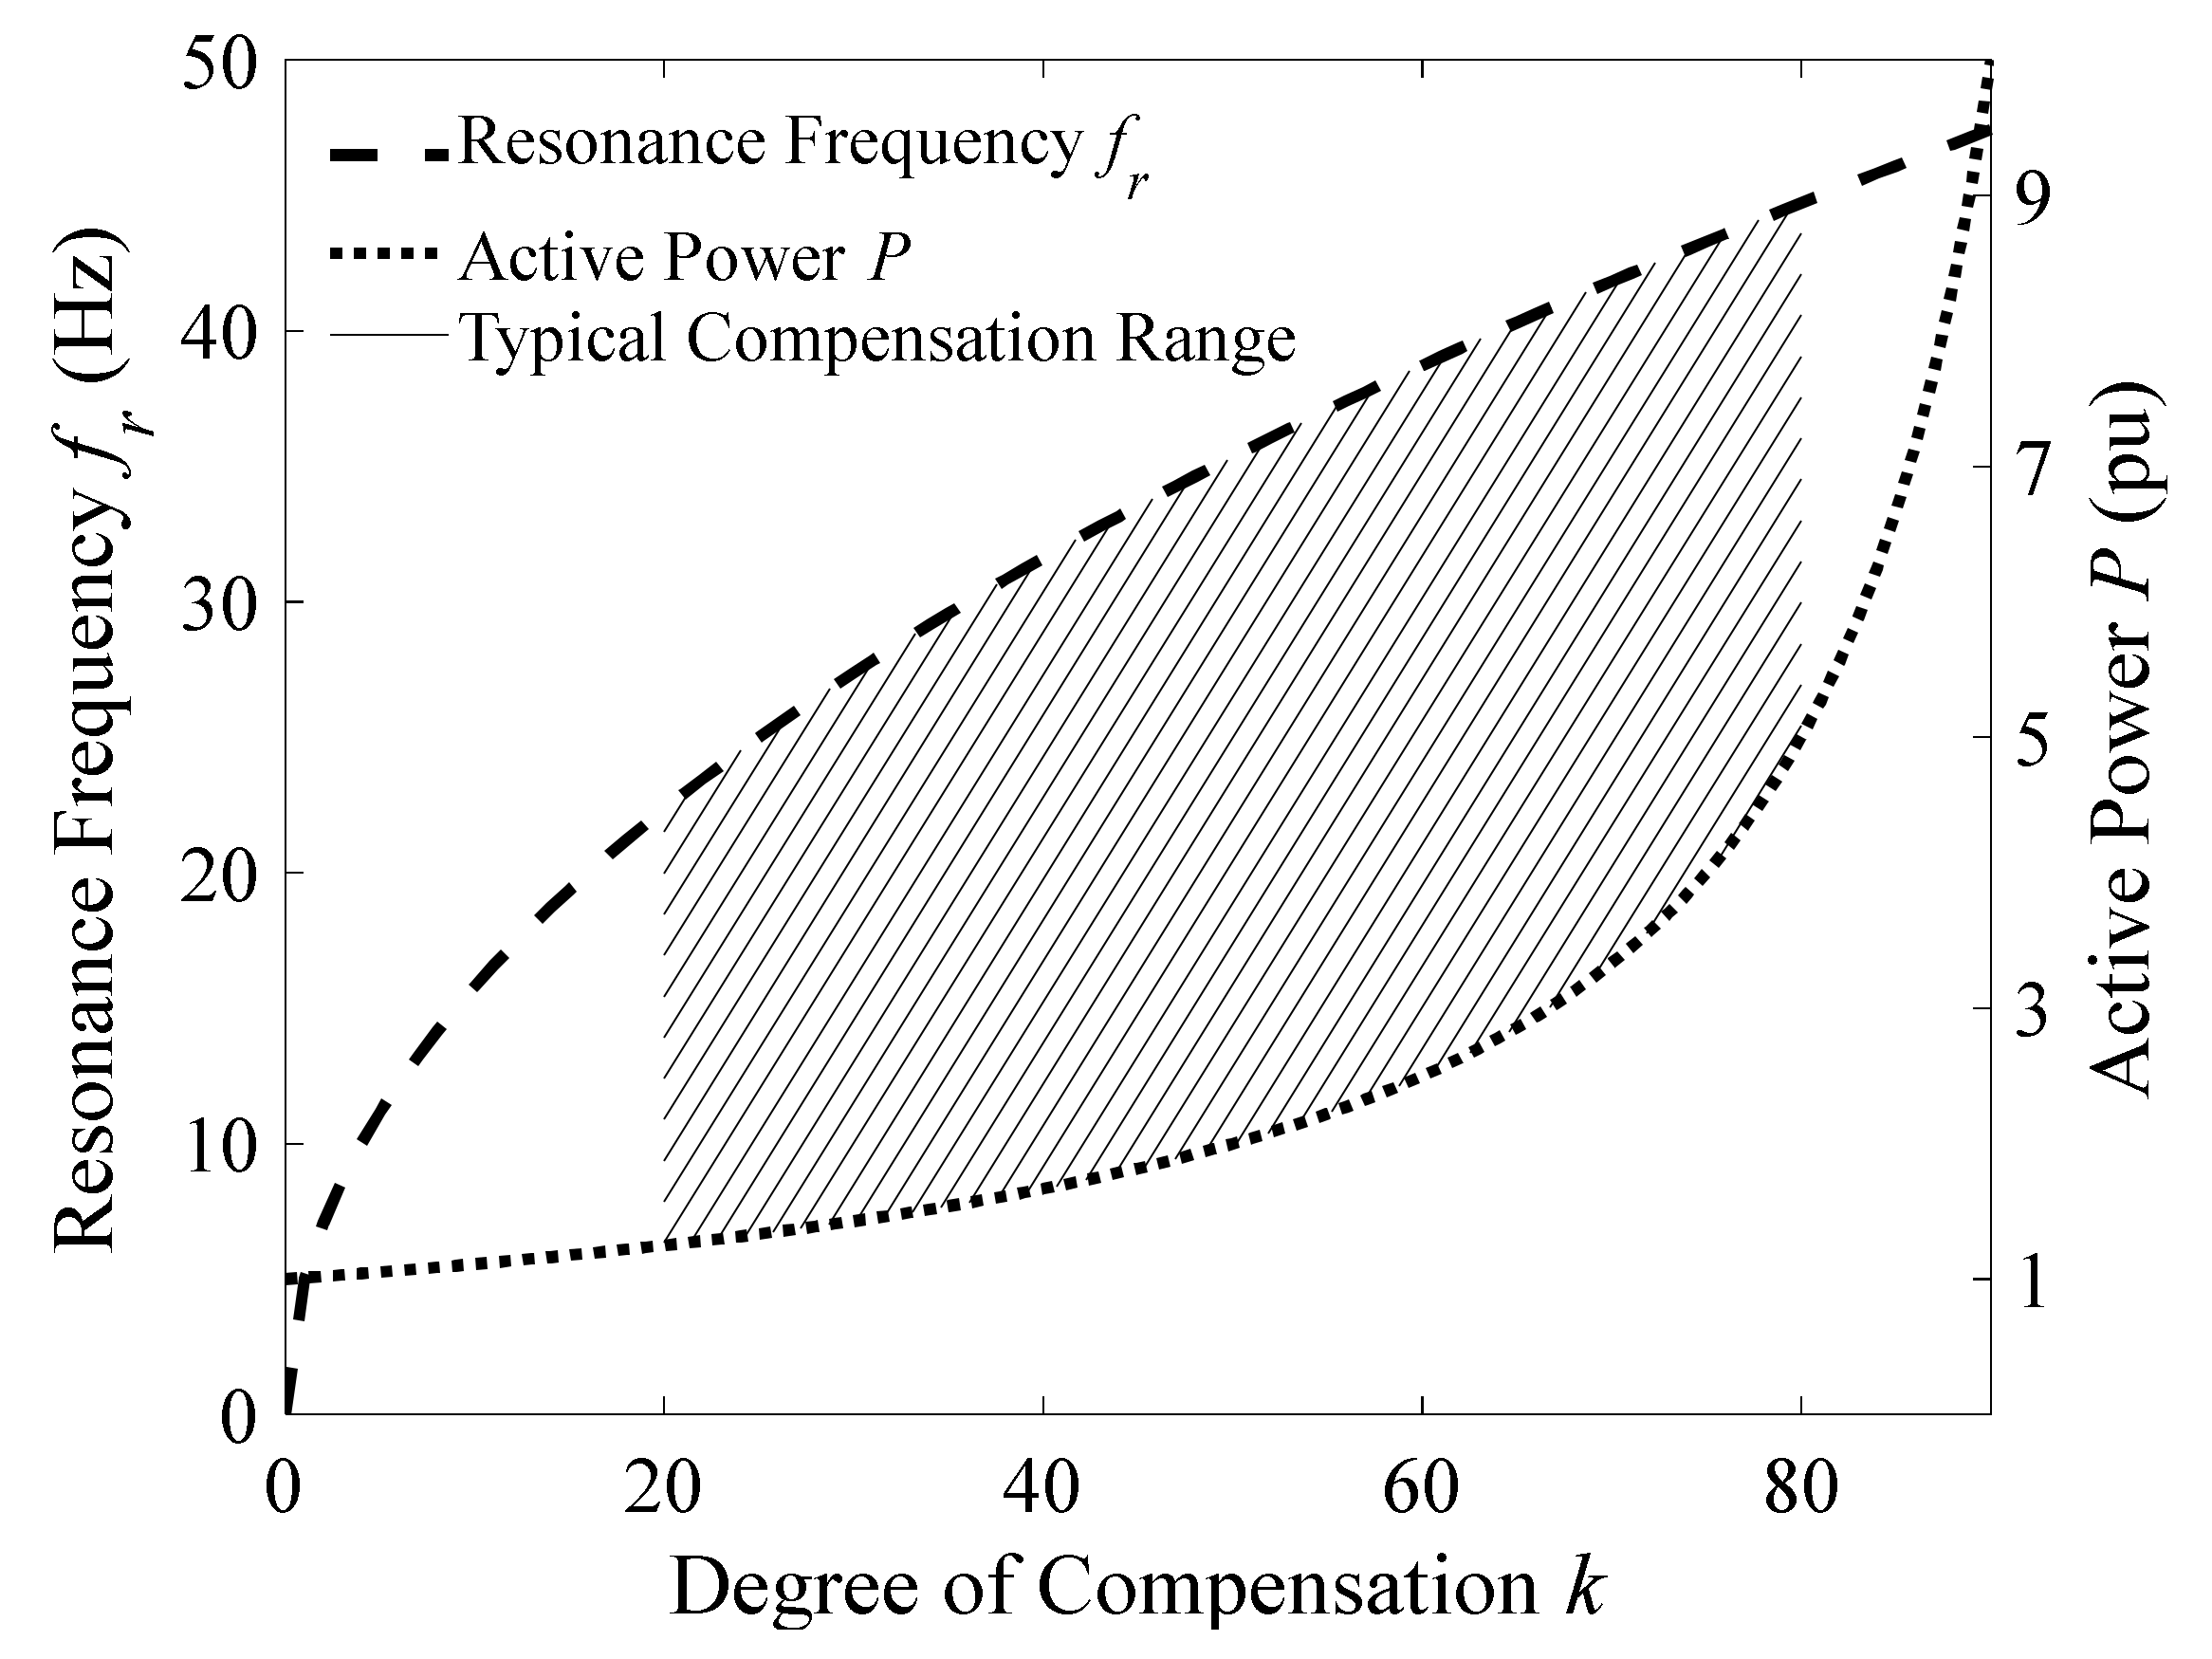
Figure 3 is derived using Formulas (2), (3) and (5) and graphically illustrates the relation between the compensation degree , the resonance frequency and the active power transfer. In practical series compensation applications, lies between 20% and 80% [19] (In exceptional cases, can be lower (e.g., the classical series compensation application in Hebei, China [20], has a -value of 6.67%), which leads to an increased active power transfer of 1.25–5 p.u. and results in resonance frequencies, as seen from a point of interconnection to the transmission network, between approximately 22 and 45 Hz (based on fundamental frequency of 50 Hz). The actual resonance frequency will be different depending on the reactance of the connected generator. It should be remembered that is always calculated at .
4. Phase Imbalance Compensation
4.1. Concept Description
The phase imbalance compensation (PIC) concept is shown in Figure 1. In this concept, a phase wide series compensation is implemented in such a way that the impedance at the fundamental frequency remains the same under both compensation schemes, i.e., , where the prime symbol denotes quantities in the classical compensation scheme and the double prime symbol denotes quantities in the phase imbalance concept. In order to achieve this, consider phase . The relation between capacitor and inductor is derived as shown in Formula (6), where and are additions due to the PIC, is the inductance of the uncompensated line, and is the capacitance of the series capacitor under the classical compensation scheme.
The same applies for phase and solving Equation (6) for ultimately leads to Equation (7), where represents the degree of asymmetry. This equation sets the relation between the additional inductance and capacitance in each phase that applies the PIC. For each phase, a single degree of freedom exists.
As a result of the imbalanced compensation, the resonance frequency of each asymmetrically compensated phase is different. With asymmetrical compensation deployed in phases and (see Figure 1), . The resonance frequency is then defined as Equations (8)–(10) for phase , and . Since no additional impedances are included in phase , it should be noted that .
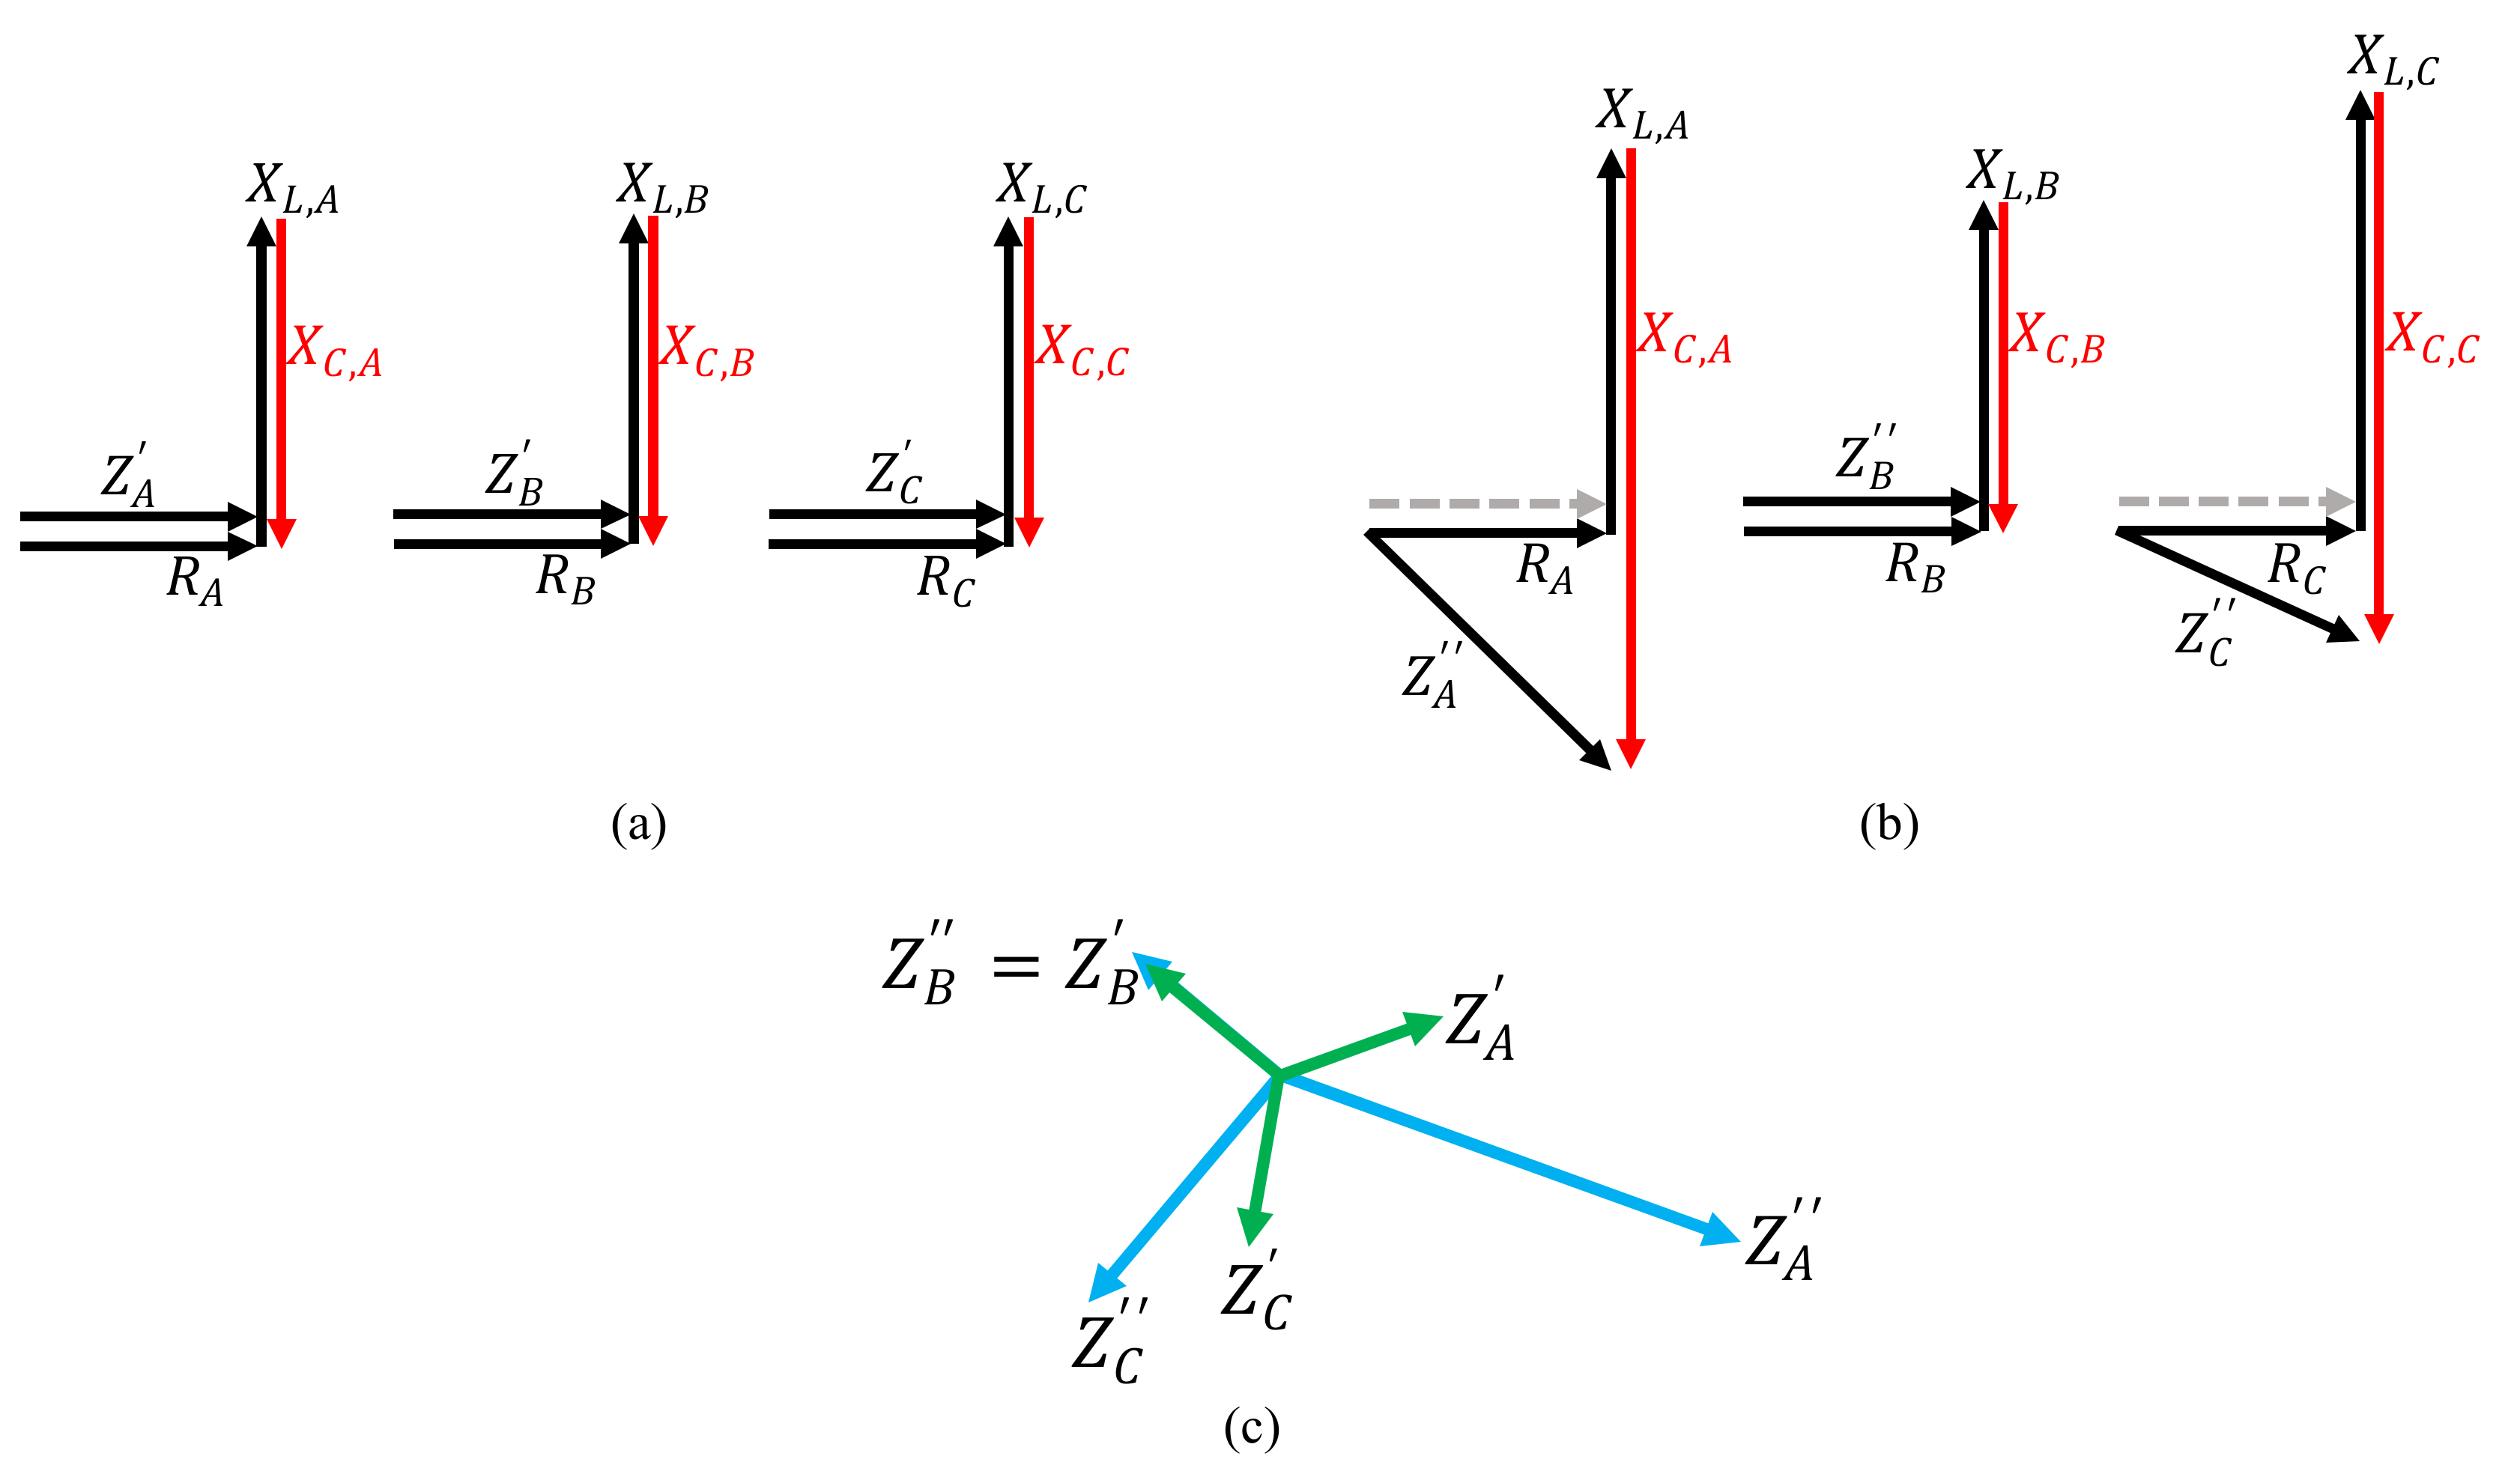
Figure 4 shows the vector and phasor diagrams of the phase impedances at a sub-synchronous frequency for the classical as well as PIC concepts. For the classical compensation concept, the phase impedances are identical. At these impedances are equal to the damping (Figure 4a) and result in a balanced phasor (Figure 4c). In the PIC, the phase impedances at are different (Figure 4b), which lead to an unbalanced phasor (Figure 4c). As mentioned in Section 3, the vector and phasor diagrams at the fundamental frequency are the same for both compensation concepts.
When a disturbance occurs in the grid, the unbalanced phase impedances will create a non-uniformly distributed . This is defined as given in Reference (11).
With no series compensation, is zero. With the classical compensation, the in each phase is identical, as the maximum current in each phase is the same (due to the same in each phase). On the other hand, for each phase that implements an asymmetrical compensation, is different depending on , which, in turn, is a function of the degree of asymmetry in that respective phase. As such, the phase imbalance concept is able to alter the (and electrical torque) at sub-synchronous frequencies, and, therefore, potentially mitigate DFIG-SSR. The larger , the smaller and the smaller the . With decreasing , the resulting subsynchronous oscillations are smaller.
4.2. Developed Analytical Model for Phase Imbalace Compensation
In order to create an understanding of how the PIC alters the dynamic behaviour of the power system, an analytical model describing the relation between the inductance and capacitance of the imbalanced phase and the resonance frequency of that phase, is developed next. The starting point for this derivation is , as . Consider phase . If differs from by , then the relation between and is given by Equation (12).
Substituting Equation (7) into Formula (12) yields Equation (13) and, after rearranging, it yields Equation (14).
Solving Equation (14) for results in Equation (15).
Substituting in Equation (15) gives Formula (16).
Finally, solving Formula (16) results in Equation (17).
The relation between , , and is derived by substituting Equation (5) in Equation (17), which ultimately results in Formula (18).
The degree of asymmetry for phase is then defined as given in Equation (19) and represents the analytical model of the PIC concept. The same relation holds for phase .
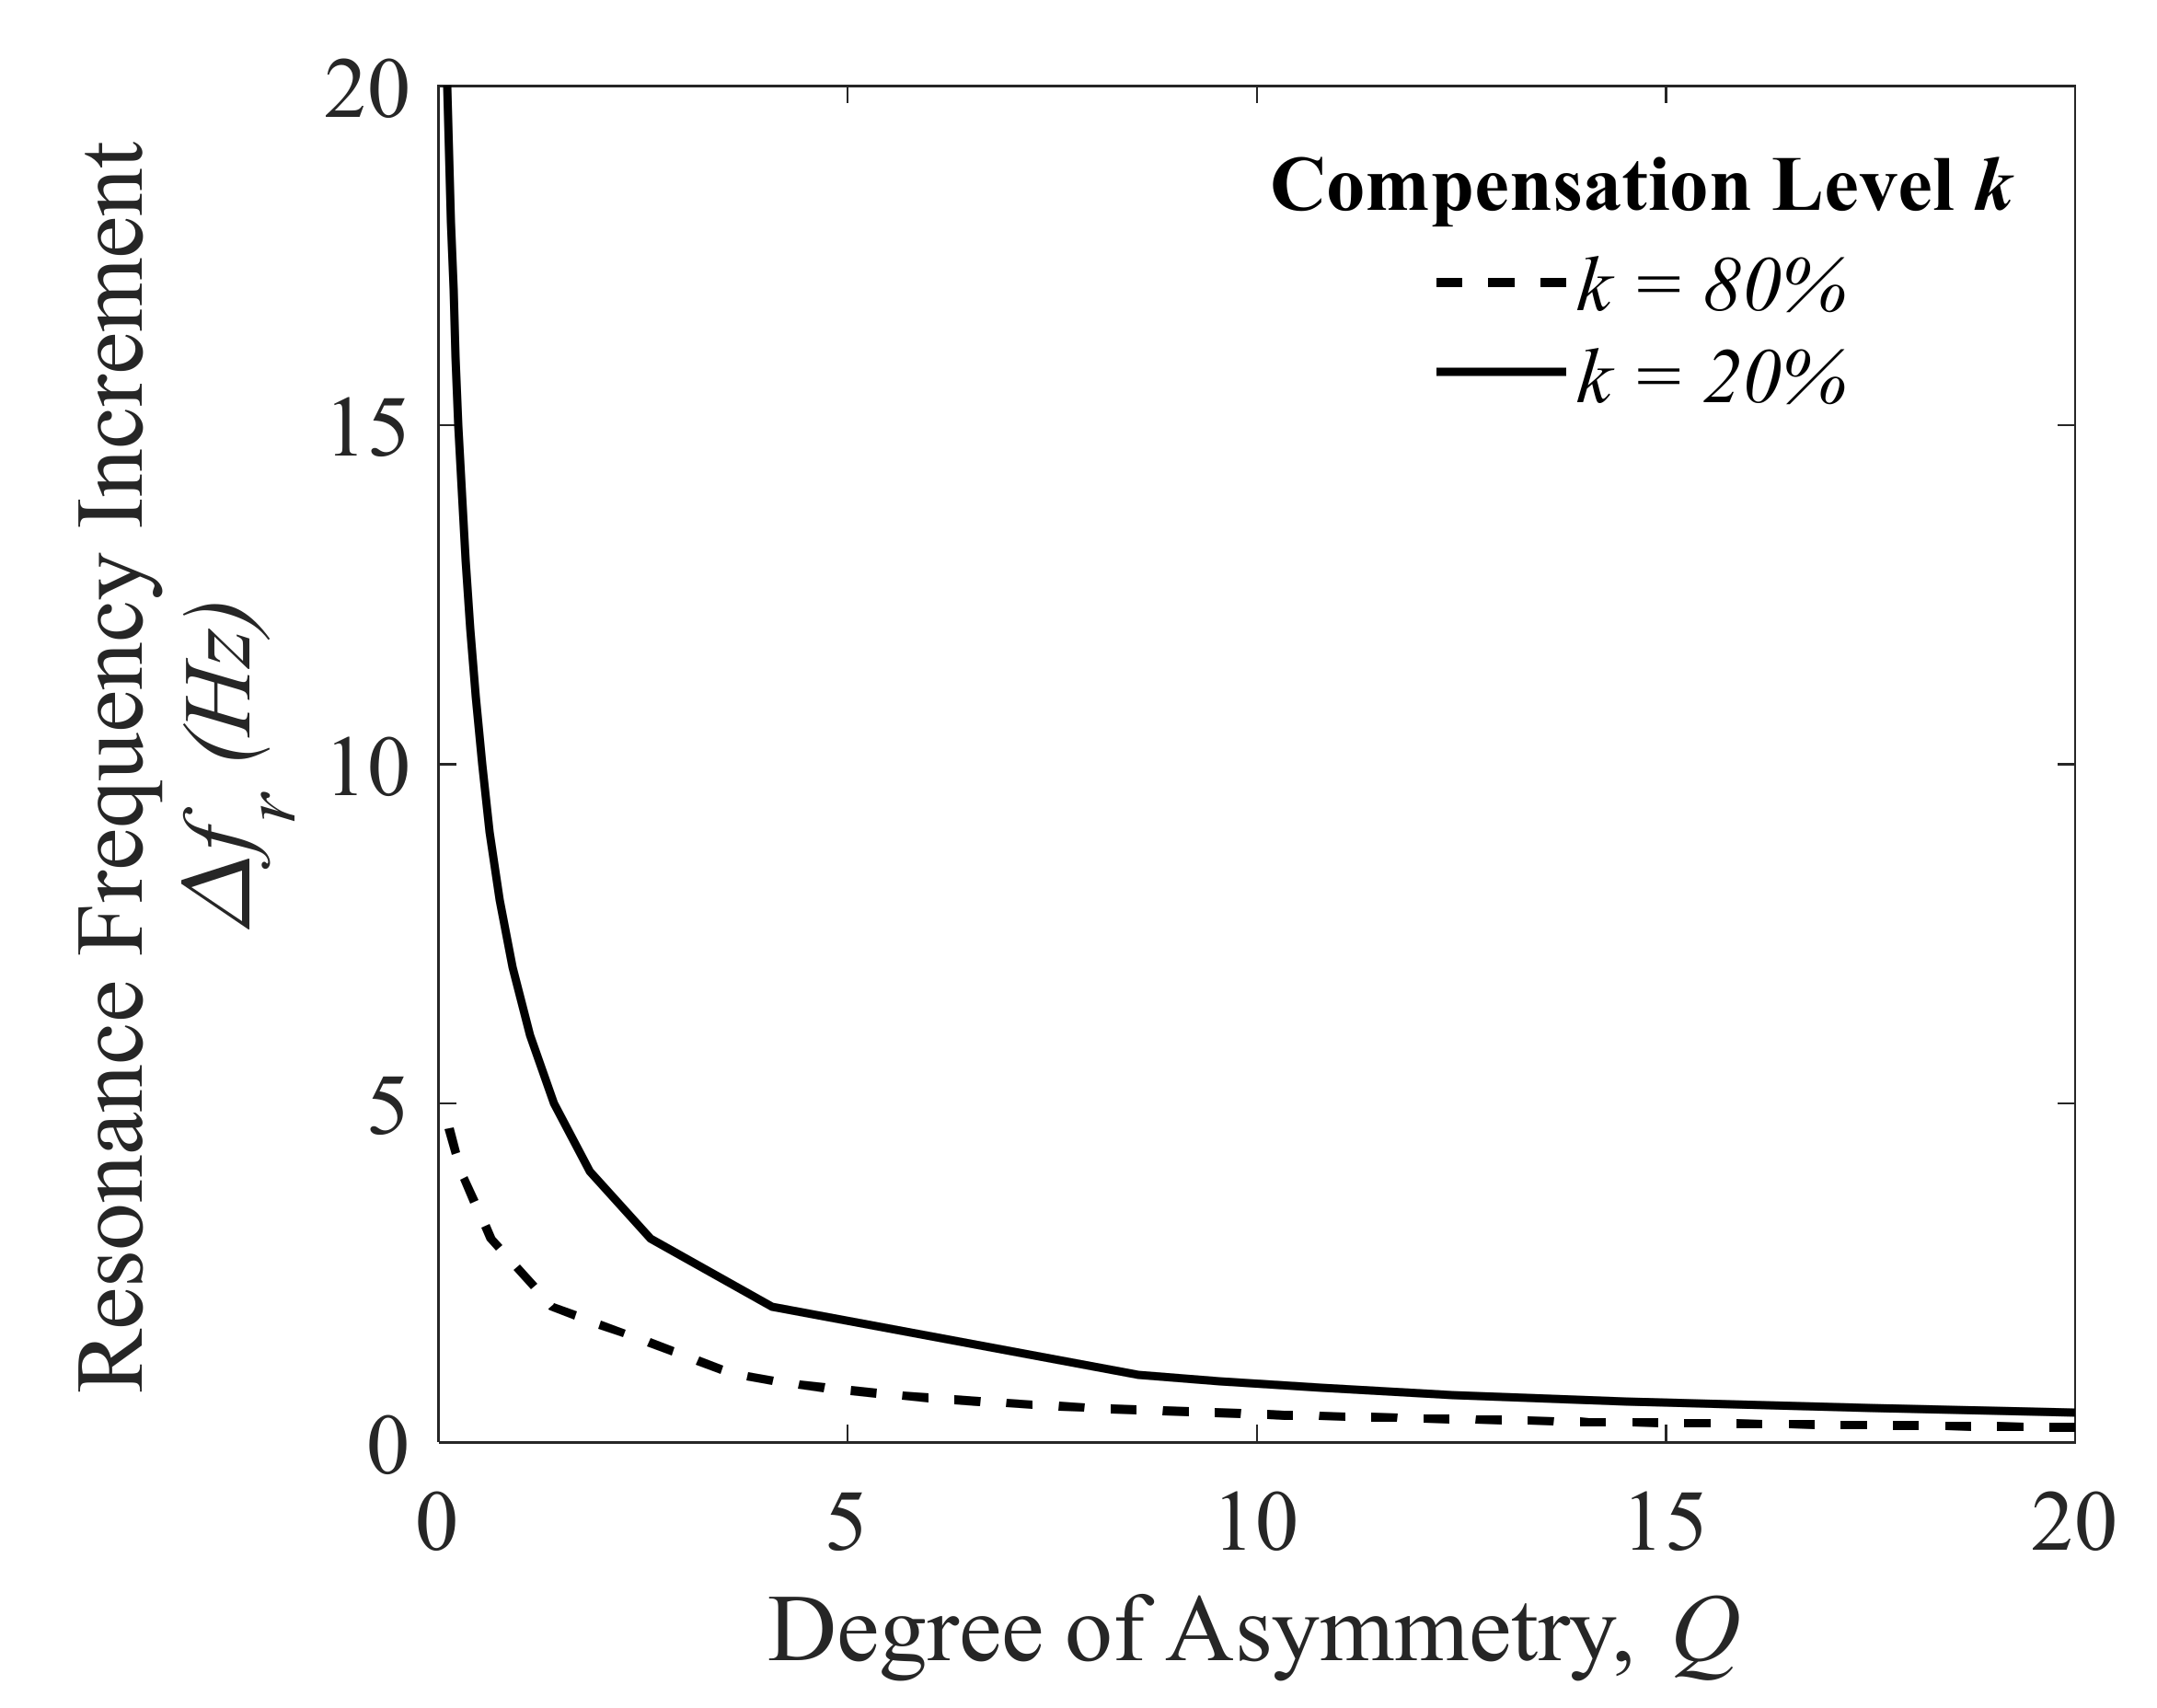
Figure 5 is derived from Equation (19) and shows different compensation levels and different degrees of asymmetry. The resulting change in resonance frequency is . Since any requires an additional series capacitor, the resonance frequency will always increase. is always positive, as is shown in Figure 5, and it is, therefore, not possible to reduce the resonance frequency below using the series resonance PIC scheme. Furthermore, for any given , is inversely proportional to .
From Figure 5, it can be observed that an imposed in the PIC can be achieved by modifying either or in the design phase. For fixed , a modification of (which is a quantity at ) results in an altered active power transfer limit and altered . For fixed , modification of results only in altered sub-synchronous behaviour (i.e., altered ), as should be respected for each value of .
4.3. Development of the Power System Model and DFIG Model
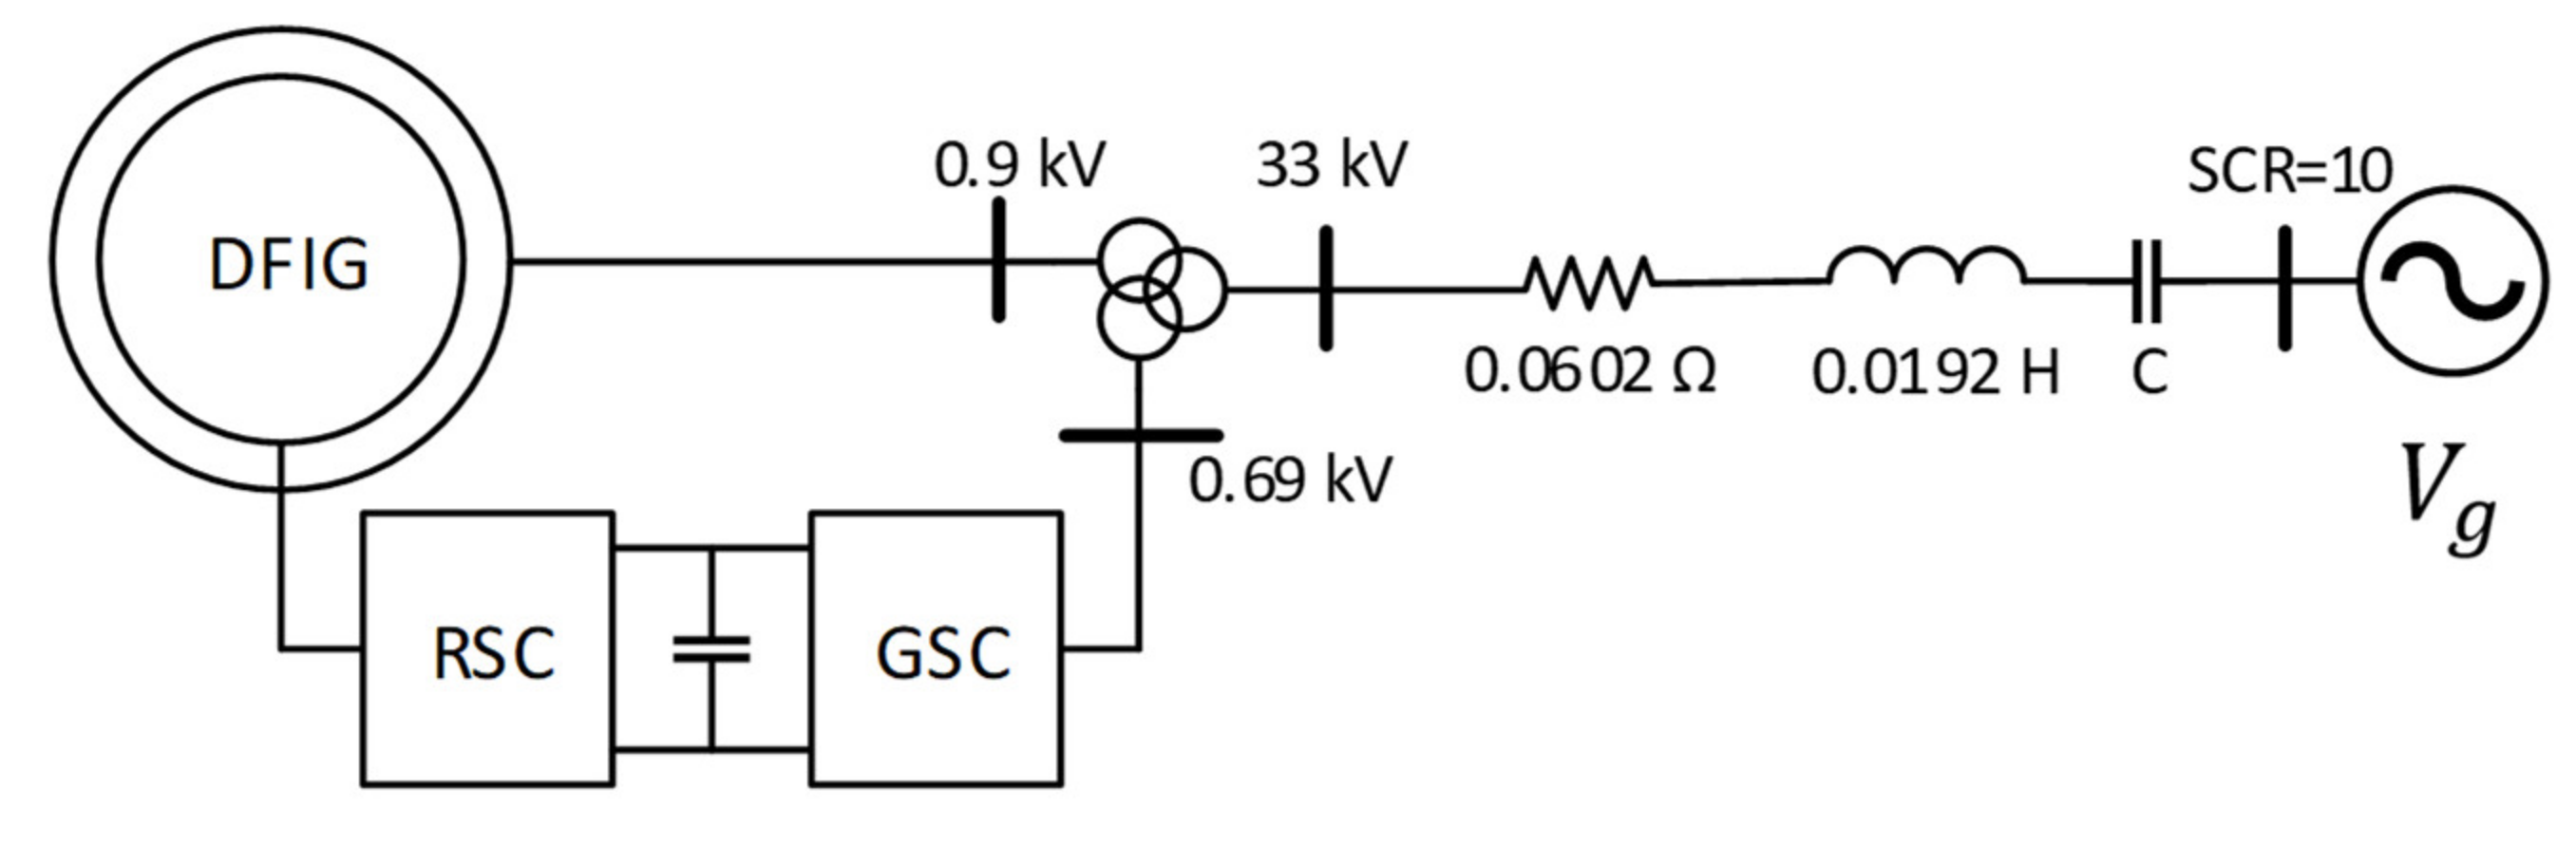
To assess the effectiveness of PIC in mitigating DFIG-SSR, the development of the power system and DFIG model is briefly described next. Due to its highly local nature, the investigation of DFIG-SSR requires a detailed model of the DFIG. Modelling of the grid is required in such a way that it excites the oscillation mode, which, ultimately, will result in the interaction between the DFIG and the grid. Therefore, many investigations on DFIG-SSR reported in literature use the topology of the IEEE First Benchmark Model [21]. The model in the current work is modified in two ways. First, the synchronous generator model is replaced by a detailed DFIG model. Second, the equivalent grid is modelled as a voltage source with a series impedance, so that the grid contains a sub-synchronous resonance point at 30 Hz, which corresponds to at 36%. The equivalent grid has a short circuit ratio of 10. The single line diagram of the power system under consideration (including all relevant network data) is given in Figure 6. Several practical studies have used similar models for investigating DFIG-SSR [22,23,24,25].
Detailed modelling of the DFIG is crucial, as the adverse interactions are influenced by the damping available at the DFIG terminal. A generic detailed EMT wind turbine model following the IEC standard 61400-27-1 [26] was developed in PSCAD as part of the MIGRATE project [27]. Since the controls presented in the IEC standard are meant for root mean square applications, several adaptations and additions were implemented in order to make the models applicable for EMT analysis. The development of the detailed model is reported in Reference [28]. This model contains, among others, a carefully designed filter to address switching harmonics, where the filter design is based on Reference [29]. Furthermore, the semiconductor switches are modelled in detail, including the thyristor’s turn on and turn off resistances, giving a more realistic damping behaviour of the DFIG. The mechanical dynamics of the wind turbine generator were modelled using a two mass model. The classical double loop control was used as a control structure of the grid as well as the rotor side converter of the DFIG. The implemented controls are the same as the ones used in the authors’ previous work (Figures 8 and 9 in Reference [1]). The DFIG’s parameters are given in Appendix A. The behaviour and fault response of the developed model was successfully validated against vendor models. Further discussion on the model development is out of the scope of the current work.
4.4. PIC Evaluation for DFIG-SSR Mitigation
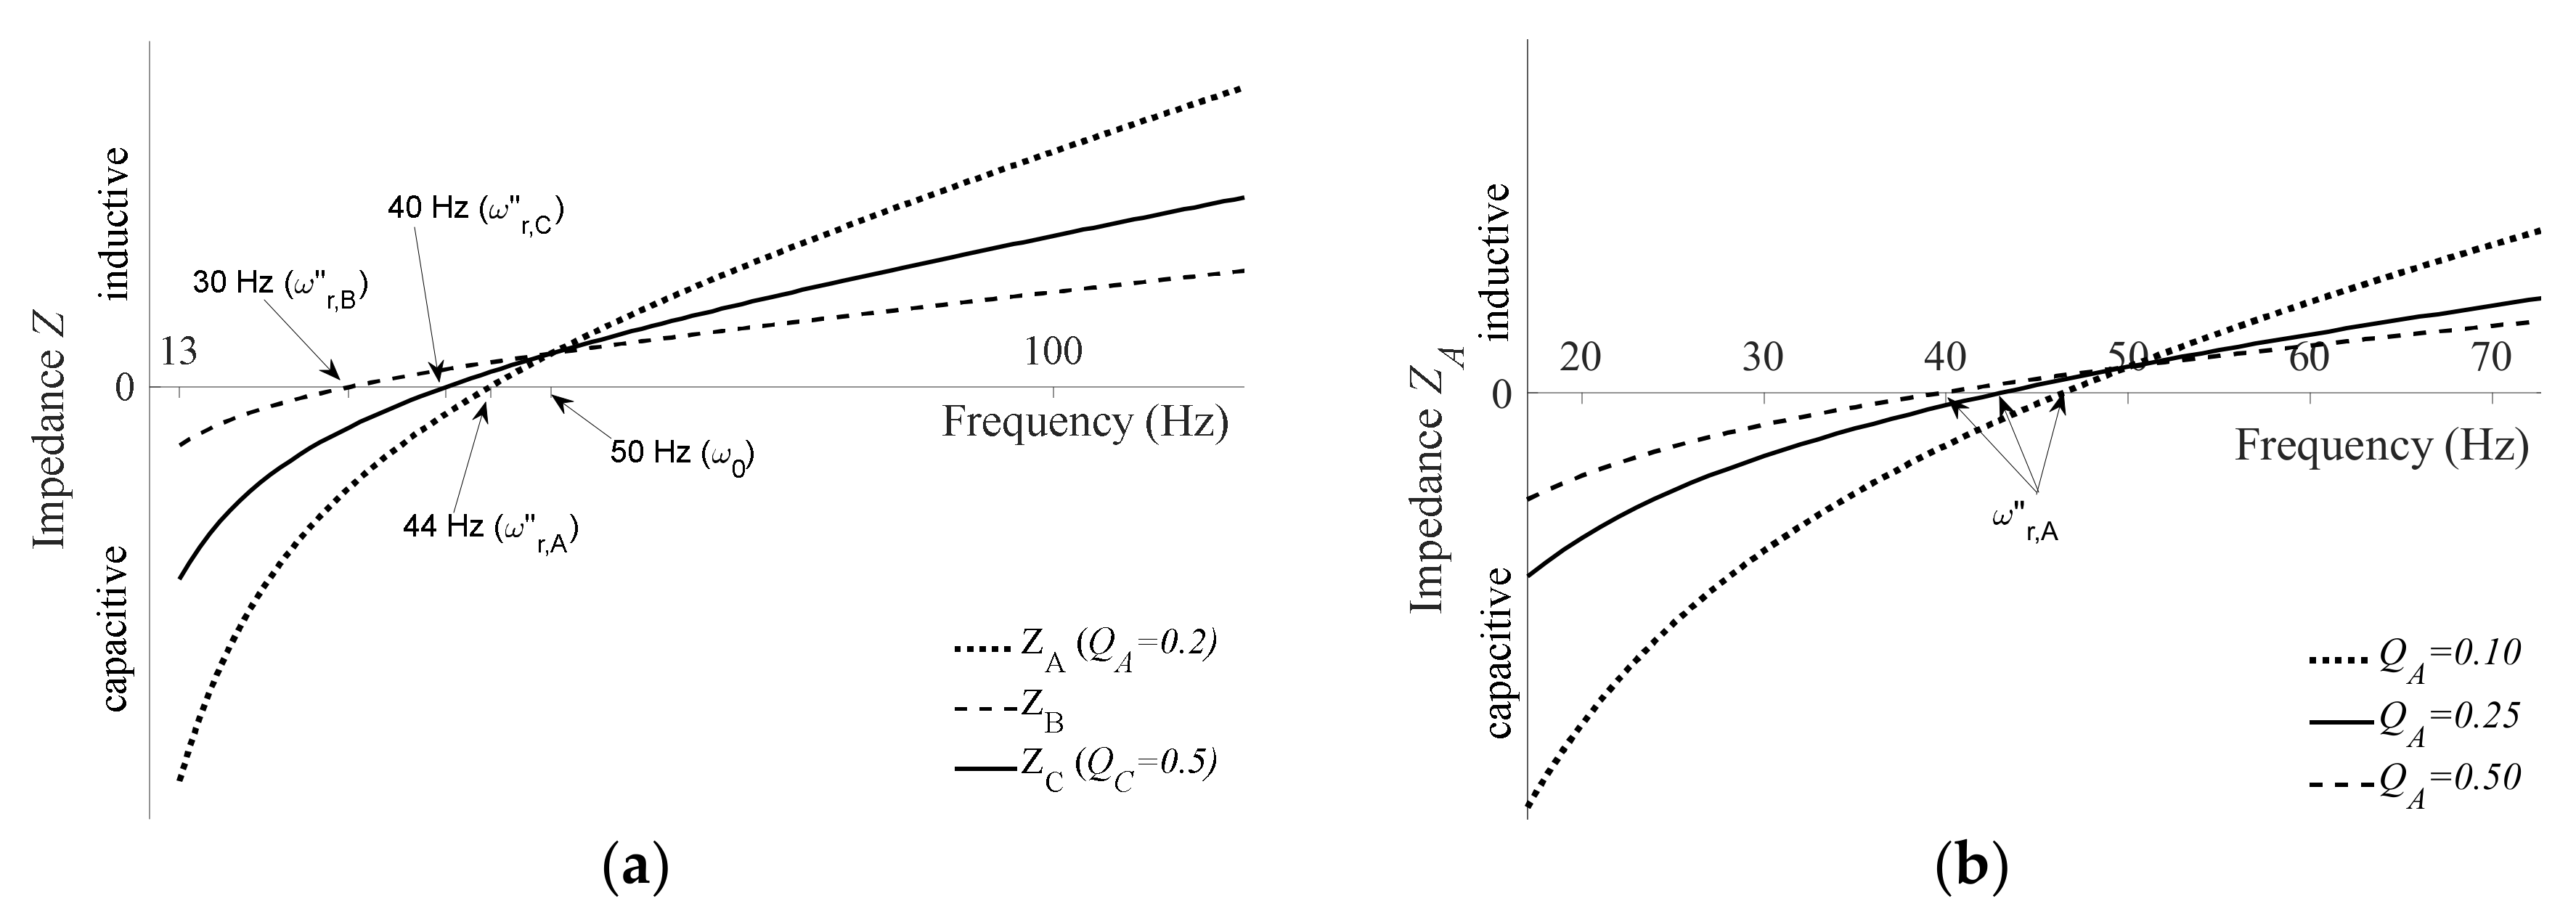
Prior to evaluating the effectiveness of the PIC in mitigating DFIG-SSR, the influence of the PIC on the impedance characteristic of the transmission line in the modified IEEE First Benchmark Model is assessed. One of the contributions of this work is the derivation and validation of Formula (19) through repetitive EMT simulations of an actual system, considering different values for the degrees of asymmetry across one and two phases. To this end, low values are chosen as these have a more pronounced effect on the impedance characteristic. The results are shown in Figure 7. Let and be equal to 0.2 and 0.5, respectively. Substituting these values for the degree of asymmetry and equal to 36% in Equation (19) results in of 14 and 10 Hz for phase and phase . As is shown in Figure 7a, the exact same results are achieved using EMT simulations, where the impedance characteristic of each phase is determined using the dynamic frequency scanning technique [30]. Figure 7b shows the impedance characteristics of phase for different levels of . These results are also in line with Formula (19) and Figure 5. Higher values decrease .
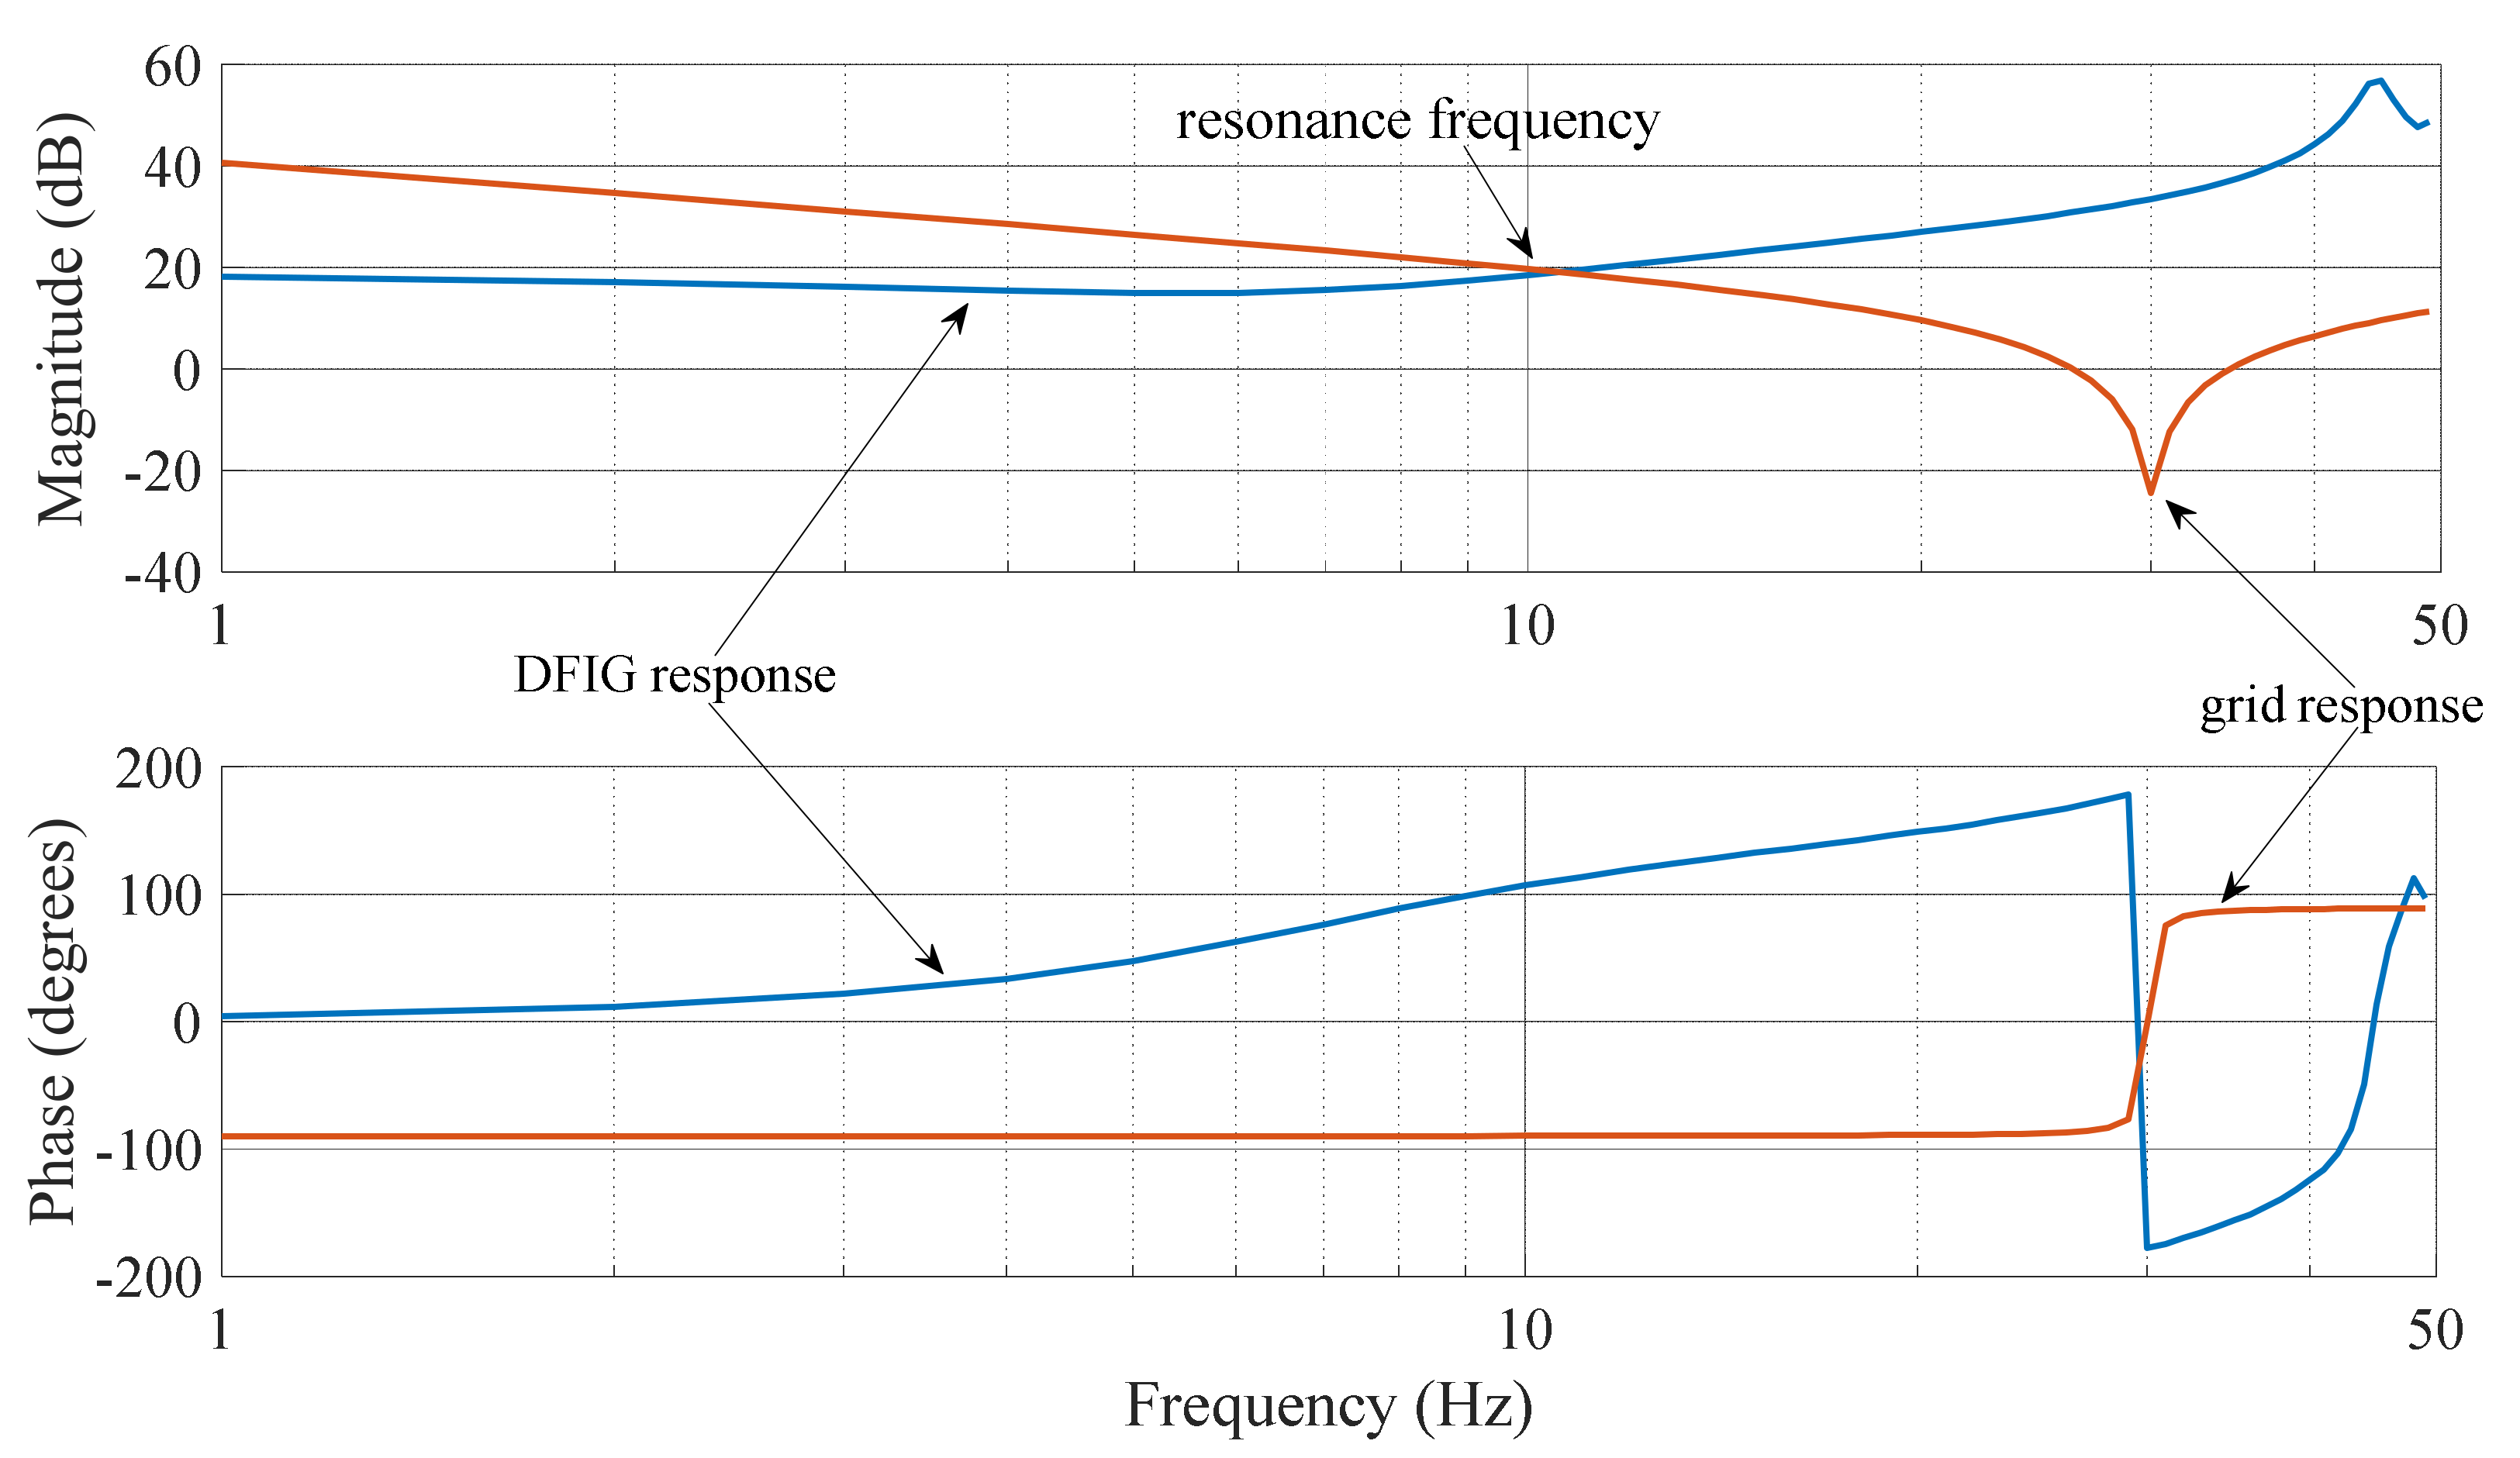
When the DFIG is added to the overall system, the equivalent impedance characteristic is changed by following the actual will be different from 30 Hz. As shown in Figure 8, the connection of the DFIG to the classical series compensated transmission line reduces to 10 Hz. The converter controller parameters, inductances from the transformers and the DFIG machine, and the inductance and shunt capacitance from the filter at the GSC are additional impedances that alter the impedance characteristic of the DFIG. The additional impedance introduced by these components is one of the reasons for the reduced .
To identify whether there exists an adequate degree of asymmetry capable of mitigating DFIG-SSR, optimisations were performed in PSCAD. is defined as given in Equation (7). An optimisation approach is selected, as it can quickly and efficiently search through wide parameter ranges. Two independent optimisations were performed. In the first optimisation, the goal was to find the adequate degree of asymmetry when only phase is compensated using PIC, i.e., single-phase imbalance compensation. The objective function of this optimisation is given by Formula (20), where performance index is developed to monitor the performance of the optimisation. The performance index is a measure of the energy associated with the oscillation. The threshold of below which DFIG-SSR can be considered mitigated was determined using extensive empirical analysis. These analyses consisted of thousands of EMT simulations in PSCAD in which each has slightly different converter controller parameters. In these simulations, the transmission line was compensated using the classical compensation scheme. For each simulation, the performance index was recorded. The empirical analysis showed that DFIG-SSR can be considered mitigated when is smaller than 0.07 per unit, as this represents a case with negligible oscillation energy. As a reference, under the classical series compensation scheme, is equal to approximately 0.215 per unit.
In the second optimisation, the goal was to find adequate degrees of asymmetry and when phase and phase are compensated using PIC, i.e., two-phase imbalance compensation. The objective function is given by Formula (21). In both optimisations, DFIG-SSR, when using phase imbalance compensation, is triggered by a switching action, which causes a permanent radial connection of the DFIG to the unbalanced compensation.
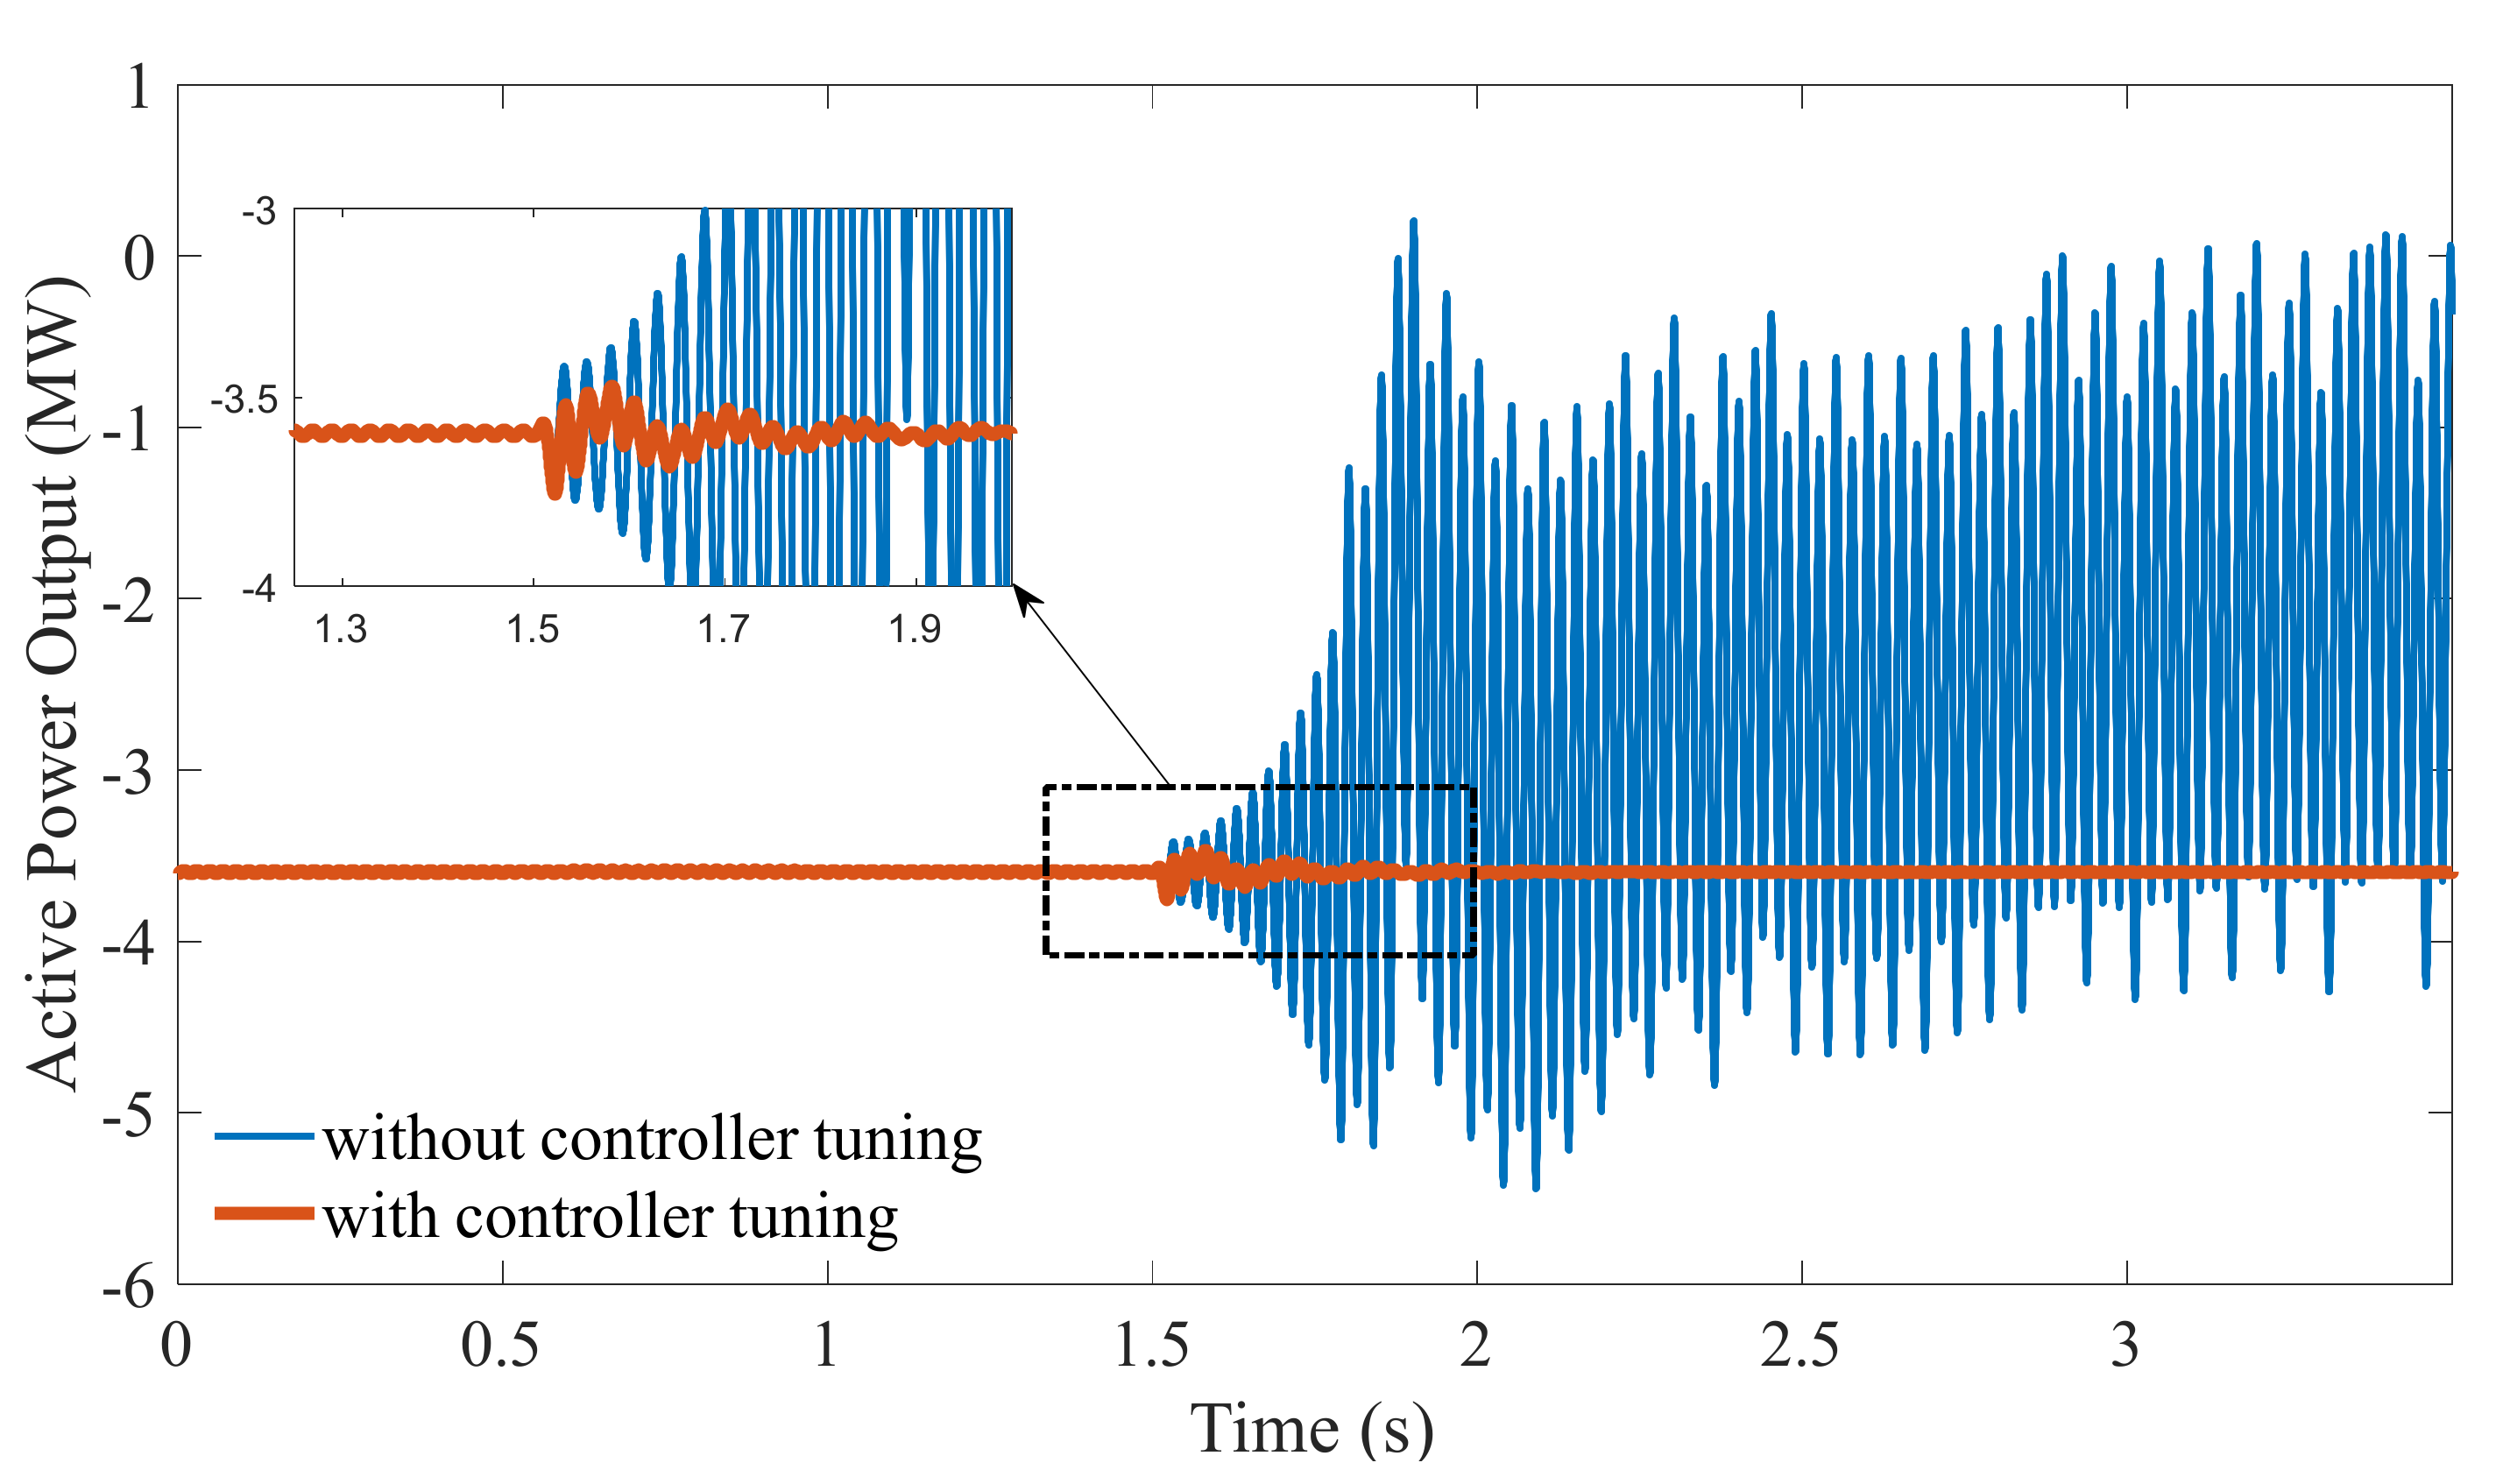
To illustrate a case where DFIG-SSR is successfully mitigated when the transmission line is equipped with classical series compensation, Figure 9 shows the response of the DFIG to a fault before and after modification of the rotor side converter controller parameters. After 1.5 s, a switching action caused the DFIG to be radially connected to the series capacitor (classical compensation), which resulted in DFIG-SSR in the case of unmodified parameters. After modification of the RSC controller parameters, DFIG-SSR was mitigated.
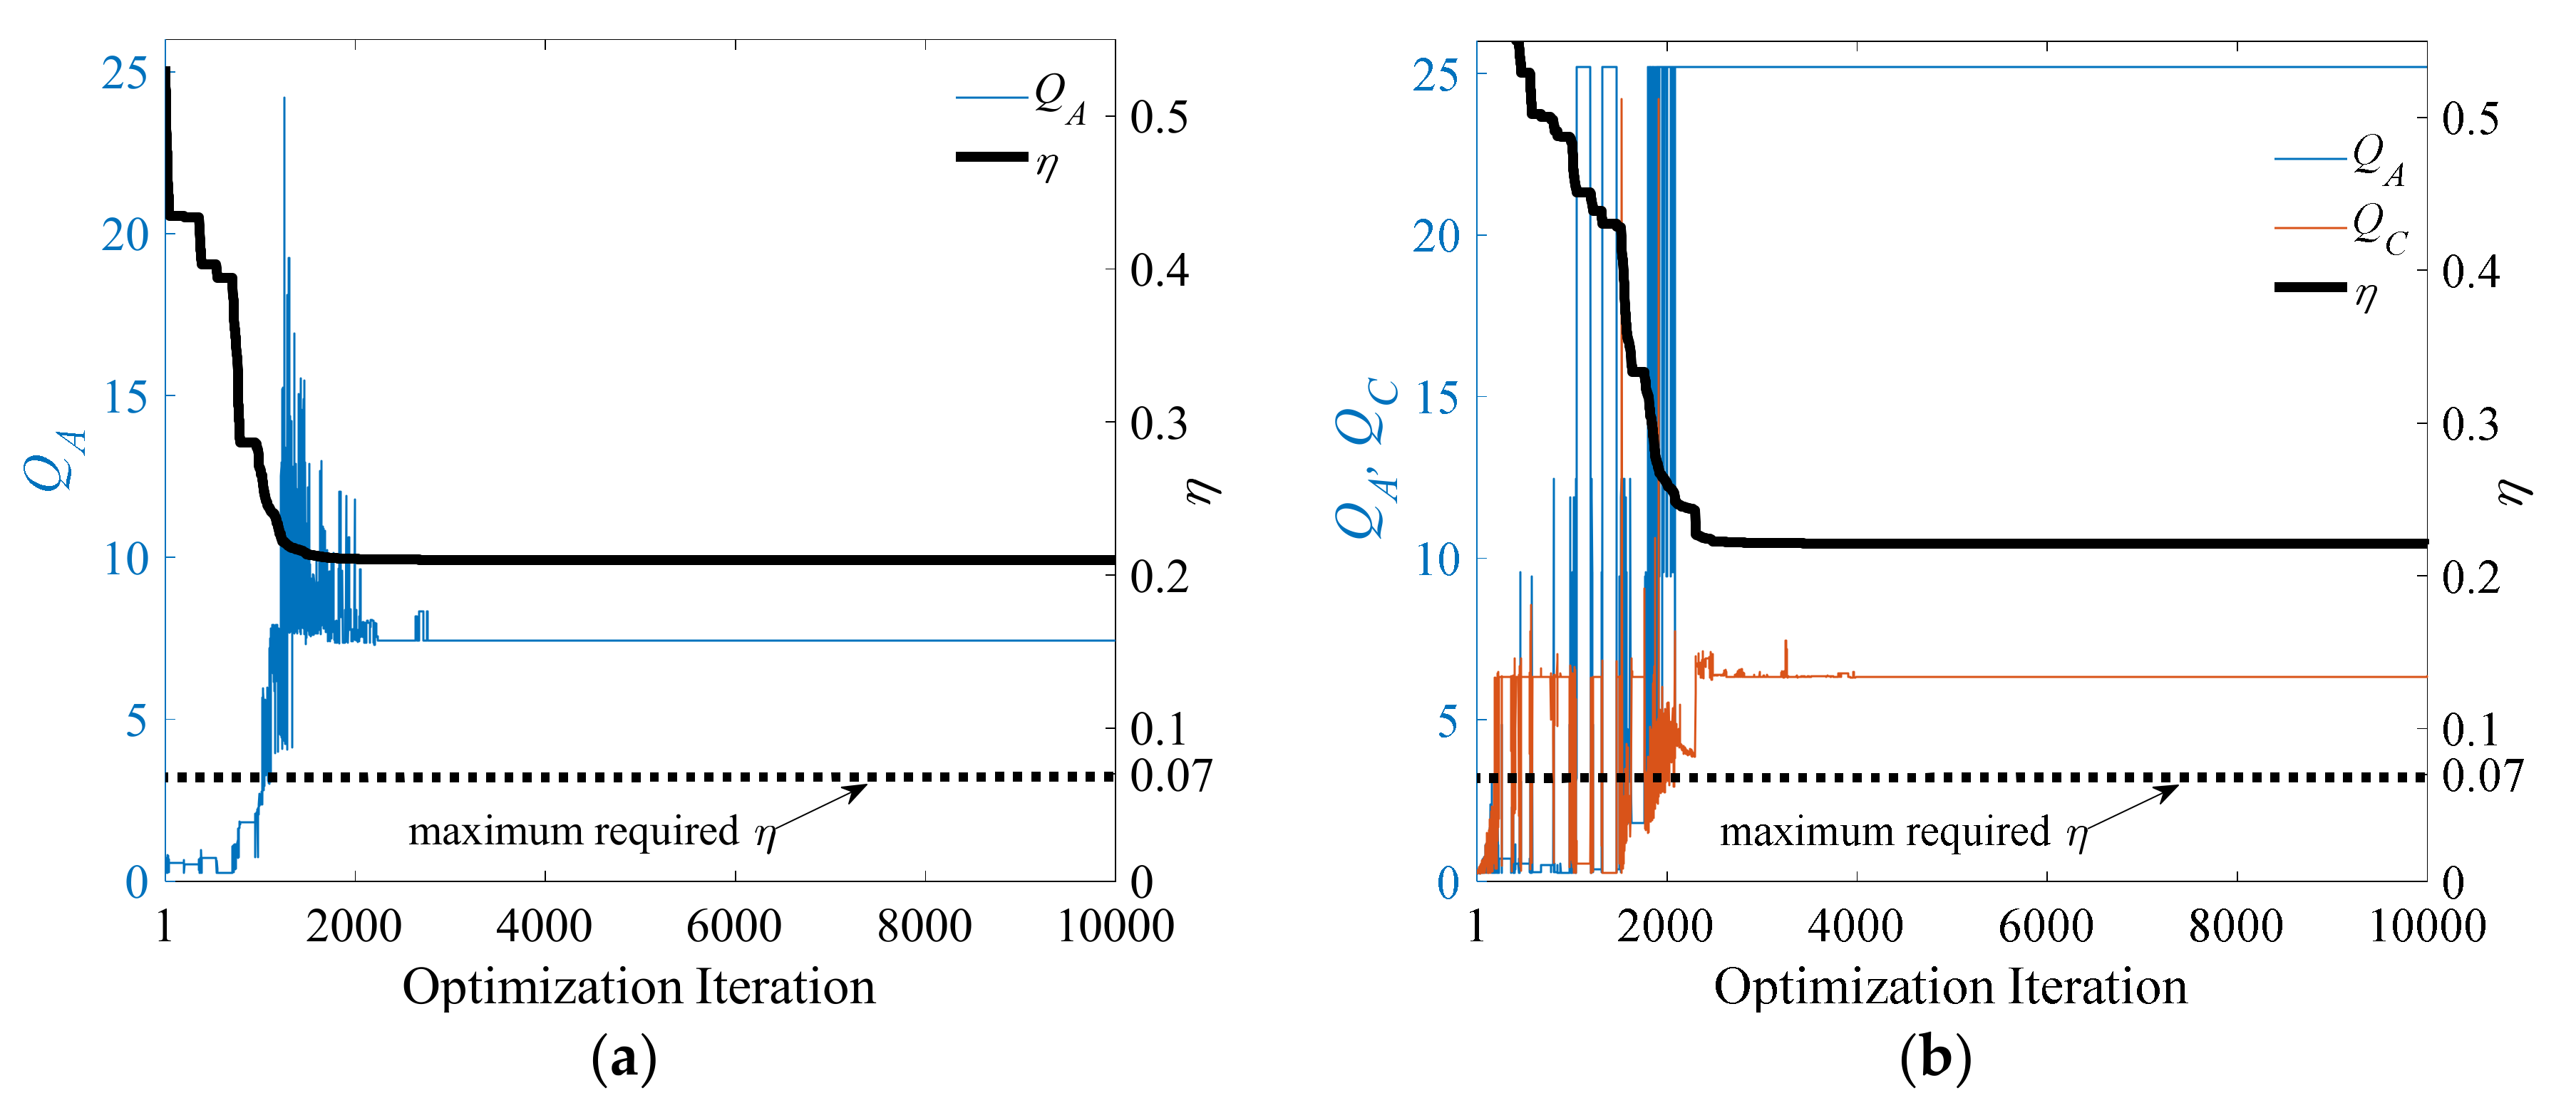
The optimisation results are given in Figure 10a for the single-phase imbalance and in Figure 10b for the two phase imbalance compensation. Approximately 3000 iterations for the single-phase imbalance compensation and 4000 iterations for the two-phase imbalance compensation were taken as sufficient to judge the optimisation’s convergence, where each iteration includes an EMT simulation. The Genetic Algorithm [31] was used as an optimisation algorithm, where the settings (e.g., initial population, mutation rate, pairing method, etc.) were chosen as recommended in Reference [32]. The influence of the algorithm’s settings on the optimisation results is out of the scope of the current work and is left as a topic for further research.
In neither of the cases, converged to a value smaller than 0.07 per unit and, consequently, no adequate degree of asymmetry capable of mitigating DFIG-SSR was identified. On the contrary, for the investigated DFIG, the PIC concept consistently performed either the same as or worse than the classical series compensation scheme. This is concluded by observing the evolution of as the degree of asymmetrical change. It shows that decreases with increasing values of , but never reaches a value below 0.215 per unit, which is the value of for the classical series compensation scheme. For the sake of consistency, the optimisations were performed multiple times without affecting the findings.
One way to assess in more detail the influence of on mitigating DFIG-SSR (and, thus, on ), is to observe how the at , , changes with changes in the degree of asymmetry . Using Equation (11), can be observed by observing the peak current . The higher , the stronger and the larger , i.e., the poorer the capability for mitigating DFIG-SSR. Different levels of asymmetry in phase were evaluated. Table 1 provides the resonance frequency and maximum phase current for five values of . For the analysis, the operating point of the DFIG was fixed at a windspeed of 10 m/s (the nominal windspeed of the DFIG is 10.2 m/s). DFIG-SSR occurs mainly below nominal windspeeds [1], which is the reason why the windspeed of 10 m/s was selected. However, lower windspeeds will not alter the main conclusions of the analysis. For comparison purposes, the results from the classical compensation scheme are included as well.
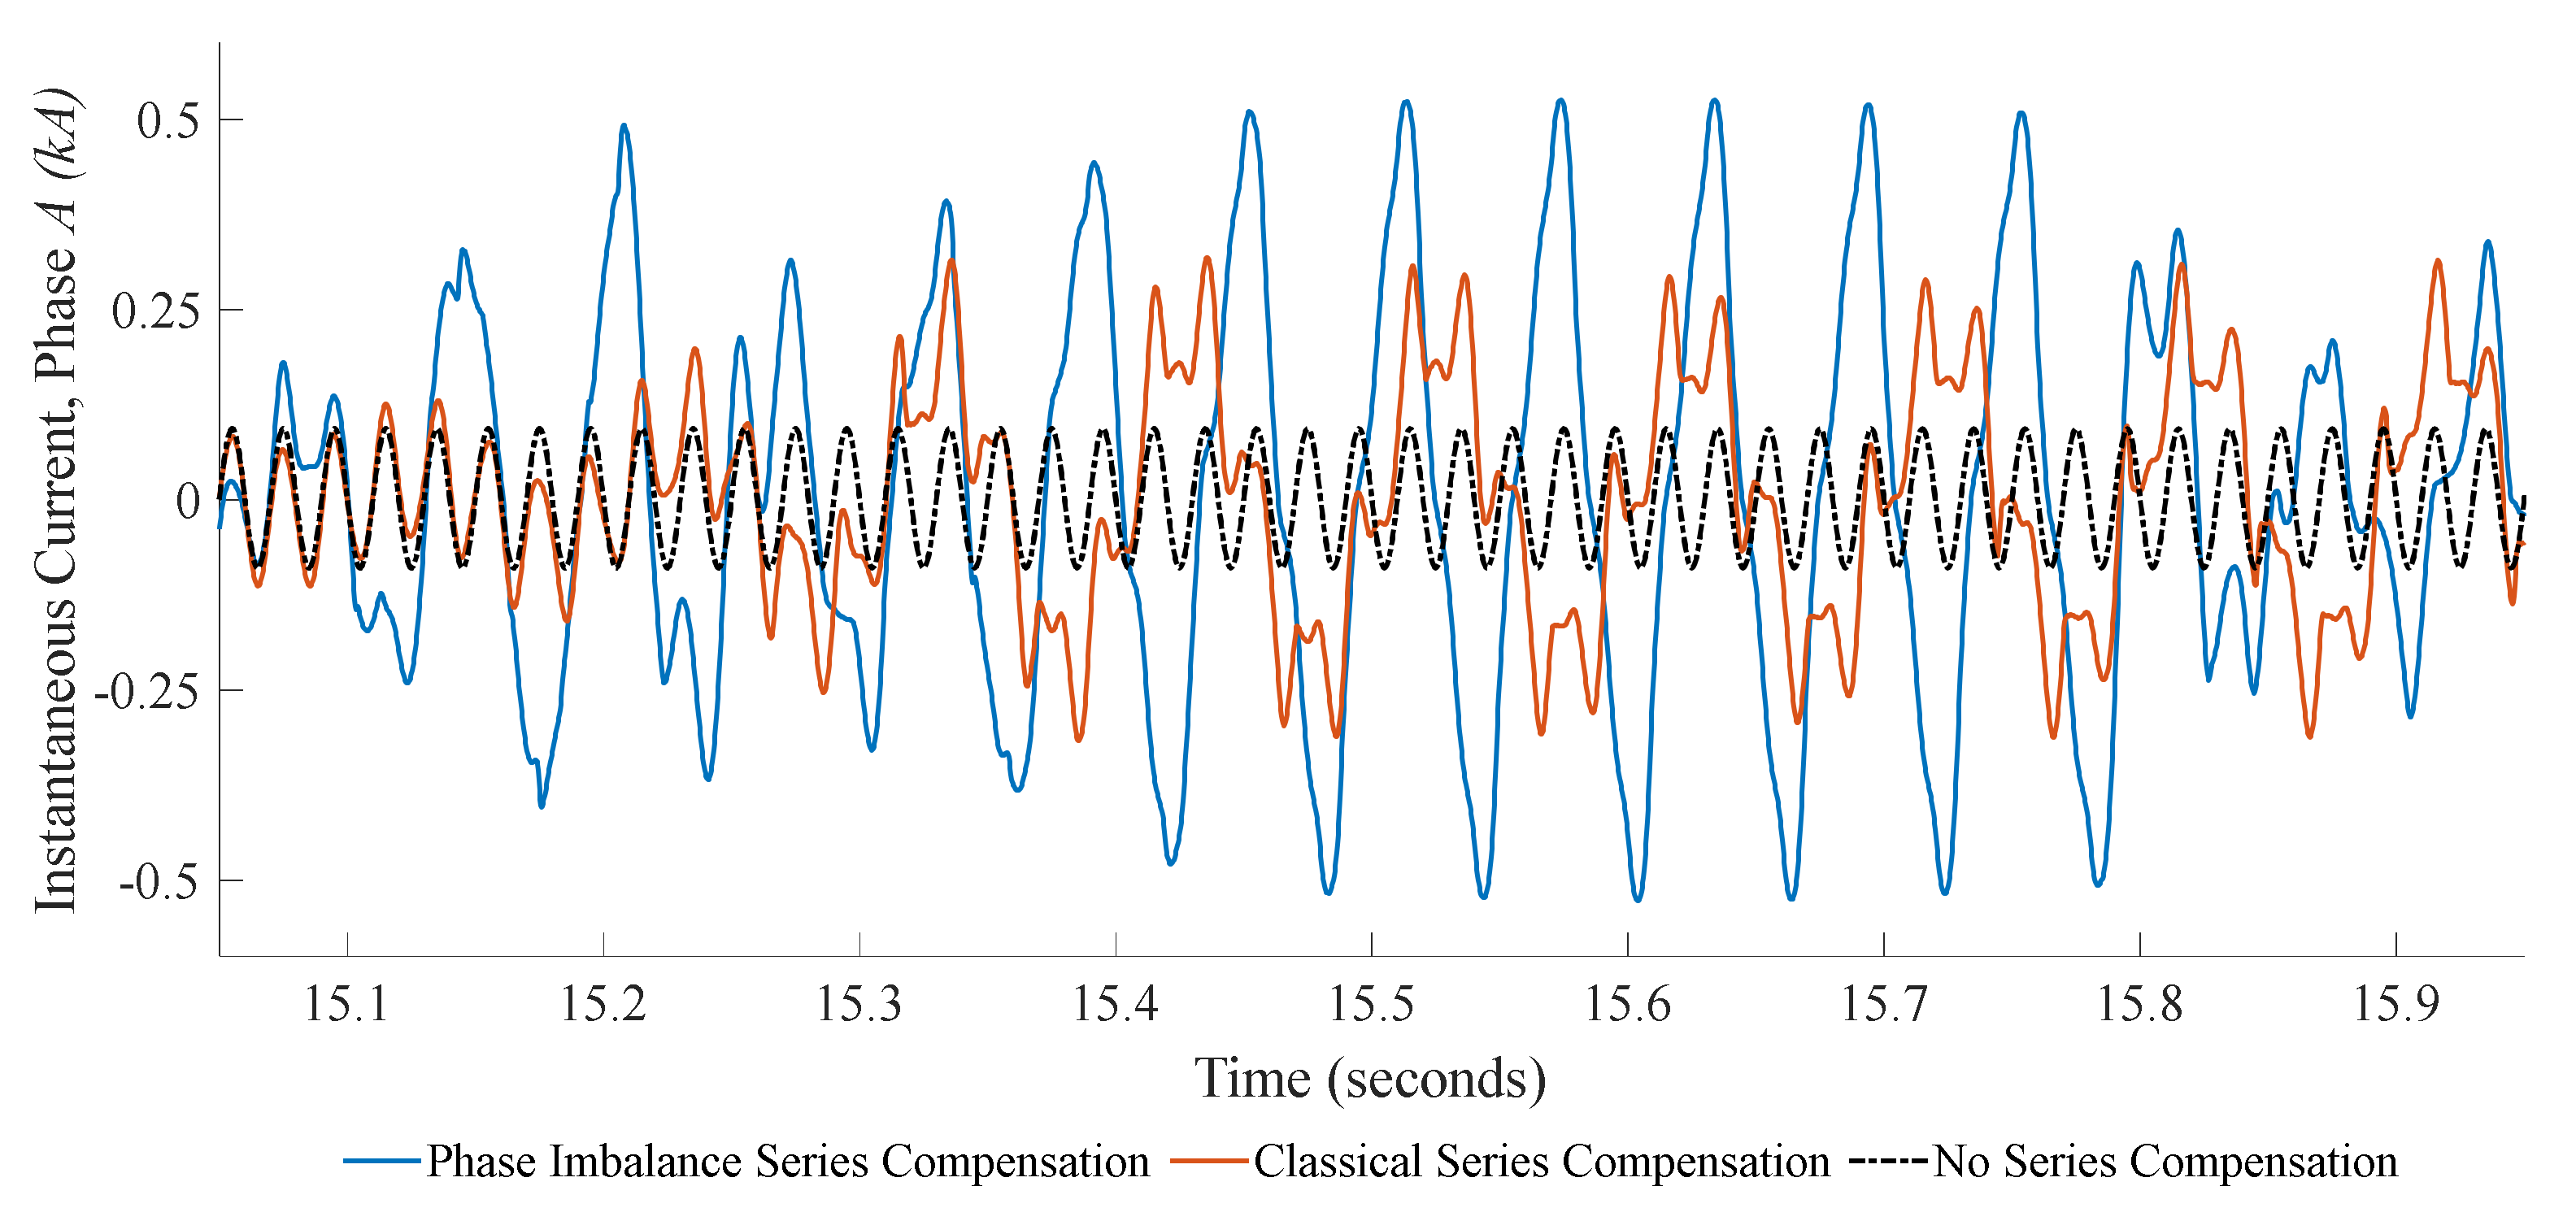
Two observations can be made. First, it is confirmed again that the resonance frequency increases by reducing the degrees of asymmetry. This is in line with Equation (19). Second, with decreasing (i.e., increasing ), increases, which implies that, with lowering degrees of asymmetry, increases. Figure 11 shows the measured instantaneous current in phase for three cases: no series compensation, classical series compensation, and phase imbalance compensation. It shows a worse performance of the phase imbalance series compensation compared to the classical series compensation. This -- relation explains why is relatively large for small values of and small for larger values of .
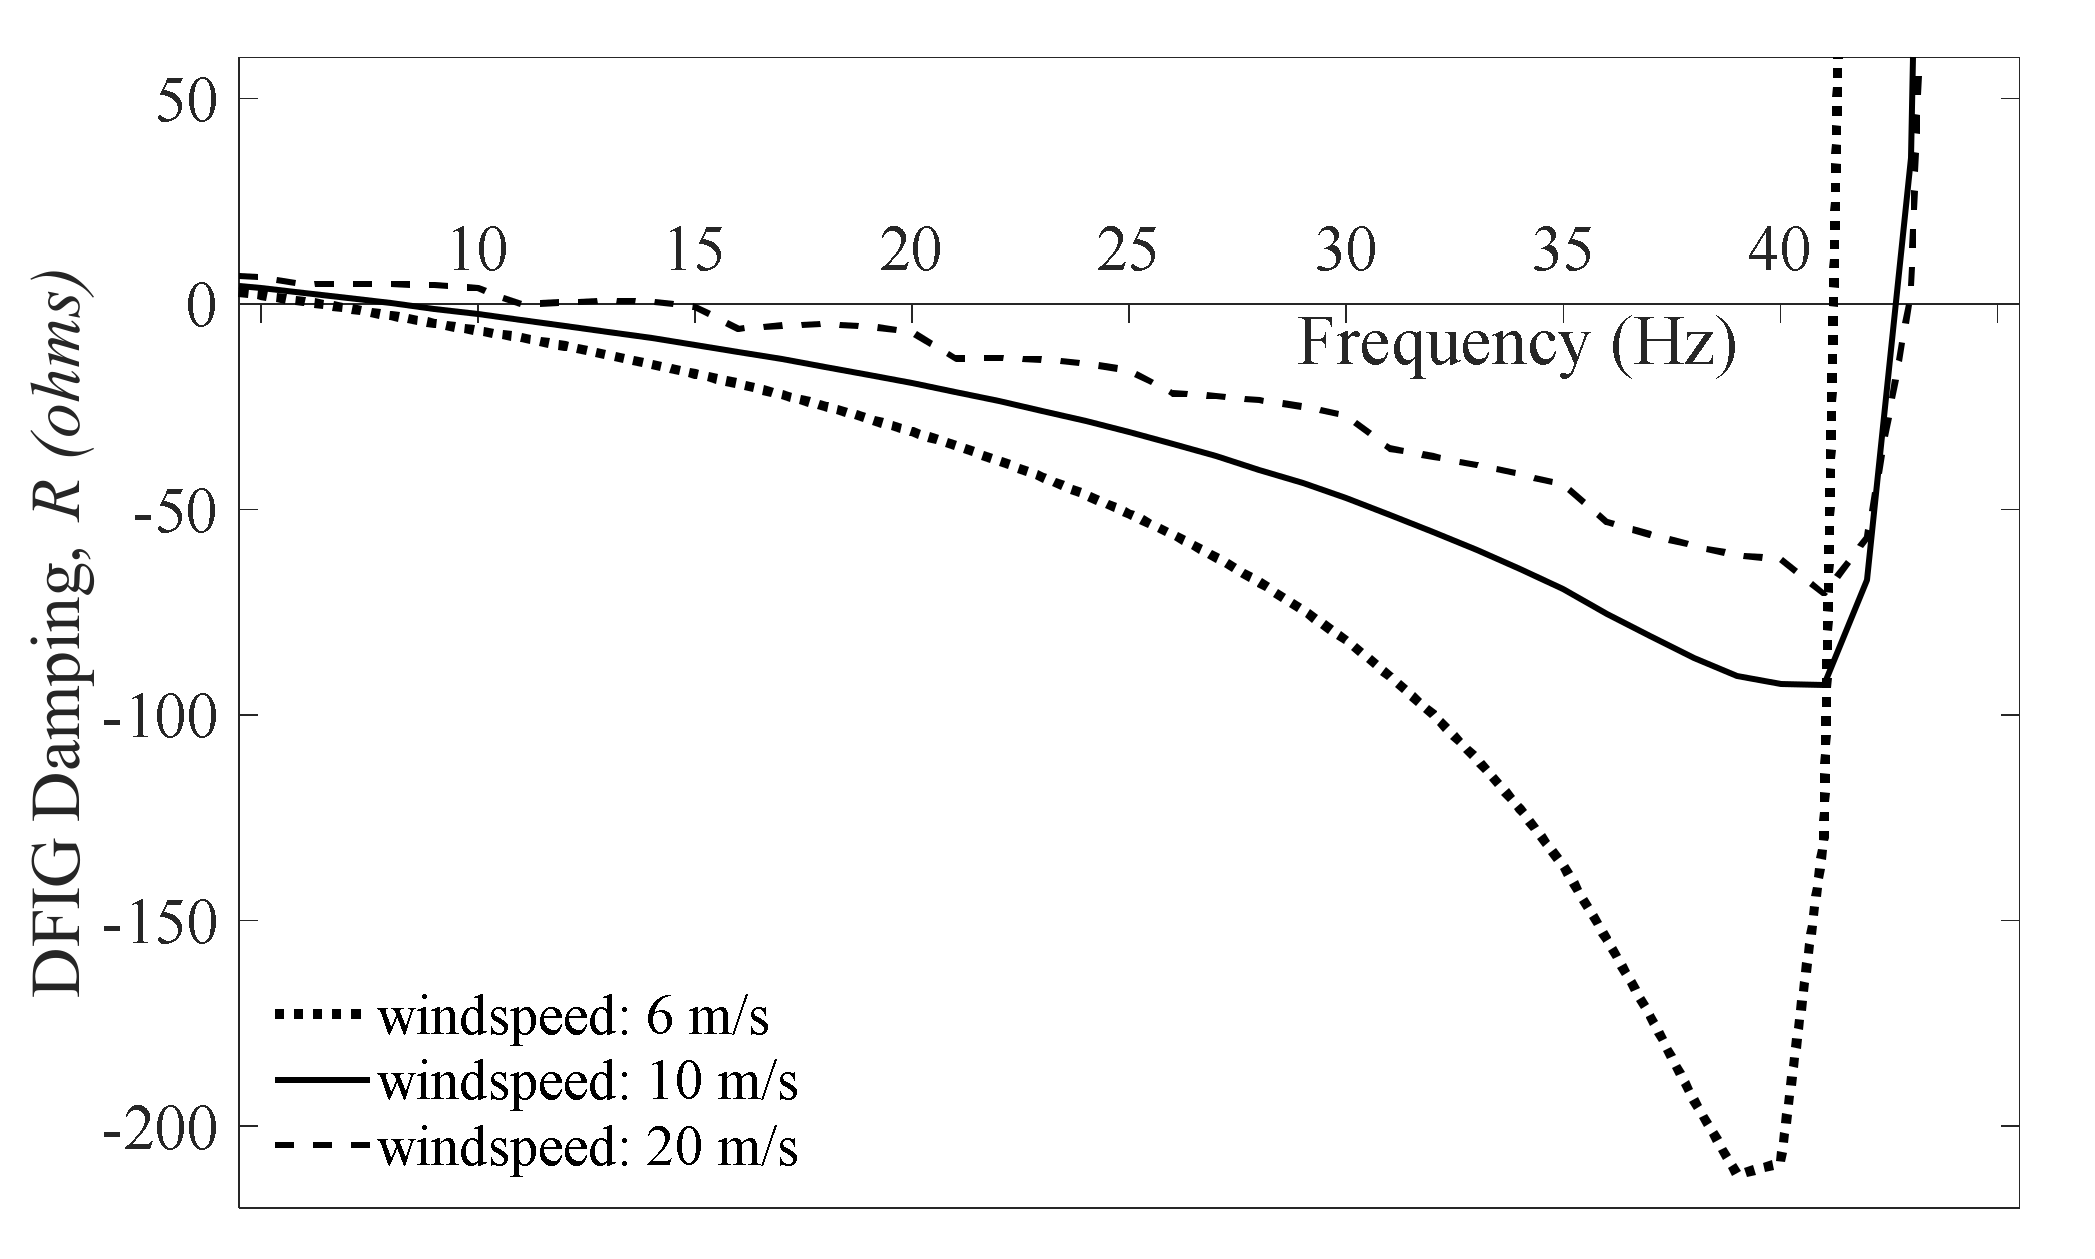
Lastly, to explain why is increasing as decreases, it is necessary to investigate the damping characteristic of the DFIG. Using the perturbation-based dynamic frequency scan [30], the damping of the DFIG was estimated at windspeeds of 6 m/s (i.e., below nominal windspeed), 10 m/s (i.e., around nominal windspeed), and 20 m/s (i.e., above nominal windspeed). The results are given in Figure 12.
The following conclusions can be drawn from Figure 12. First, Considering the of 10 Hz, any achieved by means of phase imbalance compensation, where remains in the negative resistance region, will deteriorate the damping provided by the DFIG. To achieve an outside the negative resistance region requires -values, which are not economical for practical applications. For different windspeeds, the negative resistance region of the DFIG is given in Table 2.
Second, for the same , the damping worsens with decreasing windspeeds. Therefore, the design of the PIC as a mitigation solution for DFIG-SSR needs to be validated across several operating conditions.
4.5. Mitigating Torsional SSR with PIC
The analytical model that was developed in Section 4.2 proved that, for any degree of asymmetry in the phase imbalance compensation, the resulting resonance frequency is increased. Furthermore, Section 4.4 showed that, in the negative resistance region of a DFIG, the negative damping increases with a growing resonance frequency. It was concluded that the PIC cannot mitigate DFIG-SSR, as the resulting shift in deteriorates the electrical damping even further.
Why is it then that the PIC is theoretically able to mitigate classical SSR, as was shown in Reference [8]? This is due to the fact that the negative resistance region for a conventional generator is rather limited compared to a DFIG. This is briefly discussed by using two examples. For a wind power plant in China, torsional interaction (SSR) was investigated. Using the complex torque coefficient method, electrical damping coefficients under different wind power output levels were calculated (Figure 13 [33]).
The possibility of a torsional interaction with of 31 Hz was identified. At this frequency, the damping coefficients were negative. Compared to the DFIG damping (Figure 12), the negative resistance region in Figure 13 is limited. Increasing with as little as 2 Hz results in positive damping and eliminates the adverse torsional SSR interaction. The PIC is capable of achieving this shift in and, therefore, could be a potential mitigation solution.
In another practical example, SSR analysis was carried out to investigate the torsional characteristics of the Hanul nuclear power plant in Japan [34]. Increased probability of torsional interaction between the generator and a fixed series capacitor was identified, where, depending on the operating condition, ranged between 35 and 39 Hz. A 2–5 Hz shift in would result in positive damping and, therefore, eliminate the adverse torsional interactions. In this case, the PIC could be one of the potential solutions to achieve this.
5. Conclusions
The goal of this paper was to evaluate to which extent the phase imbalance compensation scheme, as an alternative for the classical compensation scheme, can mitigate DFIG-SSR. To this end, an analytical model of the imbalance concept was developed and validated using EMT simulations. To prevent biased conclusions, an analysis based on optimisation was proposed and conducted to identify the degrees of asymmetry that could mitigate DFIG-SSR. The optimisation showed that, in the investigated resonance scheme of the imbalance compensation concept, any degree of asymmetry increases the resonance frequency. Due to the impedance characteristic of the DFIG, increasing resonance frequencies make the damping of the DFIG more negative. As a result, the at this frequency only gets stronger and further deteriorates the DFIG-SSR behaviour. Therefore, the investigated phase imbalance compensation concept cannot mitigate DFIG-SSR.
Compared to a DFIG, the negative resistance region for conventional synchronous machines is small in the subsynchronous frequency range. Therefore, the phase imbalance compensation scheme can theoretically mitigate e.g., torsional interactions with a conventional synchronous machine by shifting the resonance frequency outside of the negative resistance region.
Lastly, the evaluation of the capability of other resonance schemes in mitigating DFIG-SSR is left as a topic for further research.
Author Contributions
Conceptualization, V.S. and J.L.R.T. Methodology, V.S., J.L.R.T., and M.v.d.M. Formal analysis, V.S. and J.L.R.T. Investigation, V.S. Data curation, V.S. Writing—original draft preparation, V.S. Writing—review and editing, V.S., J.L.R.T., and M.v.d.M. Visualization, V.S. and J.L.R.T. Supervision, J.L.R.T. and M.v.d.M. Project administration, V.S. and J.L.R.T. Funding acquisition, J.L.R.T. and M.v.d.M. All authors have read and agreed to the published version of the manuscript.
Funding
This research has received funding from the European Union’s Horizon 2020 research and innovation programme under grant agreement No. 691800. This paper reflects only the authors’ views and the European Commission is not responsible for any use that may be made of the information it contains.
Conflicts of Interest
The authors declare no conflict of interest.
Appendix A

Table A1.
DFIG generator and converter data.
| Parameter | Value |
|---|---|
| GENERATOR | |
| Machine rating | 4 MVA |
| Nominal system frequency | 50 Hz |
| Rated voltage | 0.9 kV |
| Stator leakage inductance | 0.10 p.u. |
| Rotor leakage inductance | 0.11 p.u. |
| Magnetizing inductance | 4.5 p.u. |
| Stator resistance | 0.0054 p.u. |
| Rotor resistance | 0.00607 p.u. |
| Stator/rotor turns ratio | 0.391 |
| Angular moment of inertia | 6 s |
| Drive train stiffness | 200 p.u. |
| Drive train damping | 1.7 p.u. |
| CONVERTER | |
| , , , | 5, 1, 1.2, 1.2 |
| , , , | 0.05, 0.1, 0.02, 0.02 |
| , , , | 0.2, 0.3, 1.5, 2 |
| , , , | 0.5, 0.06, 0.02, 0.02 |
References
- Sewdien, V.N.; Wang, X.; Rueda Torres, J.L.; van der Meijden, M. Critical Review of Mitigation Solutions for SSO in Modern Transmission Grids. Energies 2020, 13, 3449. [Google Scholar] [CrossRef]
- Adams, J.; Carter, C.; Huang, S.H. ERCOT experience with Sub-synchronous Control Interaction and proposed remediation. In Proceedings of the IEEE Power Engineering Society Transmission and Distribution Conference, Orlando, FL, USA, 7–10 May 2012; pp. 1–5. [Google Scholar]
- Pourbeik, P.; Koessler, R.J.; Dickmander, D.L.; Wong, W. Integration of Large Wind Farms into Utility Grids (Part 2—Performance Issues). In Proceedings of the 2003 IEEE Power Engineering Society General Meeting, Conference Proceedings, Toronto, ON, Canada, 13–17 July 2003; Volume 3, pp. 1520–1525. [Google Scholar]
- Song, Y.; Wang, X.; Blaabjerg, F. Impedance-Based High-Frequency Resonance Analysis of DFIG System in Weak Grids. IEEE Trans. Power Electron. 2017, 32, 3536–3548. [Google Scholar] [CrossRef] [Green Version]
- Vieto, I.; Sun, J. Damping of subsynchronous resonance involving Type-III wind turbines. In Proceedings of the 2015 IEEE 16th Workshop on Control and Modeling for Power Electronics, COMPEL 2015, Vancouver, BC, Canada, 12–15 July 2015. [Google Scholar]
- Fan, L.; Miao, Z. Nyquist-stability-criterion-based SSR explanation for type-3 wind generators. IEEE Trans. Energy Convers. 2012, 27, 807–809. [Google Scholar] [CrossRef]
- Vieto, I.; Sun, J. Impedance modeling of doubly-fed induction generators. In Proceedings of the 2015 17th European Conference on Power Electronics and Applications, EPE-ECCE Europe 2015, Geneva, Switzerland, 8–10 September 2015. [Google Scholar]
- Edris, A.-A. Series compensation schemes reducing the potential of subsynchronous resonance. IEEE Trans. Power Syst. 1990, 5, 219–226. [Google Scholar] [CrossRef]
- Edris, A.A. Subsynchronous resonance countermeasure using phase imbalance. IEEE Trans. Power Syst. 1993, 8, 1438–1447. [Google Scholar] [CrossRef]
- Rai, D.; Ramakrishna, G.; Faried, S.O.; Edris, A.A. Enhancement of power system dynamics using a phase imbalanced series compensation scheme. IEEE Trans. Power Syst. 2010, 25, 966–974. [Google Scholar] [CrossRef]
- Rai, D.; Faried, S.O.; Ramakrishna, G.; Edris, A.A. Damping inter-area oscillations using phase imbalanced series compensation schemes. IEEE Trans. Power Syst. 2011, 26, 1753–1761. [Google Scholar] [CrossRef]
- Karaagac, U.; Faried, S.O.; Mahseredjian, J.; Edris, A.A. Coordinated Control of Wind Energy Conversion Systems for Mitigating Subsynchronous Interaction in DFIG-Based Wind Farms. IEEE Trans. Smart Grid 2014, 5, 2440–2449. [Google Scholar] [CrossRef]
- Andersen, B.; Nilsson, S. (Eds.) Flexible AC Transmission Systems; Springer: Cham, Switzerland, 2020. [Google Scholar]
- Ängquist, L.; Ingeström, G.; Jönsson, H.-Å. Dynamic Performance of TCSC Schemes. In Proceedings of the Proceedings of the 1996 CIGRE Session, Paris, France, 14–30 February 1996. [Google Scholar]
- Piyasinghe, L.; Miao, Z.; Khazaei, J.; Fan, L. Impedance model-based SSR analysis for TCSC compensated type-3 wind energy delivery systems. IEEE Trans. Sustain. Energy 2015, 6, 179–187. [Google Scholar] [CrossRef]
- Zhang, X.; Xie, X.; Shair, J.; Liu, H.; Li, Y.; Li, Y. A Grid-side Subsynchronous Damping Controller to Mitigate Unstable SSCI and its Hardware-in-the-loop Tests. IEEE Trans. Sustain. Energy 2020, 11, 1548–1558. [Google Scholar] [CrossRef]
- Khazaei, J.; Asrari, A.; Idowu, P.; Shushekar, S. Sub-Synchronous Resonance Damping using Battery Energy Storage System. In Proceedings of the 2018 North American Power Symposium (NAPS), Fargo, ND, USA, 9–11 September 2018; pp. 1–6. [Google Scholar]
- Crisci, F.; Gomes, P.; Li, B.; Sattinger, W.; Fang, Y.; Roggatz, C.; Lewis, S.; Porwal, R.; Giannuzzi, G.; Zaotini, R.; et al. Power System Restoration—World Practices & Future Trends. CIGRE Sci. Eng. J. 2019, 14, 6–22. [Google Scholar]
- Miller, J.; Brunet-watson, M.; Leighfield, J. Review of Series Compensation for Transmission Lines; PSC North America: Westborough, MA, USA, 2014. [Google Scholar]
- Wang, L.; Xie, X.; Jiang, Q.; Liu, H.; Li, Y.; Liu, H. Investigation of SSR in Practical DFIG-Based Wind Farms Connected to a Series-Compensated Power System. IEEE Trans. Power Syst. 2015, 30, 2772–2779. [Google Scholar] [CrossRef]
- IEEE Subsynchronous Resonance Working Group. First benchmark model for computer simulation of subsynchronous resonance. IEEE Trans. Power Appar. Syst. 1977, 96, 1565–1572. [Google Scholar] [CrossRef]
- Zhao, H.; Liu, F.; Zhang, H.; Liang, Z. Research on a learning rate with energy index in deep learning. Neural Netw. 2019, 110, 225–231. [Google Scholar] [CrossRef] [PubMed]
- Xie, X.; Liu, W.; Liu, H.; Du, Y.; Li, Y. A system-wide protection against unstable SSCI in series-compensated wind power systems. IEEE Trans. Power Deliv. 2018, 33, 3095–3104. [Google Scholar] [CrossRef]
- Li, P.; Xiong, L.; Wu, F.; Ma, M.; Wang, J. Sliding mode controller based on feedback linearization for damping of sub-synchronous control interaction in DFIG-based wind power plants. Electr. Power Energy Syst. 2019, 107, 239–250. [Google Scholar] [CrossRef]
- Zhao, S.; Wang, N.; Li, R.; Gao, B.; Shao, B.; Song, S. Sub-synchronous control interaction between direct-drive PMSG-based wind farms and compensated grids. Electr. Power Energy Syst. 2019, 109, 609–617. [Google Scholar] [CrossRef]
- IEC. International Standard 61400-27-1: Wind Turbines—Part 27-1: Electrical Simulation Models—Wind Turbines; IEC: Geneva, Switzerland, 2015. [Google Scholar]
- TenneT. H2020 Project MIGRATE Website. Available online: https://www.h2020-migrate.eu/ (accessed on 3 July 2020).
- MIGRATE. MIGRATE Project Type 3 and Type 4 EMT Model Documentation; MHRC: Winnipeg, MB, Canada, 2017. [Google Scholar]
- Wang, T.C.Y.; Ye, Z.; Sinha, G.; Yuan, X. Output filter design for a grid-interconnected three-phase inverter. In Proceedings of the PESC Record—IEEE Annual Power Electronics Specialists Conference, Acapulco, Mexico, 15–19 June 2003; Volume 2, pp. 779–784. [Google Scholar]
- Badrzadeh, B.; Sahni, M.; Zhou, Y.; Muthumuni, D.; Gole, A. General methodology for analysis of sub-synchronous interaction. IEEE Trans. Power Syst. 2013, 28, 1858–1869. [Google Scholar] [CrossRef]
- Haupt, R.L.; Haupt, S.E. Practical Genetic Algorithms; Wiley-Interscience: New York, NY, USA, 1998. [Google Scholar]
- PSCAD. USER’S GUIDE on the Use of PSCAD; PSCAD: Winnipeg, MB, Canada, 2018. [Google Scholar]
- Jiang, H.; Song, R.; Du, N.; Zhou, P.; Zheng, B.; Han, Y.; Yang, D. Application of UPFC to mitigate SSR in series-compensated wind farms. J. Eng. 2019, 2019, 2505–2509. [Google Scholar] [CrossRef]
- Tran, M.Q.; Dinh, M.C.; Lee, S.J.; Lee, J.I.; Park, M.; Lee, C.H.; Yoon, J.S. Analysis and mitigation of subsynchronous resonance in a Korean power network with the first TCSC installation. Energies 2019, 12, 2847. [Google Scholar] [CrossRef] [Green Version]
Figure 1.
Overview of classical and phase imbalance compensation schemes.

Figure 2.
Vector diagram of the phase impedances at fundamental frequency (a) without series compensation and (b) with series compensation. For both cases, the phase diagram of the impedance is shown as well (c). The vector diagrams of the classical series compensation and the phase imbalance compensation are identical at the fundamental frequency.

Figure 3.
Influence of the compensation degree on the resonance frequency () and active power transfer .
Figure 3.
Influence of the compensation degree on the resonance frequency () and active power transfer .

Figure 4.
Vector diagram of the phase impedances at sub-synchronous frequency for (a) classical series compensation and (b) phase imbalance compensation. For both cases, the phasor diagram of the impedance is shown as well (c). At sub-synchronous frequencies, the phases that are compensated using the imbalance concept have different impedances compared to the respective phases that use the classical compensation concept.

Figure 5.
Influence of and on the required degree of asymmetry .

Figure 6.
Modified IEEE First Benchmark Model.

Figure 7.
Influence of the degree of asymmetry on the resonance frequency, as seen from the point of common. (a) Impedance characteristic of phase , and ; (b) Impedance characteristic of phase A for = 0.10, 0.25 and 0.50.
Figure 7.
Influence of the degree of asymmetry on the resonance frequency, as seen from the point of common. (a) Impedance characteristic of phase , and ; (b) Impedance characteristic of phase A for = 0.10, 0.25 and 0.50.

Figure 8.
Impedance response of the doubly fed induction generator (DFIG) and transmission system. Using the impedance-based stability analysis methodology, the resonance frequency was found to be 10 Hz.
Figure 8.
Impedance response of the doubly fed induction generator (DFIG) and transmission system. Using the impedance-based stability analysis methodology, the resonance frequency was found to be 10 Hz.

Figure 9.
Mitigation of doubly fed induction generator-sub-synchronous resonance (DFIG-SSR) after a rotor side converter and controller parameter modification.
Figure 9.
Mitigation of doubly fed induction generator-sub-synchronous resonance (DFIG-SSR) after a rotor side converter and controller parameter modification.

Figure 10.
Optimization of the degree of asymmetry Q to mitigate doubly fed induction generator-sub-synchronous resonance (DFIG-SSR). Imbalance compensation applied for (a) one phase and (b) two phases.
Figure 10.
Optimization of the degree of asymmetry Q to mitigate doubly fed induction generator-sub-synchronous resonance (DFIG-SSR). Imbalance compensation applied for (a) one phase and (b) two phases.

Figure 11.
Measured instantaneous current in phase for three cases: without series compensation, with classical series compensation, and with phase imbalance series compensation.
Figure 11.
Measured instantaneous current in phase for three cases: without series compensation, with classical series compensation, and with phase imbalance series compensation.

Figure 12.
DFIG damping under different windspeed conditions.

Figure 13.
Electrical damping coefficients under different wind generation levels [33].
Figure 13.
Electrical damping coefficients under different wind generation levels [33].

Table 1.
Maximum current at for phase for different levels of asymmetry .
| Q | ||
|---|---|---|
| Classical Compensation | 10 | 0.214 |
| 0.1 | 20 | 0.383 |
| 0.2 | 16 | 0.368 |
| 0.5 | 14 | 0.279 |
| 2.5 | 13 | 0.231 |
| 5.0 | 12 | 0.226 |
Table 2.
Negative resistance region of DFIG under different windspeed conditions.
| Wind Speed (m/s) | ||
| 5 | 6 | 41 |
| 6 | 6.5 | 41.25 |
| 7 | 7 | 41.5 |
| 8 | 7.5 | 42 |
| 9 | 8 | 43 |
| 10 | 8 | 43 |
| 15 | 9.8 | 43 |
© 2020 by the authors. Licensee MDPI, Basel, Switzerland. This article is an open access article distributed under the terms and conditions of the Creative Commons Attribution (CC BY) license (http://creativecommons.org/licenses/by/4.0/).
Share and Cite
MDPI and ACS Style
Sewdien, V.; Rueda Torres, J.L.; van der Meijden, M. Evaluation of Phase Imbalance Compensation for Mitigating DFIG-Series Capacitor Interaction. Energies 2020, 13, 4512. https://doi.org/10.3390/en13174512
AMA Style
Sewdien V, Rueda Torres JL, van der Meijden M. Evaluation of Phase Imbalance Compensation for Mitigating DFIG-Series Capacitor Interaction. Energies. 2020; 13(17):4512. https://doi.org/10.3390/en13174512
Chicago/Turabian StyleSewdien, Vinay, Jose Luis Rueda Torres, and Mart van der Meijden. 2020. "Evaluation of Phase Imbalance Compensation for Mitigating DFIG-Series Capacitor Interaction" Energies 13, no. 17: 4512. https://doi.org/10.3390/en13174512
Note that from the first issue of 2016, this journal uses article numbers instead of page numbers. See further details here.