Investigating the Potential for Increased Energy Utilisation and Reduced CO2 Emissions at Mo Industrial Park


1
SINTEF Industry, Process Technology, Postboks 4760 Torgarden, N-7465 Trondheim, Norway
2
SINTEF Helgeland, Postboks 1364, 8602 Mo I Rana, Nordland, Norway
*
Author to whom correspondence should be addressed.
Energies 2020, 13(18), 4627; https://doi.org/10.3390/en13184627
Submission received: 17 June 2020
/
Revised: 24 August 2020
/
Accepted: 31 August 2020
/
Published: 5 September 2020
Abstract
:The potential for increased energy utilisation and reduced carbon footprint has been investigated for the industrial park Mo Industri Park (MIP), located at Mo i Rana, Norway. Process data has been gathered to quantify the energy flows between industrial clients. The energy flows have been visualised quantitatively in Sankey diagrams, while the quality of the available energy is presented in the form of a grand composite curve. High temperature flue gas from ferrosilicon (FeSi) production at Elkem Rana represent the largest heat source available for utilisation. A theoretical assessment of potential applications for this energy is presented and includes: (1) electricity production; (2) local biocarbon production, where surplus heat is utilised for drying of wood chips; (3) post combustion carbon capture, where surplus heat is utilised for solvent regeneration. The results indicate that increasing the current energy recovery from 400 GWh to >640 GWh is realistic. The increase in energy recovery can be used for reducing the carbon footprint of the industrial park. Investment in a common utility network for surplus heat may lower the threshold for establishing other energy clients at MIP. These are possibilities which may be investigated in more detail in future work.

1. Introduction
The industry sector is directly emitting 24% (8.5 Gt) of total global CO2 emissions and is accountable for 37% (156 EJ) of the global energy use [1]. Increased attention has been given to how interactions among different companies, industries and sectors can contribute to lowering the industry sectors’ energy use and greenhouse gas emissions [2]. Such interactions are often seen within the scope of the circular economy and are usually divided into three levels: the micro level (products, companies, consumers), meso level (eco-industrial parks) and macro level (city, region, nation and beyond) [3]. At the meso-level, eco-industrial parks have gained increased attention in the last decades, and this is also labelled industrial symbiosis [4]. Geographic proximity and collaboration can provide and enable both economic and environmental benefits for the companies through the exchange of energy, water, materials, as well as services such as permitting transportation and marketing [4]. Several recent studies have highlighted how an energy-intensive industry located in industrial parks can gain increased energy and material efficiency as well as CO2-reduced emissions through such symbiosis [5,6,7,8,9].
There is a vast literature in the field of industrial parks and their energy systems. Directions in research ranges from strategies and policies for development of eco-industrial parks [10,11], studies investigating how to measure the environmental performance [12,13], and optimisation of energy systems in industrial parks [14,15]. Energy recovery in industrial parks is a topic which has received interest in the academic community and a number of systematic design techniques have been developed and applied over the years [16]. Total site heat integration (TSHI) was introduced by [17]. They extend the design and targeting procedures from Pinch Technology [18] to the concept of total sites, which constitute factories which are energetically linked through a central utility system. The methodology presented is applicable both in so-called grassroots design of new factories and in retrofit situations in existing factories and industrial sites. The methodology and relevant tools are further developed by [19], who reports results from a number of case studies where the applications of the methodology have resulted in savings in both energy (30%) and capital (10%). Matsuda et al. [20] presents results from applying area-wide pinch technology on one of the largest chemical complexes in Japan. The study demonstrated significant potential for energy savings at the site. The results were reported to have initiated several projects on energy recovery, where the total annual energy saving was estimated to around 250 GWh. Hackl et al. [21] performed a total site analysis (TSA) on the industrial cluster of chemical companies located in Stenungsund in Sweden. The report published in 2010 was meant to provide a basis for future implementation of energy system integration. The following methodology was applied:
- Stream data for temperature and enthalpy flows (, , ) and data on utility consumption was collected.
- Steam from by-product incineration was also considered as a source for process heat.
- The data was presented in so-called total site profiles (TSP) and total site composite curves (TSC). This analysis provided information on the site pinch temperature and was used to identify the most attractive measures to increase heat recovery.
- The sitewide potential for co-generation and measure for reducing the external cooling demand below ambient temperature was also analysed.
Røynet et al. [6] revisited the Stenungsund chemical industry cluster and compared the current state of an industrial park with possible future configurations focusing on increased energy integration and replacing fossil feedstock with forest-based feedstock and compared the different scenarios in a lifecycle assessment. According to [6], little attention has been given to analyse how the environmental impact can be further reduced in already existing industrial parks. An investigation of how enviromental impact can be reduced in existing parks is case-specific in its nature, and the approach used in this study will therefore use a case study as a basis.
Mo Industrial Park (MIP) at Mo i Rana is one of Norway’s largest industrial parks. The park hosts ferroalloy and steel industries together with several other industrial companies. The ferroalloy and steel industry is characterised as an energy intensive industry with large demands for electrical energy in particular. A large surplus of thermal energy is generated by the process and is available over a wide range of temperature levels. MIP has for a long time recognised the surplus energy as a valuable asset for the industrial park and has, together with the industrial clients, been working ambitiously with energy recovery. Currently, MIP is reporting an annual energy recovery of 400 GWh out of an estimated potential of 900 GWh (Figure 1). Their ambition is to increase the annual energy recovery to 640 GWh by further utilising available energy streams.
The aim of the current study is to gather data on the current energy use within the park and evaluate theoretically the potential for alternative utilisation of the surplus energy in applications which may be beneficial to the current industrial clients. The industry has identified the replacement of fossil carbon reduction materials with increased use of bio-based reduction material (biocarbon) and CO2 capture and utilization or sequestration as the applications of greatest potential. The heat integration potential with future carbon capture facilities and biocarbon production facilities will therefore be explored theoretically.
2. Methodology
In order to assess the energy use and potential for recovery, a mapping of the current energy flows and temperature levels was required to establish a reference base case. This is a challenging task as it involves multiple industrial entities, the production can have seasonal variations with changing ambient conditions, not all states and magnitudes of process flows are measured or easily estimated, etc. In this work, the industrial entities are treated as independent units and only the known exchanges over the company battery limits were considered. The exchanges are either raw materials that represent significant energy content, utility exchanges, or products and effluents.
Data has been systematically gathered for all major entities in the industrial park in order to evaluate the current status and future potentials for energy use. This data serves as a parameter set for modelling the total energy flow and establishing a benchmark. Some prospective new processes are considered and the effect of the integration on the total energy flow is analysed.
2.1. Data Collection and Analysis
More than 100 different companies are located in Mo Industrial Park. The focus in this analysis is the process industry. Other actors in the park are considered relevant if they are either (1) large energy consumers or (2) interlinked with the process industry in terms of energy flows. Based on this, the actors listed in Table 1 were identified:
The collected data was compiled from a combination of publicly available sources and from data provided by the respective companies. The publicly available data has been used wherever possible and complemented by calculations and approximations based on the literature. The collected energy data was confined to the geographical co-located industrial companies in MIP at the companies’ battery limits, see Figure 2.
The annual energy input was found using official statistics for the companies which are subject to the Norwegian Environment Agency’s reporting obligation and Pollutant Release and Transfer Register (PRTR) [22]. The electricity demand is given in MWh while consumption of fossil fuels, reduction agents, etc. are given in tonnes. The energy content was found by assuming calorific values for the different energy inputs as given in Table A4 in Appendix B.1.
The energy inputs were aggregated into the categories of electricity, coal/char/coke, oil products, gas and biocarbon to simplify the analysis. This energy is consumed and used in reduction processes or for heating purposes and by that converted to chemical or thermal energy. Data on the chemically bound energy and surplus heat were estimated by using open references. Energy assessments from literature were used as estimates for the local cases to allocate surplus heat to the different energy streams. Energy balances were established to reveal lacking information and ensure energy balance consistency. Inconsistencies in energy balances were assigned to energy losses, and thus close the balance.
Figure 3 illustrates the energy flows across the battery limits for the selected actors (listed in Table 1) as a Sankey diagram. The main input is electricity and coal/char/coke which is used as a chemical reduction medium for metal oxides in the submerged arch furnaces (SAF) operated by Elkem and Ferroglobe. The data centre operated by BitFury is also a significant electricity consumer. In Figure 3, the most significant energy integration is carried out by:
- “MIP CO nettverk” which redistributes carbon monoxide (CO)-rich flue gas (204 GWh) from Ferroglobe for heating purposes at Celsa, SMA Minerals, and Mo Fjernvarme
- “Mo Fjernvarme” which recovers latent heat from flue gas from Elkem (125 GWh) for use as district heating
- “Ranfjord fiskeprodukter” which utilises cooling water from Elkem (40 GWh).
In total, this sums up to 369 GWh of recovered energy. In addition to the abovementioned utilisations of surplus heat, MIP also produces electricity from turbines in the water-cooling utility systems. This is not shown in the Sankey diagram in Figure 3, as the focus in this work is the surplus heat.
While Figure 3 illustrates the size of energy flows between the various actors, it does not provide information on the possibilities for further heat integration, which among other things depends on the temperature level of the heating and cooling demands. This information can be illustrated in a so-called Grand Composite Curve (or Heat Surplus Diagram) [18,23] which shows the aggregated heating and cooling demands at each temperature level of the process streams. The Grand Composite Curve for MIP in Figure 4 shows that MIP has an energy surplus. The existence of pockets in the curve, such as in the case for temperatures less than 80 °C in the right end of the curve, indicates a possibility for heat integration between an enthalpy surplus and an enthalpy demand. Except for the low temperature end, the remainder of the curve shows no such significant pockets. There is no heating demand above the process pinch temperature (at 1200 °C). The energy available at the temperature interval 1200–600 °C is related to cooling of metal from the SAF. Although studies have been made [24], this energy is likely to be more challenging to utilise compared to the energy available in flue gas from Elkem (below 600 °C). In the Sankey diagram in Figure 3, this flue gas stream has been split into "Off gas, unavoidable heat loss" which represents the energy in the flue gas in the temperature interval from ambient to 180 °C. Due to local environmental considerations, governmental regulations are imposed on the lower limit of flue gas emissions. The energy stream to "Off gas pipe loss" (332 GWh) represents the energy content in flue gas in the temperature interval 600–180 °C which could be utilised.
A significant high quality/temperature energy source available for utilisation can be identified from Figure 4. Above 200 °C, the available thermal effect is around 100 MW. Of these, about 40 MW is available as continuously produced flue gas at a temperature level of 180–600 °C. The main challenge is to identify existing or new energy consumers that can utilise the surplus energy in a sustainable and economical way.
2.2. Modelling
A simplistic modelling approach has been applied to describe the overall mass and energy flows between the industrial processes included in this work. The purpose has been to describe qualitatively the main design tradeoffs which are being investigated. A complete description and modelling of all industrial actors within MIP is outside the scope of this work. With respect to cost estimation, the focus has been on cost related to electricity consumption and cost related to the CO2 emissions. Other energy input costs, such as the cost for biocarbon and the coal it replaces, have been omitted in this study. Capital expenses related to proposed design changes have not been included.
2.2.1. Silicon and Ferrosilicon Production
In the following, an overview will be given of the Silicon (Si) and Ferrosilicon (FeSi) processes. This is based on Schei et al. [25] and Tangstad [26], and further details may be found there. Elkem Rana produces FeSi in two submerged arc furnaces with a total electrical power of above 100 MW.
The Si and FeSi processes are both performed in open and semi-closed furnaces, meaning that air is supplied to the charge top of the furnace to oxidize CO(g) and SiO(g) according to Equations (1) and (2). The electrical power is supplied through three Søderberg electrodes of typically 1.4–1.9 m in diameter.
The furnaces may be charged by batch charging, but, from an environmental point of view, it is beneficial with a semi-continuous charging [27]. This is due to an increased flue-gas temperature that destroys polycyclic aromatic hydrocarbons (PAH) and dioxins. The main components of the charge mix are quartz, carbon material (charcoal and/or coal), in some cases wood chips, and for FeSi, an iron source such as iron ore pellets. Electric energy is supplied through three electrodes that are submerged in the charge. The furnace process may roughly be divided into a hot zone and a colder zone, where the latter is the upper part of the furnace and the former is the lower part of the furnace centred around a crater where an electric arc dissipates energy. The overall reaction of the furnace may be given as in Equation (3). Equation (4) describes the reaction taking place in the hot part of the furnace, where Si(l) and SiO(g) is formed. Further, SiO(g) from the hot zone will be a loss of Si units if not either reacted with carbon (Equation (5)) or condensed (Equation (6) or (7)) in the colder zone of the furnace.
In the later years it is common at Norwegian Si and FeSi plants to have energy recovery. At Elkem Rana there is currently a boiler installed to recover heat for the district heating system at Mo i Rana, the largest based on recovered energy in Norway.
The flue gas composition and flow rate from a FeSi SAF has been described based on parameters outlined in Table 2 and represent typical average flue gas composition from a FeSi furnace. The composition will vary some based on operating conditions and charge composition. Typically, the moisture content increases during the winter due to ice and snow in the raw materials. It represents a simplistic modelling approach which can be representative for a "generic" quality of FeSi. A description of the energy flow around the furnace is given here, which will give a qualitatively correct representation. The composition of the flue gas from the charge top is specified and is based on information from the project Staged Combustion for Energy Recovery in Ferroalloy industry (SCORE) [28,29]. The flue gas flow rate is assumed to scale linearly with the furnace electrical power. The same applies for mass flows of ore, carbon and metal produced [30,31,32]. The mass and energy balances for combustion of furnace flue gas with air and recirculated flue gas are calculated using the open source physical properties library [33], which is based on the Shomate enthalpy correlations from the National Institute of Standards and Technology (NIST) Chemistry WebBook [34,35]. Recirculated flue gas is used to meet the maximum inlet temperature (750 °C) to the waste heat recovery unit (WHRU) in cases where the amount of excess combustion air (ingress air) alone would not be sufficient to cool down the flue gas before the waste heat recovery unit. The simulation of the SAF performance was based on the parameters given in Table 2.
2.2.2. Waste Heat Recovery Unit
The waste heat recovery unit was simulated with design parameters as given in Table 3. For external energy clients, it was assumed that the thermal energy was taken out as saturated steam. The flue gas from the SAF was assumed to have a maximum temperature of 750 °C. The physical properties of water and steam were calculated using the open source implementation of the international-standard IAPWS-IF97 steam tables [36].
2.2.3. Carbon Capture
Conventional amine-based absorption technology for post combustion CO2 capture has been considered in this work. At MIP there are several potential flue gas sources which are candidates for a carbon capture facility, where either use or storage of CO2 is possible. For absorption-based CO2 capture, the main energy requirements are linked to thermal regeneration of the amine solvent which takes place in a stripper column typically operating at a reboiler temperature of around 120–130 °C. Once the solvent system has been selected, the thermal energy requirements are defined by the specific reboiler duty (SRD) (GJ/t CO2), which is a function of the CO2 concentration in the flue gas [37] and of the capture rate.
The specific reboiler duty for state-of-the-art absorption technology has been demonstrated by using 30 wt% mono ethanol amine (MEA) as solvent at the Norwegian test facility TCM [38]. Gorset et al. [39] reports that the specific reboiler duty of 3.8 MJ/t CO2 captured was achieved with MEA as a solvent operating at 87% capture rate on a flue gas with 3.7 vol% CO2.
The influence on energy consumption and the concentration and capture rate has been investigated theoretically by [40]. They derived the following theoretical relation for the ideal work of mixing of CO2 as a function of flue gas concentration and CO2 capture rate:
By normalising with the results reported by for MEA, we get a rough estimate for the SRD as a function capture rate and flue gas composition as follows:
Figure 5 shows the estimated specific reboiler duty for a range of conditions when estimated using Equation (9). It is expected that the estimated SRD is too low for high concentrations of CO2. However, the qualitative trend can be expected to be correct and the accuracy to be sufficient at this conceptual level of design. Knudsen et al. [41] tested three different solvents (20 wt% MEA, CESAR1 and CESAR2) on flue gas from a coal power plant (13 vol% CO2). The best solvent (CESAR1) achieved an SRD value close to the 90% capture line in Figure 5.
2.2.4. Biocarbon Production
The modelling framework and assumptions made regarding biocarbon production was to a large extent based on the work by Olszewski et al. [42]. They present a techno economical evaluation of biocarbon production processes, with focus on Norwegian conditions and conclude that there are economic benefits by supplying logwood rather than wood chips to the end user of biocarbon. We therefore consider production of biocarbon at the ferroalloy plant where surplus heat may be utilised for the energy intensive drying process of virgin biomass. The composition of produced biocarbon, pyrolysis gas and pyrolysis oil is estimated from empirical correlations presented in [43].
2.3. Key Performance Indicators
The key performance indicators used in this study are focusing on CO2 footprint, net electricity consumption or costs related to both factors. The key performance indicators in this study are limited to a per company level, or on the battery limits of the production facility. The performance of the whole park was not assessed.
- CO2 footprint as kg CO2 equivalents per kg metal produced (kgCO2/kg Me)
- Net electricity consumption as kWh(el) per kg metal produced (kWh/kg Me). Net electricity consumption is electricity input to SAF minus electricity produced in the waste heat recovery steam cycle
- Electricity and CO2 emission costs per kg metal produced (EUR/kg Me).
The parameters related to the key performance indicators are summarized in Table 4.
The carbon footprint is analysed on two levels or scopes. Scope 1 include the direct CO2 emissions from the combustion of fuels from the stationary processes within the industrial park. Scope 2 emissions include the indirect CO2 emissions related to the consumed electricity in the industrial park.
Biogenic CO2 emissions are regarded as CO2 neutral in the CO2 footprint. The biogenic CO2 emissions will not contribute towards the CO2 emission cost, in line with the regulatory framework EU Emissions Trading System (EU ETS).
The carbon emissions related to the consumption of electricity depend on regional attributes. The regional average production mix, along with imports from neighbouring regions, will yield different carbon intensities of CO2/kWh depending on the regional scope. Several on-line statistics are available which can provide a snapshot of the CO2 footprint per kWh electricity produced or consumed in a given region. The average carbon intensity for different regional scopes are Norwegian (30.5 g CO2-eq/kWh, low-voltage mix) [44], Nordic electricity mix (130 g CO2-eq/kWh) [45], and European (446 g CO2-eq/kWh) [44]. An approximation for the Norwegian high voltage electricity mix was used as a baseline at 25 g CO2-eq/kWh (the high voltage mix has a lower carbon intensity because of lower losses).
The CO2 price in Europe has since 2008 and 2019 varied from 30 to 5 EUR/t CO2. The highest prices were obtained prior to the financial crisis in 2008 and again in 2019 where prices approached 30 EUR/t CO2. In the period after the financial crisis in 2008 and up until 2017, the CO2 prices were 10 ± 5 EUR/t CO2 [46]. A CO2 price of 30 EUR/t was used as the baseline.
The price of electricity for non-household consumers varies in the range from 0.15 EUR/kWh (Germany) to about 0.07 EUR/kWh (Finland). Norway is listed with a price around 0.09 EUR/kWh [47]. These electricity prices for Norway are significantly higher than what Statistics Norway presents as electricity prices for energy intensive industry (0.3 NOK/kWh which is about 0.03 EUR/kWh) [48]. An electricity price at 0.03 EUR/kWh was used as baseline.
Figure 6 shows the fraction of the total electricity price which represents the CO2 costs as a function of CO2 generation caused by electricity production. For the Norwegian market with a low specific CO2 production per kWh electricity, the CO2 costs represent a small part of the total costs. However, if a European electricity mix is considered with almost 10 times higher specific CO2 production per kWh, the cost of CO2 becomes a significant fraction of the overall electricity cost.
Comparisons made on an energy basis have received criticism in that an energy quantity does not reflect the energy potential or thermodynamic "value" of a material [49]. For electricity where losses for voltage (potential) transformations is for the most case negligible, the electrical energy can be used directly in comparisons, irrespective of voltage. To quantify energy for mass flows in heat exchange or involving heat of reactions and phase transformations, some reference must be made to the thermal, mechanical and chemical potential. A simplified analysis based on ambient reference can be made using the concept of exergy or potential useful work extraction [50]. The exergy accounts for the difference in value for work production of a given energy quantity available for two different temperatures. Still, this analysis suffers from the same problem of attributing a per unit product value when having multiple products and quantities.
For ease of comparison and for comprehensive communication of results, this work has focused on comparing the effect on the change in net electricity consumption when including CO2 capture and biocarbon production, while attributing a quota cost for the emission of CO2.
3. Potential New Energy Clients
The energy analysis for Mo Industrial Park shows that there is a significant energy surplus within the park. In the temperature range of 600–200 °C, surplus energy is accessible in the form of hot flue gas from the Elkem production. The default utilisation of this surplus heat would be waste of heat recovery with electricity production, which is currently installed at several ferroalloy production sites in Norway. However, electricity production gives an inherently low utilisation factor (typically <30% of the thermal energy is converted to electricity) and has high capital costs associated with waste heat recovery boilers for super-heated steam production and high-pressure steam turbines. Figure 7 illustrates a number of alternative processes which may utilise surplus thermal heat directly as saturated steam from a more inexpensive waste heat recovery system.
In the following theoretical evaluations, we have focused on two energy demanding production activities which are closely related to improving the sustainability of ferroalloy production processes by reducing the carbon footprint in the processes. Both biocarbon production and post combustion carbon capture represents value chains which are common to both ferro alloy producers at MIP. Both production processes are energy intensive operations which are able to utilise surplus heat in the temperature range around 200 °C. The energy consumption for carbon capture is linked to the CO2 concentration in the flue gas. A simple evaluation of the effect of using recirculated flue gas for flue gas temperature control is therefore included.
In terms of robustness and energy integration between the two ferroalloy producers at MIP, local biocarbon production and carbon capture makes sense as the value chains are interconnected.
3.1. Ferrosilicon Production
The base case for ferrosilicon production was chosen as a 40 MW furnace with a waste heat recovery unit for electricity production. The furnace performance was estimated based on the parameters outlined in Table 2.
3.1.1. Semi-Closed Furnace with Recirculated Flue Gas
Currently, most silicon and ferrosillicon production in Norway is carried out using semi-closed furnace technology, where ingress air is used for controlled combustion of the charge gas being generated in the SAF. In order to maintain a stable flue gas temperature (650–750 °C) towards the waste heat recovery boiler, a high degree of ingress air is required. This leads to a dilute flue gas with high O2 surplus and low CO2 concentration. The large amounts of ingress air also lead to significant stack loss, since ingress air is heated from ambient temperature to the stack temperature of around 150 °C. Thus, the semi-closed furnace technology limits the amount of energy which can be recovered from the flue gas.
The ferrosilicon industry has been working on establishing a semi-closed furnace technology where the combustion of the charge flue gas takes place at a lower oxygen concentration. The recirculated flue gas (from downstream the waste heat recovery system) is used for temperature control in the flue gas entering the waste heat recovery boiler. A semi-closed furnace technology with recirculated flue gas will enable recovering more energy in addition to the possibility of avoiding peak temperatures in the combustion zone. Avoiding peak temperatures will also reduce the NOx formation from the process (Wittgens et al. [28]).
Figure 8a illustrates a base case scenario for a generic ferrosilicon production, with a SAF integrated with a waste heat recovery boiler producing super-heated steam for electricity production in a Rankin steam cycle. The process flow diagram indicates how recirculated flue gas may be used for temperature control in the combustion zone and upstream of the waste heat recovery boiler. In a semi-closed furnace, the amount of ingress air can be limited to what is required for complete combustion of the flue gas. For such cases, recirculated flue gas can be used to control the flue gas temperature at the inlet of the waste heat recovery boiler below the target 750 °C. Figure 8b illustrates how reduced ingress air (reduced O2 content in the flue gas) affects both the stack loss and leads to reduced net electricity consumption (5% reduction) as more thermal energy is available for steam production. The stack loss is reduced from close to 7 MW down to about 1 MW when ingress air for cooling the flue gas is replaced by recirculated flue gas. The carbon dioxide concentration in the flue gas increases from 4 to 14 vol% as we move towards a semi-closed furnace with recirculation of flue gas operating at 7 vol% O2. An increase in CO2 concentration will have a positive impact on the energy consumption in any downstream CO2 capture processes.
3.1.2. Biocarbon Production
Replacement of fossil carbon (typically coal, char or coke) with more CO2-neutral biocarbon (charcoal and some woodchips) has been an important research area over the last decades [42,51]. Local production of biocarbon from virgin biomass offers several obvious integration opportunities in terms of energy recovery. The main motivation for introducing biocarbon is to reduce the carbon footprint of the silicon production. The drying process of the biomass prior to pyrolysis/biocarbon production can operate using waste heat from the ferrosilicon production process and other surplus heat sources within MIP. Thus, enabling efficient use of surplus energy with a less capital intensive and more thermodynamically efficient process than electricity production. Although we focus here on the ferrosilicon production, the use of biocarbon is also relevant for the ferromanganese production in Mo industrial park.
Figure 9a shows the base case ferrosilicon process integrated with biocarbon production. Steam from the waste heat recovery boiler is used for the drying of virgin biomass prior to a pyrolysis process for production of biocarbon. By-products from the biocarbon production process are pyrolysis oils and pyrolysis gas. The latter is assumed to be used directly as a heat source and added as hot (combusted) flue gas to the waste heat recovery boiler. The pyrolysis oil has not been included in the energy or CO2 balance. One may envisage upgrading the pyrolysis oils to more valuable chemicals or fuels as indicated in Figure 7. However, a pragmatic approach has recently been proposed [52] where the pyrolysis oil may be used as binder for the biocarbon material, in which case it would enter the SAF together with the biocarbon and contribute to the waste heat energy production.
Figure 9b shows the impact of the biocarbon production (given as the bio to fossil carbon ratio) on electricity production, thermal energy consumption for virgin biomass drying and the thermal energy contribution from pyrolysis gas. The increase in net electricity consumption is moderate (≈5%) at 70% bio to fossil shares. This is due to the thermal contribution from burning pyrolysis gas generated in the biocarbon production. This makes up for more than 50% of the energy consumed by the drying of virgin biomass.
3.1.3. CO2 Capture
Carbon capture and storage (CCS) is an alternative or supplement to biocarbon production in order for the ferroalloy production to reduce its carbon footprint. Conventional CO2 capture is carried out using absorption technology where the regeneration of the solvent (usually amine based) takes place in a stripping column which is operated on thermal energy at around 200 °C. This energy demand is well suited for integration with the steam production in a waste heat recovery unit.
Figure 10a shows the base case FeSi process integrated with an absorption-based CO2 capture processing unit. The solvent regeneration in the stripper column is operated using steam from the waste heat recovery unit. As with all CO2 capture technologies, the specific energy demand is linked to the CO2 concentration in the flue gas through the ideal work of separation (see Figure 5 and [40]). In general, the specific energy demand (MJ/kg CO2 captured) is reduced with increasing CO2 concentration. As already demonstrated for the base case (see Figure 8b), a semi-closed SAF will deliver a flue gas with significantly higher concentration (12–14 vol% CO2) as opposed to around 4 vol% CO2 in a SAF operating with excess ingress air for temperature control. It is therefore relevant to investigate the impact of both CO2 capture rate and the oxygen concentration in the flue gas leaving the SAF flue gas combustion zone.
The net electricity consumption in Figure 10b is affected by both the capture rate and the oxygen concentration in the flue gas leaving the SAF combustion zone. This is because the energy demand in the CO2 capture unit is linked to the CO2 concentration in the flue gas (see Figure 5). The higher the CO2 concentration in the flue gas, the less energy has to be provided by the waste heat recovery unit and more electricity can be produced. This is accomplished using a semi-closed SAF operating with low surplus oxygen content and therefore a high CO2 concentration in the flue gas. According to Figure 10b, a semi-closed furnace with recirculated flue gas for temperature control can achieve almost the same net electricity consumption with 90% carbon capture as a semi-closed furnace operating with ingress air for temperature control and without carbon capture.
3.1.4. Tradeoffs between Biocarbon Production and CO2 Capture
Exploring the integration between waste heat recovery for electricity production, biocarbon production and CO2 capture is illustrated in Figure 11a. In the parametric studies illustrated in Figure 11b–d, the key performance indicators are presented as contour lines with biocarbon fraction as the abscissa and CO2 capture rate as the ordinate. Figure 11b shows that carbon neutral metal production can be achieved with a biocarbon fraction above 55% and 90% capture rate. The associated increased net electricity demand is a 12% increase compared to the lower left corner of Figure 11c. In terms of the estimated electricity and CO2 related operating costs in Figure 11d, there is an apparent 40% reduction when moving towards the carbon neutral upper right corner. It is important to notice that the cost figures do not include capital costs associated with any of the proposed measures for increased energy recovery through electricity production, carbon capture or biocarbon production.
4. Conclusions
The potential for increased energy utilisation and reduced carbon footprint at the Norwegian industry cluster Mo Industri Park has been investigated. Process data on energy flows between the industrial clients in the park show that there is a significant potential for increasing the annual energy recovery within the park. The goal formulated by MIP of increasing the current annual energy recovery of 400 GWh to up to 640 GWh seems technically realistic. This can be accomplished by introducing carbon emission mitigating technologies like carbon capture from flue gas sources within the park and local biocarbon production as a replacement for fossil fuel-based reduction materials in the ferrosilicon production. Both of these measures can, together with conventional electricity production from waste heat recovery units, meet the stated target of energy recovery and at the same time provide close to carbon neutral ferrosilicon production.
The calculations indicate that a semi-closed SAF with recirculated flue gas for temperature control will achieve a 5% lower net electricity consumption compared to a similar SAF using ingress air for temperature control. Further, implementation of recirculation of flue gas will increase the CO2 concentration and, as a result, decrease the energy demand related to carbon capture. A further improvement of the energy recovery may be possible if the waste recovery system would be rebuilt to handle higher temperatures, however, this may increase scaling and material wear.
The viability of the biocarbon production will be dependent on the market conditions and the biocarbon price. Establishment of the energy cost for biocarbon from a possible future local biocarbon production should be evaluated in future works to get a more complete picture of the energy input costs.
The current work does not consider that capital costs of implementing the proposed measures and is focused primarily on the ferrosilicon production within the park. This is because the major surplus heat source was associated with flue gas from the ferrosilicon production. However, the proposed measures for energy recovery and carbon emission mitigation are also applicable to the ferromanganese production and to the steel production. In order to carry out a more extensive optimisation of surplus heat utilisation within the park, the utility systems for energy distribution should be considered.
Author Contributions
Conceptualisation, T.P., E.D., P.A.E. and O.T.B.; methodology, T.P.; software, T.P. and E.D.; validation, E.D. and P.A.E.; formal analysis, T.P. and E.D.; investigation, E.D.; resources, E.D.; data curation, E.D.; writing—original draft preparation, T.P., E.D. and P.A.E.; writing—review and editing, O.T.B.; visualisation, E.D.; supervision, O.T.B.; project administration, O.T.B.; funding acquisition, O.T.B. All authors have read and agreed to the published version of the manuscript.
Funding
This publication has been funded by HighEFF—Centre for an Energy Efficient and Competitive Industry for the Future, an eight-year research centre under the FME-scheme (Centre for Environment-friendly Energy Research, 257632/E20). The authors gratefully acknowledge the financial support from the Research Council of Norway and user partners of HighEFF.
Conflicts of Interest
The authors declare no conflict of interest.
Abbreviations
The following abbreviations are used in this manuscript:
| CCS | Carbon capture and storage |
| FeMn | Ferromanganeses production |
| FeSi | Ferrosilicon production |
| KPI | Key performance indicator |
| MEA | Monoethanolamine |
| MIP | Mo industrial park |
| SAF | Submerged arch furnace |
| SRD | Specific reboiler duty (for regeneration of CO2 absorbent) |
Appendix A. Stream Data for MIP
Table A1 and Table A2 show stream data which has been the basis for the grand composite curves for current base case at MIP and for a revised situation with biocarbon production and carbon capture integrated at MIP.

Table A1.
Base case stream data as basis for Grand Composite curve in Figure 4.
Table A1.
Base case stream data as basis for Grand Composite curve in Figure 4.
| Process Stream | Tstart (°C) | Tend (°C) | kW/C | MW | GWh |
|---|---|---|---|---|---|
| Aga-Heat loss | 50 | 5 | 111 | 5 | 39 |
| BitFury-Heat loss to air | 70 | 5 | 683 | 44 | 350 |
| Celsa-Off gas | 250 | 25 | 63 | 14 | 112 |
| Celsa-Cooling water | 10 | 20 | 3439 | −34 | −271 |
| Celsa-Heat loss: Solids& Gas | 250 | 5 | 80 | 20 | 154 |
| Elkem-Mo Fjernvarme: Off gas to district heating | 350 | 180 | 81 | 14 | 108 |
| Elkem-Off gas pipe loss: Flue gas | 600 | 350 | 168 | 42 | 332 |
| Elkem-Off gas cooling: | 350 | 180 | 88 | 15 | 118 |
| Elkem-Off gas, unavoidable heat loss: | 180 | 5 | 149 | 26 | 206 |
| Elkem-Cooling water | 5 | 45 | 699 | −28 | −220 |
| Elkem-Heat loss | 350 | 5 | 50 | 17 | 136 |
| Ferroglobe-Heat in solids | 1200 | 5 | 31 | 37 | 291 |
| Ferroglobe-Cooling water | 5 | 45 | 88 | −4 | −28 |
| Ferroglobe-Heat loss | 200 | 60 | 130 | 18 | 144 |
| Mo Fjernvarme-Elkem | 70 | 95 | 548 | −14 | −108 |
| Mo Fjernvarme-Heat loss: Disposed heat | 95 | 5 | 49 | 4 | 35 |
| Mo Fjernvarme-Heat loss | 95 | 5 | 9 | 1 | 7 |
| Ranfjord fisk-Cooling water | 5 | 16 | 404 | −4 | −35 |
| MIP CO distribution network-Heat loss | 60 | 5 | 64 | 4 | 28 |
Table A2.
Revised (Table A1) stream data including proposed future CCS, biocarbon and heat-to-electricity installations at Elkem.
Table A2.
Revised (Table A1) stream data including proposed future CCS, biocarbon and heat-to-electricity installations at Elkem.
| Process Stream | Tstart (°C) | Tend (°C) | kW/C | MW | GWh |
|---|---|---|---|---|---|
| Aga-Heat loss | 50 | 5 | 111 | 5 | 39 |
| BitFury-Heat loss | 70 | 5 | 683 | 44 | 350 |
| Celsa-Off gas | 250 | 25 | 63 | 14 | 112 |
| Celsa-Cooling water | 10 | 20 | 3439 | −34 | −271 |
| Celsa-Heat loss: Solids& Gas | 250 | 5 | 80 | 20 | 154 |
| Elkem-Mo Fjernvarme: Off gas to district heating | 350 | 180 | 81 | 14 | 108 |
| Elkem-Waste heat recovery: Flue gas | 600 | 350 | 168 | 42 | 332 |
| Elkem-Waste heat recovery | 350 | 180 | 88 | 15 | 118 |
| Elkem-Off gas, unavoidable heat loss | 180 | 5 | 149 | 26 | 206 |
| Elkem-Cooling water | 5 | 45 | 699 | −28 | −220 |
| Elkem-Heat loss | 350 | 5 | 50 | 17 | 136 |
| Ferroglobe-Heat in solids | 1200 | 5 | 31 | 37 | 291 |
| Ferroglobe-Cooling water | 5 | 45 | 88 | −4 | −28 |
| Ferroglobe-Heat loss | 200 | 60 | 130 | 18 | 144 |
| Mo Fjernvarme-Elkem | 70 | 95 | 548 | −14 | −108 |
| Mo Fjernvarme-Heat loss: Disposed heat | 95 | 5 | 49 | 4 | 35 |
| Mo Fjernvarme-Heat loss | 95 | 5 | 9 | 1 | 7 |
| Ranfjord fisk-Cooling water | 45 | 5 | 111 | 4 | 35 |
| MIP CO distribution network-Heat loss | 60 | 5 | 64 | 4 | 28 |
| Elkem-CCS | 150 | 250 | 260 | −28 | −221 |
| Elkem-Biocarbon | 150 | 250 | 80 | −14 | −110 |
| Elkem-Heat to electricity | 45 | 420 | −13.5 | −106 |
Table A3.
Aggregated data on energy flows between companies within MIP. This table is the basis for construction of Sankey diagrams in Figure 3 (excluding the bottom three rows).
Table A3.
Aggregated data on energy flows between companies within MIP. This table is the basis for construction of Sankey diagrams in Figure 3 (excluding the bottom three rows).
| Source | Target | Energy Flow (GWh) |
|---|---|---|
| Electricity | Aga | 50 |
| Aga | Refrigerated product | 11 |
| Aga | Heat loss | 39 |
| Electricity | BitFury | 350 |
| BitFury | Heat loss | 350 |
| Electricity | Celsa | 352 |
| Coal/Char/Coke | Celsa | 49 |
| Gas/oil | Celsa | 54 |
| MIP CO nettverk | Celsa | 84 |
| Celsa | Off gas | 112 |
| Celsa | Cooling water | 271 |
| Celsa | Heat loss | 154 |
| Electricity | Elkem | 785 |
| Coal/Char/Coke | Elkem | 860 |
| Biocarbon (current) | Elkem | 49 |
| Gas/oil | Elkem | 2 |
| Elkem | Mo Fjernvarme | 108 |
| Elkem | Waste heat recovery | 332 |
| Elkem | Waste heat recovery | 118 |
| Elkem | Off gas, unavoidable heat loss | 206 |
| Elkem | Chemical energy in product | 576 |
| Elkem | Cooling water | 220 |
| Elkem | Heat loss | 136 |
| Electricity | Ferroglobe | 521 |
| Coal/Char/Coke | Ferroglobe | 599 |
| Ferroglobe | MIP CO nettverk | 174 |
| Ferroglobe | MIP CO nettverk | 174 |
| Ferroglobe | Chemical energy in product | 483 |
| Ferroglobe | Heat in solids | 291 |
| Ferroglobe | Cooling water | 28 |
| Ferroglobe | Heat loss | 144 |
| Electricity | Mo Fjernvarme | 3 |
| Elkem | Mo Fjernvarme | 108 |
| MIP CO nettverk | Mo Fjernvarme | 8 |
| Gas/oil | Mo Fjernvarme | 6 |
| Mo Fjernvarme | District heating | 83 |
| Mo Fjernvarme | Heat loss | 35 |
| Mo Fjernvarme | Heat loss | 7 |
| Elkem | Cooling water | 220 |
| Cooling water | Ranfjord fisk | 35 |
| Cooling water | Heat loss | 484 |
| Electricity | Ranfjord fisk | 5 |
| Cooling water | Ranfjord fisk | 35 |
| Ranfjord fisk | Heat loss | 40 |
| Ferroglobe | MIP CO nettverk | 174 |
| MIP CO nettverk | Celsa | 84 |
| MIP CO nettverk | Mo Fjernvarme | 8 |
| MIP CO nettverk | SMA Minerals | 42 |
| MIP CO nettverk | CO Fakling MIP | 42 |
| Heat | MIP CO nettverk | 28 |
| MIP CO nettverk | Heat loss | 28 |
| Electricity | SMA Minerals | 5 |
| MIP CO nettverk | SMA Minerals | 42 |
| SMA Minerals | Heat loss | 46 |
| Elkem | Waste heat recovery | 332 |
| Elkem | Waste heat recovery | 118 |
| Waste heat recovery | Biocarbon Production | 110 |
| Waste heat recovery | Carbon capture | 221 |
| Waste heat recovery | Electricity out | 21 |
| Waste heat recovery | Heat loss | 97 |
| Biomass | Biocarbon Production | 231 |
| Biocarbon Production | Biocarbon | 146 |
| Biocarbon Production | Bio oil | 81 |
| Waste heat recovery | Biocarbon Production | 110 |
| Biocarbon Production | Heat loss | 114 |
| Electricity | Carbon capture | 30 |
| Waste heat recovery | Carbon capture | 221 |
| Carbon capture | Heat loss | 251 |
Appendix B. Quantifying the Surplus Heat
This section will document the data used for establishing the surplus heat flows across battery limits at Mo Industrial Park.
Appendix B.1. General Assumptions
Table A4 lists the estimated energy content of carriers to the companies located within MIP.
Table A4.
Energy content of carriers to the industry located within Mo Industrial park.
| Energy Carrier | Heating Value (MJ/kg) [53] |
|---|---|
| Diesel | 45.6 |
| Electrode mass | 26.0 |
| Anthracite (coal) | 32.5 |
| Coke | 26.0 |
| Petroleum coke | 31.3 |
| Propane | 50.4 |
| CO | 10.1 |
| Light fuel oil | 44.0 |
| Residual oil | 39.5 |
| Biocarbon | 29.6 |
| Hydrogen | 120 |
Appendix B.2. Celsa
The Celsa facility consists of a steel mill and a rolling mill, which are not co-located in the industrial park. To quantify in what form and quantities the energy leaves Celsa’s premises, estimations and assumptions were done for the steel and rolling mill.
The electricity and primary energy consumption were found using data from Norwegian Environment Agency, which provides an important basis for the overall energy basis for Celsa. The data is aggregated to company level, thus not showing the energy use in the steel and rolling mill specifically. Specific heating values were assumed for the energy carriers reported in the mass unit.
It was assumed that all electricity, electrode mass and anthracite were used in the steel mill. With this assumption, the steel mill consumes approximately 75% of the total energy input.
The remaining 25% was allocated to the rolling mill, including the energy carriers CO-rich off-gas from Ferroglobe, light fuel oil, propane and spill oil.
A simplification was assumed that there was no net change in the chemically bound energy in the metal (scrap metal in and metal out). That means all of the energy input is assumed to be transferred to surplus heat.
It was assumed that 30 GWh heat is transferred from the steel mill to the rolling mill by Celsas internal energy recovery by hot charging [54].
According to Celsa’s environmental report, they have an annual cooling water consumption of about 23.3 million m3. Assuming a T of 10 °C, this corresponds to about 271 GWh/year. The cooling water was allocated to the steel and rolling mill with respect to the assumed energy consumption in the two different mills (75%/25%, correspondingly).
The energy in the off-gas from the steel mill was approximated by an energy analysis of a steel mill in the literature [55]. The energy flows from the literature were upscaled linearly by the steel production. This approach yielded an approximated 63 GWh heat in the off-gas from the steel mill.
The energy balance for the steel mill then resulted in an approximate heat loss of 105 GWh/year.
There was not enough information available to quantify the heat in the off-gas from the rolling mill, but it was assumed that 50% of the unaccounted energy (input–known output = unaccounted energy) were losses and 50% was released as off-gas. That corresponds to 50 GWh losses and 50 GWh heat in off-gas.
Appendix B.3. Elkem
The electricity and primary energy consumption were found using data from the Norwegian Environment Agency, which provides an important basis for the overall energy basis for Elkem.
In total, 34% of energy input was assumed to be bound as chemical energy in the product [30], 13% of energy input was assumed transferred to cooling water [30] and 45% of the energy input was assumed to enter the off-gas system [30]. Some of the waste heat of the off-gas is converted to district heat in the boilers which are connected to the off-gas channels. After the off-gas has passed through the boilers, bag-house filters clean the off-gas from SiO2 (microsilica), which is a valuable by-product. The temperature at the inlet to the baghouse filters needs to be below 220 and be above 150 °C to avoid corrosion problems [56,57]. The inlet temperature to the district heating boilers were assumed to be 350 °C [58]. It was assumed that the off-gas in practice is utilisable at a temperature level of 600 °C [59]. Based on the assumed temperature levels, the off-gas stream was split into utilisable, already utilised and unavoidable losses.
The remaining 8% was assumed to be heat losses [30].
Appendix B.4. Ferroglobe
The electricity and primary energy consumption were found using data from the Norwegian Environment Agency, which provides an important basis for the overall energy basis for Ferroglobe. An energy analysis of FeMn and SiMn production was used to establish the energy flows leaving the system [60]. Since the specific energy use and metalurigal reactions are different for ferromanganese and silicomanganese, the annual energy flows were weighted by the production of ferromanganese and silicomanganese in 2017.
The CO-gas production was approximated by [60]. The exported CO-gas accounted for approximately 19% of the energy input. The interconnections with other companies in MIP were established using known consumption at Celsa, SMA and Mo Fjernvarme. The remaining energy balance was allocated to flaring at MIP. The internal consumption of CO-gas at Ferroglobe was accounted for [22], but not included in the analysis (since it was within the battery limits).
The chemical energy in the products was an average 34% of energy input. The thermal energy was in products (7%), slag (7%), and off-gas (2%). The losses are summed to 29% of the energy input.
Appendix B.5. Other Actors
The electricity and primary energy consumption were found using data from the Norwegian Environment Agency [22] and the assumed heating values in A4, which provides an important basis for the overall energy balance for SMA Mineral. All input energy was assumed to be converted to heat loss.
Fjernkontrollen.no [61] provides the energy mix of Mo Fjernvarme. The energy mix of consumed district heating was 81% heat from Elkem Ranas off-gas, 9% CO-rich syngas, 7% oil, 3% flexible electricity (2017 numbers). It was assumed that there were 10% losses (7 GWh). An annual disposal of district heat of 35 GWh was assumed [62].
The electricity use of bitfury was assumed to be 350 GWh [63].
The utilisation of cooling water was assumed to be 35 GWh based on information from MIP [64], minus the estimated electricity and district heating consumption of approximately 10 GWh. The electricity use of Ranfjord fisk was estimated by their annual production: 5.5 million smolt, assuming a specific weight of 100 g and a specific energy use of 9 kWh/kg [65].
The electricity use at Aga is 50 MWh based on an 8 MW cryogenic air separator with annual full-load hours of 6250 h (assumption) [66].
References
- International Energy Agency (IEA). Tracking Industry Technical Report; IEA: Paris, France, 2019. [Google Scholar]
- Fischedick, M.; Roy, J.; Abdel-Aziz, A.; Acquaye, A.; Allwood, J.; Ceron, J.; Geng, Y.; Kheshgi, H.; Lanza, A.; Perczyk, D.; et al. Chapter 10: Industry. In Climate Change 2014: Mitigation of Climate Change. Contribution of Working Group III to the Fifth Assessment Report of the Intergovernmental Panel on Climate Change; Edenhofer, O., Pichs-Madruga, R., Sokona, Y., Farahani, E., Kadner, S., Seyboth, K., Adler, A., Baum, I., Brunner, S., Eickemeier, P., et al., Eds.; Cambridge University Press: Cambridge, UK; New York, NY, USA, 2014; pp. 138–160. [Google Scholar] [CrossRef]
- Kirchherr, J.; Reike, D.; Hekkert, M. Conceptualizing the circular economy: An analysis of 114 definitions. Resour. Conserv. Recycl. 2017, 127, 221–232. [Google Scholar] [CrossRef]
- Chertow, M.R. Industrial Symbiosis: Literature and Taxonomy. Annu. Rev. Energy Environ. 2000, 25, 313–337. [Google Scholar] [CrossRef] [Green Version]
- Guo, Y.; Tian, J.; Chertow, M.; Chen, L. Exploring Greenhouse Gas-Mitigation Strategies in Chinese Eco-Industrial Parks by Targeting Energy Infrastructure Stocks. J. Ind. Ecol. 2018, 22, 106–120. [Google Scholar] [CrossRef]
- Røyne, F.; Hackl, R.; Ringström, E.; Berlin, J. Environmental Evaluation of Industry Cluster Strategies with a Life Cycle Perspective: Replacing Fossil Feedstock with Forest-Based Feedstock and Increasing Thermal Energy Integration. J. Ind. Ecol. 2018, 22, 694–705. [Google Scholar] [CrossRef]
- Wu, J.; Wang, R.; Pu, G.; Qi, H. Integrated assessment of exergy, energy and carbon dioxide emissions in an iron and steel industrial network. Appl. Energy 2016, 183, 430–444. [Google Scholar] [CrossRef]
- Yu, B.; Li, X.; Shi, L.; Qian, Y. Quantifying CO2 emission reduction from industrial symbiosis in integrated steel mills in China. J. Clean. Prod. 2015, 103, 801–810. [Google Scholar] [CrossRef]
- Johansson, M.T.; Söderström, M. Options for the Swedish steel industry—Energy efficiency measures and fuel conversion. Energy 2011, 36, 191–198. [Google Scholar] [CrossRef] [Green Version]
- Park, H.S.; Rene, E.R.; Choi, S.M.; Chiu, A.S. Strategies for sustainable development of industrial park in Ulsan, South Korea—From spontaneous evolution to systematic expansion of industrial symbiosis. J. Environ. Manag. 2008, 87, 1–13. [Google Scholar] [CrossRef]
- Gibbs, D.; Deutz, P. Reflections on implementing industrial ecology through eco-industrial park development. J. Clean. Prod. 2007, 15, 1683–1695. [Google Scholar] [CrossRef]
- Mattila, T.; Lehtoranta, S.; Sokka, L.; Melanen, M.; Nissinen, A. Methodological Aspects of Applying Life Cycle Assessment to Industrial Symbioses. J. Ind. Ecol. 2012, 16, 51–60. [Google Scholar] [CrossRef]
- Saidani, M.; Yannou, B.; Leroy, Y.; Cluzel, F.; Kendall, A. A taxonomy of circular economy indicators. J. Clean. Prod. 2019, 207, 542–559. [Google Scholar] [CrossRef] [Green Version]
- Chae, S.H.; Kim, S.H.; Yoon, S.G.; Park, S. Optimization of a waste heat utilization network in an eco-industrial park. Appl. Energy 2010, 87, 1978–1988. [Google Scholar] [CrossRef]
- Buoro, D.; Casisi, M.; De Nardi, A.; Pinamonti, P.; Reini, M. Multicriteria optimization of a distributed energy supply system for an industrial area. Energy 2013, 58, 128–137. [Google Scholar] [CrossRef]
- Yeo, Z.; Masi, D.; Low, J.S.C.; Ng, Y.T.; Tan, P.S.; Barnes, S. Tools for promoting industrial symbiosis: A systematic review. J. Ind. Ecol. 2019, 23, 1087–1108. [Google Scholar] [CrossRef] [Green Version]
- Dhole, V.; Linnhoff, B. Total site targets for fuel, co-generation, emissions, and cooling. Comput. Chem. Eng. 1993, 17, 101–109. [Google Scholar] [CrossRef]
- Linnhoff, B.; Townsend, D.; Hewitt, G.; Thomas, B.; Guy, A.; Marsland, R. A User Guide on Process Integration for the Efficient Use of Energy; Institution of Chemical Engineers: Rugby, UK, 1983. [Google Scholar]
- Klemeš, J.; Dhole, V.; Raissi, K.; Perry, S.; Puigjaner, L. Targeting and design methodology for reduction of fuel, power and CO2 on total sites. Appl. Therm. Eng. 1997, 17, 993–1003. [Google Scholar] [CrossRef]
- Matsuda, K.; Hirochi, Y.; Tatsumi, H.; Shire, T. Applying heat integration total site based pinch technology to a large industrial area in Japan to further improve performance of highly efficient process plants. Energy 2009, 34, 1687–1692. [Google Scholar] [CrossRef]
- Hackl, R.; Harvey, S.; Andersson, E. Total Site Analysis (TSA) Stenungsund Technical Report; Chalmers University of Technology: Gothenburg, Sweden, 2010. [Google Scholar]
- Norwegian Environment Agency. The Norwegian PRTR—Industry. 2018. Available online: https://www.norskeutslipp.no/en/Industrial-activities/?SectorID=600 (accessed on 1 February 2020).
- Gundersen, T. A Process Integration PRIMER. IEA Tutorial on Process Integration; SINTEF Energy Research: Trondheim, Norway, 2000. [Google Scholar]
- Børset, M.T.; Wilhelmsen, Ø.; Kjelstrup, S.; Burheim, O.S. Exploring the potential for waste heat recovery during metal casting with thermoelectric generators: On-site experiments and mathematical modeling. Energy 2017, 118, 865–875. [Google Scholar] [CrossRef] [Green Version]
- Schei, A.; Tuset, J.; Tveit, H. Production of High Silicon Alloys; Tapir: Trondheim, Norway, 1997. [Google Scholar]
- Tangstad, M. Chapter 6—Ferrosilicon and Silicon Technology. In Handbook of Ferroalloys; Gasik, M., Ed.; Butterworth-Heinemann: Oxford, UK, 2013; pp. 179–220. [Google Scholar] [CrossRef]
- Kero, I.; Grådahl, S.; Tranell, G. Airborne Emissions from Si/FeSi Production. JOM 2017, 69, 365–380. [Google Scholar] [CrossRef] [Green Version]
- Wittgens, B.; Panjwani, B.; Pettersen, T.; Jensen, R.; Ravary, B.; Hjertenes, D.O. SCORE Staged combustion for energy Recovery in Ferro-alloy Industries—Experimental Verification. In Proceedings of the Infacon XV, Cape Town, South Africa, 25–28 February 2018. [Google Scholar]
- Pettersen, T.; Wittgens, B.; Berglihn, O.T.; Panjwani, B.; Ravary, B.; Myrhaug, E. Reduced environmental impact and increased energy and material recovery in the ferroalloy industry through staged combustion of flue gas. In Proceedings of the 2018 Sustainable Industrial Processing Summit and Exhibition, Rio de Janeiro, Brasil, 4–7 November 2018; Volume 1, p. 18. [Google Scholar]
- Takla, M.; Kamfjord, N.; Tveit, H.; Kjelstrup, S. Energy and exergy analysis of the silicon production process. Energy 2013, 58, 138–146. [Google Scholar] [CrossRef]
- Ladam, Y.; Tangstad, M.; Ravary, B. Energy mapping of industrial ferroalloy plants. In Proceedings of the Thirteenth International Ferroalloys Congress Efficient technologies in Ferroalloy Industry, Almaty, Kazahstan, 9–12 June 2013; pp. 919–925. [Google Scholar]
- Børset, M.; Kolbeinsen, L.; Tveit, H.; Kjelstrup, S. Exergy based efficiency indicators for the silicon furnace. Energy 2015, 90, 1916–1921. [Google Scholar] [CrossRef]
- Martin, C.R. PYroMat—Thermodynamic Properties in Python; The Pennsylvania State University, Altoona College: Altoona, PA, USA, 2018; version 2.0.10. [Google Scholar]
- National Institute of Standards and Technology, US Department of Commerce. NIST Chemistry WebBook. 2018. Available online: https://webbook.nist.gov/chemistry/ (accessed on 1 February 2020).
- Chase, M. NIST-JANAF Thermochemical Tables (Journal of Physical and Chemical Reference Data Monographs); American Institute of Physics: College Park, MD, USA, 1998; pp. 1–1951. [Google Scholar]
- Romera, J.J.G. IAPWS—Python Libray for IAPWS Standard Calculation of Water and Steam Properties. Version 1.5.2; 2017; Available online: https://pypi.org/project/iapws (accessed on 1 February 2020).
- Husebye, J.; Brunsvold, A.L.; Roussanaly, S.; Zhang, X. Techno Economic Evaluation of Amine based CO2 Capture: Impact of CO2 Concentration and Steam Supply. Energy Procedia 2012, 23, 381–390. [Google Scholar] [CrossRef] [Green Version]
- Technology Centre Mongstad. About TCM. 2018. Available online: http://www.tcmda.com/en/About-TCM/ (accessed on 1 February 2020).
- Gorset, O.; Knudsen, J.N.; Bade, O.M.; Askestad, I. Results from Testing of Aker Solutions Advanced Amine Solvents at CO2 Technology Centre Mongstad. Energy Procedia 2014, 63, 6267–6280. [Google Scholar] [CrossRef] [Green Version]
- McGlashan, N.R.; Marquis, A.J. Availability analysis of post-combustion carbon capture systems: Minimum work input. Proc. Inst. Mech. Eng. Part C J. Mech. Eng. Sci. 2007, 221, 1057–1065. [Google Scholar] [CrossRef] [Green Version]
- Knudsen, J.N.; Andersen, J.; Jensen, J.N.; Biede, O. Evaluation of process upgrades and novel solvents for the post combustion CO2 capture process in pilot-scale. Energy Procedia 2011, 4, 1558–1565. [Google Scholar] [CrossRef] [Green Version]
- Olszewski, M.; Kempegowda, R.S.; Skreiberg, Ø.; Wang, L.; Løvås, T. Techno-Economics of Biocarbon Production Processes under Norwegian Conditions. Energy Fuels 2017, 31, 14338–14356. [Google Scholar] [CrossRef]
- Neves, D.; Thunman, H.; Matos, A.; Tarelho, L.; Gómez-Barea, A. Characterization and prediction of biomass pyrolysis products. Prog. Energy Combust. Sci. 2011, 37, 611–630. [Google Scholar] [CrossRef]
- Tranberg, B.; Corradi, O.; Lajoie, B.; Gibon, T.; Staffell, I.; Andresen, G.B. Real-time carbon accounting method for the European electricity markets. Energy Strat. Rev. 2019, 26, 100367. [Google Scholar] [CrossRef]
- Asplan Viak. Nordisk Strøm Blir Renere. 2016. Available online: https://www.asplanviak.no/aktuelt/2016/02/03/nordiskstroem-blir-renere/ (accessed on 1 February 2020).
- Watson, F. Factbox: EU CO2 Price Hits 11-Year High. 2019. Available online: https://www.spglobal.com/platts/en/marketinsights/latest-news/electric-power/071119-factbox-eu-co2-price-hits-11-year-high (accessed on 1 February 2020).
- Eurostat. Electricity Price Statistics. 2019. Available online: https://ec.europa.eu/eurostat/statistics-explained/index.php?title=Electricity_price_statistics#Electricity_prices_for_non-household_consumers (accessed on 1 February 2020).
- Statistics Norway. Electricity Prices. 2019. Available online: https://www.ssb.no/energi-og-industri/statistikker/elkraftpris/kvartal/ (accessed on 1 February 2020).
- Valero Capilla, A.; Valero Delgado, A. Thanatia: The Destiny of the Earth’s Mineral Resources. A Thermodynamic Cradle-to-cradle Assessment; World Scientific: Singapore, 2014. [Google Scholar]
- Magnanelli, E.; Berglihn, O.T.; Kjelstrup, S. Exergy-Based Performance Indicators for Industrial Practice. Int. J. Energy Res. 2018, 42, 3989–4007. Available online: https://onlinelibrary.wiley.com/doi/pdf/10.1002/er.4123 (accessed on 1 February 2020). [CrossRef] [Green Version]
- Monsen, B.; Grønli, M.; Nygaard, L.; Tveit, H. The Use of Biocarbon in Norwegian Ferroalloy Production. In Proceedings of the INFACON IX, Quebec City, QC, Canada, 3–6 June 2001; Volume 10, p. 10. [Google Scholar]
- Riva, L.; Nielsen, H.K.; Skreiberg, Ø.; Wang, L.; Bartocci, P.; Barbanera, M.; Bidini, G.; Fantozzi, F. Analysis of optimal temperature, pressure and binder quantity for the production of biocarbon pellet to be used as a substitute for coke. Appl. Energy 2019, 256, 113933. [Google Scholar] [CrossRef]
- Engineering Toolbox. Fuels—Higher and Lower Calorific Values. 2003. Available online: https://www.engineeringtoolbox.com/fuels-higher-calorific-values-d_169.html (accessed on 1 February 2020).
- MIP. Celsas Hot Charging Ready for Start Up. 2015. Available online: https://www.mip.no/en/2015/celsas-hot-charging-readyfor-start-up/ (accessed on 1 February 2020).
- Tunc, M.; Camdali, U.; Arasil, G. Energy Analysis of the Operation of an Electric-Arc Furnace at a Steel Company in Turkey. Metallurgist 2015, 59, 489–497. [Google Scholar] [CrossRef]
- Hjartarson, H. Waste Heat Utilization at Elkem Ferrosilicon Plant in Iceland. Master’s Thesis, University of Iceland, Reykjavík, Iceland, 2009. [Google Scholar]
- Kolbeinsen, L.; Lindstad, T.; Tveit, H.; Bruno, M.; Nygaard, L. Energy Recovery in the Norwegian Ferro Alloy Industry. In Proceedings of the INFACON 7, Trondheim, Norway, 11–14 June 1995; pp. 165–177. [Google Scholar]
- MIP. Kraft i Bruk fra Vann til Verk. 2012. Available online: https://www.mip.no/2012/kraft-i-bruk-fra-vann-til-verk/ (accessed on 1 February 2020).
- Enova. Mo Industripark: Grønn Industriklynge Med Verdensambisjoner. 2017. Available online: https://www.enova.no/bedrift/industri-og-anlegg/historier/mo-industripark-gronn-industriklynge-med-verdensambisjoner/ (accessed on 1 February 2020).
- Larssen, T.A.; Tangstad, M.; Kero, I. Energy Distribution in HC FeMn and SiMn—Energy vs. Exergy Analyses. In Proceedings of the Infacon XV, Cape Town, South Africa, 25–28 February 2018. [Google Scholar]
- Norsk Fjernvarme. Mo i Rana. 2019. Available online: https://www.fjernkontrollen.no/mo-i-rana/ (accessed on 1 February 2020).
- Norsk Fjernvarme. Dumper Spillvarme Påhavet. 2019. Available online: http://fjernvarmedagene.no/index.php?pageID=29&openLevel=4&cid=4395 (accessed on 1 February 2020).
- Helgeland Kraft. Helgeland Kraft Inngår Kraftavtale med Norges Største Datasenter. 2019. Available online: https://www.helgelandkraft.no/konsern/forside/om-helgeland-kraft/nyheter-og-aktuelt/bitfury/ (accessed on 1 February 2020).
- Ulriksen, A.; Gabor, J. Mo Industrial Park. 2017. Available online: https://industrysummit.fi/wp-content/uploads/2017/10/Susanne-M.-Naevermo-Sand.pdf (accessed on 1 February 2020).
- Bjørndal, T.; Holte, E.A.; Hilmarsen, O.; Tusvik, A. Analyse av Lukka Oppdrett av Laks-Landbasert og I sjø: Produksjon, Økonomi og Risiko. Technical Report; NTNU, SINTEF, SNF: Trondheim, Norway, September 2018. [Google Scholar]
- MIP. Lindegruppens Nordligste Luftgassfabrikk. 2014. Available online: https://www.mip.no/2014/lindegruppens-nordligste566luftgassfabrikk/ (accessed on 1 February 2020).
Figure 1.
Energy recovery at Mo Industrial Park (adapted from MIP Magasinet 2016).

Figure 2.
Illustration of battery limits for an industrial company at Mo Industrial Park (MIP). Only flows across the battery limits of companies are considered in this analysis.
Figure 2.
Illustration of battery limits for an industrial company at Mo Industrial Park (MIP). Only flows across the battery limits of companies are considered in this analysis.

Figure 3.
Sankey diagram for annual energy flows (GWh). See Table A3 in Appendix A for aggregated energy flow data across battery limits at Mo Industrial Park.
Figure 3.
Sankey diagram for annual energy flows (GWh). See Table A3 in Appendix A for aggregated energy flow data across battery limits at Mo Industrial Park.

Figure 4.
Grand composite curve for selected streams (gas, liquids, solids) between energy actors within MIP. See Appendix B.1 Table A4 for detailed stream data.
Figure 4.
Grand composite curve for selected streams (gas, liquids, solids) between energy actors within MIP. See Appendix B.1 Table A4 for detailed stream data.
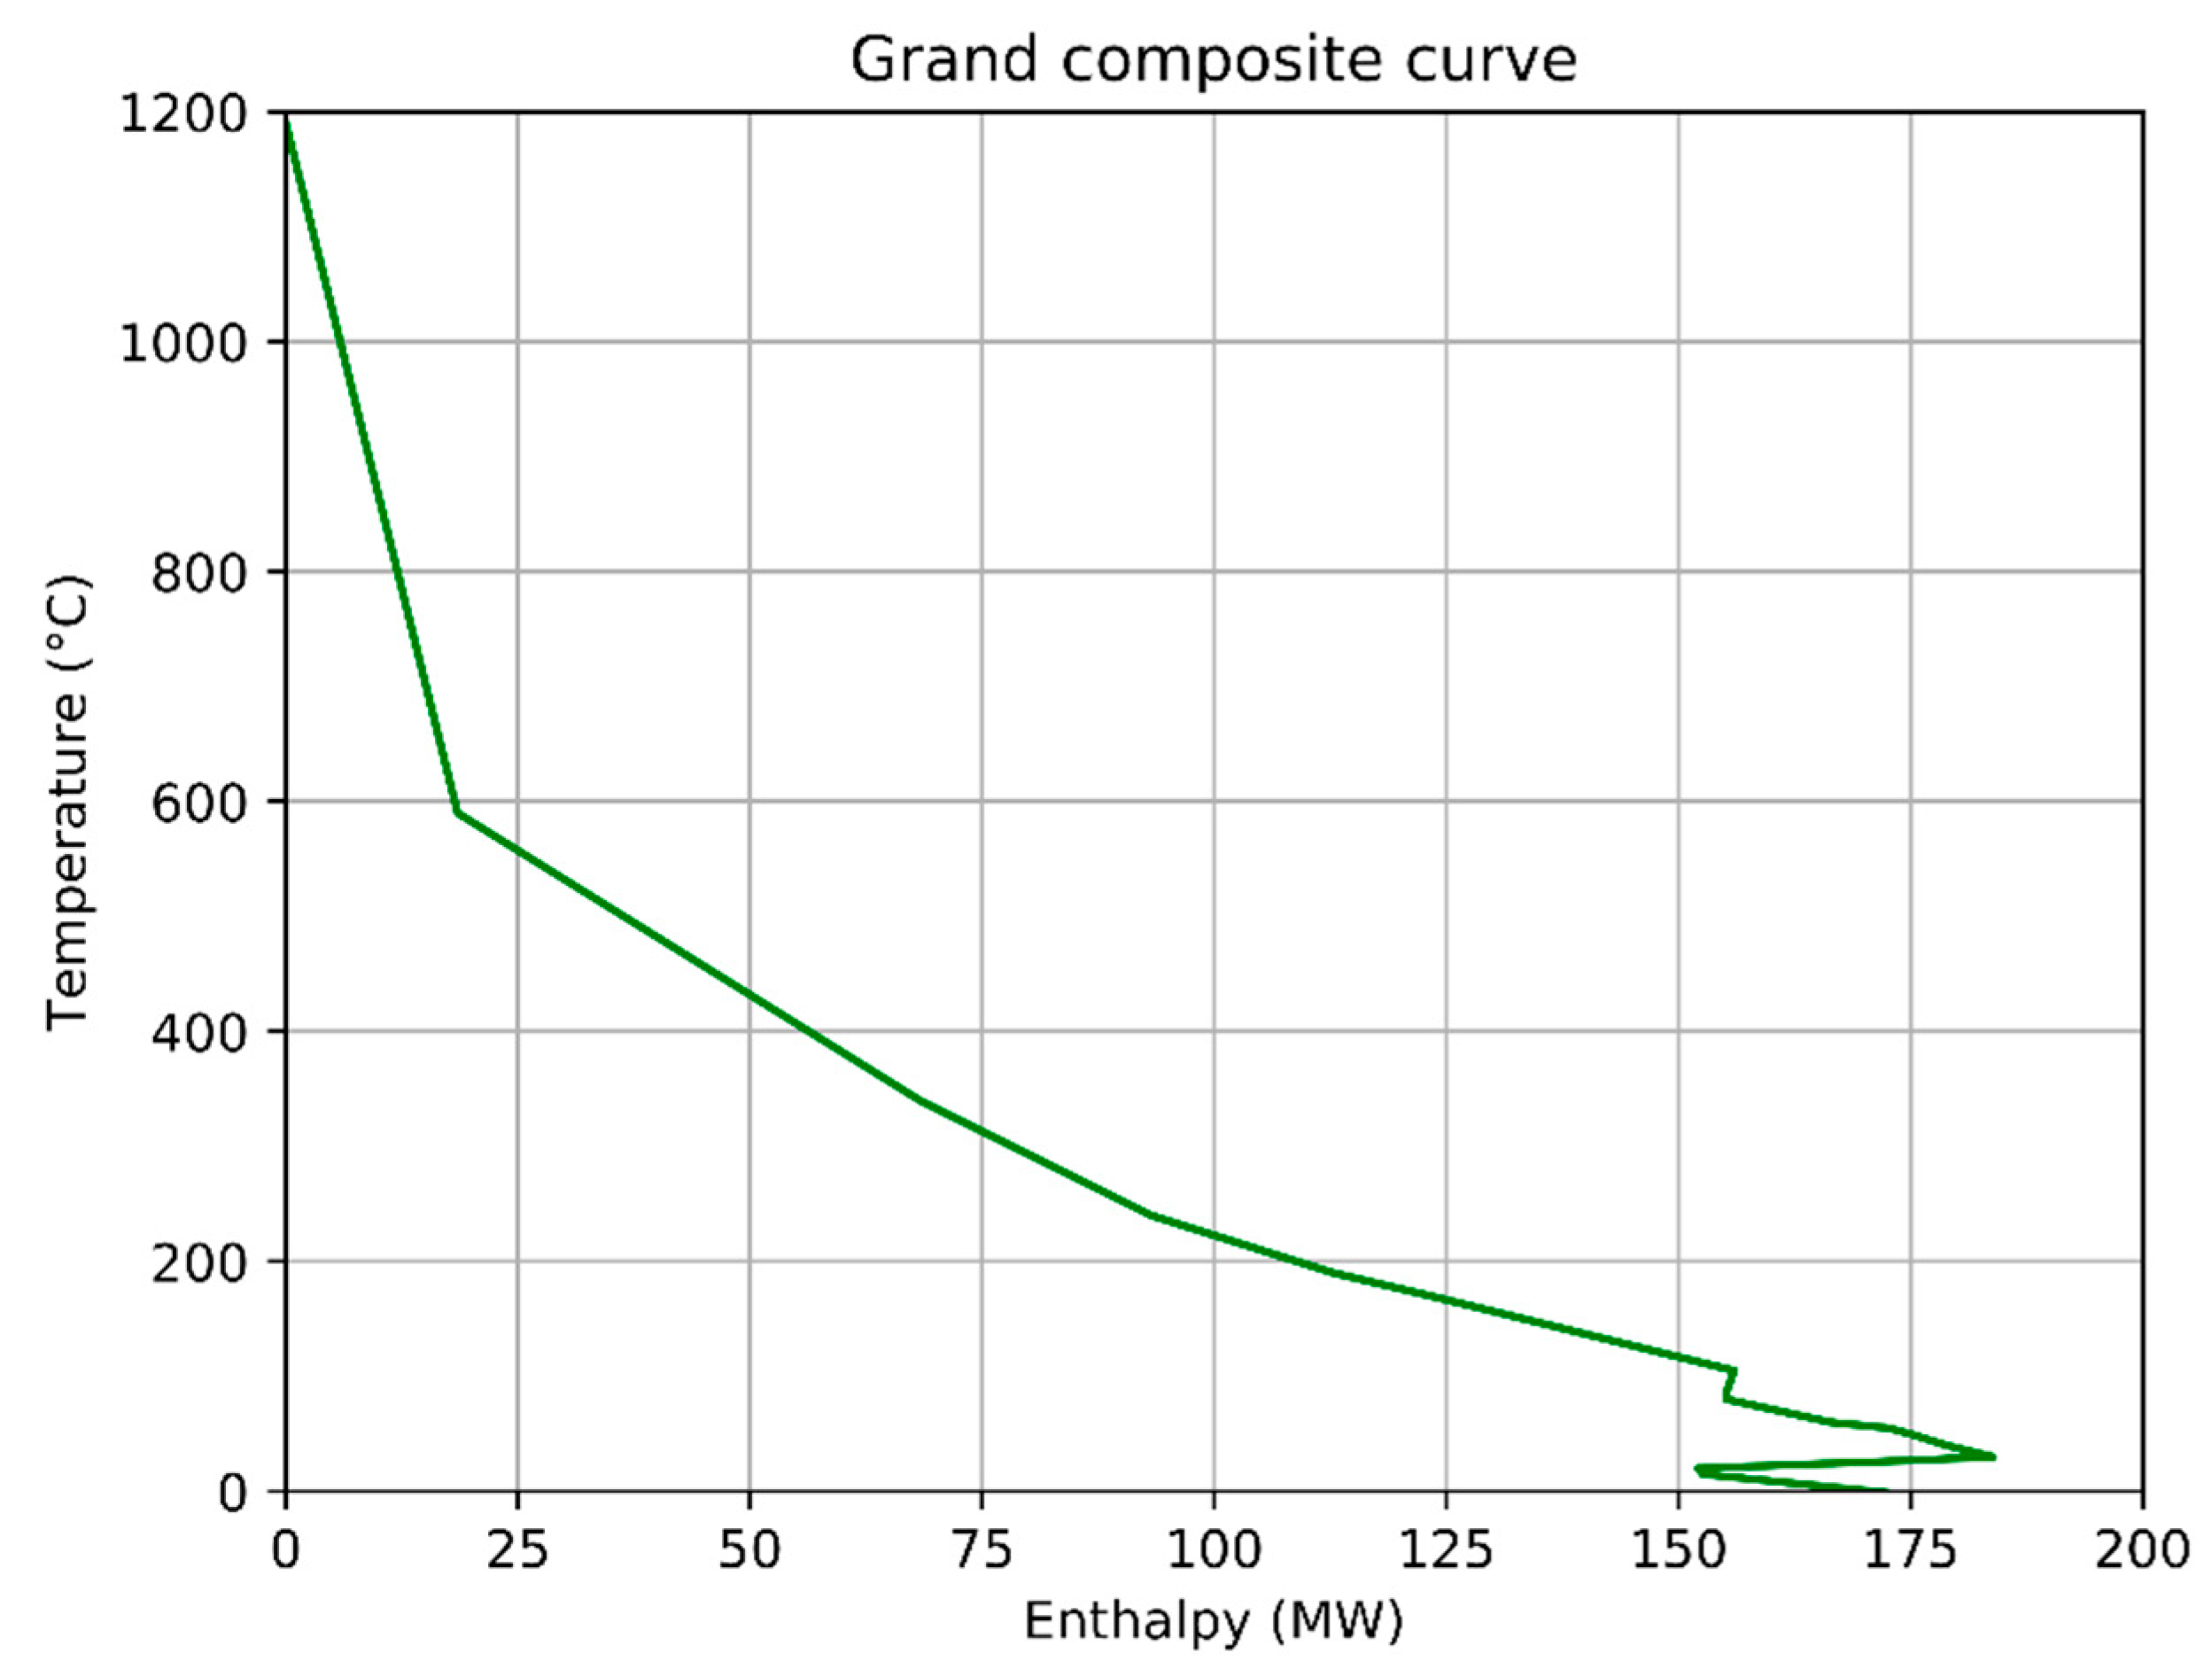
Figure 5.
Estimated specific reboiler duty for a generic solvent as a function of CO2 capture rate and flue gas concentration. Based on theoretical work of mixing [40] and normalised with results for 30 wt% MEA [39]. The performance of the CESAR1 solvent (90% capture rate, 13 vol% CO2) [41].

Figure 6.
CO2 cost relative to total cost of electricity assuming typical Norwegian electricity costs at 0.03 EUR/kWh.
Figure 6.
CO2 cost relative to total cost of electricity assuming typical Norwegian electricity costs at 0.03 EUR/kWh.
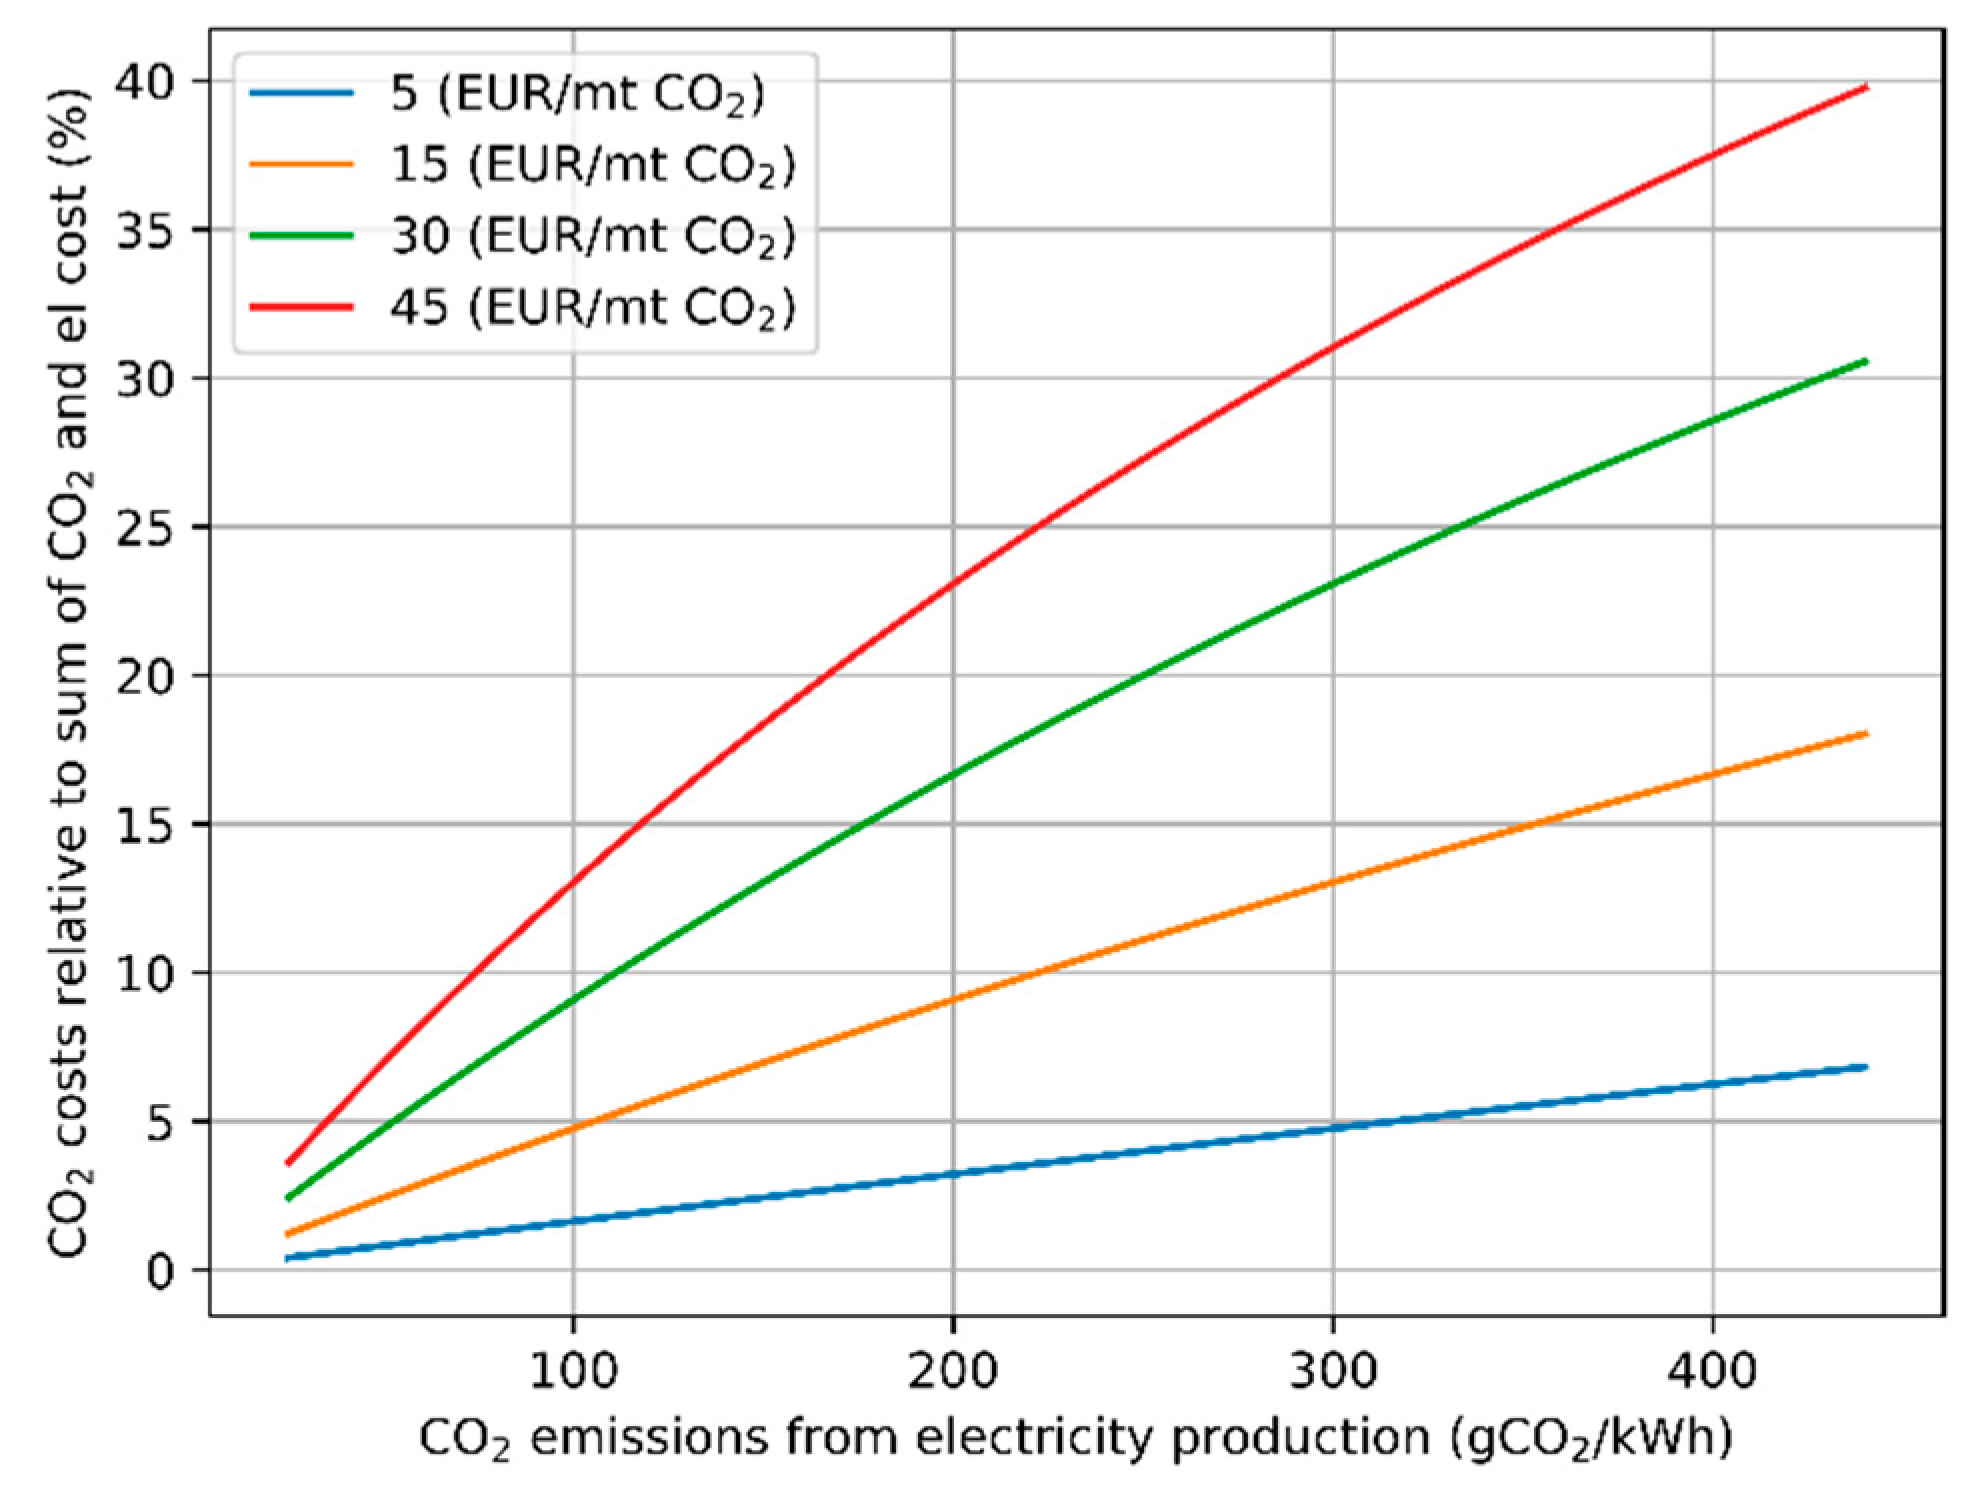
Figure 7.
Opportunities for energy integration between ferroalloy production and other sustainable production processes.
Figure 7.
Opportunities for energy integration between ferroalloy production and other sustainable production processes.
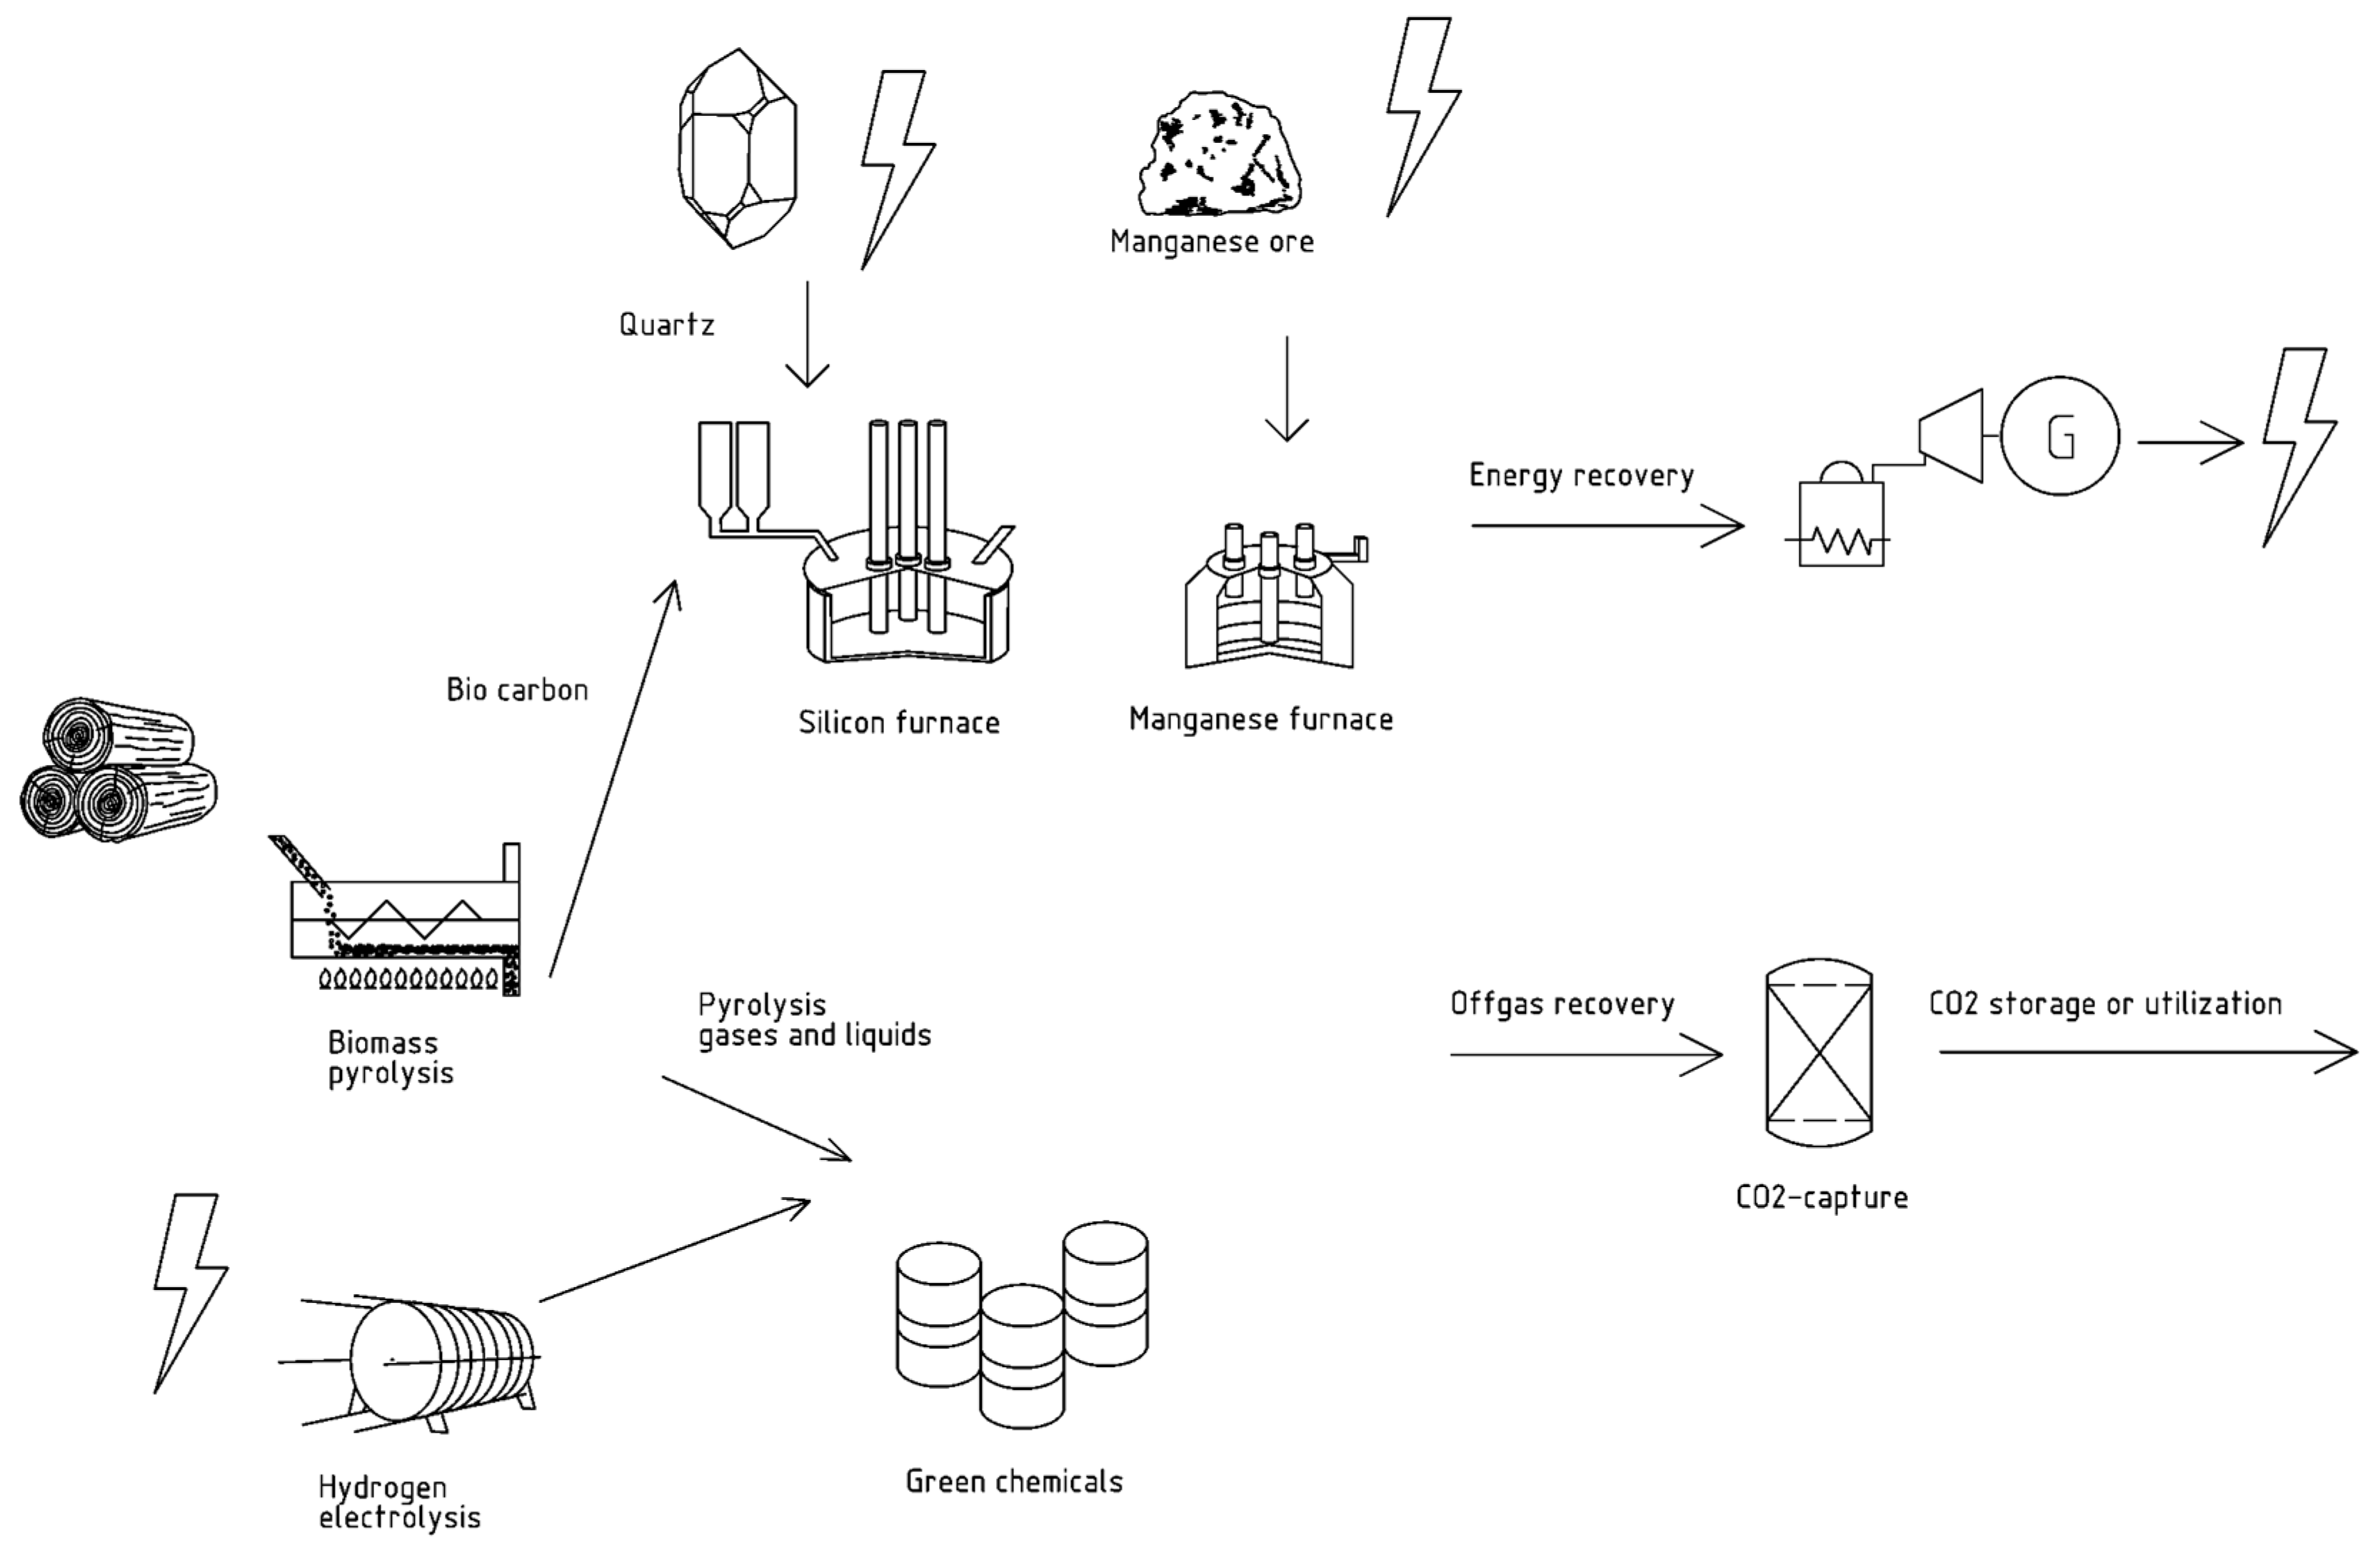
Figure 8.
FeSi production—base case. Semi-closed furnace with and without recirculated flue gas. See Table 2 and Table 3 for design parameters.


Figure 10.
FeSi production integrated with CO2 capture process. See Table 2 and Table 3 for design parameters.

Figure 11.
FeSi production with integrated CO2 capture and biocarbon production. See Table 2 and Table 3 for design parameters.

Table 1.
Relevant actors and key infrastructure in Mo Industrial Park.
| Actor/infrastrucucture | Explanation |
| Elkem Rana | Ferrosilicon |
| Ferroglobe Mangan | Silicomanganese and ferromanganese |
| Celsa | Reinforcing steel (from steel scrap) |
| SMA Minerals | Quicklime and calcined dolomite |
| Ranfjord fiskeprodukter | Land-based aquaculture |
| Aga | Industrial gases (cryogenic) |
| Bitfury | Data centre |
| MIP AS | Utility and property company |
| Syn-gas grid | CO-rich gas from Ferroglobe is utilised in other companies |
| Mo Fjernvarme | District heating from recovered surplus heat |
| Cooling water | Flow-through from nearby reservoirs |
Table 2.
Ferrosilicon production base case parameters.
| Parameter | Value | |
|---|---|---|
| Charge gas composition (vol.%) | CH4: 9, CO: 57.6, SiO: 3.7, H2: 6.4, H2O: 23.3, N2: rest | |
| Charge gas temperature | 1500 | °C |
| Specific charge gas generation | 287.5 | Nm3/(h*MW) |
| Specific electricity consumption | 11.7 | MWh/t Me |
| Specific carbon consumption | 1.7 | kg/kg Me |
| Max inlet temperature to WHRU | 750 | °C |
| Recirculated flue gas temperature from WHRU | 150 | °C |
| Heat loss from SAF | 1500 | kW |
Table 3.
Design parameters for waste heat recovery unit with steam turbine for electricity production.
Table 3.
Design parameters for waste heat recovery unit with steam turbine for electricity production.
| Design Parameter | Value |
|---|---|
| Flue gas inlet-outlet temperature (°C) | 750–150 |
| Flue gas heat loss (%) | 2 |
| Steam pressure (bar) | 40 |
| Superheated steam temperature (°C) | 420 |
| Saturated steam temperature (°C) | 250 |
| Steam turbine isentropic efficiency (%) | 75 |
| Turbine exit temperature and pressure (°C), (bar) | 45.8, 0.1 |
| Generator overall efficiency (%) | 98 |
Table 4.
Economic parameters related to key performance indicators. Base case figures are given in bold.
Table 4.
Economic parameters related to key performance indicators. Base case figures are given in bold.
| Parameter | Range | |
|---|---|---|
| Electricity price from grid | 0.03–0.1 | EUR/kWh |
| CO2 emission price | 5–30 | EUR/t CO2 |
| CO2 emissions from electricity production | 25–440 | g CO2-eq/kWh |
© 2020 by the authors. Licensee MDPI, Basel, Switzerland. This article is an open access article distributed under the terms and conditions of the Creative Commons Attribution (CC BY) license (http://creativecommons.org/licenses/by/4.0/).
Share and Cite
MDPI and ACS Style
Pettersen, T.; Dæhlin, E.; Eidem, P.A.; Berglihn, O.T. Investigating the Potential for Increased Energy Utilisation and Reduced CO2 Emissions at Mo Industrial Park. Energies 2020, 13, 4627. https://doi.org/10.3390/en13184627
AMA Style
Pettersen T, Dæhlin E, Eidem PA, Berglihn OT. Investigating the Potential for Increased Energy Utilisation and Reduced CO2 Emissions at Mo Industrial Park. Energies. 2020; 13(18):4627. https://doi.org/10.3390/en13184627
Chicago/Turabian StylePettersen, Torbjørn, Emil Dæhlin, Per Anders Eidem, and Olaf Trygve Berglihn. 2020. "Investigating the Potential for Increased Energy Utilisation and Reduced CO2 Emissions at Mo Industrial Park" Energies 13, no. 18: 4627. https://doi.org/10.3390/en13184627
Note that from the first issue of 2016, this journal uses article numbers instead of page numbers. See further details here.