Article

Residential Natural Gas Demand Response Potential during Extreme Cold Events in Electricity-Gas Coupled Energy Systems

1
National Renewable Energy Laboratory, Golden, CO 80401, USA
2
U.S. Department of Energy, Washington, DC 20585, USA
*
Author to whom correspondence should be addressed.
Energies 2020, 13(19), 5192; https://doi.org/10.3390/en13195192
Submission received: 11 August 2020 / Revised: 18 September 2020 / Accepted: 23 September 2020 / Published: 5 October 2020
(This article belongs to the Collection Demand Management for Buildings and Industrial Facilities)

Abstract

:
In regions where natural gas is used for both power generation and heating buildings, extreme cold weather events can place the electrical system under enormous stress and challenge the ability to meet residential heating and electric demands. Residential demand response has long been used in the power sector to curtail summer electric load, but these types of programs in general have not seen adoption in the natural gas sector during winter months. Natural gas demand response (NG-DR) has garnered interest given recent extreme cold weather events in the United States; however, the magnitude of savings and potential impacts—to occupants and energy markets—are not well understood. We present a case-study analysis of the technical potential for residential natural gas demand response in the northeast United States that utilizes diverse whole-building energy simulations and high-performance computing. Our results show that NG-DR applied to residential heating systems during extreme cold-weather conditions could reduce natural gas demand by 1–29% based on conservative and aggressive strategies, respectively. This indicates a potential to improve the resilience of gas and electric systems during stressful events, which we examine by estimating the impact on energy costs and electricity generation from natural gas. We also explore relationships between hourly indoor temperatures, demand response, and building envelope efficiency.

Graphical Abstract

1. Introduction

The coupling of recent cold weather events in the United States with increased utilization of natural gas for power generation has introduced unique challenges that strain the existing energy infrastructure. These challenges occur because extreme winter weather increases demand for natural gas and electric heating while also increasing the risk of failure of the energy system infrastructure during high wind, snow, and ice conditions. A natural gas thermostat demand response (NG-DR) program could provide increased flexibility and improve the resilience of natural gas and power supply during extreme winter events, by curtailing demand at the residential building level. We present a demand-side approach to improving resiliency to meet peak winter demand, which ultimately complements the broader research addressing electric grid challenges during extreme weather [1,2,3].
In late January 2019, the Midwest and Mid-Atlantic regions of the country experienced record cold temperatures below −20 °F (−28.9 °C) because of a polar vortex event. The extreme cold resulted in record levels of demand for natural gas in the region (Figure 1), caused 150 residential customers to lose natural gas access for multiple days [4], and resulted in emergency requests from utilities and local governments for customers to voluntarily reduce their thermostat setting to maintain reliable operations [5]. The event also interrupted electricity services to approximately 57,000 customers in the Midwest [4].
Natural gas demand for power generation is expected to rise steadily in the future [7,8], which increases risk from weather and non-weather-related events that impact the energy system. During the cold snap in New England at the end of December 2017, power generation from natural gas was substantially reduced and replaced by generation from oil, which is typically a more expensive and environmentally harmful fuel [9,10]. The area’s local system operator has since raised concerns about the future reliability of the power system because of reliance on natural gas during these types of events [11]. In California, the ability to import natural gas for power generation has been limited by the reduction in gas storage from the Aliso Canyon leak in 2015 [12], combined with other planned and unplanned pipeline outages [13]. Natural gas infrastructure has not necessarily expanded in tandem to meet growing demand, especially in the northeast United States. In early 2019, a utility in New York and two utilities in Massachusetts issued moratoriums on new residential and commercial natural gas hookups in parts of their service areas because of interstate pipeline constraints during cold weather months [14,15]. Even though natural gas supply is abundant, events that cause extreme demand for natural gas (e.g., cold snaps) or unexpected failures of infrastructure (e.g., Aliso Canyon leak) can still result in system failures.
The ability to reduce energy consumption during any event that strains natural gas resources could reduce system stress and increase reliability and resilience. Retail electric demand response (DR) programs have long been in use to reduce peak electric demand during periods of system stress, typically on hot days during the summer, with limited requests during the winter as emergency measures [16,17]. In 2018, there were 9.75 million customers enrolled in electric demand response programs, corresponding to 31 GW potential peak savings, and 12.5 GW actual peak savings [10]; potential savings from customers enrolled in electric demand response programs represented 6% of peak demand within ISO and RTO regions [18]. Comparatively, there have only been a few pilot NG-DR programs implemented over the last few years, which are relatively limited across geography and customer reach [19,20,21,22,23].
Although numerous studies have explored energy savings from thermostat setbacks of individual heating systems [24,25,26,27,28], and there have been assessments of the potential value and challenges facing NG-DR [29], only a few have provided a quantitative assessment of the potential for a NG-DR program used at scale. A series of reports by the Brattle Group quantified a NG-DR supply curve by a top-down examination of the historical relationship between outdoor temperature and aggregate demand [30,31,32]. However, this approach does not account for heat transfer dynamics occurring at the building-level, nor does it offer insight into the coldest period when demand is highest and infrastructure is most constrained. There is also limited information on savings from pilot programs and operational experience. Consumer’s Energy in Michigan reported that their emergency call for voluntary reduction in January 2019 resulted in 10% savings in demand [33]. The Southern California Gas Company savings reported for their pilot program ranged from not statistically significant to 3.7%, depending on customer class and program design [34].
The novel contribution of this study is the application of a highly granular bottom-up building stock model to analyze the technical potential of NG-DR for residential heating, providing new insights into the potential impacts on buildings, energy markets, and the power sector. We evaluate tradeoffs between building comfort and demand reductions during extreme cold and mild weather conditions in the northeast United States, and ultimately inform whether NG-DR programs can be effective strategies to improve natural gas and power sector resilience during high-stress scenarios. Previous studies have been limited in analyzing the technical potential of NG-DR; instead, they have focused on highlighting regulatory, economic, behavioral, and other implementation challenges facing theoretical NG-DR programs [35,36], which we do not address here.

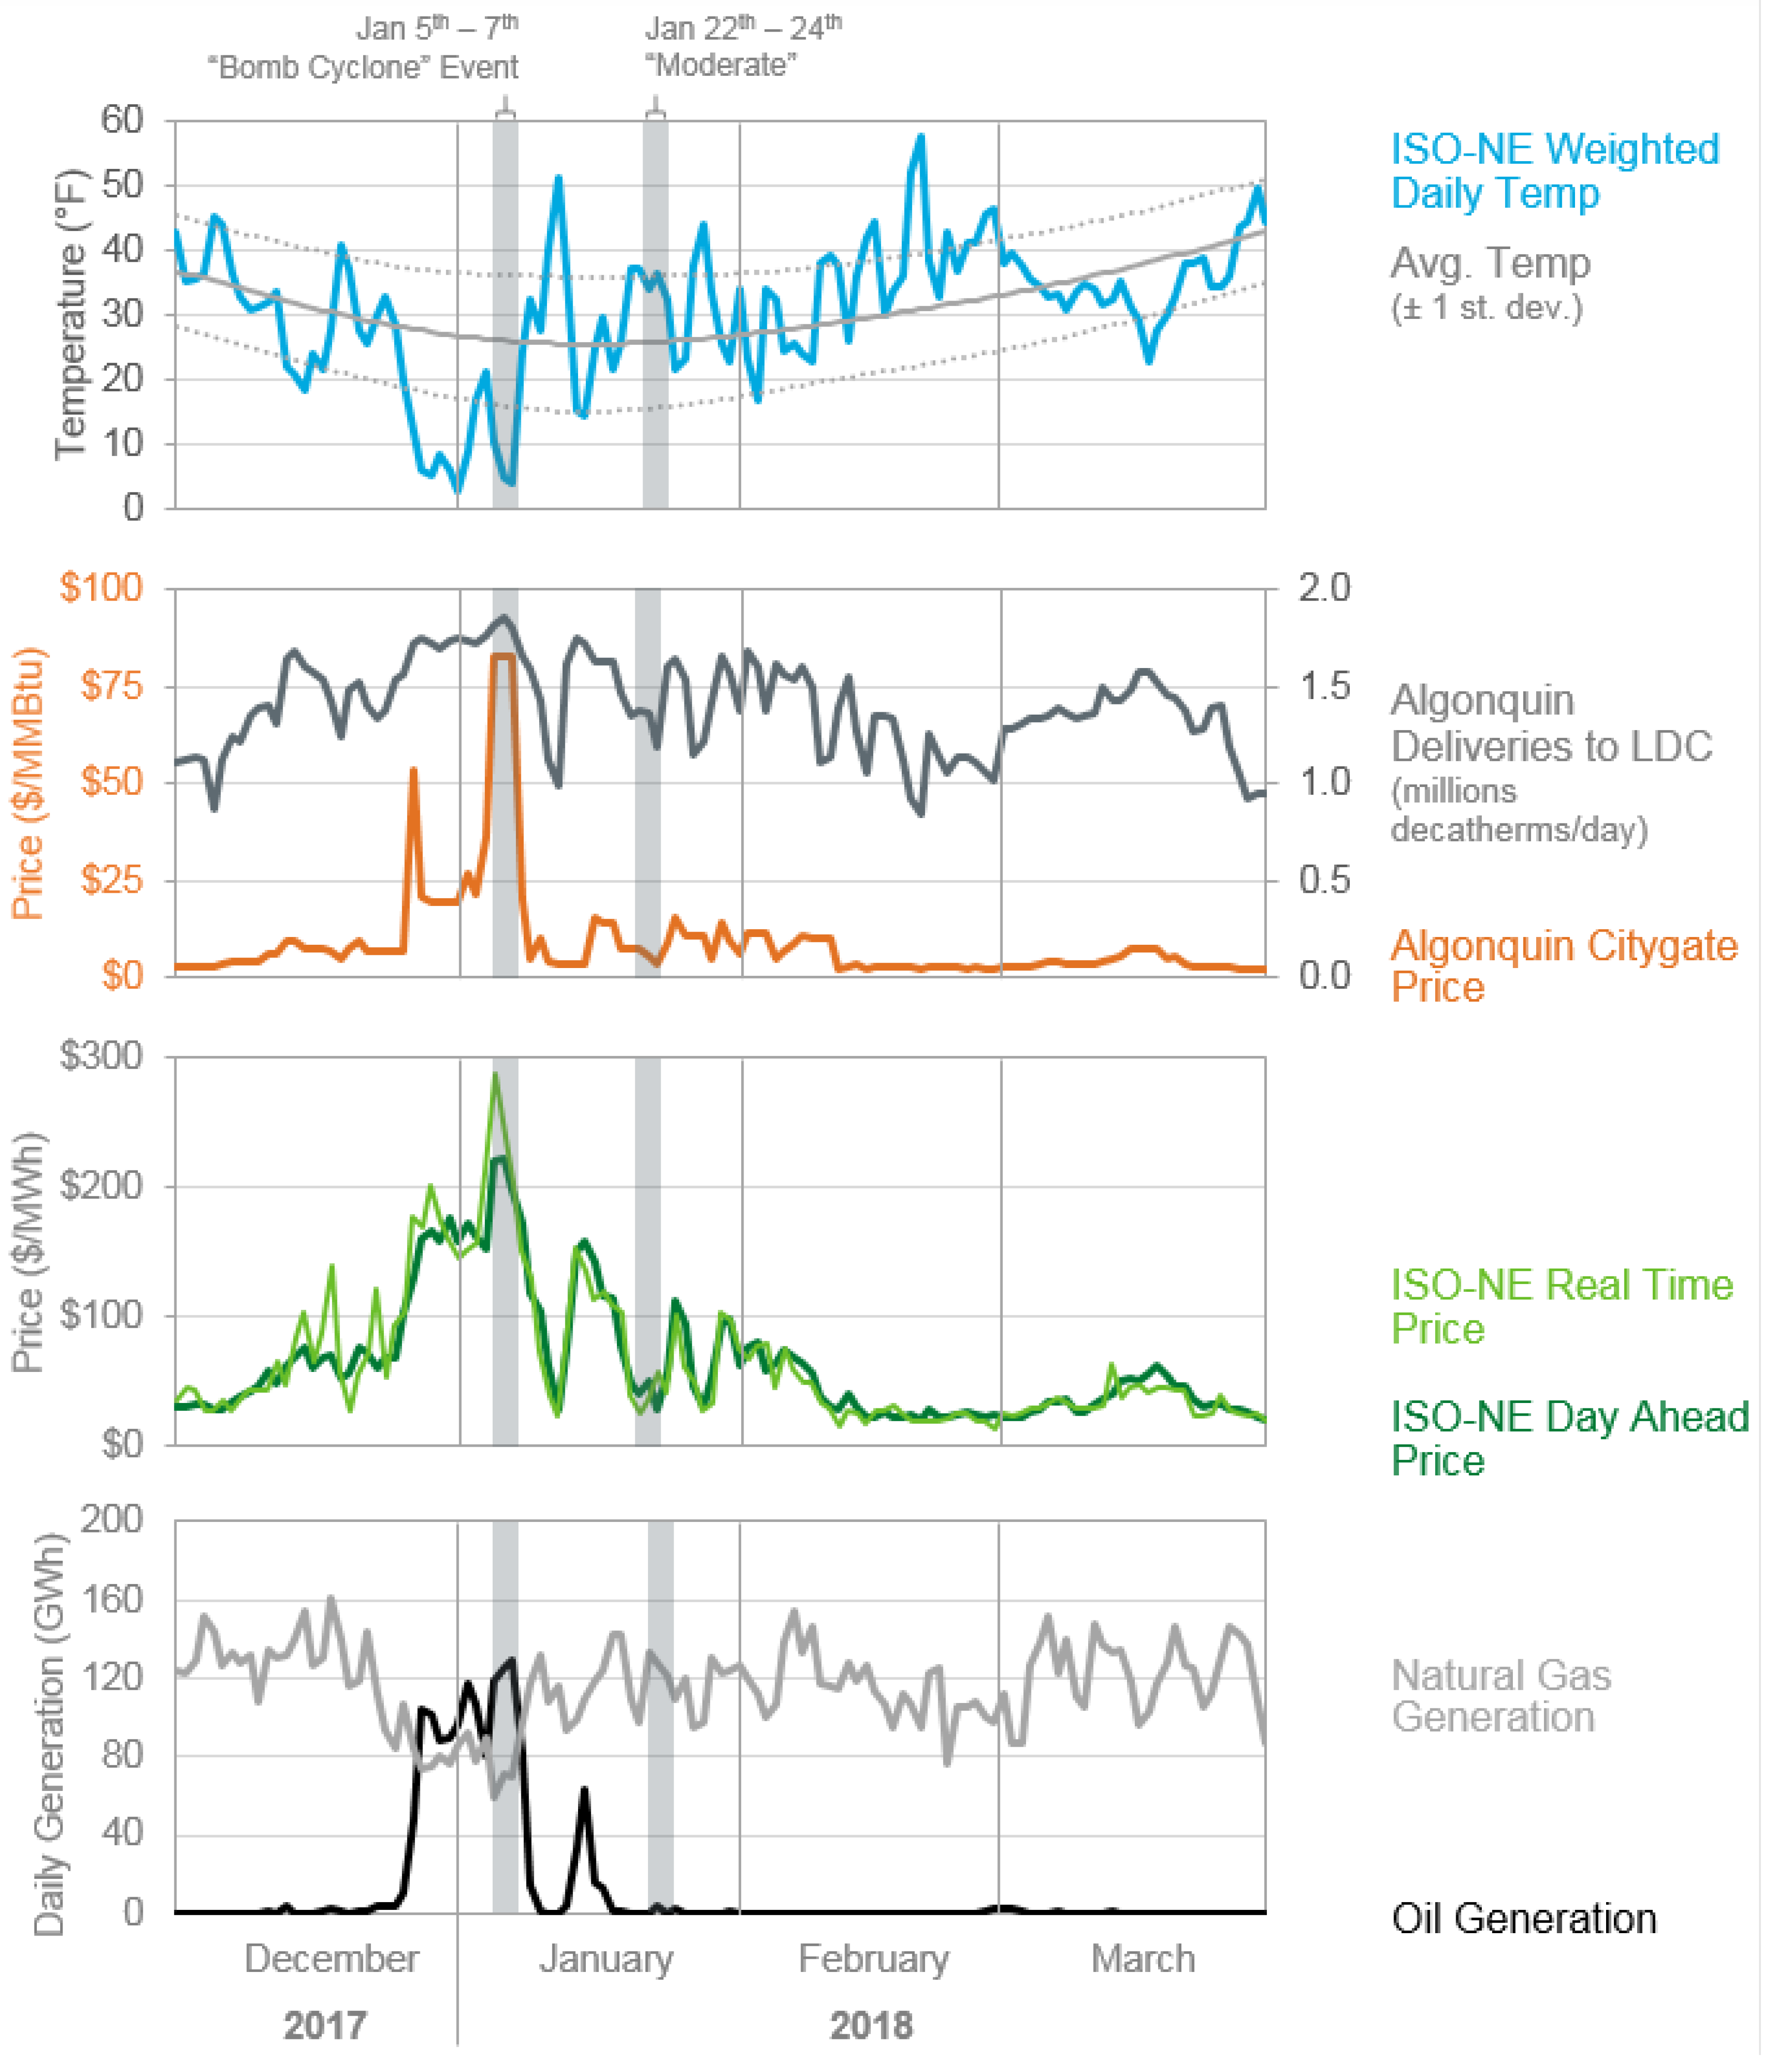
Case Study of the 2017–2018 Northeast Winter
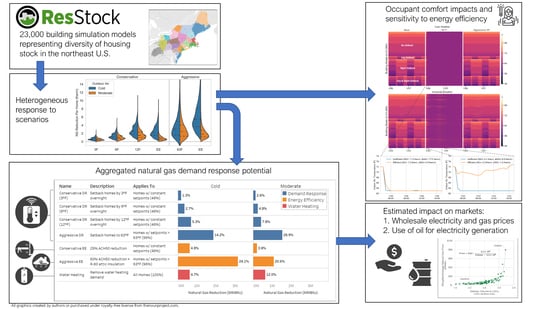
A summary of meteorological, natural gas, and power system data for the winter of 2017–2018 is presented in Figure 2. The period of interest for this case study is the bomb cyclone system that occurred in the Northeast from 5 to 7 January 2018. This period is noteworthy because of the multiday nature of the event, with daily temperatures within the ISO-NE region remaining well below average and occurring immediately following a previous cold spell the last week in December. This prolonged cold increased demand for natural gas, with deliveries from the regional Algonquin and Tennessee pipelines to the local distribution companies (LDC) that serve retail customers reaching the highest level of the previous 10 winters. This led to spikes in real-time price for natural gas, reaching USD 82/MMBtu on the Algonquin pipeline, after being below USD 10/MMBtu for the first three weeks of December 2017. Concurrently, daily average wholesale electricity prices in ISO-NE spiked, with the average daily real-time price reaching USD 288/MWh, compared to an average of USD 55/MWh in the first three weeks of December 2017. Electricity generation from natural gas fell from 161 GWh on 18 December 2017, to 70 GWh on 7 January 2018, and was generally replaced by generation from oil. Over the time span of the event, these types of cold weather events that can cause sustained multi-day high electricity prices and electricity generation from oil contrast with summertime power sector peaks, which typically last for a few hours around the hottest part of the day (Figure 2).
The Northeast is a good region to examine because of common cold weather events, a high proportion of electricity generation from natural gas, a lack of large underground natural gas storage, and constrained natural gas import capacity. In January 2018, residential buildings accounted for approximately 45% of the natural gas consumed in the northeast U.S., more than the commercial, industrial, and power generation sectors [38], and are therefore targeted in this case study. This is further amplified in extreme cold weather events and blizzards, when people are indoors more often, and commercial and industrial facilities are closed.

2. Methods

This study leverages building stock modeling capabilities and high-performance computing to quantify the technical potential of residential natural gas demand response during extreme winter weather events. Our general methodology is as follows:
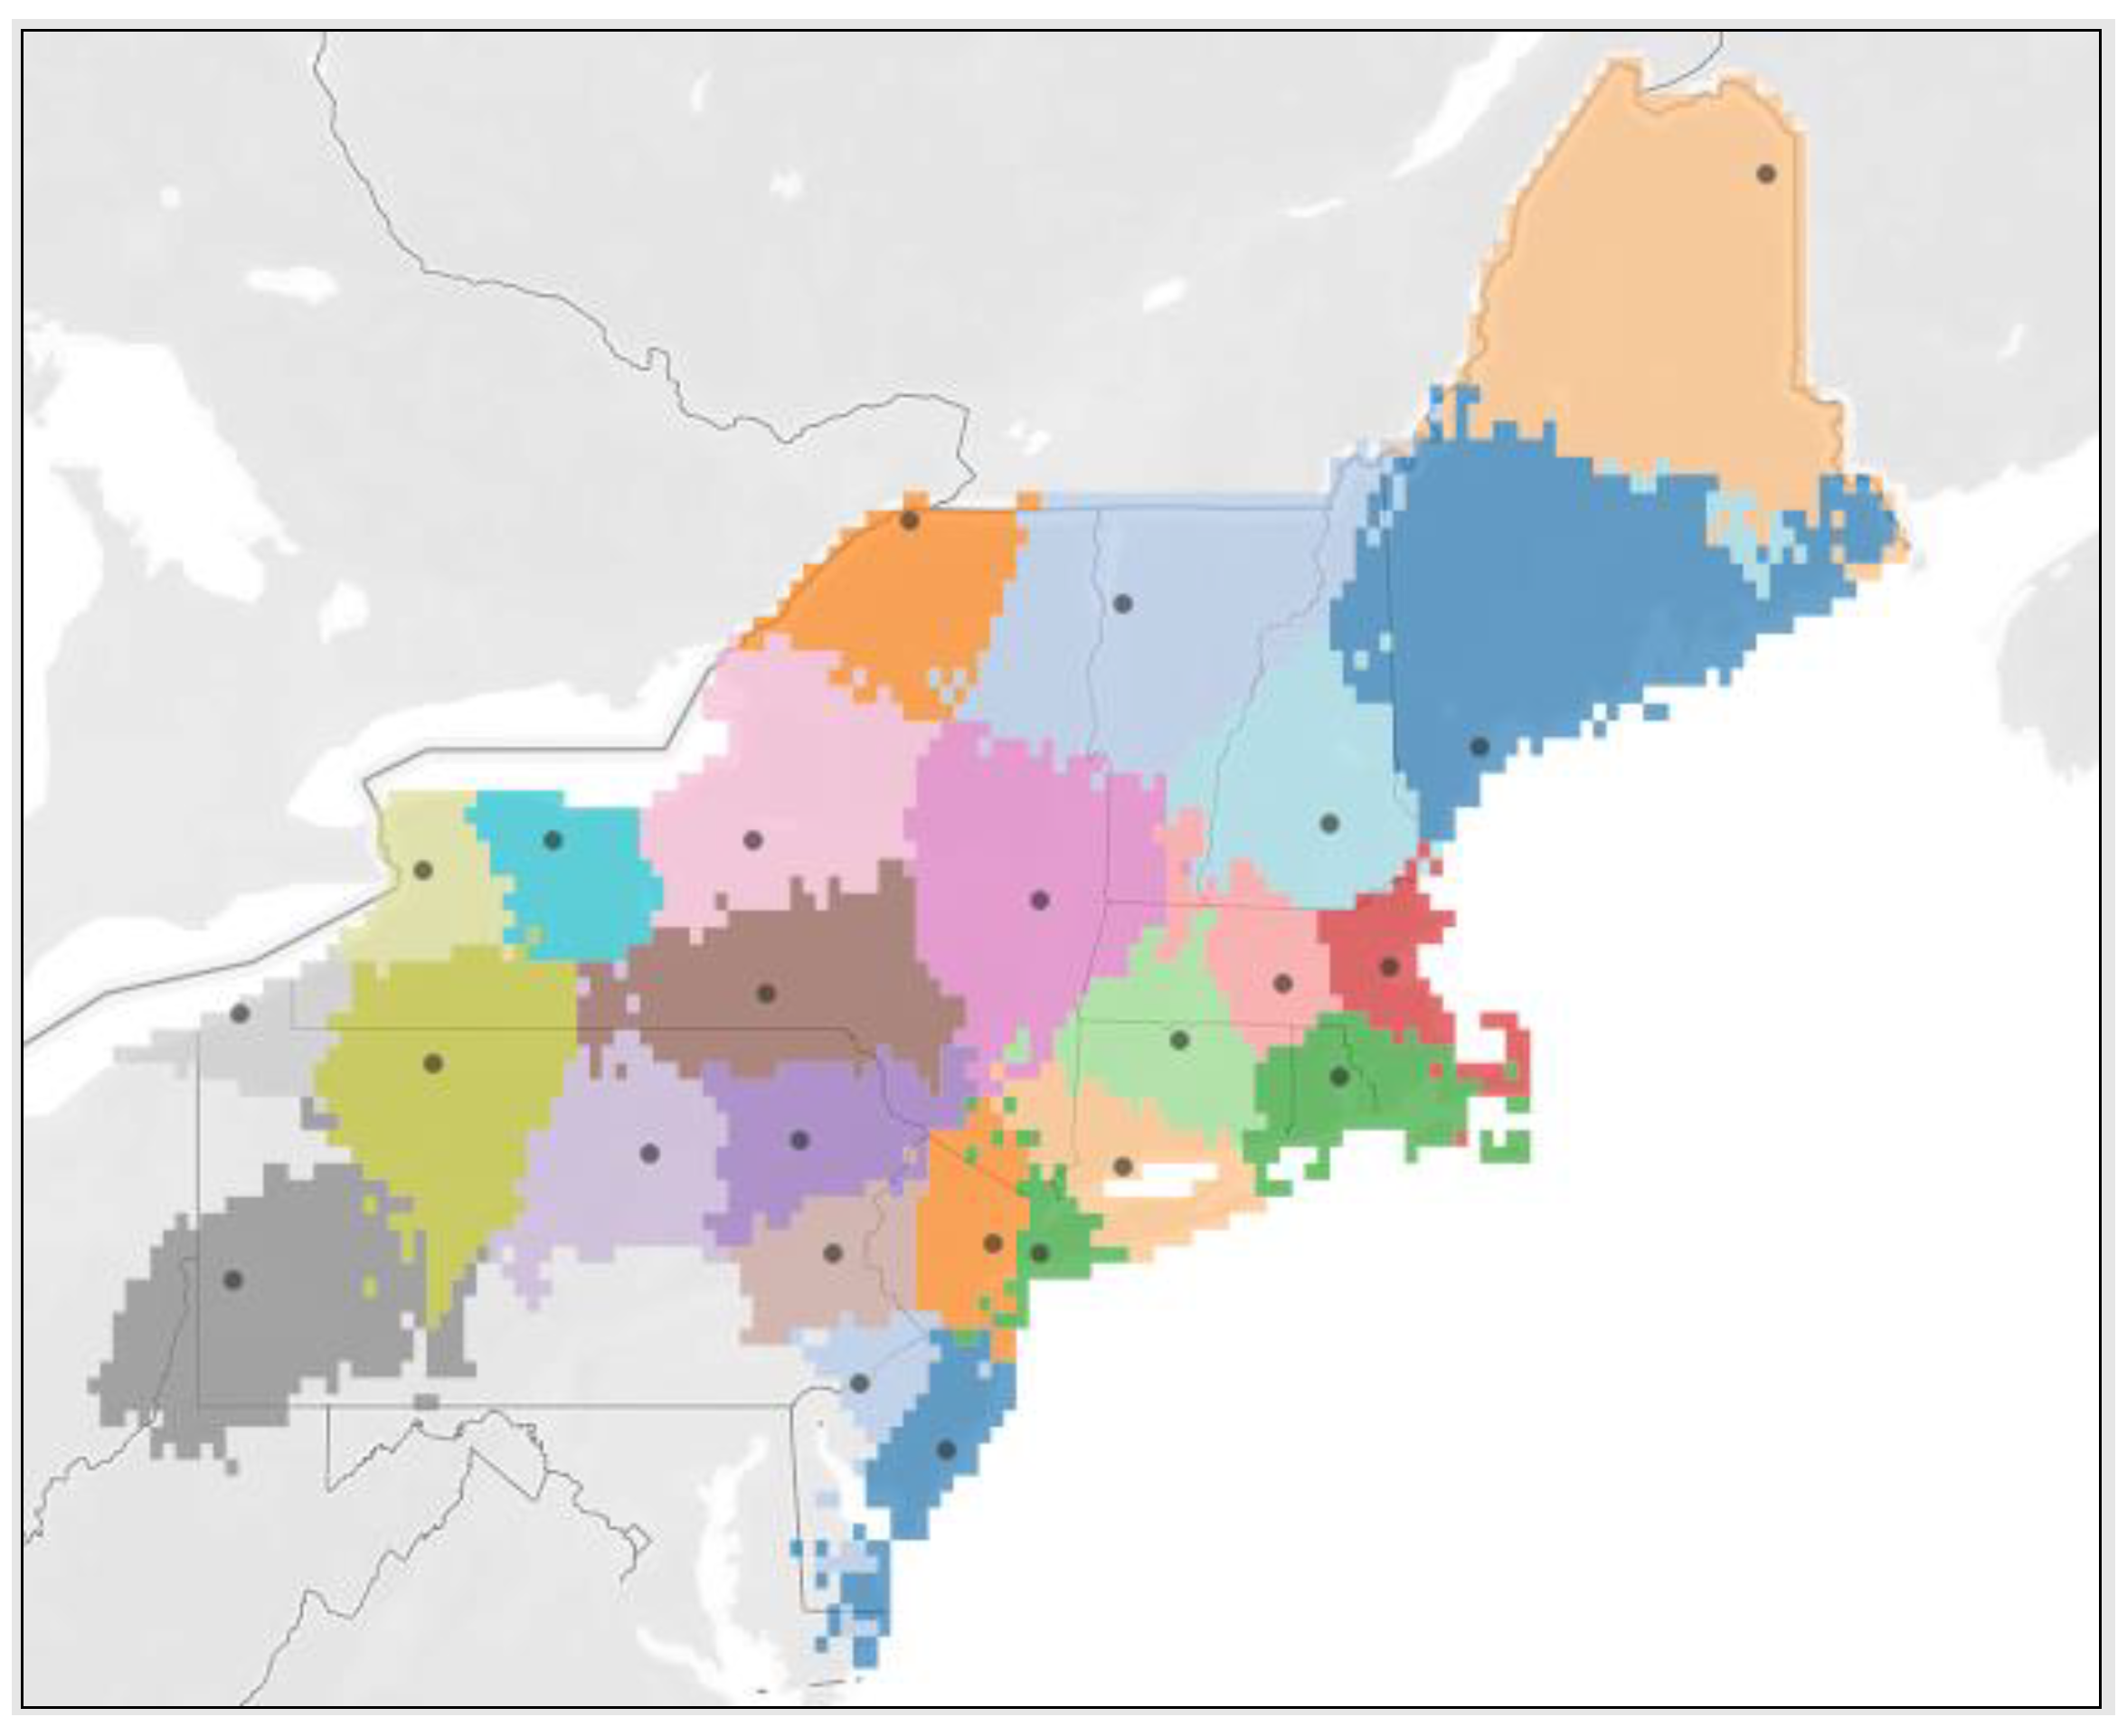
  • Establish a baseline set of building energy models representing the approximate 5.4 million detached homes that use natural gas for heating in the Northeast.
  • Simulate the baseline models to estimate the total natural gas demand.
  • Simulate aggressive and conservative demand response and energy efficiency strategies applied to the baseline home models.
  • Compare natural gas savings potential and indoor temperature impacts to the building stock and individual buildings.
  • Model the wholesale market response of natural gas supply and estimate the potential economic impacts of NG-DR.

2.1. Building Stock Modeling

The ResStockTM analysis tool [39] enables characterization and energy modeling of the 5.4 million detached homes heated with natural gas in the Northeast. ResStock is a platform that combines regional home characteristics, robust building energy modeling software, and high-performance computing to simulate whole-building energy models for the residential building stock in the United States. The simulation engine used in ResStock is EnergyPlus®, a whole-building energy simulation program that engineers, architects, and researchers use to model energy consumption [40]. Information on the calculations within EnergyPlus can be found in the EnergyPlus Engineering Reference [41]. OpenStudio [42] is an application programming interface (API) that wraps EnergyPlus to enable quick generation of building inputs and complex analyses in ResStock.
To define inputs for the individual building models, distributions of home characteristics in ResStock are sampled at the climate zone or weather file location level. The Northeast region spans 3 climate zones as defined by the American Institute of Architects (AIA), 9 states, and 26 weather file locations, as shown in Figure 3. Some of the inputs generated by the ResStock sampling routine include weather, vintage, heating fuel, HVAC system and efficiency, insulation, home size, windows, water heating, appliances, and infiltration, each of which have a unique distribution of options, often dependent on higher-level parameters such as location or vintage. The baseline temperature setpoint data are queried from the Residential Energy Consumption Survey (RECS) [43]. More than half of survey respondents already employ some form of thermostat offset during the winter, so baseline inputs to the ResStock sampling routine include offset magnitude and offset schedule. Of the homes that have heating setbacks, magnitudes range from 3–11 °F (1.7–6.1 °C) and the schedules include daytime, nighttime, and both daytime and nighttime setbacks. Further details regarding the background and methodology of ResStock can be found in the technical report: Energy Efficiency Potential in the U.S. Single-Family Housing Stock [39].
To model the detached homes that use natural gas for heating in the northeast U.S., 23,270 models are generated with the ResStock sampling routine, each model is simulated at 10 min timesteps, and results are scaled to represent 5.4 million homes. Additional models are generated using the baseline homes with energy efficiency and demand response upgrades applied, as discussed in Section 2.2. Each building simulation takes approximately 17 s to simulate a 3 day period using a high-performance computing system, totaling about 610 CPU-hours for all baseline and DR/EE scenarios. By modeling many homes, we provide a highly granular view of the housing stock across geography, vintage, construction properties, installed equipment, appliances, and occupant behavior.

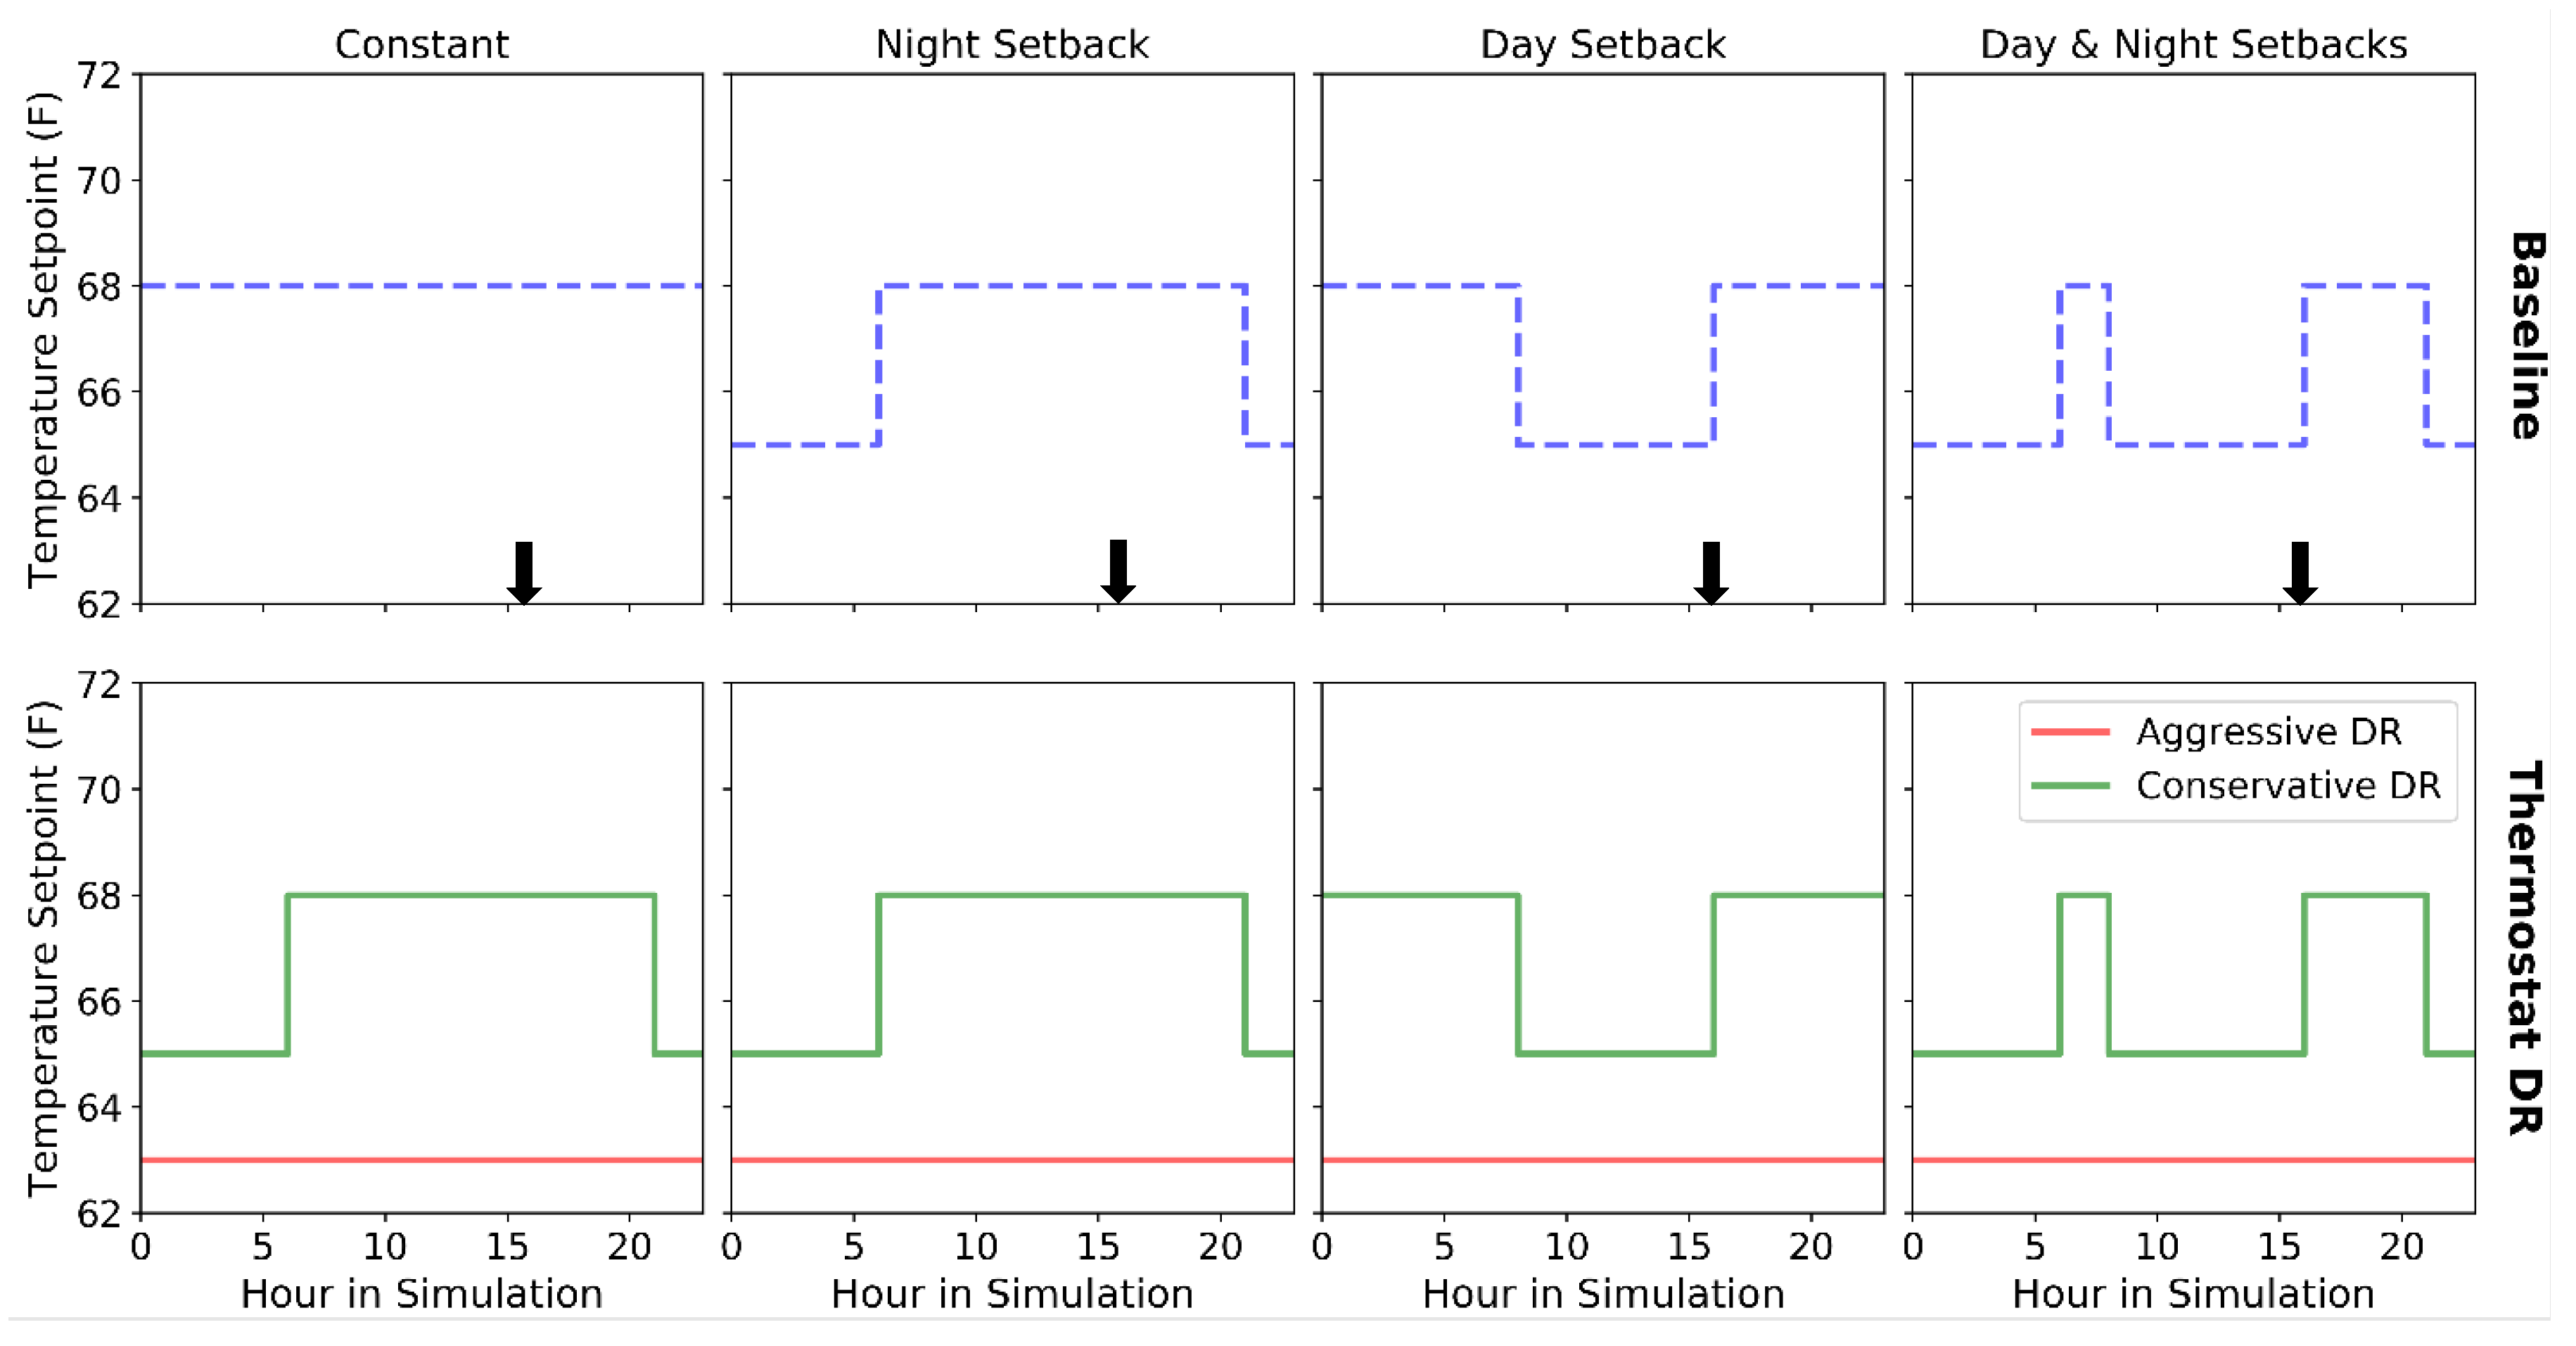
2.2. Demand Response and Energy Efficiency Strategies

We analyzed numerous demand response and energy-efficient upgrade scenarios during the 2018 bomb cyclone and during a period of moderate outdoor temperatures. Analyzing the impact of various strategies relative to a base case demonstrates the range of gas savings technically possible from NG-DR in the northeast U.S. Table 1 shows the demand response and energy efficiency strategies applied to the baseline homes in ResStock. We considered two approaches to demand response via thermostat setpoint control applied to natural-gas-heated homes: (1) conservative demand response which adds overnight temperature setbacks of varying magnitude to homes currently without setbacks (2.4 million homes, or 46% of total), and (2) aggressive demand response which sets a constant setback of 63 °F (17.2 °C) to homes with settings above this level (5.0 million homes, or 96% of total). Eight total thermostat demand response scenarios were simulated, spanning cold and moderate outdoor temperatures. The conservative demand response strategy is designed to reduce gas demand while limiting impacts on occupant comfort. This strategy is based on the assumptions that temperature setbacks during sleep are generally more tolerable than during active hours and households with pre-existing temperature setbacks have likely already maximized their energy savings within the bounds of occupant comfort. The three variants of the strategy apply 3, 6, and 12 °F (1.7, 3.3, and 6.7 °C) reductions to each household’s existing thermostat setpoint, covering the range of setback magnitudes common in the United States [43]. The aggressive demand response strategy is designed to maximize gas savings by pushing all homes to the edge of comfortable indoor conditions. The basis for selecting the aggressive demand response setpoint comes from the January 2019 polar vortex event in the Midwest United States, during which utilities urged customers to set thermostats in the range of 65 (18.3 °C) to 60 °F (15.6 °C) in certain areas [5]. Example thermostat demand response schedules for the various baseline schedules are shown in Figure 4.
Thermostat NG-DR was compared to load shedding from gas water heaters and energy-efficient building retrofits. The water heater load shedding scenario is calculated by eliminating gas water heating demand, which is interpreted as an upper bound of the NG-DR potential of water heaters. The energy-efficient scenarios include conservative and aggressive levels of air sealing and attic insulation, which are chosen based on common utility energy efficiency programs for existing residential buildings. The response of each DR and EE scenario was analyzed at the building stock-level and the individual home level, as discussed further in Section 3, Section 4 and Section 5.

2.3. Modeling Pricing and Grid Impacts

We examined the potential impact of NG-DR on natural gas and electricity prices by examining the historical relationship between price and total deliveries to LDCs. The functional form used to fit both data sets is shown in Equation (1), where x is the total daily LDC delivery, f(x) is either the natural gas or wholesale electricity price, and x0 and b are fixed parameters used for fitting. The inverse functional form was chosen as it provided the best fit to both data sets. The regression equations and curves for modeling gas and electric prices are shown in Figure 5 For natural gas deliveries to LDCs, the data came from the sum of daily scheduled deliveries to LDCs on the Algonquin and Tennessee (zone 6) pipelines [44], which are the major pipelines in the area that serves both LDCs and power plants. The natural gas prices are calculated as the average daily price on both pipelines weighted by the daily LDC scheduled deliveries [45]. The daily average wholesale real-time electricity prices are used directly as reported by ISO-NE [46]. Note that the city-gate price and wholesale electricity prices only represent a portion of the overall market as some portion of both natural gas and electricity are secured through bilateral agreements, where the price for each commodity is set ahead of time. This simple regression of price and volume does not account for the price elasticity of demand and is presented here as a first order assessment. Nor does it account for market structure which includes fixed price contracts and consumers who are insensitive to wholesale prices. More comprehensive co-modeling of the natural gas and power sector operations and demand are required to assess price impacts with greater accuracy.
f ( x ) = a ( x x 0 ) 1 + b
We estimated the impact of NG-DR on wholesale electricity prices by subtracting the total NG-DR savings over a 24 h period from the actual LDC deliveries on that date and inputting into the functional form. We also estimated additional possible electricity generation from natural gas and oil generation offset by multiplying the total daily natural gas savings in Btu by the average heat rate for a natural gas combined cycle generator, which was 7649 Btu/kWh in 2017 [47].

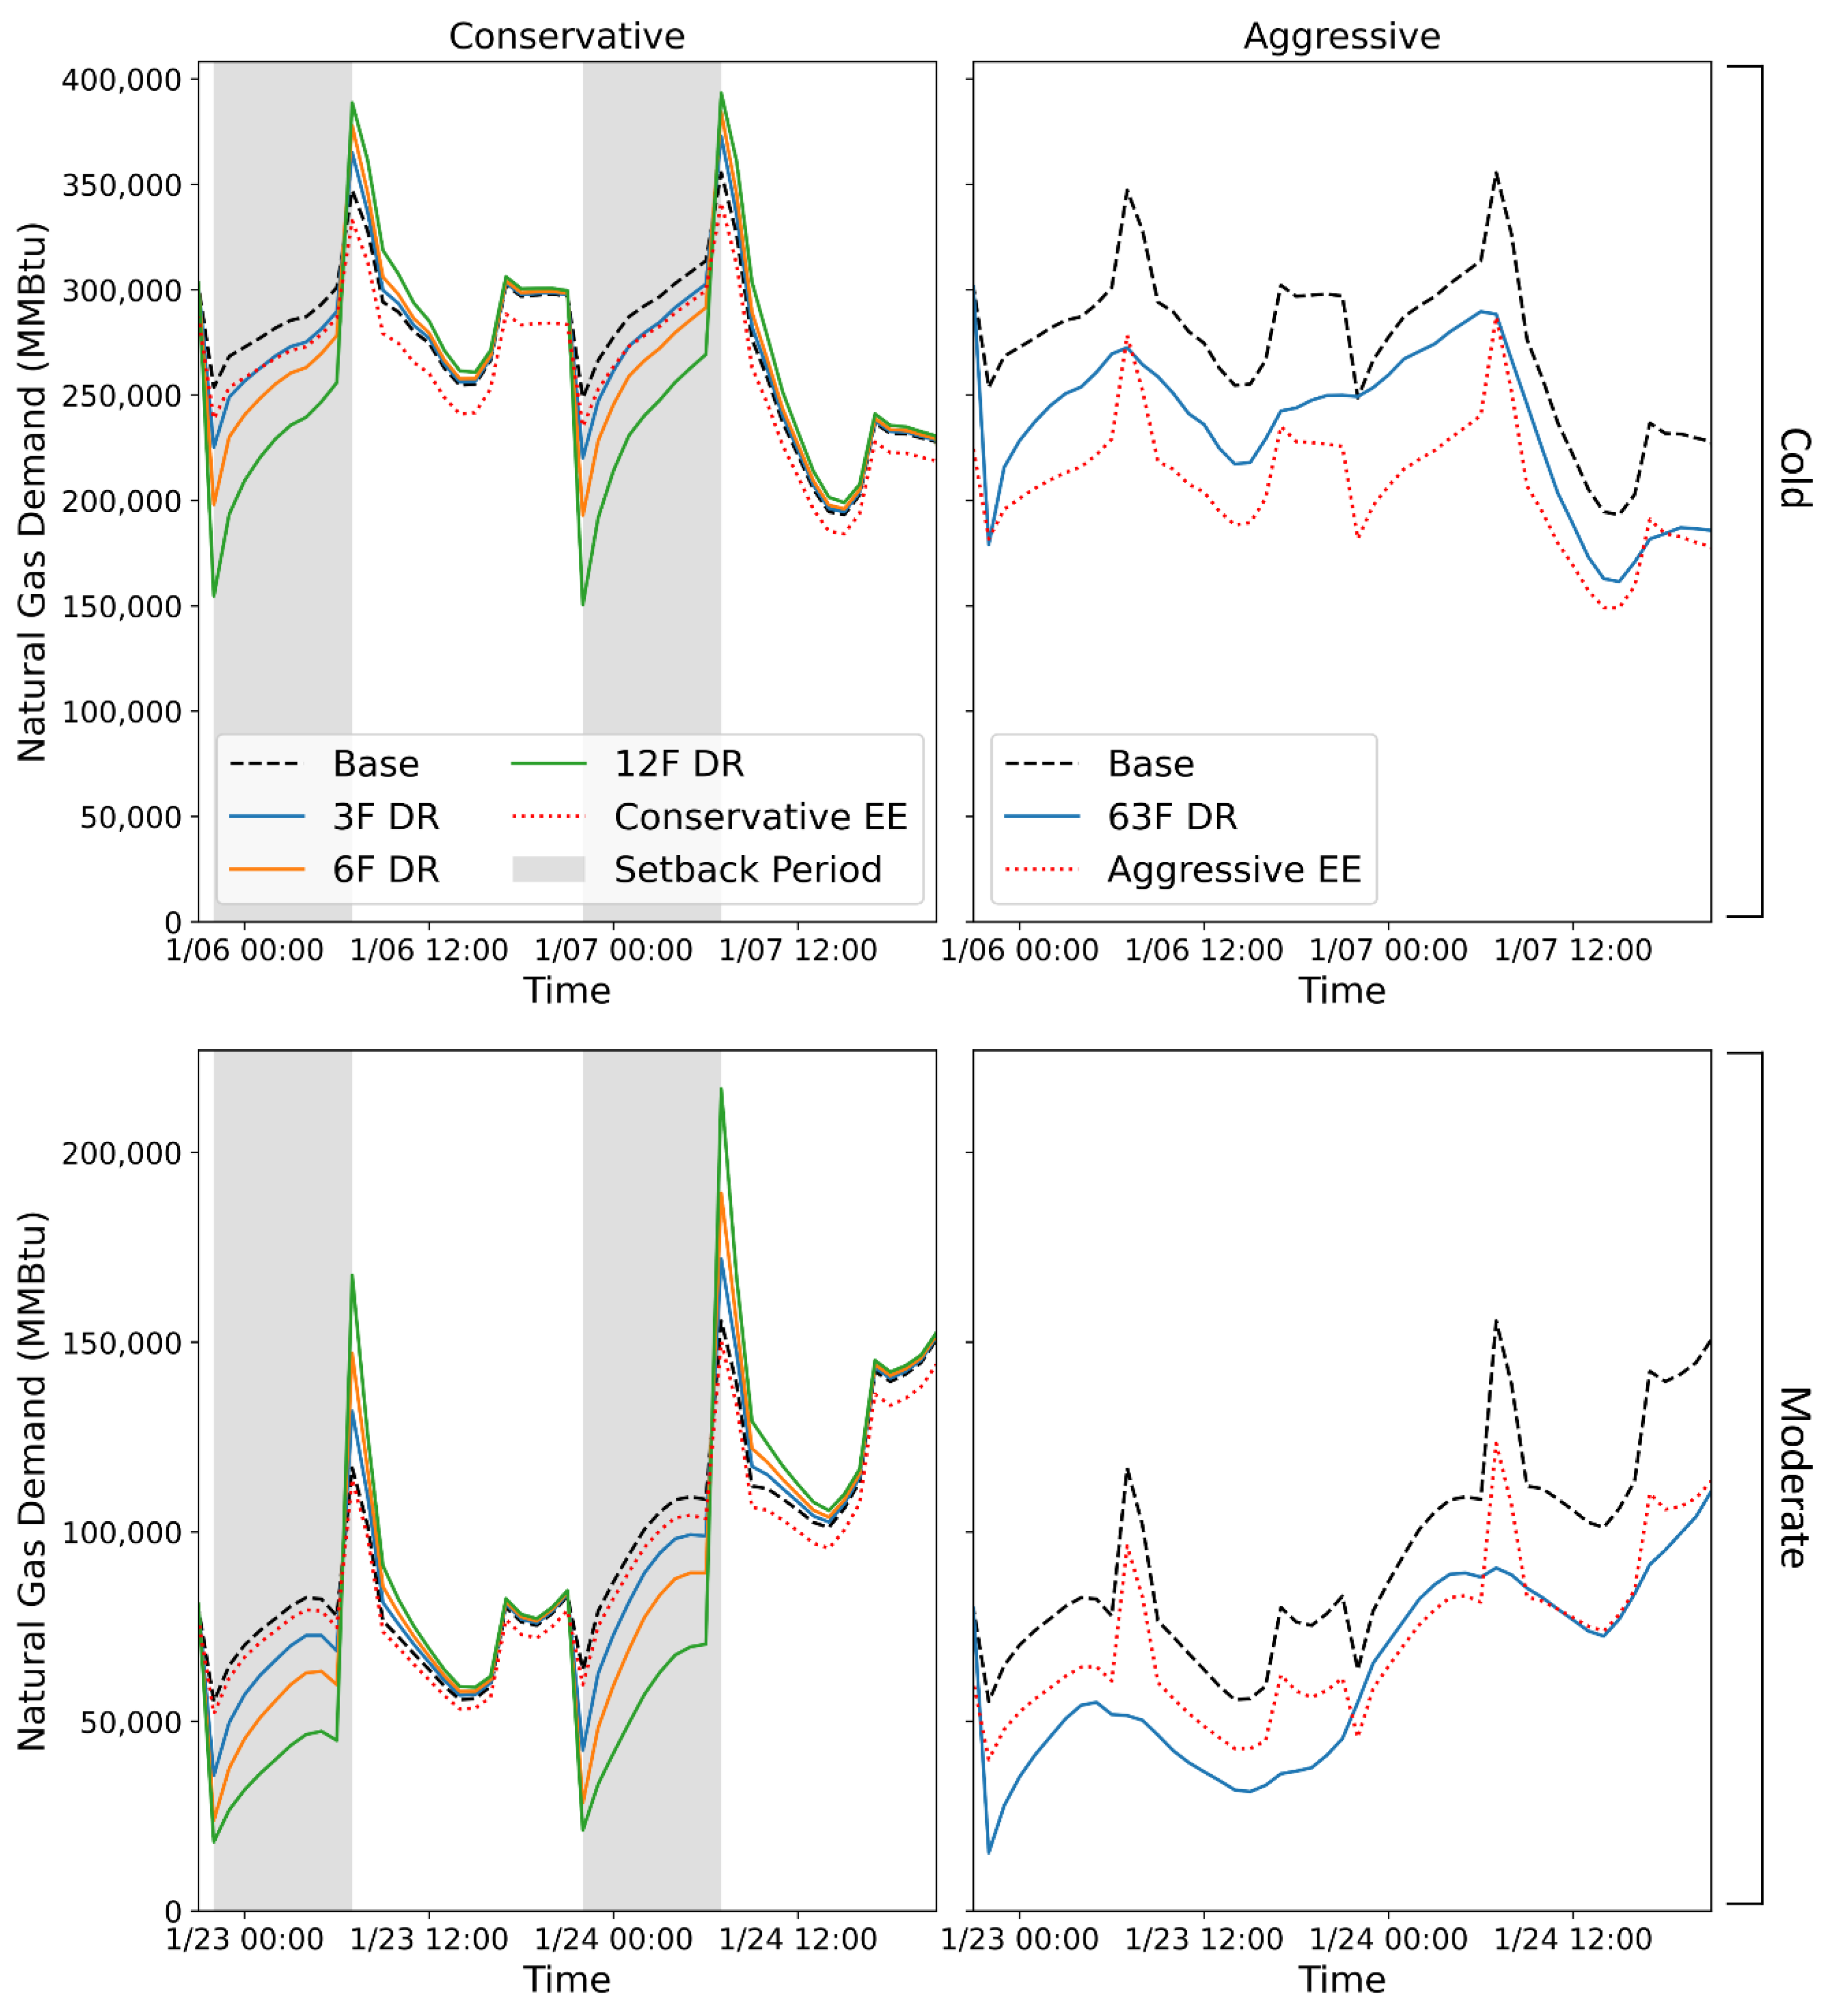
3. Natural Gas Savings Potential of Demand Response

Natural gas system impacts from extreme cold weather occur in the order of days, so gas savings are calculated across 48 h simulation periods. As seen in Figure 6, the potential natural gas savings from DR during the cold and moderate events ranges from 1 to 8% in the conservative cases and up to 14–29% in the aggressive cases, relative to the baseline results during each time period. These savings are similar in magnitude to those arising from the conservative (4–5%) and aggressive (21–24%) EE scenarios. Thermostat NG-DR savings are also comparable to the total gas water heating demand (5–12%), which is the upper threshold of water heating demand response potential. In reality, only a fraction of the water heating demand could be leveraged as a resource, signifying thermostat DR to be more effective in providing natural gas savings, especially during cold periods.
Hourly results of gas demand across scenarios can explain the implications of the various approaches to demand reduction, as shown in Figure 7. Introducing nightly setbacks in the conservative strategy creates new minima and maxima in natural gas demand relative to the base case at the beginning and end of demand response events, respectively. Alternatively, the 48 h aggressive setback maintains a relatively smooth profile, as nearly all homes are set to a fixed 63 °F (17.2 °C). However, this case would accompany a large increase in gas use after the 48 h period when homes return to their original setpoints. While the timing of these new maxima needs to be considered in the design of a demand response program, the positive aggregate net savings indicates that the increased demand does not negate the savings from the NG-DR implementation.

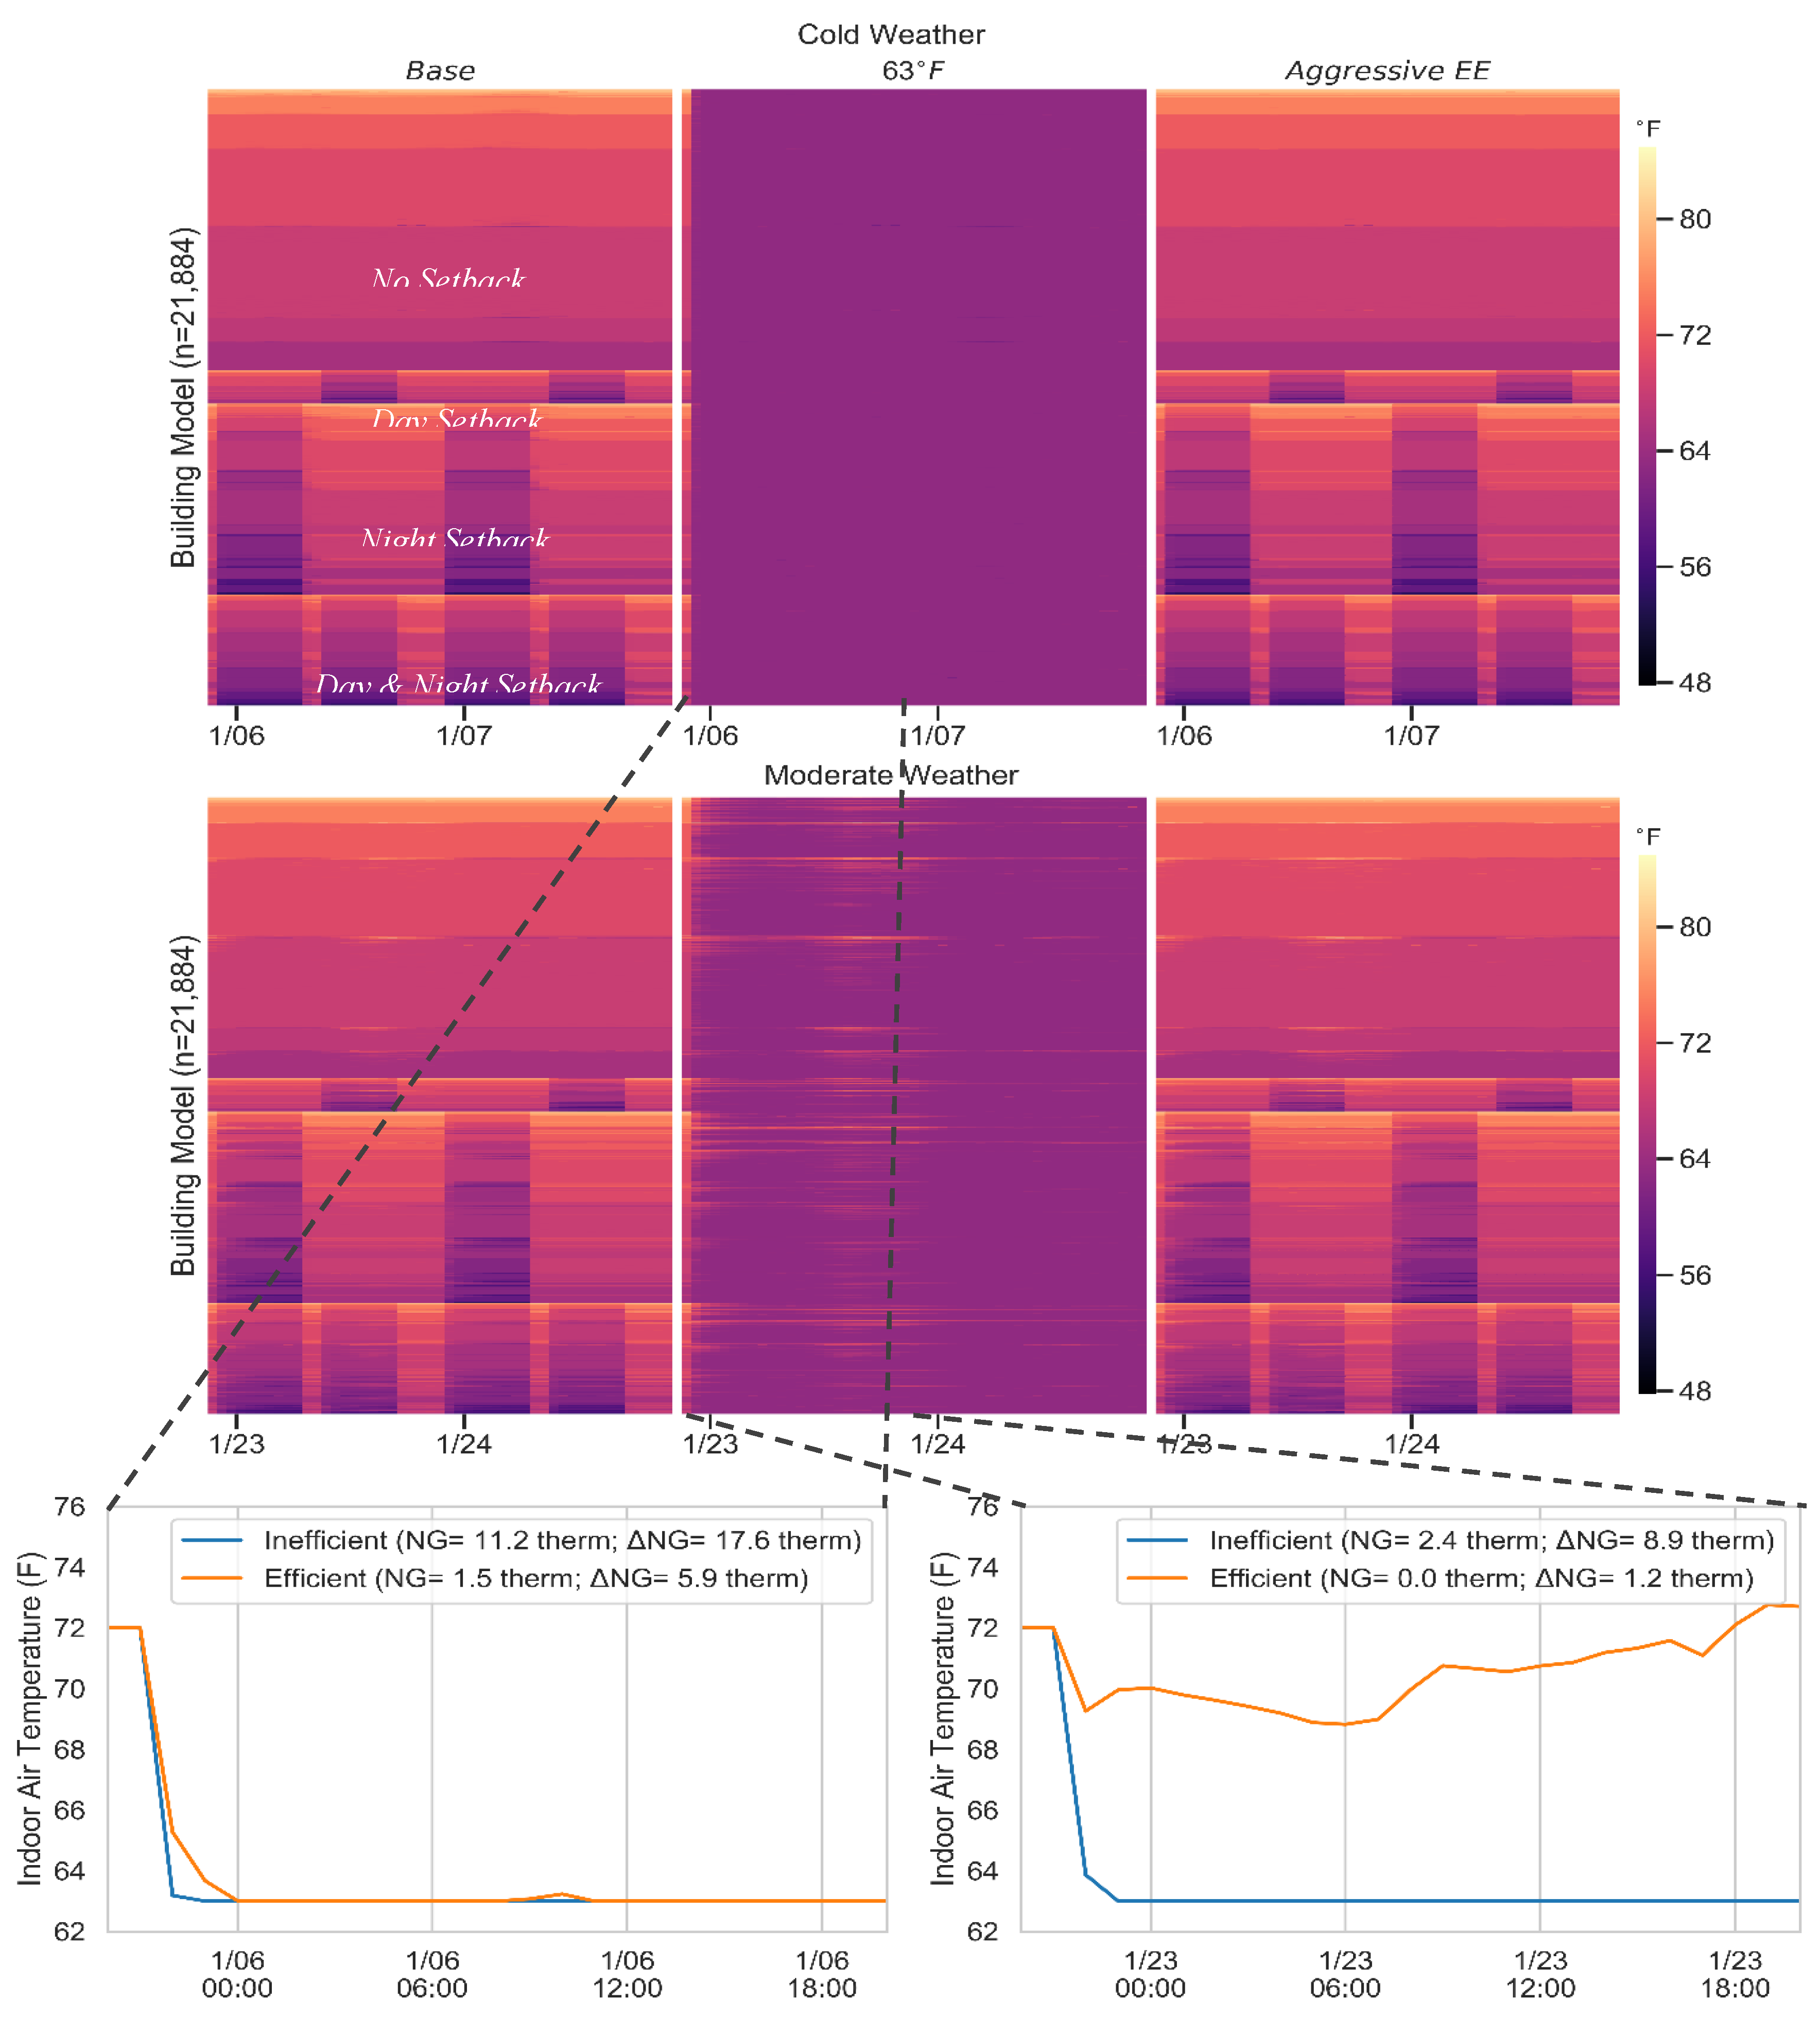
4. Implications of a Diverse Housing Stock

The diversity inherent in residential buildings in the United States means there is no one-size-fits-all solution to implementing demand response. Homes range widely in terms of efficiency levels, construction, geometry, and occupant behavior, even within a common state or region, resulting in wide-ranging responses to load-shedding techniques. ResStock captures this diversity in the residential building stock, offering a highly granular simulation of demand response strategies across the 5.4 million gas-heated detached homes in the Northeast. Figure 8 displays the distributions of gas reductions from homes with thermostat demand response, which demonstrates the diversity in savings and the influence of load-shedding approaches and outdoor temperature. In general, the more aggressive an approach is (EE or DR), the wider range of savings observed, particularly during cold outdoor temperatures. A small number of data points in the 63 °F setback distribution are below zero because of homes with existing setbacks that fell below 63 °F, resulting in negative savings after applying the demand response.

4.1. Impact of Conservative Strategies on Indoor Temperature

In addition to gas savings for individual homes, ResStock provides unique insight into expected occupant comfort impacts. Data on a home-by-home basis are presented in Figure 9 and Figure 10, which display heatmaps of indoor air temperatures for each building model. The heatmaps convey a variability in heat transfer dynamics among homes, indicated by temperatures during coasting and recovery periods. A coasting period occurs at the start of a setback, when temperatures are above the setpoint and no heating is required, while a recovery period occurs following the setback, and the heating system is working to recover the indoor temperature to the original setpoint. Select homes are plotted for a well-insulated and tightly sealed home, as well as an uninsulated and poorly sealed home. These homes share a climate, have the same setpoint schedule, and the same HVAC equipment, but differ in the level of air leakage and the wall and roof insulation R-values, which closely influence heating demand [48].
The conservative demand response approach is designed to limit occupant discomfort by applying setbacks only during nighttime hours, which are seen as bands of colder temperatures in the 3, 6, and 12 °F plots of Figure 9. Recovery periods are longest during the cold period, taking up to four hours to reheat a home in some cases, whereas during moderate temperatures, homes recover to the original setpoint quickly and have a longer coasting period. The differences in the length of coasting and recovery periods between individual homes are mostly influenced by the energy efficiency of the building envelope, as demonstrated in the indoor temperature plots shown at the bottom of Figure 9, which show the effects of insulation and air leakage. During the coldest day, an efficient home experiences a coasting period that extends over half the length of the 12 °F setback period, while an inefficient home has virtually no coasting period. During warmer days, the efficient building only deviates by 3 °F (1.7 °C), whereas the inefficient building deviates by the full 12 °F (6.7 °C) of setback. Therefore, homes with comparable envelope efficiencies to the efficient example could be the best candidates for a NG-DR program aimed at limiting disruptions to comfort, although savings per home are much less than homes with less efficient envelopes.

4.2. Impact of Aggressive Strategies on Indoor Temperature

Similar responses are observed when implementing an aggressive demand response strategy (Figure 10). The fixed 63 °F setpoint results in nearly every home experiencing a significant reduction in indoor temperatures relative to the base case, as nearly all homes have baseline setpoints above 63 °F. Energy efficiency of homes plays a smaller role in maintaining comfort than in the conservative scenario. The aggressive demand response event lasts too long to significantly impact temperatures with coasting, and therefore heatmaps display almost no temperature variation between homes for the coldest period. However, diversity in homes still influences energy use and savings during the setback. As indicated in the lower two plots, an inefficient home can achieve significantly higher natural gas savings than an efficient home, while the efficient home provides minimal advantages to occupant comfort. During mild outdoor temperatures, distinctions of indoor temperatures between homes is more evident, because the efficient home more effectively maintains the zone temperature. In the case of an extended setback in extreme cold temperatures, efficient building envelopes do little for occupant comfort, and therefore, homes with less efficient envelope characteristics deliver more value in the form of gas savings, while not sacrificing additional comfort.

5. Economic and Grid Analysis

The aggregated NG-DR savings are estimated to be large enough to impact natural gas prices and available natural gas for electricity generation, and have the potential to offset oil generation. An inverse function provides the best fit for the relationship between daily gas deliveries to LDCs and both natural gas and electricity prices (Figure 5). This implies that during high priced periods, relatively small reductions in natural gas demand could have an outsized impact on price.
For example, the historical dataset for natural gas spot prices and deliveries to LDCs during the winter of 2017–2018 shows that prices are around USD 20/MMBtu when LDC deliveries are 3 million decatherms/day, but quadrupled to nearly USD 80/MMBtu on 5 January 2018 when deliveries only increased by 7% to 3.2 decatherms/day. The conservative 3 °F overnight setback saves 87,695 MMBtu on 6 January 2018 corresponding to a 3% reduction in the deliveries to LDCs on 6 January 2018. Based on the inverse relationship of price to delivered volume, this reduction in demand from DR could have a significant impact on the NG spot price, which would be further amplified in the more aggressive scenarios. Although the effect is more muted, a similar relationship is observed for electricity prices, and the inverse relationship to LDC deliveries translates to a 25% reduction (USD 303/MWh to USD 226/MWh) in electricity price for the conservative 3 °F setback, as shown in Table 2. These results should be considered rough upper bounds only, as they assume that all houses participating in the NG-DR program exist on the same pipeline network that serves natural gas plants and that electricity demand is perfectly inelastic in the short term. We did not quantitatively estimate the impact of NG-DR on gas prices as the pipeline price data did not contain data for the days of interest, 6 January 2018 and 7 January 2018, which had the highest LDC delivered volumes for the 2017–2018 winter. The market volatility observed during extreme winter temperatures indicates a strain on the gas and electric systems. Ultimately, this analysis highlights the role of gas demand in energy markets, and how relatively minor reductions in demand may improve stability.
The presented levels of NG-DR could impact the additional natural gas available for electricity generation (up to 171% increase) and displacement of electricity generated from oil (up to a 97% decrease), as reported in Table 2. This is a maximum potential only as it assumes that every unit of natural gas saved on the demand side can be delivered to a natural gas power plant. The actual amount of additional natural gas generation and oil generation displaced depends on the location of savings relative to electricity generators on the pipeline and distribution network as well as the timing of the savings relative to the needs of the power sector. Any reduction in oil usage will also prolong the oil stockpiled at plants and increases the system’s ability to weather future events. In ISO New England (ISO-NE), the percentage of the maximum amount of fuel oil available for electricity generation declined from 68% on 1 December 2017 to 19% on 9 January 2018. With two months of winter weather remaining, this early depletion of oil reduced the ability to effectively respond to another cold weather event with restricted natural gas supply [49].

6. Discussion and Conclusions

This analysis quantifies residential natural gas savings from demand response during the winter of 2017–2018 in the northeast U.S., during which time the region experienced high natural gas demand peaks, strained capacity of pipeline network, and uncharacteristic natural gas and electricity market fluctuations. We demonstrate thermostat setpoint demand response as a promising method of shedding natural gas demand in the residential building sector. Because ResStock can characterize residential buildings across all regions in the contiguous United States, this methodology can be applied to other regions with different characteristics and weather. Areas with cold winters that rely heavily on natural gas for heating, similar to the northeast U.S., are likely to have potential for NG-DR in residential buildings. Thermostat setpoint adjustment as a load management strategy in cold weather has significant technical potential and far-reaching impacts on the grid and consumers. Because natural gas is a primary source for electricity generation in many parts of the United States, reducing gas demand not only relieves stress on the gas distribution network, but also the electric grid, and can help to stabilize local energy markets. NG-DR during extreme cold weather in particular improves the resilience of the gas supply and the electric grid. During recent extreme winter weather events in the Northeast and Midwest, natural gas systems and the power grid experienced extraordinary challenges in meeting demands of customers. Without the option of demand-side energy management, electric utilities may resort to more expensive and environmentally harmful forms of power generation such as oil, and both electric and gas utilities risk service interruptions. NG-DR may also be able to defer additional capacity in natural gas infrastructure with associated deferment in costs. Furthermore, by understanding the complicated responses of a diverse housing stock and implementing demand response programs around voluntary participants, programs could be designed to protect more sensitive populations and maintain comfort constraints.
Although this study focuses on the technical potential of NG-DR savings under different implementations, the realized impacts are dependent on the enrollment and participation rate of customers in such a program. Customer enrollment and participation in existing electricity demand response programs may guide what could be possible for a residential NG-DR program. In 2017, 5.8% of residential customers were enrolled in some type of electricity demand response program, and the 10 highest enrollment rates for demand response programs ranged from 17% to 99%, [50]. Although this provides some evidence that enrolling large fractions of residential customers for NG-DR programs may be achievable, it remains largely unknown how differences in needs for NG-DR programs in timing, duration, and overall management would change customers’ willingness to participate. Barriers to implementation that extend beyond the scope of this study include market adoption at the home level and regulatory and market constraints applicable to electricity and natural gas providers. Furthermore, the demand response strategies simulated assume that 100% of eligible households would participate. Practically, the strategies could be implemented with Internet-connected thermostats in all households, or more manually, by encouraging customers to reduce thermostat setpoints via television, radio, or a “reverse 911” public alert system. The latter, manual implementation, would be expected to have a lower participation rate, which we do not consider.
Widespread energy efficiency upgrades (e.g., increasing insulation, replacing furnaces and boilers) have a high potential for reducing natural gas year-round, not just during extreme events, which provide economic benefits to building occupants and utilities while improving comfort in homes. However, these types of upgrades require homeowners to make large capital expenditures. Thermostat NG-DR programs have much lower capital costs and result in quicker payback periods for consumers, which could lead to higher adoption rates. Additionally, thermostat demand response can be dispatchable in order to tailor events based on gas and electric availability, occupant needs, and market forecasts. As evidenced in DR programs in the electric sector, this leads to greater peak demand savings and lower program costs than utility efficiency programs [51]. We also consider potential water heating savings by summing the entire natural gas demand of water heaters in detached homes, establishing an upper bound of savings for gas water heating demand response. In reality, a gas water heater demand response event that is designed to minimize occupant comfort impacts (e.g., preheating water) would achieve only a small fraction of what is shown in Figure 6, meaning that water heater NG-DR is likely not a competitive option compared to thermostat NG-DR.
Finally, these results indicate that residential NG-DR has sufficient technical potential to reduce wholesale energy prices during multiday cold weather events and could enable increased reliability and resiliency of the power system through displacement of generation from oil. Further work is needed to understand the location of natural gas savings relative to the overall operation of the physical natural gas infrastructure, designing implementation schedules to reduce the spike in demand during the recovery period, and in understanding the costs of enabling NG-DR capabilities such that the tradeoffs between investing in NG-DR and expanding pipeline infrastructure can be assessed

Author Contributions

Methodology, Software, Formal Analysis, Visualization, Writing—Original Draft: A.S.; Conceptualization, Methodology, Formal Analysis, Visualization, Writing—Original Draft, Supervision: P.D.-V.; Conceptualization, Methodology, Investigation, Writing—Original Draft, Supervision: E.W.; Formal Analysis, Visualization, Writing—Original Draft: E.C.; Methodology, Investigation, Supervision: C.C. All authors have read and agreed to the published version of the manuscript.

Funding

This research was funded by the U.S. Department of Energy (DOE) under Contract No. DE-AC36-08GO28308, and the APC was funded by the National Renewable Energy Laboratory.

Acknowledgments

This work was authored in part by the National Renewable Energy Laboratory, operated by Alliance for Sustainable Energy, LLC, for the U.S. Department of Energy (DOE) under Contract No. DE-AC36-08GO28308. Funding provided by the U.S. Department of Energy Office of Energy Efficiency and Renewable Energy Building Technologies Office and Office of Strategic Programs. The views expressed herein do not necessarily represent the views of the DOE or the U.S. Government. The U.S. Government retains and the publisher, by accepting the article for publication, acknowledges that the U.S. Government retains a nonexclusive, paid-up, irrevocable, worldwide license to publish or reproduce the published form of this work, or allow others to do so, for U.S. Government purposes.

Conflicts of Interest

The authors declare no conflict of interest.

References

  1. Jufri, F.H.; Widiputra, V.; Jung, J. State-of-the-art review on power grid resilience to extreme weather events: Definitions, frameworks, quantitative assessment methodologies, and enhancement strategies. Appl. Energy 2019, 239, 1049–1065. [Google Scholar] [CrossRef]
  2. Panteli, M.; Mancarella, P. Influence of extreme weather and climate change on the resilience of power systems: Impacts and possible mitigation strategies. Electr. Power Syst. Res. 2015, 127, 259–270. [Google Scholar]
  3. Abi-Samra, N.C.; Malcolm, W.P. Extreme weather effects on power systems. In Proceedings of the IEEE Power and Energy Society General Meeting, Detroit, MI, USA, 24–28 July 2011. [Google Scholar]
  4. Grandoni, D. The Energy 202: Polar vortex tests gas and electric systems in Midwest, Mid-Atlantic. The Washington Post, 31 January 2019. [Google Scholar]
  5. Schwartz, M.S. Deep Freeze Puts Strain On Midwest Gas And Electricity Grids. Energy 2019. Available online: https://www.npr.org/2019/01/31/690230462/deep-freeze-puts-strain-on-midwest-gas-and-electricity-grids (accessed on 12 September 2019).
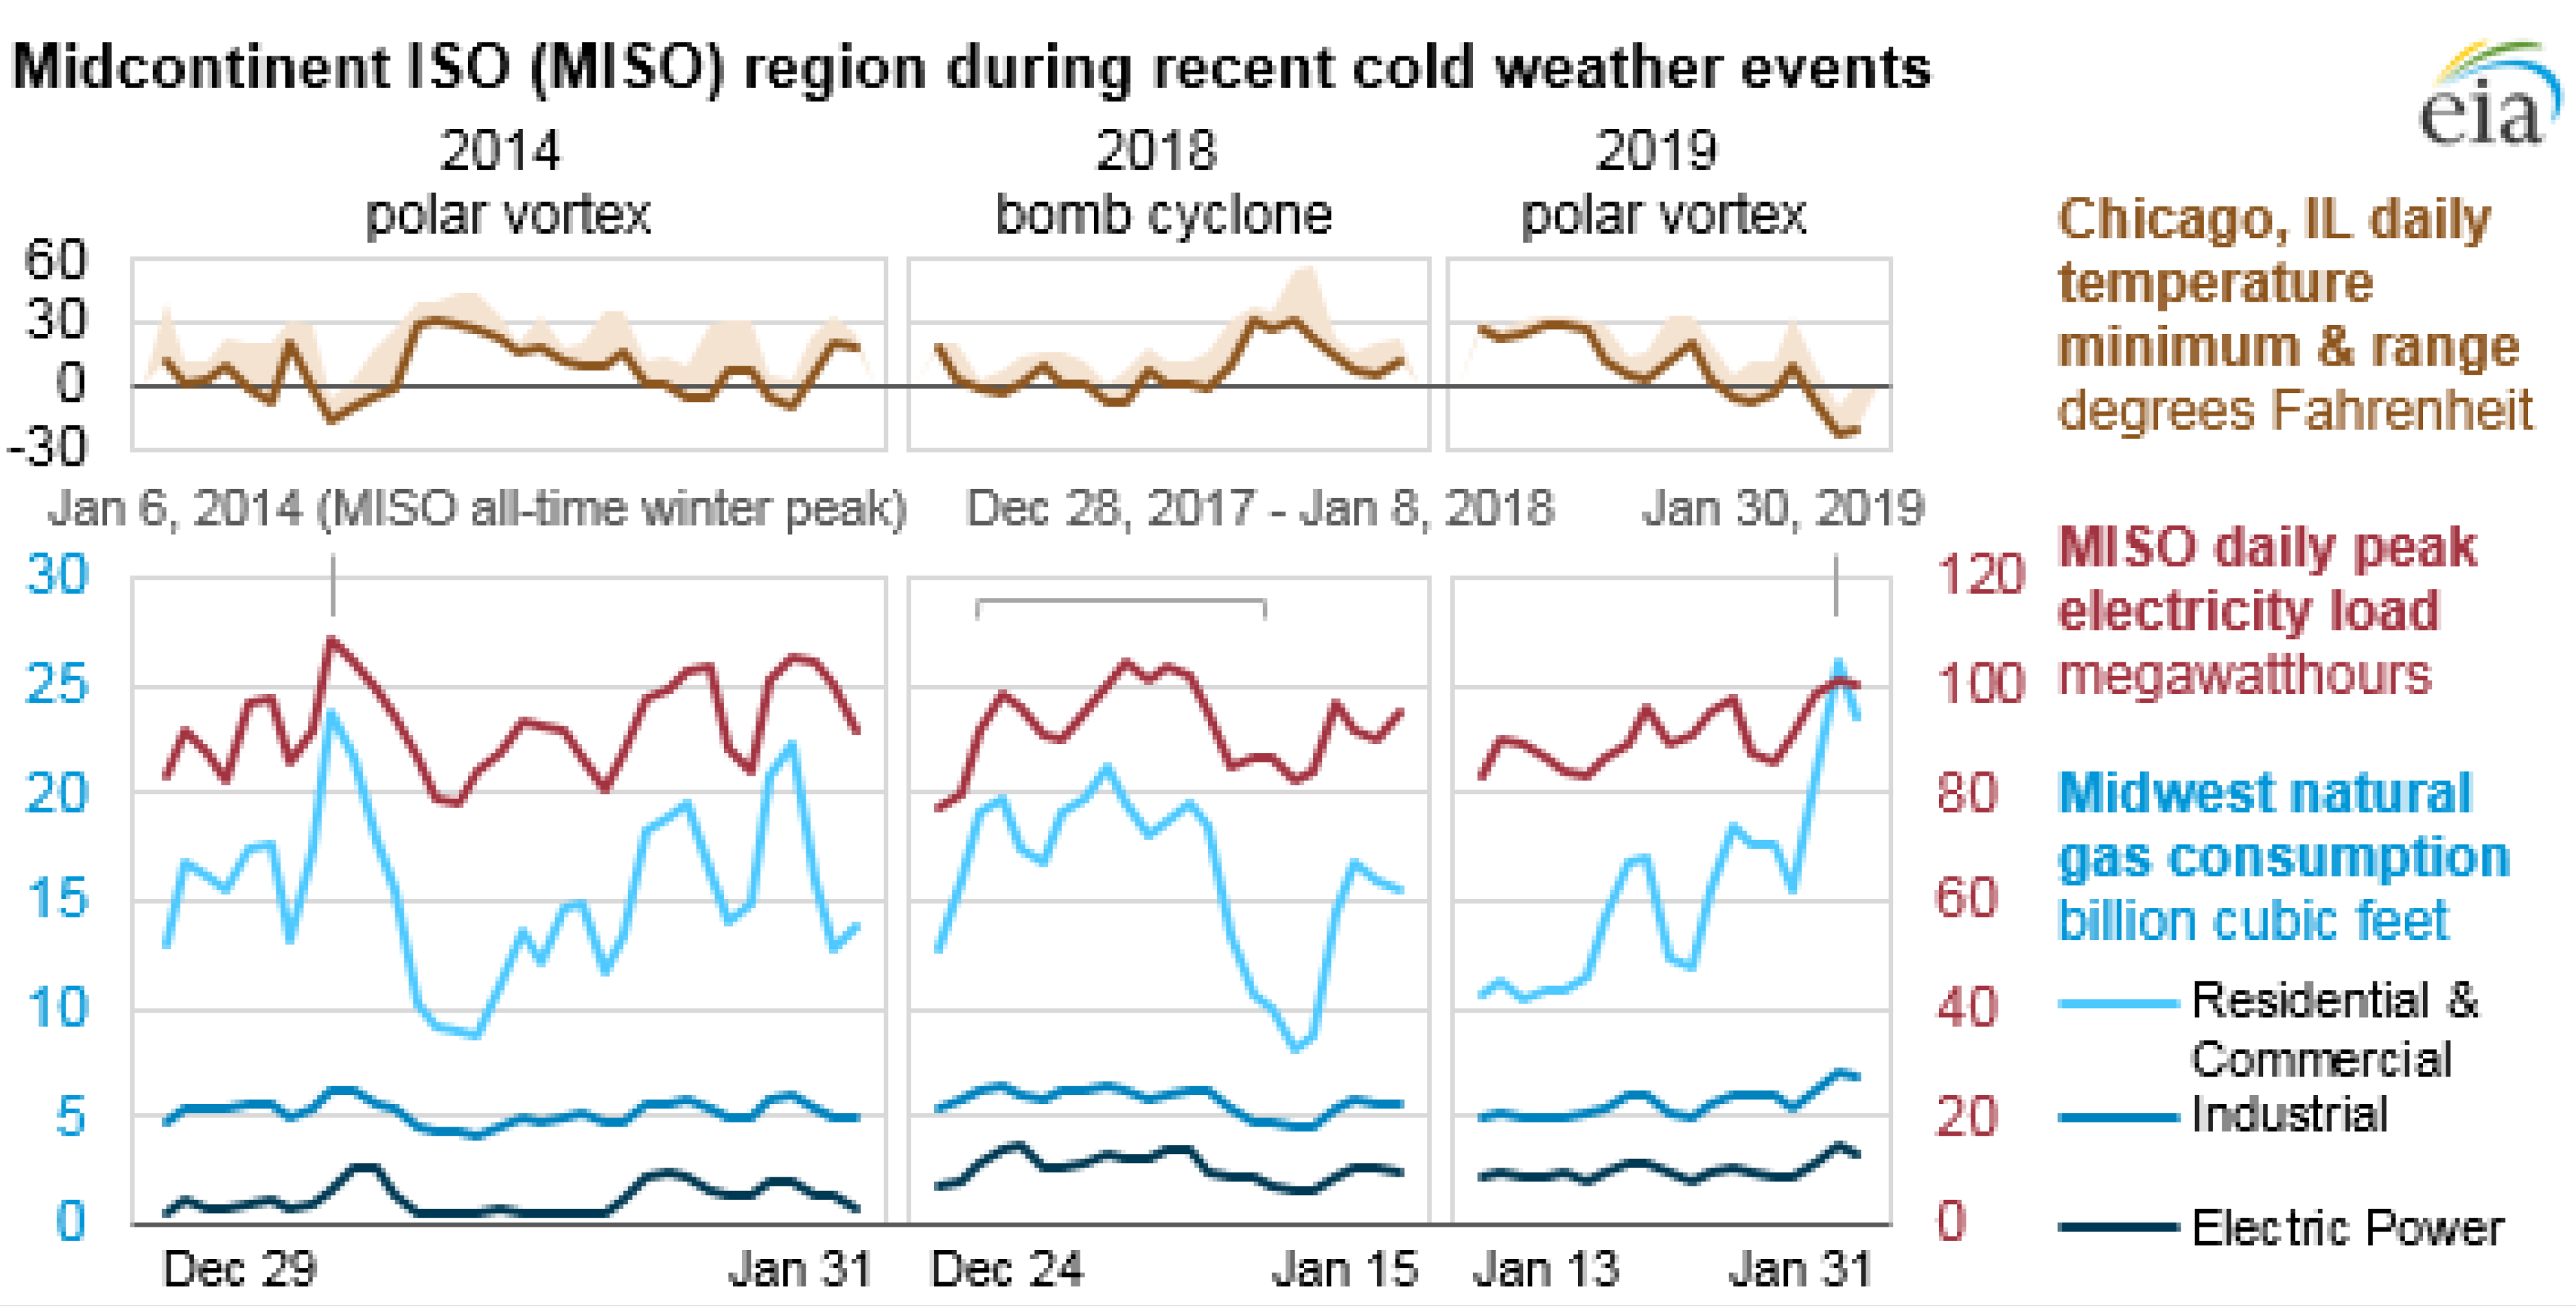
  6. EIA. Extreme Cold in the Midwest Led to High Power Demand and Record Natural Gas Demand. Today Energy 2019. Available online: https://www.eia.gov/todayinenergy/detail.php?id=38472 (accessed on 12 September 2019).
  7. U.S. DOE. Natural Gas Infrastructure Implications of Increased Demand from the Electric Power Sector; United States Department of Energy (DOE): Washington, DC, USA, 2015.
  8. EIA. Annual Energy Outlook 2019; U.S. Energy Information Administration: Washington, DC, USA, 2019.
  9. EIA. Northeastern Winter Energy Alert. Energy Market Alerts. 2018. Available online: https://www.eia.gov/special/alert/east_coast/ (accessed on 12 September 2019).
  10. EIA. 2018 Annual Electric Power Industry Report, Form EIA-861; U.S. Energy Information Administration (EIA): Washington, DC, USA, 2019.
  11. ISO New England. 2018 Regional Electricity Outlook; ISO New England: Holyoke, MA, USA, 2018. [Google Scholar]
  12. ABA. Aliso Canyon Storage Leak. 2017. Available online: https://www.americanbar.org/groups/infrastructure-regulated-industries/publications/infrastructure/2015-16/summer/aliso_canyon_storage_leak/ (accessed on 12 September 2019).
  13. Upchurch, J.; Peterson, C. Southern California’s Natural Gas Infrastructure May Face Constraints This Summer. Today Energy 2018. Available online: https://www.eia.gov/todayinenergy/detail.php?id=36416 (accessed on 12 September 2019).
  14. St. John, A. National Grid Isn’t Providing New Gas Hookups in New York. Wall Street Journal, 25 July 2019. [Google Scholar]
  15. HG&E. Natural Gas Service Notice; Holyoke Gas & Electric: Holyoke, MA, USA, 2019. [Google Scholar]
  16. Wang, F.; Xu, H.; Xu, T.; Li, K.; Shafie-khah, M.; Catalão, J.P.S. The values of market-based demand response on improving power system reliability under extreme circumstances. Appl. Energy 2017, 193, 220–231. [Google Scholar] [CrossRef]
  17. North American Electric Reliability Corporation (NERC). 2019–2020 Winter Reliability Assessment; NERC: Atlanta, GA, USA, 2019. [Google Scholar]
  18. Federal Energy Regulatory Commission (FERC). 2019 Assessment of Demand Response and Advanced Metering; Staff Report; FERC: Washington, DC, USA, 2019. [Google Scholar]
  19. ConEdison. Gas Demand Response Pilot Implementation Plan, 2018–2021; Consolidated Edison Company of New York Inc.: New York, NY, USA, 2018. [Google Scholar]
  20. SoCalGas. SoCalGas Smart Therm Program. 2019. Available online: https://www3.socalgas.com/save-money-and-energy/rebates-and-incentives/smart-therm (accessed on 31 January 2019).
  21. MA EEA. Baker-Polito Administration Announces Over $4.6 Million in Grants for Peak Demand Reduction Projects; Massachusetts Executive Office of Energy and Environmental Affairs: Boston, MA, USA, 2017. [Google Scholar]
  22. Rhodes, J.B. PSC Approves Con Edison’s Demand Response Pilot Program; N.Y.P.S. Commission: Albany, NY, USA, 2018. [Google Scholar]
  23. National Grid. Natural Gas Demand Response Pilot Program. 2017. Available online: https://www.nationalgridus.com/GDR (accessed on 1 March 2019).
  24. Moon, J.W.; Han, S.-H. Thermostat strategies impact on energy consumption in residential buildings. Energy Build. 2011, 43, 338–346. [Google Scholar]
  25. Armstrong, M.; Swinton, M.C.; Szadkowski, F.; Gusdorf, J.; Ruest, K. The Effects of Thermostat Set-back and Set-up on Seasonal Energy Consumption, Surface Temperatures and Recovery Times at the CCHT Twin House Facility. ASHRAE Trans. 2007, 113, 1–12. [Google Scholar]
  26. Ingersoll, J.; Huang, J. Heating energy use management in residential buildings by temperature control. Energy Build. 1985, 8, 27–35. [Google Scholar] [CrossRef] [Green Version]
  27. Nelson, L.W.; MacArthur, J.W. Energy savings through thermostat setback. ASHRAE J. 1978, 84. [Google Scholar]
  28. Pilati, D. Residential energy savings through modified control of space-conditioning equipment. Energy 1976, 1, 233–239. [Google Scholar] [CrossRef]
  29. Feldman, B. Natural Gas Demand Response—Not Just for Electricity Any More; Navigant Research: Boulder, CO, USA, 2017. [Google Scholar]
  30. The Brattle Group and Brown Rudnick LLP. Gas Demand Response—A Solution to the Electricity/Gas Interface Issue? In A Brainstorming Summit; The Brattle Group: Boston, MA, USA, 2014. [Google Scholar]
  31. Weiss, J.; Levine, S.; Sergici, S.; Thapa, A.; Grausz, L. Demand Response For Natural Gas Distribution; The Brattle Group: Boston, MA, USA, 2018. [Google Scholar]
  32. Faruqui, A.; Weiss, J. Gas Demand Response. 2014. Available online: http://spark.fortnightly.com/fortnightly/gas-demand-response (accessed on 12 September 2019).
  33. Wisely, J.; Hall, C. How Consumers Energy Customers Helped Avert a Michigan Gas Crisis. 2019. Available online: https://www.freep.com/story/news/local/michigan/2019/01/31/consumers-lower-heat-emergency-alert/2732252002/ (accessed on 12 September 2019).
  34. Schellenberg, J.; Savage, A.; Ciccone, A.; Nexant Inc. SoCalGas 2016–2017 Winter Demand Response Load Impact Evaluation; Southern California Gas Company: Los Angeles, CA, USA, 2017. [Google Scholar]
  35. Winston & Strawn LLP. Gas Demand Response Programs Are Alluring but Impractical. 2016. Available online: https://www.winston.com/images/content/1/1/v2/115461/Gas-Demand-Response-Programs-Are-Alluring-but-Impractical.pdf (accessed on 12 September 2019).
  36. Roth, K. Gas Demand Response: The Next Frontier. In Proceedings of the AEE East Energy Conference, Boston, MA, USA, 20–21 March 2019. [Google Scholar]
  37. ISO-NE. Real-Time Maps and Charts. Available online: https://www.iso-ne.com/isoexpress/ (accessed on 12 September 2019).
  38. EIA. Natural Gas Consumption by End Use. 2019. Available online: https://www.eia.gov/dnav/ng/ng_cons_sum_dcu_nus_m.htm (accessed on 13 February 2020).
  39. Wilson, E.J.; Christensen, C.B.; Horowitz, S.G.; Robertson, J.J.; Maguire, J.B. Energy Efficiency Potential in the U.S. Single-Family Housing Stock; National Renewable Energy Lab. (NREL): Golden, CO, USA, 2017; 157p. [Google Scholar]
  40. DOE. EnergyPlus; U.S. Department of Energy (DOE): Washington, DC, USA, 2019. Available online: https://energyplus.net/ (accessed on 24 September 2020).
  41. DOE. U.S. EnergyPlus Version 9.2.0 Documentation. In Engineering Reference; DOE: Washington, DC, USA, 2019. [Google Scholar]
  42. NREL. OpenStudio 2.8.0; National Renewable Energy Lab (NREL): Golden, CO, USA, 2019. [Google Scholar]
  43. EIA. Residential Energy Consumption Survey (RECS); U.S. Energy Information Administration: Washington, DC, USA, 2015.
  44. S&P Global Market Intelligence. Pipeline Zone Summary—Algonquin Gas Transmission, LLC; SNL Energy Data: New York, NY, USA, 2019. [Google Scholar]
  45. S&P Global Market Intelligence. Natural Gas Summary; SNL Energy Data: New York, NY, USA, 2019. [Google Scholar]
  46. ISO-NE. Pricing Reports-Zonal Information; ISO New England: Holyoke, MA, USA, 2019. [Google Scholar]
  47. EIA. Electric Power Annual 2018; U.S. Energy Information Administration: Washington, DC, USA, 2019.
  48. Huang, J.; Hanford, J.; Fuqiang, Y. Residential Heating and Cooling Loads Component Analysis; Lawrence Berkley National Laboratory: Berkeley, CA, USA, 1999. [Google Scholar]
  49. Van Welie, G. Managing the Fuel-Security Risk During the Power System’s Rapid Transformation. In Proceedings of the 2018 EIA Energy Conference: Electric System Reliability and Operations, Washington, DC, USA, 23—26 September 2018; ISO New England: Holyoke, MA, USA, 2018. [Google Scholar]
  50. EIA. 2017 Annual Electric Power Industry Report, Form EIA-861; U.S. Energy Information Administration (EIA): Washington, DC, USA, 2018.
  51. EIA. Demand-Side Management Programs Save Energy and Reduce Peak Demand. Today Energy 2019. Available online: https://www.eia.gov/todayinenergy/detail.php?id=38872 (accessed on 26 November 2019).
Figure 1. Historical temperature, electricity load, and natural gas consumption data for periods of extreme winter weather in the Midwest United States. Periods of extreme cold correspond with an increase in electricity and natural gas demand, which is primarily driven by residential and commercial heating. Source: U.S. Energy Information Administration [6].
Energies 13 05192 g001
Figure 2. Summary statistics for the New England region for the winter of 2017–2018, highlighting temperatures (top panel), natural gas deliveries to local distribution companies (LDC) and prices on the Algonquin pipeline (second panel from top), daily average electricity prices in ISO-NE (third from top), and daily natural gas and oil generation (bottom). The bomb cyclone and moderate periods highlighted were selected for detailed modeling in this report. Data compiled from ISO-NE [37].
Energies 13 05192 g002
Figure 3. Actual Meteorological Year (AMY) weather locations in the northeast United States.
Energies 13 05192 g003
Figure 4. Example thermostat schedules for the baseline operation (top) and the resulting schedule after thermostat demand response (bottom).
Energies 13 05192 g004
Figure 5. Average daily prices for electricity and natural gas during the winter of 2017–2018 fit with inverse functionals shown as dotted lines. (a) Natural gas prices for Algonquin Citygate and Tennessee zone 6 versus total daily delivery volumes to LDCs on both pipelines, R2 = 0.889. (b) Electricity prices for the ISO-NE trading hub versus total daily delivery volumes to the LDCs, R2 = 0.793. Data Sources: S&P Global Market Intelligence for NG volume and price data [44,45]; ISO-NE Pricing Reports, Zonal Information for electricity prices [46].
Energies 13 05192 g005
Figure 6. Total natural gas reduction from the baselines across 48 h periods of cold and moderate outdoor temperatures. The percentage of homes in which each case applies is shown in parenthesis in the “Applies To” column. The percentages shown at the end of each bar are the reductions in total natural gas demand from the baseline. The cold period refers to 5 January 2018–7 January 2018, coinciding with the bomb cyclone, and the moderate period refers to 22 January 2018–24 January 2018. ACH50 is the air changes per hour at 50 pascals pressure differential, a measure of the level of air sealing in a home.
Energies 13 05192 g006
Figure 7. Total natural gas demand for heating during cold (top) and moderate (bottom) periods in 2018. Demand response (DR) and energy efficiency (EE) measures are applied to 46% of homes in the conservative scenario, and 94% of homes in the aggressive scenario. The sharp peaks and valleys shown in baseline, conservative, and energy efficiency profiles are a result of heating setbacks across homes that occur at the same time each day (i.e., not staggered).
Energies 13 05192 g007
Figure 8. Distributions of total natural gas (NG) reductions from demand response and energy efficient upgrade scenarios from the cold and moderate weather baseline scenarios. Quartiles are represented by the lines inside each plot. The conservative plot displays all modeled homes, while the aggressive plot displays approximately 98% of the modeled homes, omitting extreme high and low data points.
Energies 13 05192 g008
Figure 9. Heatmap of indoor air temperatures for the conservative approach during cold temperature (top) and moderate temperature (bottom) periods in 2018. The y-axis contains each building model for which the conservative setback was applied (46% of homes) and is sorted by average indoor air temperature. The lower two plots show expanded views of indoor air temperatures for two homes over 24 h during the cold period (left) and the mild period (right). One model is well insulated and tightly sealed (“Efficient”) and the other is poorly insulated and poorly sealed (“Inefficient”).
Energies 13 05192 g009
Figure 10. Heatmap of indoor air temperatures for the aggressive approach during cold temperature (top) and moderate temperature (bottom) periods in 2018. The y-axis contains each building model for which the aggressive setback was applied (94% of homes), and is sorted by existing setback and average indoor air temperature. The lower two plots show expanded views of indoor air temperatures for two homes over 24 h during the cold period (left) and the mild period (right). One model is well insulated and tightly sealed (“Efficient”) and the other is poorly insulated and poorly sealed (“Inefficient”).
Energies 13 05192 g010
Table 1. Summary of demand response (DR) and energy efficiency (EE) scenarios.
ScenarioDescriptionApplies To
BaselineNormal Home OperationAll Homes
Conservative (3 °F)Setback homes by 3 °F overnight (9 h)Homes with constant heating setpoints (46%)
Conservative DR (6 °F)Setback homes by 6 °F overnight (9 h)
Conservative DR (12 °F)Setback homes by 12 °F overnight (9 h)
Conservative EE25% ACH50 reduction
Aggressive DRSetback homes to 63 °F (48 h)Homes with existing setpoints > 63 °F (96%)
Aggressive EE50% ACH50 reduction + R-60 attic insulation
Water HeaterRemove water heating demand (48 h)All Homes
Table 2. Demand response (DR) and energy efficiency (EE) reductions in natural gas demand and estimated impacts on natural gas price, maximum potential additional electricity generation by natural gas, and maximum potential oil generation displaced for the cold weather event on 6 January 2018. The heat rate of a natural gas combined cycle plant is used to convert natural gas savings into additional possible electricity generation. Baseline demand is total volume served to LDCs on indicated date from both Algonquin and Tennessee Zone 6 pipelines.
Outdoor ConditionsScenarioDescriptionNG Reduction (MMBtu)NG Reduction (%)Estimated Electricity Price ($/MWh)Maximum Additional NG Gen. (MWh)Maximum Oil Gen. Displaced (%)
Cold (Jan. 6)BaselineN/ADemand: 3,323,147N/A$303N/AN/A
Conservative DR (3 °F)3 °F Setback Overnight87,6953%$22611,2359%
Conservative DR (6 °F)6 °F Setback Overnight176,7505%$17622,74918%
Conservative DR (12 °F)12 °F Setback Overnight340,99511%$11945,40236%
Conservative EE25% ACH50 Reduction338,45210%$12240,77432%
Aggressive DR63 °F Setback for 48 h962,92929%$43122,30997%
Aggressive EE50% ACH50 Reduction + R-60 Attic Insulation1,690,26751%NA *206,190164%
Moderate (Jan. 23)BaselineN/ADemand: 2,192,782N/A$34N/AN/A
Conservative DR (3 °F)3 °F Setback Overnight69,3603%$318799N/A
Conservative DR (6 °F)6 °F Setback Overnight127,7376%$2816,472N/A
Conservative DR (12 °F)12 °F Setback Overnight205,9589%$2526,939
Conservative EE25% ACH50 Reduction74,7923%$3013,200N/A
Aggressive DR63 °F Setback for 48 h738,79434%$1099,746N/A
Aggressive EE50% ACH50 Reduction + R-60 Attic Insulation421,76519%$1871,263N/A
* Natural gas demand reduction in this case is outside the range of LDC volumes used in the regression

