1. Introduction
In terms of cost, simplicity, efficiency, and durability, oil–paper insulation has been the most popular insulation used by the industry for decades and will continue to be so, although this kind of insulation is for specific applications such as mobile transformers, safety-sensitive transformers, and those transformers on which large overloads or high temperatures are expected, in which it may be more advantageous to use other dielectrics, both solid and liquid.
For decades dielectric spectroscopy techniques (RVM, PDC, and FDS) have assisted maintenance technicians to manage the transformers’ dielectric condition. In 2002, the Technical Brochure 254 “Dielectric Response Methods for Diagnostics of Power Transformers” [
1] was published, focusing on the three spectroscopy methods mentioned above: RVM, PDC, and FDS. It concluded that all three methods are sensitive to the same polarization and conduction phenomena in the transformers’ dielectric, and that regardless of whether time or frequency domain measurements are used, mathematical modeling is necessary to understand the properties of an insulation system. The interpretation of the obtained results in these tests has been the object of study, with the FDS technique being the one that has achieved a greater degree of development thanks to the development of its mathematical model.
The aim of this article is to explain the way to obtain a good interpretation of the RVM test results by applying a mathematical model. To model a dielectric, one of the most commonly used models is known as the “Debye Extended Model” [
2,
3,
4,
5]. The method used by each of the authors to determine the parameters of the model varies. Authors like [
4] use genetic algorithms (GA); others like [
4,
5] use Particle Swarm Optimization (PSO), or, like [
6], who use cuckoo search (CS). All of them are very similar in finding the optimal solution. In other cases, assumptions and simplifications are used to mathematically solve the system and define the parameters of the model [
7]. These methods result in a different number of branches and different time constants in each test. By using a variable number of branches, which have different time constants, variations in the circuit and displacements in the dominant branches can be observed. By applying a sweep with a constant number of branches with fixed time constants, changes in the dominant branches can be observed, as well as those branches that do not show sensitivity.
As a general rule, works are ended when models fit the result of the RVM tests but are not correlated with other tests or validated in the field [
6,
8,
9].
Supported by several case studies in real power transformers, it is shown how the different polarization branches of the equivalent Debye circuit vary. The transformers have been tested before and after carrying out an oil treatment. Given that the effects of each treatment type on the dielectric are known, it is possible to correlate the change in the branches of the equivalent circuit with the removed contaminants in the dielectric and it is possible to observe that those branches that do not show sensitivity to the process applied on the dielectric remain unchanged.
The use of a model that has a fixed number of branches (14) and these, in turn, have a fixed time constant (value of the charging time used by the RVM test equipment for each) cycle, allowing a methodical evaluation running every time in the same sweep. In practice, this means that it is possible to split the response obtained into areas and to evaluate the effectiveness of the treatment on all the desired areas (humidity, polar compounds, interfacial polarization), whereas the traditional system of evaluating RVM tests only allows an evaluation of the improvement in the time constant.
2. RVM Test Technique
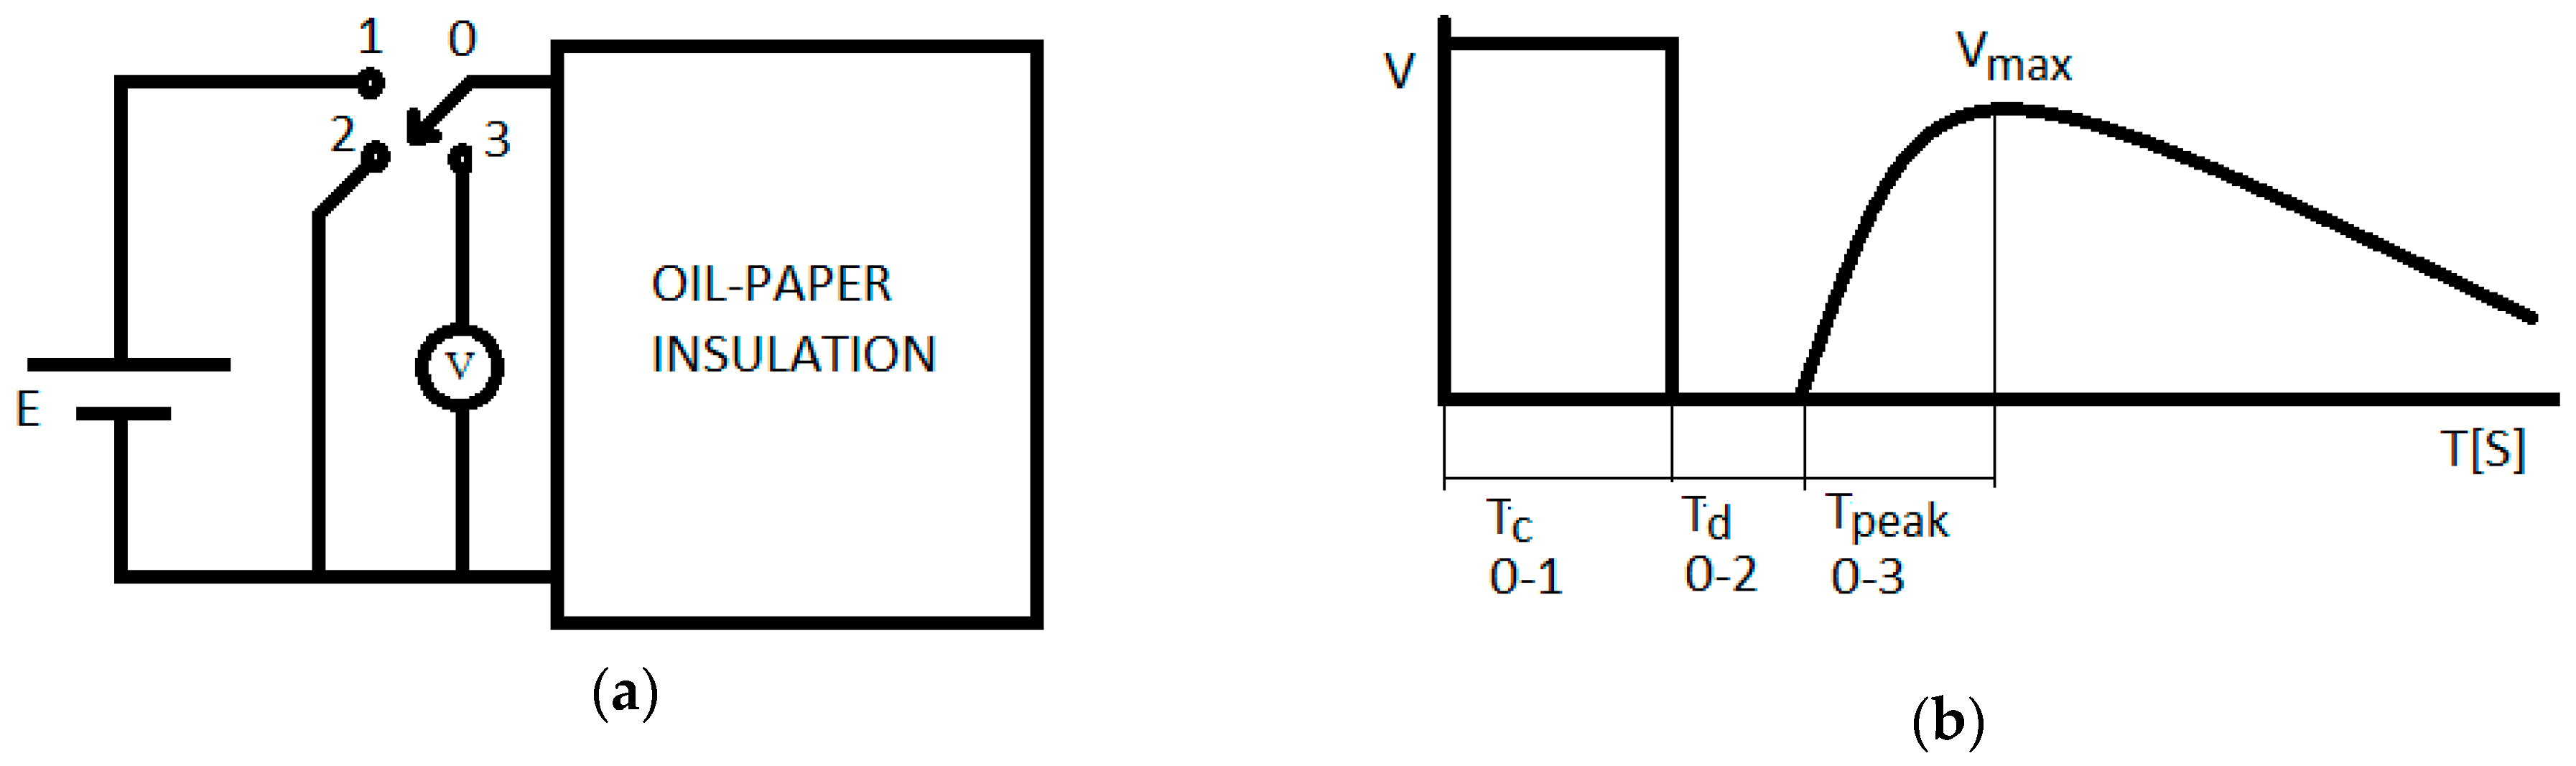
The tests to be used to determine the equivalent circuit have been carried out in the field using the RVM (Recovery Voltage Measurement) technique. The RVM test consists of carrying out several polarization and depolarization cycles in order to obtain an oil paper insulation polarization spectrum.
Each cycle consists of three steps:
A DC voltage is applied to both terminals of the dielectric to be tested during a T
c time (Charging times are listed in
Table 1). Terminals 0–1 connected are shown in in
Figure 1a.
Both terminals of the dielectric are short-circuited during a time Td (usually this time is equal to T
c/2). Terminals 0–2 connected are shown in in
Figure 1a.
The two terminals of the dielectric being tested are opened, measuring the voltage between the two terminals, and the highest voltage reached V
max for the time T
c is recorded. Terminals 0–3 connected are shown in in
Figure 1a.
The measurement results are displayed by representing the maximum voltage obtained in each cycle with respect to the charging time of that cycle (
Figure 2). Depending on the equipment, the number of cycles to be carried out and the charging times may vary. The equipment used for this project uses 14 cycles with charging times between 0.1 and 819.2 s, each one being two times the previous one [
10].
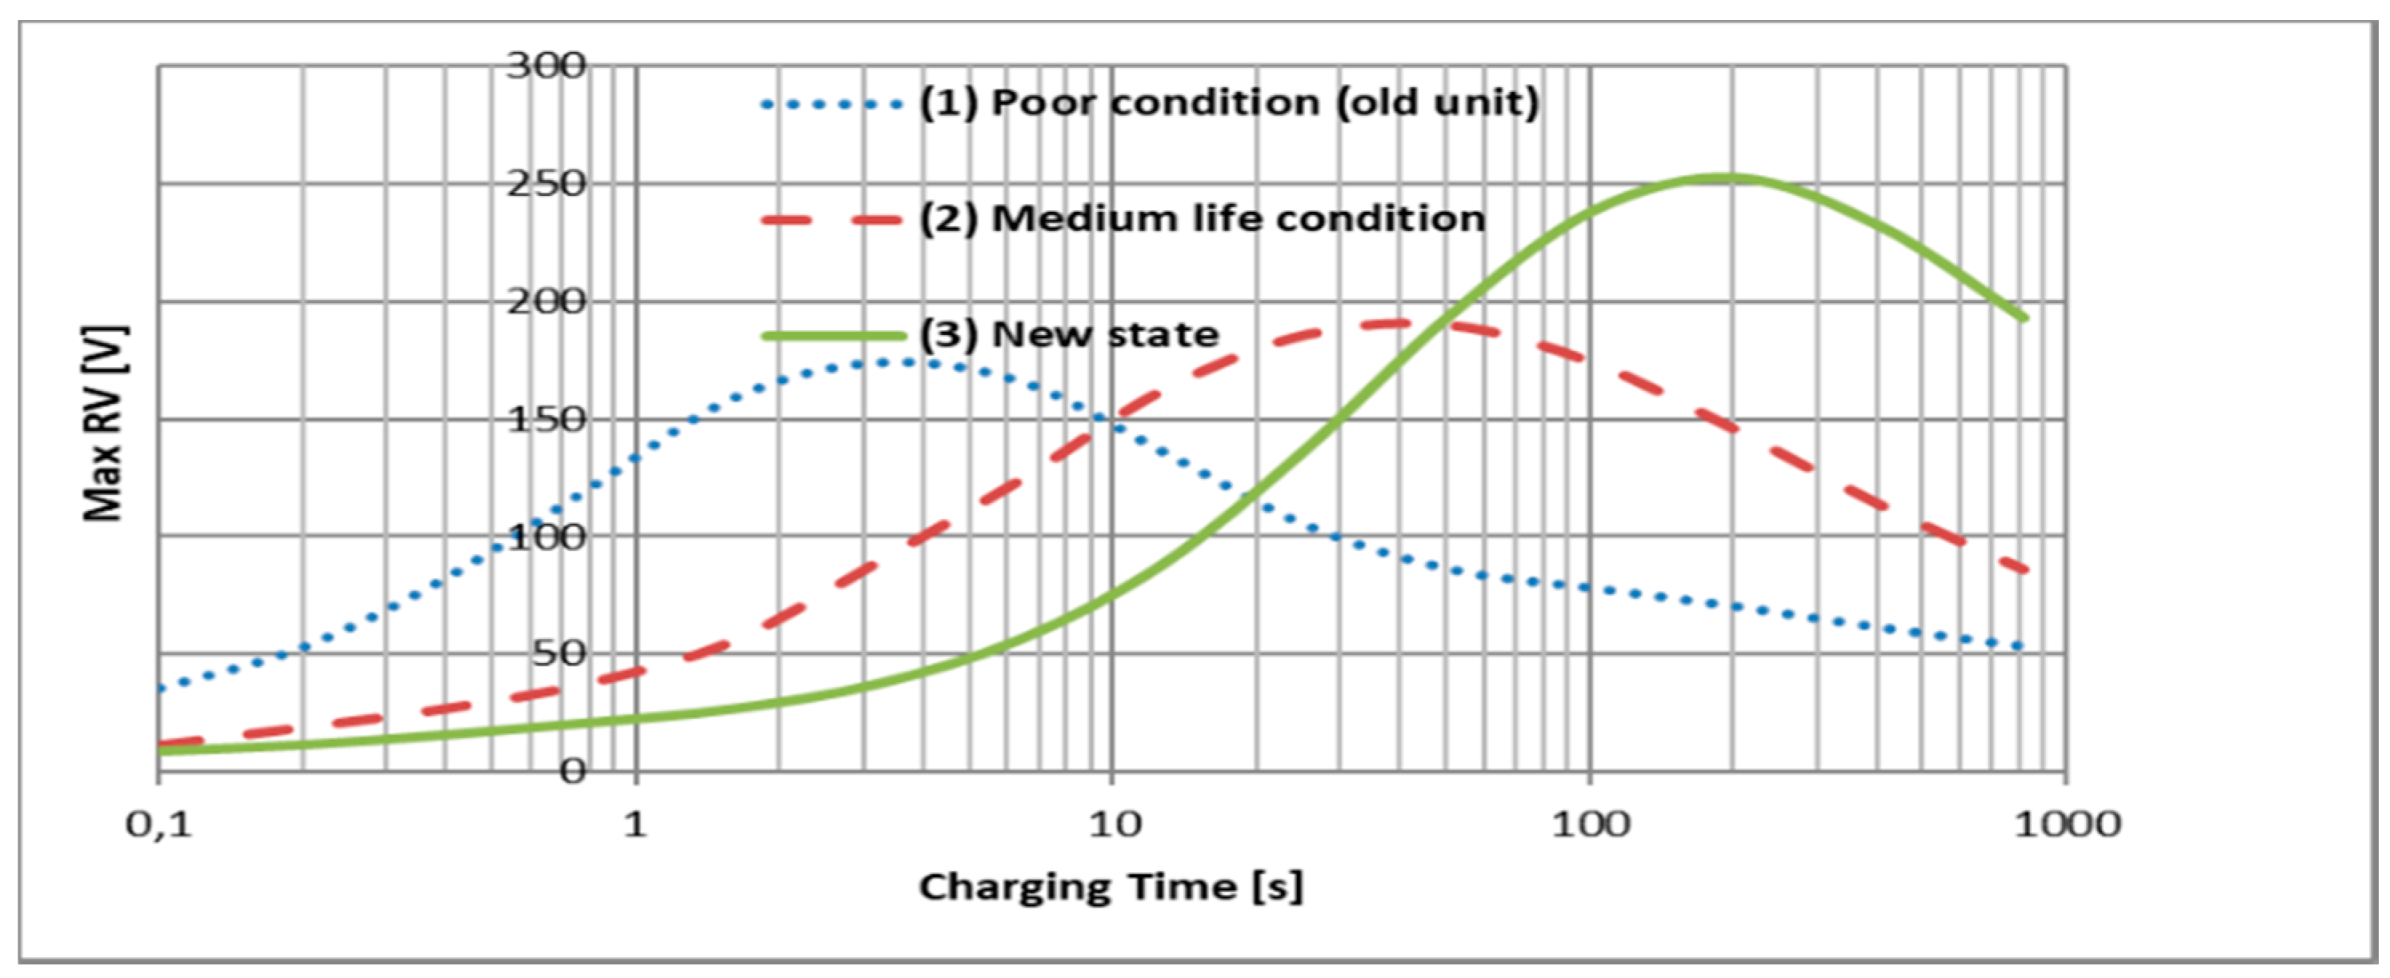
The result obtained in the test is evaluated graphically, based on the morphology of the curve obtained. For both the RVM and FDS techniques, algorithms have been developed that summarize the test result in a numerical value that can be a percentage of moisture and a conductivity or a time constant [
11], although an evaluation that only observes these values is partial and it is recommended to evaluate the whole response.
In the case of RVM, different behaviors can be characterized. The traditional diagnostics have always been based on the value of the time constant [
11], which is the charging time value for which the maximum recovery voltage value is reached and the decrease of the time constant value is interpreted as a degradation in the transformer condition [
12,
13]. In the previous graph, the time constants would be (1) = 3.2 s, (2) = 40 s, and (3) = 204.8 s, although, as indicated in CIGRÉ’s Technical Brochure 254 [
1]: “
Intermediate time constant values may exclusively show interfacial polarization effects, hiding other insulation characteristics”—this fact can be considered an important factor that has penalized its acceptance in academic and industrial sectors.
3. Dielectric Condition Management
In terms of maintenance and transformer life management, monitoring and managing the liquid dielectric condition is a key factor. Transformer dielectric aging causes the formation of paper and oil decomposition products and sub-products; these products and sub-products must be removed due to their presence catalyzing the aging mechanisms themselves (
Table 2).
To manage the life of the transformer, the sequence to be applied must: monitor the aging products of the transformer, remove the decomposition products, and test the transformer to validate the treatments performed.
3.1. Transformer Aging, Products, and Sub-Products
The combination of paper and dielectric oil has historically been used for transformer manufacturing because it is cheap in comparison with other insulation systems that can be justified in special applications and because together they achieve very important synergies, as can be seen in the dielectric breakdown voltage.
There are also negative synergies such as the aging products of both materials are cross-catalyzed as can be appreciated in
Table 2.
The main insulation decomposition products are water (H2O), carbon monoxide (CO) and carbon dioxide (CO2), acids, furanics compounds, and sludge or x-wax. These decomposition products have to be studied and monitored for the following reasons:
They may affect the safe operation of the asset.
They act as catalyzers of aging processes.
They are an indicator of the aging process and allow us to know the condition of the asset.
Table 2 lists the aging processes that occur in a transformer. These processes do not occur separately and, depending on the condition, the rate of aging of each process will vary. Although, as it is possible to observe, the sub-products of a process catalyze themselves and/or others, which makes it possible to close a loop.
3.2. Dielectric Fluids Treatments
As a function of the substance or substances to be removed, there is a series of treatments that can be applied. In this article, we will limit ourselves exclusively to the treatments used on-site, omitting the treatments that can be carried out in the factory with other techniques.
Basically, it is possible to differentiate between two dehydration and/or drying and regeneration processes; the first dedicated to removing moisture from oil or from oil and paper, and the second, according to the IEC definition, are focused on “removing or reducing soluble and insoluble polar contaminants from dielectric oil through chemical and physical processes”.
3.3. Dielectric Fluid Treatment Assessment
Oil physicochemical tests are usually used both to evaluate the oil condition and to evaluate the treatment quality, although it must be taken into account that only the condition of the dielectric fluid is being evaluated. Therefore, there are parameters such as the moisture in the paper or the interfacial polarization that cannot be evaluated, being later when the transformer returns to service when an abrupt increase in the value of dielectric losses of the oil or moisture contained in the oil can be observed.
Dielectric spectroscopy techniques are complementary to physical-chemical tests and are capable of carrying out a full assessment of the condition of the paper and the oil paper interface (
Figure 3) FDS in the frequency domain and PDC and RVM in the time domain. Currently, the most well-established technique is the FDS, which, based on adjusting the response obtained to responses obtained using models, is able to carry out dielectric condition estimations with a high degree of precision [
14]. The purpose of the method proposed in this document is to be able to achieve a level of disaggregation in the areas of influence of the different insulation parameters effects for the RVM test than the one achieved for the FDS test, as shown in
Figure 3.
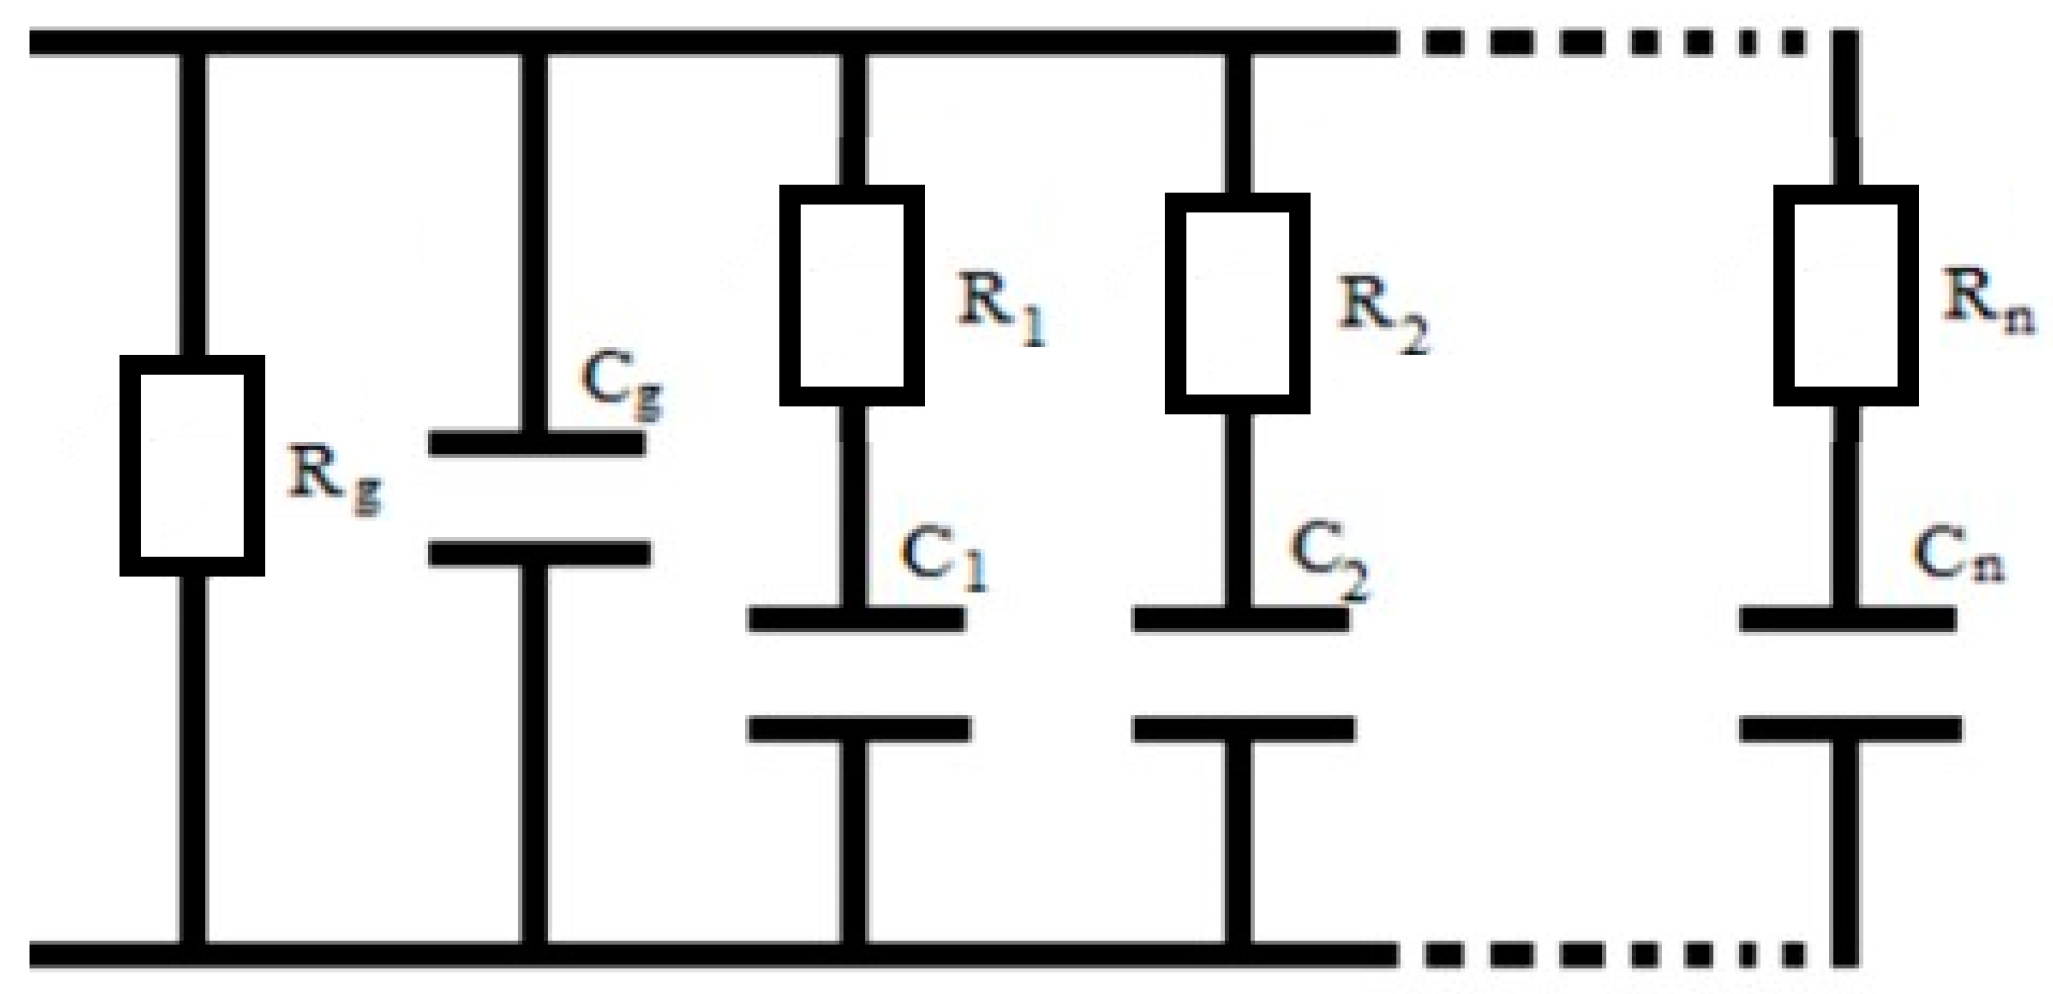
4. Deriving Debye Equivalent Circuit from RVM Test Result
Once the result of the RVM test has been obtained, it is necessary to observe that, as indicated in [
1], “
mathematical modeling is necessary to understand the properties of an insulation system”. That is why an algorithm developed in Octave has been used to calculate the value of the different components of the Debye equivalent circuit (
Figure 4). This circuit is composed of parallel branches, which correspond to a physical meaning: R
g, represents the conduction resistance of the dielectric; C
g represents the geometric capacity of the insulation system; and the successive RC branches represent the different dielectric polarization mechanisms. The result of multiplying R
n × C
n is equivalent to the branch τ called time constant [
2].
The parameters C
g and R
g are obtained from electrical tests such as conventional capacitance measurement techniques at power frequency and insulation resistance measurement at larger values of time [
3,
15].
The used model consists of 14 branches, with time constants τ similar to the charging times used by the RVM test equipment employed (
Table 1). The capacitance of each of the 14 C
n branches represents the energy stored due to the different dielectric polarization mechanisms for each time constant. Rn is obtained by dividing τ of the corresponding branch (it is a prefixed value for each branch) by the value obtained of C
n for the corresponding branch, R
n = τ
n/C
n. Other authors prefer to explain the variations in polarization mechanisms based on the variation of the resistance R of each polarization branch [
12].
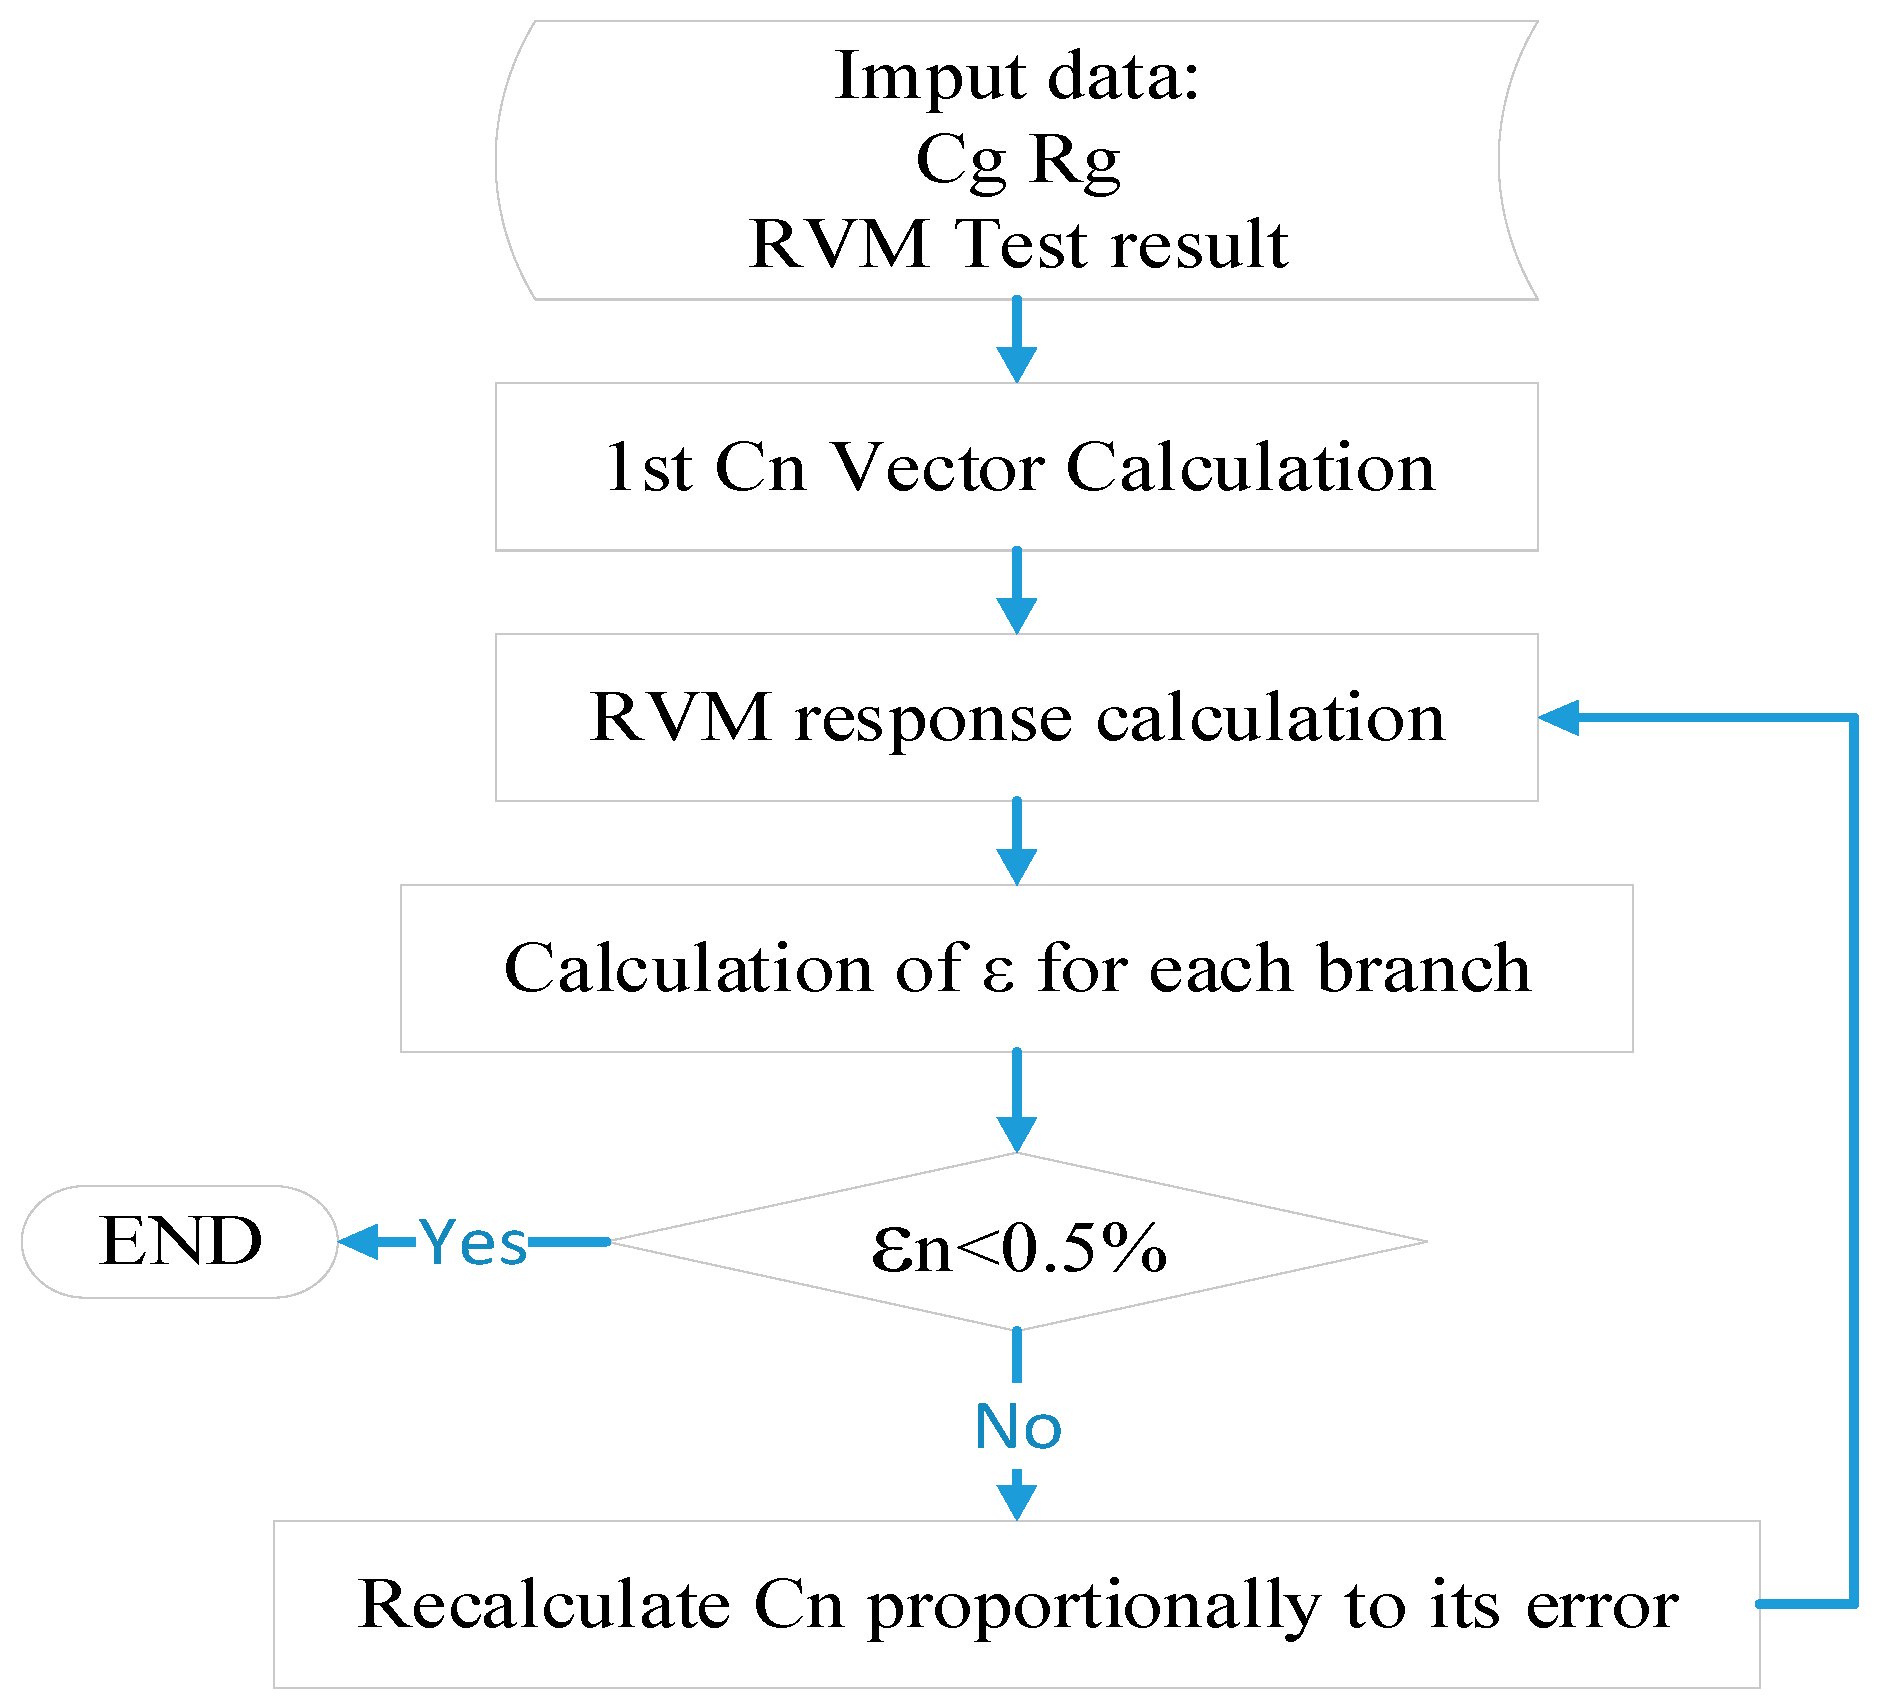
The algorithm developed used as baseline data Vmax value obtained in the RVM test for each of the 14 cycles as long as C
g and R
g are obtained from conventional electrical tests. Using this initial data, it calculates the first vector with 14 C
n. The particularity of this vector is that it is composed of the values of C
n for which a Debye equivalent circuit of a single branch of polarization (time constant τ
n) fits with the Vmax
n value of the corresponding cycle. The following steps form a loop in which the response is simulated. The error is calculated with respect to the measured value, and if any one of the branches error is greater than 0.5%, the vector value of each component of the C
n vector is recalculated proportionally to its error (
Figure 5).
It is proposed to establish that only certain branches are sensitive to the removal of specific compounds present in the oil (moisture, X-wax, polar compounds). Using tests carried out before and after dielectric oil treatment, and based on the knowledge of the removed compounds from the oil, it is possible to correlate the compounds with those polarization branches that are sensitive to their presence.
5. Equivalent Circuit Model Interpretation
The use of a model makes sense if, as described for the FDS test in
Section 3.3, it is possible to identify which circuit components show sensitivity to certain variations. The model sensitivity analysis carried out in this section will support the interpretation of the case studies discussed in
Section 6.
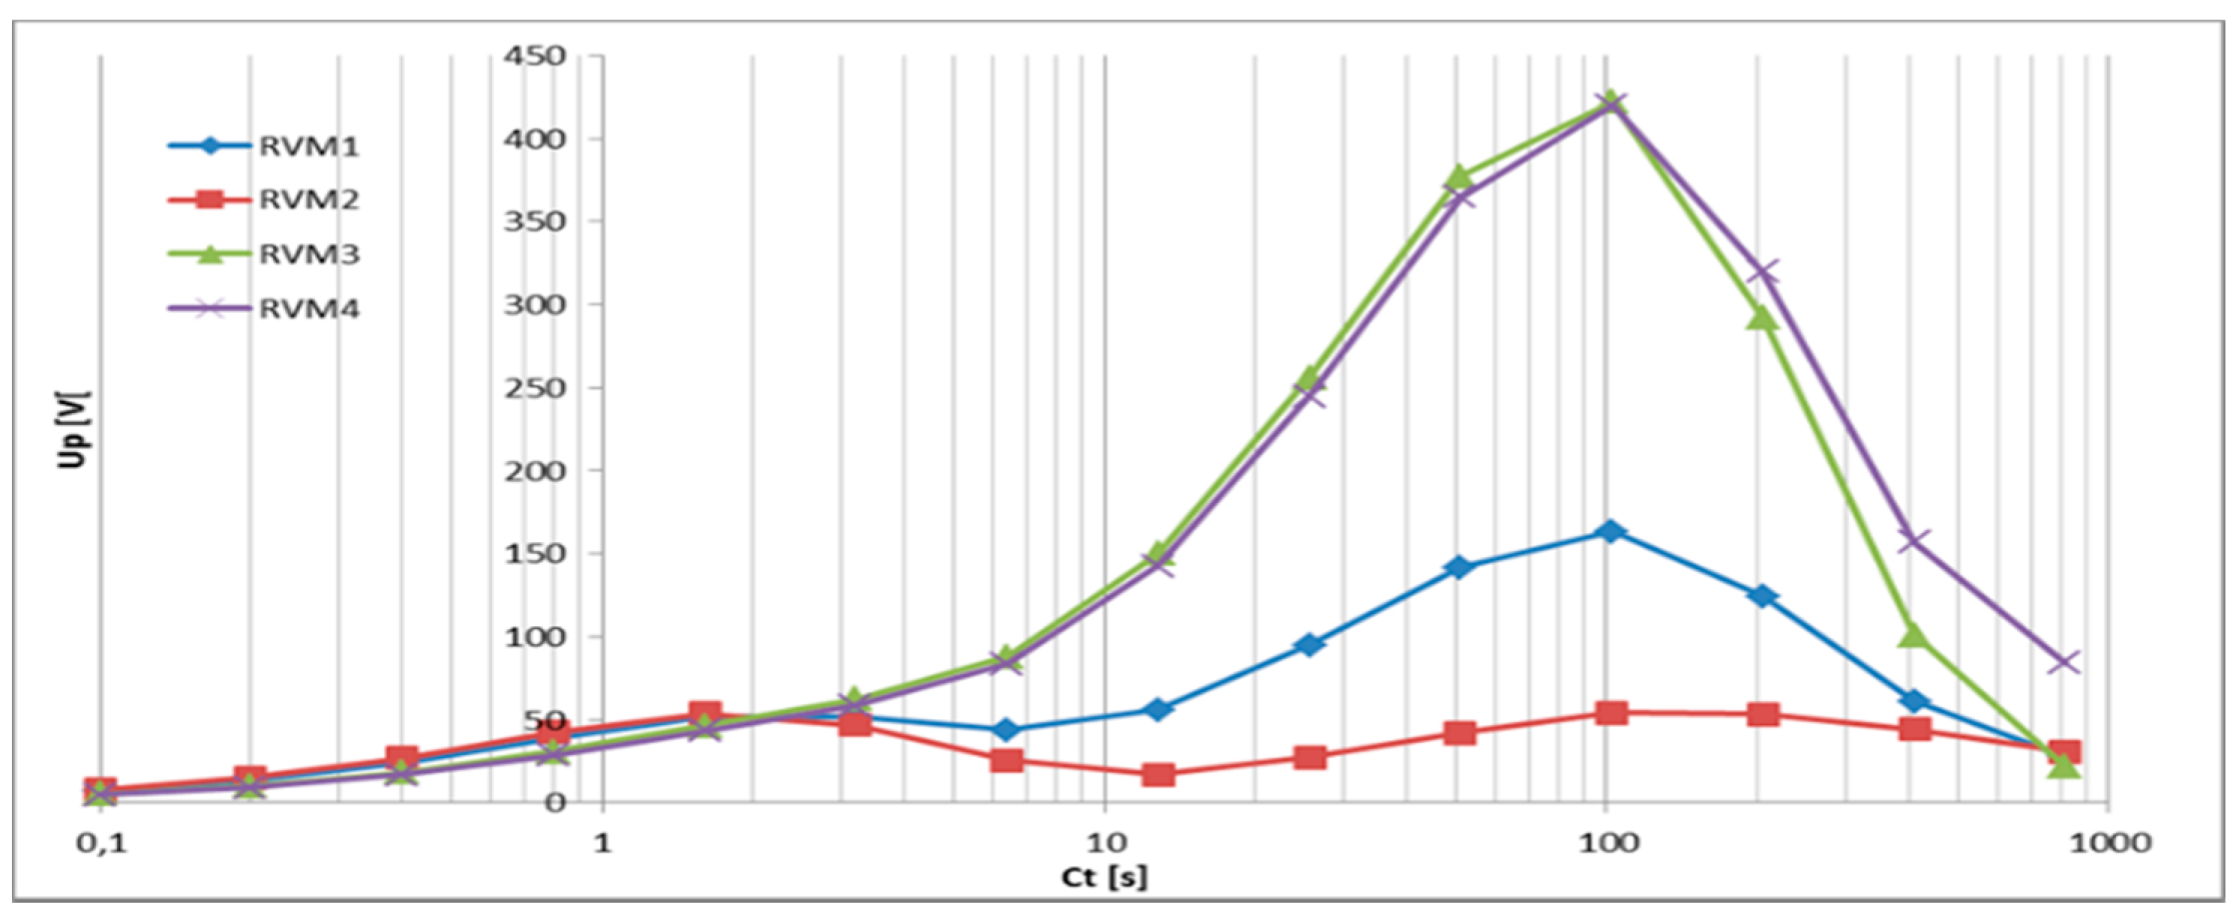
When in a transformer there is only one dominant polarization mechanism, such as in the case of a new transformer—where in theory the time constant is only a function of the quality of the drying process—only a single maximum is observed. In cases in which the mechanisms of polarization are several but their dielectric response is sufficiently spaced in time, two or more maximums are observed in the response without a strong interaction between them. However, there are many cases in which the time constants of the different polarization branches are close to each other, and it is in these cases in which one effect overlaps the other and therefore the interpretation of the RVM test results is more difficult.
The following simulation will simulate an RVM spectrum composed of three polarization branches in which the values of Ci and Ri of the intermediate branch will be varied (these branches modifications are carried out according to
Table 3) in all but in the fourth simulation. In the intermediate regions from 30 to 300 s, the effects of oil–paper interfacial polarization [
16] can be observed. In the fourth simulation (RVM4), an important variation of the value of the third polarization branch will be carried out to show the low sensitivity of the system when the interfacial polarization is predominant.
The authors of Task Force 15.01.09 of CIGRE concluded in their article that an absolute maximum in the mid spectrum range indicates a high influence of “interfacial polarization” between oil and paper or between oil and pressboard in the ducts.
As shown in
Figure 6, both absolute and relative maximums of the RVM2 spectrum are affected by changes in C2 and R2 until no relative maximums can be differentiated. As it has been mentioned, this change in the branches corresponding to intermediate times can be attributed to the “interfacial polarization” of a composed insulation.
For the interpretation of the results, it is important to observe that the effects of the interfacial polarization are much more important on the branches with high times, because even when the value of C2 is not very high, the peak of branch 3, that would have been expected to be located in the area around 400 s, is displaced to 100 s.
It can also be inferred that the interpretation of an RVM curve, in cases where interfacial polarization phenomena exist, should be limited to evaluating this polarization, the time constant not corresponding either to the oil or the paper condition value.
6. Case Studies
Over the last few years, many tests have been carried out on real transformers before and after the different oil treatments, so it has been possible to correlate the different treatments and the compounds they remove from the oil with the change in the value of the capacitance of each of the 14 branches of the equivalent circuit.
It solves the problem of the interpretation of the results expressed in the already mentioned Technical Brochure 254 of CIGRE [
1]: “Intermediate time constant values may exclusively show interfacial polarization effects, hiding other insulation characteristics”. It can be observed in case 3, in particular, that it is much more accurate to interpret a Debye equivalent circuit than to use the RVM test response.
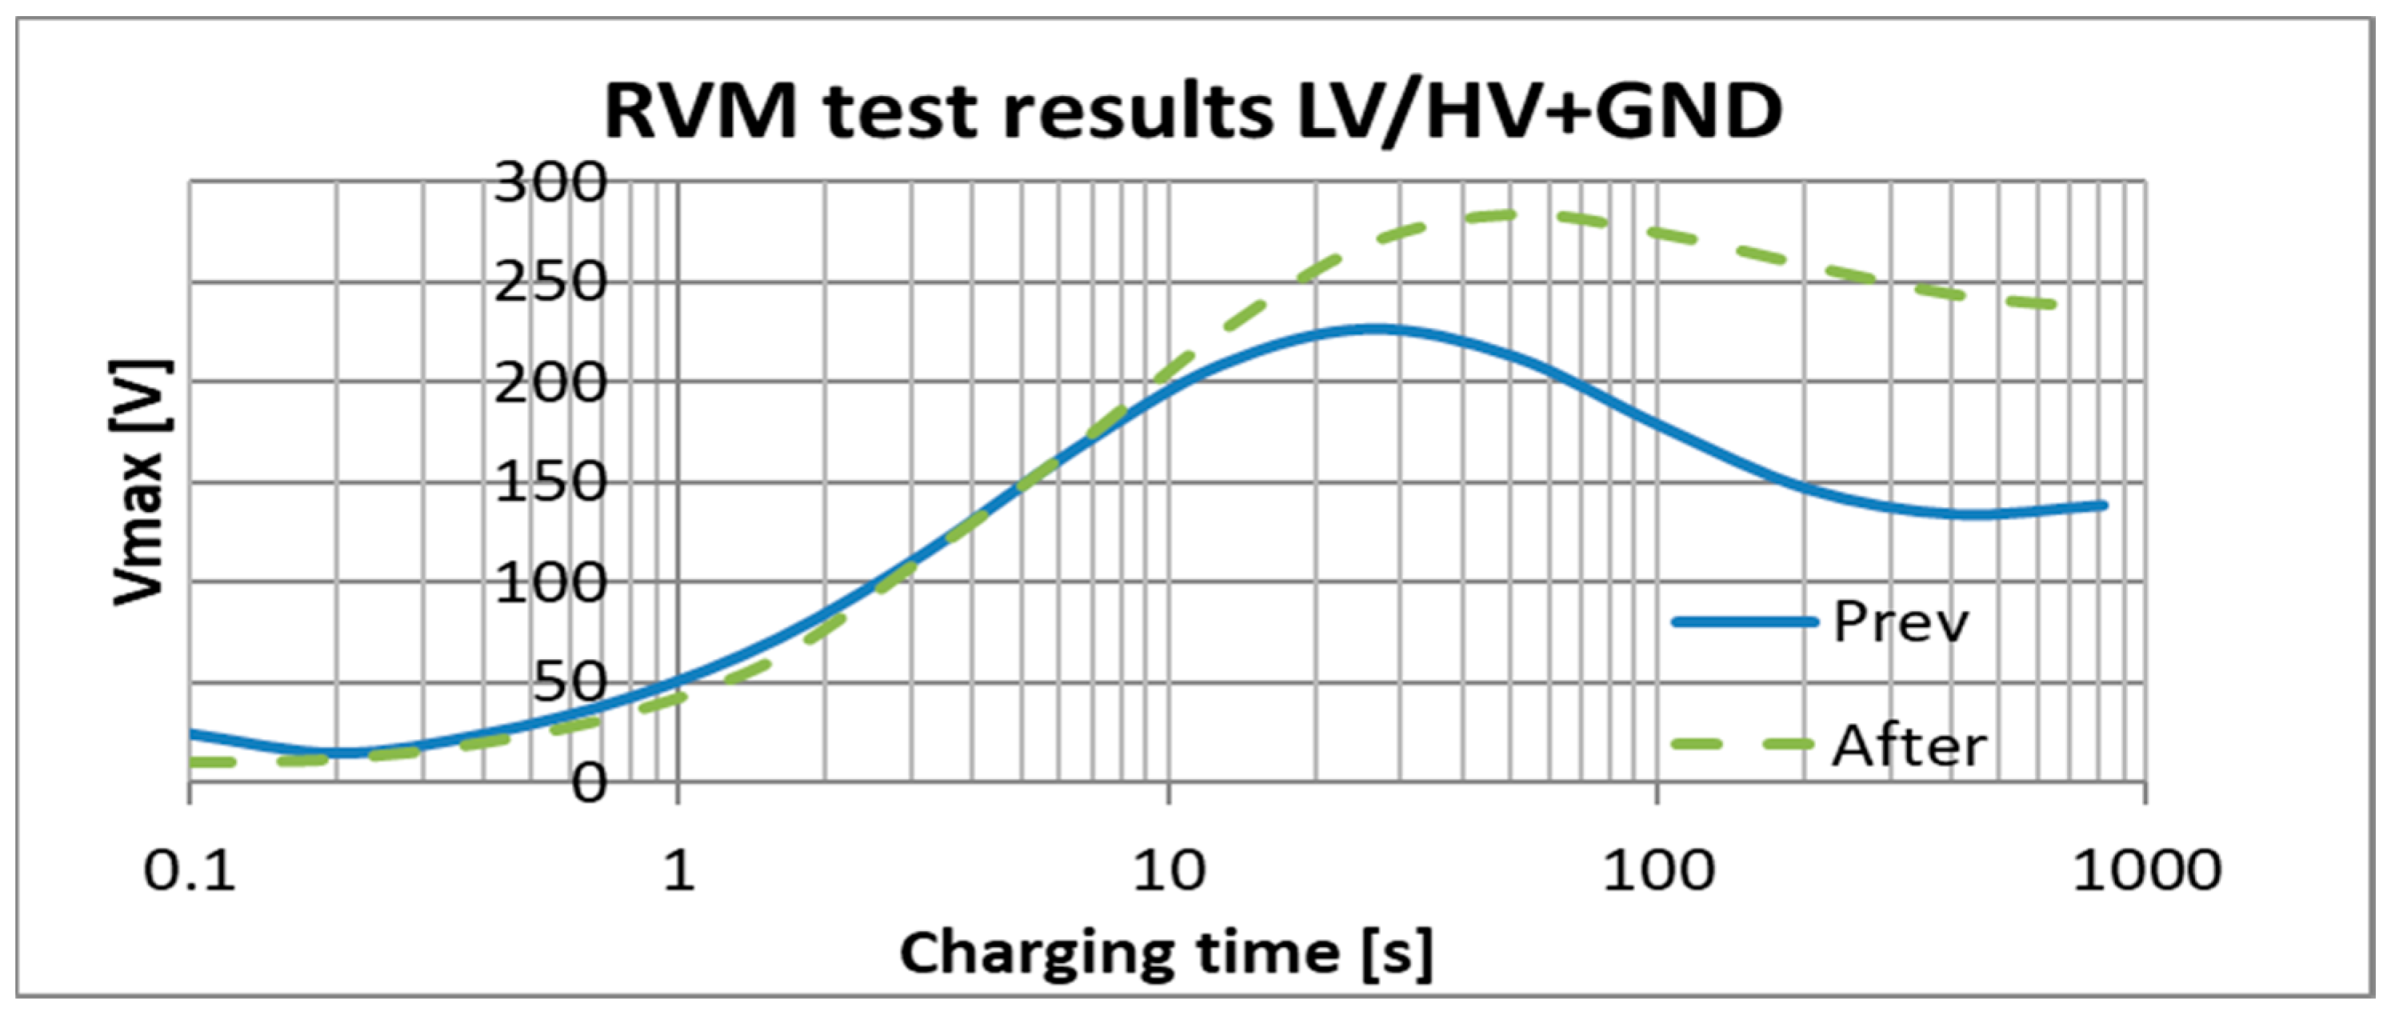
6.1. Case 1: Transformer on Which a Drying Process Has Been Carried Out
The transformer (
Table 4) contains an important amount of water (
Table 5), so it is necessary to apply a procedure of reconditioning and active part drying. It consists of heating the oil by circulating it through the treatment equipment so that the hot oil heats the active part. Once the active part is heated, the oil is drained and a vacuum is applied to the tank. The combination of vacuum and an 80 °C temperature makes it so that the water contained in the paper evaporates; this evaporation causes the cooling of the active part. So, it is a process that requires several cycles.
RVM test results (
Figure 7) can be interpreted as a positive treatment. A slight displacement of the time constant (absolute maximum of the curve) indicates an improvement, and an increase of the maximum voltage indicates a higher insulation resistance [
2,
11].
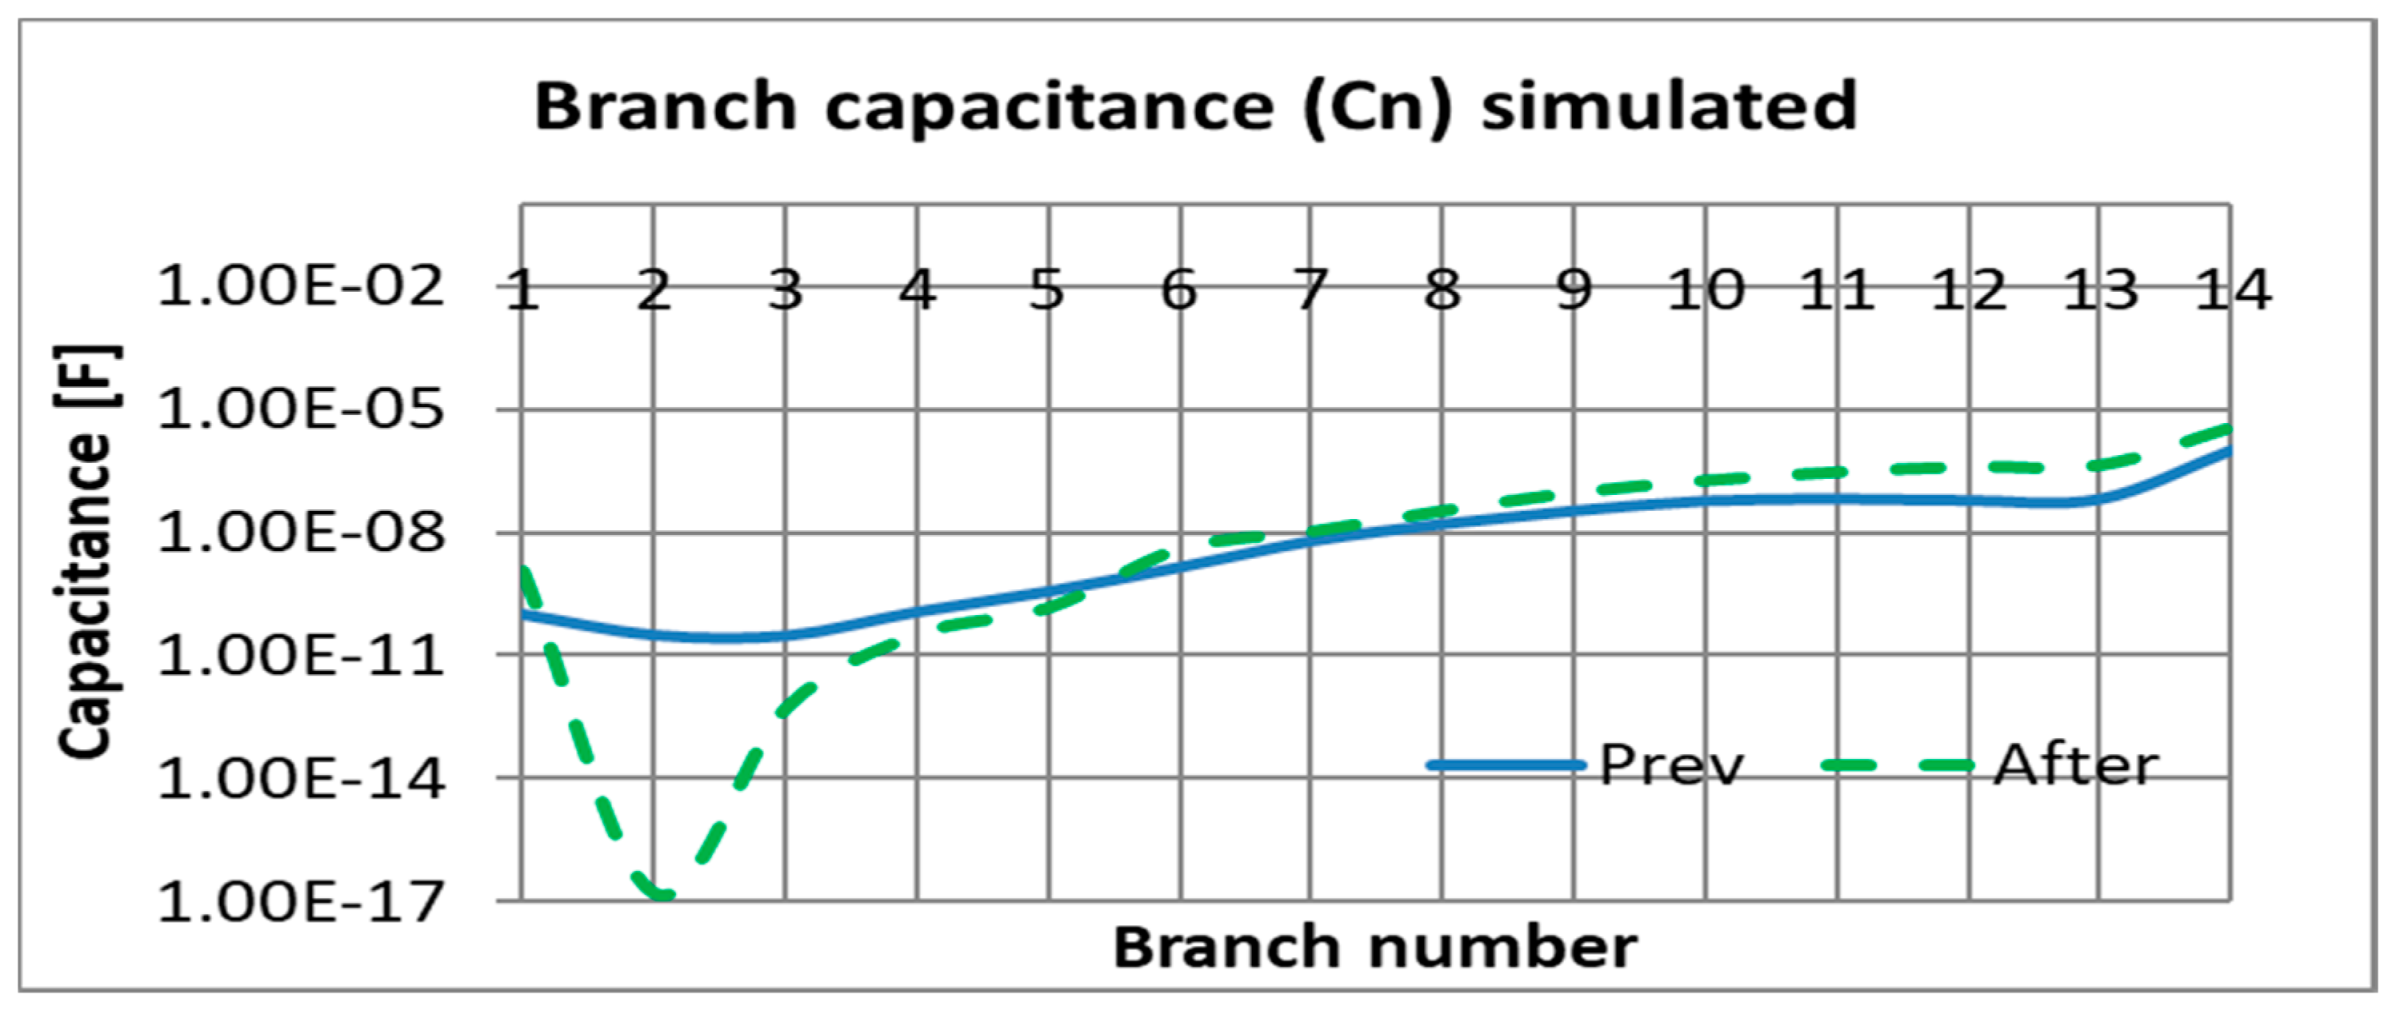
In the case of using the equivalent circuit’s 14 branches condensers capacitance, it can be appreciated (
Figure 8) how, before and after the treatment, the branches beyond n° 5 have not changed. This means that all those mechanisms of polarization with time constant higher than 1.6 s (branch 5 and above) are not modified after drying. It is inferred that the time constant of the water is around 0.2 s (branch 2).
6.2. Case 2: Transformer on Which a Regeneration Process Has Been Carried Out (Without Drying It)
In this case, a small size transformer (
Table 6). The transformer oil showed a dielectric loss factor of 13% and a water content of 7 ppm before the treatment (
Table 7). For this reason, only an oil regeneration process was carried out without drying the oil, which means that polar compounds and particles were removed, but no drying procedure was carried out. The process was carried out while the transformer was in service in order to maximize its effectiveness. The oil is pumped several times through Fuller’s earth, which absorbs the polar compounds. The last step is to add inhibitor compounds to the oil.
In this case, it is possible to evaluate the results of the RVM test (
Figure 9) according to the traditional interpretation and infer that the polar compounds, which cause interfacial polarization, have been eliminated [
1,
2,
11]. The removal of polar compounds is deduced based on the decrease of the dissipation factor, the increase of the interfacial tension value, and in a smaller degree the decrease of the color value (the decrease in color is due to the elimination of polar and non-polar particles). Nevertheless, as it is described in the literature, the response of insulation affected by a strong interfacial polarization mechanism will overlap the rest of the polarization mechanisms, and the diagnosis should be limited to reflect the presence of this component.
Once the extended Debye model is applied, it can be observed (
Figure 10) how the branches between 1 and 5 show only a slight variation in the same way as the branches from 12 to 14, so it can be concluded that the polar products and contaminants extracted during regeneration respond to the time constants of the branches between 6 and 11.
6.3. Case 3: Transformer Affected by Interfacial Polarization on Which a Drying Process Has Been Carried Out
In this case, a medium size transformer (
Table 8). The results obtained in the transformer showed a high water content of 26 ppm, and the dielectric loss factor is not very high (3.3%) (
Table 9) so the most appropriate treatment is the drying of the transformer.
The transformer contains an important amount of water, so it is necessary to apply a procedure of reconditioning and active part drying. It consists of heating the oil by circulating it through the treatment equipment so that the hot oil heats the active part. Once the active part is heated, the oil is drained and a vacuum is applied to the tank. The combination of a vacuum and an 80 °C temperature make it so the water contained in the paper evaporates. This evaporation causes the cooling of the active part so it is a process that requires several cycles.
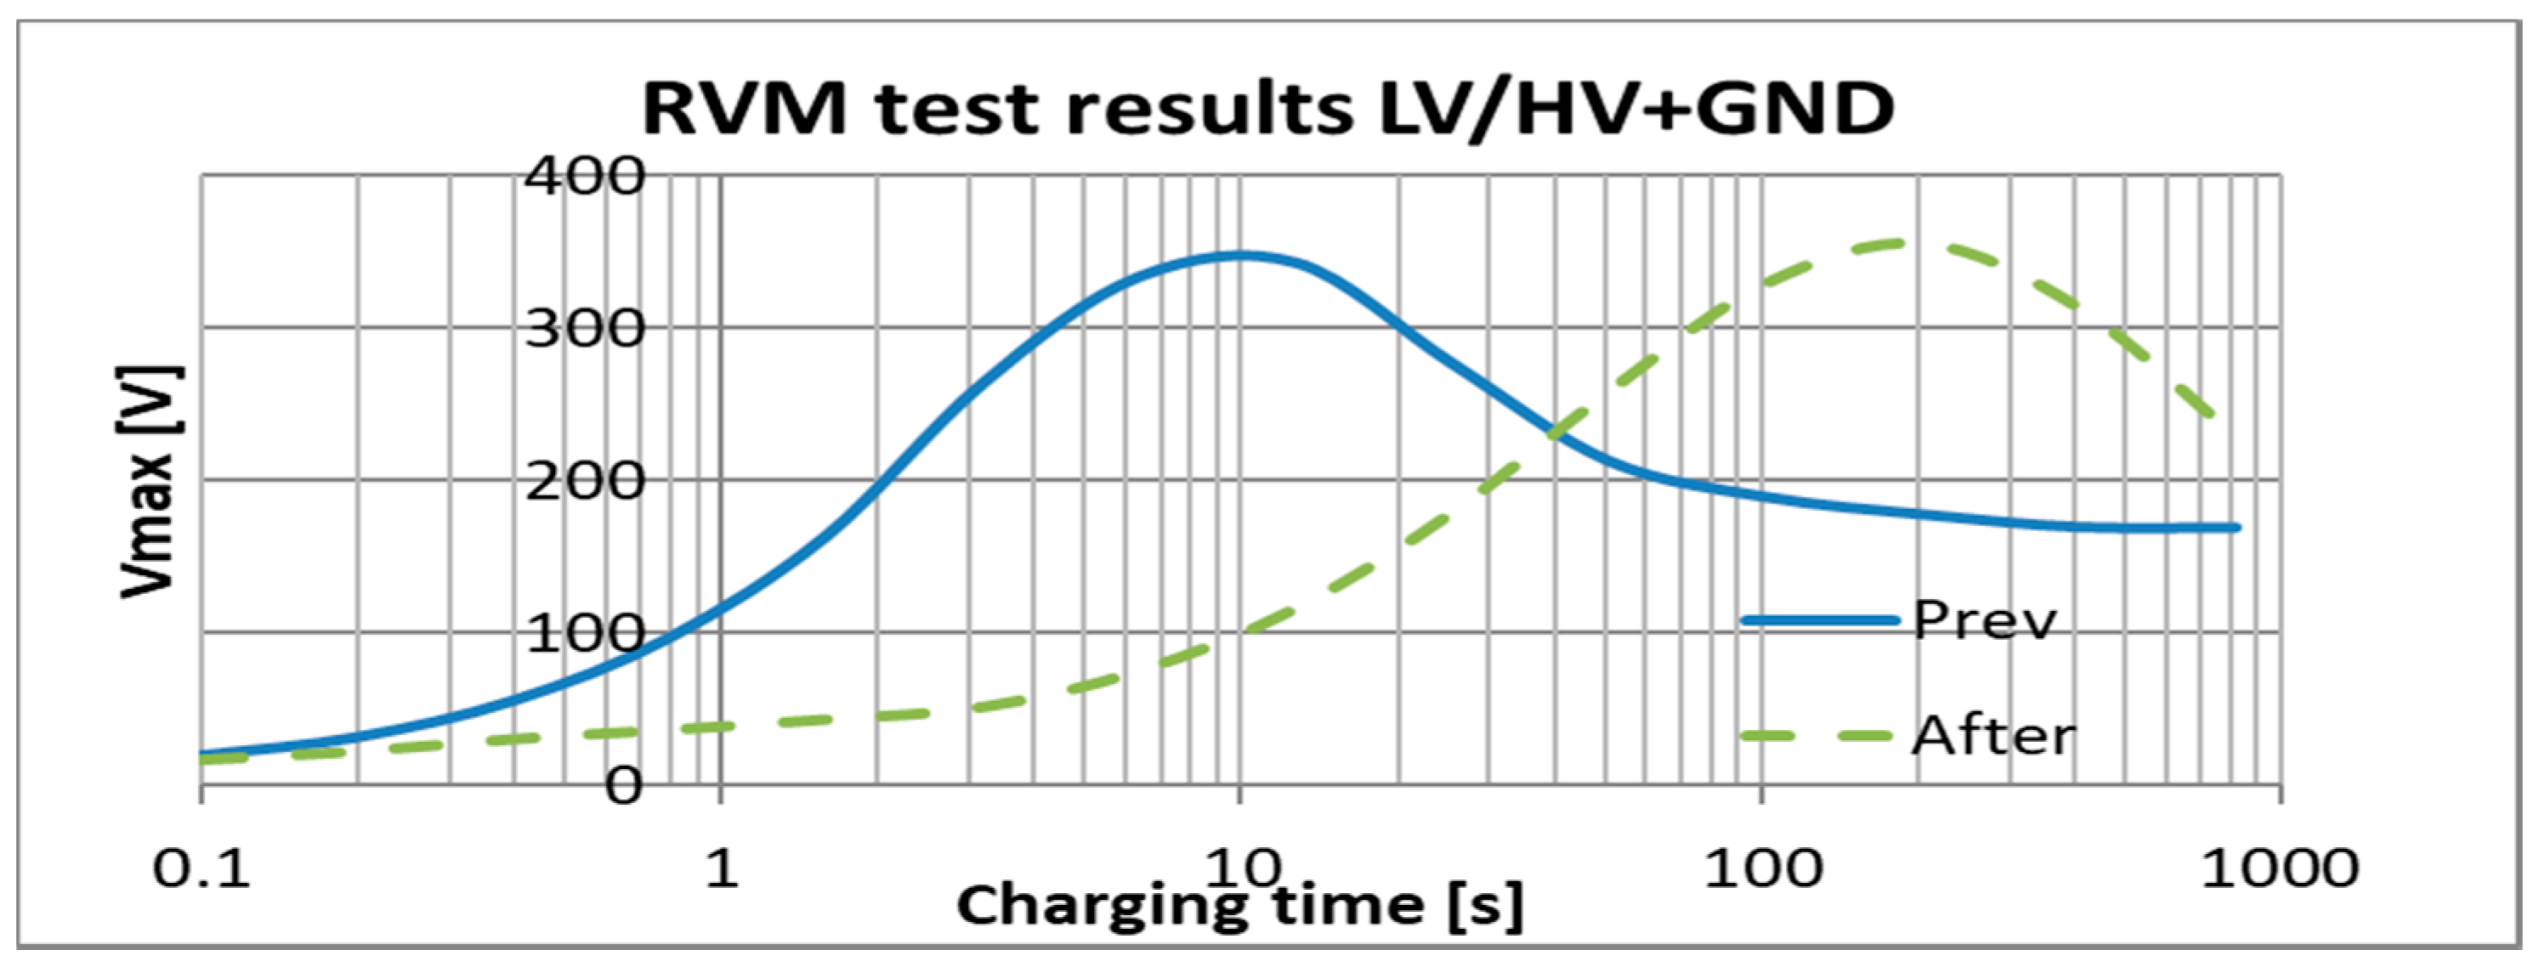
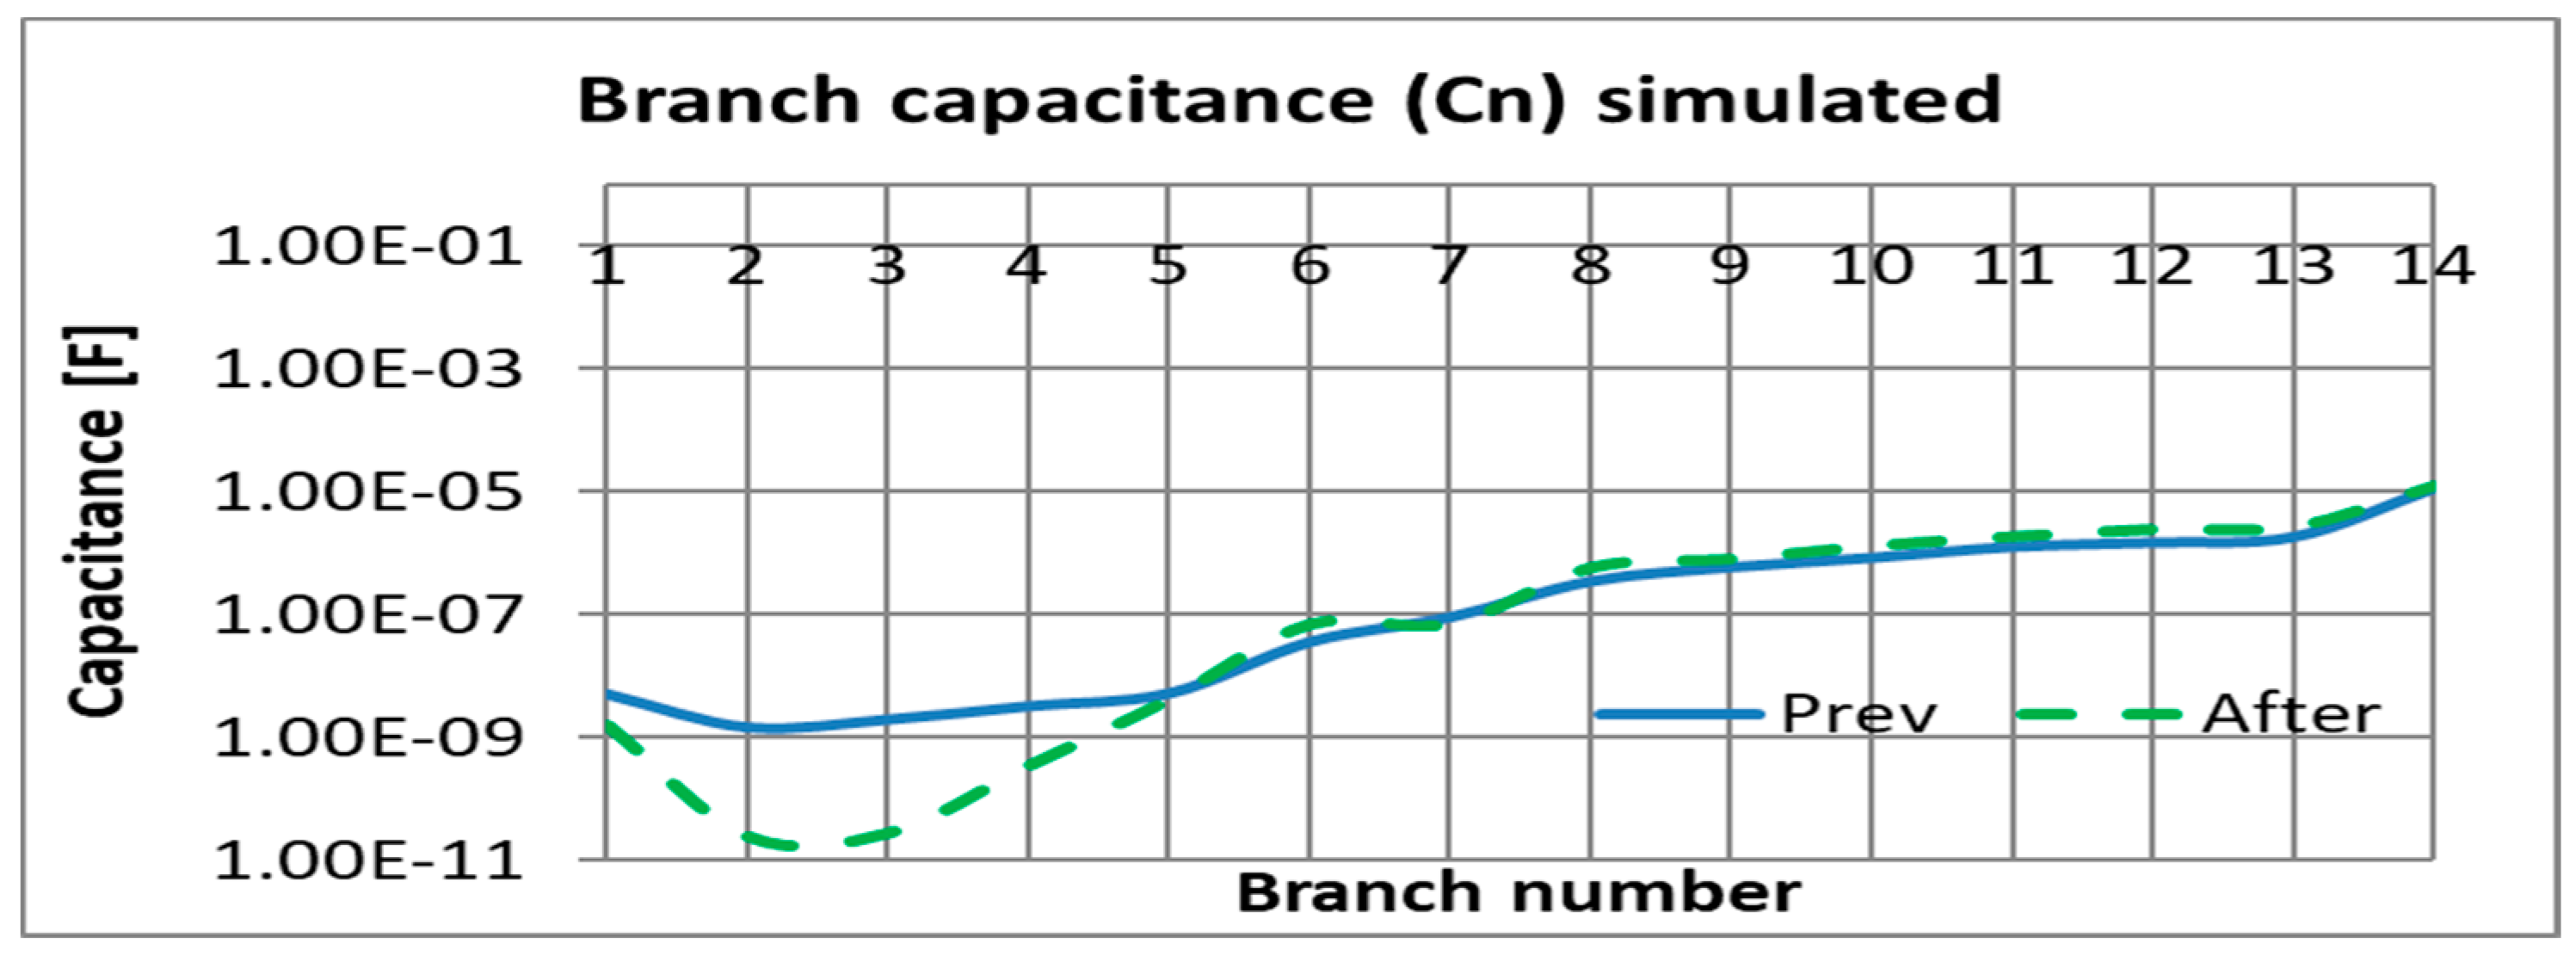
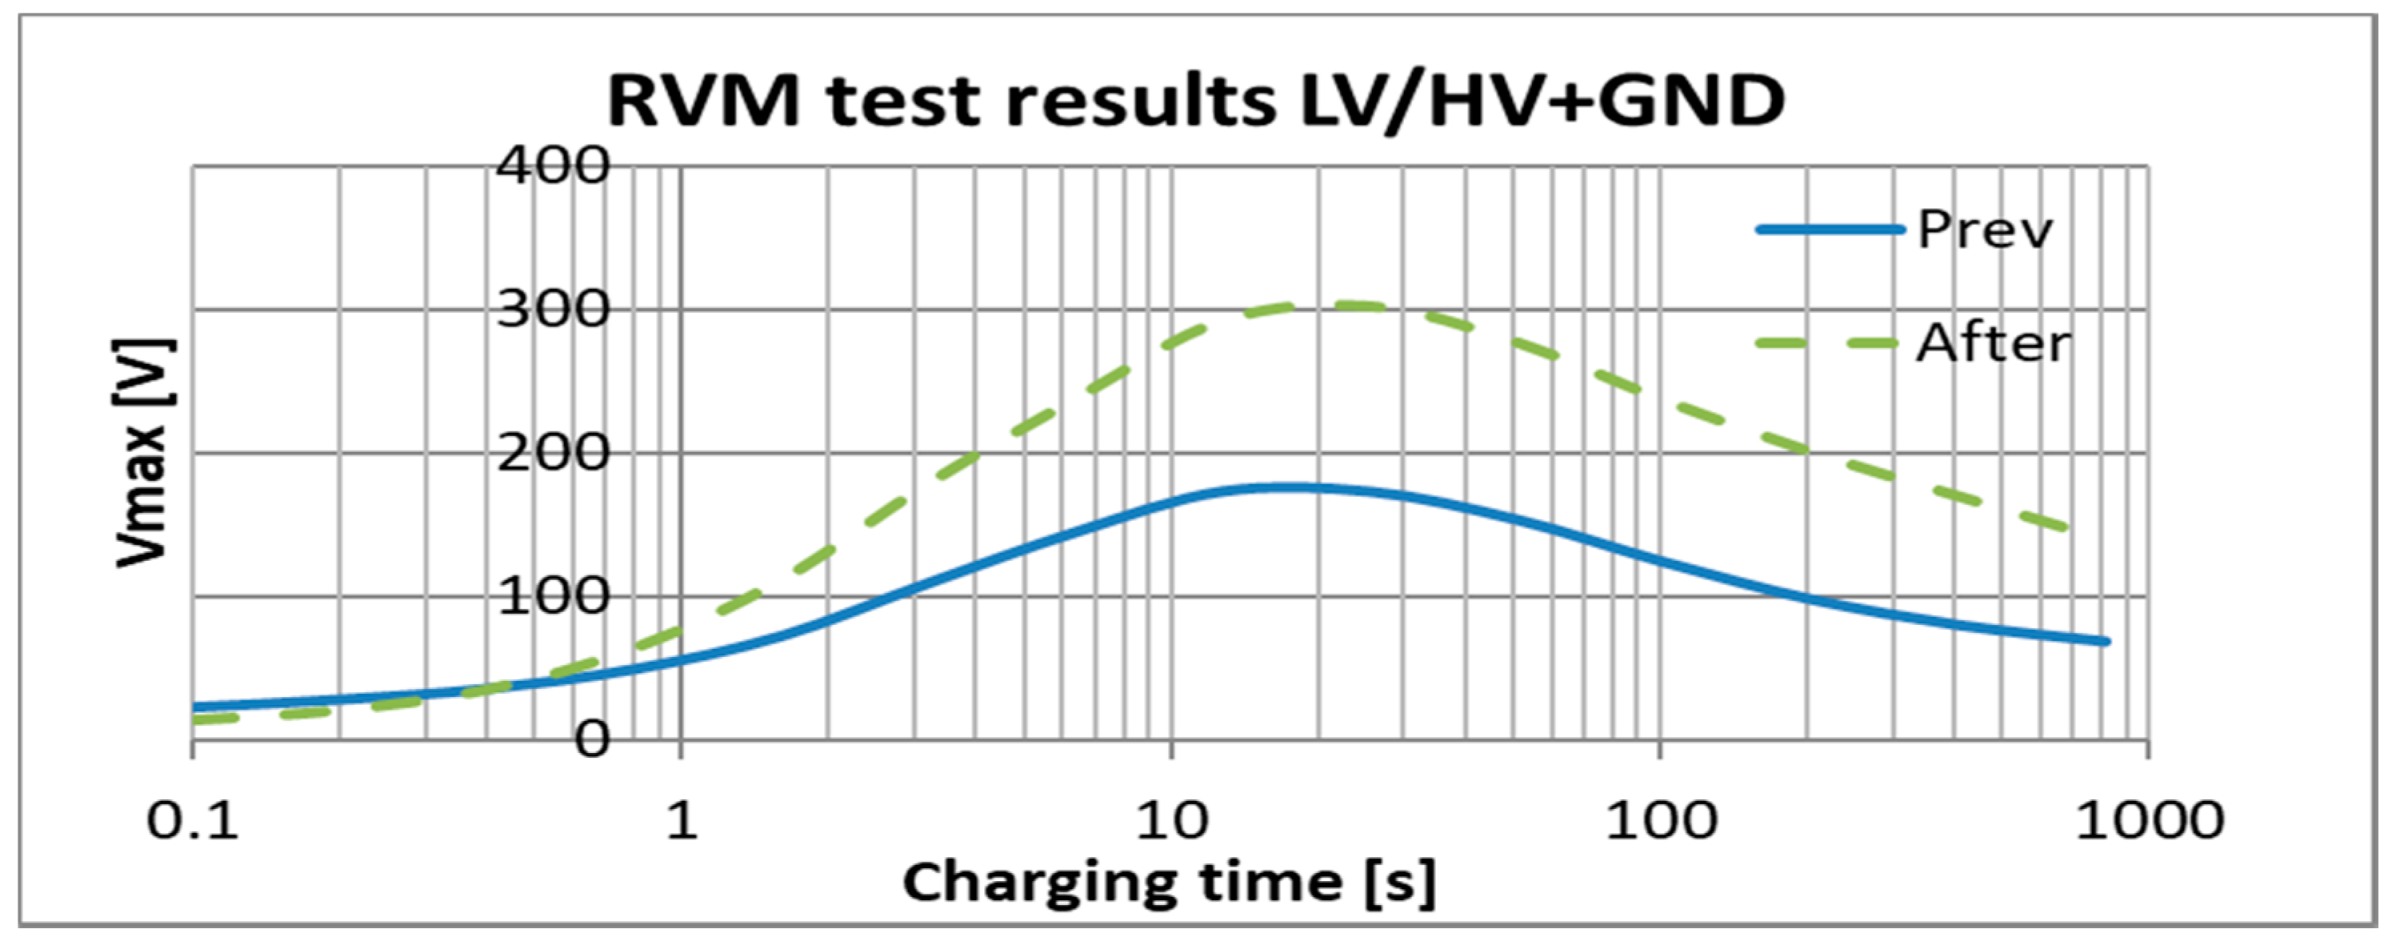
It can be appreciated that, although the oil did not have a high dielectric loss factor, the diagnosis both before and after the treatment (
Figure 10) must be, and only can be, that the transformer is affected by interfacial polarization. The surface of the coils is probably heavily contaminated with adhering particles, particles that have not been suspended in the oil, therefore the dielectric losses of the oil are not high. This situation, given that the treatment carried out was not designed to remedy it, has been maintained in both tests, with the problem that it is not possible to determine whether the water has been eliminated or not.
In the case that the Debye equivalent circuit is used, parallelisms with the exposure in cases one and two can be observed. It can be seen (
Figure 11) that as a result of the drying treatment carried out, the capacitance of the condensers of branches 1 to 4 has decreased, while the rest of the branches remain unchanged. Attention should be paid to branches 6 to 11, which have not changed as the compounds responsible for interfacial polarization have not been removed.
This case is representative of the improvement in diagnostics resulting from the use of the Debye equivalent circuit. In this case, the use of the traditional representation of the RVM test shows that it has no sensitivity to variations in moisture content as there is an overlapping effect of interfacial polarization (
Figure 12).
7. Conclusions
In this document, it has been described the different compounds that can contaminate the transformer’s oil–paper insulation system, and how the correct evaluation of the contents of these contaminating substances allows determining in a much more efficient way the treatment to be carried out.
The literature [
1] shows that, although all the methods commonly used to evaluate the condition of transformers are capable of identifying the same polarization mechanisms, each technique has its own weaknesses. In the case of the RVM technique, it shows insensitivity to all polarization mechanisms in the case of very strong interfacial polarization. Using a Debye equivalent circuit to model the dielectric according to the different polarization branches, it showed higher sensitivity, as it is shown in particular in case 3, effects that in the traditional representation were hidden by the effect of interfacial polarization, and can be appreciated by representing the capacity value of the different branches.
The proposed method of using a sweep with branches and time constant of the branches prefixed provides a tool that allows for systematic evaluation and sensitivity analysis between different tests. In contrast to other methods proposed, which find an equivalent circuit for a dielectric, in which both the number of branches and their time constant could vary, the use of a sweep allows to evaluate the morphology of the response obtained and allows to identify areas of influence (similar to what was achieved for the FDS test).
The use of a Debye equivalent circuit to characterize the different species present in the dielectric system has been shown to be a useful tool. The effects of the different species can be delimited allowing to carry out an individualized assessment. For transformer maintainers and managers, it is an advantage to be able to evaluate different areas that represent different effects, since the success of the treatments carried out on the dielectric of the transformer can be evaluated split into areas and not as an overall change.


