Exploring the Synergies between Urban Overheating and Heatwaves (HWs) in Western Sydney


1
Faculty of Built Environment, University of New South Wales (UNSW), Sydney NSW 2052, Australia
2
Data-61, The Commonwealth Scientific and Industrial Research Organization (CSIRO), Underwood Ave, Floreat, Perth WA 6014, Australia
*
Author to whom correspondence should be addressed.
Energies 2020, 13(2), 470; https://doi.org/10.3390/en13020470
Submission received: 3 December 2019
/
Revised: 11 January 2020
/
Accepted: 14 January 2020
/
Published: 18 January 2020
(This article belongs to the Special Issue Urban Heat Island Mitigation Technologies)
Abstract
:There is no consensus regarding the change of magnitude of urban overheating during HW periods, and possible interactions between the two phenomena are still an open question, despite the increasing frequency and impacts of Heatwaves (HW). The purpose of this study is to explore the interactions between urban overheating and HWs in Sydney, which is under the influence of two synoptic circulation systems. For this purpose, a detailed analysis has been performed for the city of Sydney, while considering an urban (Observatory Hill), in the Central Business District (CBD), and a non-urban station in Western Sydney (Penrith Lakes). Summer 2017 was considered as a study period, and HW and Non-Heatwave (NHW) periods were identified to explore the interactions between urban overheating and HWs. A strong link was observed between urban overheating and HWs, and the difference between the peak average urban overheating magnitude during HWs and NHWs was around 8 °C. Additionally, the daytime urban overheating effect was more pronounced during the HWs when compared to nighttime. The advective flux was found as the most important interaction between urban overheating and HWs, in addition to the sensible and latent heat fluxes.
1. Introduction
Currently, urban areas around the world are hosting more than 50% of the world’s population, and this figure is rapidly increasing [1]. Additionally, it is expected that, by 2025, 75% of the world’s population will reside in coastal cities and, consequently, more built-up spaces will be required. Mostly, cities are hotter than the surrounding non-urban areas, because of the urban heat island (UHI) effect. Urban overheating is one of the most documented phenomena, affecting more than 400 cities around the world [2,3]. The major causes of urban overheating relate to synoptic weather conditions, thermal properties of the materials (absorbing solar radiations or opaque surfaces releasing heat), lack of vegetation, less evaporative surfaces, availability of heat sources or sinks in the cities, anthropogenic heat released in the cities, and the reduction of wind penetration due to the urban texture [4,5,6,7,8].
Urban overheating has a devastating impact on energy consumption, vulnerability, human health, economy, and environment, and these negative effects are further magnified during HWs. Urban overheating increases the building energy demand and the peak electricity demand [4]. In more detail, with every 1 °C rise in temperature, induced by urban overheating, peak electricity demand might increase by 0.45–4.6% [9]. Additionally, UHI might also induce up to 0.8 kWh/m2K of the average cooling energy penalty [10]. While forecasting the global energy demand, it was also concluded that UHI and other factors, such as population growth and rapid penetration of air-conditioning, may increase the cooling energy loads of residential and commercial buildings up to 275% and 750%, respectively, by 2050 [11].
In addition to the adverse effects on energy and economy, UHIs and HWs impact on human health is most frightening and is the matter of prime concern [12,13]. Worldwide, HWs are one of the leading causes of weather-related mortality [14]. A notable case is the European heatwave of 2003, which caused approximately 70,000 excess deaths [15]. In Australia, over the last two centuries, heat-related deaths exceeded those due to other climate hazards [16]. As in many studies, in Sydney, a significant increase in the mortality rate of elderly people, especially of women, was noted during HW episodes [17,18,19,20], with an increase in mortality rate by 13% computed for the summer of 2011 [20].
Heat-related mortality and morbidity also increase due to the combined effect of overheating in the cities and higher levels of pollutants, being also enhanced by high temperatures [21]. More in detail, a 4.5–12% increase in mortality rate was estimated in Sydney, due to a 10 °C rise in daily maximum temperatures and high concentrations of ozone and particulate matter [22], being notably contributed by photochemical smog formation [23,24]. People’s adaptation to higher temperatures influences the mortality and morbidity rates and also the definition of the HW threshold temperatures towards the use of relative instead of absolute terms [25,26]. In particular, urban overheating impacts on low-income populations are also devastating, due to the poor thermal quality of dwellings, which worsens the exposure to extreme heat events and pollution. Resultantly, mortality, and morbidity ratios are higher in such urban areas [27].
Extreme heat events occur with higher frequency and intensity due to global climate change. For instance, HW frequency has already increased in the last few decades [28] and it is likely to increase further in the 21st century [29,30]. These regional and global changes are also affecting the UHI magnitude during the HWs. Cities are more vulnerable to extreme heat events, and HWs have more severe impacts due to their higher population density and additive UHI effect [31]. Recent findings on HWs, their causes, impact on energy, economy, and health, and its higher frequency have altered the research trend towards the identification of the potential interactions between UHIs and HWs, which affects the urban population [6,21,32].
Exploring the synergies between urban overheating and HWs helps in identifying the key factors that intensify the urban overheating, and more effectively plan for the application of mitigation technologies. No consensus exists on the relative change of the magnitude of urban overheating during HWs, and the interactions between both phenomena is still an open question [33,34,35,36,37,38,39,40]. Additionally, interactions between UHIs and HWs are mostly explored for noncoastal sites relative to the rural sites, and mostly positive interactions were noted at nighttime. For instance, in Beijing, China, the UHI is intensified at nighttime during HWs, and the difference between HW UHI and the background UHI is approximately 1.5 °C [35]. Similarly, higher nighttime UHI during the HWs was also found in Karachi, Shanghai, and Oklahoma [33,41,42]. No modification was noted in the UHI trend during the HWs in Philadelphia, PA, USA [43], while a reduction in UHI pattern during HWs was reported by Brazdil at Klementinum, Czech Republic [34]. In contrast to these studies, an amplified daytime UHI during HWs was found in Athens, while considering coastal stations as a reference [37]. Similarly, a positive daytime response between UHIs and HWs was noted in Shanghai, China, while considering the coastal reference station and the maximum difference between UHI during HWs and NHWs was around 1.5 °C [38].
In previous studies, either rural sites were compared with the urban sites or coastal sites were compared against the urban stations. However, the interaction between urban overheating and HWs in coastal cities close to a significant heat source such as desert has never been explored before. Sydney is located along the coastline of the South Pacific Ocean on the eastern side, while, on the west, it is exposed to advective airflow from one of the largest deserts in the world. Thus, it is under the influence of two different synoptic systems, (i) coastal winds and (ii) desert winds, as concluded in [5,44]. Synergistic interactions between UHIs and HWs also depend upon the boundary conditions of the investigated area. For instance, the urban-rural moisture contrast is considered as an essential interaction when noncoastal urban sites are compared with rural locations. In Baltimore, USA, during HWs, not only urban-rural temperature differences increased, but also the urban-rural moisture contrast, which is one of the major synergistic interactions between UHIs and HWs [41]. During HWs, typically, the sensible heat flux at the urban site increases [45], while, at the rural site, it is the latent heat flux that increases. This dynamic further intensifies the magnitude of the UHI during the HW [35]. High wind speed typically decreases the magnitude of UHIs [46]; however, advective heat flux from warm areas, increases the UHI and affects the interaction between UHIs and HWs, when coastal stations are considered [37].
The present study investigates the change in urban overheating magnitude during HWs in a coastal city, Sydney, being regionally affected by the desert and explores the synergistic interactions between urban overheating and HWs. Penrith Lakes in Western Sydney, influenced by the desert winds, at approximately 55 km from the coast, is taken as the nonurban (inland) station, while Observatory Hill located near the coast and Central Business District (CBD) Sydney is considered as urban reference station (coastal) to investigate the issue. The meteorological data of summer 2017 are analyzed to identify the HW and non-heatwave (NHW) periods. The specific energy budget contrast is computed in terms of sensible, latent, and advective heat fluxes to identify the potential interactions between urban overheating and HWs. To counteract urban overheating in Sydney, appropriate mitigation technologies can be devised by using the results of this study and, consequently, public health, energy savings, and environmental quality can be improved.
2. Methodology and Data
Sydney is the capital of the state of New South Wales (NSW), spreading along the south-eastern coastline, while, on the west, it is under the influence of one of the largest desert landforms in the world, the Australian arid biome [47]. From the eastern coastline to the western Blue Mountains, Sydney’s metropolitan area extends by about 70 km [48]. For this study, Sydney is divided into three main zones, (i) Eastern Sydney, (ii) Inner Sydney, and (iii) Western Sydney. Eight different stations in three zones of Sydney are considered for the Heatwave (HW) calculation: Observatory Hill, Sydney Airport and Terrey Hills reserve in the eastern Sydney, Olympic park AWS and Canterbury Racecourse in the Inner Sydney, Horsley park Equestrian Centre AWS, Campbelltown and Penrith Lakes in Western Sydney (Figure 1). To quantify the magnitude of urban overheating and characterize the synoptic conditions in Sydney, Observatory Hill—which is highly influenced by the sea breeze—is considered as the reference urban (coastal) station in this study, as proposed in [5]. Penrith Lakes, which is influenced by the desert winds, is taken as a nonurban (inland) station, with among the highest maximum temperatures in Western Sydney, and Australia in general.
Weather data are obtained from the Australian Bureau of Meteorology (BOM) for the sites of Penrith Lakes, Observatory Hill (OBS Hill) and six other stations in eastern, western, and inner Sydney. Observatory Hill (151°12′18″ E, 33°51′39″ S, 39 m above mean sea level) is located on a hill covered by greenery, in the proximity to the coast and Sydney’s central business district (CBD) [49] OBS Hill is in a mixed-use area, with industrial, commercial, and residential buildings, extending over 27 km2, with a tree canopy cover of approximately 15.2% [50]. It is one of the densest areas in Sydney, with a population of 205,339, corresponding to 76.8 persons per hectare [51]. Wind is mostly blowing from sea to the site, and NE/SE winds are representing the sea breeze, while the winds from NW/SW blow from inner Sydney towards the reference station.
Penrith Lakes is in Western-Sydney, north-west of Observatory Hill, at about 55 km from the reference station and the nearest coastline is at 49 km distance. The weather station is located in Penrith Lakes regional park (150°40′42″ E, 33°43′10″ S, 24.7 m above mean sea level), with green areas, bare soil, and lakes in surroundings [49], while the close urban area of Penrith displays mostly residential and commercial buildings. Additionally, the Nepean river flows to the west of the station, and an aqua park and golf facility are also present nearby. The tree canopy cover of the area is around 25% of the total land area, much higher than Sydney CBD [50]. Temperatures at Penrith Lakes are quite high in summer and sometimes reaching 47 °C. The population of Penrith is approximately 13,000. Wind speed and direction vary and NE/SE winds represent the wind coming from inner Sydney to the site, while the NW/SW direction denotes the dry, warm, and downslope winds (Foehn wind)/desert wind, which might increase the site ambient temperatures.
The dataset that was composed of semi-hourly records was cleaned, and outliers and null-values were removed, while using the validation procedure that was proposed by Estevez et al. [52], comprising range tests, step tests, persistence tests, and relational tests. A two-step procedure was used to infill the gaps. The missing values up to three hours were linearly interpolated, while, for longer gaps, genetic algorithms have been applied to establish relations between the studied station and three nearest stations. Subsequently, the hourly averages were computed from 1999 to 2017. The dataset was analyzed to calculate the HW days and periods and understand the frequency and intensity of HW over the years. As done in [44], the period 1999–2017 was considered due to either the unavailability of data at some of the weather stations before the study period or issues with data quality and significant gaps, which could not be infilled for this type of analysis. The available meteorological parameters were the ambient temperature (near-surface air temperatures at 2 m height), Relative Humidity (RH), wind speed, and wind direction. Vapour pressure (Pv), saturated pressure (Ps), Absolute Humidity (AH), and dewpoint temperature were calculated from the available parameters. The summer of 2017 was selected as a study period, as it was one of the warmest summers in recent years, to identify the interactions between HWs & urban overheating at Penrith Lakes [44]. Additionally, a time series analysis of ambient temperature over Sydney from 1960 to 2016 demonstrated that the mean and maximum temperatures in summer have increased in recent years [53]. Monthly and seasonal UHI variations in Sydney have already been studied in [44], while the focus of the study is on urban overheating response during HWs.
2.1. HW Period Identification & UHII Calculation
Defining the HW period is not straightforward, as people in different areas have different climatic adaptability and, hence, the vulnerability factor might vary with the location. Consequently, there is no globally accepted definition of HW period, with multiple metrics being proposed in the literature [25,26,54,55]. The temperature threshold, spatial extension, and duration of the HW period are the most commonly used parameters for isolating HW events. Most of the metrics identify an HW when a threshold is trespassed by a given number of subsequent days with the limit being an absolute maximum temperature threshold (35 °C or 37 °C), or a relative maximum temperature (90th, 95th, or 97th percentile) [22,25,26]. The latter type of metrics consider percentiles instead of absolute temperatures to account for the climatic adaptability factor. There is also no consensus on the minimum number of subsequent days trespassing threshold to be considered an HW: two consecutive days are used in the USA, while two to five consecutive days in Europe and Australia are taken as the minimum duration [17,56,57,58]. Excess Heat Index (EHI) and Excess Heat Factors (EHF) also have been used to identify HW events, by considering the 95th percentile temperature threshold and three consecutive days [58]. In the present research, the temperature threshold is defined in terms of percentile, and the minimum duration is considered as three consecutive days, as in [37,55,56]. The number of HW days at Penrith Lakes, as calculated with 97th, 95th, and 90th percentiles were 208, 342, and 691 days, respectively, while the HW periods were 12, 31, and 84, respectively (Table 1).
HWs is a regional phenomenon, thus, it was essential to know whether similar events were happening at other surrounding stations. Very few HW periods were noted at eight weather stations with the 97th percentile and three consecutive days definition. Additionally, these were not falling in the same period, which referred to the local overheating at a particular station. With the 95th percentile and three consecutive days definition, a common HW period at all weather stations was observed from 9–11th February, while the corresponding NHW period was considered from 13–15th February, as shown in Table 2. Two NHW periods of equal duration as of the HW period, one immediately before and one after the HW period, were considered in [37,41], to explore the synergies between urban overheating and HWs. However, in the present research, another HW period was noticed at Penrith Lakes from 4th–6th February (Table 2). Thus, only one HW and one NHW periods were considered for further analysis due to the gap of only two days between two HW periods. The threshold temperatures (95th percentile) were 34.7 °C and 29.4 °C, at Penrith Lakes and OBS Hill, respectively (Table 2). During the summer of 2017, a total of four HW periods were recorded at Penrith Lakes, two in January and two in February.
The magnitude of urban overheating is computed as the ambient temperature difference between Penrith Lakes and OBS Hill (ΔT = TPenrith − TOBS Hill). Thus, positive urban overheating magnitude indicates the higher temperatures at Penrith Lakes than in the City, while negative values mean higher temperatures at the coastal station. Mean urban overheating magnitude with standard deviations was also calculated for the whole HW and NHW periods to understand the variation in urban overheating patterns. Similarly, AH differences (ΔAH = AH Penrith Lakes − AH OBS Hill) were also calculated between both sites, and a positive value denotes higher latent heat flux at Penrith Lakes, while a negative value shows higher latent heat flux at the coastal site.
2.2. Energy Budget Equation Exploration
The energy budget equation is used to understand the surface energy contrast between urban and rural sites. The quantification of the energy budget equation at both sites during HWs and NHWs helps in understanding the interactions between urban-overheating and HWs. In the energy budget equation (Q* + QF = QH + QE + ΔQS + ΔQA, expressed in W/m2), Q* is the net all-wave radiative heat flux at earth surface. It consists of the balance of incoming and outgoing short-wave and long-wave radiations. QF is the anthropogenic heating flux, which is high at urban sites due to human activities, such as air-conditioning use. QH and QE are the turbulent sensible and latent heat fluxes, respectively, and their sum is also called available energy. The sensible and latent heat fluxes are mostly explored while investigating the interaction between UHIs and HWs and are also considered as one of the important reasons for urban-rural temperature difference [35]. Sensible heat flux is usually high at urban sites, mostly due to higher surface temperatures, while latent heat flux is high at the rural site, because of abundant site moisture. Urban-rural moisture contrast is considered as one of the important synergistic interactions between HWs & UHIs [41]. ΔQs is the storage heat flux, which is high at the urban site due to the higher heat storage capacity of surfaces. ΔQA is the advective heat flux. In this study, sensible and latent heat fluxes during HWs and NHWs were estimated through near-surface temperature (ambient temperatures) and absolute humidity values.
Typically, higher surface temperatures during the HWs increases the ambient temperatures, through convection and resultantly sensible heat flux [59]. Similarly, latent heat flux increases due to the higher evaporation rates at the site. Wind speed and direction helped in identifying the advective heat potential at both sites. In the present study, mainly sensible, latent, and advective heat fluxes are explored to identify the synergies between urban-overheating and HWs. Initially, analysis is made for one representative HW (11 February 2017) day, last day of the HW period, having maximum temperature, and one NHW day (14 February 2017), having minimum temperatures during considered NHW period. After a one-day analysis, it is repeated for all HW and NHW periods.
3. Results
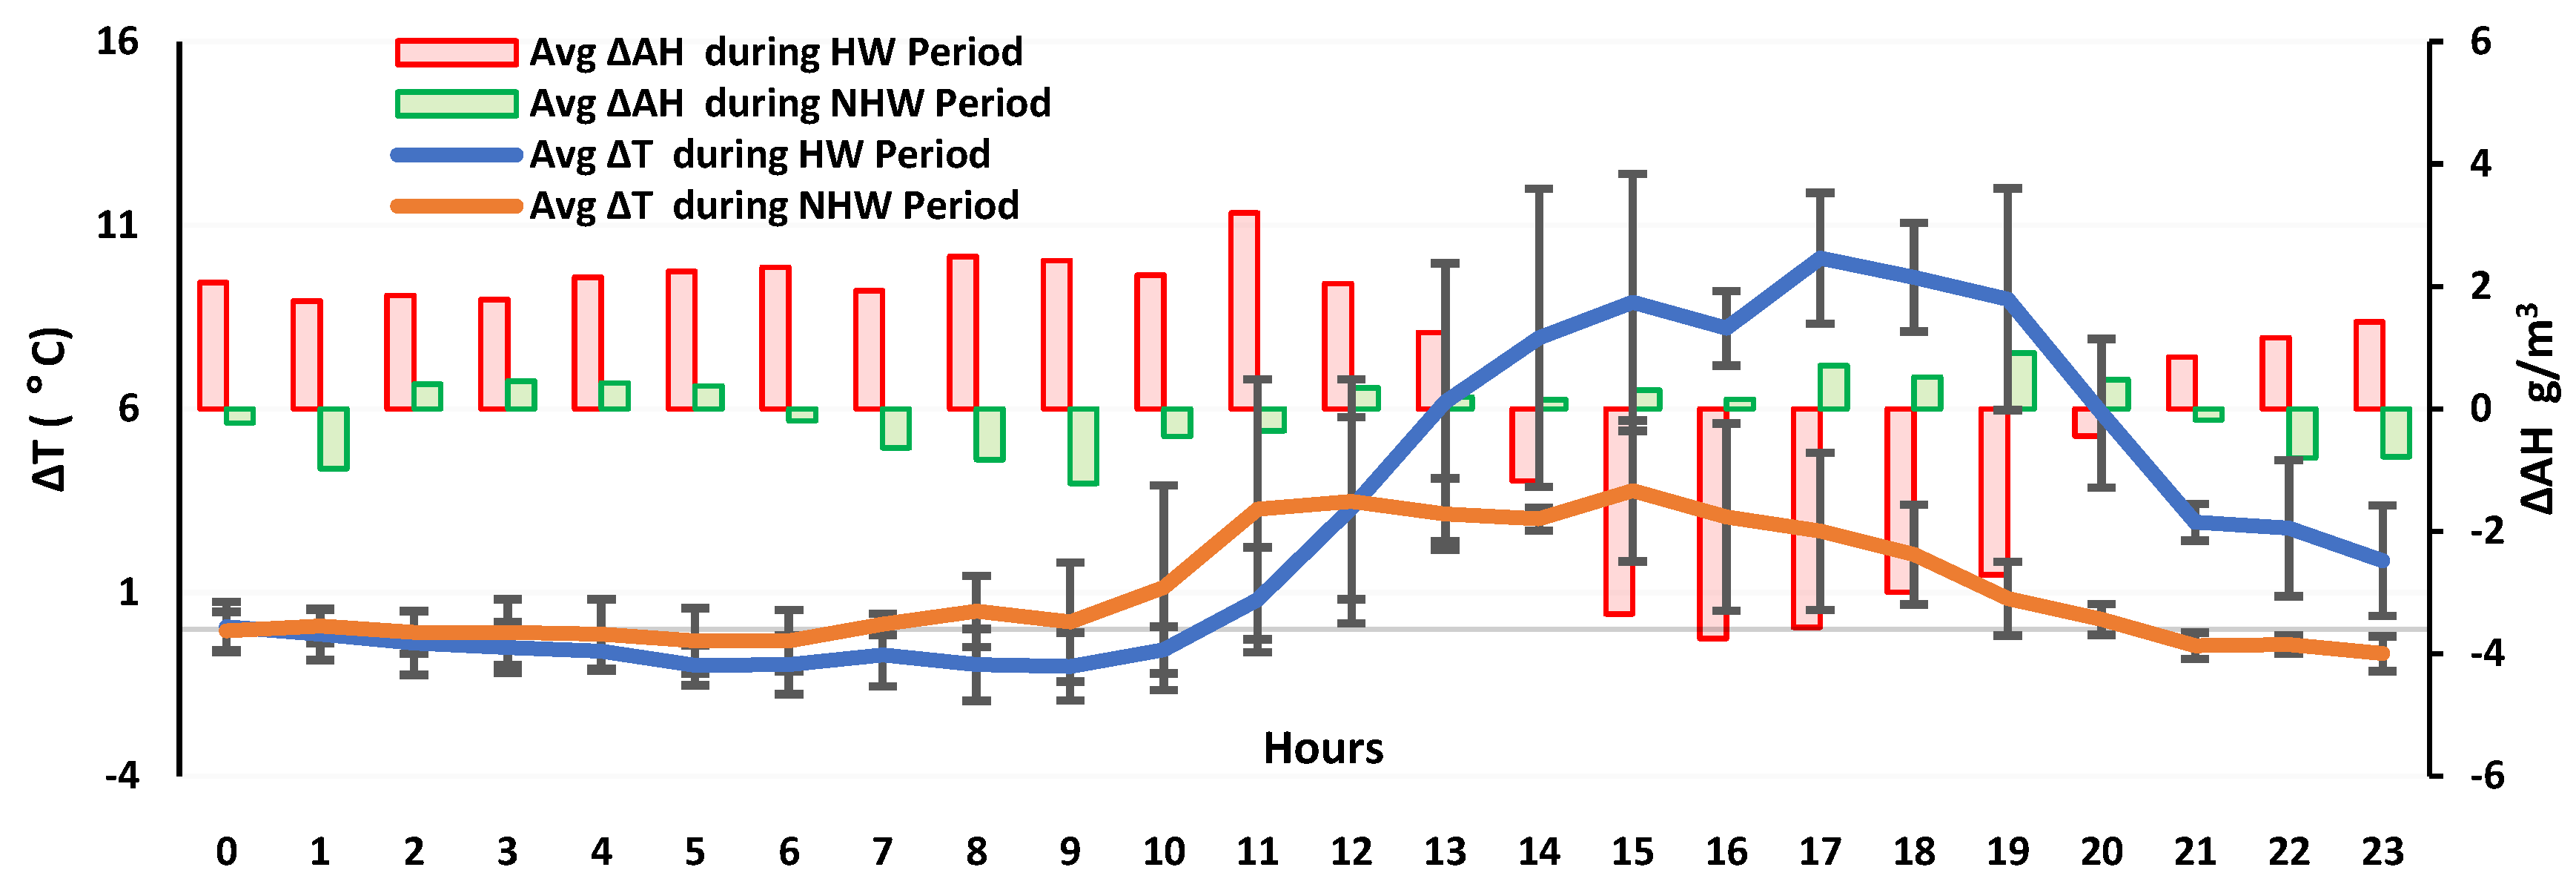
The magnitude of urban overheating was computed during both HW and NHW periods. Urban-overheating magnitude at daytime was quite high (average peak around 10 °C at 17:00) during the HWs, as compared to the NHW period, especially in the afternoon (Figure 2).
The results show a strong connection between urban overheating and HWs. The specific pattern can be attributed either to advection from the sea breeze, cooling down the coastal station quickly during the day, and then intensified the urban overheating or because of the latent heat flux difference between both sites, got increased abruptly during the daytime.
3.1. Coastal-Inland Moisture Contrast on Selected HW and NHW Days
During the HW day, the latent heat flux difference between the coastal and the inland sites increased in the daytime, compared to the NHW day (Figure 3). Generally, due to higher surface temperatures during the HW period, the evaporation rate increases, which increases the AH. The availability of vegetation and ground surface moisture enhances the evaporation/evapotranspiration rates. Typically, evapotranspiration/evaporation is more evident in rural areas, when compared to urban areas and, hence, these areas show lower ambient temperatures. When the AH difference, between both sites, during the HW period at daytime was increasing, the urban-overheating magnitude was also increasing (Figure 3). From here, it can be concluded that, despite having nonurban surfaces and being closer to the water bodies (lakes), latent heat flux at Penrith Lakes at daytime was lower, during the HW period when compared to the coastal site. The possible explanations include: (i) reduced evaporation rates at the site, (ii) advection of dry air at Penrith Lakes, (iii) advection of humid air from sea to the coastal site, and (iv) higher/constant evaporation or evapotranspiration at the coastal station. Temperature and AH profiles at Penrith Lakes and OBS Hill were explored further to understand the phenomena.
3.2. Wind Speed and Direction on Selected HW and NHW Days
Wind speed and its directions were examined during HW and NHW days and observed the following. During HW day, at daytime wind speed at Penrith lakes increased from 2–5 m/s and it was blowing from desert to the site (Figure 4A). At this time, the wind was blowing from sea to site at OBS Hill, as shown in Figure 4C, and the urban-overheating magnitude was quite high. During the NHW day, wind speed at Penrith lakes was slightly higher when compared to the HW day, and it was blowing from Inner-Sydney to the site (Figure 4B), and urban overheating magnitude was quite low, as compared to the HW day. The nocturnal wind direction at Penrith lakes during HW day (desert to the site) and NHW days (Inner Sydney to the site) did not change much when compared to the daytime. However, windspeed also got reduced at nighttime and urban overheating magnitude.
On the other hand, at OBS Hill during the HW day, the nocturnal wind direction was from inland to the site, while during the NHW day wind was blowing from sea to the site (Figure 4D). Wind speed during the NHW day at OBS Hill was much higher when compared to the HW day.
3.3. Absolute Humidity and UHI Magnitude at Night-Time
During HW & NHW days, AH at Penrith lakes was higher at nighttime, when compared to OBS Hill (Figure 5B). The land cover (retaining more moisture content), proximity to the lakes, wind speed, and direction and evaporation of surface moisture (formed due to condensation) can explain the higher AH and lower nocturnal temperature at Penrith Lakes. The principal reason could relate to non-urban surfaces, having higher evaporation potential and increasing the latent heat flux at the site. Precipitation could be another important reason for higher soil moisture at Penrith Lakes, which was observed on the 7th and 8th of February.
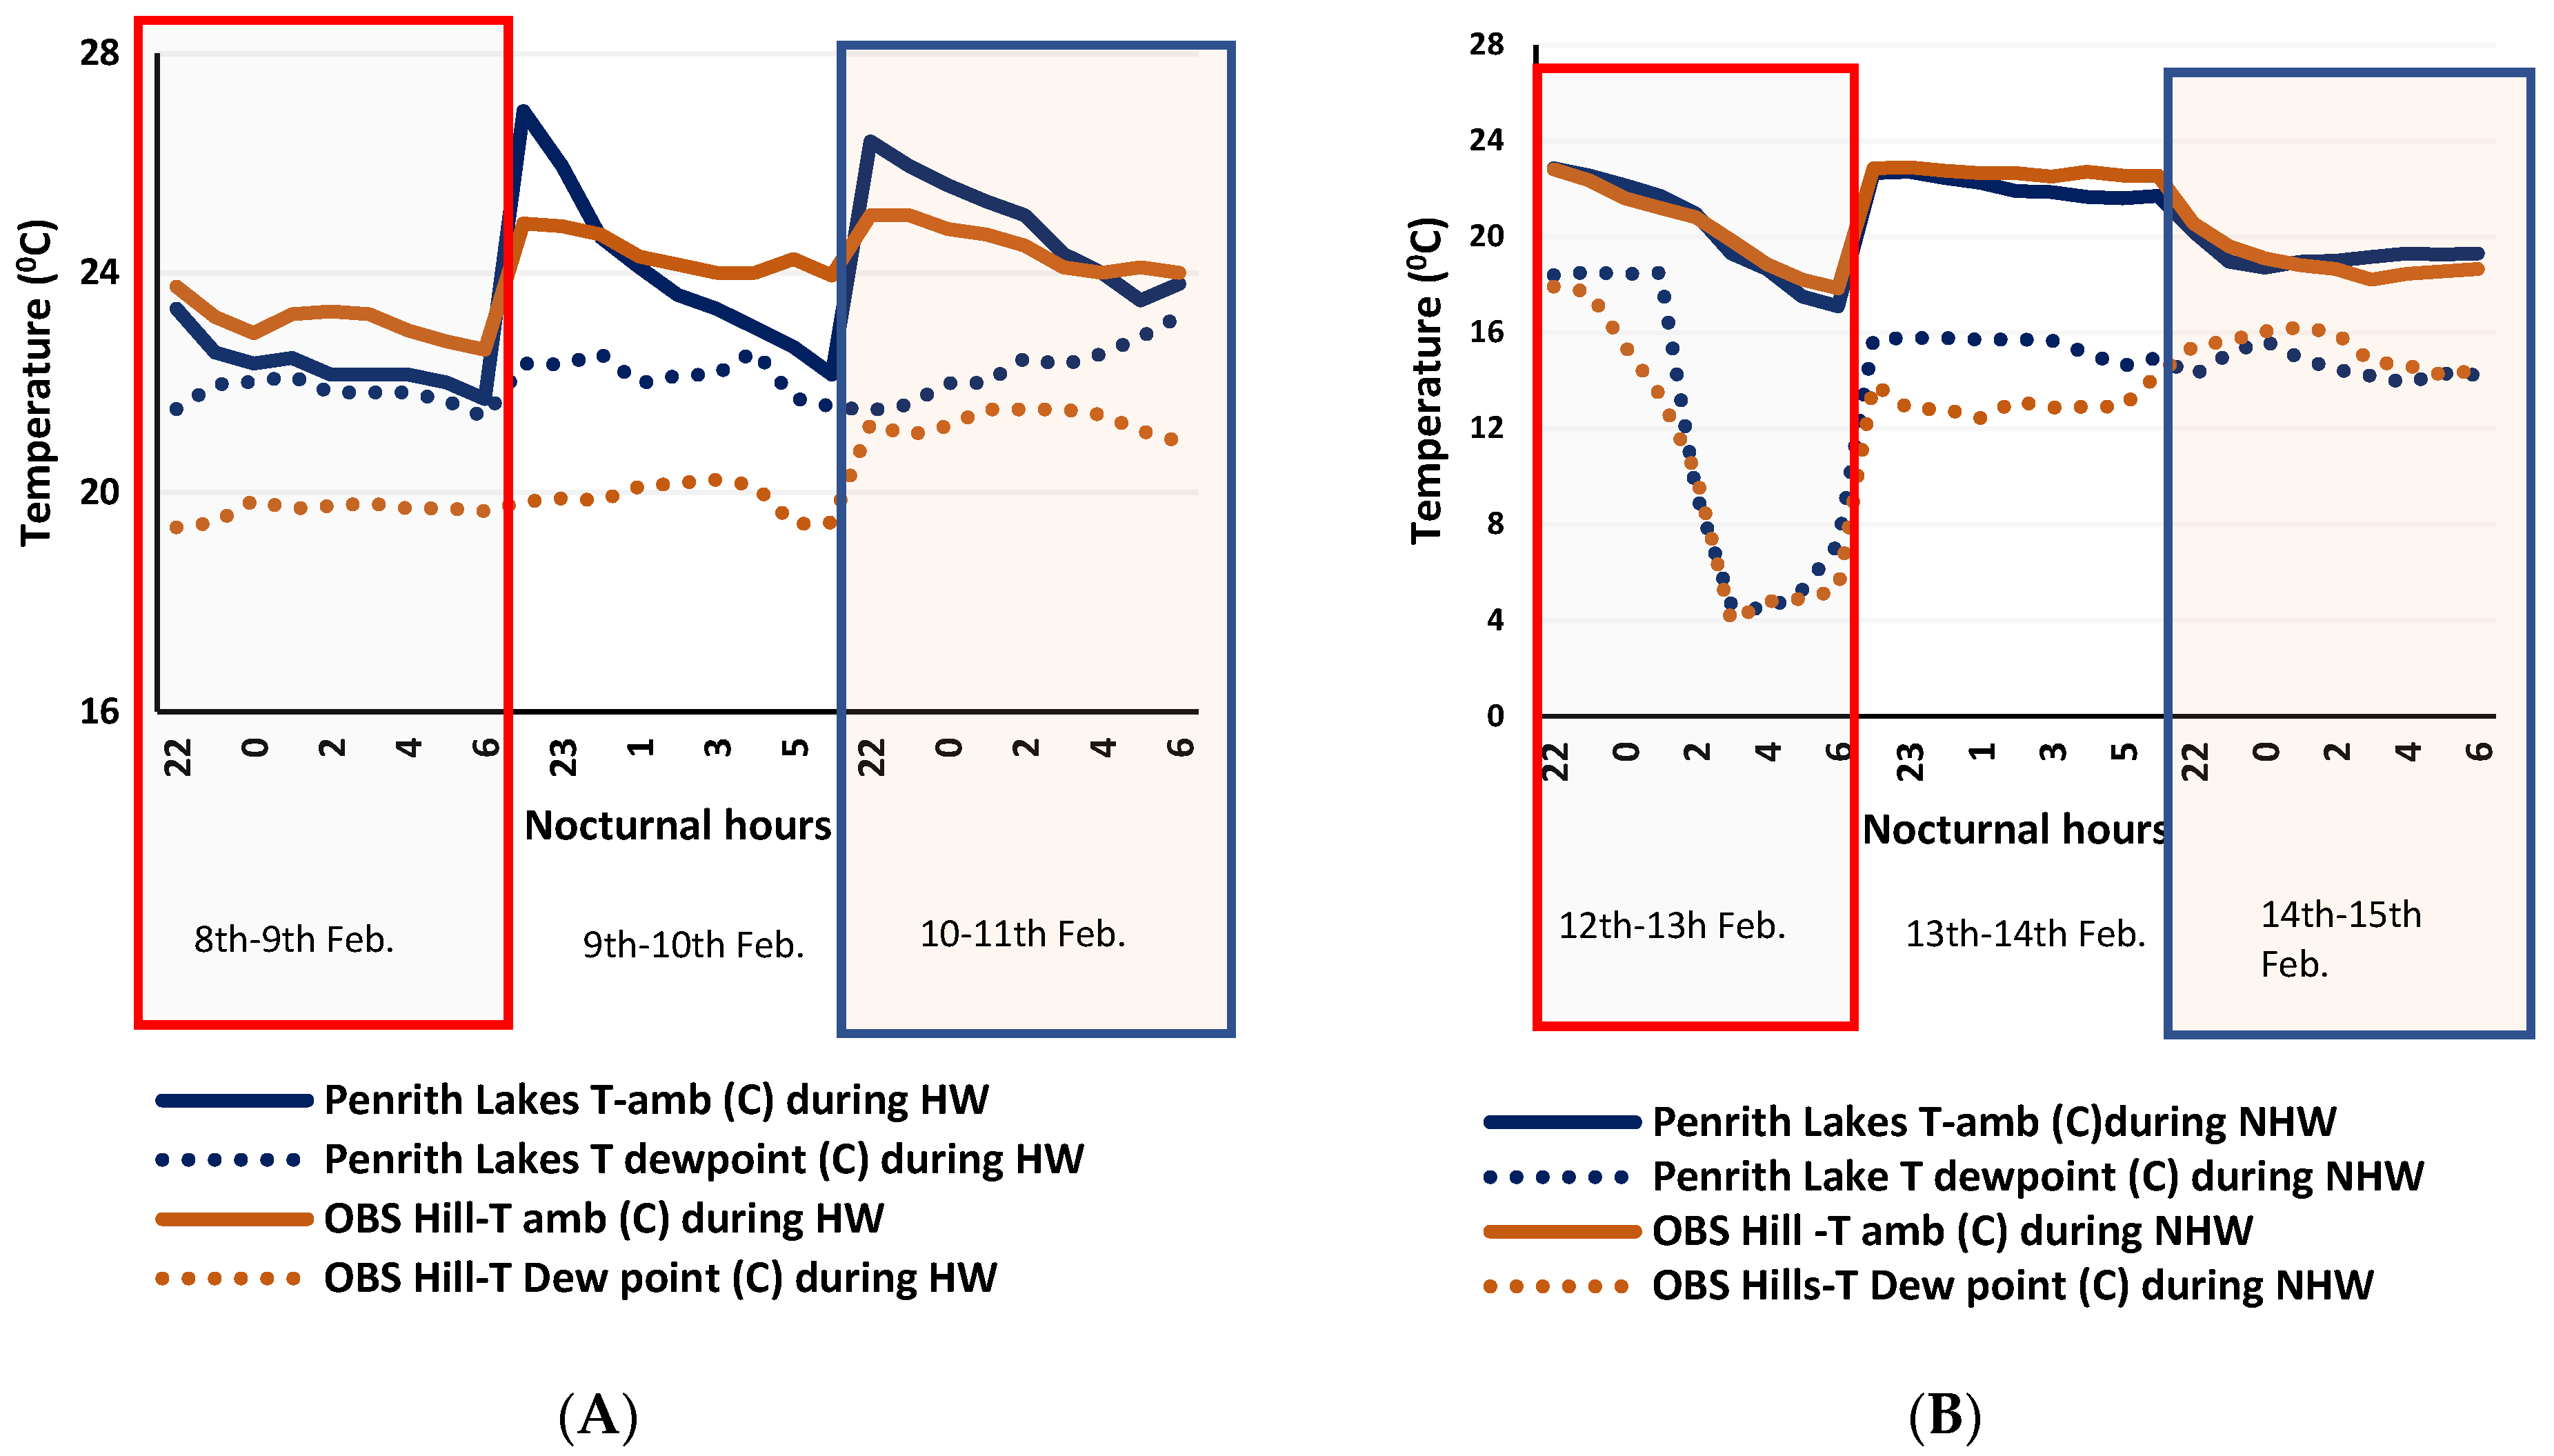
Dew formation is another potential reason for the increased AH value in the morning, as, in early morning, warm soil can evaporate the excessive surface moisture, which formed due to condensation. This phenomenon occurs if the surface temperatures are less than or equal to the dew point temperature, then humidity from the air condenses, and dew is formed. Site ambient temperatures at Penrith Lakes and OBS Hill were compared with dewpoint temperatures during both HW and NHW periods to explore the chances of dew formation, and it was found that, at Penrith Lakes, there were chances of dew formation during HW days, as shown in Figure 6A. Thus, a sharp increase in AH value at Penrith lakes at 6 am could be because of the evaporation of surface moisture.
Nighttime temperatures at both stations are almost the same during both HW and NHW days (Figure 5A). At OBS Hill, steady sea surface temperatures penetrating at the site are maintaining the air temperatures and AH within a specific range, while the radiative cooling process at Penrith lakes due to its non-urban surfaces is quickly reducing ambient temperatures. Thus, the nocturnal urban-overheating magnitude during both HWs and NHWs is negligible.
3.4. Daytime Urban Overheating Magnitude
Daytime temperatures at Penrith lakes were much higher when compared to OBS Hill during HW day (Figure 5A). During this time, AH at the site got reduced very quickly and then started increasing again in the evening (Figure 5B). Until midday, the AH was quite high and consistent at the site, but a sharp reduction in AH value referred to the change in wind speed and direction. During the whole HW day, wind at Penrith lakes was blowing from desert to the site; however, until 1 p.m., wind speed was quite low (Figure 4A). Advection from the desert wind with higher wind speed after 1 p.m., making the evaporation/evapotranspiration process ineffective at the site and, resultantly, drastic increase in temperature was noted at Penrith Lakes. Wind speed started decreasing at 4 p.m., and resultantly temperature started falling and AH increased again because of the restoration of the evaporation process.
The analysis of the data at Penrith Lakes during the whole HW period (9th–11th Feb.) & NHW period (13th–15th Feb.) found that daytime temperatures were consistently increasing at Penrith lakes from first HW day to the last HW day (Figure 7A). On the other hand, latent heat flux during daytime at the site was getting reduced similarly, as shown in Figure 7C. The wind blowing from inner Sydney to the site (see methodology and data) is helping to reduce the site temperatures as site evaporation potential is not getting compromised (Figure 8A,B). On the other hand, when the wind is blowing from desert to the site (Figure 8A), ambient temperatures increase (Figure 7A), as the evaporation process is becoming ineffective (Figure 7C). It is due to dry, warm air, which is causing the fast depletion of available moisture and decreasing the latent heat flux at Penrith Lakes. Additionally, as wind speed from the desert is increasing, AH is getting further reduced and drastically increasing the temperatures.
In contrast to Penrith Lakes, daytime AH at OBS Hill, during both HW & NHW days, was high (Figure 7D) and consistent and temperatures were also low in the same proportion (Figure 7B). This is due to the advection of humid air from the sea as during both HW & NHW days, the wind was blowing from sea to OBS Hill (Figure 4C,D). However, the wind speed was much higher, as compared to the HW day, during the NHW day. Thus, the temperatures at OBS Hill were accordingly low (Figure 5A).
On the other hand, during the HW day, although the temperatures were relatively high at OBS Hill, but because of higher evaporation from the sea, AH was also higher. After analyzing the three consecutive HW (9–11th Feb.) and NHW (13–15th Feb.) days at OBS Hill, it was found that, during both HW and NHW periods in the daytime, the wind was blowing from sea to the site (Figure 8C,D). However, as wind speed was getting reduced, AH was also getting reduced due to less advection from the sea and resultantly temperatures were increasing (Figure 7B,D). When the wind was blowing from inland to the coastal site, AH was reduced, and temperatures increased.
4. Discussion
The urban population is at higher thermal risk due to rapid urbanization and extreme heat events. Hence, comprehensive knowledge is required for identifying the factors, magnifying the urban-overheating, and changing the urban-rural energy contrast. In the present study, the very first time, the impact of extreme heat events on urban overheating is measured in a coastal city, which is also under the influence of the desert climate. The results reveal that the urban overheating effect gets amplified during the HWs, in contrast to some of the previous studies, where no modification or reduction in the UHI pattern was noticed during the HWs [34,43].
Additionally, it is found that the urban overheating effect is more pronounced in the daytime, especially in the afternoon. These results are consistent with the studies that were carried out in the coastal cities [37,38]. However, these results differ from other studies, where rural and noncoastal sites were compared, and due to a quick radiative cooling process at rural stations and slow cooling at urban sites, the nocturnal UHI effect was more intense during the HWs [33,35,41,42,60]. The nighttime urban overheating effect, in the present study, during HWs is unnoticeable. It is due to the rapid radiative cooling process at Penrith Lakes, due to non-urban surfaces and maintained temperatures at OBS Hill due to a steady sea breeze.
The difference between the peak average magnitude of urban overheating during HWs and NHWs is approximately 8 °C. In previous studies, with coastal or non-coastal reference stations, the maximum difference between HW and NHW urban overheating was from 1–2.5 °C [33,35,37,38]. The greater magnitude of urban overheating in Sydney is due to the presence of two different synoptic systems (heating mechanism—desert winds and cooling mechanism—coastal winds), on both sides of the city, which makes western Sydney more vulnerable. In the present study, advective heat flux is found as the dominant interaction between urban overheating and HWs, in addition to the sensible and latent heat fluxes. Advective heat flux was considered to be inconsequential for noncoastal cities; however, in coastal cities, it was one of the primary reasons for the intensification of urban overheating during HWs [37,38]. In noncoastal cities, urban-rural moisture contrast was considered a major interaction between UHIs and HWs [35,37,41].
Moreover, synergies between UHIs and HWs may get diminished if there is an insufficient latent heat flux difference between urban and rural sites [35]. In France, extreme temperatures were noted in 2003, because of the reduced evapotranspiration and latent cooling, which were linked to the soil moisture conditions [61]. Higher latent heat flux differences between urban and rural areas were also considered as the most important synergistic interaction in Beijing, China [35]. However, in the present study, sensible and latent heat fluxes at Penrith Lakes are also getting affected by the winds. Desert winds from the west are causing a fast depletion of available moisture at Penrith Lakes, consequently decreasing the total evaporation/evapotranspiration and, thus, the latent heat flux, while increasing the ambient temperatures. On the other side, a steady sea breeze at the coastal site during the HW event maintained the temperatures and humidity at a certain level. Generally, higher wind speed reduces the magnitude of UHIs [2,62,63]; however, in this case, winds with higher speed from the desert are increasing the temperatures at the inland station and, consequently, urban overheating. The impact of wind speed and direction (coastal and desert wind) on urban overheating at the coastal station highlights the importance of advective heat flux and shows it as the most influential interaction between urban overheating and HWs in Sydney.
Western Sydney’s population is at high thermal risk, due to higher outdoor temperatures during extreme heatwave events. Thus, the chances of heat-related mortality, morbidity, air pollution, and electricity consumption increase [6]. Not only appropriate mitigation technologies need to be employed in Western Sydney, but CBD and eastern Sydney should be mitigated to allow for the sea breeze penetration in the Western Sydney through ventilation corridors to maintain the outdoor thermal comfort. Thus, through proper urban planning initiatives and design, excess urban heat can be mitigated and, consequently, it can help in reducing the economic burden from the health and energy sector. A detailed investigation of these mitigation technologies will be carried out in a subsequent paper. These results are not only applicable in Sydney, but they can also be applied to other cities, having similar boundary conditions, such as Muscat (Oman), Dubai(U.A.E.), Jeddah (Saudi Arabia), Dammam (Saudi Arabia), Casablanca (Morocco), etc. [2,64,65].
Reliance on the data from a single summer/year to identify the interaction between urban overheating and HWs is one of the limitations of this study, and results can be validated by considering data from some more recent summers. Additionally, this study can be further enhanced by analyzing the other weather stations in inner and Western Sydney. Other components of the energy budget equation may also be explored to understand the interactions between urban overheating and HWs further.
5. Conclusions
The frequency and intensity of HWs are increasing in the 21st century, negatively affecting the outdoor thermal comfort in urban areas. This study focuses on the interactions between urban overheating and HWs in a coastal city (Sydney, Australia), which is affected by a desert landmass. The results show a positive response between urban overheating and HWs, which gets magnified during the daytime, instead of night-time, consistently with the literature. Additionally, the difference between peak average urban overheating magnitude during HWs and NHWs was around 8 °C, which exceeds the most commonly documented figures. The greater difference between the magnitude of urban overheating during HWs and NHWs is attributed to the presence of two synoptic systems, which become further active during HWs. The increased severity of urban climate during HWs might severely affect human health, environmental quality by increasing the pollutants in the atmosphere, and economy by increasing the energy demand. Urban-rural moisture contrast is considered as one of the leading factors, intensifying the UHI magnitude during the HWs. However, advective heat flux was found as the dominant interaction between both these phenomena in addition to sensible and latent heat fluxes. Further, the advective heat flux also affected the sensible and latent heat fluxes at both sites and intensified the urban overheating. The results will help to devise the appropriate strategies to mitigate extreme heat events and design countermeasures to urban overheating.
Author Contributions
All authors (H.S.K., R.P., M.S., and P.C.) contributed equally in conceptualization, methodology, analyzing the data sets and preparation of the manuscript. All authors have read and agreed to the published version of the manuscript
Funding
The authors kindly acknowledge the Australian Bureau of Meteorology for the weather data, analyzed in this study, whose post-processing and validation was initially supported by Sydney Water and CRC for Low Carbon Living with the research contract ‘SP0012: Strategic Study on the Cooling Potential and Impact of Urban Climate Mitigation Techniques in Western Sydney’. The data analysis was also supported by the City of Parramatta, with the research contract ‘Parramatta Urban Overheating’.
Acknowledgments
Hassan Saeed Khan thankfully acknowledges UNSW Sydney and Data 61 CSIRO for supporting his Ph.D. in the form of University international postgraduate award and top-up scholarships.
Conflicts of Interest
The authors do not have any conflict of interest.
References
- United Nation. UN Finds World ’ s Population Is Increasingly Urban with More Than Half Living in Urban Areas Today and Another 2.5 Billion Expected by 2050 [Press Release]; United Nation: New York, NY, USA, 2014. [Google Scholar]
- Santamouris, M. Analyzing the heat island magnitude and characteristics in one hundred Asian and Australian cities and regions. Sci. Total Environ. 2015, 512–513, 582–598. [Google Scholar] [CrossRef] [PubMed]
- Santamouris, M. Innovating to zero the building sector in Europe: Minimising the energy consumption, eradication of the energy poverty and mitigating the local climate change. Sol. Energy 2016, 128, 61–94. [Google Scholar] [CrossRef]
- Santamouris, M. facing the problem of overheating in Australian cities. Archit. Aust. 2019, 108, 54–56. [Google Scholar]
- Santamouris, M.; Haddad, S.; Fiorito, F.; Osmond, P.; Ding, L.; Prasad, D.; Zhai, X.; Wang, R. Urban heat island and overheating characteristics in Sydney, Australia. An analysis of multiyear measurements. Sustainability 2017, 9, 712. [Google Scholar] [CrossRef]
- Santamouris, M. Recent Progress on Urban Overheating and Ηeat Island Research. Integrated Assessment of the Energy, Environmental, Vulnerability and Health Impact Synergies with the Global Climate Change. Energy Build. 2019, 15, 109482. [Google Scholar]
- Khan, H.S.; Asif, M. Impact of green roof and orientation on the energy performance of buildings: A case study from Saudi Arabia. Sustainability 2017, 9, 640. [Google Scholar] [CrossRef] [Green Version]
- Khan, H.; Asif, M.; Mohammed, M. Case Study of a Nearly Zero Energy Building in Italian Climatic Conditions. Infrastructures 2017, 2, 19. [Google Scholar] [CrossRef] [Green Version]
- Santamouris, M.; Cartalis, C.; Synnefa, A.; Kolokotsa, D. On the impact of urban heat island and global warming on the power demand and electricity consumption of buildings—A review. Energy Build. 2015, 98, 119–124. [Google Scholar] [CrossRef]
- Santamouris, M. On the energy impact of urban heat island and global warming on buildings. Energy Build. 2014, 82, 100–113. [Google Scholar] [CrossRef]
- Santamouris, M. Cooling the buildings–past, present and future. Energy Build. 2016, 128, 617–638. [Google Scholar] [CrossRef]
- Patz, J.A.; Campbell-Lendrum, D.; Holloway, T.; Foley, J.A. Impact of regional climate change on human health. Nature 2005, 438, 310. [Google Scholar] [CrossRef] [PubMed]
- Basu, R.; Samet, J.M. Relation between elevated ambient temperature and mortality: A review of the epidemiologic evidence. Epidemiol. Rev. 2002, 24, 190–202. [Google Scholar] [CrossRef] [PubMed]
- De Ridder, K.; Maiheu, B.; Lauwaet, D.; Daglis, I.; Keramitsoglou, I.; Kourtidis, K.; Manunta, P.; Paganini, M. Urban Heat Island Intensification during Hot Spells—The Case of Paris during the Summer of 2003. Urban Sci. 2016, 1, 3. [Google Scholar] [CrossRef] [Green Version]
- Robine, J.M.; Cheung, S.L.K.; Le Roy, S.; Van Oyen, H.; Griffiths, C.; Michel, J.P.; Herrmann, F.R. Death toll exceeded 70,000 in Europe during the summer of 2003. Comptes Rendus Biol. 2008, 331, 171–178. [Google Scholar] [CrossRef] [PubMed]
- National Climate Change Adaptation Research Facility. Managing Heatwave Impacts under Climate Change—Policy Guidance Brief 9; National Climate Change Adaptation Research Facility: Gold Coast, Australia, 2013; Volume 6. [Google Scholar]
- Tong, S.; Wang, X.Y.; Yu, W.; Chen, D.; Wang, X. The impact of heatwaves on mortality in Australia: A multicity study. BMJ Open 2014, 4, 1–6. [Google Scholar] [CrossRef] [Green Version]
- Vaneckova, P.; Hart, M.A.; Beggs, P.J.; De Dear, R.J. Synoptic analysis of heat-related mortality in Sydney, Australia, 1993–2001. Int. J. Biometeorol. 2008, 52, 439–451. [Google Scholar] [CrossRef]
- Vaneckova, P.; Beggs, P.J.; Jacobson, C.R. Spatial analysis of heat-related mortality among the elderly between 1993 and 2004 in Sydney, Australia. Soc. Sci. Med. 2010, 70, 293–304. [Google Scholar] [CrossRef]
- Schaffer, A.; Muscatello, D.; Broome, R.; Corbett, S.; Smith, W. Emergency department visits, ambulance calls, and mortality associated with an exceptional of in Sydney, Australia, 2011: A time-series analysis. Environ. Heal. A Glob. Access Sci. Source 2012, 11, 1–8. [Google Scholar] [CrossRef] [Green Version]
- Paravantis, J.; Santamouris, M.; Cartalis, C.; Efthymiou, C. Mortality Associated with High Ambient Temperatures, Heatwaves, and the Urban Heat Island in Athens, Greece. Sustainability 2017, 9, 606. [Google Scholar] [CrossRef] [Green Version]
- Vaneckova, P.; Beggs, P.J.; de Dear, R.J.; McCracken, K.W.J. Effect of temperature on mortality during the six warmer months in Sydney, Australia, between 1993 and 2004. Environ. Res. 2008, 108, 361–369. [Google Scholar] [CrossRef]
- Lai, L.W.; Cheng, W.L. Air quality influenced by urban heat island coupled with synoptic weather patterns. Sci. Total Environ. 2009, 407, 2724–2733. [Google Scholar] [CrossRef] [PubMed]
- Lebassi, B.; Gonzalez, J.; Fabris, D.; Maurer, E.; Miller, N.; Milesi, C.; Switzer, P.; Bornstein, R. Observed 1970–2005 cooling of summer daytime temperatures in coastal California. J. Clim. 2009, 22, 3558–3573. [Google Scholar] [CrossRef] [Green Version]
- Tong, S.; FitzGerald, G.; Wang, X.Y.; Aitken, P.; Tippett, V.; Chen, D.; Wang, X.; Guo, Y. Exploration of the health risk-based definition for heatwave: A multi-city study. Environ. Res. 2015, 142, 696–702. [Google Scholar] [CrossRef] [PubMed]
- Brooke Anderson, G.; Bell, M.L. Heat waves in the United States: Mortality risk during heat waves and effect modification by heat wave characteristics in 43 U.S. communities. Environ. Health Perspect. 2011, 119. [Google Scholar] [CrossRef] [Green Version]
- Kolokotsa, D.; Santamouris, M. Review of the indoor environmental quality and energy consumption studies for low income households in Europe. Sci. Total Environ. 2015, 536, 316–330. [Google Scholar] [CrossRef]
- Peterson, T.C.; Heim, R.R.; Hirsch, R.; Kaiser, D.P.; Brooks, H.; Diffenbaugh, N.S.; Dole, R.M.; Giovannettone, J.P.; Guirguis, K.; Karl, T.R.; et al. Monitoring and understanding changes in heat waves, cold waves, floods, and droughts in the United States: State of knowledge. Bull. Am. Meteorol. Soc. 2013, 94, 821–834. [Google Scholar] [CrossRef] [Green Version]
- Coumou, D.; Robinson, A. Historic and future increase in the global land area affected by monthly heat extremes. Environ. Res. Lett. 2013, 8, 034018. [Google Scholar] [CrossRef]
- Stocker, T. IPCC Summary for Policymakers in Climate Change 2013: The Physical Science Basis; Cambridge University Press: Cambridge, UK; New York, NY, USA, 2013. [Google Scholar]
- Schatz, J.; Kucharik, C.J. Urban climate effects on extreme temperatures in Madison, Wisconsin, USA. Environ. Res. Lett. 2015, 10, 094024. [Google Scholar] [CrossRef] [Green Version]
- Mitchell, D.; Heaviside, C.; Vardoulakis, S.; Huntingford, C.; Masato, G.; Guillod, B.P.; Frumhoff, P.; Bowery, A.; Wallom, D.; Allen, M. Attributing human mortality during extreme heat waves to anthropogenic climate change. Environ. Res. Lett. 2016, 11, 074006. [Google Scholar] [CrossRef]
- Rizvi, S.H.; Alam, K.; Iqbal, M.J. Spatio-temporal variations in urban heat island and its interaction with heat wave. J. Atmos. Solar-Terrestrial Phys. 2019, 185, 50–57. [Google Scholar] [CrossRef]
- Brázdil, R.; Budíková, M. An urban bias in air temperature fluctuations at the Klementinum, Prague, the Czech Republic. Atmos. Environ. 1999, 33, 4211–4217. [Google Scholar] [CrossRef]
- Li, D.; Sun, T.; Liu, M.; Yang, L.; Wang, L.; Gao, Z. Contrasting responses of urban and rural surface energy budgets to heat waves explain synergies between urban heat islands and heat waves. Environ. Res. Lett. 2015, 10, 054009. [Google Scholar] [CrossRef]
- Cheval, S.; Dumitrescu, A.; Bell, A. The urban heat island of Bucharest during the extreme high temperatures of July 2007. Theor. Appl. Climatol. 2009, 97, 391–401. [Google Scholar] [CrossRef]
- Founda, D.; Santamouris, M. Synergies between Urban Heat Island and Heat Waves in Athens (Greece), during an extremely hot summer (2012). Sci. Rep. 2017, 7, 1–11. [Google Scholar] [CrossRef] [Green Version]
- Ao, X.; Wang, L.; Zhi, X.; Gu, W.; Yang, H.; Li, D. Observed Synergies between Urban Heat Islands and Heat Waves and Their Controlling Factors in Shanghai, China. J. Appl. Meteorol. Climatol. 2019, 58, 1955–1972. [Google Scholar] [CrossRef] [Green Version]
- Zhao, L.; Lee, X.; Smith, R.B.; Oleson, K. Strong contributions of local background climate to urban heat islands. Nature 2014, 511, 216–219. [Google Scholar] [CrossRef]
- Zhao, L.; Oppenheimer, M.; Zhu, Q.; Baldwin, J.W.; Ebi, K.L.; Bou-Zeid, E.; Guan, K.; Liu, X. Interactions between urban heat islands and heat waves. Environ. Res. Lett. 2018, 13, 034003. [Google Scholar] [CrossRef]
- Li, D.; Bou-Zeid, E. Synergistic interactions between urban heat islands and heat waves: The impact in cities is larger than the sum of its parts. J. Appl. Meteorol. Climatol. 2013, 52, 2051–2064. [Google Scholar] [CrossRef] [Green Version]
- Basara, J.B.; Basara, H.G.; Illston, B.G.; Crawford, K.C. The Impact of the Urban Heat Island during an Intense Heat Wave in Oklahoma City. Adv. Meteorol. 2010, 2010. [Google Scholar] [CrossRef] [Green Version]
- Ramamurthy, P.; Bou-Zeid, E. Heatwaves and urban heat islands: A comparative analysis of multiple cities. J. Geophys. Res. 2017, 122, 168–178. [Google Scholar] [CrossRef]
- Yun, G.Y.; Ngarambe, J.; Duhirwe, P.N.; Ulpiani, G.; Paolini, R.; Haddad, S.; Vasilakopoulou, K.; Santamouris, M. Predicting the magnitude and the characteristics of the urban heat island in coastal cities in the proximity of desert landforms. The case of Sydney. Sci. Total Environ. 2020, 709, 136068. [Google Scholar] [CrossRef] [PubMed]
- Grimmond, S. Urbanization and global environmental change: Local effects of urban warming. Geogr. J. 2007, 173, 83–88. [Google Scholar] [CrossRef]
- Arnfield, A.J. Two decades of urban climate research: A review of turbulence, exchanges of energy and water, and the urban heat island. Int. J. Climatol. 2003, 23, 1–26. [Google Scholar] [CrossRef]
- Byrne, M.; Yeates, D.K.; Joseph, L.; Kearney, M.; Bowler, J.; Williams, M.A.J.; Cooper, S.; Donnellan, S.C.; Keogh, J.S.; Leys, R.; et al. Birth of a biome: Insights into the assembly and maintenance of the Australian arid zone biota. Mol. Ecol. 2008, 17, 4398–4417. [Google Scholar] [CrossRef]
- Australian Bureau of Statistics. Australian Statistical Geography Standard: Volume 4—Significant Urban Areas. Urban Centres Localities Section State 2011, 4, 29–31. [Google Scholar]
- Australian Government Bureau of Meteorology Climate Data Online. Available online: http://www.bom.gov.au/climate/data/index.shtml?bookmark=201 (accessed on 15 August 2019).
- Jacbos, B.; Mikhailovich, N.; Delaney, C. Benchmarking Australia’s Urban Tree Canopy: An i-Tree Assessment, Final Report 2014; Institute for Sustainable Futures: Sydney, Australia, 2014; Volume 47. [Google Scholar]
- Australian Bureau of Statistics. Regional Population Growth, Australia, 2016-17-Population Density; Australian Bureau of Statistics: Canberra, Australia, 2017.
- Estévez, J.; Gavilán, P.; Giráldez, J.V. Guidelines on validation procedures for meteorological data from automatic weather stations. J. Hydrol. 2011, 402, 144–154. [Google Scholar] [CrossRef] [Green Version]
- Livada, I.; Synnefa, A.; Haddad, S.; Paolini, R.; Garshasbi, S.; Ulpiani, G.; Fiorito, F.; Vassilakopoulou, K.; Osmond, P.; Santamouris, M. Time series analysis of ambient air-temperature during the period 1970–2016 over Sydney, Australia. Sci. Total Environ. 2019, 648, 1627–1638. [Google Scholar] [CrossRef]
- Barnett, A.G.; Hajat, S.; Gasparrini, A.; Rocklöv, J. Cold and heat waves in the United States. Environ. Res. 2012, 112, 218–224. [Google Scholar] [CrossRef] [Green Version]
- Pyrgou, A. Synergy of Urban Heat Island and Heat Waves. Ph.D. Thesis, The Cyprus Institute, Nicosia, Cyprus, 2018. [Google Scholar]
- Perkins, S.E.; Alexander, L.V. On the measurement of heat waves. J. Clim. 2013, 26, 4500–4517. [Google Scholar] [CrossRef]
- Kuglitsch, F.G.; Toreti, A.; Xoplaki, E.; Della-Marta, P.M.; Zerefos, C.S.; Trke, M.; Luterbacher, J. Heat wave changes in the eastern mediterranean since 1960. Geophys. Res. Lett. 2010, 37. [Google Scholar] [CrossRef] [Green Version]
- Nairn, J.; Fawcett, R. Defining Heatwaves: Heatwave Defined as a Heat-Impact Event Servicing all Communiy and Business Sectors in Australia; CAWCR Technical Report No 060; The Centre for Australian Weather and Climate Research A partnership between the Bureau of Meteorology and CSIRO: Kent Town, South Australia, 2013. [Google Scholar]
- Guan, K. Surface and ambient air temperatures associated with different ground material: A case study at the University of California, Berkeley. Surf. Air Temp. Gr. Mater. 2011, 196, 1–14. [Google Scholar]
- Li, D.; Sun, T.; Liu, M.; Wang, L.; Gao, Z. Changes in wind speed under enhance urban heat islands in the Beijing metropolitan area. J. Appl. Meteorol. Climatol. 2016, 55, 2369–2375. [Google Scholar] [CrossRef]
- Fischer, E.M.; Seneviratne, S.I.; Vidale, P.L.; Lüthi, D.; Schär, C. Soil moisture-atmosphere interactions during the 2003 European summer heat wave. J. Clim. 2007, 20, 5081–5099. [Google Scholar] [CrossRef]
- Camilloni, I.; Barrucand, M. Temporal variability of the Buenos Aires, Argentina, urban heat island. Theor. Appl. Climatol. 2012, 107, 47–58. [Google Scholar] [CrossRef]
- Alonso, M.S.; Fidalgo, M.R.; Labajo, J.L. The urban heat island in Salamanca (Spain) and its relationship to meteorological parameters. Climate Res. 2007, 34, 39–46. [Google Scholar] [CrossRef]
- Peng, S.; Piao, S.; Ciais, P.; Friedlingstein, P.; Ottle, C.; Bréon, F.M.; Nan, H.; Zhou, L.; Myneni, R.B. Surface urban heat island across 419 global big cities. Environ. Sci. Technol. 2012, 46, 696–703. [Google Scholar] [CrossRef]
- Bahi, H.; Rhinane, H.; Bensalmia, A.; Fehrenbach, U.; Scherer, D. Effects of urbanization and seasonal cycle on the surface urban heat island patterns in the coastal growing cities: A case study of Casablanca, Morocco. Remote Sens. 2016, 8, 829. [Google Scholar] [CrossRef] [Green Version]
Figure 1.
Selected weather stations and their locations.

Figure 2.
Mean urban overheating intensity (ΔT = Penrith Lakes − OBS Hill) and AH difference (ΔAH = Penrith Lakes − OBS Hill) during HW (9–11 February 2017) & NHW (13–15 February 2017) periods. The whiskers represent the standard deviation.
Figure 2.
Mean urban overheating intensity (ΔT = Penrith Lakes − OBS Hill) and AH difference (ΔAH = Penrith Lakes − OBS Hill) during HW (9–11 February 2017) & NHW (13–15 February 2017) periods. The whiskers represent the standard deviation.

Figure 3.
Absolute humidity difference (ΔAH) and urban-overheating (ΔT) between Penrith Lakes—OBS Hill during selected HW (11 February 2017) & NHW (14 February 2017) days.
Figure 3.
Absolute humidity difference (ΔAH) and urban-overheating (ΔT) between Penrith Lakes—OBS Hill during selected HW (11 February 2017) & NHW (14 February 2017) days.

Figure 4.
Wind speed-U (m/s) and direction comparison with urban overheating (ΔT) at Penrith Lakes and OBS Hill during selected HW (11 February 2017) and NHW (14 February 2017) days. (A): Penrith Lakes during HW day, (B) Penrith Lakes during NHW day, (C) OBS Hill during HW day, (D) OBS Hill during NHW day.

Figure 5.
Temperature T (°C) and AH (g/m3) profiles at Penrith Lakes & OBS Hill on selected HW (11 February 2017) & NHW (14 February 2017) days. (A) Temperature profiles in °C at Penrith Lakes and OBS Hill on HW and NHW days, (B) AH profiles in g/m3 at Penrith Lakes and OBS Hill on HW and NHW days.
Figure 5.
Temperature T (°C) and AH (g/m3) profiles at Penrith Lakes & OBS Hill on selected HW (11 February 2017) & NHW (14 February 2017) days. (A) Temperature profiles in °C at Penrith Lakes and OBS Hill on HW and NHW days, (B) AH profiles in g/m3 at Penrith Lakes and OBS Hill on HW and NHW days.

Figure 6.
Nocturnal ambient temperatures & dew point temperatures at Penrith Lakes & OBS Hill during HW (9–11 February 2017) and NHW periods. (A) during the HW and (B) NHW period.
Figure 6.
Nocturnal ambient temperatures & dew point temperatures at Penrith Lakes & OBS Hill during HW (9–11 February 2017) and NHW periods. (A) during the HW and (B) NHW period.

Figure 7.
Temperature profile (°C) and AH (g/m3) at Penrith Lakes and OBS Hill during HW (9–11 February 2017) & NHW (13–15 February 2017) Periods. (A) Temperature profiles at Penrith Lakes during HW and NHW periods, (B) Temperature profiles at OBS Hill during HW and NHW periods, (C) AH profiles at Penrith Lakes during HW and NHW periods, (D) AH profiles at OBS Hill during HW and NHW periods.

Figure 8.
Wind Speed (m/sec) & wind direction at Penrith Lakes and OBS Hill during HW (9–11 February 2017) and NHW (13–15 February 2017) periods. (A) Penrith Lakes during the HW period, (B) Penrith Lakes during NHW period, (C) OBS Hill during HW period, (D) OBS Hill during the NHW period.
Figure 8.
Wind Speed (m/sec) & wind direction at Penrith Lakes and OBS Hill during HW (9–11 February 2017) and NHW (13–15 February 2017) periods. (A) Penrith Lakes during the HW period, (B) Penrith Lakes during NHW period, (C) OBS Hill during HW period, (D) OBS Hill during the NHW period.


Table 1.
Number of Heatwave (HW) days and periods at Penrith Lakes and Observatory (OBS) Hill (1999–2017).
Table 1.
Number of Heatwave (HW) days and periods at Penrith Lakes and Observatory (OBS) Hill (1999–2017).
| Weather Station | Threshold Temperature | Threshold Temperature (°C) | Number of HW Days | Number of HW Periods |
|---|---|---|---|---|
| OBS Hill (Reference) | 97th Percentile | 31.2 | 209 | 4 |
| 95th Percentile | 29.4 | 345 | 14 | |
| 90th Percentile | 27.6 | 703 | 60 | |
| Penrith Lakes | 97th Percentile | 36.4 | 208 | 12 |
| 95th Percentile | 34.7 | 342 | 31 | |
| 90th Percentile | 32 | 691 | 84 |
Table 2.
Total Number of HW Periods and their duration in Summer 2017 (with 95th Percentile and three consecutive days definition).
Table 2.
Total Number of HW Periods and their duration in Summer 2017 (with 95th Percentile and three consecutive days definition).
| Weather Station | Threshold Temperature (°C) (95th Percentile) | Number of HW Periods | Days for HW Periods in Summer 2017 | Days for NHW Periods in Summer 2017 |
|---|---|---|---|---|
| OBS Hill | 29.4 | 2 | 29–31 Jan. | 26–28 Jan. |
| 9–11 Feb. | 13–15 Feb. | |||
| Penrith lakes | 34.7 | 4 | 8–11 Jan. | 4–7 Jan. |
| 16–18 Jan. | 19–21 Jan. | |||
| 4–6 Feb. | 1–3 Feb. | |||
| 9–11 Feb. | 13–15 Feb. |
© 2020 by the authors. Licensee MDPI, Basel, Switzerland. This article is an open access article distributed under the terms and conditions of the Creative Commons Attribution (CC BY) license (http://creativecommons.org/licenses/by/4.0/).
Share and Cite
MDPI and ACS Style
Khan, H.S.; Paolini, R.; Santamouris, M.; Caccetta, P. Exploring the Synergies between Urban Overheating and Heatwaves (HWs) in Western Sydney. Energies 2020, 13, 470. https://doi.org/10.3390/en13020470
AMA Style
Khan HS, Paolini R, Santamouris M, Caccetta P. Exploring the Synergies between Urban Overheating and Heatwaves (HWs) in Western Sydney. Energies. 2020; 13(2):470. https://doi.org/10.3390/en13020470
Chicago/Turabian StyleKhan, Hassan Saeed, Riccardo Paolini, Mattheos Santamouris, and Peter Caccetta. 2020. "Exploring the Synergies between Urban Overheating and Heatwaves (HWs) in Western Sydney" Energies 13, no. 2: 470. https://doi.org/10.3390/en13020470
Note that from the first issue of 2016, this journal uses article numbers instead of page numbers. See further details here.