Comparison between Inflexible and Flexible Charging of Electric Vehicles—A Study from the Perspective of an Aggregator


1
ICT, Instituto Ciências da Terra, Universidade de Évora, 7002-554 Évora, Portugal
2
IDMEC, Instituto Superior Técnico, Universidade de Lisboa, 1049-001 Lisbon, Portugal
3
Departamento de Física, Escola de Ciências e Tecnologia, Universidade de Évora, 7002-554 Évora, Portugal
4
CISE, Electromechatronic Systems Research Centre, Universidade da Beira Interior, 6201-001 Covilhã, Portugal
5
Department of Electrical Engineering and Automation, Instituto Superior de Engenharia de Lisboa, 1959-007 Lisbon, Portugal
*
Author to whom correspondence should be addressed.
Energies 2020, 13(20), 5443; https://doi.org/10.3390/en13205443
Submission received: 22 July 2020
/
Revised: 4 October 2020
/
Accepted: 10 October 2020
/
Published: 19 October 2020
(This article belongs to the Special Issue Distributed Power Generation Scheduling, Modelling and Expansion Planning)
Abstract
:This paper is about the problem of the management of an aggregator of electric vehicles participating in an electricity market environment. The problem consists in the maximization of the expected profit through a formulation given by a stochastic programming problem to consider the uncertainty faced by the aggregator. This uncertainty is due to the day-ahead market prices and the driving requirements of the owners of the vehicles. Depending on the consent of the owners, inflexible charging to flexible charging is considered. Thus, the aggregator can propose different profiles and charging periods to the owners of electric vehicles. Qualitatively, as expected, the more flexible the vehicle owners, the higher the expected profit. The formulation, however, offers more to the aggregator and provides the ability to quantify the influence of consent of favorable driving requirements in the expected profit, allowing the aggregator to consider rewarding the owners of vehicles with more flexibility. Case studies addressed are for comparison of the influence of owners having inflexibility, partial flexibility, or flexibility in the expected profit of the aggregator.
1. Introduction
Energy production has been essentially based on non-renewable sources, i.e., from fossil fuels, resulting in increased anthropogenic gas emissions. Among the sectors of the economy, the transport sector has a weight of about 15% in global emissions [1]. Likewise, the transport sector is responsible for more than 28% of the energy consumed in most countries [2]. To reduce greenhouse gas emissions, electric vehicle adoption has been discussed worldwide [3,4]. The market share of electric vehicles remains low since the higher acquisition cost of electric vehicles compared to conventional vehicles is one of the important barriers to adoption [3]. Policy incentives for the acquisition of electric vehicles include financial incentives and non-financial incentives [3]. Financial incentives include direct purchasing subsidies, and registration/emission/tax fee exemptions, which are the most widely used incentives to lower the high initial purchasing cost [3]. Non-financial incentives are designed for the convenience of electric vehicle owners, including free parking policies, and toll tax exemptions [3]. The power system perceives the integration of a large number of electric vehicles as a threat and the electricity market participants perceive this integration as an opportunity to consider electric vehicles as a new source of energy in the electricity market [5]. Therefore, in the coming years, with the increase in electric vehicles in the power system, aggregating agents tend to play an important role as intermediaries among the owners of electric vehicles, the electricity market, distribution system operators, and transmission system operators [6]. Ref. [7] presents one of the most important works regarding the role of electric vehicle aggregators in electricity markets. The trading of energy in electricity markets is a well-studied subject [8,9,10,11,12,13,14]. Ref. [8] proposes an aggregation platform for wind, photovoltaic, and thermal power in electricity markets. Ref. [9,12] present the stochastic coordination of joint wind and photovoltaic systems in the day-ahead market. Ref. [10] proposes the coordination of wind power, photovoltaic power, and energy storage. Ref. [11] proposes the analysis of the impact of dust on photovoltaic systems in aggregation with wind and thermal power. Ref. [13] presents the self-scheduling and bidding strategies of thermal units with stochastic emission constraints. Ref. [14] proposes the bidding strategy of wind–thermal energy producers.
In recent years, the participation of electric vehicle aggregators in electricity markets has been gaining attention among researchers and market players. Electric vehicles management has been proposed according to two different approaches: considering unidirectional charging [15], i.e., grid-to-vehicle; and considering bidirectional charging [16], vehicle-to-grid (V2G). The development of management systems for the management of electric vehicles in electricity markets is divided into two main groups: group 1 studies electric vehicles as deterministic units [17,18,19], suggesting the absence of uncertain characteristics; group 2 studies electric vehicles as stochastic units [17,18,19,20,21,22,23,24,25], suggesting the consideration of uncertain characteristics. Ref. [17] presents a mechanism to determine the two-way energy storage of a large pool of electric vehicles that can be contracted in the ancillary services market on a long-term basis to provide the regulation up and regulation down to the grid. Ref. [18] proposes an algorithm for an electric vehicle aggregator providing unidirectional V2G regulation. Ref. [20] proposes a bidding strategy for an electric vehicle aggregator that participates in the day-ahead market. The problem is formulated using stochastic robust optimization, considering uncertainty in day-ahead market prices, and driving requirements of electric vehicles. Ref. [21] investigates the application of stochastic dynamic programming to the optimization of charging and frequency regulation capacity bids of an electric vehicle in a smart grid [26,27]. Ref. [22] presents an optimal bidding strategy of an electric vehicle aggregator participating in day-ahead energy and regulation markets using stochastic optimization. Ref. [23] proposes a stochastic optimization model for optimal bidding strategies of electric vehicle aggregators in day-ahead and ancillary services markets with variable wind energy. Ref. [24] proposes the optimal scheduling of plug-in electric vehicle aggregators in the electricity market considering as uncertain parameters market prices, availability of electric vehicles, and status of being called in the reserve market. Ref. [25] proposes a two-stage stochastic optimization problem for optimally coordinated bidding of an electric vehicle in the day-ahead, intra-day and real-time markets. The formulation also includes risk management with the hourly conditional value at risk. Ref. [28] presents the bidding strategy for electric vehicle aggregators participating in the day-ahead market. Ref. [29] proposes the problem of decision making on an electric vehicle aggregator in a competitive market in the presence of different uncertain resources. The problem is formulated using stochastic programming. Ref. [30] proposes a stochastic programming problem for the scheduling of electric vehicle aggregators in the day-ahead market. The main contribution of this paper is the consideration of the level of flexibility of the owners of vehicles. Flexibility is the consent regarding electricity usage for charge/discharge to a practice stated by the aggregator, allowing the aggregator to obtain a higher expected profit than the one in the case of the inflexibility of owners. This contribution allows further improvement in the management of the aggregator and is an extension of the scope of the work in [5] addressing only inflexible owners.
2. Assumptions
This paper considers a set of assumptions: (1) the aggregator is the intermediate entity between the owners of electric vehicles and the electricity market; (2) the parties agree on the inflexibility or flexibility for the electricity usage, so the aggregator is only empowered to carry out operation planning with the owners’ authorization; (3) the aggregator is responsible for the degradation of vehicles when in the process of charging or discharging, in which the cost is paid to the owners of electric vehicles; (4) the owners of electric vehicles pay back to the aggregator the cost of the degradation due to the demand for energy for driving; (5) the owners of electric vehicles are penalized with the respective cost of the degradation of the vehicles, when a violation occurs on the schedule given by aggregator for charge or discharge of energy; (6) the market gives aggregators a premium for the participation of electric vehicles in the electricity market, through a special price in the purchase of energy, in order to stimulate the purchase of electric vehicles and their participation in the electricity market and in a wider energy matrix; (7) through an agreement between the parties, the profit obtained from participation in the electricity market can be divided between the aggregator and the owners of electric vehicles.
3. Problem Formulation
The current wholesale markets do not allow small agents to participate in the market, due to minimal power requirements, for example, in Nord Pool, the minimum bid size in the day-ahead market is 1 MW. So, a single electric vehicle is not allowed to participate in the market, but a fleet of electric vehicles satisfying minimal power requirements can be in a market through an aggregator. The electric vehicles are considered in this paper as non-stationary energy storage devices. The aggregator’s functions are: (1) the management of charges and discharges in periods where the vehicles are available, by agreement with the owners of the vehicles; (2) to be an intermediary agent between the owners of electric vehicles and the electricity market; (3) present profitable offers for the purchase and sale of energy in the day-ahead market; (4) to manage the charges and discharges to reduce the degradation of the batteries of electric vehicles. The aggregator’s main objective in participating in the market is the maximization of profit, subjected to constraints as follows:
Subject to:
In (1), the objective function is the aggregator’s expected profit, with the following terms: (1) revenue from sales offers in the day-ahead market, as a result of electric vehicle discharges, where is the day-ahead market price and is the sale offer/discharge power; (2) cost of purchase offers in the day-ahead market, as a result of charging electric vehicles, where is a V2G tariff to encourage the electric vehicle owners to operate in V2G mode and is the purchase offer/charge power; (3) revenue from the energy consumed by the owners of electric vehicles, where is the price for driving requirements and is the energy consumed for driving requirements; and (4), the cost of battery degradation of electric vehicles given by . In (2), the technical limits of operation are presented for the sale offer/discharge power, where and are the minimum and maximum discharge power, respectively. In (3), the technical limits of operating limits are presented for the purchase offer/charge power, where and are the minimum and maximum charge power, respectively. In (2) and (3), and are the binary variables that model the discharge and charge cycles of electric vehicles, respectively. In (4) and (5), maximum and minimum values of the binary variables are presented, where is the availability parameter of electric vehicles (0/1 parameter). In (6), it is imposed that electric vehicle batteries cannot charge and discharge at the same time. According to the fleet being available, there are two events imposed to be feasible and one event imposed to be feasible for the fleet being unavailable: () is event_1, available for discharge; () is event_2, available for charge; () is event_3, in which discharge or charge is unavailable. In (7), the equation of state of charge of the electric vehicle battery equation is presented, where is the state of charge, is the charge/discharge efficiency and is the maximum capacity of the battery of electric vehicles. In (8), and are the minimum and maximum values of the state of charge variable, respectively. In (9), it is imposed that the offering curves for the sale offer increase monotonically, where is the power discharge of a specific scenario and . In (10), it is imposed that the offering curves for the purchase offer decrease monotonically, where is the power charge of a specific scenario and . Regarding (9) and (10), once the market participants submit their offering curves for sales offers and offering curves for purchase offers, the market operator clears the day-ahead market and publishes the market-clearing price of the day-ahead market and the accepted offers. In (11) and (12), non-anticaptivity constraints are imposed. With these constraints, only one offering curve can be submitted to the day-ahead market for each hour irrespective of the driving requirement realizations. The expression to compute the battery degradation is as follows [31]:
In (13), is the parameter for the relationship of the cost incurred with the reduction in useful life due to charge or discharge of the battery [31] and is the cost of batteries for electric vehicles. The extra cost of degradation incurred by charge or discharge processes due to the aggregator management decisions is paid to the electric vehicle owners. This cost is given by the total cost of degradation minus the cost of degradation incurred by the owner driving requirement since the energy used in driving is the one stored by charging.
4. Uncertainty Modeling
4.1. Scenario Generation
The management of electric vehicles in a market environment involves an increased level of uncertainty due to not only market prices that have some characteristics of volatility, but also to the uncertainty on the behavior of owners of the electric vehicles in what regards the usage of electricity. Thus, the uncertain parameters considered in this paper are the day-ahead market prices, the energy demand for electric vehicles for driving requirements, and the availability of electric vehicles. To incorporate the uncertainty into the stochastic model proposed in this paper, the uncertain parameters are modeled through a set of plausible realizations known to be the scenarios. Energy demand for electric vehicles and the availability of vehicles are modeled at coincident periods and scenarios. The following steps are applied to generate the scenarios: (1) the consideration of the kernel density estimation (KDE), which is a non-parametric method to estimate the probability density function (pdf) of a random variable; (2) from the estimation revealed by KDE, a total of 1000 scenarios are generated. The kernel density estimator is as follows [32]:
In (14) is the sample size, is the bandwidth, and K(.) is the kernel smoothing function.
4.2. Scenario Reduction
The 1000 scenarios generated for each parameter in the previous section are reduced to 10 by applying the K-means scenario reduction technique. The K-means technique identifies clusters of scenarios that show considerable similarity; determining a scenario represents clusters of scenarios while maintaining relevant information for optimal decision-making. The K-means technique is relatively easy to implement, having broad convergence, and can be adapted to larger data sets. The objective function of the K-means technique is as follows [33]:
In (15), is the number of clusters, is a chosen distance measure, and and are data points and centroids belonging to cluster .
5. Case Studies
The case studies are tested using data of day-ahead market prices from the Iberian Electricity Market (MIBEL) [34] and the behavior profiles of drivers in Europe [35]. The time horizon considered is 24 h. The electric vehicle aggregator manages 1000 similar electric vehicles, having a battery capacity of 25 kWh [5]—a common value for Nissan Leaf models. The rated power of the super battery/superload is 25 MWh [5]. This paper assumes that the driving patterns of all electric vehicles are similar. The battery cost in an electric vehicle is 250 €/kWh and the battery modeled for battery degradation has the cost given by Equation (13) with a linear approximated slope of −0.0013 given in [31]. The ratio distance/consumption is assumed to be the same, having a value of 6 km/kWh. The V2G tariff is assumed to be . This V2G tariff should be sufficiently low to encourage the electric vehicle aggregator to participate in electricity markets, covering the operating costs of the electric vehicles and the battery degradation costs. Similar approaches regarding incentives for aggregators are applied in other research works, such as the case of [36] where a price markup is considered. Three case studies are considered: (1) Case 1—Inflexible charging; (2) Case 2—Partially-flexible charging; (3) Case 3—Flexible Charging.
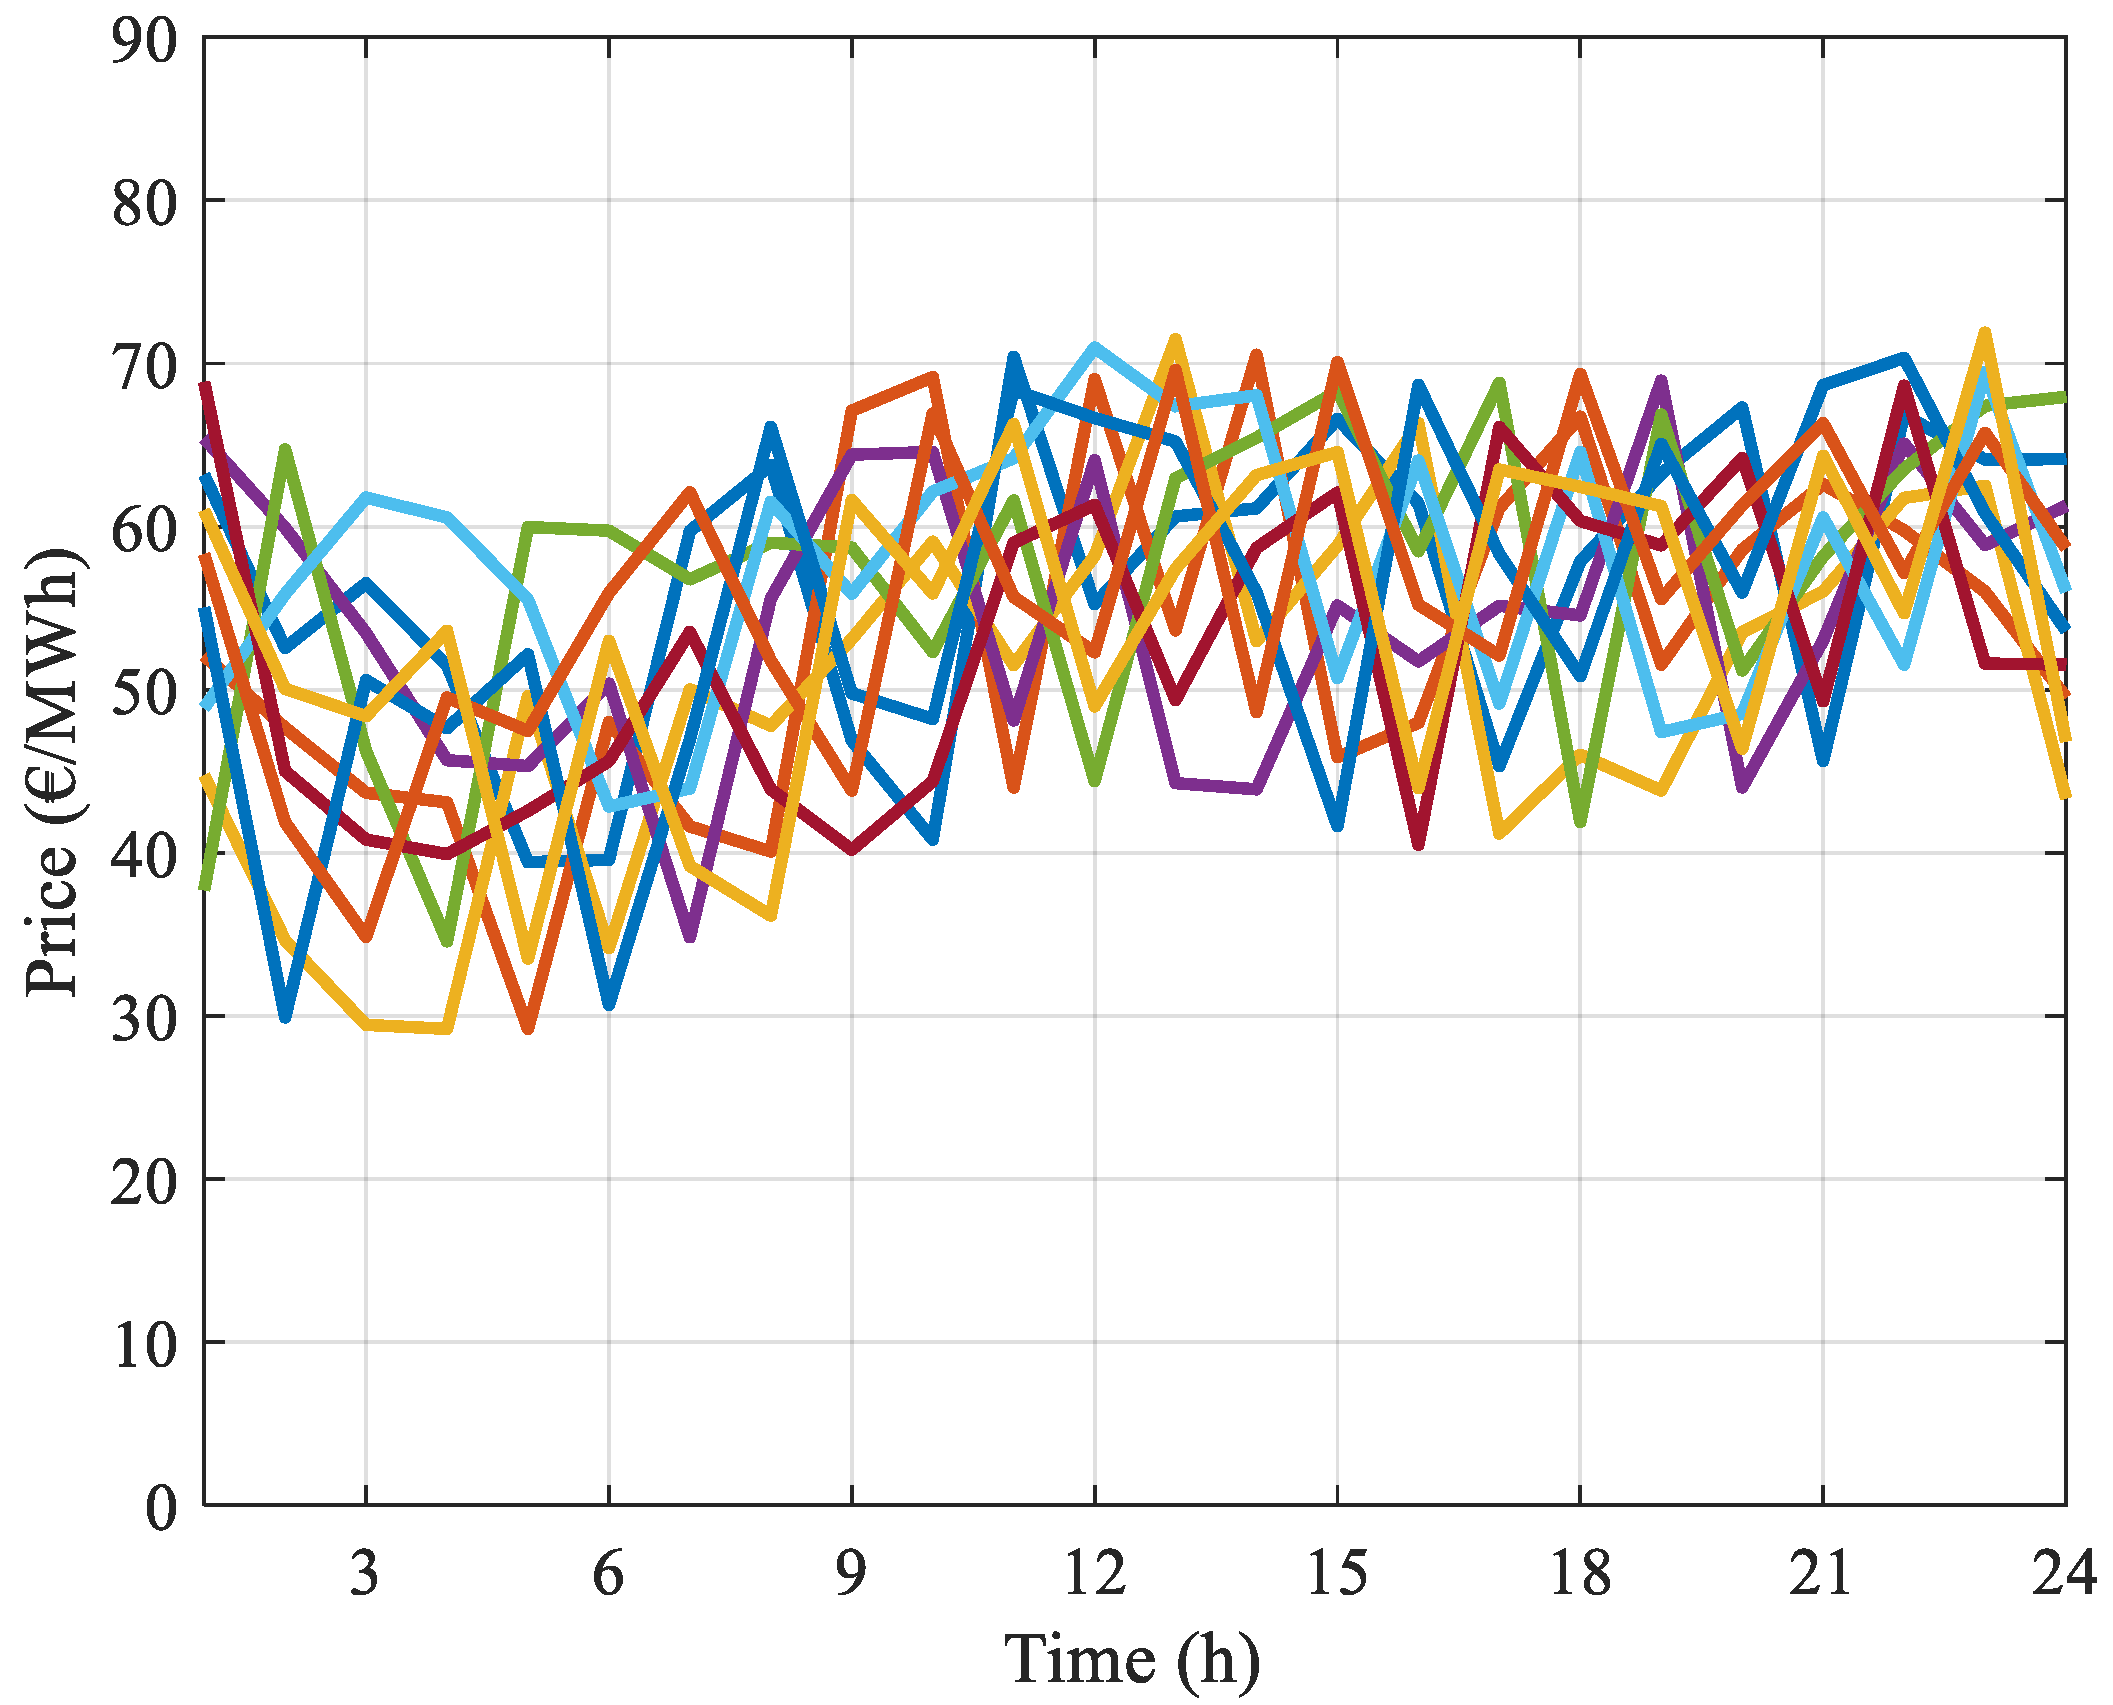
The analysis of the results obtained from the formulation proposed in this paper is on the basis of the offering curves, whether regarding the offering curves for the purchase or sale of energy, typically presented in electricity markets, as is the case in the Iberian Electricity Market. The purpose of the analysis is to confirm that the flexibility of vehicle owners can influence the management of the electric vehicle fleet and to determine how flexibility can improve the aggregator’s profit through the use of the offering curves. The importance of this analysis is its further support for the aggregator to access the market with better levels of rationality when submitting the offers. The scenarios of day-ahead market prices given by the K-means scenario reduction technique are in Figure 1.
Figure 1 shows the typical tendency for the behavior of market prices.
5.1. Case_1—Inflexible
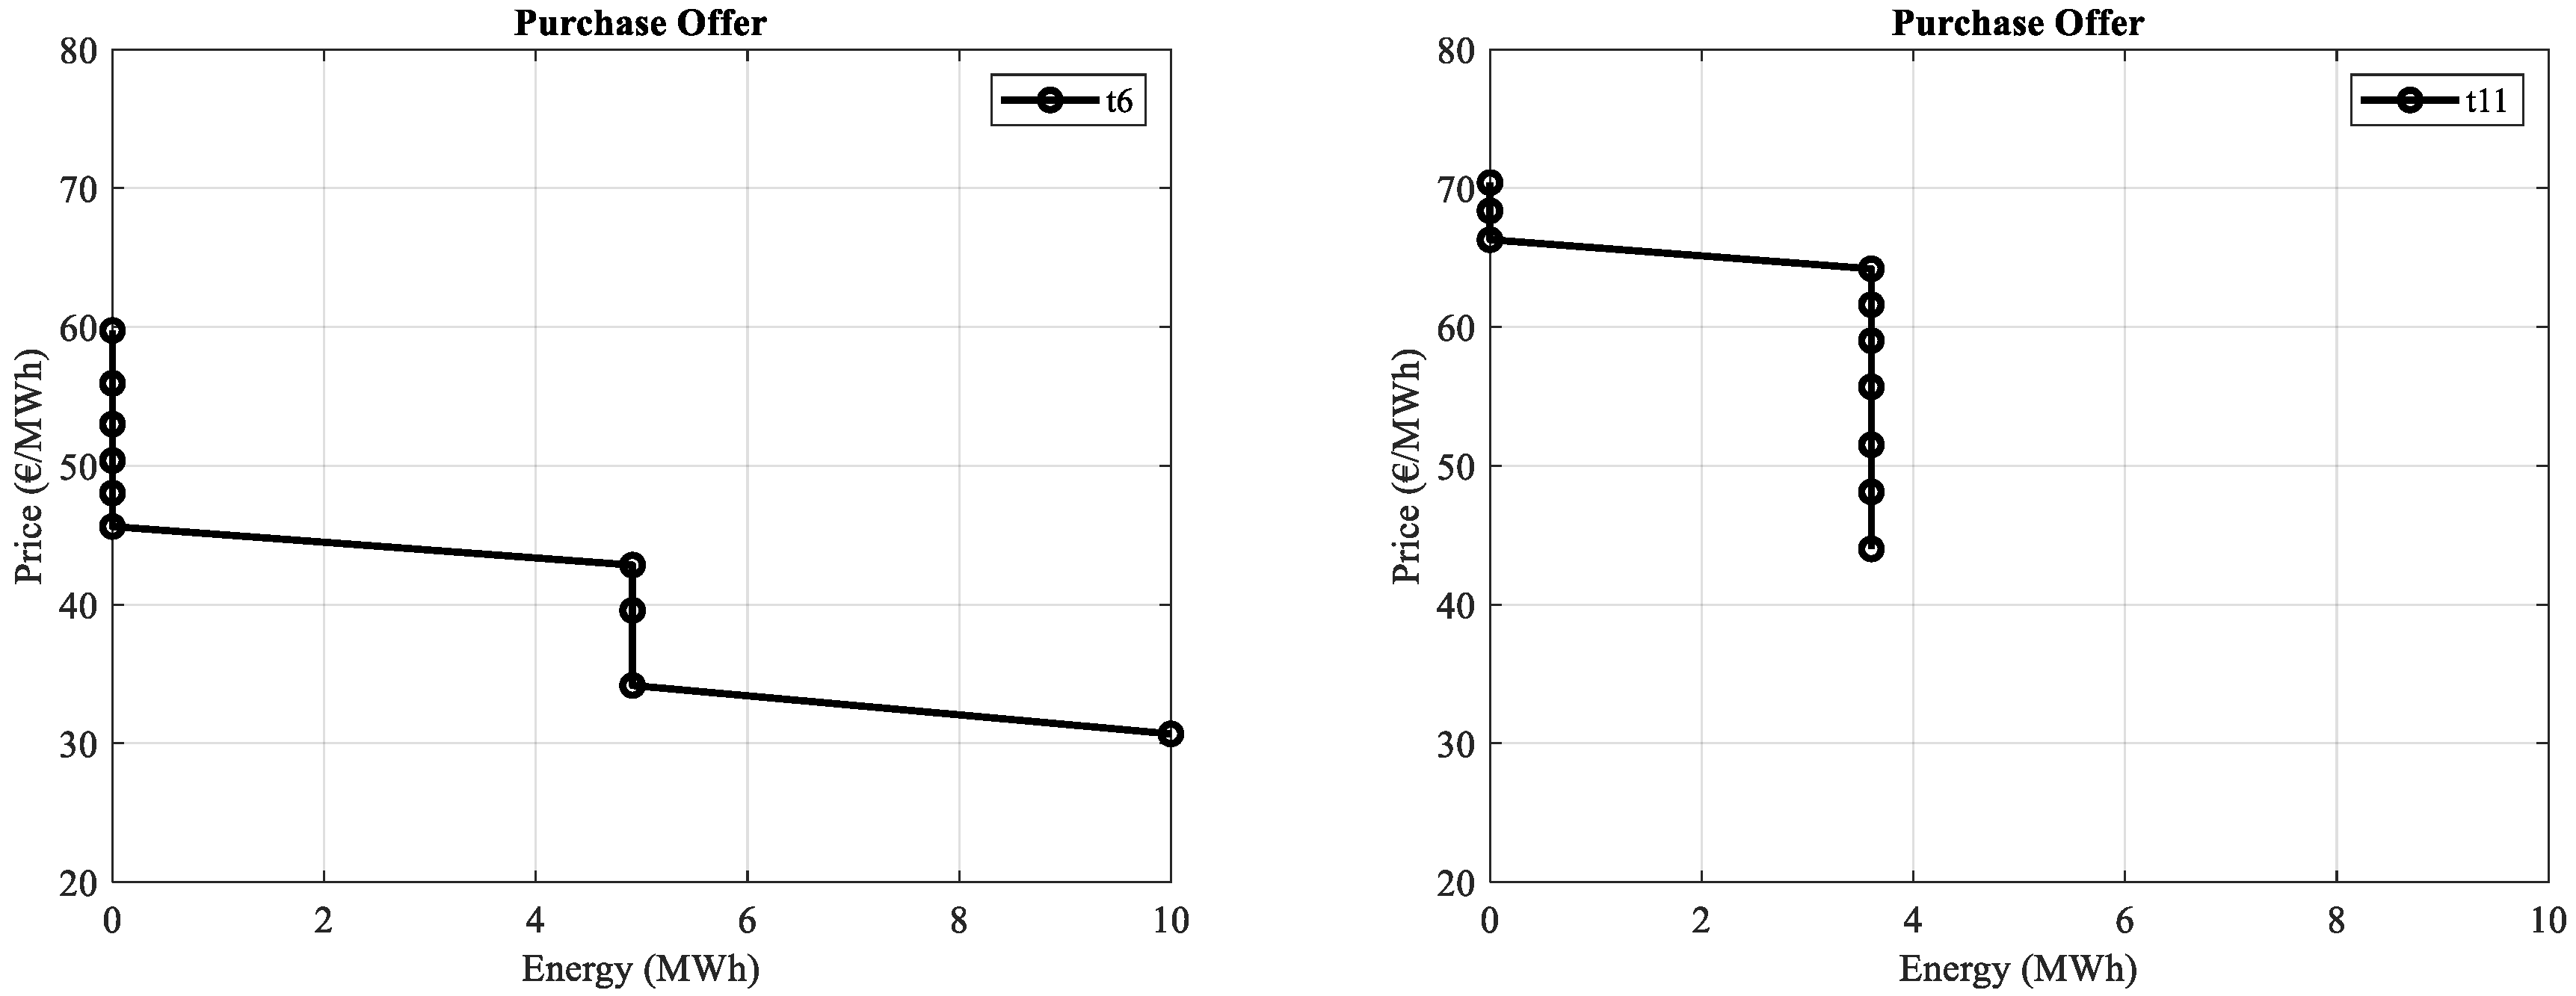
In this case study, the electric vehicle aggregator has no power over the behavior of the vehicle, i.e., owners of vehicles are inflexible. The aggregator has power only when electric vehicles are not moving. Thus, through the communication system between the aggregator and the owners, the latter sends the predictable data on their behavior. The owner of the vehicle has the possibility to send 10 scenarios of driving requirements, according to the data in Appendix A, Table A1. The data show that vehicles between hour 1 and hour 7 are parked. In addition, the data show that the vehicles are, not with certainty, parked in periods of likely high day-ahead market prices, namely, hours 10, 13, and 22, and are explicitly driving in hour 21. Consequently, the vehicles are, not with certainty, able to charge or discharge the batteries in those periods. Based on these data, at the time of decision making, the aggregator defines the optimal values and the times for charging and discharging the electric vehicles, respectively, for purchase offers and sales offers, to present optimal offers in the electricity market. So, the aggregator has no opportunity to present offers in periods that have the potential for economic advantage. Purchase offering and sale curves are in Figure 2 and Figure 3, respectively.
Figure 2 shows the offering curves for purchase offers for hour 6 and hour 11. The offering curves for purchase offers decrease monotonically, as imposed by (10). At hour 6, as the day-ahead market price is one of the lowest, the aggregator takes the opportunity to charge the battery of electric vehicles. However, the aggregator is only willing to buy energy at a price below 45 €/MWh. So, when the price is higher than this value, the offer has a value of 0 MWh. The aggregator is willing to charge the battery of electric vehicles if the purchase price is around 30 €/MWh. At hour 11, as the day-ahead market price is already higher, the aggregator chooses to buy less energy. Thus, the aggregator only buys around 3.5 MWh of energy. To buy this amount of energy, the aggregator is willing to pay a maximum of 65 €/MWh. Above that value, the best option for the aggregator is not to buy energy in the day-ahead market. Figure 3 shows the offering curves for sale offers for hour 12 and hour 24. The offering curve for sale offers increases monotonically, as imposed by (9). At hour 12, one of the periods of the day with the best day-ahead market price, the aggregator is only available to sell energy at a price above 69 €/MWh. Below this value, the offer has a value of 0 MWh. At hour 24, the day-ahead market price is higher than some periods of the time horizon. Then, the aggregator is willing to receive anything between 44 €/MWh and 68 €/MWh for 5.5 MWh of energy. This behavior is the behavior of a perfectly inelastic supply curve. The approach proposed in this paper makes it possible to acquire the offering curves, which allow the aggregator to present bids for offer blocks at the lowest possible price when purchasing energy, and bids for offer blocks at the highest possible price when selling energy. In addition, this approach allows studying strategies to allocate part of the augmented profit among the owners of vehicles, thus allowing for flexibility.
5.2. Case_2—Partially-Flexible
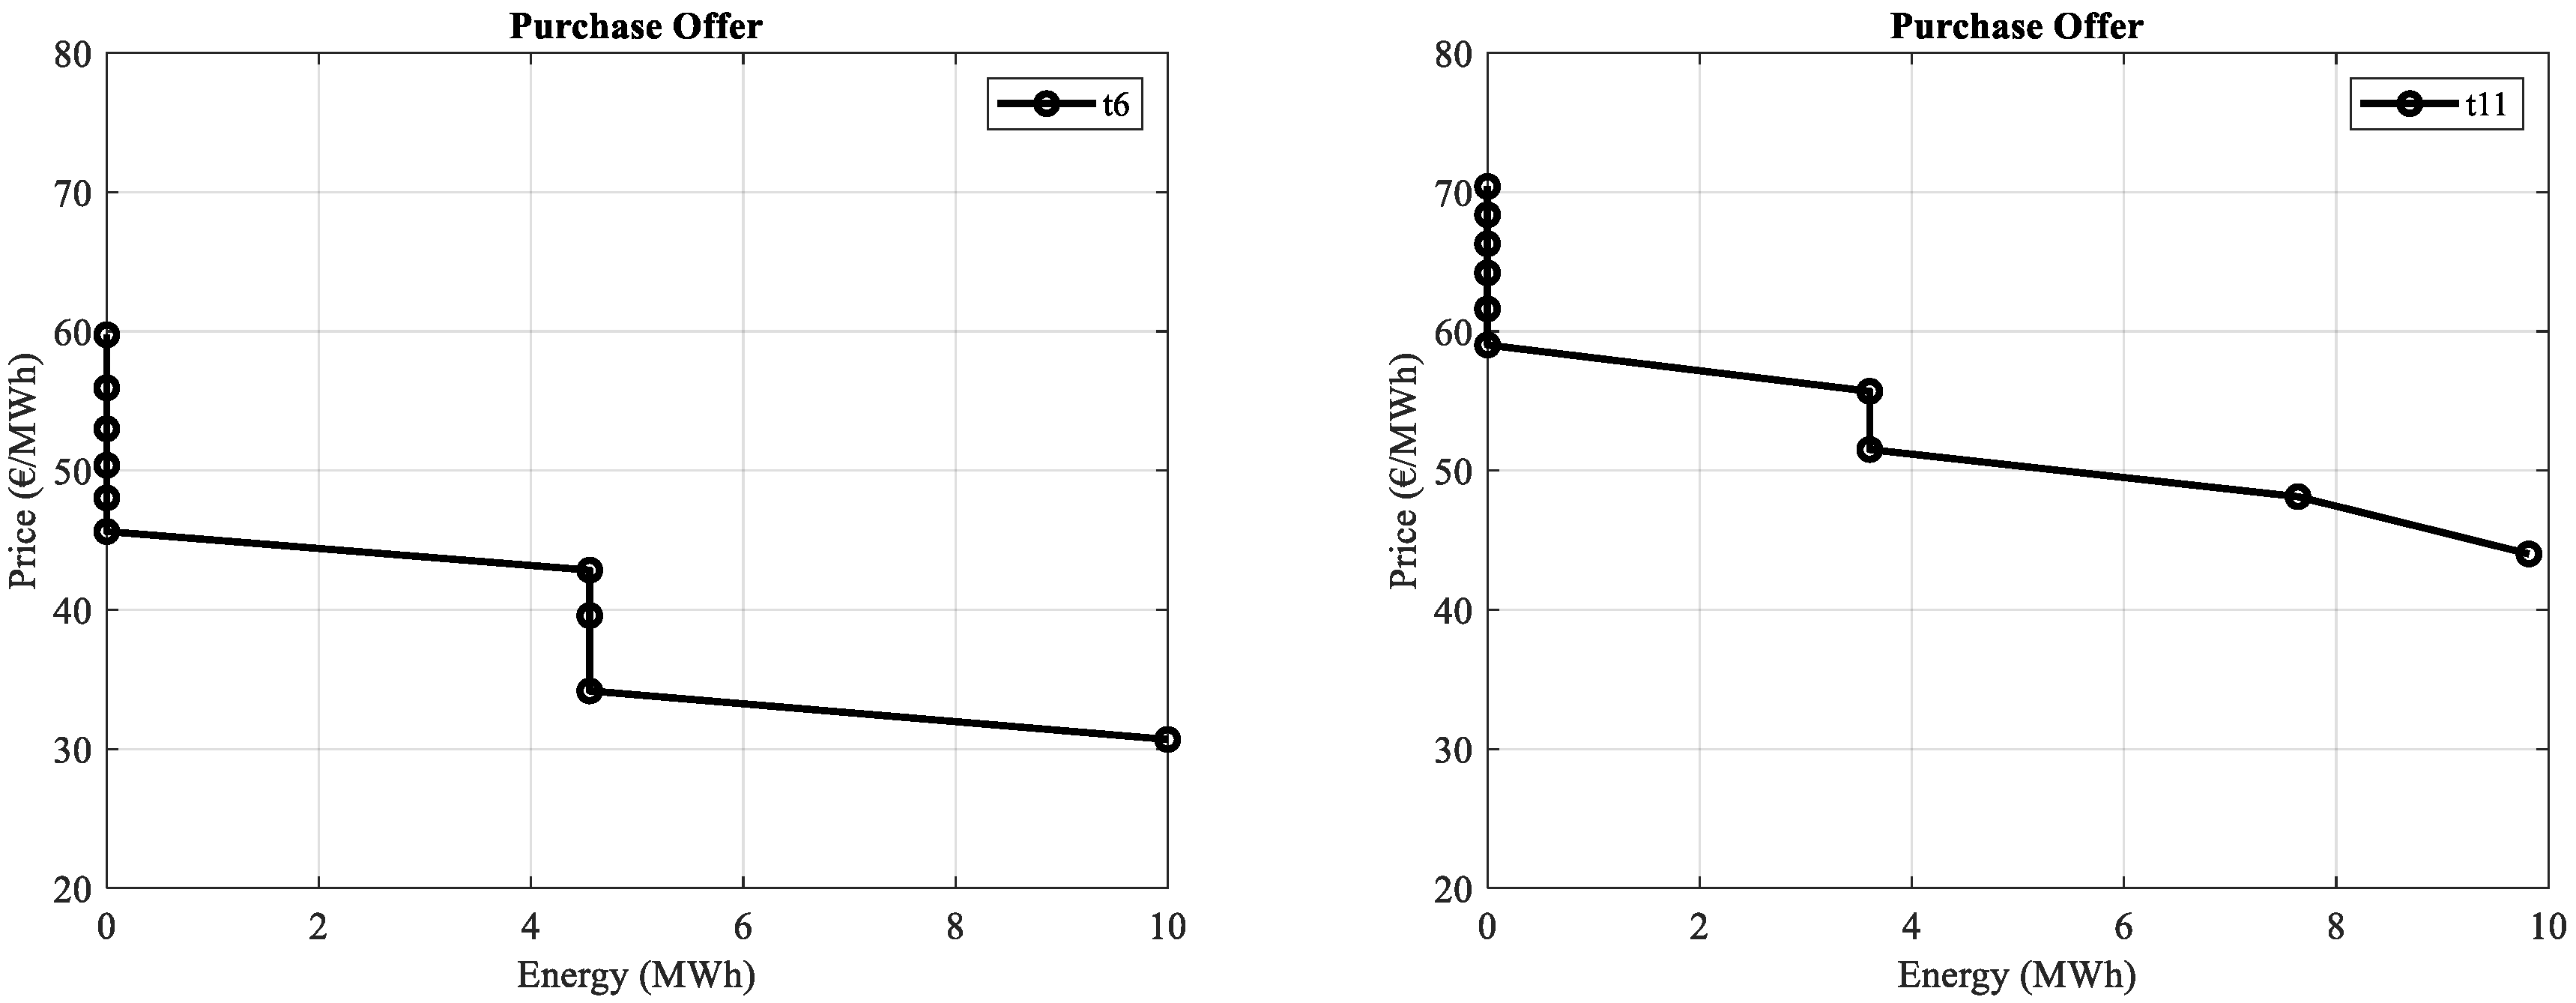
In this case study, the aggregator has power over the behavior of electric vehicle owners in a more extended period. By agreement, the behavior of vehicle owners is less uncertain, and part of the energy is consumed in fewer hours. With the extended period of control over the behavior of vehicles, the aggregator can make better decisions, since periods of better market prices are available to inject energy into the grid and thus improve profit. In this case study, the scenarios of driving requirements and the availabilities of electric vehicles are in accordance with the data in Appendix A, Table A2. The driving hours are just 5 hours per day, giving the aggregator the possibility to implement more profitable decisions without significantly interfering in the routines of vehicle owners. It is worth noting that hours 10, 13, 21, and 22 are flexible hours with high day-ahead market prices. Purchase offering and sale curves are in Figure 4 and Figure 5, respectively.
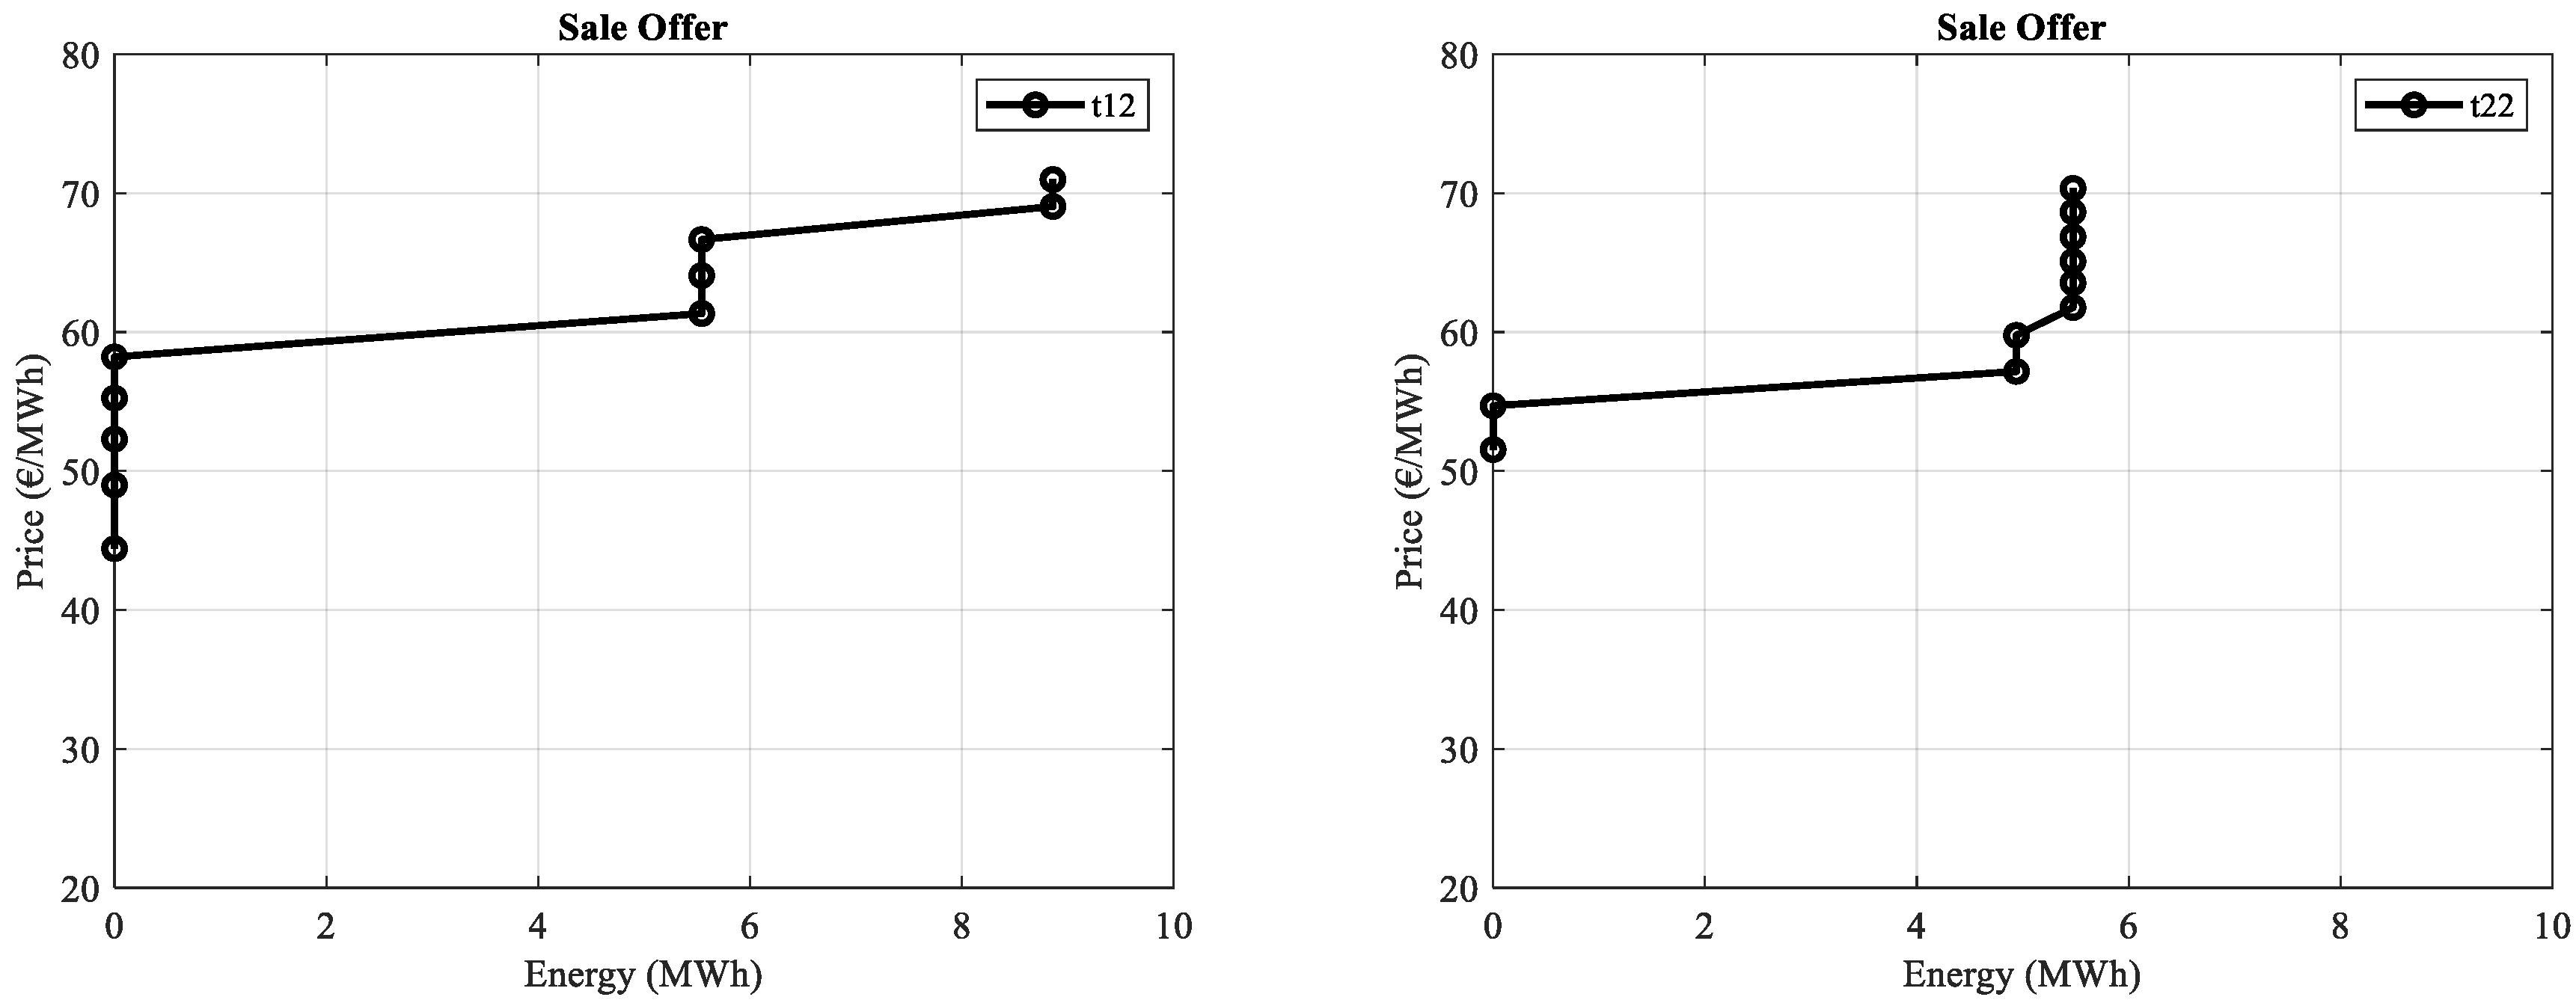
Figure 4 shows that at hour 6, the aggregator is only available to buy energy below 43 €/MWh. Above this value, the offer is 0 MWh. The aggregator is available to buy 4.5 MWh for values between €34 and €43. To buy 10 MWh, the aggregator only accepts at a value of around €31. The offer values for hour 6 of Case 2 are very similar to the values for hour 6 of Case 1. The difference is in the offer of 4.5 MWh, which in Case 1 is 4.9 MWh. At hour 11, the aggregator is only available to buy energy below 56 €/MWh. Above this value, the offer is 0 MWh. The aggregator is available to buy 3.6 MWh for values between €51 and €56. To buy 7.7 MWh and 9.8 MWh, the aggregator only accepts at a value of around €48 and €44, respectively. Compared to hour 11 in Case 1, the aggregator is more demanding, since the aggregator only accepts to trade below €56, while in Case 1 the trade starts from €64. Figure 5 shows that at hour 12, the aggregator is only available to sell energy above 61 €/MWh. Below this value, the offer is 0 MWh. The aggregator is available to sell 5.5 MWh for values between €61 and €66. To sell 8.8 MWh, the aggregator only accepts at a value of around €69. Compared to hour 12 in Case 1, the aggregator starts to trade from €61, while, in Case 1, the aggregator starts to trade from €69. However, for Case 2, starting at €69, the aggregator only negotiates an amount of energy equal to 8.8 MWh. A convenient consent of the owners of vehicles allows the aggregator, by implementing the strategy that yields a higher profit, to consider rewarding the owners in order to encourage further flexibility.
5.3. Case_3—Flexible
In this case study, the aggregator has full power over the batteries of electric vehicles, and the aggregator decides the charging and discharging periods throughout the day, i.e., by assumption, the owners of the electric vehicle do not use the vehicle during the entire time horizon under study. Purchase offering and sale curves are in Figure 6 and Figure 7, respectively.
Figure 6 shows that compared to Case 2, the optimum values suggest that the batteries of electric vehicles be charged at hour 5, an hour with an average market price slightly lower than that of hour 6. Thus, at hour 5, the aggregator is only available to buy energy below 48 €/MWh. Above this value, the offer is 0 MWh. The aggregator is available to buy 10 MWh for values between €29 and €48. Compared to hour 6 in Case 2, the aggregator can buy large quantities of energy at lower prices. At hour 11, the aggregator is only available to buy energy below 56 €/MWh. Above this value, the offer is 0 MWh. Compared to hour 11 in Case 2, the aggregator can buy larger quantities of energy for the same prices. For example, for a price of €44, the aggregator in Case 3 buys 10 MWh, while, in Case 2, the aggregator buys 9.8 MWh, and for a price of €48, the aggregator buys 9.7 MWh in Case 3 and buys 7.6 MWh in Case 2. Figure 7 shows that at hour 13, the aggregator is only available to sell energy above 69.6 €/MWh. Below this value, the offer is 0 MWh. Compared to hour 12 in Case 2, the aggregator can sell larger quantities of energy at better market prices. For example, for a price of €69 at hour 12 of Case 2 and a price of €69.6 for hour 13 of Case 3, the aggregator sells 8.9 MWh and 10 MWh, respectively. Similarly, for a price of €71.5, the aggregator sells 10 MWh, while for €70.9, the aggregator sells only 8.9 MWh at hour 12 of Case 2. Likewise, at hour 23 of Case 3, compared to hour 22 of Case 2, the aggregator can sell larger quantities of energy at better market prices. For example, for a price of €68.6 at hour 12 of Case 2 and a price of €69.5 for hour 23 of Case 3, the aggregator sells 5.47 MWh and 10 MWh, respectively. Similarly, for a price of €71.9, the aggregator sells 10 MWh, while, for €70.3, the aggregator buys only 5.47 MWh at hour 22 of Case 2. The possibility of total control over the batteries allows the aggregator to make better decisions through the knowledge that the aggregator has about the market. The comparison between the cases is in Table 1.
Table 1 shows that although the cost of degradation increases, the expected profit in Case 2 and Case 3 is higher than the expected profit in Case 1. The expected profit for Case 2 is 32% higher than the profit for Case 1, and the expected profit for Case 3 is more than 100% higher than the profit for Case 1. Thus, the formulation developed offers aggregator support for the management of the charge/discharge of electricity in the vehicles to improve the expected profit. With full control over electric vehicles, owners of electric vehicles are expected to receive a higher reward for being compliant with flexibility, allowing the aggregator to have a further economic advantage. Note that the V2G tariff is important for an aggregator in electricity markets due to the high costs of battery degradation. Hence, the aggregator can make a profit only with adequate values of V2G tariffs.
6. Conclusions
Although the conventional power system perceives the integration of electric vehicles as only a further new load to be satisfied in due time, these vehicles are new sources of energy and opportunities for business in the electricity market. Nevertheless, the owners of electric vehicles cannot participate in electricity markets due to conditions of minimal power requirements imposed in these markets. Thus, these owners can only through an aggregator achieve sufficient conditions to participate in those markets. The aggregator is the intermediary entity between vehicle owners and electricity markets submitting blocks of offers to buy and sell energy to the market and wanting the achieve the most profitable operation, subject to operational and technical constraints. However, a set of electric vehicles is a fleet of non-stationary energy storage devices not necessarily under the total control of the aggregator. The aggregator is only able to manage charge/discharge of the energy storage devices in periods of consent by the owners of the vehicles. This consent is upon agreement with the owners and, in general, must take into consideration the cost due to the incurred degradation of the energy storage devices due to extra usage. So, a support decision for the fleet of vehicles is a crucial aid to the most favorable management regarding participation in the market, and this paper is a contribution in this regard. The support decision for the fleet of vehicles proposed is a formulation based in a mathematical programming problem written as a maximization of the expected profit in a stochastic programming framework, considering the uncertainty in day-ahead market prices and the driving requirements of electric vehicles.
The consent of owners is the level of flexibility regarding electricity usage for charge/discharge to a practice stated by the aggregator, allowing the aggregator to have some control, which is an opportunity to achieve a higher expected profit than the one in the case of inflexibility. As expected, the assumed level of flexibility accepted by the owners has repercussions in the aggregator management, as shown by a comparison of the addressed case studies assuming that the owners are inflexible, partially inflexible, or flexible.
The application proposed in this paper offers the aggregator support for the management of the charge/discharge of electricity in the vehicles to improve the expected profit. Quantitively identifying the augmented profit is a result of having the flexibility stated by the owners to allow the schedule of charge/discharge of vehicles by the aggregator and allowing for simulating the studies of strategies of persuasion for further consent.
Author Contributions
I.G., R.M. and V.M. conceived the formulation, performed the simulations, analyzed the simulation results, and wrote the paper. All authors have read and agreed to the published version of the manuscript.
Funding
This research received no external funding.
Acknowledgments
This work is funded by Bolsas Camões, IP/Millennium BCP Foundation and funded by: European Union through the European Regional Development Fund, included in the COMPETE 2020 (Operational Program Competitiveness and Internationalization); Foundation for Science and Technology (FCT) under the ICT (Institute of Earth Sciences) project UIDB/04683/2020; Portuguese Funds through the Foundation for Science and Technology (FCT) under the LAETA project UIDB/50022/2020; Portuguese Foundation for Science and Technology (FCT) under the CISE Projects UIDB/04131/2020 and UIDP/04131/2020.
Conflicts of Interest
The authors declare no conflict of interest.
List of Symbols
| index of scenarios | |
| index of periods | |
| day-ahead market price | |
| V2G tariff to encourage the electric vehicle owners to operate in the vehicle to grid mode | |
| price for driving requirements | |
| binary variable modeling discharge cycles | |
| binary variable modeling charge cycles | |
| binary parameter for input status of electric vehicles | |
| discharge efficiency of batteries of electric vehicles | |
| charge efficiency of batteries of electric vehicles | |
| driving requirements of electric vehicles | |
| capacity of battery of electric vehicles | |
| discharge power of electric vehicles/sale offer | |
| charge power of electric vehicles/purchase offer | |
| / | minimum/maximum discharge power |
| / | minimum/maximum charge power |
| state of charge of electric vehicles | |
| / | minimum/maximum state of charge |
| cost of battery degradation | |
| cost of batteries of electric vehicles | |
| linear approximated slope of battery life as a function of the number of cycles |
Appendix A
The following tables only show the driving requirements at hours of the day that have a line of non-null values; in hours not shown, the values are null for all scenarios.

Table A1.
Scenarios of driving requirements () of the fleet of electric vehicles for Case_1.
| Hour\Scenario | 1 | 2 | 3 | 4 | 5 | 6 | 7 | 8 | 9 | 10 |
|---|---|---|---|---|---|---|---|---|---|---|
| 8 | 2.083 | 1.185 | 1.909 | 1.340 | 1.468 | 1.994 | 2.165 | 1.694 | 1.587 | 1.808 |
| 9 | 1.339 | 2.492 | 1.863 | 2.221 | 1.982 | 1.594 | 2.373 | 1.732 | 2.101 | 1.472 |
| 10 | 0.000 | 1.998 | 1.399 | 0.000 | 1.036 | 1.646 | 0.000 | 0.000 | 1.839 | 1.922 |
| 13 | 2.661 | 0.000 | 1.033 | 1.859 | 2.540 | 0.000 | 2.139 | 0.000 | 2.369 | 1.486 |
| 14 | 2.482 | 0.000 | 0.000 | 1.715 | 2.827 | 2.186 | 0.000 | 1.271 | 0.000 | 2.708 |
| 19 | 0.000 | 2.497 | 1.298 | 2.330 | 2.027 | 0.000 | 1.723 | 0.000 | 0.000 | 0.000 |
| 20 | 2.723 | 1.109 | 1.863 | 2.263 | 3.130 | 2.065 | 2.927 | 1.626 | 1.397 | 2.495 |
| 21 | 2.321 | 1.558 | 1.800 | 2.221 | 1.707 | 2.103 | 1.628 | 1.906 | 1.997 | 1.490 |
| 22 | 2.992 | 0.000 | 2.562 | 0.000 | 2.073 | 1.664 | 0.000 | 1.324 | 2.838 | 0.000 |
Table A2.
Scenarios of driving requirements () of the fleet of electric vehicles for Case_2.
| Hour\Scenario | 1 | 2 | 3 | 4 | 5 | 6 | 7 | 8 | 9 | 10 |
|---|---|---|---|---|---|---|---|---|---|---|
| 8 | 2.083 | 1.185 | 1.909 | 1.340 | 1.468 | 1.994 | 2.165 | 1.694 | 1.587 | 1.808 |
| 9 | 1.339 | 4.490 | 3.262 | 2.221 | 3.018 | 3.240 | 2.373 | 1.732 | 3.940 | 3.393 |
| 14 | 5.143 | 0.000 | 1.033 | 3.574 | 5.367 | 2.186 | 2.139 | 1.271 | 2.369 | 4.194 |
| 19 | 2.321 | 4.055 | 3.098 | 4.551 | 3.734 | 2.103 | 3.351 | 1.906 | 1.997 | 1.490 |
| 20 | 5.715 | 1.109 | 4.425 | 2.263 | 5.203 | 3.729 | 2.927 | 2.951 | 4.235 | 2.495 |
References
- Organization for Economic Co-Operation and Development. OECD: Reducing Transport Greenhouse Emissions: Trends & Data; International Transport Forum: Leipzig, Germany, 2010. [Google Scholar]
- Lane, B.W.; Dumortier, J.; Carley, S.; Siddiki, S.; Clark, K.-S.; Graham, J.D. All plug-in electric vehicles are not the same: Predictors of preference for a plug-in hybrid versus a battery electric vehicle. Transp. Res. Part D Transp. Environ. 2018, 65, 1–13. [Google Scholar] [CrossRef] [Green Version]
- Yao, J.; Xiong, S.; Ma, X. Comparative analysis of national policies for electric vehicle uptake using econometric models. Energies 2020, 13, 3604. [Google Scholar] [CrossRef]
- Chen, L.; Zhang, Y.; Figueiredo, A. Spatio-temporal model for evaluating demand response potential of electric vehicles in power-traffic network. Energies 2019, 12, 1981. [Google Scholar] [CrossRef] [Green Version]
- Gomes, I.L.R.; Melicio, R.; Mendes, V.M.F. Electric vehicles aggregation in market environment: A stochastic grid-to-vehicle and V2G management. In Technological Innovation for Industry and Service Systems; Springer: Cham, Switzerland, 2019; pp. 343–352. [Google Scholar]
- Lopes, J.P.; Soares, F.J.; Almeida, P.M.R. Integration of electric vehicles in electric power system. Proc. IEEE 2011, 99, 168–183. [Google Scholar] [CrossRef] [Green Version]
- Bessa, R.J.; Matos, M.A. The role of an aggregator agent for EV in the electricity market. In Proceedings of the 7th Mediterranean Conference and Exhibition on Power Generation, Transmission, Distribution and Energy Conversion (MedPower 2010), Agia Napa, Cyprus, 7–10 November 2010; pp. 1–9. [Google Scholar]
- Gomes, I.L.R.; Pousinho, H.M.I.; Melicio, R.; Mendes, V.M.F. Aggregation platform for wind-pv-thermal technology in electricity market. In Proceedings of the International Symposium on Power Electronics, Electrical Drives, Automation and Motion, Amalfi, Italy, 20–22 June 2018; pp. 799–804. [Google Scholar]
- Gomes, I.L.R.; Pousinho, H.M.I.; Melicio, R.; Mendes, V.M.F. Stochastic coordination of joint wind and photovoltaic systems with energy storage in day-ahead market. Energy 2017, 124, 310–320. [Google Scholar] [CrossRef]
- Gomes, I.L.R.; Melicio, R.; Mendes, V.M.F. Decision making for sustainable aggregation of clean energy in day-ahead market: Uncertainty and risk. Renew. Energy 2019, 133, 692–720. [Google Scholar] [CrossRef]
- Gomes, I.L.R.; Melicio, R.; Mendes, V.M.F. Dust Effect impact on PV in an aggregation with wind and thermal powers. Sustain. Energy Grids Netw. 2020, 22, 100359. [Google Scholar] [CrossRef]
- Gomes, I.L.R.; Pousinho, H.M.I.; Melicio, R.; Mendes, V.M.F. Bidding and optimization strategies for wind power-pv systems in electricity markets assisted by CPS. Energy Procedia 2016, 106, 111–121. [Google Scholar] [CrossRef]
- Laia, R.; Pousinho, H.M.I.; Melicio, R.; Mendes, V.M.F. Self-scheduling and bidding strategies of thermal units with stochastic emission constraints. Energy Convers. Manag. 2015, 89, 975–984. [Google Scholar] [CrossRef]
- Laia, R.; Pousinho, H.M.I.; Melicio, R.; Mendes, V.M.F. Bidding strategy of wind-thernal energy producers. Renew. Energy 2016, 99, 673–681. [Google Scholar] [CrossRef] [Green Version]
- Vandael, S.; Claessens, B.; Hommelberg, M.; Holvoet, T.; Deconinck, G. A scalable three-step approach for demand side management of plug-in hybrid vehicles. IEEE Trans. Smart Grid 2013, 4, 720–728. [Google Scholar] [CrossRef]
- Vaya, P.; Baringo, L.; Krause, T.; Andersson, G.; Almeida, P.; Geth, F.; Rapoport, S. EV aggregation models for different charging scenarios. In Proceedings of the 23rd International Conference on Electricity, Lyon, France, 15–18 June 2015; pp. 1–5. [Google Scholar]
- Jain, P.; Das, A.; Jain, T. Aggregated electric vehicle resource modeling for regulation services commitment in power grid. Sustain. Cities Soc. 2019, 45, 439–450. [Google Scholar] [CrossRef]
- Sortome, E.; Sharkavi, M.A.-E. Optimal charging strategies for unidirectional V2G. IEEE Trans. Smart Grid 2011, 2, 131–138. [Google Scholar] [CrossRef]
- Naharudinsyah, I.; Limmer, S. Optimal charging of electric vehicles with trading on the intraday electricity market. Energies 2018, 11, 1416. [Google Scholar] [CrossRef] [Green Version]
- Baringo, L.; Amaro, R.S. A stochastic robust optimization approach for the bidding strategy of an electric vehicle aggregator. Electr. Power Syst. Res. 2017, 146, 362–370. [Google Scholar] [CrossRef] [Green Version]
- Donadee, J.; Ilic, M.D. Stochastic optimization of grid to vehicle frequency regulation capacity bids. IEEE Trans. Smart Grid 2014, 5, 1061–1069. [Google Scholar] [CrossRef]
- Vagropoulos, S.I.; Bakirtzis, A.G. Optimal bidding strategy for electric vehicle aggregators in electricity markets. IEEE Trans. Power Syst. 2013, 28, 4031–4041. [Google Scholar] [CrossRef]
- Wu, H.; Shahidehpour, M.; Alabdulwahab, A.; Absusorrach, A. A game theoric approach to risk-based optimal bidding strategies for electric vehicle aggregators in electricity markets with variable wind energy resources. IEEE Trans. Sustain. Energy 2016, 7, 374–385. [Google Scholar] [CrossRef]
- Manijeh, A.; Mohammadi, B.-I.; Moradi, M.-D.; Zare, K. Stochastic scheduling of aggregators of plug-in electric vehicles for participation in energy and ancillary service markets. Energy 2017, 118, 1168–1179. [Google Scholar]
- Vardanyan, Y.; Madsen, H. Optimal coordinated bidding of a profit maximizing, risk-averse EV aggregator in three-settlement markets under uncertainty. Energies 2019, 12, 1755. [Google Scholar] [CrossRef] [Green Version]
- Batista, N.C.; Melicio, R.; Matias, J.C.O.; Catalão, J.P.S. ZigBee standard in the creation of wireless networks for advanced metering infrastructures. In Proceedings of the 16th IEEE Mediterranean Electrotechnical Conference (MELECON’2012), Medina Yasmine Hammamet, Tunisia, 10 May 2012; pp. 220–223. [Google Scholar]
- Batista, N.C.; Melicio, R.; Mendes, V.M.F. Services enabler architecture for smart grid and smart living services providers under industry 4.0. Energy Build. 2017, 141, 16–27. [Google Scholar] [CrossRef] [Green Version]
- Guo, Y.; Liu, W.; Wen, F.; Salam, A.; Mao, J.; Li, L. Bidding strategy for aggregators of electric vehicles in day-ahead electricity markets. Energies 2017, 10, 144. [Google Scholar] [CrossRef]
- Rashidizadeh-Kermani, H.; Najafi, H.R.; Anvari-Moghaddam, A.; Guerrero, J.M. Optimal decision-making strategy of an electric vehicle in short-term electricity markets. Energies 2018, 11, 2413. [Google Scholar] [CrossRef] [Green Version]
- Aliasghari, P.; Mohammadi-Ivatloo, B.; Abapour, M.; Ahmadian, A.; Elkamel, A. Goal programming application for contract pricing of electric vehicle aggregator in join day-ahead market. Energies 2020, 13, 1771. [Google Scholar] [CrossRef] [Green Version]
- Sarker, M.R.; Dvorkin, Y.; Ortega, M.A.-V. Optimal participation of an electric vehicle aggregator in day-ahead energy and reserve markets. IEEE Trans. Syst. 2016, 31, 3506–3515. [Google Scholar] [CrossRef]
- Martinez, W.L.; Martinez, A.R. Computational Statistics Handbook with MATLAB, 3rd ed.; CRC Press: Boca Raton, FL, USA, 2016. [Google Scholar]
- Viegas, J.L.; Vieira, S.M.; Melicio, R.; Mendes, V.M.F.; Sousa, J.M.C. Classification of new electricity costumers based on surveys and smart metering data. Energy 2016, 107, 804–817. [Google Scholar] [CrossRef]
- REE-Red Elétrica de España. Available online: https://www.esios.ree.es/es (accessed on 9 March 2020).
- Pasaoglu, G.; Fiorello, D.; Martino, A.; Scarcella, G.; Alemanno, A.; Zubaryeva, A.; Thiel, C. Driving and Parking Patterns of European Car Drivers—A Mobility Survey; European Commission Joint Research Centre: Luxembourg, 2012. [Google Scholar]
- Ortega-Vazquez, M.A.; Bouffard, F.; Silva, V. Electric Vehicle Aggregator/System Operator Coordination for Charging Scheduling and Services Procurement. IEEE Trans. Power Syst. 2013, 28, 1806–1815. [Google Scholar] [CrossRef]
Figure 1.
Scenarios of day-ahead market prices.

Figure 2.
Purchase offering curves: left, hour 6; right, hour 11.

Figure 3.
Sale offering curves: left, hour 12; right, hour 24.

Figure 4.
Purchase offering curves: left, hour 6; right, hour 11.

Figure 5.
Sale offering curves: left, hour 12; right, hour 22.

Figure 6.
Purchase offering curves: left, hour 5; right, hour 11.

Figure 7.
Sale offering curves: left, hour 13; right, hour 23.

Table 1.
Comparison between Case 1, Case 2, and Case 3.
| Expected Profit (€) | Degradation Cost (€) | |
|---|---|---|
| Case 1 | 504 | 254 |
| Case 2 | 666 | 333 |
| Case 3 | 1153 | 487 |
Publisher’s Note: MDPI stays neutral with regard to jurisdictional claims in published maps and institutional affiliations. |
© 2020 by the authors. Licensee MDPI, Basel, Switzerland. This article is an open access article distributed under the terms and conditions of the Creative Commons Attribution (CC BY) license (http://creativecommons.org/licenses/by/4.0/).
Share and Cite
MDPI and ACS Style
Gomes, I.; Melicio, R.; Mendes, V. Comparison between Inflexible and Flexible Charging of Electric Vehicles—A Study from the Perspective of an Aggregator. Energies 2020, 13, 5443. https://doi.org/10.3390/en13205443
AMA Style
Gomes I, Melicio R, Mendes V. Comparison between Inflexible and Flexible Charging of Electric Vehicles—A Study from the Perspective of an Aggregator. Energies. 2020; 13(20):5443. https://doi.org/10.3390/en13205443
Chicago/Turabian StyleGomes, Isaias, Rui Melicio, and Victor Mendes. 2020. "Comparison between Inflexible and Flexible Charging of Electric Vehicles—A Study from the Perspective of an Aggregator" Energies 13, no. 20: 5443. https://doi.org/10.3390/en13205443
Note that from the first issue of 2016, this journal uses article numbers instead of page numbers. See further details here.