A Systematic Literature Review of Reverse Logistics of End-of-Life Vehicles: Bibliometric Analysis and Research Trend


1
School of Automobile and Traffic Engineering, Jiangsu University, Zhenjiang 212013, China
2
School of Management, Jiangsu University, Zhenjiang 212013, China
*
Author to whom correspondence should be addressed.
Energies 2020, 13(21), 5586; https://doi.org/10.3390/en13215586
Submission received: 8 October 2020
/
Revised: 23 October 2020
/
Accepted: 23 October 2020
/
Published: 26 October 2020
(This article belongs to the Special Issue Materials Recycling and Energy Use of Waste)
Abstract
:Under the background of the prompt development of the global economy and continuous improvement of environmental protection awareness, end-of-life vehicles (ELVs), as an essential part of “urban mineral”, have the substantial economic, resource, and environmental value. The research on reverse logistics of ELVs has developed rapidly, but the existing relevant reviews are based on unique research perspectives and do not fully understand the whole field. This work aims to help comprehend the research status of reverse logistics of ELVs, excavate and understand the critical publications, and reveal the main research topics in the past 20 years. Based on 299 articles published in ISI Web of Science Core Collection (WOSCC) database from 2000 to 2019, this paper uses the methodologies of literature bibliometrics and content analysis, combined with VOS viewer, CiteSpace, and Bibexcel software. Besides, the literature quantity and cited situation, core journals, distribution of countries and regions, institutions, core authors, subject categories, and keywords information are analyzed to determine the primary trends and future research hot spots focus on reverse logistics of ELVs.
1. Introduction
With the continuous improvement of environmental protection awareness in various countries and the recognition of recyclable and valuable material resources in waste products, reverse logistics has been widely used worldwide. Stock [1] first proposed the definition of reverse logistics in his research report to the Council of Logistics Management in US. He believed that reverse logistics refers to all issues related to logistics activities, including waste disposal, recycling, substitution, and management of hazardous materials. This definition directly combines waste management and reverse logistics activities and reflects the changes in understanding the circulation mode of end-of-life (EOL) products.
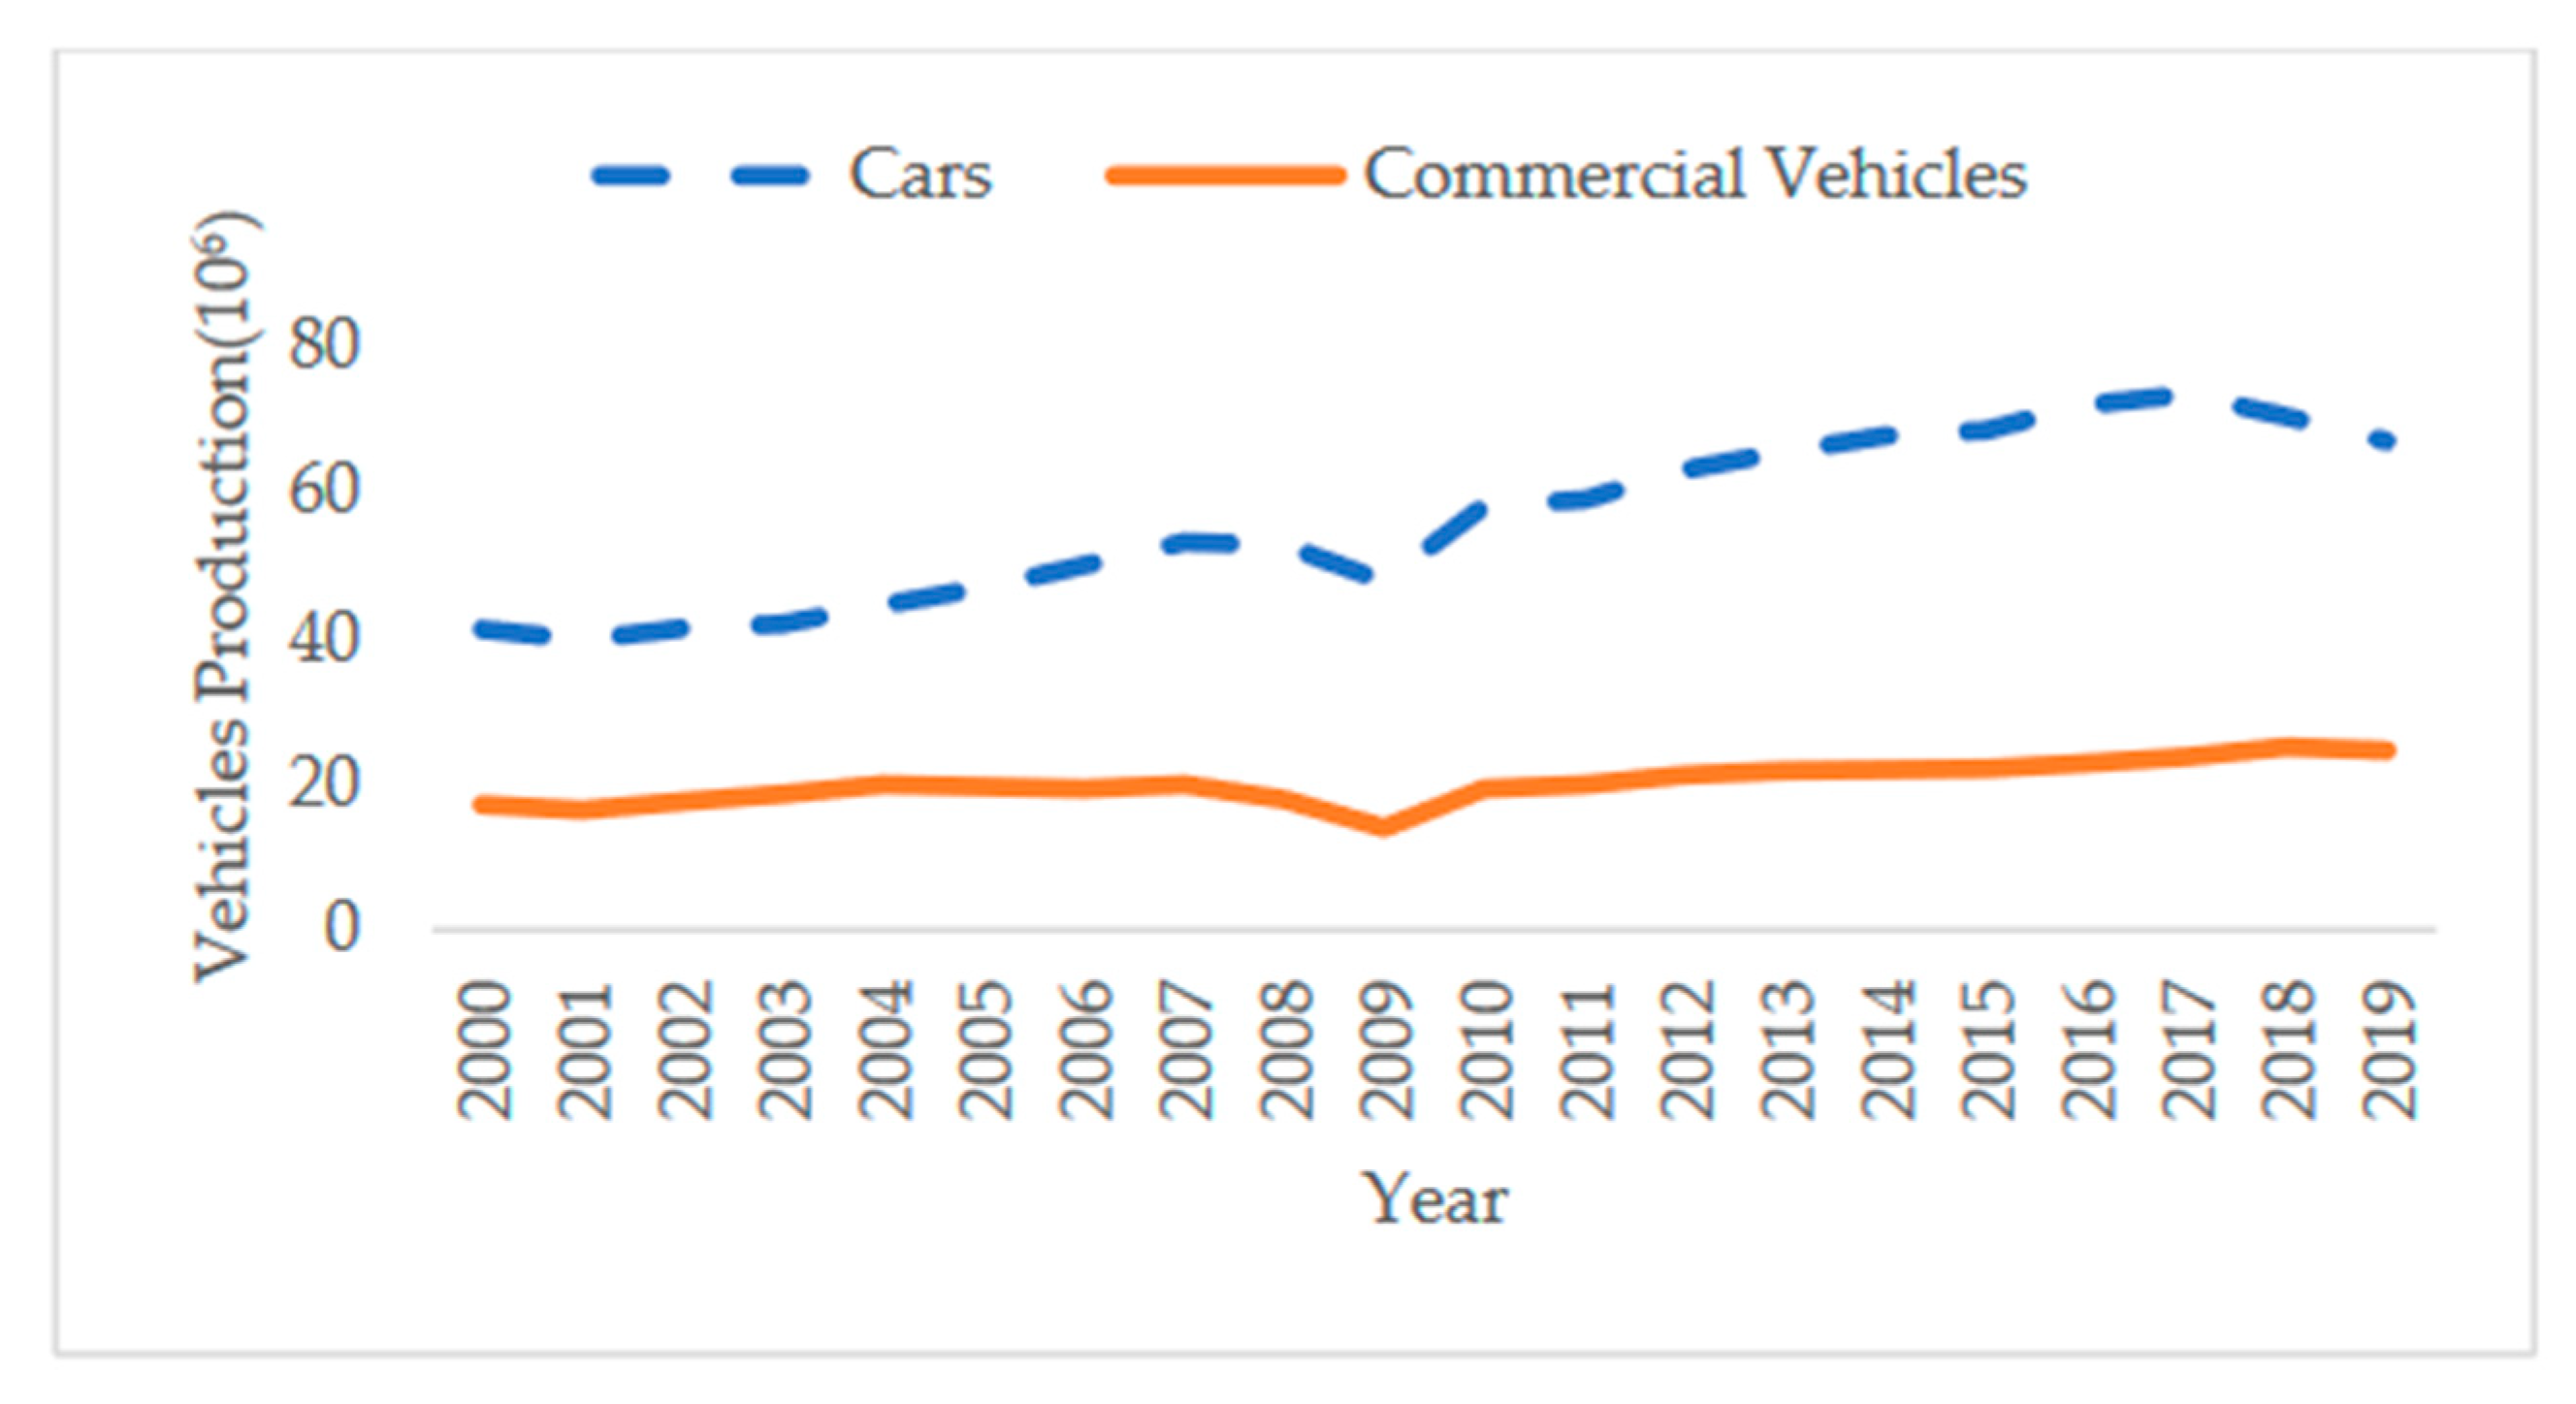
Waste management currently plays a crucial role in solving environmental problems. Besides, the increasing number of end-of-life vehicles (ELVs) has become an important part of waste [2], caused by the rapid growth of global vehicle production, as shown in Figure 1. ELVs refer to the vehicles discarded by the registered owner as a waste, which has solid or liquid high pollution materials such as heavy metal, EOL circuit board, battery, and engine oil. It will cause environmental pollution if people dispose of ELVs at will [3]. Besides, ELVs will cause many occupations, especially land resources, if they are placed at will. Each year in Europe, waste generated by ELVs amounts to 8–9 million tons [4]. At present, the waste generated by the automobile industry, whether it comes from vehicles or the manufacturers, accounts for about 5% of the world’s industrial waste [5]. Meanwhile, the recovery and reuse of ELVs’ parts and metal recovery are beneficial to manufacturers, suppliers, disassemblers, vehicle recycling centers, and even the governments. Currently, ELVs have become the main waste stream in the EU since they have been identified as a priority waste stream in the early 1990s [6,7]. Besides, some researchers use life cycle assessment (LCA) to evaluate the environmental sustainability of ELVs, proving that reverse logistics of ELVs is beneficial to environmental protection. For example, research by Smith and Keoleian [8] demonstrated that every engine remanufacturing could save 68–83% of energy and reduce 73–87% of carbon dioxide emissions.
The European Union implemented the ELVs directive (2000/53/EC) in 2000 to improve the reuse and the recyclability of ELVs components, reduce waste from ELVs, and protect the environment. The ELVs’ directive requires that, from 1 January 2015, the recovery rate should be more than 95%, of which the maximum energy recovery rate is 10%, and in the automobile manufacturing process, the proportion of reusable and recyclable materials needs to reach 85%. For example, higher recovery quantity and revenue levels can be achieved through joint pricing and manufacturing decisions by stakeholders [9]. Thus recoveries are higher than 85% for any device version of a regular vehicle today [10]. Consequently, reverse logistics of ELVs can not only contribute to environmental protection and natural resource conservation but also promote economic growth. However, the management of ELVs recycling process is sophisticated, and methods in different aspects are required to recycle and reuse materials. Kuşakcı et al. [11] proposed a structure of a reverse logistics network for ELVs, as shown in Figure 2.
Through a literature search, Table 1 introduces 10 recent review papers on ELV reverse logistics, including their focus, period and the number of collected literature. The latest literature review is “recovery of resources from end-of-life passenger cars in the information sector in India” written by Sharma and Pandey [12] in 2020, which focuses on the treatment of ELVs in India. It highlighted the informal setting of the industry through case studies and quantified its potential in promoting resource efficiency in India. Besides, Karagoz et al. [13] used the content analysis method to classify and analyze 232 articles in the field of ELVs management. Rosa and Terzi [14] compared ELVs and WEEE waste streams from multiple perspectives through structured literature analysis, proving the potential commonness and current differences. Cucchiella et al. [15] provided a mini-review on the automotive electronics recycling topic. Buekens and Zhou [16] reviewed the characteristics of the actual automobile shredder residue (ASR) and its contribution to the separation and recovery of plastics. Gan and He [17] reviewed the current situation and countermeasures of ELVs recycling, the selection of recycling mode, the reverse logistics system and the network. Zhang and Chen [18] compared regulations and technologies related to plastic recycling of ELVs in China and developed countries, discussed the existing problems, and put forward suggestions. Simic [2] reviewed the environmental engineering problems of ELVs recycling through a content analysis of the collected literature. Go et al. [19] reviewed the related work of disassembly evaluation methods. Nourreddine [20] provided an overview of several ASR treatment processes.
Given the above, these reviews lay a particular emphasis on the study of ELVs reverse logistics from a unique perspective, such as regulations, management, disassembly, processing technology, parts or material recycling, etc., and do not include all the research on ELVs reverse logistics, nor provide a comprehensive understanding of this field. Moreover, with a growing number of papers on ELVs reverse logistics, the above review methods cannot find out the relationship between published literature and the performance of related publications. They are also unable to visually reflect the historical trend of literary works. Besides, the existing reviews cannot reveal the interaction between researchers, which contributes to visualizing the interrelation of intelligence. Keywords can identify the research topics and hotspots of an article. However, the current reviews mainly focus on the content analysis of relevant literature, and the methods used cannot analyze the keywords. Therefore, this paper will explore the statistical analysis in the field of keywords, trying to find the current research hotspot.
Bibliometrics can be used to analyze the relationship between journals quantitatively. Bibliometric analysis shows the knowledge status and research trend of the exploration field by reviewing a large number of academic literature. The bibliometric method can also describe the cooperation between countries, the citation relationship between authors and the knowledge structure of the research field. Simultaneously, network analysis can help study the interrelationships between different items through different network nodes, which can help access the influence and importance of a node. Therefore, we need to combine bibliometrics and social network analysis to show the complicated relationship between literature and state cooperation in research.
However, there are few literature reviews on the analysis of ELVs reverse logistics from both qualitative and quantitative perspectives. Additionally, none of the researchers combined the complex network analysis and bibliometric analysis to systematically and deeply analyze the relationship between the publications of ELVs reverse logistics. Therefore, it is incredibly necessary and essential to use the network analysis method to study the related literature of ELVs reverse logistics. Consequently, this research attempts to fill this gap. In general, this paper aims to determine the research focus of ELVs reverse logistics through bibliometric analysis, and provide help for researchers in further research and analysis. This paper has the following main objectives: (1) evaluating the progress and trends of research on ELVs reverse logistics recent years; (2) revealing the relationship of academic cooperation, distribution of countries/regions, the characteristics of journals, core authors, subject categories and institutions; (3) conducting the mutual citation of literature and listing the distribution of keywords to elaborate the intellectual structure and find research hot points; and (4) providing potential research directions with sustainability for future studies.
The remaining part of the paper is organized as follows. After this introduction, the research methodologies are provided in Section 2. Section 3 presents the research findings and analysis. Section 4 discusses the research emphasis and future direction. Eventually, related conclusions are summarized in Section 5.
2. Research Methodologies
2.1. Bibliometrics and Content Analysis
Bibliometric analysis, widely used in different fields, uses mathematical statistics to quantitatively analyze the relationship between research books and other media, evaluate research trends, and look for innovative perspectives [21]. Statistical analysis of journals, authors, countries, institutions, and subject categories plays a significant role in researchers’ quick grasp of development and critical information of literature. Besides, citation analysis can dig out important information on influential papers, authors, and journals, and help to comprehend the growth of contributions in a specific scientific domain [22]. Co-citation analysis is defined as the frequency of two articles cited together by other articles [23]. Researchers can not only find the internal relationship in the documents but also determine the core citations/publications and major knowledge groups through co-citation analysis. Content analysis can identify current hot spots by the characteristic of the keyword co-occurrence, which is different from citation analysis. Network analysis, complicated in technology and used in many disciplines, adopted graphical and visualization to explain and analyze the relationship between units more intuitively. Network analysis based on the assumption of the importance of connections (edges) between nodes [24] can measure the degree of the center of nodes to evaluate the importance and impact of nodes. So, the complex network analysis was adopted in this paper to analyze the academic cooperation between different journals, countries, and authors.
This paper used the method combined with bibliometric and content analysis to review the literature related to reverse logistics of ELVs, which can dig the characteristics of the literature content more deeply and help researchers evaluate research trends and present innovative perspectives based on rapidly grasping of the general information and development situation of the literature quantitatively.
2.2. Tools
Bibexcel can carry out fundamental bibliometric analysis, citation analysis, co-occurrence, co-citation, bibliographic coupling and cluster analysis for bibliographic data downloaded from Web of Science or Scopus, and provide bibliographic data for visualization software such as VOS viewer, CiteSpace, and Gephi for further analysis. VOS (visualization of similarities) viewer can be used to generate a variety of maps based on bibliometric relationships, such as co-citation diagrams of authors or journals, and co-occurrence diagrams of keywords. Compared with other visualization software, its main feature is that the graphical presentation is rich and distinct, making the analysis results of bibliometrics easy to explain. The methodologies used are the fruchterman reingold layout and modularity algorithms.
In the fruchterman reingold layout, all nodes are regarded as electrons, and each node receives two forces: (1). Coulomb force (repulsive force) of other nodes and (2). Hooker force (attractive force) of edge to point. Then, under the interaction of forces, the whole layout will eventually become a state of balance. The formulas are as follows [25]:
where , , , , , and represents the attractive force, repulsive force, the distance between two vertices, the optimal distance between two points, and the width and length of the frame respectively. C is the constant.
The modular algorithm aims to divide the network into several communities by maximizing the module gain DQ in iterative calculation [26]. The formula of the modularity gain DQ is:
where , , , , and represents the sum of weights of the links, the sum of the weights connected from to node, the sum of the weights of the links associated with node , the sum of all link weights in the network respectively [27].
2.3. Data Sources and Processing
ISI Web of Science network (WOS) has become the primary citation data source for its high reputation and recognition in the scientific community [28]. The data for this paper was obtained from the ISI Web of Science Core Collection (WOSCC), which is an interdisciplinary and influential database covering proceedings, books, and journals on arts, humanities, social sciences, and natural sciences. As shown in Figure 3, we started the search process with the keywords “reverse logistics”, “closed-loop supply chain”, “recycl*”, “recovery”, “collect*”, and “end-of-life vehicle*” by searching in topic (including the article title, abstract, keywords, and keywords plus). "*" represents any character group, including null characters. Article was selected in the document type option to clarify the data type for further analysis. Finally, a total of 299 documents were selected as total publications, with a data span of 2000–2019.
3. Results and Analysis
3.1. Overview of the Publication Performance
The evolution of the annual number of publications (ANP) between 2000 and 2019 is shown in Figure 4. Although the ANP appeared in a trough period from 2008 to 2011, it showed an upward trend overall. In particular, it accounted for 70% of the total in the recent 10 years. From the current trend, it can be predicted that the ANP related to the reverse logistics of ELVs will continue to proliferate, which indicates an increasing number of researchers will pay attention to the field. This study aims to explore the impact and development of reverse logistics of ELVs by analyzing popular journals, representative countries, influential authors, and topic distribution.
3.1.1. Primary Analysis of Influential Journals
There were 102 journals in the total published papers related to reverse logistics of ELVs in the 2000–2019 period, manifesting the multifarious of publication and broad interests in such a field accounting from multiple perspectives. Table 2 highlights the top ten most famous journals, which accounted for 52.84% of the investigated publication. According to the Law of Bradford in Bibliometrics, the number of papers published in the core region, the related region, and the nonrelated region were equal, and the number of journals in the three regions was 1:n:n2, respectively. The Journal of Cleaner Production (34) is the most popular journal, followed by Waste Management (32) and Resources Conservation and Recycling (25). The total number of articles in the three journals accounted for 30.95%, so that they could be considered as the core journals of reverse logistics research of ELVs.
The impact factor (IF) is an internationally accepted journal evaluation index [29]. The h-index takes into account both the citation impact and productivity of the author’s publications, and aiming to quantify the research results of researchers as independent individuals [30]. IF in Table 1 were extracted from the JCR published in 2019. During the 2000–2019 period, the Journal of Cleaner Production, with the most articles published, 855 citations, and the highest h-index (31), was the most predominant journal among all the journals. Interestingly, the IF of Environmental Science & Technology (7.864) was the highest, while its total publications and h-index was far lower than that of Journal of Cleaner Production. It indicates that its primary influence was not in the field of ELV reverse logistics.
The journals co-citation developed based on co-citation analysis that refers to the literature of two journals is cited by other academic journals at the same time, and the number of other journals is the strength of journals co-citation [31]. The journals co-citation can organically link numerous journals without external connection to describe the similarity of topics, reveal the interdependence and cross-relationship among journals, judge the professional scope of some journals and help to determine the core journals of disciplines. As shown in Figure 5, only the journals whose co-citation strength exceeds 60 are put into the co-citation analysis. The size of the node and the width of the line represent the number of citation and co-citation, respectively. The same color of the cited journals indicated that they had similar research directions.
3.1.2. Primary Analysis of Influential Countries/Regions
From 2000 to 2019, a total of 42 countries have publications related to the reverse logistics of ELVs. Figure 6 reveals 11 countries/regions that have published more than 10 papers, of which China (45, 15.31%) published the most papers, followed by Japan (41, 13.95%) and Germany (22, 7.48%), which is consistent with their highly developed automobile industry. The h-index of a country means that at most h papers have been cited for at least h times, which can accurately reflect the academic achievements of a country. Besides, these three countries also had high h-index (China, 12; Japan, 12; Germany, 10), which shows they attach importance to the domain of reverse logistics of ELVs, and promote the development and application of research in this domain. It is worth mentioning that the h-index of the UK (13) is the highest, followed by Italy (12) and the Netherlands (12), while their number of publications is relatively small. It indicates that the papers published in these three countries are of high quality, especially in the Netherlands, where 12 of the 14 articles published have been cited more than 12 times.
The literature coupling of various countries has been studied, as shown in Figure 7. The number of articles affects the size of the nodes, the width of the line indicates the strength of the relationship between countries, and the color of the node indicates the time when the field was studied initially. As can be seen from the image, Japan coauthored the most articles with China, Italy, Serbia and Germany. Similarly, the node representing Japan was located in the center of the image, with the strongest connection strength, indicating that Japan is the most active country. In addition, the largest node representing China was located near the center and had carried out more cooperation with Japan, Italy, Serbia, and England, which also shows China’s enthusiasm for academic cooperation. In terms of research time, Germany, the United States, and the Netherlands were the first countries to start research in the domain of reverse logistics of ELVs. Although China had the most significant number of academic papers, the research time was relatively short, which shows that Chinese scholars attached great importance to this domain in recent years.
3.1.3. Primary Analysis of Influential Institution
Through the screening of the first author organization, 145 different research institutions were found, nearly half of the total number of publications, indicating the breadth and interdisciplinary nature of the research in this field of reverse logistics of ELVs. The 10 most essential institutions to promote the development are shown in Table 3, of which 9 were universities. Interestingly, they all came from six countries, which happened to publish the largest number of articles in the world. Besides, half of the institutions came from Japan, showing the great interest of Japanese research institutions in this field. Shanghai Jiao Tong University, located in China, ranked the first, with 18 publications published, primarily due to influential experts such as Chen Ming. University of Belgrade and Tohoku University, coming from Serbia and Japan respectively, ranked the second and third productive organization. It is interesting to note that in Figure 6, Serbia had 14 articles, while the University of Belgrade had 14, which indicates that this institution had a leading position in Serbia. Besides, University of Bologna, Delft University of Technology, and Yonsei University rank in the top three on citations by paper (CP), indicating that they had the highest average level of papers. Interestingly, most of the top 10 institutions were from China and Japan, which were not only the two most productive countries in Figure 6 but also the two countries with the most outstanding academic cooperation in Figure 7.
3.1.4. Primary Analysis of Influential Authors
Table 4 highlights the 10 most influential authors. The h-index of Simic (10) was the highest in this domain, followed by Chen (8) and Reuter (8), but Simic was inferior to Chen in terms of total publications and total citations, thus Chen was the most influential author of an individual analysis. Chen, based at Shanghai Jiang Tong University, published 16 articles related to the reverse logistics of ELVs.
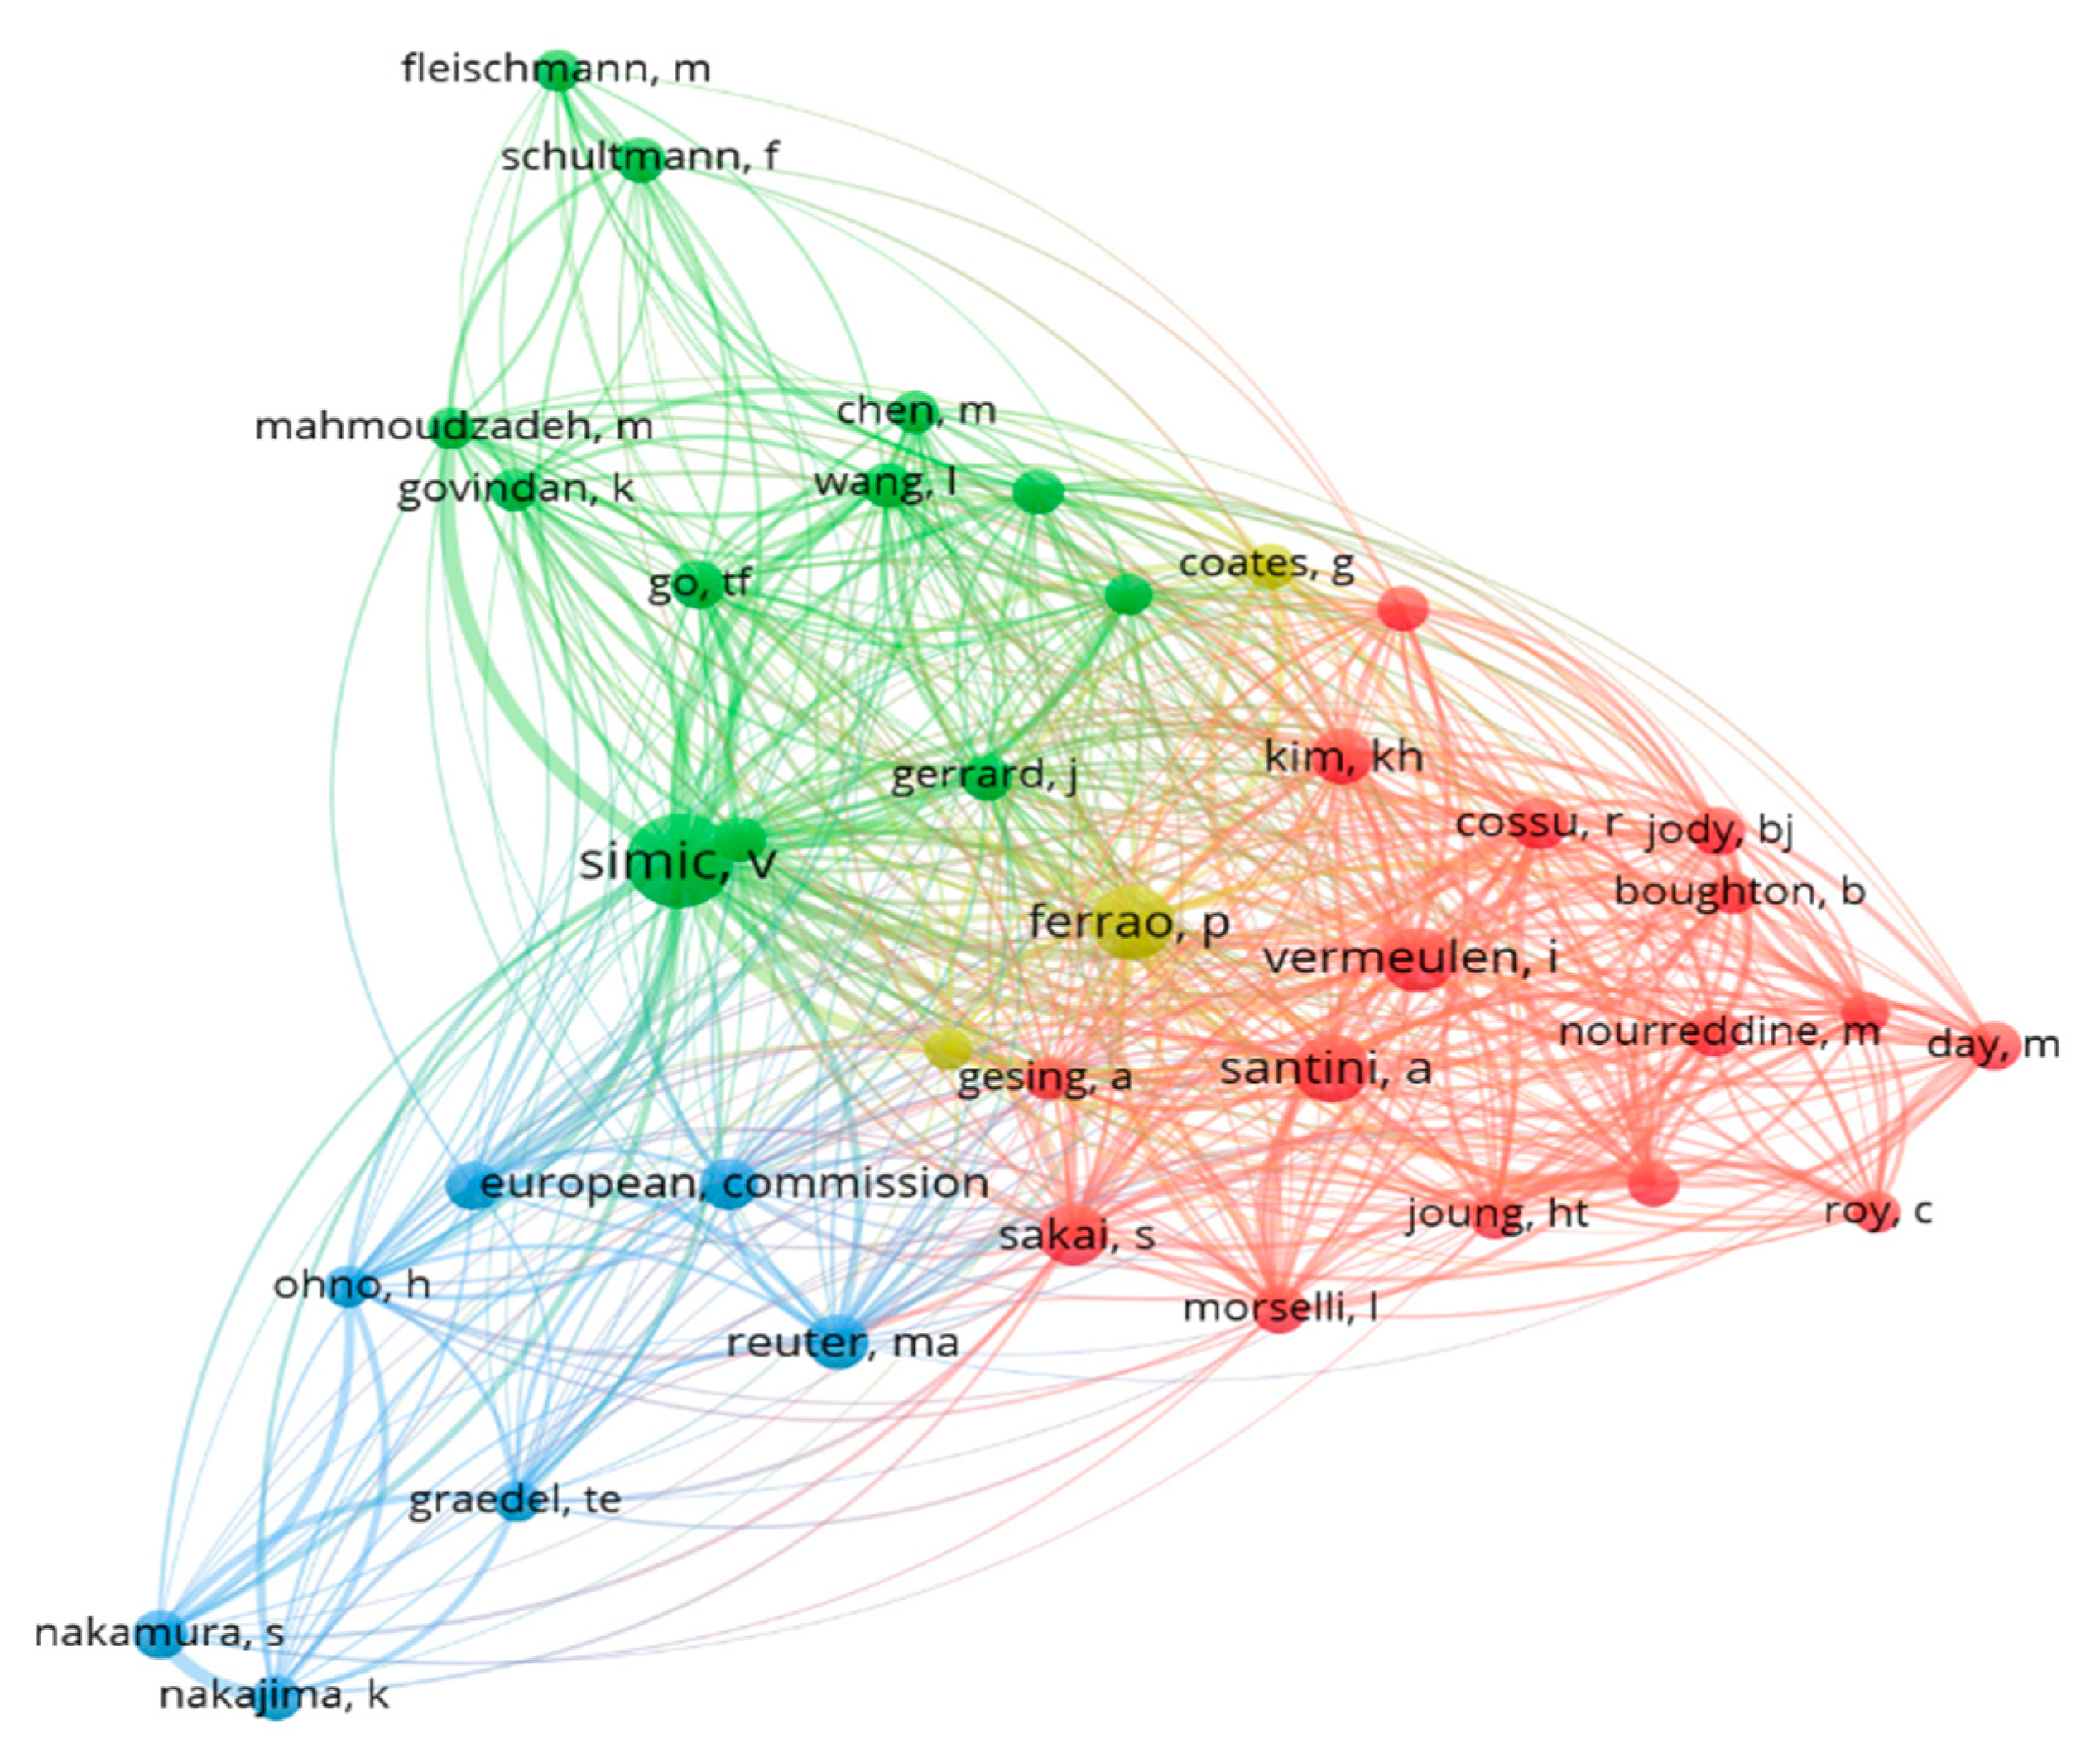
Author co-citation refers to that at least one article of two authors’ works appears in the same reference list, identifying the influential authors and their associations [32,33]. Considering the first author only and at least 20 citations for each author, Figure 8 shows the co-citation of authors through different clusters reported by distinct colors and the linkages among them. The node represents the author, and its size represents the number of papers published by the author. If the nodes have the same color or close distance, they are similar in research directions, forming a cluster. In addition, the co-citation relationship is represented by a link between two nodes. Thus, the most frequently cited author was Simic, who was closely related to Gerrard, Go, etc., forming a green cluster. Secondly, Santini was closely related to Vermeulen, Sakai, etc., forming a red ethnic group. The blue group was composed of Reuter, Nakamura, Graedel, and others.
3.1.5. Analysis of Subject Categories
Figure 9 reveals that these 299 publications contained 32 subject categories according to WOS, of which the most common topic category was Engineering (32%), followed by Environmental Science Ecology (29%).
3.2. Research Themes
3.2.1. The Top 10 Frequently Cited Articles
Highly cited articles are regarded as indicators of top performance and scientific excellence, which means the higher the citation frequency, the more significant the influence of the articles. Table 5 shows the information of the top 10 frequently cited articles in the domain of reverse logistics of ELVs in the 2000–2019 period. Accurately, the European Journal of Operational Research and Waste Management published two articles, respectively, while the other articles were published by different journals. In summary, the three most highly cited articles focused on the modeling approach, including vehicle routing planning [34], a life cycle assessment [35], and a location problem [36]. Moreover, the other seven articles mainly discussed the policy and management [37,38,39,40], and the solid plastic recycling on the ELVs [41] and the disposal and recycling of automotive shredder residue [20,42].
3.2.2. The Most Frequently Used Keywords
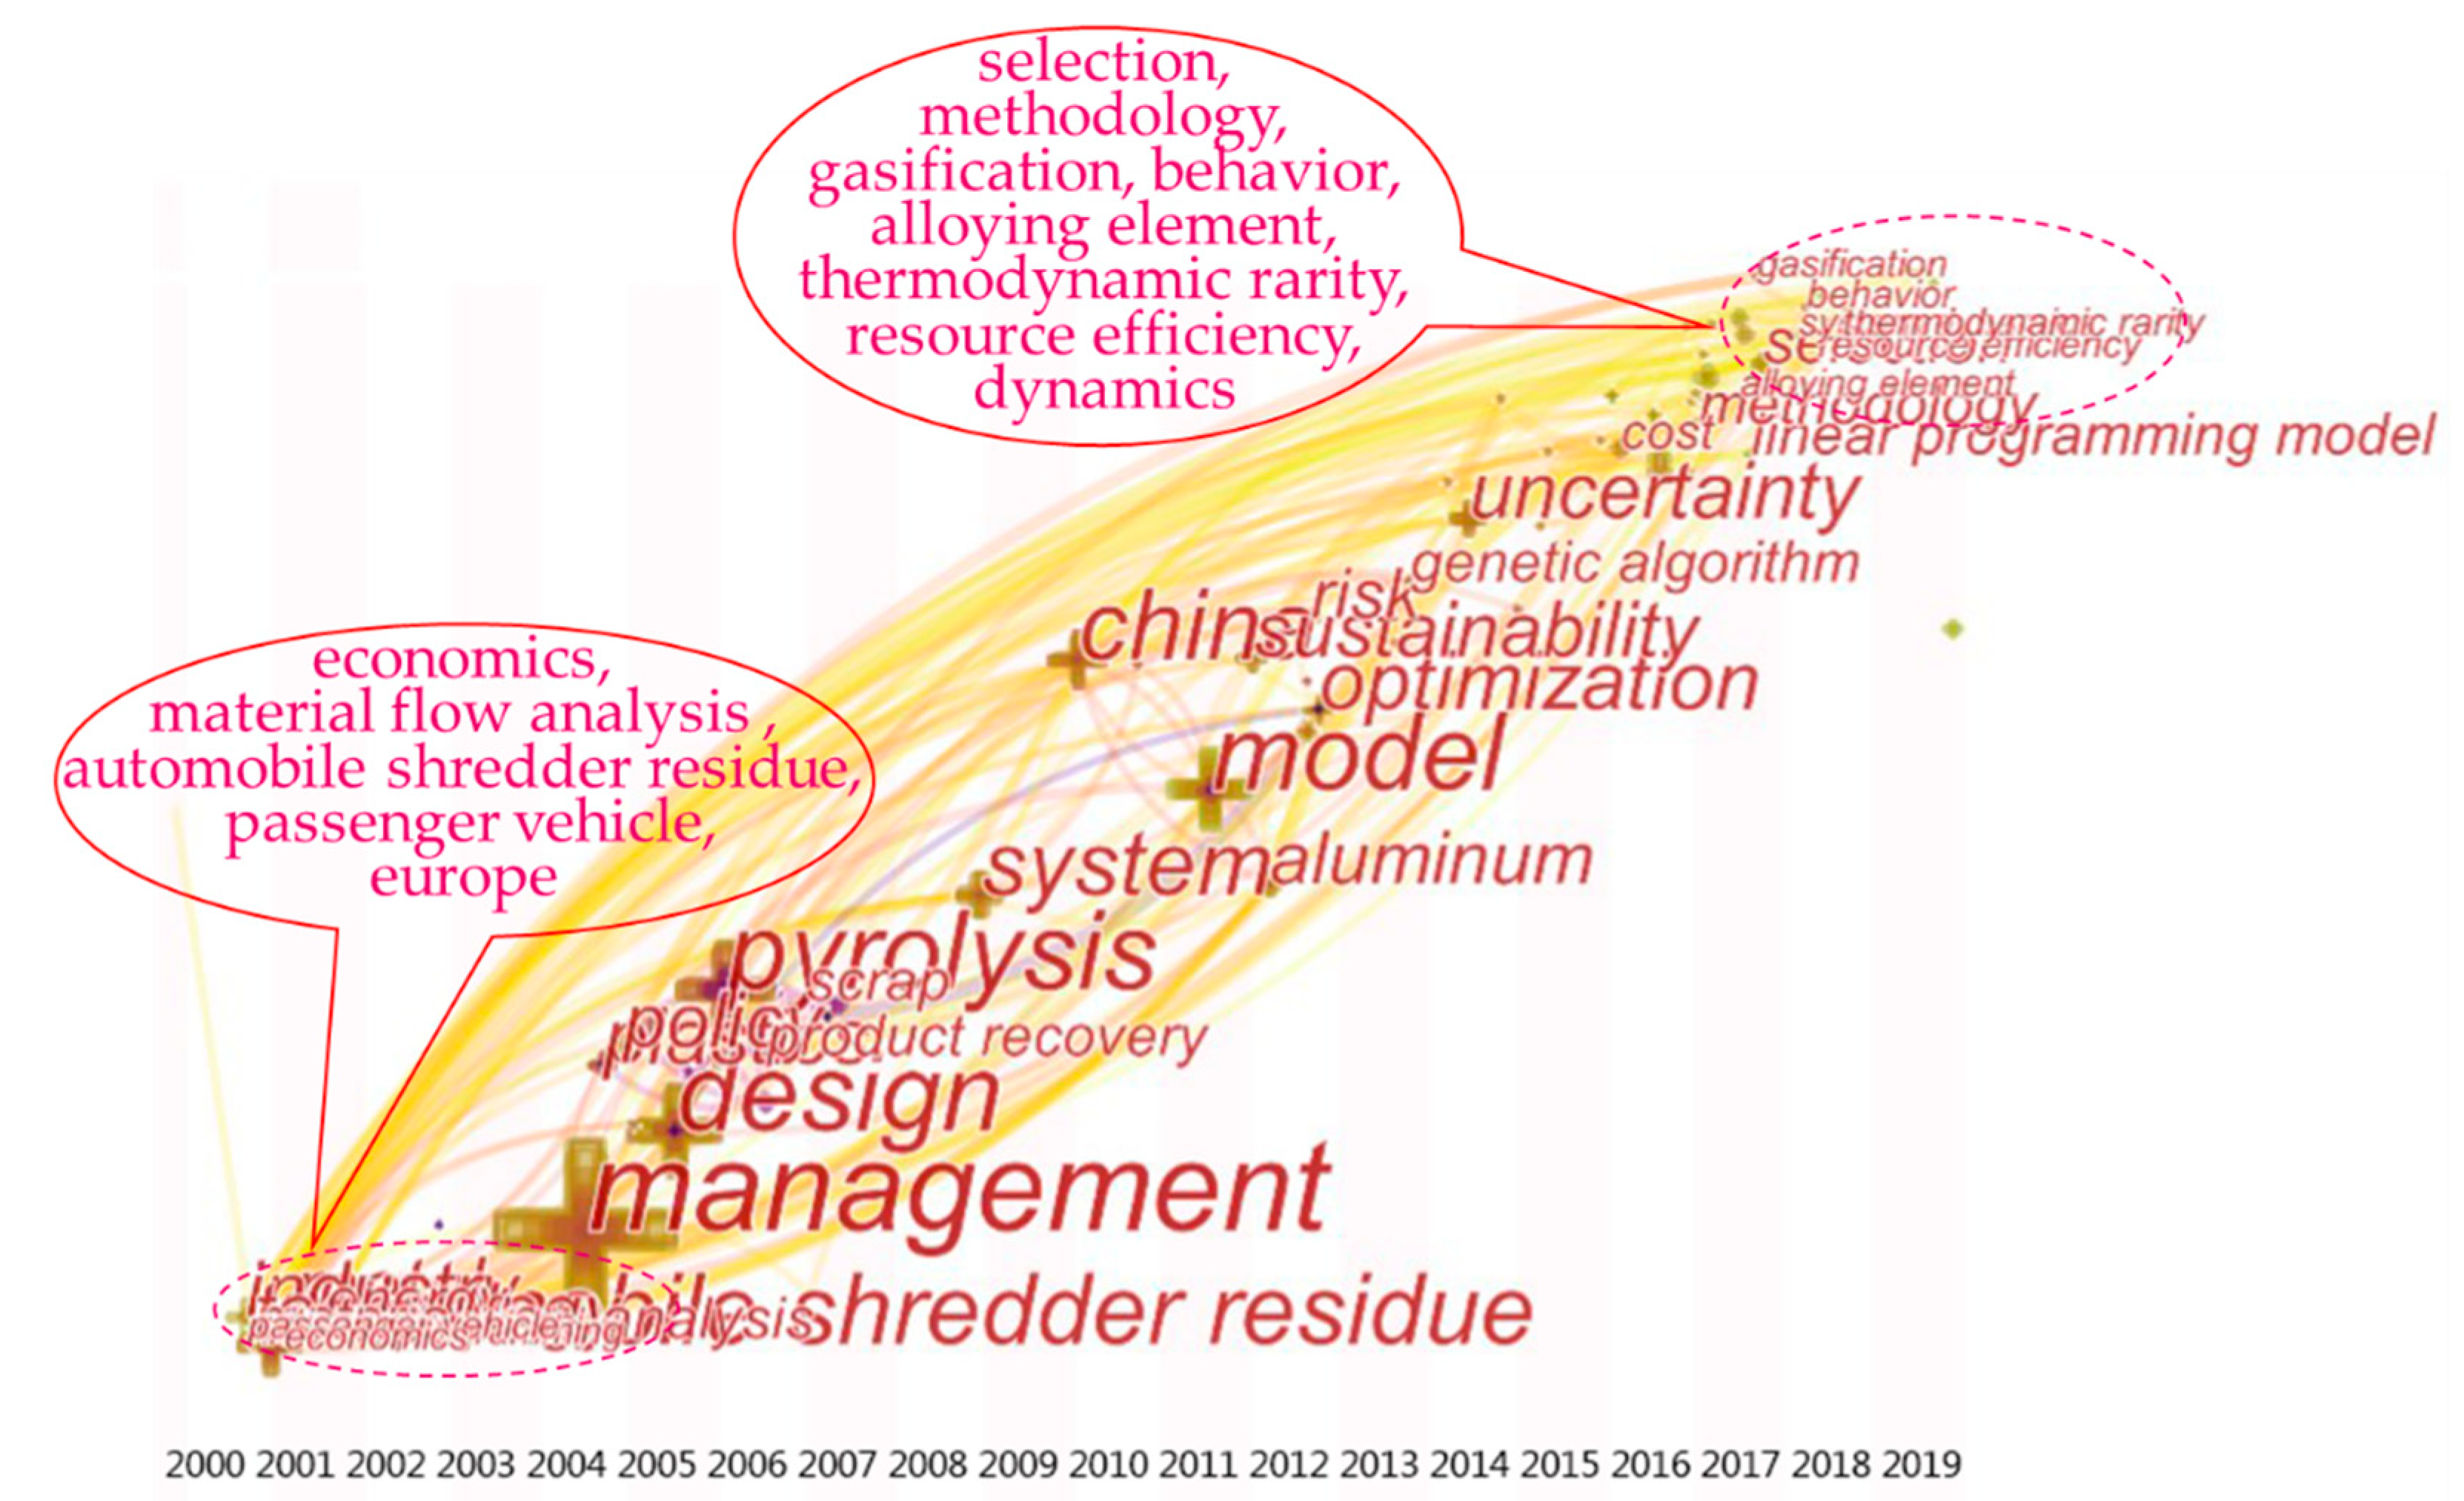
The primary information of a paper can be reflected by keywords so that we could understand the research topic of a domain through keywords analysis. This paper analyzed the author keywords of 299 articles by VOS viewer software and found that there were 1248 keywords in total. In order to make the data more reasonable, original data were preprocessed, and similar keywords were merged, such as “end of life vehicle”, “end of life vehicles”, “ELV”, and “ELVs”. Since most keywords only appeared once, the top 87 keywords were selected with a threshold of 5 for analysis. Total link strength refers to the total co-occurrence times of keywords with other keywords (including repeated co-occurrence times). The top three frequency keywords were “end of life vehicles” (109), “recycling” (65), “management” (45), and their total link strengths were 306, 234, and 232, respectively.
(1) Keywords Co-Occurrence and Categorization
In the keyword co-occurrence network, each node of the network represents a keyword, and the edge between nodes was composed of keyword co-occurrence.
When excluding the keywords “reverse logistics”, “closed-loop supply chain”, “recycl *“, “recovery”, “collect *”, and “end of life vehicle *”, the most frequently co-occurring keywords were management (45), design (30), pyrolysis (29), model (21), and products (20). "*" represents any character group, including null characters. As shown in Figure 10, the mapped keywords were derived from VOS viewer’s previous analysis (including density, degree, concentration, and inclusiveness, which are typical indicators of the relationship among keywords). By using this method, the keywords were divided into four clusters through VOS viewer for further analysis: (a) modeling approach; (b) remanufacturing and materials recycling; (c) legislation-oriented research; and (d) automobile shredder residue recycling.
Modeling approach of the recycling process
As shown in Figure 9, the red cluster represents the first category named modeling approach, including keywords such as network, optimization, genetic algorithm, life cycle assessment, uncertainty, linear-programming model, etc. Furthermore, the rapid increase of these keywords frequency in recent years illustrates that the modeling approach had become a significant content and was widely concerned in reverse logistics of ELVs. At present, the discussion on the model mainly focused on the following aspects: (1) reverse logistics network, (2) prediction of the number of ELVs, and (3) life cycle assessment and environment effect. The content of the modeling approach will be discussed in detail in Section 4.
Remanufacturing and materials recycling
The second category is the blue cluster, including keywords such as material flow analysis, scrap, aluminum, steel, metal, cycle, etc. The automobile industry is well-known of its parts remanufacturing history, which refers to the transformation of parts conditions from scrap to “as new as possible”. However, this operation is pervasive, including dismantling, cleaning, recycling, and reassembly. This kind of literature mainly focuses on the recycling technology, methodology, and cycle evaluation of various components, metals, plastics, and other materials of ELVs. At present, the mechanical treatment is the technical support for metal recovery of ELVs, mainly recycling steel, aluminum, copper, and zinc alloy. Seitz [43] discussed the motivation behind the remanufacturing of passenger car engines in terms of market share, profitability, moral responsibility, and brand protection. An experimental study conducted by Jordão et al. [44] aims to enhance the recovery and recycling of nonferrous metals, and the optimum conditions were determined. Ortego et al. [45] evaluate the downcycling degree of minor metals in conventional vehicles from the perspective of thermodynamics rarity. In addition to metals, the world has also attached great importance to the recycling and reutilization of automotive plastics. Li et al. [46] developed a high-voltage triboelectric separation device through the single factor test to separate polyvinylchloride (PVC), polyurethane (PU), and polypropylene (PP) from the general plastic mixture inside and outside the passenger vehicles. In the future, more detailed consideration can be given to how to reduce material waste and improve the recyclability of materials and the remanufacturing process of recyclable materials.
Legislation-oriented research
The yellow cluster represents this category, including keywords such as environment, European-union, China, policies, strategies, directive, innovation, issues, etc. As the implementation of various ELVs legislation-oriented measures will significantly affect the ELVs recycling industry, this kind of literature mainly focuses on the EU ELVs Directive, national legislation and comparison, and the extension producer responsibility (EPR). The EU 2000/53/EC Directive on ELVs was formulated to solve the problems of vehicle discard, pollution, and waste, which is the first performance since the establishment of EPR. Since then, ELVs reverse logistics has developed rapidly, and various recycling solutions have been proposed. According to the EU Directive, Alwaeli [6] discussed the requirements and objectives of recycling of ELVs in Poland in 2011. Wang and Chen [47] classified Chinese regulations and policies on ELVs management, drawing lessons from the experience of ELVs law and EPR in developed countries. Li et al. [48] analyzed and summarized Chinese current regulations and policies, which is conducive to the improvement of them by the government.
Although most of the literature is on the analysis of local laws and regulations, in recent years, some researchers began to compare and analyze the laws and regulations of several countries or regions. Despeisse et al. [49] made a comparative analysis of Britain and Japan, describing the background and RRR (the recovery, recycling, and reuse) performance of the two countries in terms of the life cycle. The environmental performance and legislative boundaries of the current ELVs recovery processes in Belgium and Australia were compared by Soo et al. [50]. Singh et al. [51] analyzed the impact of laws and regulations of Japan and EU countries on the innovation of ELVs in terms of patent data, and the results demonstrated that Japan’s environmental policies were more effective than those of the EU countries in promoting innovation. As regulations affect many countries in the world, the comparative analysis of multiple regions is still the future research direction, which is conducive to the improvement of domestic regulations.
Automobile shredder residue recycling
The green cluster represents the fourth category with keywords such as ASR, pyrolysis, gasification, combustion, brominated flame retardants, etc. One of the reasons why ELVs are challenging to recycle is that polymer materials are used in the vehicle manufacturing process to improve vehicle performance, such as emissions and weight. The automobile shredder residues (ASRs) refers to the remaining fraction after shredding of ELVs, accounting for 25%–30% of the total ELVs crushed mixture, containing most of the polymers [52,53]. If these polymers are directly landfilled, it will cause severe environmental pollution. The development of technology to improve the separation ability of ASR is the most critical measure to solve this problem. Thus, this kind of literature mainly focuses on the treatment of ASR in order to improve the separation level to recover energy and metal.
(2) Keywords Citation Bursts
Each article contains many keywords, so the activity of this field can be reflected by the growth of keywords [54]. Keyword citation burst refers to the sudden increase of keyword categories over time, which can highlight emerging topics in a particular field. Therefore, it helps us to understand the most important emerging topics in the domain of reverse logistics of ELVs and determine the direction of future research. As shown in Figure 11 made by CiteSpace, the emergence of the keyword automobile shredder reserve was in 2001, indicating that the research on it started very early. Besides, the outbreak of the keywords such as management, design, policies, and system mainly occurred in 2004–2008. However, the focus on model method mainly occurred after 2011, and there were still a lot of relevant articles published, which shows that in the domain of reverse logistics, the modeling approach was a research hotspot.
4. Discussion
4.1. Development of Publications
Figure 4 presents the evolution of related publications, from which it can be seen that the ANP was substantially increasing. However, the ANP appeared in a trough period from 2008 to 2011 and increased slowly in the recent 3 years, which was consistent with the trend in global vehicle production shown in Figure 1, indicating that academic activities were closely related to the development of the industry. Moreover, China and Japan were the top two production countries in Figure 6, probably resulting from their rapidly developing automobile industry and related regulations and policies.
Table 2 and Figure 5 highlights the top 10 most famous journals and co-citation relations. Among them, the Journal of Cleaner Production, Waste Management, and Resources Conservation and Recycling are the core journals, accounting for 30.95% of the total number of papers. At the same time, the three journals are the most closely related, proving that their themes were significantly similar.
Table 4 highlights the 10 most influential authors, three of them from Japan, and the most influential author was Chen from Shanghai Jiao Tong University in China. In a vertical comparison of country performance, academic collaboration, productive institutions, and authors, it is interesting to find that the top two countries in all three parts were relatively consistent: China and Japan. Academic cooperation integrates the expertise of different scholars, resulting in innovations and more high-level papers. International cooperation also contributes to the academic development of low-tech countries, as they can obtain learning opportunities from partner countries. Interestingly, the countries and authors with the highest paper output also have positive and outstanding performance in international academic cooperation, which shows that cooperative research contributes more to the production of outstanding literature.
Table 3 shows the 10 most essential institutions, half of which are from Japan, and Shanghai Jiao Tong University in China ranks first. It is worth noting that China and Japan were not only the two most productive countries but also the most prominent in academic cooperation. Interestingly, nine of the most influential institutions were universities, which had rich research platforms and fields to choose from, and more student papers were published in the top 10 journals under the guidance of professors. Simultaneously, academic cooperation performance can provide a certain basis for the ranking of institutions. Shanghai Jiao Tong University, for example, is the most productive University in the field of ELV reverse logistics, probably because more international students and visiting scholars carry out frontier research.
4.2. Future Research Emphasis and Trend
The keywords related to frequency analysis and the most frequently cited articles show that the main topic was focused on the modeling approach of the recycling process, which will be classified and discussed below.
4.2.1. Reverse Logistics Network
Reverse logistics network construction refers to the network structure of determining the flow of waste goods from the consumption place to the recycling place, including determining the number, location, and flow distribution of the main body of the network. The construction of a reverse logistics network, considered as a strategic level design problem, was the most basic and essential task in reverse logistics management. Currently, the study on the reverse logistics network of ELVs has become the focus of the researchers, and many construction approaches have been proposed.
The network structure of ELVs reverse logistics can be classified into open-loop supply chain (OLSC) and closed-loop supply chain (CLSC); there are several optimization models: linear programming (LP), mixed integer linear programming (MILP), and mixed-integer nonlinear programming (MINLP); the objective function is divided into multi-objective and single objective according to quantity, and can be divided into maximization (Max) and minimization (Min); the type of parameters is divided into deterministic (Det.), probabilistic (Prob.), and fuzzy; and the solution approach can be classified into exact (E), heuristic (H), and metaheuristic (MH). The following characteristics can be summarized from the 23 articles collected in Table 6.
Most of the ELVs reverse logistics network were designed as an OLSC (65.2%), which was recycled by the third-party operation entities and was modeled according to LP (56.5%) or MILP (39.1%). Besides, the majority of the work adopted a single objective model (91.3%), and the solution approach was E (78.3%) for small or medium-size cases. Only in a few studies, the CLSC was used as the network structure to build a multi-objective model, which was mostly based on the recycling of automobile manufacturers [36,55]. All single objective models considered minimizing costs (usually including recovery costs, fixed and variable costs of facilities, transportation costs, and carbon emission costs) or maximizing profits (profits from sales of parts and materials minus costs), while multi-objective models considered both. In addition, only two papers considered carbon emission in the model [56,57]. By comparing the cost of each part of recovery and sensitivity analysis, they found that the carbon emission cost was meager under the current carbon tax, which is difficult to restrict the decision-making. Therefore, the government must formulate more effective environmental policies to reduce carbon emissions, such as imposing strict limits on carbon emissions. Besides, LINGO, CPLEX, and other software are widely used to solve the linear model. However, more researchers solve the model using H and M-H methods to solve large-scale or non-linear problems in recent years, such as an improved artificial bee colony algorithm [58], genetic algorithm [59,60], Tabu search algorithm [34], improved multi-start search algorithm, etc. In particular, complex uncertainties exist in the network design, such as the time, quantity and quality of ELVs recovered, and economic and technical parameters. Only in a few studies, the fuzzy method was used to solve the uncertainty. Most of them only considered the uncertainty of the processing cost, sales price, transportation cost, and other price parameters [61,62,63], only Kuşakcı et al. [11] models with the uncertainty of the number of ELVs.
In short, future research should focus on CLSC, build multi-objective and non-linear models, consider carbon emission constraints under strict environmental policies, take more uncertainties into account, and adopt more advanced methods to solve the model.
4.2.2. Prediction of the Number of ELVs
The accurate prediction of the recovery quantity of ELVs plays a vital role in reverse logistics of the automobile industry. For instance, the production, operation, and inventory of ELVs processing facilities can be adjusted according to the forecast results to reduce costs; besides, it can promote relevant departments to formulate more effective regulations and policies and contribute to the development of the industry.
Conventionally, the number of ELVs is predicted by a fixed proportion of the total vehicle ownership, which has low accuracy [75]. Thus, a variety of prediction theory research emerges in recent years. Some researchers use the statistical model [76] and the non-linear Gompertz model [77] to analyze the non-linear characteristics in the prediction process. Besides, due to the limitation of many uncertain factors, the grey model (GM) applies to predict the quantity of ELVs [78,79]. Although some progress has been made, due to the different complexity of the problem, some tricky problems cannot achieve the expected goal only by using a certain theoretical method. Therefore, in practice, the integration of GM, GA, PSO, and other theoretical algorithms, to make up for deficiencies, and the use of comparative research methods to carry out prediction evaluation, an analysis of its advantages and disadvantages and scope of application, and to select the appropriate conclusion as the reference results of prediction can provide specific theoretical support for researchers.
4.2.3. Life Cycle Assessment and Environment Effect
Life cycle assessment (LCA) is a method used by most researchers to evaluate the environmental sustainability of products. Some studies conducted LCA of the overall environmental impact from alternative methods and compared different technologies and management methods [8,80,81,82]. To a certain extent, this can determine ways to reduce environmental pollution and resource waste. However, the entire range of environmental benefits and burdens of the ELV recycling process are not clear enough to develop the appropriate guidelines to reduce the environmental impact of ELV recovery. Therefore, some researchers began to conduct LCA research on the whole vehicle [83,84], which may be a worthy research direction in the future.
As the environmental benefits of the recovery and dismantling of ELVs are greatly affected by the resource recovery rate, the application of LCA to support the decision-making of vehicle parts design is still worthy of further exploration by researchers. However, simple LCA and environmental modeling methods may not optimize further, improve, and understand the complete ELV recycling system. Besides, it is noted that in recent years, some experts will consider cost and energy consumption emission in LCA, namely, life cycle cost (LCC) and environmental life cycle assessment (ELCA). Therefore, integrating socioeconomic characteristics with ecological design and LCA for modeling and predicting complex ELV recovery systems can be regarded as a very promising methodology.
5. Conclusions
This paper combined bibliometrics with social network analysis, for the first time, to quantitatively and qualitatively analyze the performance of publications and the coupling of literature in the field of ELVs revered logistics. According to the WOSCC database, there were 299 relevant records from 2000 to 2019. During this period, the number of annual publications in the domain of ELVs reverse logistics exhibited an increasing trend. The following contributions of this study hope to help researchers understand the current research in this field and obtain more innovative ideas. First of all, this study provided the most influential journals, countries/regions, institutions, and cooperation among them. Journal of Cleaner Production, Waste Management, and Resources Conservation and Recycling were the core journals in this field with similar themes and closest links. The two countries with the most publications, China, and Japan, also had a more academic relationship. Besides, Shanghai Jiao Tong University in China was the most productive institution, while Japan had half the high-level institutions. Secondly, the author co-citation network graph was described, and the top three influential authors were Chen M, Simic V, and Reuter MA. Second, we analyzed the multi-disciplines involved in ELV reverse logistics, mainly focusing on Engineering and Environmental Science Ecology. Third, we provided influential papers and conducted content analysis to obtain important topics in this field. Fourth, we visualized the keyword co-occurrence, categorization, and citation bursts, and found the future research emphasis and trend, and made a detailed content analysis.
To sum up, this research contributed to reviewing the domain of reverse logistics of ELVs, uniquely to identify the future interests of this research domain.
Author Contributions
M.H. and T.L. conceived the conception and collected documents. J.L., X.W. and Y.P. screened eligible papers carefully and offered reasonable suggestions; T.L. wrote the manuscript. All authors have read and agreed to the published version of the manuscript.
Funding
This research was funded by the Humanities and Social Science Youth Foundation of the Ministry of Education of China [GrantsNo16YJCZH027], the National Natural Science Foundation of China [Grant No 71772080, 71802099] and Research Projects of Philosophy and Social Sciences in Universities of Jiangsu Province [Grants No 2020SJA2058, 2020SJZDA062].
Acknowledgments
This work was supported by the Humanities and Social Science Youth Foundation of the Ministry of Education of China [GrantsNo16YJCZH027], the National Natural Science Foundation of China [Grant No 71772080, 71802099] and Research Projects of Philosophy and Social Sciences in Universities of Jiangsu Province [Grants No 2020SJA2058, 2020SJZDA062].
Conflicts of Interest
The authors declare no conflict of interest.
References
- Stock, J.R. Reverse Logistics: White Paper; Council of Logistics Management: Oak Brook, IL, USA, 1992; pp. 2–67. [Google Scholar]
- Simic, V. End-of-life vehicle recycling—A review of the state-of-the-art. Tech. Gaz. 2013, 20, 371–380. [Google Scholar]
- Vermeulen, I.; Van Caneghem, J.; Block, C.; Baeyens, J.; Vandecasteele, C. Automotive shredder residue (ASR): Reviewing its production from end-of-life vehicles (ELVs) and its recycling, energy or chemicals’ valorisation. J. Hazard. Mater. 2011, 190, 8–27. [Google Scholar] [CrossRef] [PubMed]
- EuroStat End-of-life Vehicles—Reuse, Recycling and Recovery Totals. EuroStat, 2018. Available online: https://ec.europa.eu/eurostat (accessed on 27 November 2018).
- Zorpas, A.A.; Inglezakis, V.J. Automotive industry challenges in meeting EU 2015 environmental standard. Technol. Soc. 2012, 34, 55–83. [Google Scholar] [CrossRef]
- Alwaeli, M.A.M. End-of-life vehicles recovery and recycling and the route to comply with EU directive targets. Environ. Prot. Eng. 2016, 42, 191–202. [Google Scholar] [CrossRef]
- Environment, E.C.D. End-of-life vehicles: Influence of production costs on recycling rates. Science for Environment Policy-News Alert, 3 May 2012; 282. [Google Scholar]
- Smith, V.M.; Keoleian, G.A.G.U. The Value of Remanufactured Engines: Life-Cycle Environmental and Economic Perspectives. J. Ind. Ecol. 2004, 8, 193–221. [Google Scholar] [CrossRef]
- Chen, D.; Ignatius, J.; Sun, D.; Zhan, S.; Zhou, C.; Marra, M.; Demirbag, M. Reverse logistics pricing strategy for a green supply chain: A view of customers’ environmental awareness. Int. J. Prod. Econ. 2019, 217, 197–210. [Google Scholar] [CrossRef] [Green Version]
- Millet, D.; Yvars, P.; Tonnelier, P. A method for identifying the worst recycling case: Application on a range of vehicles in the automotive sector. Resour. Conserv. Recycl. 2012, 68, 1–13. [Google Scholar] [CrossRef]
- Kuşakcı, A.O.; Ayvaz, B.; Cin, E.; Aydın, N. Optimization of reverse logistics network of End of Life Vehicles under fuzzy supply: A case study for Istanbul Metropolitan Area. J. Clean. Prod. 2019, 215, 1036–1051. [Google Scholar] [CrossRef]
- Sharma, L.; Pandey, S. Recovery of resources from end-of-life passenger cars in the informal sector in India. Sustain. Prod. Consum. 2020, 24, 1–11. [Google Scholar] [CrossRef]
- Karagoz, S.; Aydin, N.; Simic, V. End-of-life vehicle management: A comprehensive review. J. Mater. Cycles Waste 2020, 22, 416–442. [Google Scholar] [CrossRef] [Green Version]
- Rosa, P.; Terzi, S. Waste Electrical and Electronic Equipments versus End of Life Vehicles: A State of the Art Analysis and Quantification of Potential Profits. Procedia CIRP 2016, 48, 502–507. [Google Scholar] [CrossRef] [Green Version]
- Cucchiella, F.; Adamo, I.D.; Rosa, P.; Terzi, S. Scrap automotive electronics: A mini-review of current management practices. Waste Manag. Res. 2015, 34, 3–10. [Google Scholar] [CrossRef]
- Buekens, A.; Zhou, X. Recycling plastics from automotive shredder residues: A review. J. Mater. Cycles Waste Manag. 2014, 16, 398–414. [Google Scholar] [CrossRef]
- Gan, J.W.; He, Z.G. Literature Review and Prospect on the End-of-Life Vehicles Reverse Logistics. Adv. Mater. Res. 2014, 878, 66–74. [Google Scholar] [CrossRef]
- Zhang, H.; Chen, M. Current recycling regulations and technologies for the typical plastic components of end-of-life passenger vehicles: A meaningful lesson for China. J. Mater. Cycles Waste Manag. 2014, 16, 187–200. [Google Scholar] [CrossRef]
- Go, T.F.; Wahab, D.A.; Rahman, M.N.A.; Ramli, R.; Azhari, C.H. Disassemblability of end-of-life vehicle: A critical review of evaluation methods. J. Clean. Prod. 2011, 19, 1536–1546. [Google Scholar] [CrossRef]
- Nourreddine, M. Recycling of auto shredder residue. J. Hazard. Mater. 2007, 139, 481–490. [Google Scholar] [CrossRef]
- Pritchard, A. Statistical bibliography or bibliometrics. J. Doc. 1969, 25, 348–349. [Google Scholar]
- Pilkington, A.; Meredith, J. The evolution of the intellectual structure of operations management—1980–2006: A citation/co-citation analysis. J. Oper. Manag. 2009, 27, 185–202. [Google Scholar] [CrossRef]
- Small, H. Co-citation in the scientific literature: A new measure of the relationship between two documents. J. Am. Soc. Inf. Sci. 1973, 24, 265–269. [Google Scholar] [CrossRef]
- Scott, J. Social network analysis. Sociology 1988, 22, 109–127. [Google Scholar] [CrossRef]
- Fruchterman, T.M.J.; Reingold, E.M. Graph drawing by force-directed placement. Softw. Pract. Exp. 1991, 21, 1129–1164. [Google Scholar] [CrossRef]
- Newman, M.E.J. Modularity and community structure in networks. Proc. Natl. Acad. Sci. USA 2006, 103, 8577–8582. [Google Scholar] [CrossRef] [PubMed] [Green Version]
- Blonde, V.D.; Guillaume, J.; Lambiotte, R.; Lefebvre, E. Fast unfolding of communities in large networks. J. Stat. Mech. Theory Exp. 2008, 2008, P10008. [Google Scholar] [CrossRef] [Green Version]
- Mongeon, P.; Paul-Hus, A. The journal coverage of Web of Science and Scopus: A comparative analysis. Scientometrics 2016, 106, 213–228. [Google Scholar] [CrossRef]
- Garfield, E. The history and meaning of the journal impact factor. JAMA 2006, 295, 90–93. [Google Scholar] [CrossRef]
- Hirsch, J.E. An index to quantify an individual’s scientific research output. Proc. Natl. Acad. Sci. USA 2005, 102, 16569–16572. [Google Scholar] [CrossRef] [PubMed] [Green Version]
- White, H.D. A co-citation map of the social indicators movement. J. Am. Soc. Inf. Sci. 1983, 34, 307–312. [Google Scholar] [CrossRef]
- White, H.D.; Griffith, B.C. Author cocitation: A literature measure of intellectual structure. J. Am. Soc. Inf. Sci. 1981, 32, 163–171. [Google Scholar] [CrossRef]
- White, H.D.; McCain, K.W. Visualizing a discipline: An author co-citation analysis of information science, 1972–1995. J. Am. Soc. Inf. Sci. 1998, 49, 327–355. [Google Scholar]
- Schultmann, F.; Zumkeller, M.; Rentz, O. Modeling reverse logistic tasks within closed-loop supply chains: An example from the automotive industry. Eur. J. Oper. Res. 2006, 171, 1033–1050. [Google Scholar] [CrossRef]
- Gerrard, J.; Kandlikar, M. Is European end-of-life vehicle legislation living up to expectations? Assessing the impact of the ELV Directive on ‘green’ innovation and vehicle recovery. J. Clean. Prod. 2007, 15, 17–27. [Google Scholar] [CrossRef]
- Cruz-Rivera, R.; Ertel, J. Reverse logistics network design for the collection of End-of-Life Vehicles in Mexico. Eur. J. Oper. Res. 2009, 196, 930–939. [Google Scholar] [CrossRef]
- Ferguson, N.; Browne, J. Issues in end-of-life product recovery and reverse logistics. Prod. Plan. Control. 2001, 12, 534–547. [Google Scholar] [CrossRef]
- Mazzanti, M.; Zoboli, R. Economic instruments and induced innovation: The European policies on end-of-life vehicles. Ecol. Econ. 2006, 58, 318–337. [Google Scholar] [CrossRef]
- Michalek, J.J.; Papalambros, P.Y.; Skerlos, S.J. A Study of Fuel Efficiency and Emission Policy Impact on Optimal Vehicle Design Decisions. J. Mech. Des. 2004, 126, 1062–1070. [Google Scholar] [CrossRef] [Green Version]
- Zhang, T.; Chu, J.; Wang, X.; Liu, X.; Cui, P. Development pattern and enhancing system of automotive components remanufacturing industry in China. Resour. Conserv. Recycl. 2011, 55, 613–622. [Google Scholar] [CrossRef]
- Ragaert, K.; Delva, L.; Van Geem, K. Mechanical and chemical recycling of solid plastic waste. Waste Manag. 2017, 69, 24–58. [Google Scholar] [CrossRef]
- Morselli, L.; Santini, A.; Passarini, F.; Vassura, I. Automotive shredder residue (ASR) characterization for a valuable management. Waste Manag. 2010, 30, 2228–2234. [Google Scholar] [CrossRef]
- Seitz, M.A. A critical assessment of motives for product recovery: The case of engine remanufacturing. J. Clean. Prod. 2007, 15, 1147–1157. [Google Scholar] [CrossRef]
- Jordão, H.; Sousa, A.J.; Carvalho, M.T. Optimization of wet shaking table process using response surface methodology applied to the separation of copper and aluminum from the fine fraction of shredder ELVs. Waste Manag. 2016, 48, 366–373. [Google Scholar] [CrossRef] [PubMed]
- Ortego, A.; Valero, A.; Valero, A.; Iglesias, M. Downcycling in automobile recycling process: A thermodynamic assessment. Resour. Conserv. Recycl. 2018, 136, 24–32. [Google Scholar] [CrossRef]
- Li, T.; Yu, D.; Zhang, H. Triboelectrostatic separation of polypropylene, polyurethane, and polyvinylchloride used in passenger vehicles. Waste Manag. 2018, 73, 54–61. [Google Scholar] [CrossRef] [PubMed]
- Wang, L.; Chen, M. Policies and perspective on end-of-life vehicles in China. J. Clean. Prod. 2013, 44, 168–176. [Google Scholar] [CrossRef]
- Li, J.; Yu, K.; Gao, P. Recycling and pollution control of the End of Life Vehicles in China. J. Mater. Cycles Waste 2014, 16, 31–38. [Google Scholar] [CrossRef]
- Despeisse, M.; Kishita, Y.; Nakano, M.; Barwood, M. Towards a Circular Economy for End-of-Life Vehicles: A Comparative Study UK—Japan. Procedia CIRP 2015, 29, 668–673. [Google Scholar] [CrossRef]
- Soo, V.K.; Peeters, J.; Compston, P.; Doolan, M.; Duflou, J.R. Comparative Study of End-of-Life Vehicle Recycling in Australia and Belgium. Procedia CIRP 2017, 61, 269–274. [Google Scholar] [CrossRef]
- Singh, R.K.; Yabar, H.; Nozaki, N.; Niraula, B.; Mizunoya, T. Comparative study of linkage between environmental policy instruments and technological innovation: Case study on end-of-life vehicles technologies in Japan and EU. Waste Manag. 2017, 66, 114–122. [Google Scholar] [CrossRef]
- Huang, J.; Xu, C.; Zhu, Z.; Xing, L. Visual-Acoustic Sensor-Aided Sorting Efficiency Optimization of Automotive Shredder Polymer Residues Using Circularity Determination. Sensors 2019, 19, 284. [Google Scholar] [CrossRef] [Green Version]
- Evangelopoulos, P.; Sophonrat, N.; Jilvero, H.; Yang, W. Investigation on the low-temperature pyrolysis of automotive shredder residue (ASR) for energy recovery and metal recycling. Waste Manag. 2018, 76, 507–515. [Google Scholar] [CrossRef]
- Cobo, M.J.; López-Herrera, A.G.; Herrera-Viedma, E.; Herrera, F. Science mapping software tools: Review, analysis, and cooperative study among tools. J. Am. Soc. Inf. Sci. Technol. 2011, 62, 1382–1402. [Google Scholar] [CrossRef]
- Özceylan, E.; Demirel, N.; Çetinkaya, C.; Demirel, E. A closed-loop supply chain network design for automotive industry in Turkey. Comput. Ind. Eng. 2017, 113, 727–745. [Google Scholar] [CrossRef]
- Xiao, Z.; Sun, J.; Shu, W.; Wang, T. Location-allocation problem of reverse logistics for end-of-life vehicles based on the measurement of carbon emissions. Comput. Ind. Eng. 2019, 127, 169–181. [Google Scholar] [CrossRef]
- Simic, V. Interval-parameter chance-constraint programming model for end-of-life vehicles management under rigorous environmental regulations. Waste Manag. 2016, 52, 180–192. [Google Scholar] [CrossRef]
- Lin, Y.; Jia, H.; Yang, Y.; Tian, G.; Tao, F.; Ling, L. An improved artificial bee colony for facility location allocation problem of end-of-life vehicles recovery network. J. Clean. Prod. 2018, 205, 134–144. [Google Scholar] [CrossRef]
- Zarei, M.; Mansour, S.; Husseinzadeh Kashan, A.; Karimi, B. Designing a Reverse Logistics Network for End-of-Life Vehicles Recovery. Math. Probl. Eng. 2010. [Google Scholar] [CrossRef]
- Gołębiewski, B.; Trajer, J.; Jaros, M.; Winiczenko, R. Modelling of the location of vehicle recycling facilities: A case study in Poland. Resour. Conserv. Recycl. 2013, 80, 10–20. [Google Scholar] [CrossRef]
- Phuc, P.N.K.; Yu, V.F.; Tsao, Y. Optimizing fuzzy reverse supply chain for end-of-life vehicles. Comput. Ind. Eng. 2017, 113, 757–765. [Google Scholar] [CrossRef]
- Zhang, J.; Liu, J.; Wan, Z. Optimizing Transportation Network of Recovering End-of-Life Vehicles by Compromising Program in Polymorphic Uncertain Environment. J. Adv. Transp. 2019, 2019, 1–24. [Google Scholar] [CrossRef]
- Simic, V. A two-stage interval-stochastic programming model for planning end-of-life vehicles allocation under uncertainty. Resour. Conserv. Recycl. 2015, 98, 19–29. [Google Scholar] [CrossRef]
- Mansour, S.; Zarei, M. A multi-period reverse logistics optimisation model for end-of-life vehicles recovery based on EU Directive. Int. J. Comput. Integr. Manuf. 2008, 21, 764–777. [Google Scholar] [CrossRef]
- Mahmoudzadeh, M.; Mansour, S.; Karimi, B. A decentralized reverse logistics network for end of life vehicles from third party provider perspective. Environ. Sci. Technol. 2011, 6, 338–342. [Google Scholar]
- Vidovic, M.; Dimitrijevic, B.; Ratkovic, B.; Simic, V. A novel covering approach to positioning ELV collection points. Resour. Conserv. Recycl. 2011, 57, 1–9. [Google Scholar] [CrossRef]
- Farel, R.; Yannou, B.; Bertoluci, G. Finding best practices for automotive glazing recycling: A network optimization model. J. Clean. Prod. 2013, 52, 446–461. [Google Scholar] [CrossRef] [Green Version]
- Mahmoudzadeh, M.; Mansour, S.; Karimi, B. To develop a third-party reverse logistics network for end-of-life vehicles in Iran. Resour. Conserv. Recycl. 2013, 78, 1–14. [Google Scholar] [CrossRef]
- Simic, V. Fuzzy risk explicit interval linear programming model for end-of-life vehicle recycling planning in the EU. Waste Manag. 2015, 35, 265–282. [Google Scholar] [CrossRef]
- Simic, V. A multi-stage interval-stochastic programming model for planning end-of-life vehicles allocation. J. Clean. Prod. 2016, 115, 366–381. [Google Scholar] [CrossRef]
- Simic, V. End-of-life vehicles allocation management under multiple uncertainties: An interval-parameter two-stage stochastic full-infinite programming approach. Resour. Conserv. Recycl. 2016, 114, 1–17. [Google Scholar] [CrossRef]
- Demirel, E.; Demirel, N.; Gökçen, H. A mixed integer linear programming model to optimize reverse logistics activities of end-of-life vehicles in Turkey. J. Clean. Prod. 2016, 112, 2101–2113. [Google Scholar] [CrossRef]
- Shankar, R.; Bhattacharyya, S.; Choudhary, A. A decision model for a strategic closed-loop supply chain to reclaim End-of-Life Vehicles. Int. J. Prod. Econ. 2018, 195, 273–286. [Google Scholar] [CrossRef] [Green Version]
- Sun, Y.; Wang, Y.T.; Chen, C.; Yu, B. Optimization of a regional distribution center location for parts of end-of-life vehicles. Simulation 2018, 94, 577–591. [Google Scholar] [CrossRef]
- Tian, G.; Zhang, H.; Feng, Y.; Jia, H.; Zhang, C.; Jiang, Z.; Li, Z.; Li, P. Operation patterns analysis of automotive components remanufacturing industry development in China. J. Clean. Prod. 2017, 164, 1363–1375. [Google Scholar] [CrossRef]
- Yu, L.; Chen, M.; Yang, B. Recycling policy and statistical model of end-of-life vehicles in China. Waste Manag. Res. 2019, 37, 347–356. [Google Scholar] [CrossRef] [PubMed]
- Dargay, J.; Gately, D.; Sommer, M. Vehicle Ownership and Income Growth, Worldwide: 1960–2030. Energy J. 2007, 28, 143–170. [Google Scholar] [CrossRef] [Green Version]
- Ene, S.; Öztürk, N. Grey modelling based forecasting system for return flow of end-of-life vehicles. Technol. Soc. 2017, 115, 155–166. [Google Scholar] [CrossRef]
- Li, Y.; Wang, L. Prediction and recovery of end-of-life vehicles of China. Ecol. Econ. 2015, 6, 342–349. [Google Scholar]
- Cossu, R.; Lai, T. Automotive shredder residue (ASR) management: An overview. Waste Manag. 2015, 45, 143–151. [Google Scholar] [CrossRef]
- Soo, V.K.; Peeters, J.; Paraskevas, D.; Compston, P.; Doolan, M.; Duflou, J.R. Sustainable aluminium recycling of end-of-life products: A joining techniques perspective. J. Clean. Prod. 2018, 178, 119–132. [Google Scholar] [CrossRef] [Green Version]
- Salonitis, K.; Jolly, M.; Pagone, E.; Papanikolaou, M. Life-Cycle and Energy Assessment of Automotive Component Manufacturing: The Dilemma between Aluminum and Cast Iron. Energies 2019, 12, 2557. [Google Scholar] [CrossRef] [Green Version]
- Belboom, S.; Lewis, G.; Bareel, P.; Léonard, A. Life cycle assessment of hybrid vehicles recycling: Comparison of three business lines of dismantling. Waste Manag. 2016, 50, 184–193. [Google Scholar] [CrossRef]
- Li, W.; Bai, H.; Yin, J.; Xu, H. Life cycle assessment of end-of-life vehicle recycling processes in China—Take Corolla taxis for example. J. Clean. Prod. 2016, 117, 176–187. [Google Scholar] [CrossRef]
Figure 1.
The vehicles production between 2000 and 2019.

Figure 2.
The reverse logistics process of end-of-life vehicles (ELVs) [11].
Figure 2.
The reverse logistics process of end-of-life vehicles (ELVs) [11].

Figure 3.
The general flow diagram for systematic bibliometric analysis.

Figure 4.
The number of annual publications between 2000 and 2019.
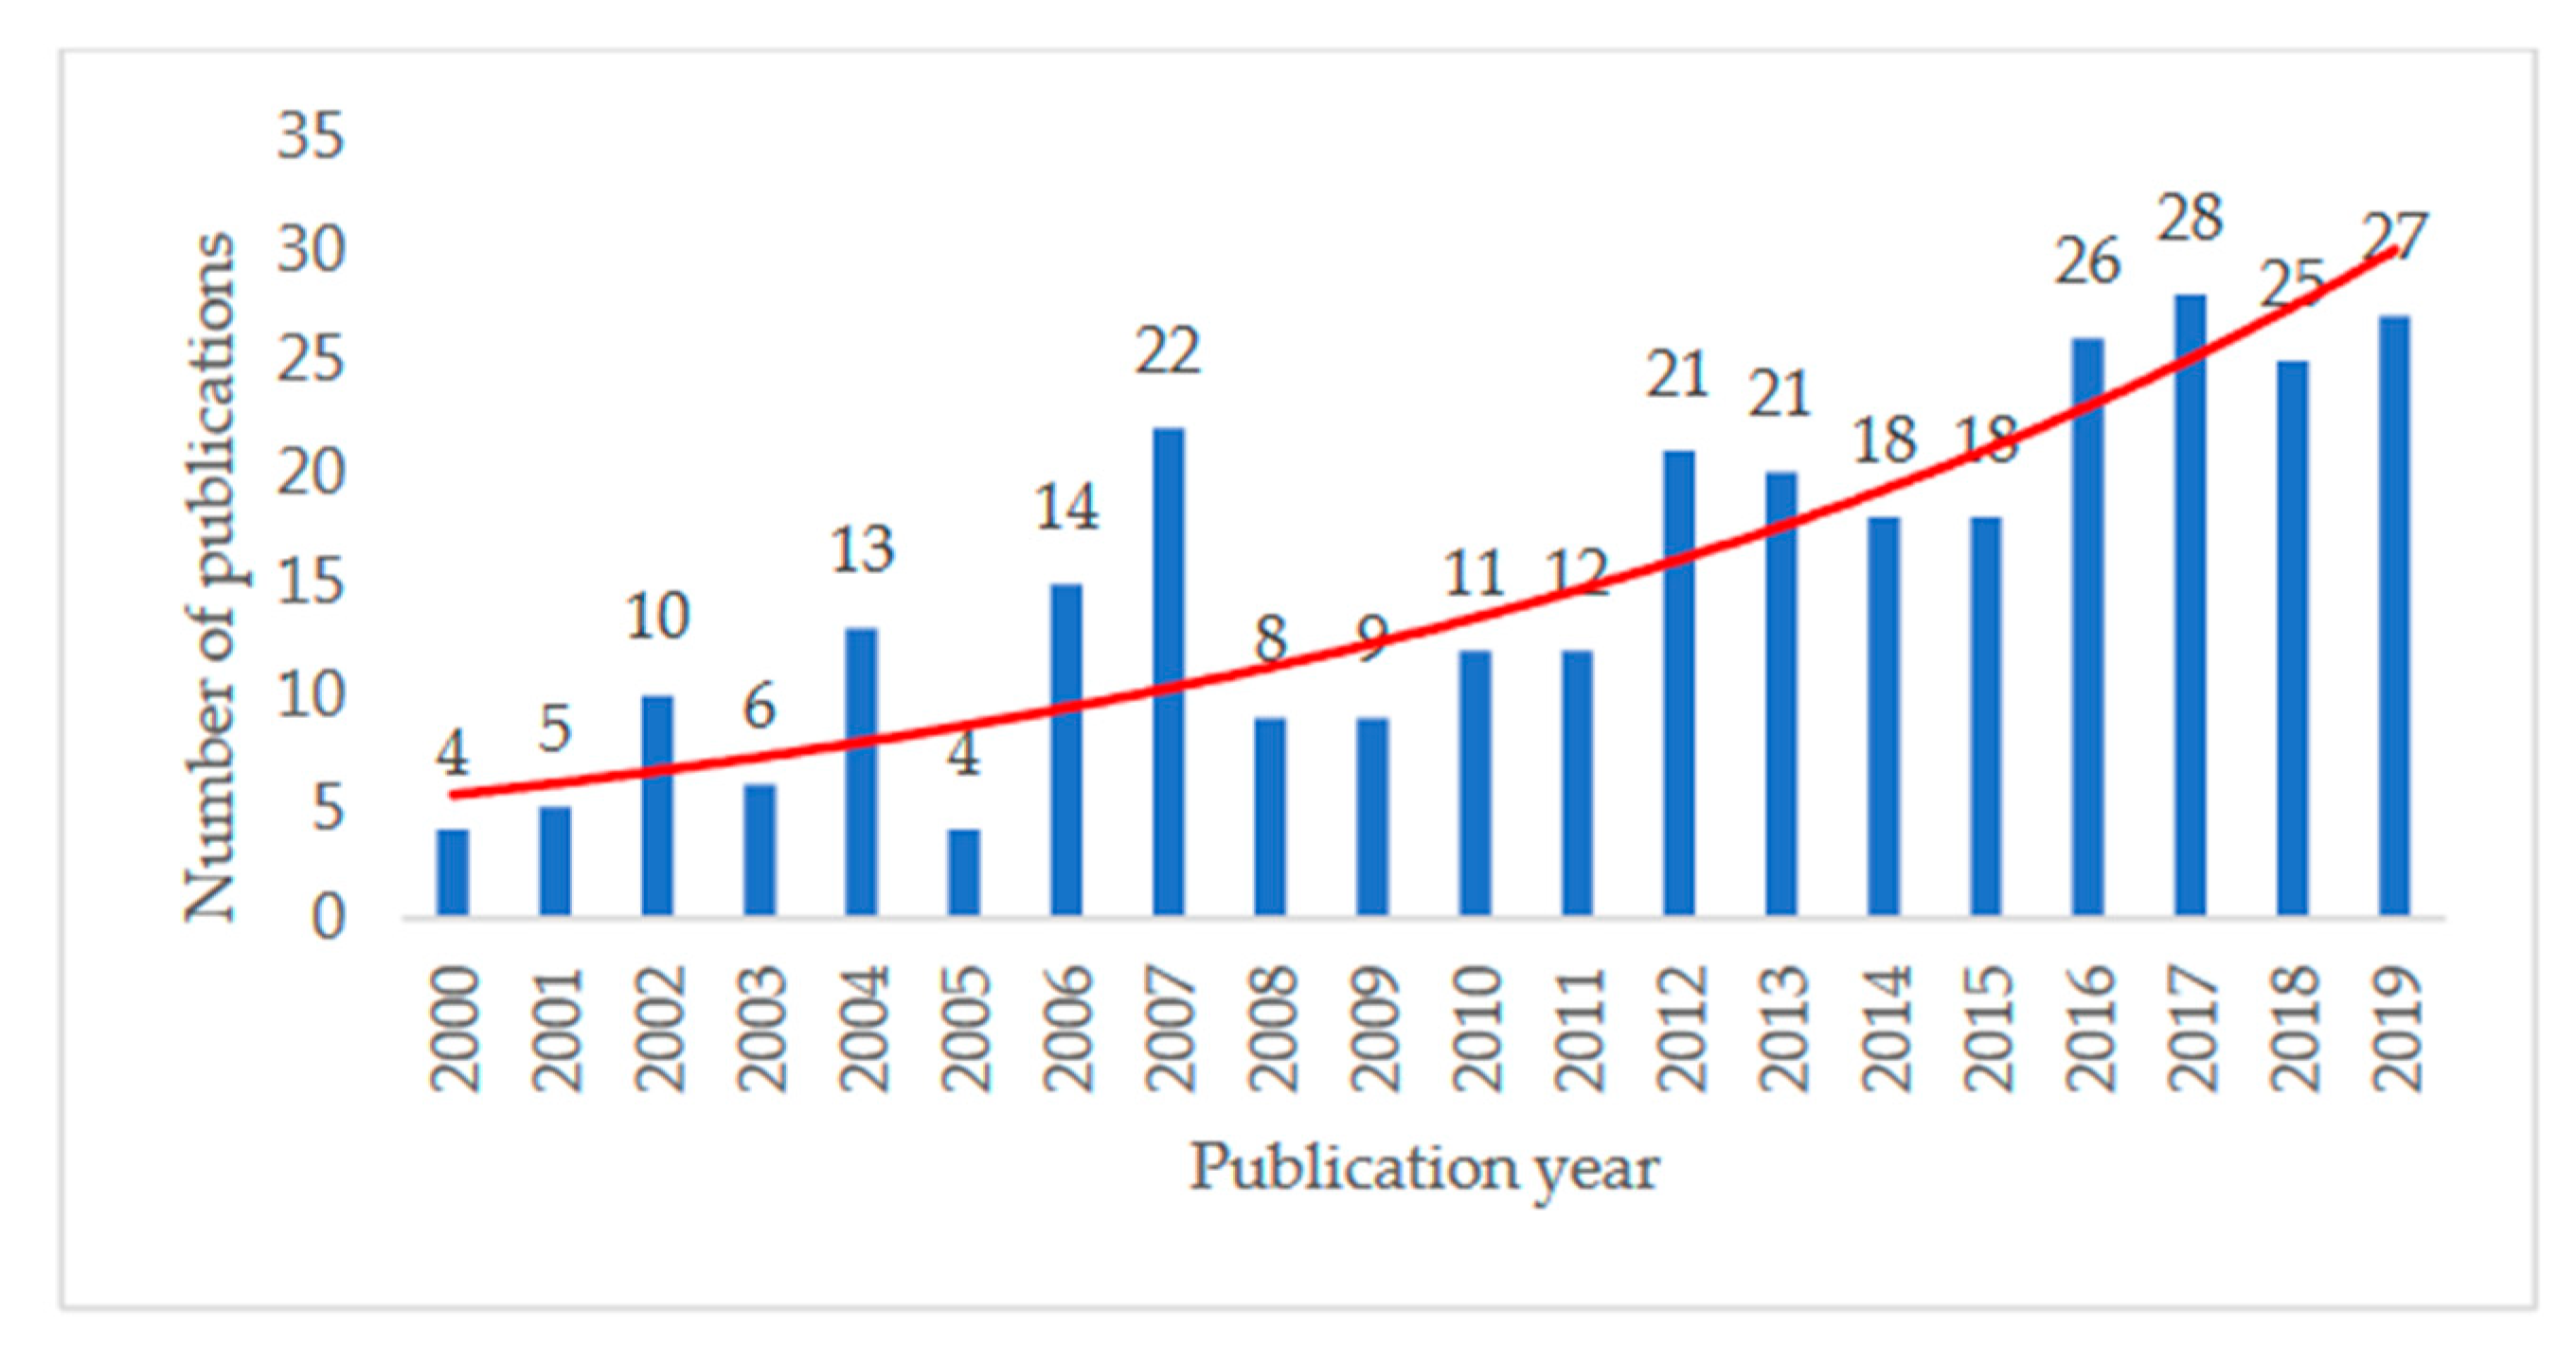
Figure 5.
Journal co-citation network visualization map.
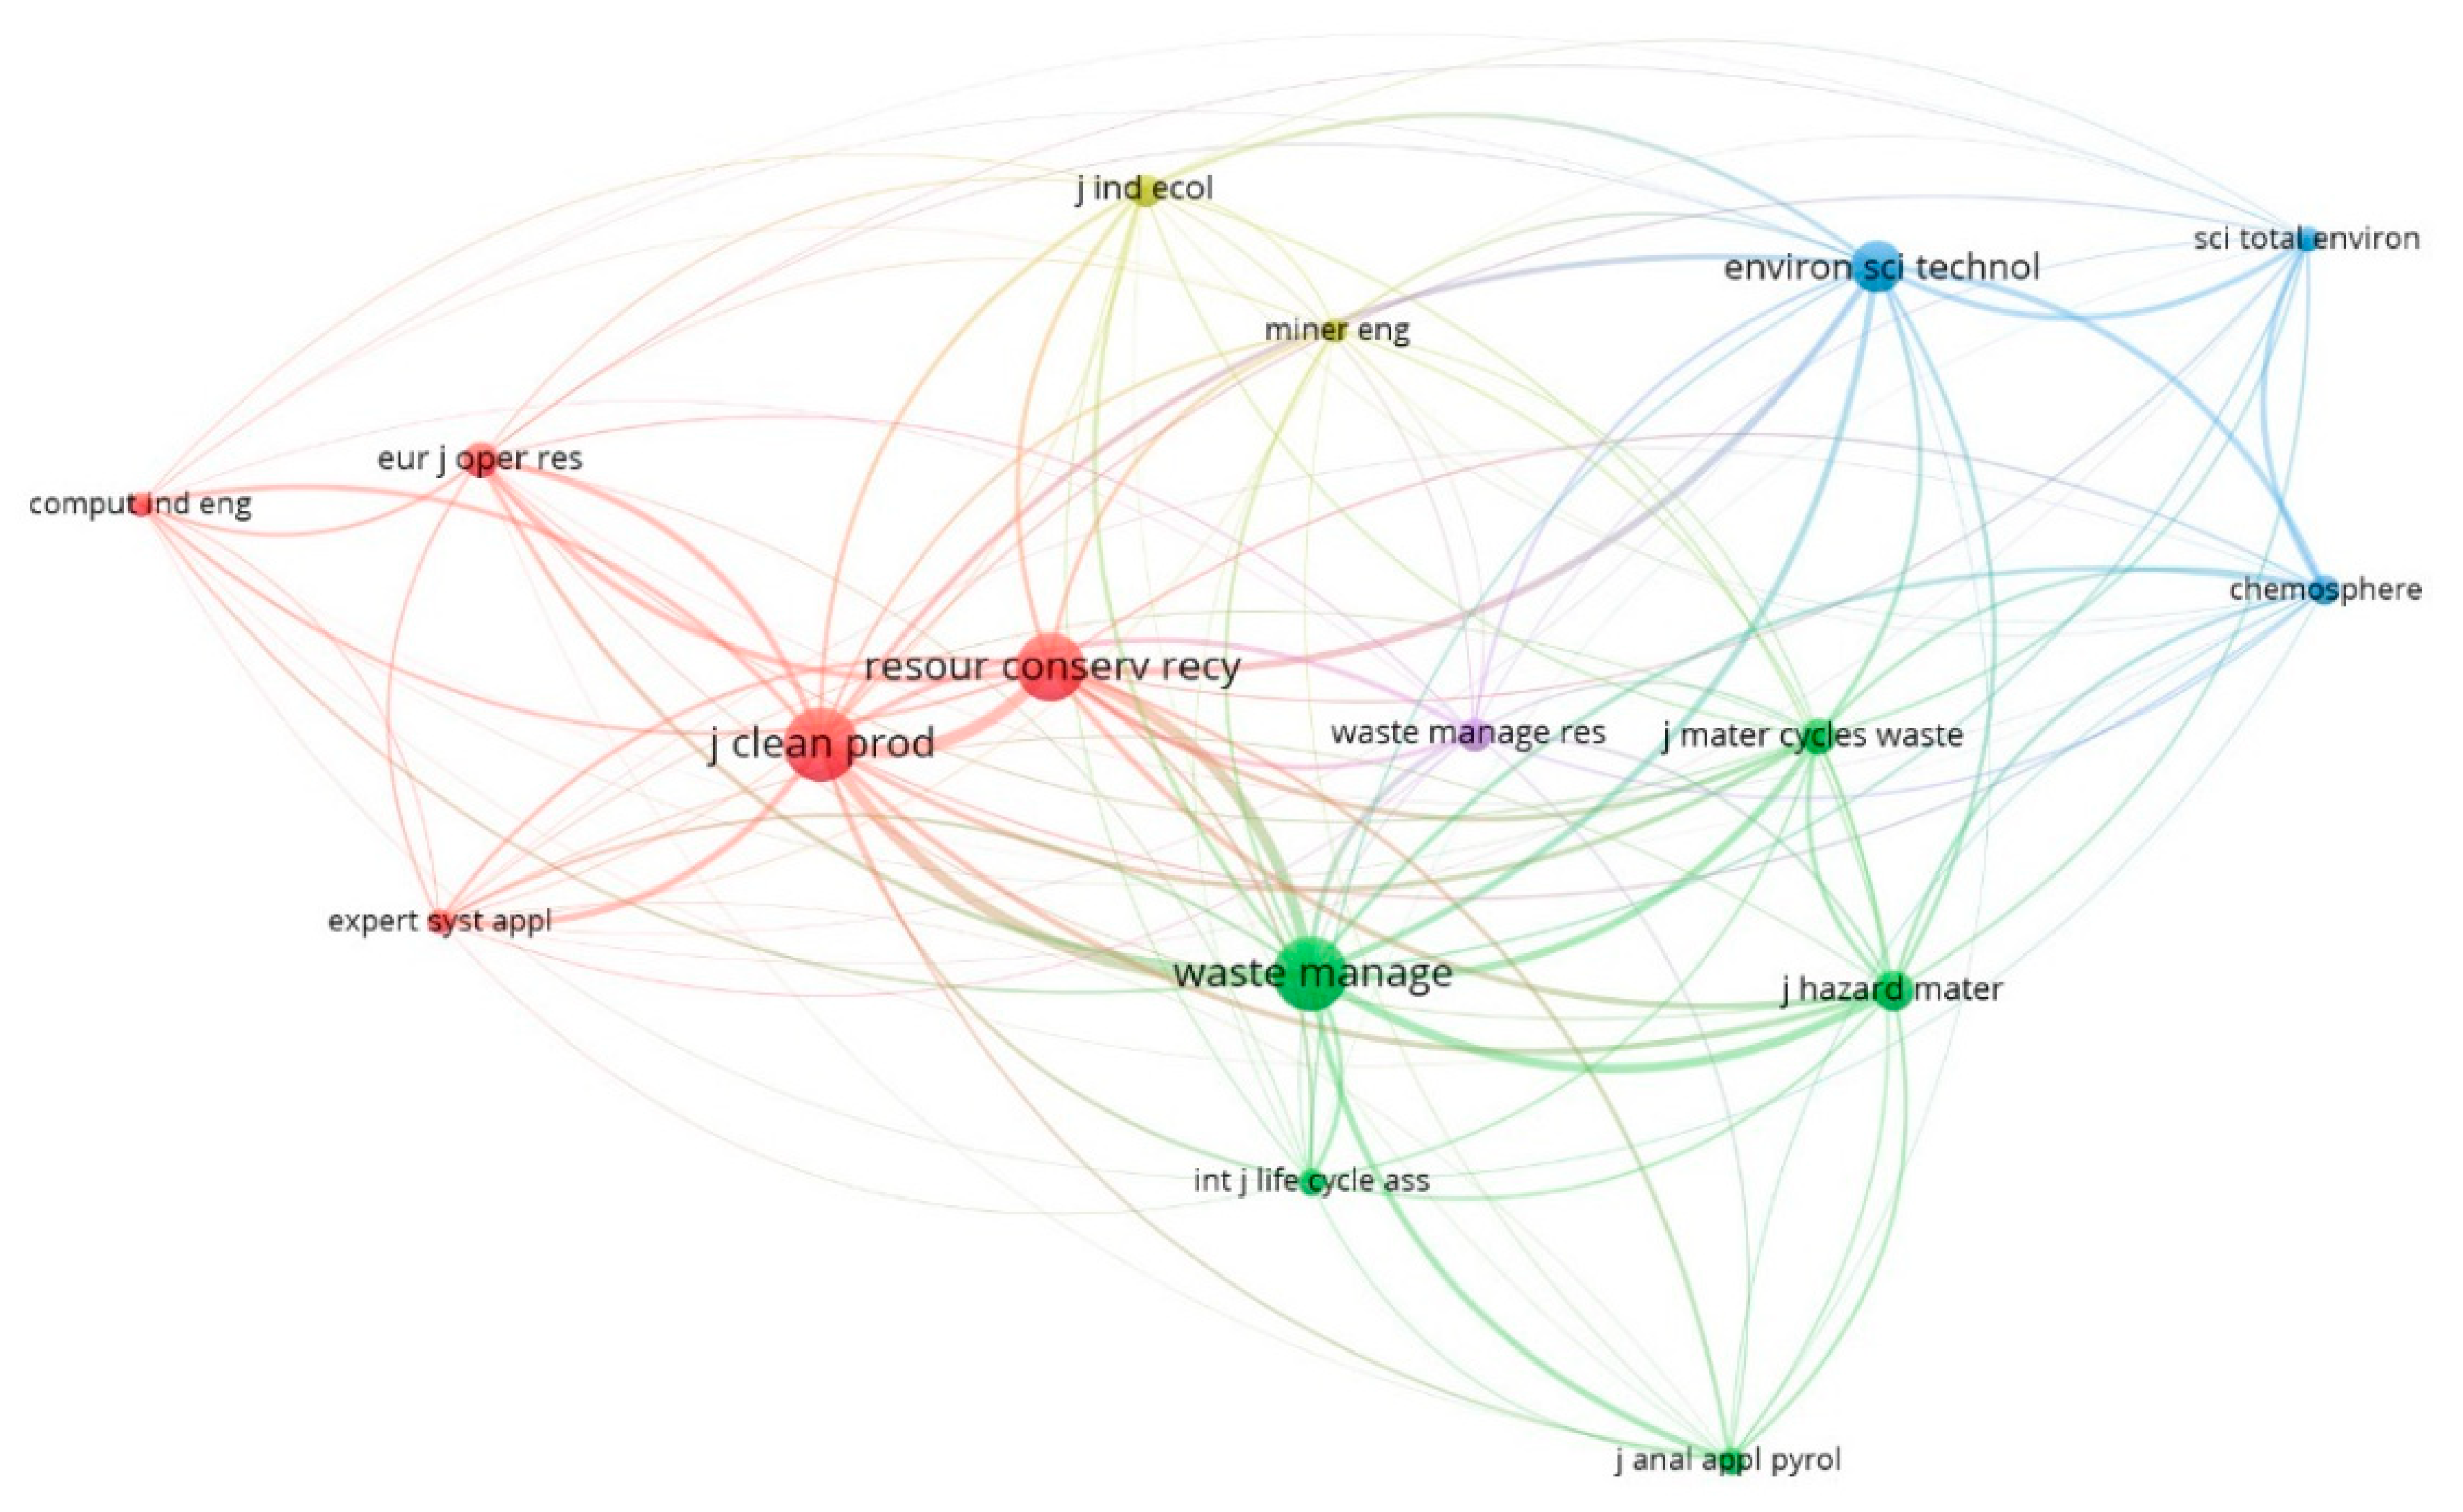
Figure 6.
The top 11 productive countries (TP ≥ 10).

Figure 7.
The collaboration network visualization map of the 42 representative countries.
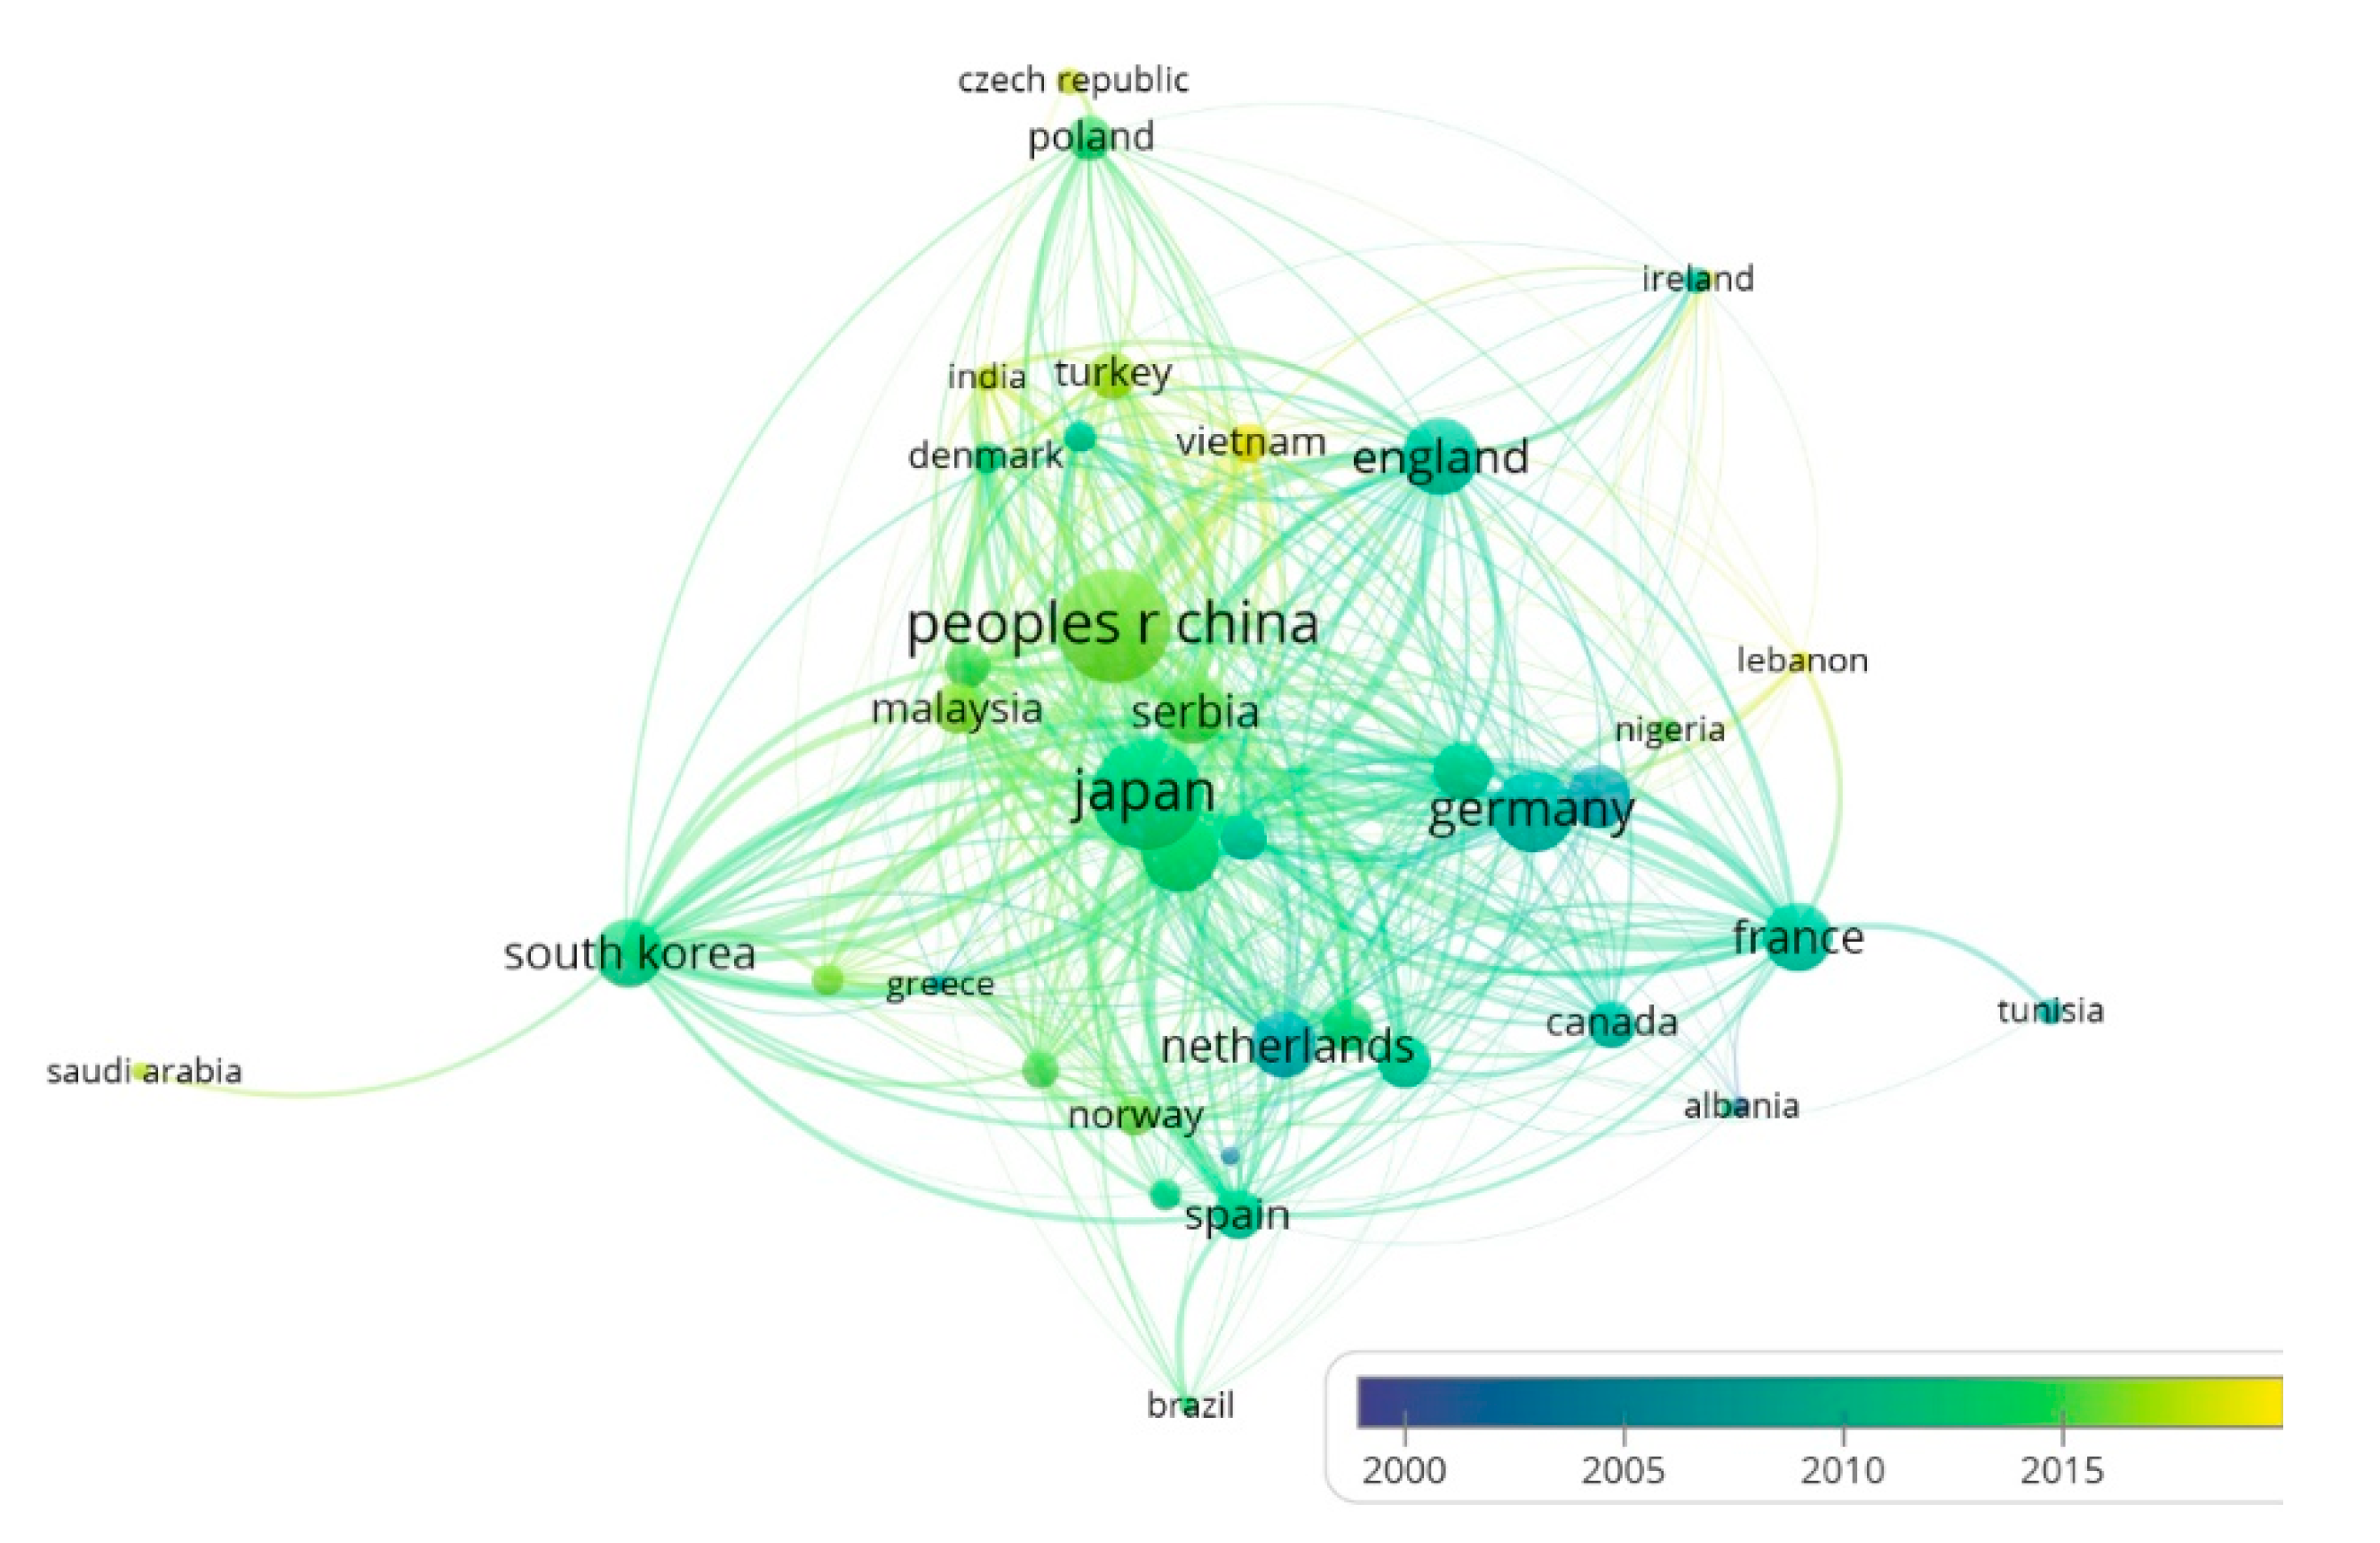
Figure 8.
Author co-citation network visualization map.

Figure 9.
Subject categories.
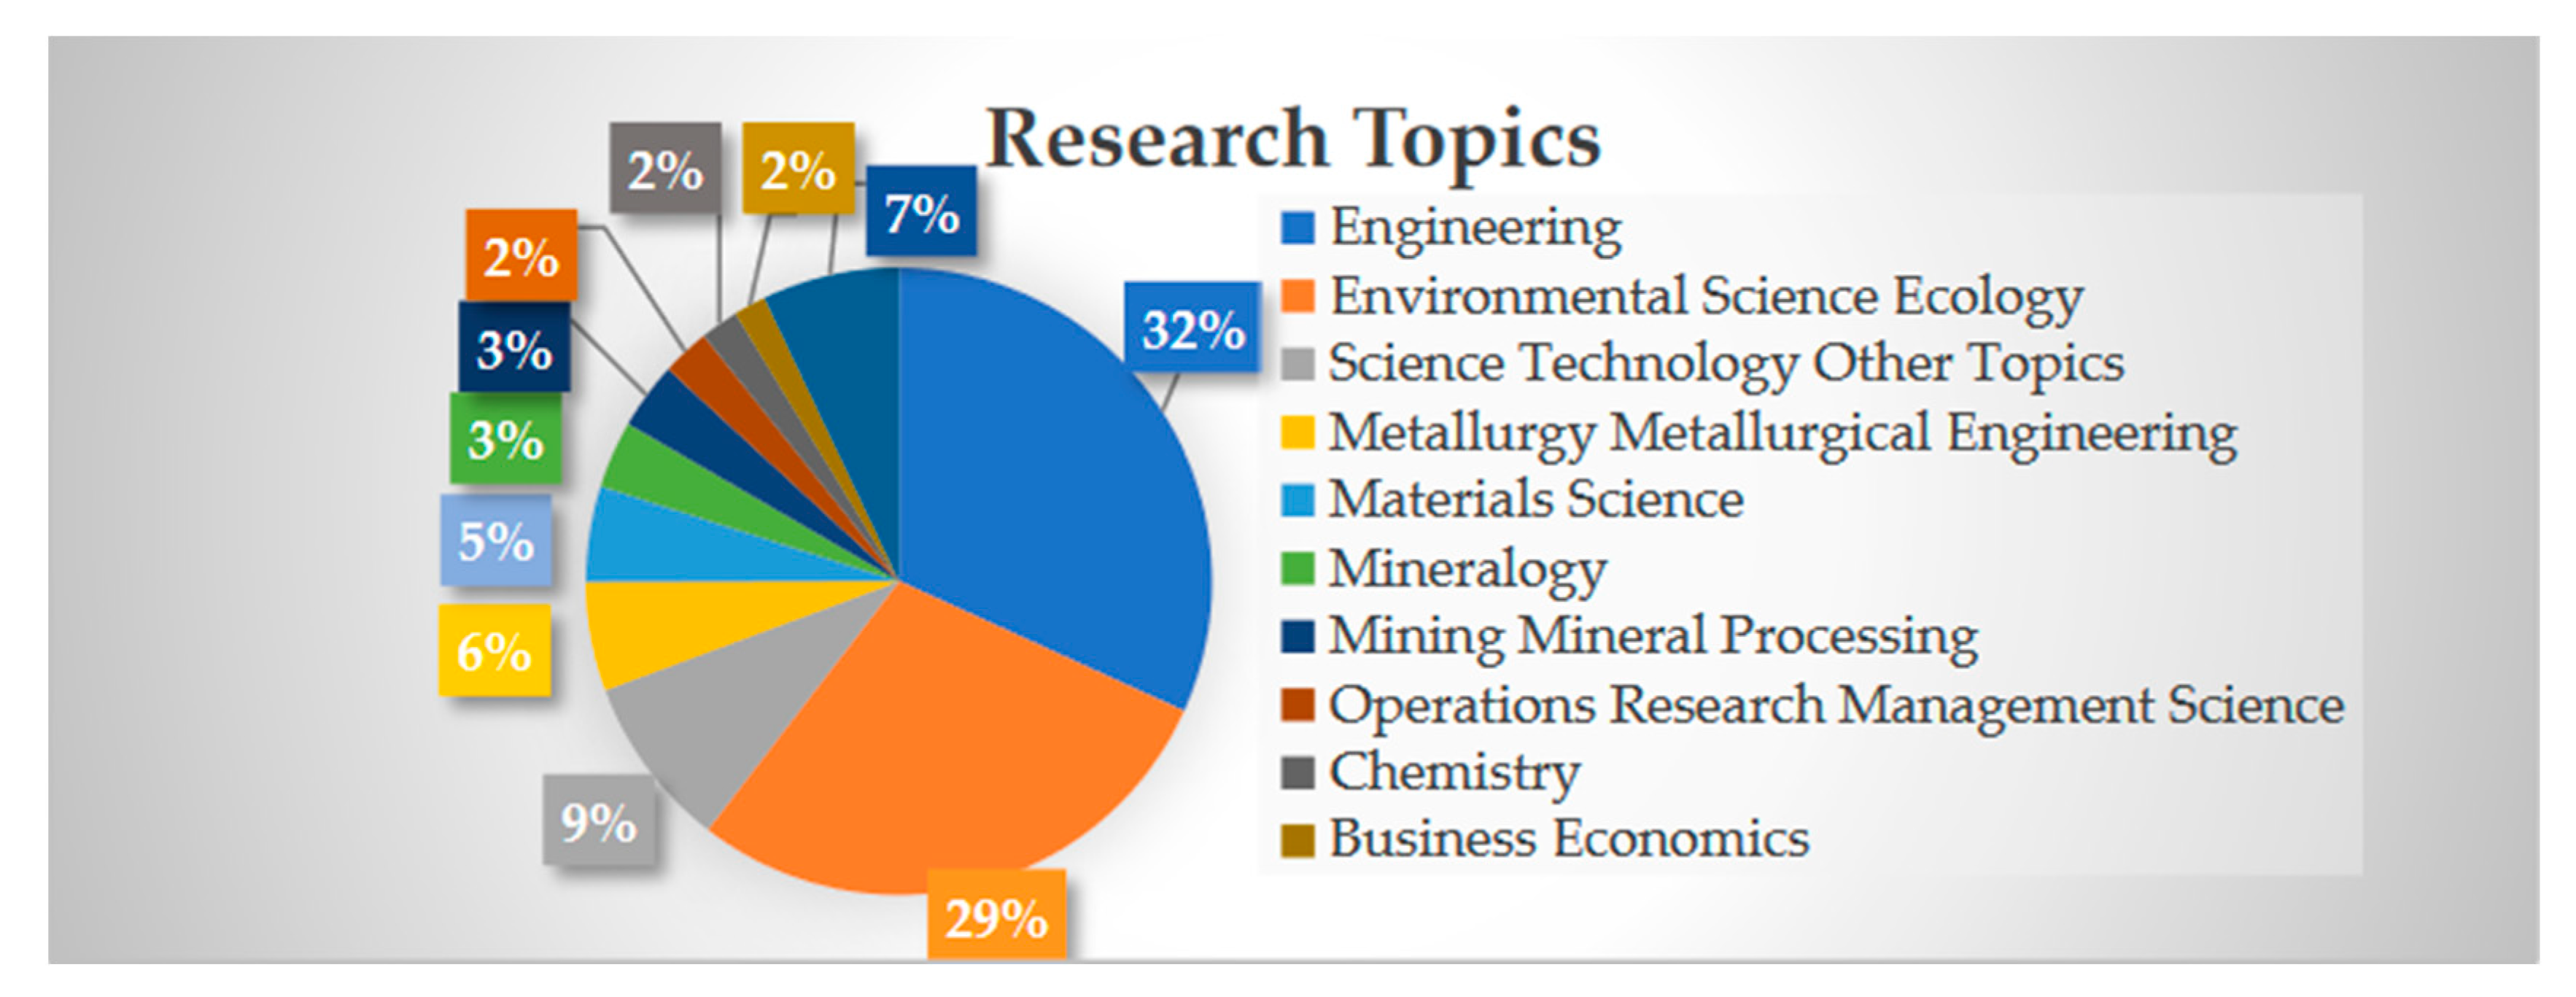
Figure 10.
The network visualization map of the 103 most frequently occurring keywords.

Figure 11.
Keywords citation bursts visualization map.

Table 1.
The performance of review papers related to reverse logistics of ELVs.
| Review Papers | Focus | Period | Number of Collected Literature |
|---|---|---|---|
| Sharma and Pandey [12] | ELVs processing | 2013–2019 | 41 |
| Karagoz et al. [13] | ELVs management | 2000–2019 | 232 |
| Rosa and Terzi [14] | ELVs waste streams | 2001–2015 | 35 |
| Cucchiella et al. [15] | Automotive electronics | 2000–2014 | 50 |
| Buekens and Zhou [16] | Automotive shredder residue plastics | 1977–2012 | 76 |
| Gan and He [17] | Reverse logistics | 2002–2013 | 38 |
| Zhang and Chen [18] | Automotive plastics | 1993–2012 | 63 |
| Simic [2] | Environmental engineering issues | 2003–2012 | 93 |
| Go et al. [19] | Disassemblability | 1992–2010 | 38 |
| Nourreddine [20] | Shredder residue treatment | 1991–2004 | 26 |
Table 2.
The performance of the 10 most leading journals.
| TP | Percentage | Journal | TC | Impact Factor | H-Index |
|---|---|---|---|---|---|
| 34 | 11.565% | Journal of Cleaner Production | 855 | 7.246 | 19 |
| 32 | 10.884% | Waste Management | 642 | 5.448 | 15 |
| 25 | 8.503% | Resources Conservation and Recycling | 685 | 7.044 | 15 |
| 13 | 4.422% | Journal of Material Cycles and Waste Management | 150 | 1.974 | 8 |
| 13 | 4.422% | Waste Management Research | 124 | 2.771 | 8 |
| 12 | 4.082% | Jom | 188 | 2.029 | 8 |
| 11 | 3.741% | Environmental Science & Technology | 223 | 7.864 | 8 |
| 7 | 2.381% | Minerals Engineering | 243 | 3.795 | 7 |
| 6 | 2.041% | Journal of Industrial Ecology | 179 | 6.539 | 5 |
| 5 | 1.701% | Sustainability | 22 | 2.592 | 3 |
TP = Total Publications; TC = Total Citations.
Table 3.
The top 10 influential institutions.
| Institution | Country | TP | H-Index | TC | CP | %TP |
|---|---|---|---|---|---|---|
| Shanghai Jiao Tong University | Peoples R China | 18 | 9 | 289 | 16.1 | 6.1 |
| University of Belgrade | Serbia | 14 | 10 | 209 | 14.9 | 4.8 |
| Tohoku University | Japan | 11 | 6 | 168 | 15.3 | 3.7 |
| National Institute for Environmental Studies—Japan | Japan | 11 | 5 | 159 | 14.5 | 3.7 |
| Delft University of Technology | Netherlands | 9 | 9 | 342 | 38 | 3.1 |
| Kyoto University | Japan | 9 | 4 | 90 | 10 | 3.1 |
| National Institute of Advanced Industrial Science Technology Aist | Japan | 8 | 6 | 100 | 12.5 | 2.7 |
| Yonsei University | South Korea | 7 | 6 | 138 | 19.7 | 2.4 |
| University of Tokyo | Japan | 7 | 4 | 61 | 8.7 | 2.4 |
| University of Bologna | Italy | 6 | 6 | 257 | 42.8 | 2.0 |
Table 4.
Information on the 10 most influential researchers.
| Author | H-Index | Country | TP | TC | Institute |
|---|---|---|---|---|---|
| Chen, M | 8 | Peoples R China | 16 | 226 | Shanghai Jiao Tong University |
| Simic, V | 10 | Serbia | 13 | 208 | University of Belgrade |
| Reuter, MA | 8 | Australia | 8 | 310 | University of Melbourne |
| Seo, YC | 6 | South Korea | 8 | 162 | Yonsei University |
| Nakajima, K | 6 | Japan | 11 | 165 | University of Tokyo |
| Dimitrijevic, B | 6 | Serbia | 6 | 129 | University of Belgrade |
| Nakamura, S | 5 | Japan | 5 | 149 | Waseda University |
| Santini, A | 5 | Italy | 5 | 248 | University of Bologna |
| Passarini, F | 5 | Italy | 5 | 248 | University of Bologna |
| Matsubae, K | 5 | Japan | 8 | 155 | Tohoku University |
Table 5.
The top 10 frequently cited articles between 2000 and 2019.
| Articles | Journal | TC |
|---|---|---|
| Schultmann et al. [34] | European Journal of Operational Research | 154 |
| Gerrard and Kandlikar [35] | Journal of Cleaner Production | 144 |
| Cruz-Rivera and Ertel [36] | European Journal of Operational Research | 101 |
| Zhang et al. [40] | Resources Conservation and Recycling | 100 |
| Michalek et al. [39] | Journal of Mechanical Design | 82 |
| Ferguson and Browne [37] | Production Planning & Control | 78 |
| Morselli et al. [42] | Waste Management | 74 |
| Ragaert et al. [41] | Waste Management | 72 |
| Nourreddine [20] | Journal of Hazardous Materials | 69 |
| Mazzanti and Zoboli [38] | Ecological Economics | 69 |
Table 6.
Summary of the characteristics of the ELVs reverse logistics network.
| References | Network Structure | Optimization Models | Single-Multi Objective | Type of Objective Functions | Type of Parameters | Solution Approach | |||||||||
|---|---|---|---|---|---|---|---|---|---|---|---|---|---|---|---|
| OLSC | CLSC | LP | MILP | MINLP | Single | Multi | Max | Min | Det. | Prob. | Fuzzy | E | H | MH | |
| Schultmann et al. [34] | √ | √ | √ | √ | √ | √ | |||||||||
| Mansour and Zarei [64] | √ | √ | √ | √ | √ | √ | |||||||||
| Cruz-Rivera and Ertel [36] | √ | √ | √ | √ | √ | √ | |||||||||
| Zarei et al. [59] | √ | √ | √ | √ | √ | √ | |||||||||
| Mahmoudzadeh et al. [65] | √ | √ | √ | √ | √ | √ | |||||||||
| Vidovic et al. [66] | √ | √ | √ | √ | √ | √ | |||||||||
| Farel et al. [67] | √ | √ | √ | √ | √ | √ | |||||||||
| Gołębiewski et al. [60] | √ | √ | √ | √ | √ | ||||||||||
| Mahmoudzadeh et al. [68] | √ | √ | √ | √ | √ | √ | |||||||||
| Simic [63] | √ | √ | √ | √ | √ | √ | √ | √ | |||||||
| Simic [69] | √ | √ | √ | √ | √ | √ | √ | √ | |||||||
| Simic [70] | √ | √ | √ | √ | √ | √ | √ | ||||||||
| Simic [71] | √ | √ | √ | √ | √ | √ | √ | ||||||||
| Simic [57] | √ | √ | √ | √ | √ | √ | √ | ||||||||
| Demirel et al. [72] | √ | √ | √ | √ | √ | √ | |||||||||
| Phuc et al. [61] | √ | √ | √ | √ | √ | √ | √ | ||||||||
| Özceylan et al. [55] | √ | √ | √ | √ | √ | √ | |||||||||
| Lin et al. [58] | √ | √ | √ | √ | √ | √ | |||||||||
| Shankar et al. [73] | √ | √ | √ | √ | √ | √ | |||||||||
| Sun et al. [74] | √ | √ | √ | √ | √ | √ | |||||||||
| Kuşakcı et al. [11] | √ | √ | √ | √ | √ | √ | √ | ||||||||
| Zhang et al. [62] | √ | √ | √ | √ | √ | √ | √ | ||||||||
| Xiao et al. [56] | √ | √ | √ | √ | √ | √ | |||||||||
Publisher’s Note: MDPI stays neutral with regard to jurisdictional claims in published maps and institutional affiliations. |
© 2020 by the authors. Licensee MDPI, Basel, Switzerland. This article is an open access article distributed under the terms and conditions of the Creative Commons Attribution (CC BY) license (http://creativecommons.org/licenses/by/4.0/).
Share and Cite
MDPI and ACS Style
He, M.; Lin, T.; Wu, X.; Luo, J.; Peng, Y. A Systematic Literature Review of Reverse Logistics of End-of-Life Vehicles: Bibliometric Analysis and Research Trend. Energies 2020, 13, 5586. https://doi.org/10.3390/en13215586
AMA Style
He M, Lin T, Wu X, Luo J, Peng Y. A Systematic Literature Review of Reverse Logistics of End-of-Life Vehicles: Bibliometric Analysis and Research Trend. Energies. 2020; 13(21):5586. https://doi.org/10.3390/en13215586
Chicago/Turabian StyleHe, Meiling, Tianhe Lin, Xiaohui Wu, Jianqiang Luo, and Yongtao Peng. 2020. "A Systematic Literature Review of Reverse Logistics of End-of-Life Vehicles: Bibliometric Analysis and Research Trend" Energies 13, no. 21: 5586. https://doi.org/10.3390/en13215586
Note that from the first issue of 2016, this journal uses article numbers instead of page numbers. See further details here.