Ultrasonically-Assisted Dissolution of Sugarcane Bagasse during Dilute Acid Pretreatment: Experiments and Kinetic Modeling


School of Engineering, University of KwaZulu-Natal, Durban 4041, South Africa
*
Author to whom correspondence should be addressed.
Energies 2020, 13(21), 5627; https://doi.org/10.3390/en13215627
Submission received: 10 September 2020
/
Revised: 23 October 2020
/
Accepted: 24 October 2020
/
Published: 28 October 2020
(This article belongs to the Special Issue Bioresource Technology for Bioenergy: Development and Trends)
Abstract
:Ultrasonic irradiation is known to enhance various physicochemical processes. In this work, the effect of ultrasound on the dissolution of sugarcane bagasse was studied, with the specific aims of quantifying the effect at low solids loading and mild reaction conditions, and determining whether the enhancement of dissolution by ultrasound is independent of temperature. The effects of agitation speed, reaction time, and sonication were examined on the dissolution of the biomass substrate at varying reaction temperatures during the pretreatment process. Sugarcane bagasse was mixed with a 0.3 M solution of sulfuric acid in a reaction vessel to undergo pretreatment. A kinetic model was applied to the mass dissolution of the biomass, as sonicated runs showed higher mass losses at each reaction time, compared to the non-sonicated runs. The ultrasonic enhancement in mass dissolution was seen to increase for an increase in the reaction time. It was observed that the induction period for the dissolution was eliminated by the application of ultrasound. Ultrasound was found to be more effective than temperature at enhancing mass dissolution at low solids loadings, and the effect of ultrasound was also found to be dependent on the temperature employed.
1. Introduction
Biomass is an abundant source of carbon and is a widely used raw material for the production of bioenergy [1]. The composition of biomass allows for the development of a large scale bioindustry that utilizes the various components present in lignocellulosic biomass, thereby enhancing the value of the biomass [2]. Biomass is seen as a renewable source of energy and a highly available resource [1]. Types of biomass include crop extracts, wood, and animal waste. Sugarcane bagasse is a by-product from the processing of sugarcane and a form of lignocellulosic biomass. Bagasse is a fibrous material obtained from the remnants of sugarcane stalks that are milled to extract their vital juice, which is used to produce sugar [3]. The main constituent of the bagasse is cellulose, which is approximately 46%, while hemicellulose and lignin account for approximately 27% and 23% of the bagasse, respectively [4]. Bagasse may be regarded as a feedstock for biofuel production due to its low cost and high availability [5]. Sugarcane bagasse is widely used in industry as it can be converted into various valuable products such as biofuels (methanol, ethanol, etc.), paper, pulp, boards, biodegradable plastics, construction material, and certain chemicals [6].
Bagasse may be stored for long periods and is usually used to produce heat and electricity through combustion [7]. It may be used as a substrate for microbial production of products such as enzymes, organic acids, amino acids, protein rich animal feed, and as a source of carbon for the growth of filamentous fungi [8]. Filamentous fungi are useful producers of enzymes due to the high production level of enzymes and the ease of cultivation [8]. This type of fungi produces high levels of polysaccharide-degrading enzymes and are used to produce lignin modifying enzymes and industrial enzymes (e.g., amylases and cellulase) [8]. These enzymes may be utilized in industrial processes to eliminate the use of extreme pH and high temperatures, while providing increased product purity [8]. These enzymes also have a variety of biotechnological applications such as the production of food for animals and in the production of textiles, paper, and detergents [8].
Biofuels may be regarded as the future of the fuel industry due to its net low greenhouse gas emissions during combustion when compared to the combustion of fossil fuels and the ability to produce biofuels with lignocellulosic material, which do not compete with food crops [6]. Climate change as well as the effects of global warming have made biofuels an attractive option. Biofuels provide a renewable source of energy while reducing the effects on the environment significantly. Renewable biofuels are made through the use or conversion of biomass such as bagasse. Biomass can be converted to fuel sources in a variety of ways including physical conversion, thermal conversion, chemical conversion, and biochemical conversion [9]. Depending on the conversion technology used, biomass can be utilized in the production of liquid bio-based fuels such as ethanol [10]. The fuels produced from the conversion of biomass such as bio-ethanol and bio-diesel can be used in the transport sector. The use of these fuels will significantly reduce greenhouse gas emissions and reduce the demand placed on the processing and extraction of fossil fuels. Sugarcane bagasse plays an important role in the production of biofuels such as ethanol, however, it must undergo a multi-step process in order to be converted to biofuel [11]. The four main steps of biofuel production are: biomass pretreatment, enzymatic hydrolysis, fermentation, and recovery (e.g., distillation) [11]. Hence in the second generation biofuel scheme, pretreatment is a major step toward biofuel production, particularly ethanol.
Cellulose is generally the most desired component in lignocellulosic biomass, as it is a major component of plant matter and stores a large quantity of energy conserved by photosynthesis [12]. It is considered a polymer of glucose, however, the cellulose is entangled in hemicellulose and covered by lignin [13]. Cellulose found in biomass is a form of cellobiose, which consists of two glucose molecules [14]. It may have a crystalline or non-crystalline structure and is insoluble in water [14]. Hydrogen bonds aid in holding the crystalline structure together [15]. Cellulose is also insoluble in dilute acid solutions at low temperatures [14]. The solubility of cellulose is highly related to the degree of hydrolysis achieved [14]. Cellulose is soluble in concentrated acids, but is at risk of undergoing degradation. Cellulose also has good solubility in alkaline compounds [15]. At high temperatures, the polymer becomes soluble as there is enough energy to break the hydrogen bonds. For conversion of lignocellulosic biomass to biofuels such as ethanol, polymers such as cellulose must be broken down into the corresponding simple sugars so that microorganisms can process them. In order to access the cellulose and process it into its constituent sugars, the outer layer of lignin needs to be broken down.
Enzymatic hydrolysis is the process of using enzymes to break down cellulose into soluble glucose, which can then be used to produce paper, cotton textiles, and biofuels such as ethanol [16]. Enzymatic hydrolysis strongly depends on the operating conditions of the process (such as temperature, solids loading, enzyme loading, and pH), enzyme consumption (specific activity, enzyme recycling strategies, and stability), and the effect of product inhibitor on enzyme catalysis [17]. Normal enzymatic hydrolysis applied directly to raw lignocellulosic biomass is not effective in extracting the cellulose as the lignin remains intact and unaffected by the process [18]. This is due to the complex structure of the lignocellulosic biomass, ensuring that it is very recalcitrant and resistant to enzyme attack [1]. A combination of pretreatment with enzymatic hydrolysis processes is vital for the release of nutrients from the biomass. The pretreatment process therefore plays a vital role in weakening and breaking down the lignin layer. This enables the hydrolysis process to extract and break down the valuable cellulose into glucose. The parameters that influence effective pretreatment of lignocellulosic biomass are cellulose crystallinity, the presence of lignin, the surface area accessible to hydrolysis, and the presence of hemicellulose [9]. A variety of pretreatment techniques are used in industry to alter the physical and chemical structure of the biomass and improve hydrolysis rates. Pretreatment is essential to reduce the overall cost for production because the cost of pretreatment is a significant factor affecting the selling price of the end product (e.g., ethanol) [9]. There are a variety of pretreatment techniques, and each technique has its advantages and disadvantages.
Chemical pretreatment processes are initiated by chemical reactions to disrupt the biomass structure [14]. Chemical pretreatment is characterized by the use of inorganic or organic compounds, which interact with the intrapolymer and interpolymer bonds of the cellulose, hemicellulose, and lignin to disrupt the structure of the biomass [19]. Chemical pretreatment processes include acid hydrolysis, hydrothermal pretreatment, alkaline pretreatment, wet oxidation, and the use of deep eutectic solvents (DESs) [14]. Chemical pretreatment methods involve the dissolution of part of the biomass (mainly lignin and hemicellulose) to make the cellulose more accessible for further processing such as enzymatic hydrolysis. Chemical processes usually yield high recovery of glucose at the end of the entire process [14]. Deep eutectic solvents are a promising new class of solvents considered for the fractionation of lignocellulosic biomass and the dissolution of lignin, as lignin is highly soluble in deep eutectic solvents [20]. These are primarily liquid eutectic mixtures that are formed by the hydrogen bonding interaction of two or three components [20]. DESs are seen as green solvents and have a high potential for biomass processing as they are easily recycled and reused, biodegradable, easy to synthesize, have a low cost, and a low toxicity [21]. Cellulose (to a certain degree) and lignin both have good solubility with dilute alkaline solutions. Sodium hydroxide is an alkaline solution used to aid delignification. Types of dilute alkaline solutions include aluminum hydroxide, aluminum oxide, magnesium hydroxide, lithium hydroxide, potassium carbonate, and sodium carbonate [21].
Mercerization is an alkaline treatment method for cellulose fibers [22]. Mercerization is a process whereby textiles (mainly cotton, which is made of cellulose fibers) are treated with a caustic solution (e.g., sodium hydroxide) to improve properties such as fiber strength, dye affinity, luster, and shrinkage resistance [22]. It can also be used to improve the accessibility of cellulose and increases the effective surface area available for contact when processing lignocellulosic biomass [22]. Following the treatment with sodium hydroxide, the fibers are treated with an acid or water to neutralize the fibers. The degree of modification of the cellulose depends on the length of treatment, the temperature, and concentration of the dilute alkaline solution [23]. Alkaline pretreatment, using a variety of different chemical oxides and hydroxides of lithium, aluminum, magnesium, calcium, sodium, and potassium, is often used for the elimination of lignin. The alkaline pretreatments typically have longer processing times compared to acid pretreatment, and can form irrecoverable salts that are incorporated into the residual biomass.
Mechanical pretreatment involves the addition of a form of mechanical agitation to the biomass solution to break the structure of the biomass such as milling and grinding. Mechanical pretreatment processes result in a reduction in the particle size and an increase in pore size and specific surface area [14]. It also decreases the cellulose crystallinity and the degree of polymerization [9]. Steam explosion can be classified as a form of mechanical pretreatment, although there are also chemical actions involved. The biomass is subjected to high temperatures and pressures for a short period, and then the system is rapidly depressurized, which results in disruption of the fibrous structure [14]. Another method of mechanical pretreatment is the application of ultrasonic irradiation to the biomass solution, which uses ultrasonic vibration to disrupt the chemical and physical structure of the biomass such as delignification and surface erosion [24]. This disruption of the biomass structure occurs at different levels of interaction than chemical pretreatment processes and yields different products of transformation when compared to the chemical pretreatment methods.
Biological pretreatment involves the use of microorganisms such as white and brown rot-fungi to degrade lignin and hemicellulose in lignocellulosic biomass [14]. The use of microorganisms modifies the chemical composition and structure by degrading the lignin to make the cellulose more accessible for enzyme digestion or dissolution [25]. Biological pretreatments have mild operating conditions, usually no chemical requirements and low energy requirements [14]. A major disadvantage of biological treatment with microorganisms is that the processing time varies and may take up to 60 days in some cases, therefore it is viewed as too long to be economically viable for biofuel production [26]. Physiochemical pretreatment processes encompass a combination of physical changes and chemical reactions to disrupt the structure of the biomass [14]. The lignocellulosic biomass is treated at high temperatures or pressures, with an inorganic compound, which causes the disruption of its recalcitrant structure [26]. This type of pretreatment includes steam explosion, ammonia fiber explosion, and carbon dioxide explosion [14]. These processes have a low energy requirement and decrease the cellulose crystallinity [14].
Sonochemistry is regarded as the application of ultrasonic irradiation to physical and chemical processes to enhance and facilitate chemical reactions [27]. The phenomenon of acoustic cavitation is the mechanism that causes sonochemical effects in solutions and liquids [28]. Acoustic cavitation causes the formation, growth, and implosive collapse of bubbles in a liquid [29]. This results in a pressure difference, which acts to overcome the adhesion and cohesion forces of the liquid or solution undergoing ultrasonication [30]. The cavitation produced by the ultrasound releases large amounts of heat energy and mechanical energy, which enhances physical and chemical processes such as synthesis and catalysis [30]. Acoustic cavitation occurs at low frequencies (20–100 kHz), where most of the energy from the ultrasound waves are dissipated into the medium [31]. Sonochemical reactions undergo an increase in reaction rate and reaction output [28]. When ultrasound is applied for biomass dissolution, there are both mechanical and chemical effects. On the mechanical side, microjetting and microstreaming occur. The collision of microjets, formed by acoustic cavitation, with particles result in shearing and pitting of the particle surfaces, increasing the surface area available for reaction with the liquid medium. Microstreaming disperses very fine particles and facilitates uniform dissolution [32]. The energy added to the reaction medium by ultrasonic irradiation is also utilized locally to accelerate the chemical reaction of the dissolution agent (e.g., acid) and the biomass.
The primary hypothesis for this study was that ultrasonic irradiation improves the dissolution of biomass and that this effect is independent of temperature. The secondary hypothesis was that the ultrasonic irradiation will have a greater influence on performance than temperature when a low solid loading is employed since there would be increased contact for permeation of the acid into the biomass, and propensity for acoustic cavitation. The effect of ultrasonication on the dissolution of biomass during dilute acid hydrolysis was investigated in this work. The study considered dilute acid hydrolysis, since the corrosiveness of the reaction mixture is not as great as the concentrated acid pretreatment process, invariably reducing equipment costs. A low solid loading of biomass was used, which has not been reported in the literature, particularly with the application of ultrasound. Two key objectives were identified in this study. The first was to examine the effect of sonication on the dissolution of bagasse using varying reaction times and temperatures during dilute acid hydrolysis. The second objective was to compare the dissolution with and without the use of sonication and apply a simple kinetic model to the results obtained to further quantify the effect.
2. Materials and Methods
2.1. Materials
The sugarcane bagasse used in the experiment was obtained from Maidstone Sugar mill in Tongaat, Durban, South Africa. The bagasse used contained both fiber and pith fractions. Sieve tray analysis was done and determined that the bagasse used was above a particle size of 600 μm. Further characterization of the bagasse was carried out, with the methods reported is a separate study [33]. A summary of the main characteristics of the bagasse are provided in Table 1. Sulfuric acid (98%, 18.42 M) and deionized water were obtained from Sigma Aldrich. The sulfuric acid was diluted to 0.3 M using deionized water.
2.2. Experimental Setup
For the pretreatment of raw bagasse, a water bath (Labotec, Johannesburg, South Africa) was set up at the base of the experimental apparatus. A temperature controller (Labcon, Krugersdorp, South Africa) was used to set and maintain the temperature of the water bath. The water bath could be operated between 30 °C and 70 °C. The base of the ultrasonic probe (Intelligent, Hangzhou, China) was placed next to the water bath. The reaction vessel was placed inside the water bath and held up by a clamp attached to a stand. Reaction volumes between 0.5 L and 1.5 L could be used. The overhead stirrer (IKA, Staufen Germany) and ultrasonic probe were placed in the reaction vessel and held in place using clamps attached to two stands. The full experimental setup is shown in Figure 1. Residual solids were separated from the mixture after treatment via vacuum filtration.
2.3. Experimental Campaign—Classical Approach
Preliminary experiments and a review of conditions in the literature assisted in the selection of test parameters for this study. The main variables examined in this study were agitation speed, reaction temperature, reaction time, and sonication. The campaign, which is characteristic of a classical approach to experiments, was divided into two parts: the set of experiments for determining optimum agitation speed (and hence kinetic regime) and the set of experiments for investigating kinetics.
The ultrasonic probe was set and maintained at 300 W power. Sulfuric acid was supplied to the laboratory at a concentration of 98%. This was diluted using deionized water. Since the density of bagasse is low and a low mass of bagasse was used for pretreatment, a 0.3 M solution of sulfuric acid was used, as it provided adequate mass dissolution without charring the bagasse. The bagasse was dried in an oven, following pretreatment, at a temperature of 80 °C. The bagasse was left in the oven for 12 h to ensure all moisture was removed from the bagasse. This was a non-standardized procedure that was used to ensure a sufficiently high solids content for the pretreatment. A paddle impeller consisting of two paddle blades was used to allow the use of higher agitation speeds, while ensuring no frothing and vortexing occurred within the reaction vessel. Low water bath temperatures of 30 °C and 40 °C were used as there was no frothing observed in the reaction vessel at these temperatures, and adequate dissolution was observed at low solids loadings. These low temperatures are also better for large scale operation as they are more economically attractive
2.3.1. Experimental Study of Agitation Speed
The effect of stirrer speed on the pretreatment of bagasse was tested during this study in order to determine the kinetically controlled regime and eliminate mass transfer resistance effects. The speed (rpm) of the overhead stirrer was optimized to ensure adequate mixing of the slurry solution, without frothing and splashing, to ensure there was no mass lost during pretreatment. The mixing here refers to the mixing of the heterogeneous suspension, maintaining a uniform distribution of solids in the liquid medium. Sedimentation and floatation of solid material was observed when no agitation was applied. Trial runs were done to determine a feasible speed range. A 2 L round glass vessel was used and this allowed an increase in the stirrer speed being used, as splashing occurred at stirrer speeds above 800 rpm. Since the density of bagasse is low and a low mass of bagasse was used for pretreatment, an agitation speed range of 500–750 rpm was used to obtain the optimum agitation speed. Too low of a speed resulted in inefficient mixing of the slurry solution. A water bath temperature of 40 °C was selected, with a reaction time of 30 min for agitation speed runs as this was seen to provide adequate dissolution. The initial moisture content was kept within the range of 45–55%.
2.3.2. Experimental Study of Reaction Time and Temperature
The effect of varying the reaction temperature was tested in the pretreatment of raw bagasse. Since high temperatures are known to favor the formation of inhibitory by-products and accelerate the loss of cellulose from the residual solids, a set of low temperatures was used. A relatively tight temperature range of 10 °C was chosen as this restricted the temperatures employed to close to room temperature, which would result in lower heating costs in higher capacity processes. The study tested the pretreatment of bagasse by hydrolysis using sulfuric acid at temperatures of 30 °C and 40 °C. The agitation speed used was selected from the agitation speed design (agitation speed that resulted in highest dissolution in the previous experimental phase). The initial moisture content was kept within the range of 45% to 55%. The reaction time was varied from 5 min to 30 min in intervals of 5 min and the mass dissolution trends observed. The experimental data were fitted to a simple kinetic model of the system in order to determine the kinetic parameters.
2.3.3. Experimental Study of Ultrasonic Irradiation
The effect of sonication on the pretreatment of bagasse was tested by adding an ultrasonic probe during the pretreatment process. The ultrasonic probe was set to a power of 300 W. This was based on previous work and the observed safe operation of the equipment under long load times at this setting. The ultrasonic probe had the effect of adding kinetic energy to the pretreatment process and aiding in the contact between the bagasse and sulfuric acid. A low solid loading was used to enhance the effect of the sonic probe during pretreatment. Reaction conditions were similar to those used for the reaction time runs, with the addition of the ultrasonic probe and the reduction in the applied water bath temperature to account for the heat added to the system by the ultrasonic probe.
The equation to calculate the mass dissolution is given by:
2.4. Experimental Procedure
2.4.1. Experimental Procedure for Optimum Agitation Speed
A total of five runs were conducted. A dilute sulfuric acid solution (0.3 M) was prepared by mixing 98% sulfuric acid with deionized water in a fume hood. The oven temperature was set to 80 °C. The water bath was switched on and set to a temperature of 40 °C. Bagasse of 15 g was measured into the 500 mL beaker for each run to keep a constant mass. The moisture analyzer was set to 100 °C, with the time limit set to automatic. The initial moisture content was then measured by placing a small amount of bagasse (1–1.5 g) into the analyzer. The ratio of bagasse to sulfuric acid was 1 g bagasse to 50 mL of sulfuric acid based on the initial dry mass of bagasse. The sulfuric acid and bagasse were added to the reaction vessel to create a slurry solution with low solids loadings. The reaction vessel was placed in the water bath with the neck of the vessel being above the water. The reaction vessel was then clamped onto a stand. The overhead stirrer was placed above the reaction vessel with the stirrer submerged in the slurry solution. The agitation speed was set manually on the analogue stirrer. The agitation speed was varied for each run. Agitation speeds of approximately 500 rpm, 575 rpm, 625 rpm, 675 rpm, and 750 rpm were used. The selection of these speeds was based on prior work with the experimental system, visually observing better distribution of the solid material in the vessel with little frothing or vortexing. The optimization criteria for agitation speed was the maximum mass dissolution (with other parameters fixed), which is indicative of correct contacting of the liquid and solid phases, and movement out of the mass transfer controlled regime into the kinetic regime.
The run was conducted for a reaction time of 30 min, with the reaction temperature being checked intermittently (with the use of a thermometer). A plastic jug was filled with water and ice to make an ice bath. Following pretreatment, the reaction vessel was placed in the ice bath to quench the reaction mixture. The reaction mixture was stirred while in the ice bath to ensure even cooling of the mixture. This was done until the temperature of the reaction mixture dropped below 10 °C. The mass of the filter paper was measured. The filter paper was placed inside the filter funnel and the slurry solution was filtered under suction for 30 min to remove the hydrolysate and ensure that only solids remained. The watch glass was weighed, and mass recorded. The remaining solids were placed on the watch glass (with the filter paper) and left in the oven for 12 h to remove excess water. The watch glass was removed from the oven and left to cool. The mass of the watch glass (including bagasse and filter paper) was measured. A small quantity of the remaining solids (1–1.5 g) was placed in the moisture analyzer and the final moisture of the bagasse was determined. Final dry mass was obtained by subtracting the moisture content from the initial and final dry mass and then subtracting the final dry mass from the initial dry mass of bagasse.
2.4.2. Experimental Procedure for Non-Sonicated Reaction Time Runs
The experimental procedure for the non-sonicated runs were similar to the experimental procedure for the agitation speed experimental phase. The start-up procedure was the same, however, reaction time was varied instead of the agitation speed and two reaction temperatures examined. A total of 12 runs were conducted. Water bath temperatures of 30 °C and 40 °C were used for all reaction times used. The agitation speed was set to 625 rpm, as this was found to be the optimum from the agitation speed results, and was indicative of correct contacting of the liquid and solid phases and operation in the kinetic regime. The reaction time was varied from 5 min to 30 min in steps of 5 min (i.e., run 1 had a reaction time of 5 min, run 2 had a reaction time of 10 min, run 3 had a reaction time of 15 min, and so on). The reaction temperature was measured throughout each run.
2.4.3. Experimental Procedure for Sonicated Reaction Time Runs
A total of 12 runs were conducted. The experimental procedure for the sonicated and non-sonicated runs were the same, however, a sonic probe was inserted into the reaction vessel together with the overhead stirrer (at a reaction time of 0 min) for the sonicated runs. Water bath temperatures of 20 °C and 30 °C were used to simulate the same reaction temperature that existed in the non-sonicated runs (i.e., 30 °C and 40 °C respectively), as it was determined that the ultrasonic probe added heat to the system. The reaction temperatures inside the vessel were therefore the same for both sonicated and non-sonicated runs.
2.5. Estimation of Measurement Uncertainties
Temperature uncertainties were estimated to be ±0.5 °C from the platinum resistance thermometer installed on the temperature controller. The uncertainty in the gravimetric measurements were on average ±0.04 g. Consequently, the average relative uncertainty in the measurement of mass dissolution was 5% of the reported values. These have been indicated as error bars in Figure 2, Figure 3 and Figure 4 in the Results and Discussion Section.
3. Results and Discussion
The dissolution of sugarcane bagasse was quantified at varying agitation speeds, reaction temperatures, and reaction times. Sieve tray analysis was done to determine the size distribution of the bagasse used for experimentation (Table 2). It was determined that approximately 30% of the bagasse particles had a size greater than 11,200 µm. The bagasse used consisted mainly of particle sizes above 600 μm. Gravimetric measurements and moisture analyses were done before and after the dilute acid treatment to determine the total mass lost from the bagasse. The fraction of mass lost (in terms of percentage mass dissolution) was assumed to be a majority of hemicellulose with some portions of lignin. This was due to the slightly brown color of the hydrolysate. Lignin is an aromatic polymer, whereas the sugars formed from dilute acid hydrolysis of hemicellulose are polysaccharides and monosaccharides that are usually colorless or transparent.
3.1. Effect of Agitation Speed
The mass dissolution given in Equation (1) is defined on the dry basis of the bagasse, since the moisture content before and after pretreatment was measured and subtracted from the total mass. This measure of pretreatment performance was adopted from the literature [34]. From Figure 2, it can be seen that the mass dissolution initially increases with an agitation speed between 550–625 rpm, followed by a gradual decrease between 625–750 rpm. The results are significant, taking into account the experimental uncertainties, as indicated by error bars in Figure 2. An agitation speed of 625 rpm was seen to have the highest mass dissolution with 18%. Agitation speeds between 500–625 rpm provided inefficient mass transfer between the aqueous phase and bagasse and resulted in poorer dissolution results, with 500 rpm having a mass dissolution of 6.95%, and 575 rpm having a mass dissolution of 15.39%. This is indicative of the mass transfer controlled regime. Agitation speeds greater than 625 rpm resulted in inefficient mixing as frothing, foaming, and vortexing occurred at higher temperatures and higher agitation speeds. This resulted in less contact between the bagasse and sulfuric acid, which resulted in a lower mass dissolution. Further experimentation was constrained to an agitation speed of 625 rpm.
3.2. Effect of Reaction Temperature
Figure 3a,b show the effect of increasing the reaction temperature on the pretreatment of bagasse. The non-sonicated temperature runs revealed an increase in the dissolution with an increase in time, which was to be expected. Between 0–10 min, a low mass dissolution was observed (less than 1%), and this induction period was observed to be present in all non-sonicated runs. During this time, there was ineffective contacting of the acid solution and the inner components of the solid material, resulting in the observed induction period. The induction period observed for the non-sonicated runs was absent for the sonicated runs. This is due to the action of the applied ultrasonic radiation, which induced shear and pitting of the solids, and better contacting of the liquids and solids within the reaction vessel. Between 10–30 min, the average difference in the mass dissolution between the temperatures of 30 °C and 40 °C for the non-sonicated runs was observed to be 4–5%. The difference was statistically significant given the uncertainty in the experimental measurements, as indicated by error bars in both plots in Figure 3. For the sonicated runs, the average difference in the mass dissolution between the reaction temperatures of 30 °C and 40 °C was comparatively lower, between 0 to 30 min, at approximately 3%. The highest dissolution for the non-sonicated runs was seen for the 30 min, 40 °C run, with a mass dissolution of 16.83%. The highest mass dissolution for the sonicated runs was observed for the 30 min, 40 °C run, with a mass dissolution of 20.51%.
The results demonstrate that in the conventional dissolution process, the contacting of the liquid and solid phases plays a major role initially, giving almost identical rates at both temperatures. Once the inner components of the biomass are accessed, the reaction becomes kinetically controlled and the rate is governed by the temperature alone, hence a significant difference in the average level of mass dissolution. When ultrasound is applied, the induction period is eliminated, but furthermore, the dissolution results are more uniform over the two temperatures employed, indicating that the localized effects of ultrasound (cavitation, microjet formation, microstreaming) have a more significant influence on the dissolution rate than the temperature. This is favorable, since lower temperatures, possibly even room temperature, can be employed with a satisfactory degree of mass dissolution during pretreatment.
3.3. Effect of Ultrasonic Irradiation
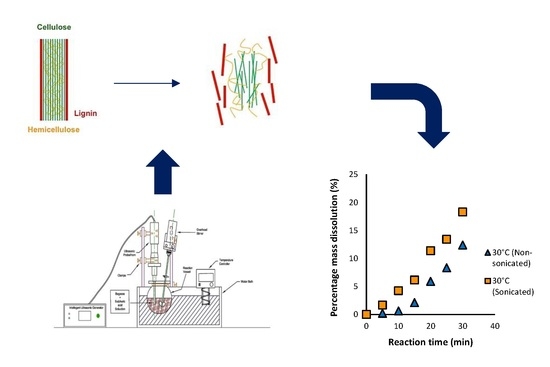
Figure 4a,b shows the effect of sonication at varying reaction times, with reaction temperatures of 30 °C and 40 °C, respectively. For both the 30 °C and 40 °C reaction time runs, the sonicated results displayed a higher mass dissolution. Once again, these differences were statistically significant due to the relatively low uncertainty in the experimental measurements, indicated by error bars in Figure 4. For the 30 °C reaction time runs, there was initially a small difference between the dissolution percentages, however, this increased with an increase in time. The mass dissolution ranged from 0.22% to 12.42% and 1.67% to 18.29% for the non-sonicated and sonicated runs, respectively. The smallest difference was seen for the 5-min reaction time run, with a difference in dissolution of 1.45%. The highest difference in dissolution was seen for the 30-min reaction time run, which yielded a difference in dissolution of 5.93%. It appears that the effect of sonication on the dissolution process improved with pretreatment time. Once the inner portions of the biomass have been accessed, the effect of sonication becomes more pronounced, since these polymeric structures are more susceptible to the action of the ultrasound.
The 40 °C reaction time runs displayed a similar trend to the 30 °C runs, with an increase between the mass dissolution of the sonicated and non-sonicated runs with an increase in time. The mass dissolution ranged from 0.27% to 20.51% for the 40 °C runs. The smallest difference in the mass dissolution was seen for the 5-min reaction time run, with a difference of 2.75% and the largest difference in dissolution was seen for the 20-min run, with a difference of 5.81%.
These results show that the ultrasonic generator was effective in aiding in the dissolution of biomass, as there was an increase in the dissolution for every sonicated run at all reaction times and temperatures. It is assumed that the ultrasonic probe assists in permeation of the sulfuric acid solution into the bagasse to act effectively on the inner components of the solid material. The ultrasonic generator provided an average increase of approximately 4% to the mass dissolution. Another important observation is that the effect of ultrasound on the mass dissolution was more pronounced at a lower temperature, therefore the enhancement is not independent of temperature. Furthermore, this opens up the possibility of operating at a lower temperature and achieving similar levels of mass dissolution.
3.4. Development of the Kinetic Model
The system was modeled using a simple dynamic balance for the mass of solids, based on a driving force that was linearly related to the rate of change of solid mass in the vessel. Various pseudo reaction orders were tested by modifying the expressions according to the conversion (or dissolution) of solids and plotting appropriate forms against time. This is the classical approach for the collection and analysis of rate data. Similar trends were noticed for the sonicated reaction time runs at different reaction temperatures. Therefore, a single plot is shown for the sonicated results. The same was noticed for the non-sonicated runs at different reaction temperatures, therefore, only one plot was also shown for the non-sonicated runs. The development and testing of each of these reaction rate expressions is discussed below.
First order reaction:
where is the mass of bagasse (g), is the fractional dissolution of biomass, is the time (min), is the kinetic rate of dissolution (g/min) and the subscript 0 indicates the initial conditions.
A model was developed for the first order reaction. Equation (4) displays the final form for the first order reaction applied to the reaction system. Graphs of ln(1 − X) were plotted against reaction time (Figure 5a,b) to determine if a first order reaction fit the system. Additional regression statistics are reported in Table 3. The model appears to visually fit the data, with low p-values also indicating a reasonable fit. However, when computing 95% confidence intervals, we found that at least one data point was outside these limits for both sonicated and non-sonicated runs. From the results obtained, it is clear that the reaction was not first order as a straight line did not adequately fit both the sonicated and non-sonicated runs for the first order approximation. Second order was then attempted to see if a second order reaction fit the system.
Second order reaction:
A model was developed for the second order reaction. Equation (6) displays the final form of the second order equation applied to the reaction system. Graphs of X/(1 − X) were plotted against reaction time (Figure 6a,b) to determine if a second order reaction fit the system. A less satisfactory fit of the experimental data was found for this rate form, although visually it appeared acceptable. Once again, for both sonicated and non-sonicated runs, at least one data point was significantly outside the 95% confidence on the regression for both sets of experiments. From the results obtained, the reaction was not second order as a straight line did not adequately fit both the sonicated and non-sonicated for the second order approximation. Zeroth order was then attempted to see if it would fit the reaction system.
Zeroth order reaction:
A model was developed for the zeroth order reaction. Equation (8) displays the final form of the zeroth order equation applied to the reaction system. Graphs of X (conversion) were plotted against reaction time (Figure 7a,b) to determine if a zeroth order reaction fit the system. It should be noted that for the sonicated runs, a straight line appropriately fit the data obtained. This dataset had the lowest p-value and highest coefficient of correlation, as indicated in Table 3. All data points were within or directly in the 95% confidence limits for the regression. For the non-sonicated runs, it can be seen that one straight line would not fit the system, however, it was noted that there were two distinct linear regions between 0–10 min and 10–30 min, respectively. This showed that two dissolution rates ( and , respectively) were present for the non-sonicated runs, as initially there was a low dissolution rate, followed by a higher dissolution rate. Hence, zero order was used as it was seen to fit the majority of the results obtained. Note that confidence interval curves are not shown for the non-sonicated zeroth order data fits, since a smaller number of data points were used for each linear region. The dissolution rates (k) were determined by calculating the gradient of these zero order reactions. The dissolution rates are displayed in Table 4.
The temperature dependence of the reaction rate constants were given by the conventional Arrhenius expression, as shown in Equation (9):
where is the rate constant; is the pre-exponential factor; and is the activation energy for the reaction. Graphs of the natural logarithm of the dissolution rate constant were plotted against the inverse of temperature (K−1) (Arrhenius plot) to determine the activation energy of the kinetics (Figure 8). The results are displayed in Table 5. Note that due to the concise dataset, rate constants at only two temperatures could be obtained. This provides a basic measure of the change of the respective parameter when varying temperature.
For the non-sonicated runs, the activation energy for the high-rate region was significantly larger than the low-rate region. This would indicate that practically no liquid-solid reaction occurs during the low-rate period, and that the process is physically, rather than kinetically controlled.
Comparing the activation energy for the high-rate region of the non-sonicated runs and that of the sonicated runs, it is evident that the application of ultrasonic irradiation has reduced the energy requirement for the dissolution, and hence improved the overall rate of dissolution at each of the temperatures used.
Kinetic models for the dissolution of sugarcane bagasse reported in the literature have been developed for higher temperatures and higher solids loadings, and hence cannot be directly compared quantitatively to the present work. Nevertheless, some useful features of the existing models can be compared to the experimental observations in the present case. Consider the model proposed by Aguilar et al. [35] for the mass dissolution during acid hydrolysis:
where is the rate of the generation reaction (min−1) and is the rate of decomposition reaction (min−1); is the concentration of the monomer (g/L); and P is the concentration of the polymer (g/L); is the time (min); and the subscript 0 implies the initial conditions [35]. The model considers two distinct processes occurring in series, the decomposition of sugar polymers to monomers and further to decomposition products. It is evident from the experimental results in this work that these stages also occurred simultaneously at low temperatures and low solids loading, and were enhanced by the action of ultrasound.
4. Conclusions
The effect of ultrasound on the mass dissolution is more pronounced at a lower temperature, therefore the enhancement is not independent on temperature. The primary hypothesis was therefore rejected. The experimental evidence gathered in this study demonstrated that ultrasonic irradiation, when applied to the dilute acid pretreatment of sugarcane bagasse at low solids loading and low temperature, had a more significant effect on mass dissolution (as a measure of pretreatment performance) than temperature. This confirmed the secondary hypothesis.
An additional important observation was that the effect of sonication on the dissolution process improved with reaction time. Accordingly, chemical pretreatment processes that involve imbibing the solid biomass in a reaction liquid may benefit from this. These are altogether favorable results, since they show that the process can be carried out at a lower temperature within a reasonable timeframe and still achieve satisfactory levels of mass dissolution.
A zeroth order kinetic model fitted the results for the sonicated reaction time runs for all reaction times used, resulting in the sonicated runs displaying one consistent dissolution rate (corresponding to ksonicated). The results for the non-sonicated runs showed two linear regions, hence two dissolution rates (corresponding to klow,non-sonicatd and khigh,non-sonicated) were present for the non-sonicated results. Activation energies of 457 J mol−1 and 2383 J mol−1 were obtained from the Arrhenius plots for the non-sonicated dissolution rates, klow,non-sonicatd and khigh,non-sonicated, respectively. The activation energy for the sonicated dissolution rate was found to be 1787 J mol−1. The activation for the latter part of the non-sonicated runs was found to be 595 J mol−1 higher than the activation energy of the sonicated runs, which indicates that the application of ultrasonic irradiation reduced the energy requirement for the dissolution reactions, and hence improved the overall rate of dissolution at each of the temperatures used.
Ultrasonic irradiation was confirmed to improve the mass dissolution during pretreatment, with up to a 4% absolute increase reported at a maximum dissolution of 20.51% (corresponding to a relative increase of approximately 20%). Such an increase in mass dissolution can translate into shorter processing times, improving throughput in a biomass valorization sequence such as biofuel production from sugarcane bagasse via ethanol.
Author Contributions
Conceptualization, D.L.; Methodology, D.N. and K.N.; Software, D.N., K.N. and D.L.; Validation, D.N., K.N. and D.L.; Formal analysis, D.N., K.N. and D.L.; Investigation, D.N., K.N. and D.L.; Data curation, D.N., K.N. and D.L.; Writing—original draft preparation, D.N., K.N. and D.L.; Writing—review and editing, D.L.; Visualization, D.N., K.N. and D.L.; Supervision, D.L.; Project administration, D.L.; Funding acquisition, D.L. All authors have read and agreed to the published version of the manuscript.
Funding
This work was based on research supported by the National Research Foundation of South Africa, unique grant number 120828. The authors also acknowledge financial support from ESKOM.
Conflicts of Interest
The authors declare no conflict of interest. The funders had no role in the design of the study; in the collection, analyses, or interpretation of data; in the writing of the manuscript, or in the decision to publish the results.
Nomenclature
| Symbol | Description | Unit |
| Pre-exponential factor | g min−1 | |
| Concentration of monomer | g L−1 | |
| Activation energy | J mol−1 | |
| Dissolution rate | g min−1 | |
| Mass of bagasse | g | |
| Initial mass of bagasse | g | |
| Concentration of polymer | g L−1 | |
| R | Correlation coefficient | - |
| Time | min | |
| Fractional dissolution | - |
References
- Dziekońska-Kubczak, U.; Berłowska, J.; Dziugan, P.; Patelski, P.; Balcerek, M.; Pielech-Przybylska, K.; Robak, K. Two-Stage Pretreatment to Improve Saccharification of Oat Straw and Jerusalem Artichoke Biomass. Energies 2019, 12, 1715. [Google Scholar] [CrossRef] [Green Version]
- Negro, M.J.; Álvarez, C.; Doménech, P.; Iglesias, R.; Ballesteros, I. Sugars Production from Municipal Forestry and Greening Wastes Pretreated by an Integrated Steam Explosion-Based Process. Energies 2020, 13, 4432. [Google Scholar] [CrossRef]
- Chambon, C.L.; Mkhize, T.Y.; Reddy, P.; Brandt-Talbot, A.; Deenadayalu, N.; Fennell, P.S.; Hallett, J.P. Pretreatment of South African sugarcane bagasse using low-cost protic ionic liquid: A comparison of whole, depithed, fibrous and pith bagasse fractions. Biotechnol. Biofuels 2018, 11, 2–10. [Google Scholar] [CrossRef] [PubMed] [Green Version]
- Pandey, A.; Soccol, C.; Nigam, P.; Soccol, V. Biotechnological potential of agro-industrial residues. I: Sugarcane bagasse. Bioresour. Technol. 2000, 74, 69–80. [Google Scholar] [CrossRef]
- Cardona, C.; Quintero, J.; Paz, I. Production of bioethanol from sugarcane bagasse: Status and perspectives. Bioresour. Technol. 2010, 101, 4754–4766. [Google Scholar] [CrossRef] [PubMed]
- Know Sumo. Available online: https://www.knowsumo.com/uses-of-bagasse/ (accessed on 2 April 2020).
- Khoo, K.S.; Chia, W.Y.; Tang, D.Y.Y.; Show, P.L.; Chew, K.W.; Chen, W. Nanomaterials Utilization in Biomass for Biofuel and Bioenergy Production. Energies 2020, 13, 892. [Google Scholar] [CrossRef] [Green Version]
- Ferreira, F.L.; Antonia, C.B.D.; Shiga, E.A.; Alvim, L.J.; Pessoni, R.A.B. Sugarcane bagasse as a source of carbon for enzyme production by filamentous fungi. Hoehnea 2018, 45, 134–142. [Google Scholar] [CrossRef] [Green Version]
- Rawat, K. Biomass to Fuel: Conversion Techniques. In Energy Resources: Development, Harvesting and Management, 1st ed.; Nautiyal, O.P., Sharma, B., Pant, D., Eds.; Uttarakhand Science Education and Research Centre: Dehradun, India, 2016; pp. 155–194. [Google Scholar]
- Hoekman, S.K. Biofuels in the U.S.—Challenges and Opportunities. Renew. Energy 2009, 34, 14–22. [Google Scholar] [CrossRef]
- Maurya, D.; Singla, A.; Negi, S. An overview of key pretreatment processes for biological conversion of lignocellulosic biomass to bioethanol. 3 Biotech 2015, 5, 597–609. [Google Scholar] [CrossRef] [Green Version]
- Wagner, A.O.; Lackner, N.; Mutschlechner, M.; Prem, E.M.; Markt, R.; Illmer, P. Biological Pretreatment Strategies for Second-Generation Lignocellulosic Resources to Enhance Biogas Production. Energies 2018, 11, 1797. [Google Scholar] [CrossRef] [Green Version]
- Lee, H.V.; Hamid, S.B.A.; Zain, S.K. Conversion of Lignocellulosic Biomass to Nanocellulose: Structure and Chemical Process. Sci. World. J. 2014, 2014, 631013. [Google Scholar] [CrossRef] [PubMed]
- Harmsen, P.; Huijgen, W.; Bermudez, L.; Bakker, R. Literature Review of the Physical and Chemical Pretreatment Processes for Lignocellulosic Biomass, 1st ed.; Wageningen UR Food & Biobased Research: Wageningen, The Netherlands, 2010; pp. 6–30. [Google Scholar]
- Holtzapple, M.T. Encyclopedia of Food Sciences and Nutrition, 2nd ed.; Elsevier Ltd.: London, UK, 2003; pp. 998–1007. [Google Scholar]
- McMillan, J.D. Pretreatment of Lignocellulosic Biomass. In Enzymatic Conversion of Biomass for Fuels Production; Himmel, M.E., Baker, J.O., Overend, R.P., Eds.; American Chemical Society: Washington, DC, USA, 1994; Volume 556, pp. 292–324. [Google Scholar]
- Procentese, A.; Russo, M.E.; Somma, I.D.; Marzocchella, A. Kinetic Characterization of Enzymatic Hydrolysis of Apple Pomace as Feedstock for a Sugar-Based Biorefinery. Energies 2020, 13, 1051. [Google Scholar] [CrossRef] [Green Version]
- Mansfield, S.D.; Mooney, C.; Saddler, J.N. Substrates and enzyme characteristics that limit cellulose hydrolysis. Biotechnol. Prog. 1999, 15, 804–816. [Google Scholar] [CrossRef] [PubMed]
- Jędrzejczyk, M.; Soszka, E.; Czapnik, M.; Ruppert, A.M.; Grams, J. Physical and chemical pretreatment of lignocellulosic biomass. In Second and Third Generation of Feedstocks, 1st ed.; Basile, A., Dalena, F., Eds.; Elsevier Ltd.: London, UK, 2019; pp. 143–196. [Google Scholar]
- Tang, X.; Zuo, M.; Li, Z.; Lui, H.; Xiog, C.; Zeng, X.; Sun, Y.; Hu, L.; Lui, S.; Lei, T.; et al. Green Processing of Lignocellulosic Biomass and Its Derivatives in Deep Eutectic Solvents. ChemSusChem 2017, 10, 2696–2706. [Google Scholar] [CrossRef]
- Satlewal, A.; Agrawal, R.; Bhagia, S.; Sangoro, J.; Ragauskas, A.J. Natural deep eutectic solvents for lignocellulosic biomass pretreatment: Recent developments, challenges and novel opportunities. Biotechnol. Adv. 2018, 36, 2032–2050. [Google Scholar] [CrossRef]
- Dal, D.; Fan, M. Wood fibres as reinforcements in natural fibre composites: Structure, properties, processing and applications. In Natural Fibre Composite: Materials, Processes and Applications, 1st ed.; Hodzic, A., Shanks, R.A., Eds.; Woodhead Publishing: Cambridge, UK, 2008; pp. 3–65. [Google Scholar]
- Zafeiropoulos, N.E. Properties and Performance of Natural-Fibre Composites, 1st ed.; Woodhead Publishing: Cambridge, UK, 2008; pp. 127–162. [Google Scholar]
- Bussemaker, M.J.; Zhang, D. Effect of Ultrasound on Lignocellulosic Biomass as a Pretreatment for Biorefinery and Biofuel Applications. Ind. Eng. Chem. Res. 2013, 52, 3563–3580. [Google Scholar] [CrossRef]
- Singh, S.; Goyal, A.; Moholkar, V.S. Synthesis of Bioethanol From Invasive Weeds: Process Design, Optimization, and Intensification With Ultrasound. In Waste Biorefinery, 1st ed.; Bhaskar, T., Pandey, A., Mohan, S.V., Lee, D., Khanal, S.K., Eds.; Elsevier, B.V.: Amsterdam, The Netherlands, 2018; pp. 45–485. [Google Scholar]
- Mielenz, J.R. Small-Scale Approaches for Evaluating Biomass Bioconversion for Fuels and Chemicals. In Bioenergy Biomass to Biofuels, 1st ed.; Dahiya, A., Ed.; Elsevier Ltd.: London, UK, 2015; pp. 385–406. [Google Scholar]
- Gedanken, A. Ultrasonic Processing to Produce Nanoparticles. In Encyclopedia of Materials: Science and Technology, 2nd ed.; Jürgen Buschow, K.H., Cahn, R.W., Flemings, M.C., Ilschner, B., Kramer, E.J., Mahajan, S., Eds.; Elsevier Ltd.: London, UK, 2001; pp. 9450–9456. [Google Scholar]
- Patel, V.K.; Sen, D.J.; Patel, H.U.; Patel, C.N. Sonochemistry: The effect of sonic waves on chemical systems. J. Pharm. Res. 2010, 2, 573–580. [Google Scholar]
- Suslick, K.S. Kirk-Othmer Encyclopedia of Chemical Technology, 4th ed.; J. Wiley & Sons: New York, NY, USA, 1998; pp. 516–541. [Google Scholar]
- Hielsher Ultrasound Technology. Available online: https://www.hielscher.com/?s=sonochemical (accessed on 27 March 2020).
- Mamvura, T.A.; Iyuke, S.E.; Paterson, A.E. Energy changes during use of high-power ultrasound on food grade surfaces. SAJCE 2018, 25, 62–73. [Google Scholar] [CrossRef]
- Esfahani, M.R.; Azin, M. Pretreatment of sugarcane bagasse by ultrasound energy and dilute acid. Asia-Pac. J. Chem. Eng. 2012, 7, 274–278. [Google Scholar] [CrossRef]
- Madlala, N.E.; Eloka-Eboka, A.C.; Lokhat, D. Chemo-physical and thermal properties of sugarcane bagasse fractions (fibre and pith) technique. In Proceedings of the 18th International Conference on Sustainable Energy Technologies, Kuala Lumpur, Malaysia, 20–22 August 2019; Riffat, S., Su, Y., Ismail, N., Ahmad, M.I., Eds.; University of Nottingham and WSSET: Nottingham, UK, 2019; pp. 549–557. [Google Scholar]
- Moyer, P.; Smith, M.D.; Abdoulmoumine, N.; Chmely, S.C.; Smith, J.C.; Petridis, L.; Labbé, N. Relationship between lignocellulosic biomass dissolution and physicochemical properties of ionic liquids composed of 3-methylimidazolium cations and carboxylate anions. Phys. Chem. Chem. Phys. 2018, 20, 2508–2516. [Google Scholar] [CrossRef]
- Aguilar, R.; Ramirez, J.A.; Garrote, G.; Vazquez, M. Kinetic study of the acid hydrolysis of sugarcane bagasse. J. Food Eng. 2002, 55, 309–318. [Google Scholar] [CrossRef]
Figure 1.
Partial section view of the experimental setup.

Figure 2.
Mass dissolution results for varying agitation speeds.

Figure 3.
Mass dissolution versus reaction time for (a) non-sonicated reaction time runs at different temperatures, and (b) sonicated reaction time runs at different temperatures.
Figure 3.
Mass dissolution versus reaction time for (a) non-sonicated reaction time runs at different temperatures, and (b) sonicated reaction time runs at different temperatures.

Figure 4.
The effect of sonication with varying reaction times at (a) 30 °C, and (b) 40 °C.

Figure 5.
First order (response) plot for the 40 °C (a) sonicated runs, and (b) non-sonicated runs.

Figure 6.
Second order (response) plot for the 40 °C (a) sonicated runs, and (b) non-sonicated runs.
Figure 6.
Second order (response) plot for the 40 °C (a) sonicated runs, and (b) non-sonicated runs.

Figure 7.
Zeroth order (response) plot for the 40 °C (a) sonicated runs, and (b) non-sonicated runs.
Figure 7.
Zeroth order (response) plot for the 40 °C (a) sonicated runs, and (b) non-sonicated runs.

Figure 8.
Plots of (a) versus the inverse of temperature for the first 10 min of the non-sonicated runs, (b) versus the inverse of temperature for the 15–30 min non-sonicated runs, and (c) versus the inverse of temperature for the sonicated runs.
Figure 8.
Plots of (a) versus the inverse of temperature for the first 10 min of the non-sonicated runs, (b) versus the inverse of temperature for the 15–30 min non-sonicated runs, and (c) versus the inverse of temperature for the sonicated runs.


Table 1.
Characteristics of the sugarcane bagasse used in this work.
| Characteristic | Value |
|---|---|
| Bulk density | 200 kg m−3 |
| Volatiles | 80% |
| Ash | 8% |
| Fixed carbon | 28% |
| Carbon | 45.2% |
| Hydrogen | 5.3% |
| Nitrogen | 0.2% |
| Oxygen | 49.3% |
| Calorific value | 16.14 MJ kg−1 |
Table 2.
Size distribution of the bagasse.
| Size of Sieve Trays (µm) | Mass of Sieve Trays (g) | Mass of Sample (g) | Mass Fraction | Mass % |
|---|---|---|---|---|
| x > 11,200 | 473.80 | 49.70 | 0.33 | 33.13 |
| 11,200 > x > 1700 | 403.03 | 40.70 | 0.27 | 27.13 |
| 1700 > x > 600 | 342.70 | 34.03 | 0.23 | 22.69 |
| 600 > x > 300 | 288.64 | 13.87 | 0.09 | 9.24 |
| 300 > x > 38 | 257.93 | 11.70 | 0.08 | 7.80 |
Table 3.
Regression statistics for the first, second, and zeroth order kinetic data fitting.
| Statistic | First Order Sonicated | First Order Non-Sonicated | Second Order Sonicated | Second Order Non-Sonicated | Zeroth Order Sonicated |
|---|---|---|---|---|---|
| R2 | 0.985 | 0.944 | 0.980 | 0.939 | 0.988 |
| t-stat | −18.10 | −9.21 | 15.78 | 8.81 | −20.43 |
| p-value | 9 × 10⁻⁶ | 2 × 10⁻⁴ | 2 × 10⁻⁵ | 3 × 10⁻⁴ | 5 × 10⁻⁶ |
| F-value | 327.96 | 84.88 | 249.02 | 77.72 | 417.74 |
Table 4.
Dissolution rates determined from the zeroth order graphs.
| Temperature | Non-Sonicated (g min−1) | Sonicated (g min−1) | |
|---|---|---|---|
| 30 °C | 0.0082 | 0.0784 | 0.0722 |
| 40 °C | 0.0137 | 0.0956 | 0.0851 |
Table 5.
Activation energy calculated at different rates.
| Dissolution Rate (g min−1) | Activation Energy (Ea) (J mol−1) |
|---|---|
| 457 | |
| 2383 | |
| 1788 |
Publisher’s Note: MDPI stays neutral with regard to jurisdictional claims in published maps and institutional affiliations. |
© 2020 by the authors. Licensee MDPI, Basel, Switzerland. This article is an open access article distributed under the terms and conditions of the Creative Commons Attribution (CC BY) license (http://creativecommons.org/licenses/by/4.0/).
Share and Cite
MDPI and ACS Style
Nadar, D.; Naicker, K.; Lokhat, D. Ultrasonically-Assisted Dissolution of Sugarcane Bagasse during Dilute Acid Pretreatment: Experiments and Kinetic Modeling. Energies 2020, 13, 5627. https://doi.org/10.3390/en13215627
AMA Style
Nadar D, Naicker K, Lokhat D. Ultrasonically-Assisted Dissolution of Sugarcane Bagasse during Dilute Acid Pretreatment: Experiments and Kinetic Modeling. Energies. 2020; 13(21):5627. https://doi.org/10.3390/en13215627
Chicago/Turabian StyleNadar, Deslin, Kubendren Naicker, and David Lokhat. 2020. "Ultrasonically-Assisted Dissolution of Sugarcane Bagasse during Dilute Acid Pretreatment: Experiments and Kinetic Modeling" Energies 13, no. 21: 5627. https://doi.org/10.3390/en13215627
Note that from the first issue of 2016, this journal uses article numbers instead of page numbers. See further details here.