New Protection Scheme in Loop Distribution System with Distributed Generation


School of Electronic & Electrical Engineering, Yonam Institute of Technology, Jinju-si 52821, Korea
Energies 2020, 13(22), 5897; https://doi.org/10.3390/en13225897
Submission received: 23 October 2020
/
Revised: 4 November 2020
/
Accepted: 9 November 2020
/
Published: 12 November 2020
(This article belongs to the Special Issue Smart Power Distribution Systems and the Integration of Distributed Energy Resources to Power Systems)
Abstract
:Loop distribution systems are increasingly used for reasons such as increased distributed generation (DG) and increased demand for a reliable and high-quality power supply. Because the loop distribution system involves bidirectional power flow, the method for protection of the radial distribution system cannot be applied. Therefore, a protection method is proposed herein for loop distribution systems. In this study, the existence of DG is also considered. According to the proposed method, the fault point is estimated on the basis of the equivalent circuit of the distribution system. Then, the fault section is determined and separated from the distribution system. The separation of DG is determined depending on whether the frequency and voltage are maintained within the steady state ranges. The proposed method is modelled and verified using the Electromagnetic Transients Program. Simulations according to the fault location are performed and analyzed. The results show that the method accurately determines the fault section so that normal power can be supplied to the healthy sections in the distribution system.
1. Introduction
Most conventional distribution systems are radial distribution systems, in which the current flows in one direction. However, the use of loop distribution systems is increasing for several reasons, such as an increase in load capacity, reliability, and power quality demand. In addition, because of the increasing of distributed generation (DG) and energy storage systems in distribution system, the use of loop distribution systems is increasing further. The protection method employed in conventional radial systems cannot be applied in a loop-type distribution system because of the bidirectional power flow. Loop distribution systems can be classified as open- or closed-loop distribution systems according to opening/closing of the tie switch under normal conditions. In open-loop distribution systems, a protection relay can mal-operate due to the tie switch operation. Meanwhile, in closed-loop distribution systems, the protection relay can mal-operate due to bidirectional current flow [1,2,3].
Various works have been studied on the issues concerning the protection of loop distribution systems. In a previous study [1], a method was proposed to classify fault circuits and open the tie switch to solve the protection problems in the closed-loop system. In another work [2], a method was proposed to classify the normal load current and the fault current after closing of the tie switch in an open-loop distribution system using wavelet transformation. Elsewhere [3], considering the success of separating the fault point after the tie switch in the open-loop microgrid is closed, a method was used to classify the normal load current supply to another feeder, the fault at the original feeder, and the fault at another feeder as well as to operate the tie switch. That method [2,3], proposed as a protection method in open-loop distribution systems, cannot be applied to the closed-loop distribution systems targeted in this study. In other work [4], linear and nonlinear programming techniques were applied to obtain the optimal settings of relay in a single-loop and a multi-loop distribution system. A blocking pilot protection method for a closed-loop distribution network with an underground cable was proposed using remote terminal units in a distribution automation system [5]. Transmission and distribution protection schemes to classify faults in transmission and distribution systems have been developed using the wavelet transform [6]. The systems considered are composed of a radial loop transmission system and a radial underground distribution system. In another work [7], a wide area protection and control scheme based on information sharing was proposed for closed-loop distribution systems. It includes wide-area protection control devices and integrated distribution terminals. Moreover, fault location in a loop-type direct current (DC) distribution system was also investigated [8]. Fundamental distribution network architectures, including radial, ring, and mesh architectures, were reviewed considering their types of operation, control and management, and growth model, as well as their advantages and disadvantages [9]. In other studies, the performance of overcurrent directional relays to protect a medium-voltage distribution loop in an conventional power system was examined [10], and an improved method for fault location in double-circuit medium-power distribution lines was proposed [11]. Further, a protection scheme was proposed for loop-based microgrids, which are divided into four levels: load-way, loop-way, feeder, and microgrid [12]. In another work [13], an iterative mixed-integer nonlinear optimization method was proposed to locate and size fault current limiters optimally in a meshed power system. Moreover, a novel microgrid protection scheme based on the Hilbert–Huang transform and machine-learning techniques was developed [14]. The proposed microgrid protection scheme was tested in a radial and mesh microgrid structure. In another study [15], a fault analysis of a coaxial high-temperature superconducting cable in a meshed distribution system was performed, and a coordinated protection system was proposed. In the proposed system, the differential current relay serves as the main protection, whereas the overcurrent and directional overcurrent relays serve as the backup protections. Fault detection and location in a microgrid using mathematical morphology (MM) and recursive least-square (RLS) methods was proposed [16].
Herein, the issue concerning protection in a closed-loop distribution system with DG is addressed. The DG has not been considered in previous works [1,2,3,4,5,6,7,8,9,10,11,12,13,14,15,16]. In one study [1], the load after the fault point in the distribution line could experience outage because of the operation of the tie switch, without considering the fault section. To solve this problem, a protection method in loop distribution systems with DG is proposed.
The contributions of this paper are as follows.
- (1)
- A method for calculating the fault location in a loop distribution system with DG based on the equivalent circuit of the system is proposed.
- (2)
- After the fault location is calculated, a protection scheme to separate the fault section and supply the normal current to the healthy sections in the distribution line is proposed.
The remainder of this article is organized as follows. In Section 2, the investigated considerations for protection issues in loop distribution systems with DG are presented. In Section 3, the proposed protection scheme for a loop distribution system with DG is described. The method to calculate the fault location is based on the equivalent circuit of the loop distribution system. Section 4 details the verification of the method through simulations. The loop distribution system using DG and the proposed method was modelled using the Electromagnetic Transients Program (EMTP). Various simulations according to the fault location were performed and analyzed. Finally, the conclusions derived from the study are presented in Section 5.
2. Considerations for Protection in Loop Distribution System with DG
Figure 1 shows the loop-type distribution system model, in which the I distribution line and the J distribution line are connected through a tie switch. In Figure 1, CBi1, CBi2, etc. mean the number of circuit breakers (CB) located at I distribution line and CBj1, CBj2, etc. mean the number of CB located at J distribution line. Furthermore, Load i1, Load i2, etc. mean the number of loads at I distribution line and Load j1, Load j2, etc. mean the number of loads at J distribution line. The tie switch is closed in normal states. In Figure 1, the DG is connected to the end of the I distribution line. Figure 1 shows the loop distribution system without regard for the connection point of DG. It is assumed that a fault occurs at the Fault 1 point, as shown in Figure 1. The fault current can be injected from Sources 1 and 2 as well as from the DG. Therefore, because the fault current is injected from several directions, the conventional protection scheme designed for the radial distribution system cannot be applied.
- (1)
- Because the fault current is injected from both directions, the current flowing to the fault point can increase.
- (2)
- The injection of a bidirectional fault current makes it impossible to supply the normal current, even though the J distribution line is not faulty. In addition, during a fault, it is impossible to supply a normal current from the DG system to the J distribution line.
- (3)
- Despite the fault at the I distribution line, it is possible for the protection devices of the J distribution line to operate by detecting the fault current. Therefore, the protection devices of both distribution lines are operated so that the outage section can be expanded.
- (4)
- In a conventional radial distribution system, because the current flows in one direction, the directionality is not applied to the protection device. As shown in Figure 1, the fault current by the fault of the I distribution line is injected from the J distribution line and DG as well as from the I distribution line. However, if the protection device does not have directionality, maloperation of the protective devices located after the fault section in the I distribution line and protective devices located in the J distribution line is possible.
To solve the aforementioned problems, a method for judging a faulted distribution line and operating a tie switch was proposed in a previous report [1]. If this method is applied, the DG can be connected to the faulted distribution line when the tie switch is opened. At this time, because the fault current is still being injected from the DG, the DG needs to be additionally blocked—that is, because this method cannot accurately detect a fault section, the possibility of fault current injection from DG still exists.
In this report, a protection scheme is proposed for detecting the fault section considering the existence of DG and for separating the fault section. Application of the proposed method enables prevention of maloperation of the protection device and expansion of the outage section.
3. New Protection Scheme in Loop Distribution System with DG
3.1. Detection Method of Fault Section
The method proposed should accurately detect the fault section considering the DG. To this end, a method is proposed based on an equivalent circuit. This method is simple, but it can detect the fault section accurately.
Figure 2 shows the equivalent circuit of the loop distribution system in Figure 1. Figure 2 is based on the lumped model. In transient conditions, the distributed line model is important. However, the line length of distribution line targeted in this paper is very short and hence the lumped model not considering capacitance is enough. The meaning of each symbol in Figure 2 is as follows.
- Vsource1: Magnitude of voltage source in the I distribution line;
- Vsource2: Magnitude of voltage source in the J distribution line;
- VDG: Magnitude of voltage at the connecting point of DG;
- L1: Total line length of the I distribution line;
- L2: Total line length of the J distribution line;
- L: Length from source to fault point in the I distribution line;
- Z1: Impedance per length in the I distribution line;
- Z2: Impedance per length in the J distribution line;
- Zload11: Equivalent impedance of loads from source to fault point in the I distribution line;
- Zload12: Equivalent impedance of loads after fault point in the I distribution line I;
- Zload2: Equivalent impedance of loads in the J distribution line;
- ZF: Fault resistance.
The proposed algorithm aims to protect against low impedance fault. In this case, the equivalent impedance of the load is large compared with the fault resistance. Therefore, because the load equivalent impedance and the fault resistance are connected in parallel, as shown in Figure 2, if the equivalent impedance of the load and the fault resistance are equivalently calculated, the load equivalent impedance can be omitted. The simplified equivalent circuit is shown in Figure 3.
In Figure 2, the length L from the source to the fault point can be easily derived by applying Kirchhoff’s voltage law. As shown in Figure 2, one can set the current direction in each loop considering the voltage source, with the names of each set being I1, IDG, and I2. Then, Equations (1)–(3) can be derived using Kirchhoff’s voltage law.
I1·L·Z1 + I1·ZF + IDG·ZF = Vsource1
(L1 − L)·Z1·IDG + IDG·ZF + I1·ZF = VDG,
(L1 − L)·Z1·IDG + IDG·ZF + I1·ZF = VDG,
If Equation (3) is arranged for VDG and substituted into Equation (2), Equation (4) can be derived.
(L1 − L)·Z1·IDG + IDG·ZF + I1·ZF = Vsource2 − L2·Z2·I2
Equation (5) can be derived by subtracting Equation (4) from Equation (1). At this time, it is assumed that the magnitudes of the voltage sources Vsource1 and Vsource2 are within normal range. Then, these values are very similar so it can be eliminated in this step.
(I1 + IDG) L·Z1 − L1·Z1·IDG = L2·Z2·I2
Then, Equation (6) can be derived by rearranging Equation (5):
In Equation (6), L1 and L2 are known values because they are the total length of the line. Because Z1 and Z2 are impedances per length of the line, they are also known values. Therefore, if the fault current I1 from Source 1, the fault current I2 from Source 2, and the fault current IDG from the DG are measured, the length from the source to the fault point can be obtained using Equation (6). Then, the fault section can also be detected.
Equation (6) is derived based on the assumption that a fault occurs in the I distribution line in Figure 1. If a fault occurs in the J distribution line, it can also be derived in the same way as in Equation (7).
3.2. New Protection Scheme in Loop Distribution System Considering DG
Figure 4 shows a schematic diagram of the proposed protection method of the loop distribution system considering DG. The control center receives i1 and i2, which are the currents supplied from Sources 1 and 2, as inputs. In addition, it receives iDG, which is the supply current from DG, and the voltage VDG of the grid connection point as inputs. Subsequently, the control center performs the operation proposed in this report, and it sends open/close signals to the circuit breakers (CBs) in the distribution line. When inputs are received and outputs are sent, high-speed communication technology is required because communication must be performed in an extremely short time. As a communication method, IoT technology can be applied. IoT technology has been applied to factory automation, smart grid, and etc. and it requires ultra-high reliability and low-latency communication performance. In [17], in the smart grid, a time delay of approximately 10ms and a transmission failure rate of 10−7 should be guaranteed. Therefore, IoT technology is for the implementation of the algorithm proposed in this paper.
Figure 5 is a flowchart of the new protection scheme in the loop distribution system considering DG. First, it receives currents i1 and i2 supplied from both power sources, the current iDG, supplied from DG, and the voltage vDG at the connection point DG. Next, the root mean square (RMS) values (I1, I2, IDG, and VDG) of i1, i2, iDG, and vDG are calculated, and the frequency is also calculated using vDG. If I1 is greater than α or I2 is greater than β, it is judged that a fault has occurred. Here, α and β are the threshold values for detecting faults in the I and J distribution lines. These values depend on the system configuration, load capacity, etc. The next step is to detect faulty lines. This step adopts a method presented elsewhere [1]. This method detects the faulty line by using the current difference between the I and J distribution lines (I1fault-I2fault) under fault conditions and the current difference between the I and J distribution lines (I1normal-I2normal) in normal states. A detailed description of this method is presented in a previous report [1]. If a faulty line is detected, the fault length from source to fault point is calculated through Equation (6) for the I distribution line fault or Equation (7) in the case of the J-distribution line fault. Subsequently, the fault sections are detected using Equations (6) and (7), and the CBs at the fault sections are opened. Then, the fault section can be completely separated. For example, if the fault section is judged as Line i2, it separates the fault section by opening CBi21 and CBi22 at the same time. In case of fault on bus, the calculation method of fault location are the same. If the fault on bus is detected, two CBs located at before and after bus will open. For example, the fault is occurred at Bus i2, CBi22 and CBi31 will open to separate fault section. Next, it is determined as to whether the voltage and frequency supplied from the DG are maintained within the normal range. If it is determined that the normal range is not maintained, the DG is separated from the system; if the normal range is maintained, the algorithm is terminated. As above discussion, the control center performs an important role and hence the proposed algorithm is type of centralized protection algorithm.
If the method proposed is applied, the following advantages are presented.
- (1)
- Through accurate determination of the fault section and its separation from the system, it is possible to supply normal power to the healthy section in the distribution line. Therefore, other protection devices do not malfunction, and the outage section can be reduced.
- (2)
- It is possible to supply normal power from the main source as well as DG because the fault section is quickly separated from the system. If the DG cannot supply normal power, the DG is separated from the distribution system by the proposed protection scheme.
4. Simulations and Discussion
4.1. System Model
Figure 6 shows the loop distribution system model with DG to verify the proposed protection scheme. The length and load of each distribution line are shown in Figure 6. Each distribution line is a short-distance line of 2 or 1 km, and the power factor of the load is 0.9. The system model in Figure 6 was modelled using EMTP/ATPDraw. In addition, the proposed method was modelled using EMTP/MODELS [18,19,20,21].
4.2. Simulation Conditions
Table 1 shows the simulation conditions to verify the proposed protection scheme. In the distribution system in Figure 6, various fault locations are simulated. Cases 1–3 are the faults of the I distribution line, and Cases 4–6 are the faults of the J distribution line. Cases 7 and 8 are the bus faults. The fault occurred at 0.15 s. The fault type is set to a three-phase fault, and the fault resistance is set to 1 Ω.
4.3. Simulation Results
4.3.1. Case 1
Figure 7 shows the calculation result of the fault length in Case 1. Through the proposed scheme, the fault length is calculated as 1.05 km from the power source; hence, the fault section is detected as Line 1. In Figure 7, the fault location is calculated after fault occurrence at 0.15 s and has a zero value after operation of CBs for next fault. Reset of fault location is the same at each case. According to the proposed algorithm, CBi11 and CBi12 in Line 1 are opened at 0.16 s. This can be seen from the current waveform measured at i1 in Figure 8. The fault occurs at 0.15 s, and there is no load present after the opening of CBs at 0.16 s; thus, the current flowing through i1 becomes 0. Figure 9 shows the current waveform measured at load 3. In the case of the proposed method, because both the CBs of the line are opened and the fault section is isolated, the normal current is supplied from Source 2 to Load 3, which is located after the fault point at the I distribution line. However, as observed in a previous study [1], because the tie switch is opened, the normal current cannot be supplied to Load 3; thus, Load 3 experiences an outage.
4.3.2. Case 2
Figure 10 shows the calculation result of the fault point in Case 2. The fault point is calculated as 2.83 km from the power source; therefore, the fault section can be accurately determined. According to the proposed algorithm, both CBi21 and CBi22 in Line 2 are opened in 0.16 s. Figure 11 shows the current waveform measured at i1. Because Load 1 exists after separating the fault section at 0.16 s, the current flowing through i1 is not zero. Figure 12 shows the current waveform measured at Load 3. In the case of the proposed method, because both CBs in Line 2 are opened and the fault section is separated, the normal current is supplied from Source 2. However, as observed in a previous work [1], because the tie switch is open, the current flowing toward Load 3 becomes 0, and Load 3 experiences an outage.
4.3.3. Case 3
Figure 13 shows the calculation result of the fault point. From the simulation, the fault point is calculated as 4.01 km from the power source; therefore, the fault section can be accurately determined. According to the proposed algorithm, CBi31 and CBi32 are opened at 0.16 s. Figure 14 shows the current waveform measured at i1. Because Loads 1 and 2 exist after the CBs are opened at 0.16 s, the current flowing through i1 has a constant value that is not zero. In particular, the DG shares some of the load in the normal state before the fault; however, after the fault section is blocked, there is no current injection from the DG; therefore, a larger current flows before the fault. Figure 15 shows the measured current waveform at Load 3. In the proposed method, because the fault region is separated, the normal current is supplied from Source 2 to Load 3. However, as observed in previous research [1], because the tie switch is open, the current flowing toward Load 3 becomes 0; hence, Load 3 experiences an outage.
From the results of Cases 1–3 and through a comparison of the current measured at Load 3, the superiority of the method proposed can be verified.
4.3.4. Case 4
Figure 16 shows the calculation result of the fault point in Case 4. The fault point is calculated as 1.06 km from Source 2. Even if there is a difference of 0.06 km between the accurate fault point and the calculated fault point, it is possible to determine the fault section accurately. According to the proposed protection scheme, both CBj11 and CBj12 in Line 4 are opened at 0.16 s. Figure 17 shows the current waveform measured at i2. The fault occurs at 0.15 s, and there is no load after the CBs are opened at 0.16 s, so the current flowing through i2 becomes 0. Figure 18 shows the current waveform measured at Load 6. In Cases 1–3, because the load located at the end of the faulted line is Load 3, the current of Load 3 is measured. In Cases 4–6, the load located at the end of the faulted line is Load 6, so the current in Load 6 is measured and analyzed. In the proposed protection scheme, because the fault section is separated, the normal current is supplied from Source 1 to Load 6. However, as observed in a previous study [1], because the tie switch is open, the normal current from Source 1 cannot be supplied to Load 6, so an outage occurs.
4.3.5. Case 5
Figure 19 shows the calculation result of the fault point in Case 5. From the simulation, the fault point is calculated as 2.25 km from Source 2; therefore, the fault section can be accurately determined as Line 5. According to the proposed algorithm, both the CBj21 and CBj22 in Line 5 are opened at 0.16 s. Figure 20 shows the current waveform measured at i2. A fault occurs in 0.15 s, and the CBs are opened at a 0.16 s. Load 4 exists, so the current flowing in i2 is not zero. Figure 21 shows the current waveform measured at Load 6. In the proposed method, because the fault section is separated, the normal current is supplied from Source 1 to Load 6. However, as in the previous study [1], because the tie switch is opened, the normal current cannot be supplied to Load 6, so Load 6 experiences an outage.
4.3.6. Case 6
Figure 22 shows the calculation result of the fault point in Case 6. The fault point is calculated as 4.02 km from Source 2; therefore, the fault section can be accurately determined as Line 6. Therefore, according to the proposed algorithm, CBj31 and CBj32 in Line 6 are opened at 0.16 s. Figure 23 shows the current waveform measured at i2. After the CBs is opened at 0.16 s, the current measured at i2 flows to Loads 4 and 5. Figure 24 shows the current waveform measured at Load 6. In the proposed method, because the fault section is separated, the normal current is supplied from Source 1 to Load 6. However, as in the previous study [1], because the tie switch is opened, the normal current cannot be supplied to Load 6, so Load 6 experiences an outage.
Similar to Cases 1–3, through a comparison of the current flowing toward Load 6 in the proposed method and that of the previous study [1], the superiority of the proposed protection scheme can be verified.
4.3.7. Case 7
Figure 25 shows the calculation result of the fault point in Case 7. The fault point is calculated as 3.03 km from the power source and hence the fault section can be determined as bus 2 although the small error of 0.03km exists. By the proposed algorithm, both CBi22 and CBi31 at before and after Bus 2 are opened at 0.16 s. Figure 26 shows the current waveform measured at i1. Because Load 1 is not separated from the distribution system, the current flowing in i1 can be supplied from Source 1. Figure 27 shows the current waveform measured at Load 3. In the proposed method, because both CBi22 and CBi31 are opened, the normal current is supplied from Source 2. However, in a previous work [1], the current flowing toward Load 3 becomes 0 due to the opening of the tie switch, and Load 3 experiences an outage.
4.3.8. Case 8
Figure 28 shows the calculation result of the fault point in Case 8. From the simulation, the fault point is calculated as 3.04 km from Source 2; therefore, the fault section can be determined as Bus 5 even if small error of 0.04km exists. According to the proposed algorithm, both the CBj22 and CBj31 located at before and after Bus 5 are opened at 0.16 s. Figure 29 shows the current waveform measured at i2. A fault occurs in 0.15 s, and the CBs are opened at a 0.16 s. The current flowing in i2 can be supplied to Load 4. Figure 30 shows the current waveform measured at Load 6. In the proposed method, because the fault section is separated, the normal current is supplied from Source 1 to Load 6. However, as in the previous study [1], because the tie switch is opened, the normal current cannot be supplied to Load 6, so Load 6 experiences an outage.
5. Conclusions
For reasons such as the increasing demand for a reliable power supply and the increase in DG, the use of loop distribution systems is also increasing. However, because the protection problem in loop-type distribution systems can be caused by bidirectional current flow, a protection scheme in loop distribution systems connected with DG was proposed. The proposed method first determines the faulty distribution line among the distribution lines connected through the tie switch and accordingly determines the faulty section according to the equations based on the equivalent circuit proposed in this article. After the fault section is determined, it is separated by the opening of CBs, and the normal power can be supplied from another source to the other sections. In this case, the disconnection of DG is determined by observing the voltage and frequency outside the normal range. In particular, the method of determining the fault region in the proposed method is a simple method based on an equivalent circuit.
The proposed method was modelled and verified using the EMTP. Simulations were performed according to the fault locations. It was found that the fault section was accurately determined and separated via the proposed method. Therefore, a normal current was supplied from another source and DG, and the loads did not experience an outage.
The proposed algorithm aims to protect against low impedance fault. Therefore, the proposed method assumes that the fault resistance is less than the load equivalent impedance. If the fault resistance becomes large, this assumption cannot be made. Therefore, as part of a future study, the investigation of the protection method in a loop distribution system with DG in consideration of a high impedance fault is planned.
Funding
This work was supported by a 2020 Yonam Institute of Technology grant.
Conflicts of Interest
The author declares no conflict of interest.
References
- Seo, H.-C. Protection Scheme based on IoT in Loop Distribution System. Trans. Korean Inst. Electr. Eng. 2020, 69, 752–758. [Google Scholar] [CrossRef]
- Seo, H.-C. Novel Protection Scheme considering Tie Switch Operation in Open Loop Distribution System using Wavelet Transform. Energies 2019, 12, 1725. [Google Scholar] [CrossRef] [Green Version]
- Seo, H.-C. New Protection Scheme Based on Coordination with Tie Switch in an Open-Loop Microgrid. Energies 2019, 12, 4756. [Google Scholar] [CrossRef] [Green Version]
- Tiwari, R.; Singh, R.K.; Choudhary, N.K. Performance Analysis of Optimization Technique for Protection Coordination in Single and Multi-Loop Distribution System. In Proceedings of the International Conference on Electrical Electronics and Computer Engineering, Aligarh, India, 8–10 November 2019. [Google Scholar]
- Zhang, Z.H.; Xu, B.Y.; Crossley, P.; Li, L. Positive-sequence-fault-component-based blocking pilot protection for closed-loop distribution network with underground cable. Int. J. Electr. Power Energy Syst. 2018, 94, 57–66. [Google Scholar] [CrossRef]
- Ngaopitakkul, A.; Leelajindakrairerk, M. Application of probabilistic neural network with transmission and distribution protection schemes for classification of fault types on radial, loop, and underground structures. Electr. Eng. 2018, 100, 461–479. [Google Scholar]
- Zhang, A.; Li, Y.; Huang, Y.; Huang, F.; Liu, Z. Research on Wide-Area Protection and Control Scheme for Closed-Loop Distribution Network. In Proceedings of the International Conference on Power System Technology, Guangzhou, China, 6–8 November 2018. [Google Scholar]
- Xue, S.; Liu, C. Fault location principle and 2-step isolation scheme for a loop-type DC grid. IET Gener. Transm. Distrib. 2018, 12, 2937–2943. [Google Scholar] [CrossRef]
- Islam, F.R.; Prakash, K.; Mamun, K.A.; Lallu, A.; Pota, H.R. Aromatic network: A novel structure for power distribution system. IEEE Access 2017, 5, 25236–25257. [Google Scholar] [CrossRef]
- Borgnino, A.; Manuel, C. Comparison of the performance of different directional polarizing methods in cross country fault protection of a MV loop. In Proceedings of the Power Systems Computation Conference, Dublin, Ireland, 11–15 June 2018. [Google Scholar]
- Dashti, R.; Salehizadeh, S.M.; Shaker, H.R.; Tahavori, M. Fault location in double circuit medium power distribution networks using an impedance-based method. Appl. Sci. 2018, 8, 1034. [Google Scholar] [CrossRef] [Green Version]
- Liu, X.; Shahidehpour, M.; Li, Z.; Liu, X.; Cao, Y.; Tian, W. Protection scheme for loop-based microgrids. IEEE Trans. Smart Grid 2016, 8, 1340–1349. [Google Scholar] [CrossRef]
- Yu, P.; Venkatesh, B.; Yazdani, A.; Singh, B.N. Optimal location and sizing of fault current limiters in mesh networks using iterative mixed integer nonlinear programming. IEEE Trans. Power Syst. 2016, 31, 4776–4783. [Google Scholar] [CrossRef]
- Mishra, M.; Rout, P.K. Detection and classification of micro-grid faults based on HHT and machine learning techniques. IET Gener. Transm. Distrib. 2017, 12, 388–397. [Google Scholar] [CrossRef]
- Nguyen, T.T.; Lee, W.G.; Kim, H.M.; Yang, H.S. Fault Analysis and Design of a Protection System for a Mesh Power System with a Co-Axial HTS Power Cable. Energies 2020, 13, 220. [Google Scholar] [CrossRef] [Green Version]
- Gush, T.; Bukhari, S.B.; Haider, R.; Admasie, S.; Oh, Y.S.; Cho, G.J.; Kim, C.H. Fault Detection and Location in a Microgrid using Mathematical Morphology and Recursive Least Square Methods. Int. J. Electr. Power Energy Syst. 2018, 102, 324–331. [Google Scholar] [CrossRef]
- Kim, W.I.; Kim, E.A.; Ko, Y.J.; Song, J.S.; Yoon, C.H.; Moon, S.H.; Kim, C.S.; Baek, S.K. Technical Trend and Challenging Issues for Celluar-Based Industrial IoT. Electron. Telecommun. Trends 2018, 33, 51–63. [Google Scholar]
- Seo, H.C. New adaptive reclosing technique using second order difference of THD in distribution system with BESS used as uninterruptible power supply. Int. J. Electr. Power Energy Syst. 2017, 90, 315–322. [Google Scholar] [CrossRef]
- Seo, H.C.; Rhee, S.B. Novel adaptive reclosing scheme using wavelet transform in distribution system with battery energy storage system. Int. J. Electr. Power Energy Syst. 2018, 97, 186–200. [Google Scholar] [CrossRef]
- Oh, Y.S.; Kim, C.H.; Gwon, G.H.; Noh, C.H.; Bukhari, S.B.; Haider, R.; Gush, T. Fault detection scheme based on mathematical morphology in last mile radial low voltage DC distribution networks. Int. J. Electr. Power Energy Syst. 2019, 106, 520–527. [Google Scholar] [CrossRef]
- Gwon, G.H.; Kim, C.H.; Oh, Y.S.; Noh, C.H.; Jung, T.H.; Han, J. Mitigation of voltage unbalance by using static load transfer switch in bipolar low voltage DC distribution system. Int. J. Electr. Power Energy Syst. 2017, 90, 157–167. [Google Scholar] [CrossRef]
Figure 1.
Loop-type distribution system model with DG.
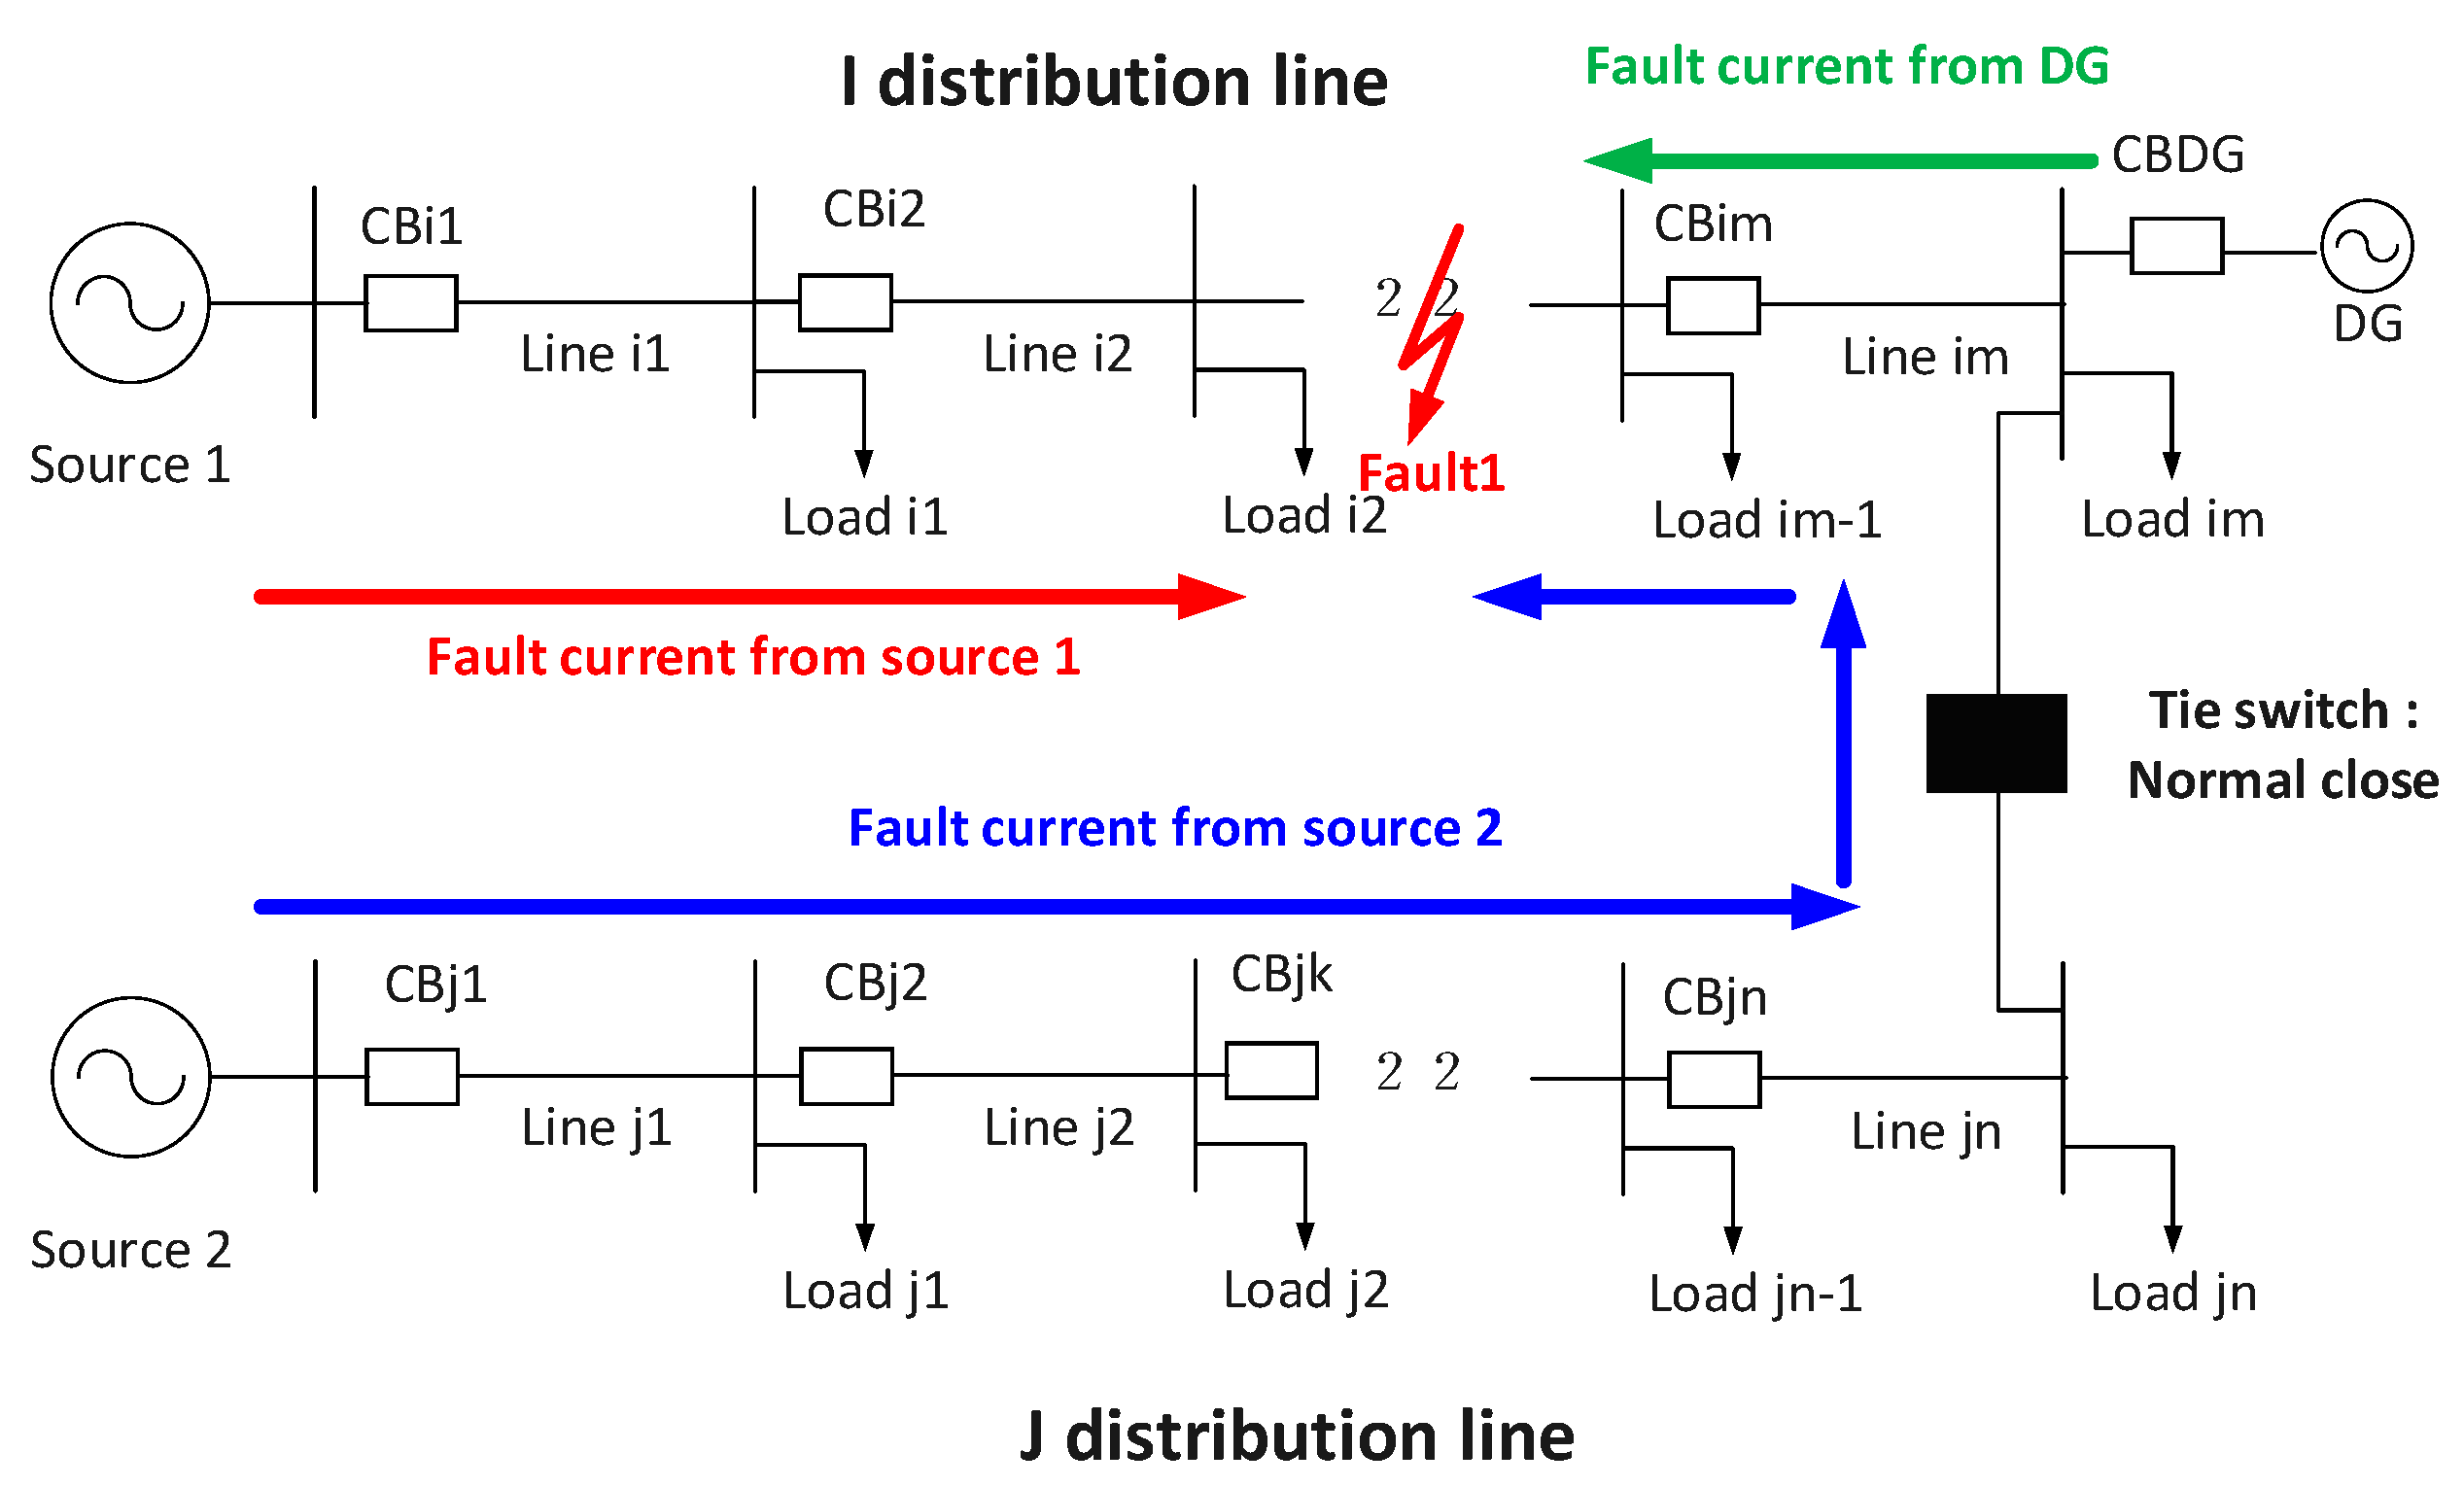
Figure 2.
Equivalent circuit of loop distribution system.
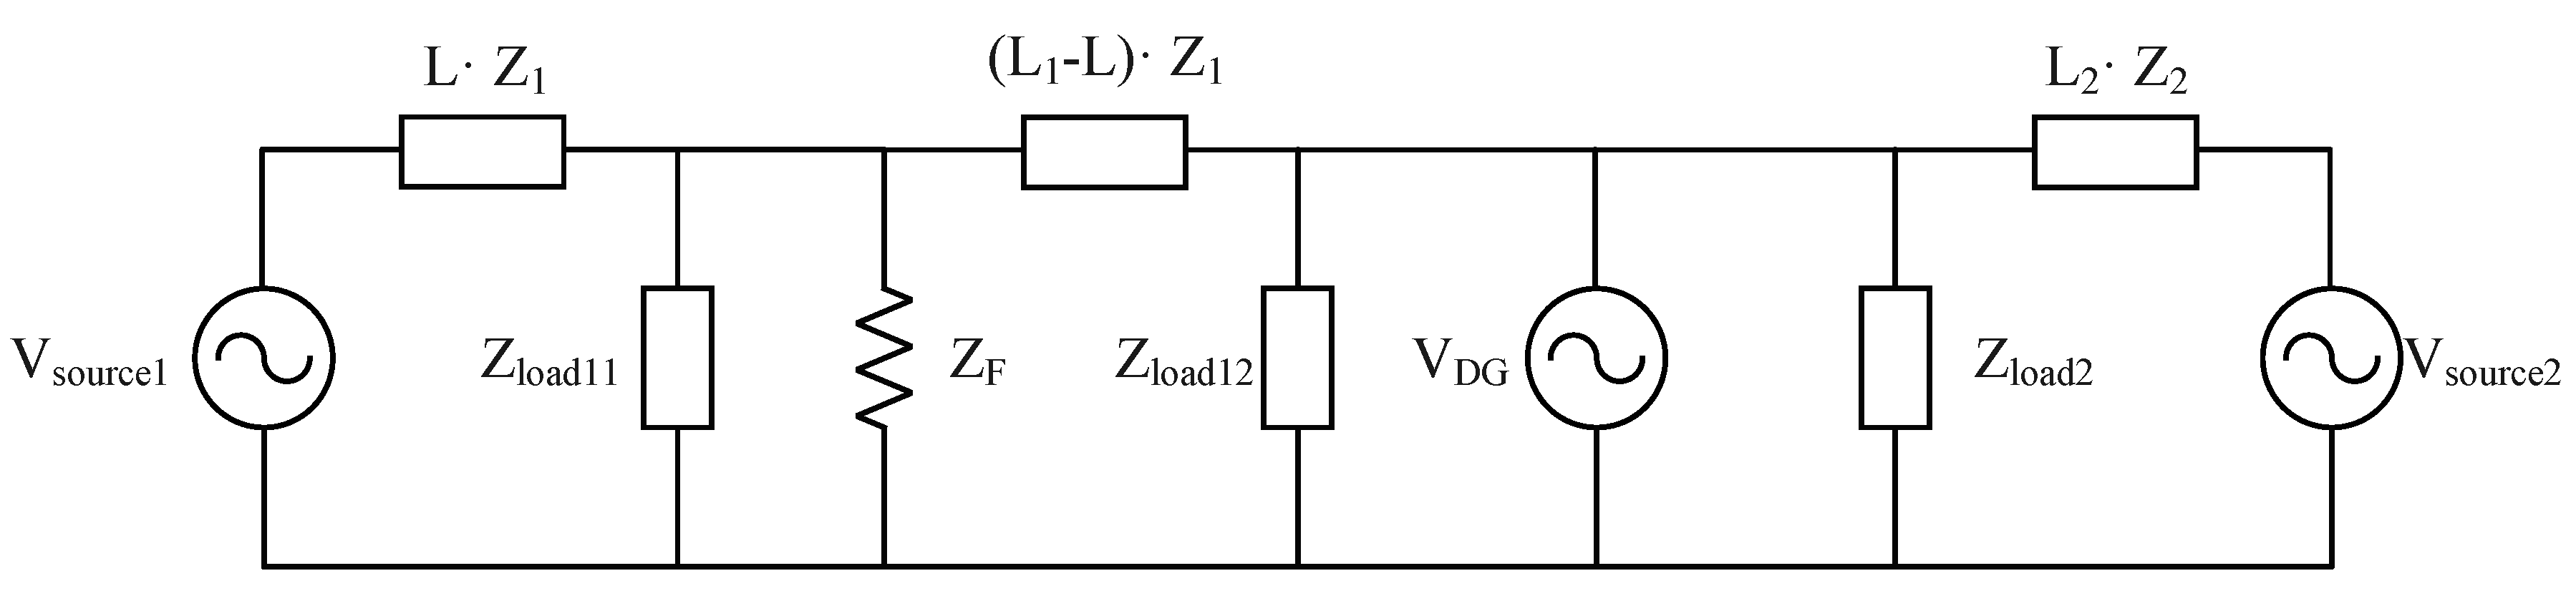
Figure 3.
Simplified equivalent circuit.
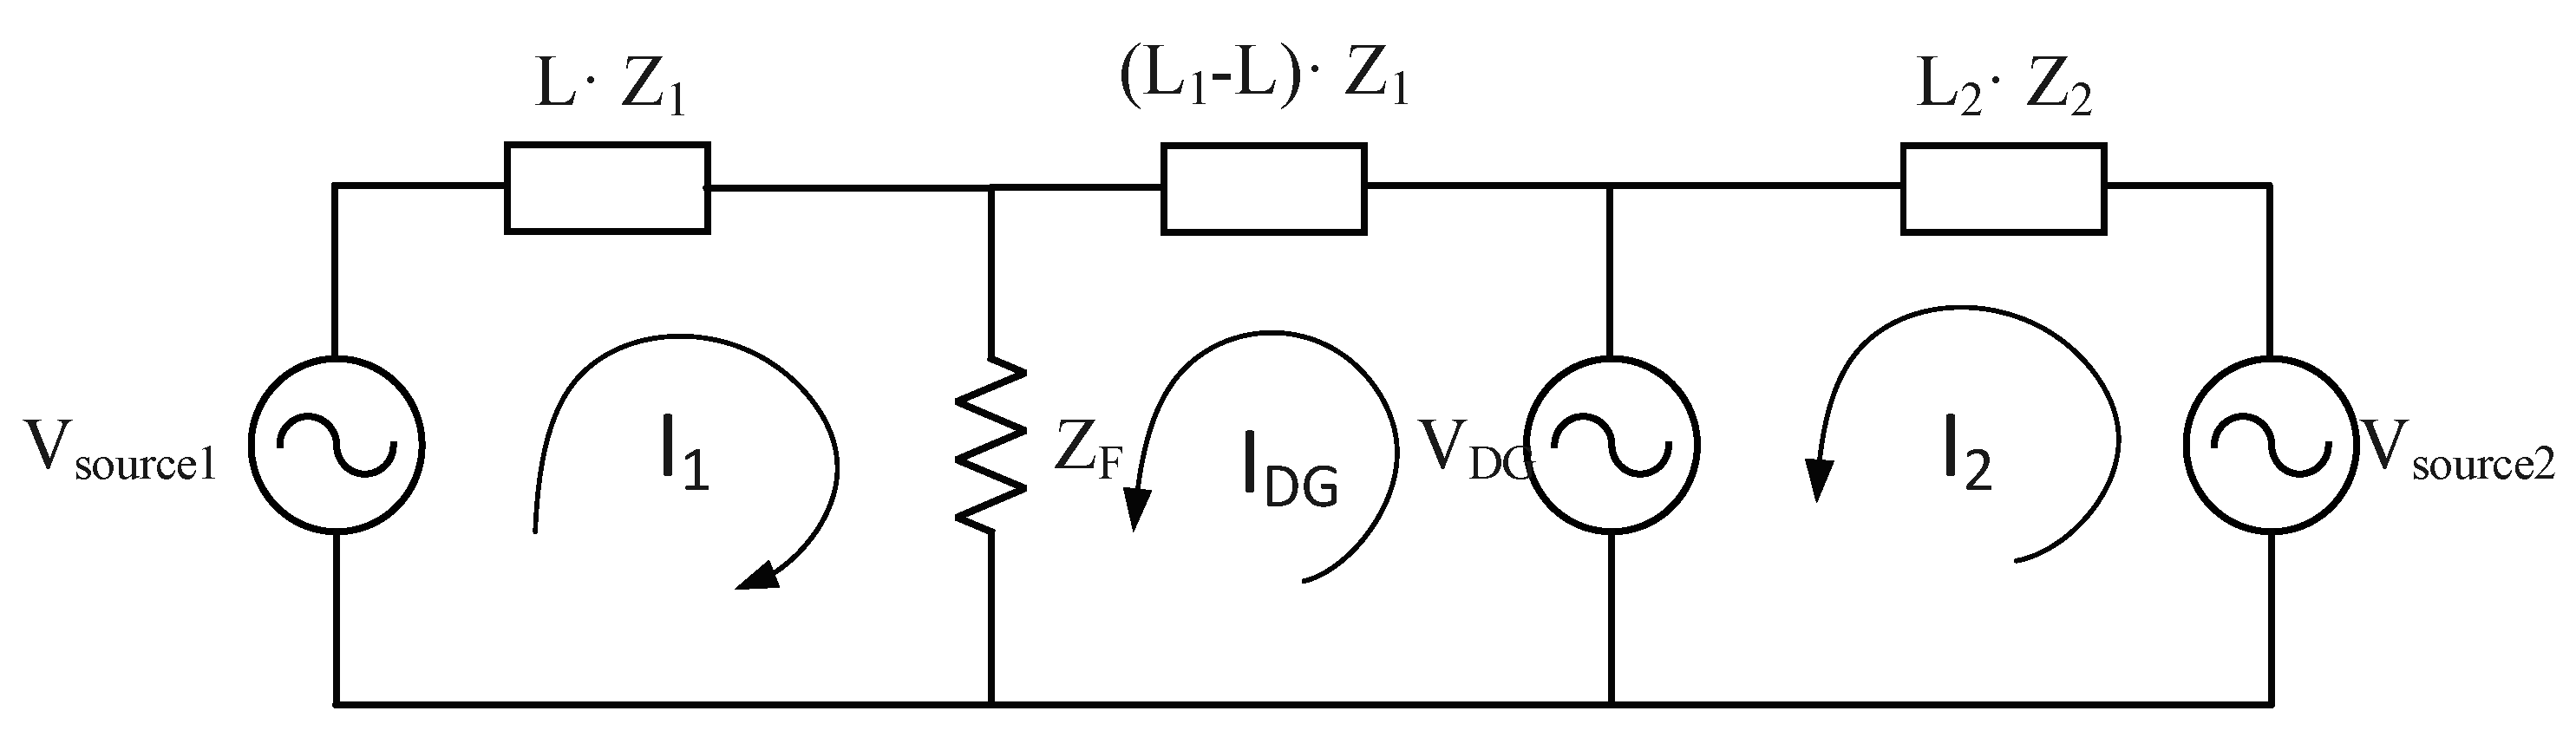
Figure 4.
Schematic diagram of new protection method of the loop distribution system considering DG.
Figure 4.
Schematic diagram of new protection method of the loop distribution system considering DG.

Figure 5.
Flowchart of new protection method in the loop distribution system considering DG.

Figure 6.
Loop distribution model with DG.
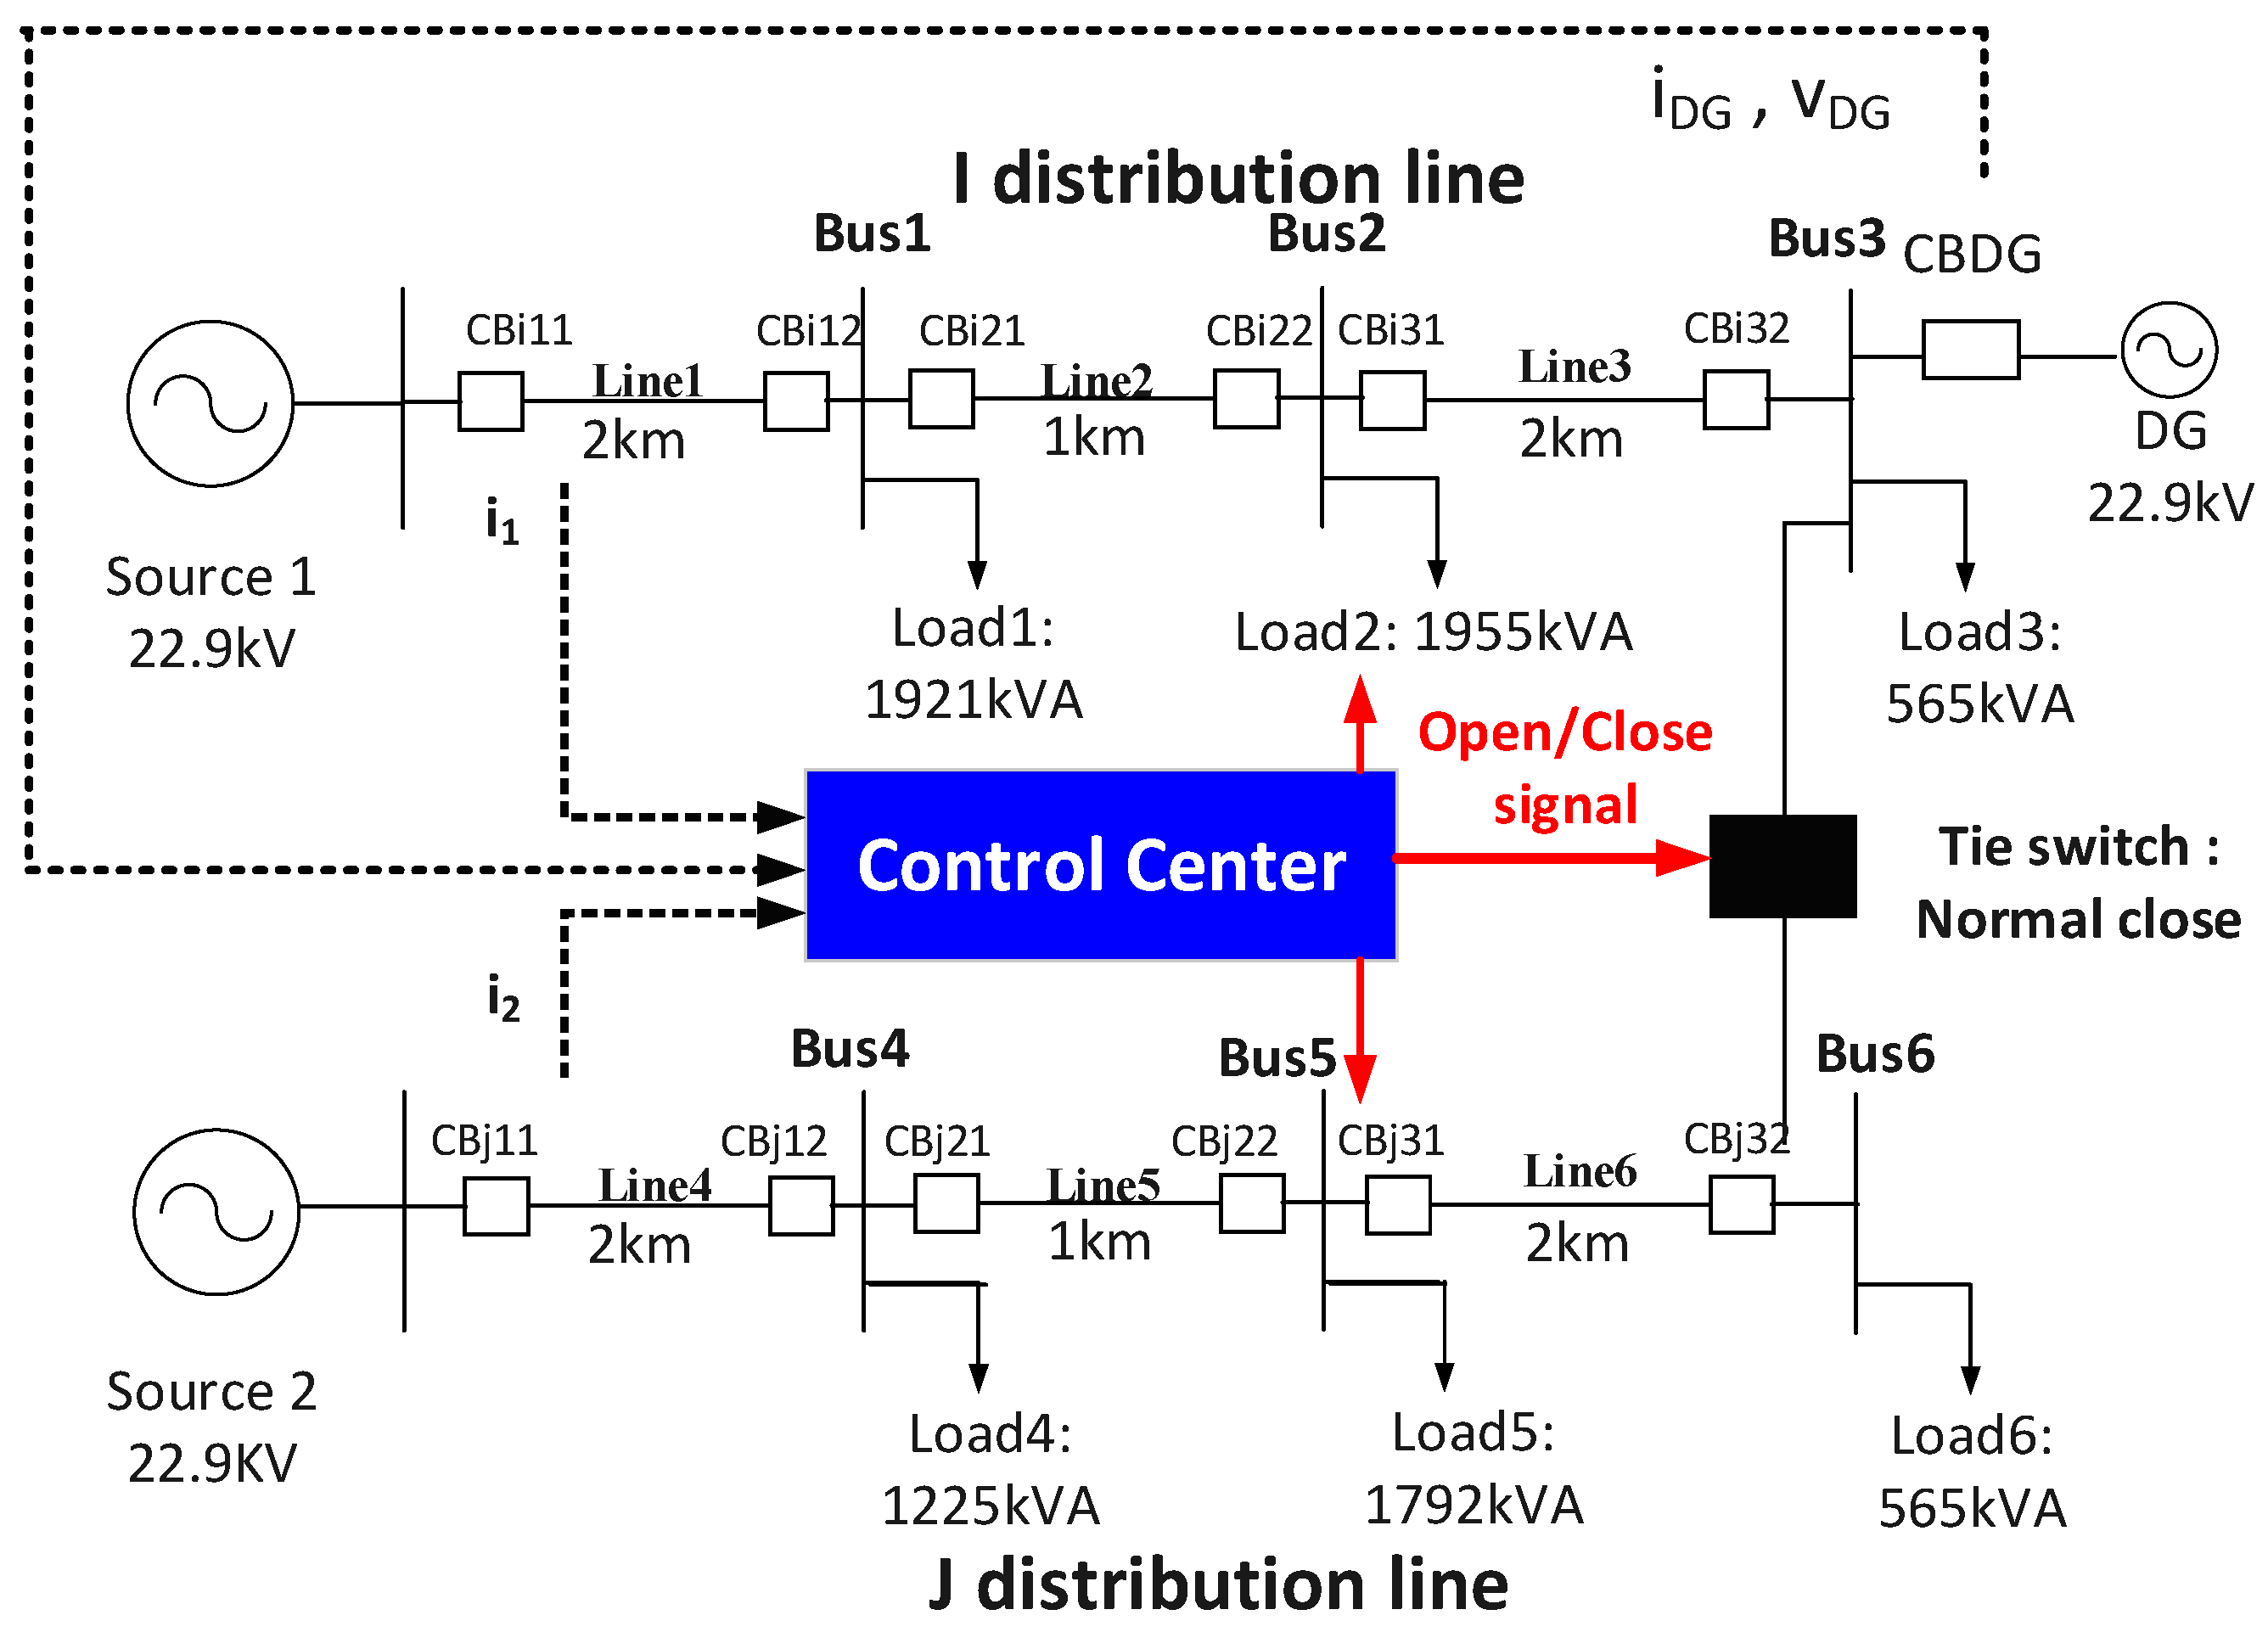
Figure 7.
Fault location in Case 1.
Figure 8.
Current waveform measured at I1 in Case 1.
Figure 9.
Current measured at Load 3 in Case 1.

Figure 10.
Fault location in Case 2.

Figure 11.
Current measured at I1 in Case 2.
Figure 12.
Current measured at Load 3 in Case 2.

Figure 13.
Fault location in Case 3.
Figure 14.
Current measured at I1 in Case 3.

Figure 15.
Current measured at Load 3 in Case 3.

Figure 16.
Fault location in Case 4.
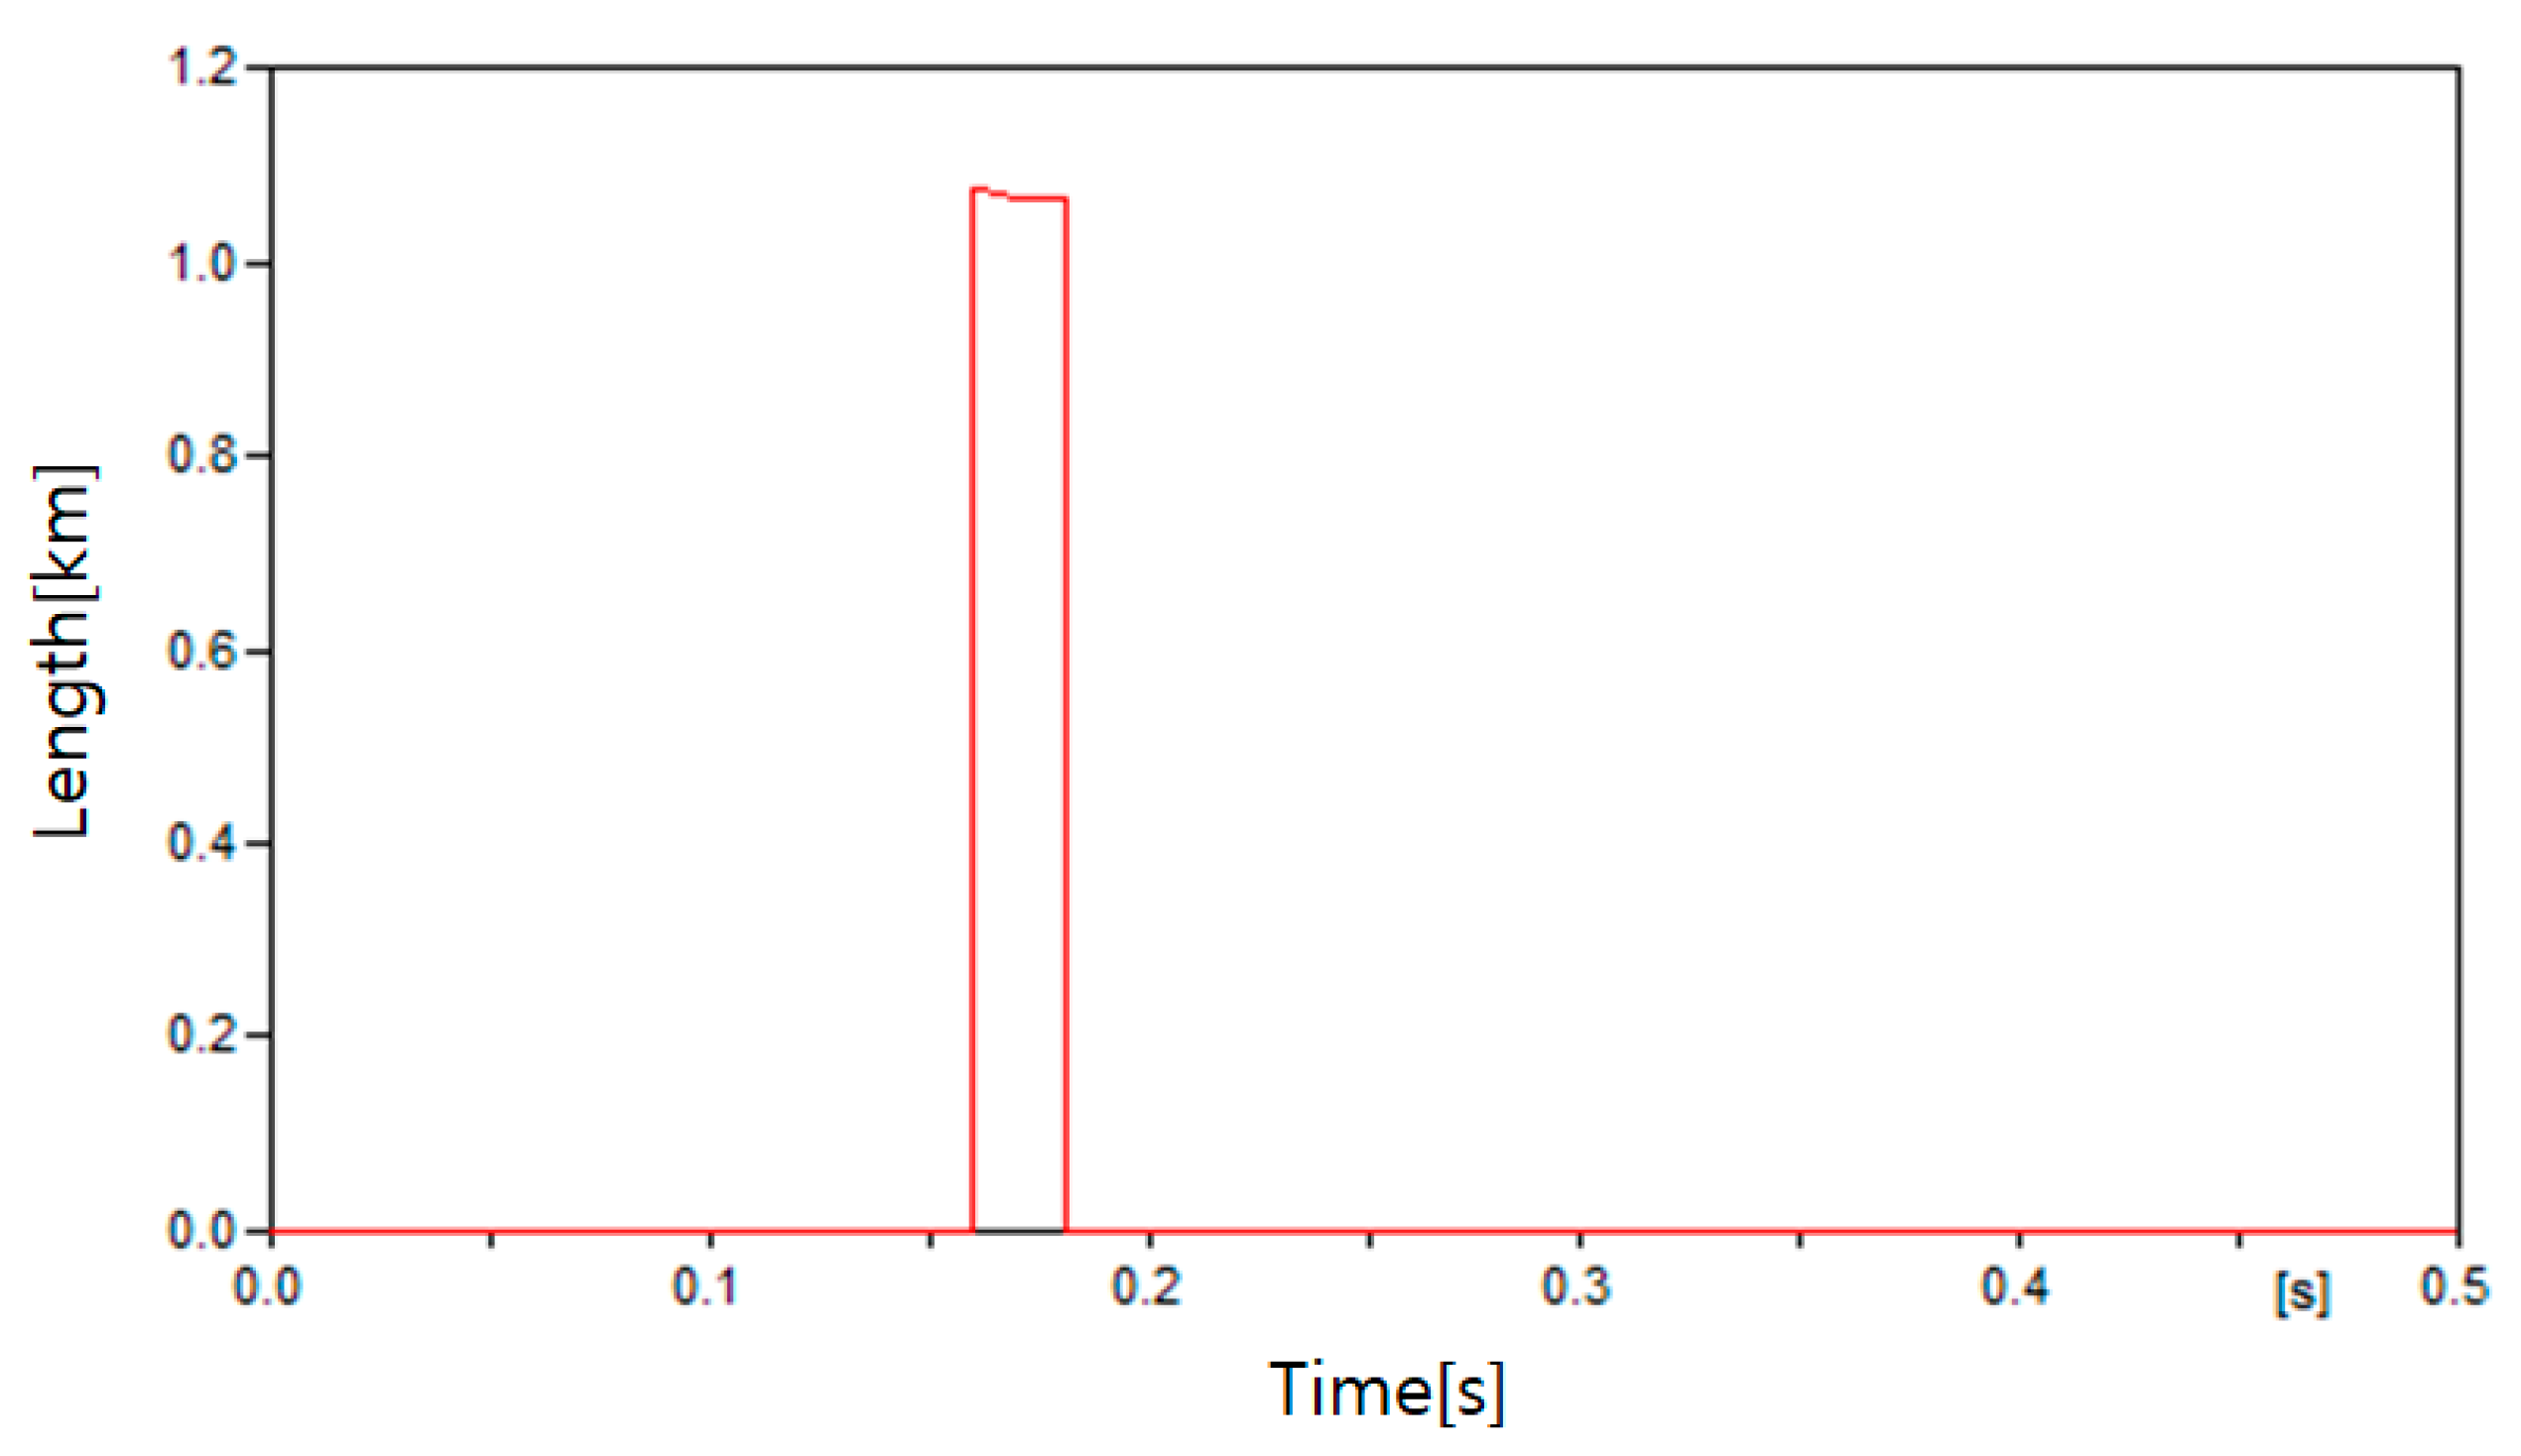
Figure 17.
Current measured at I2 in Case 4.
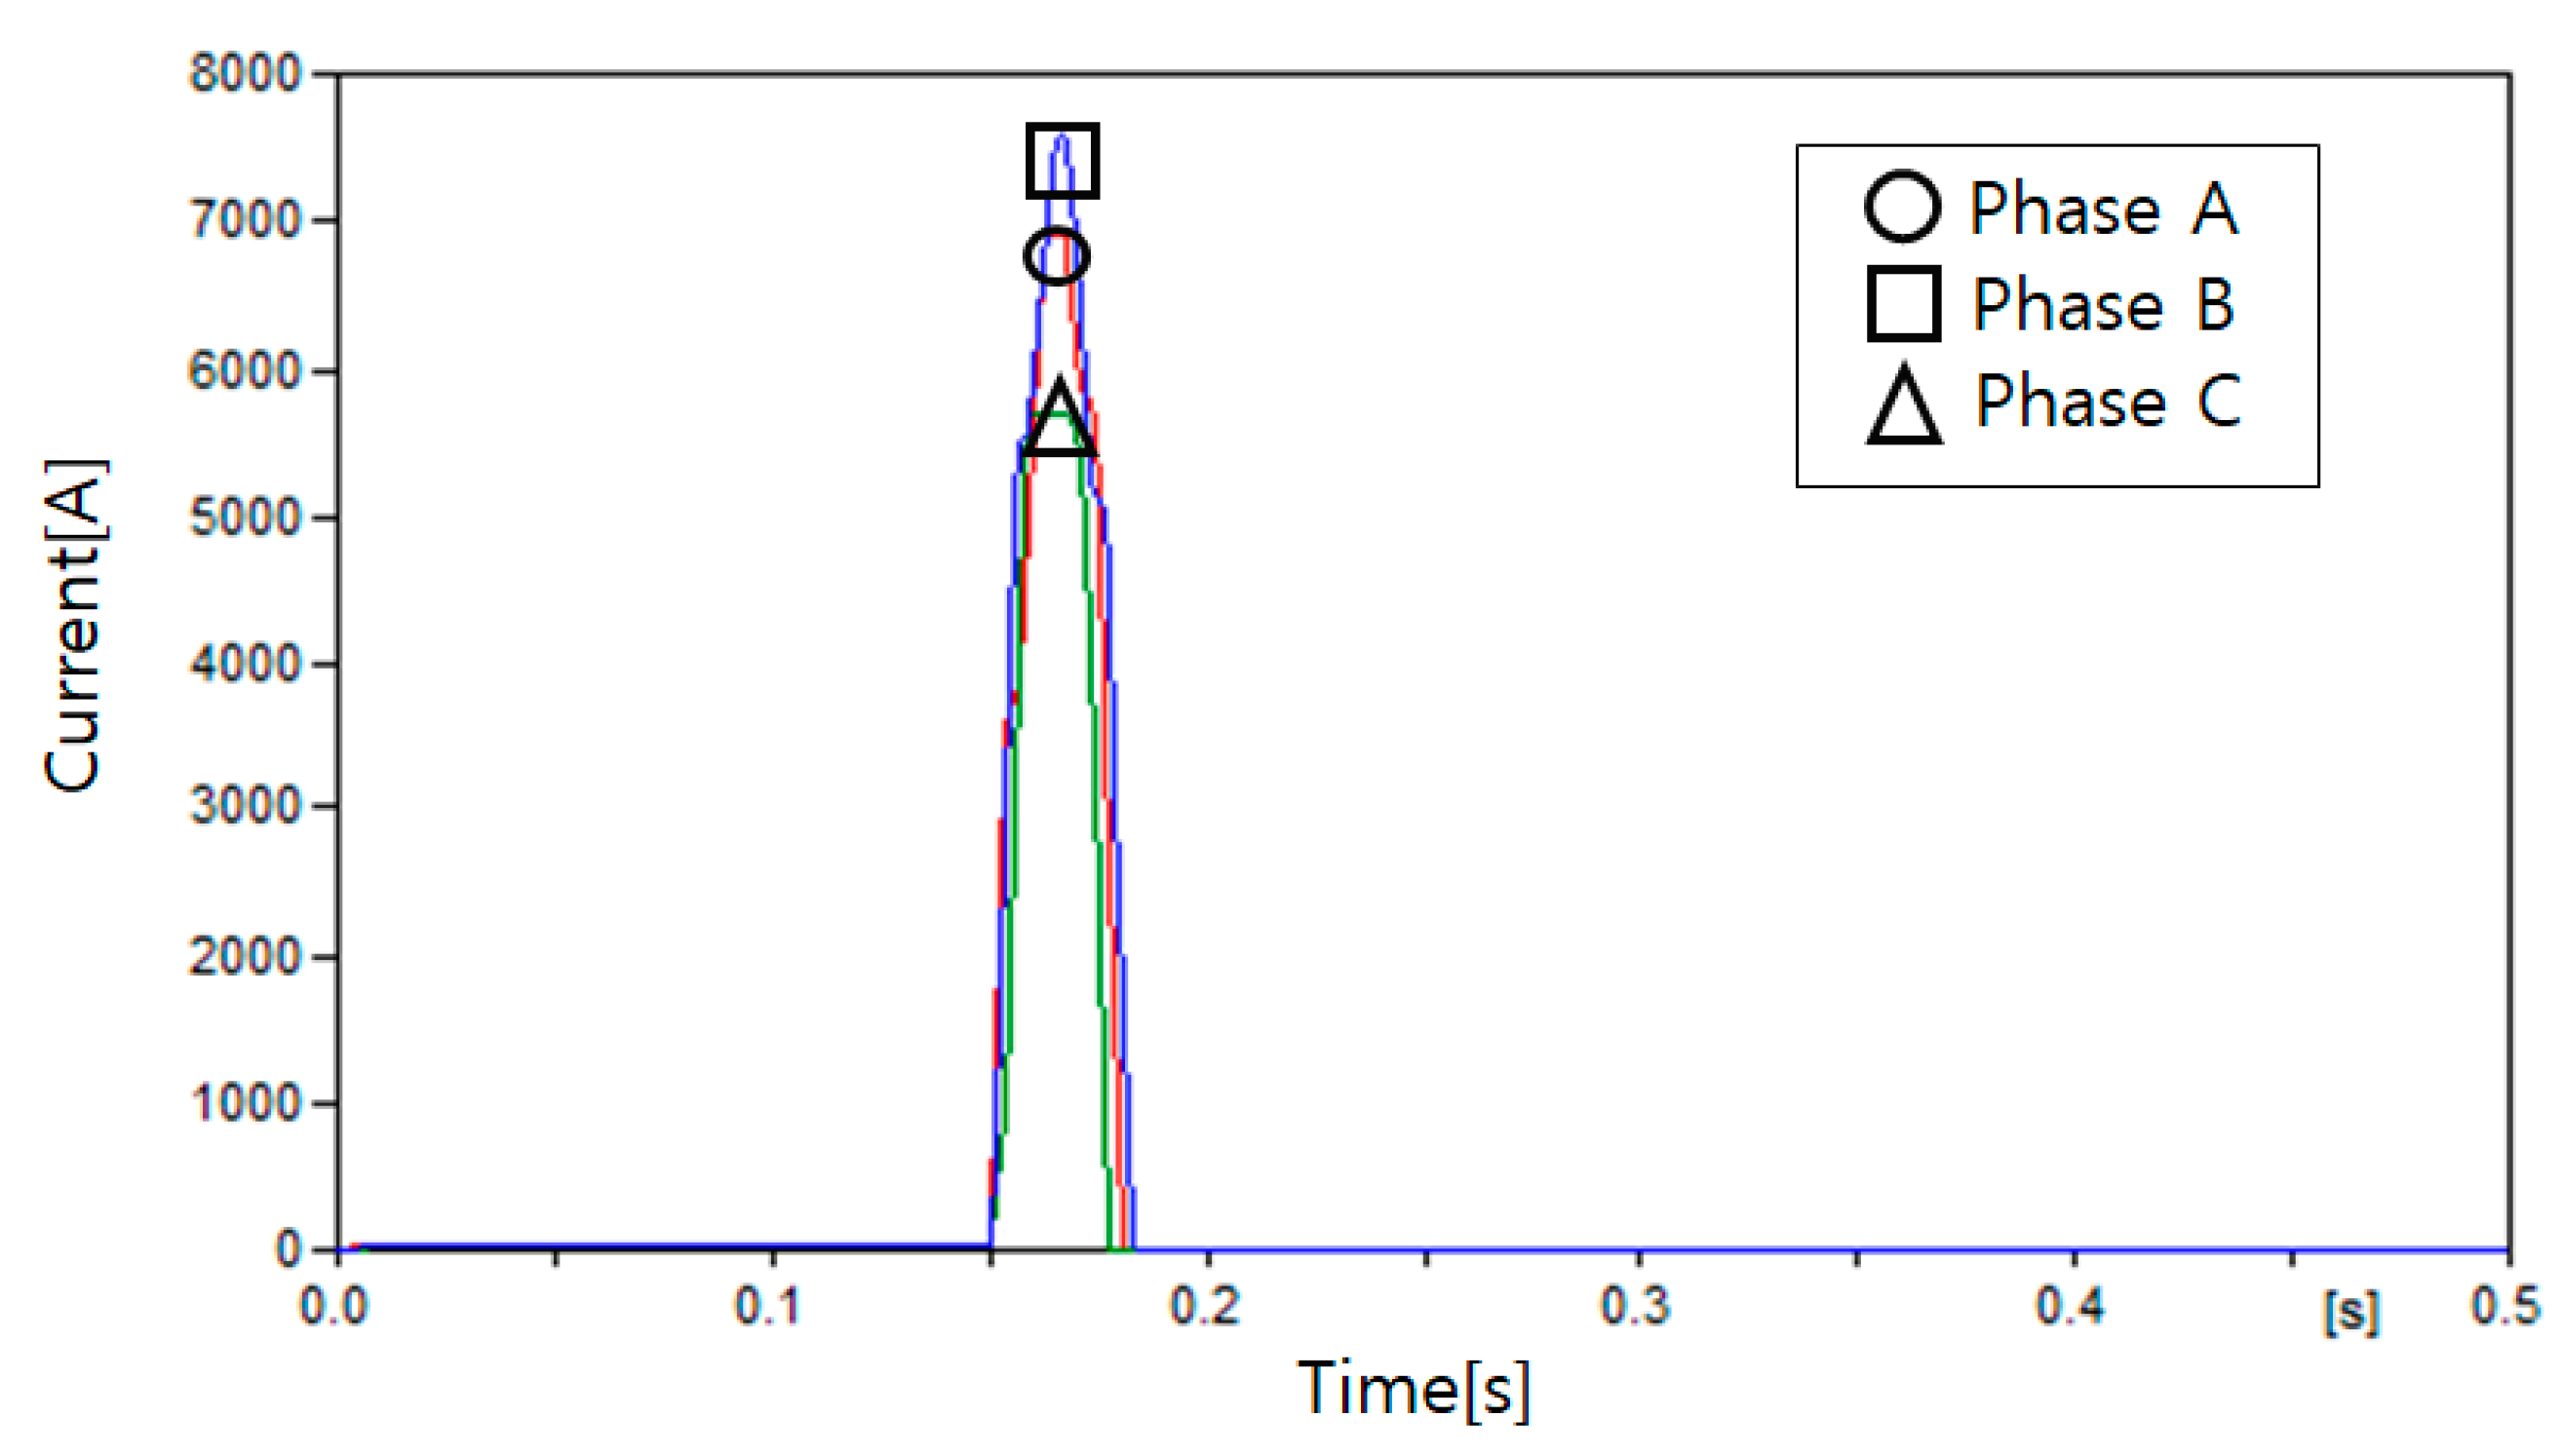
Figure 18.
Current measured at Load 6 in Case 4.

Figure 19.
Fault location in Case 5.
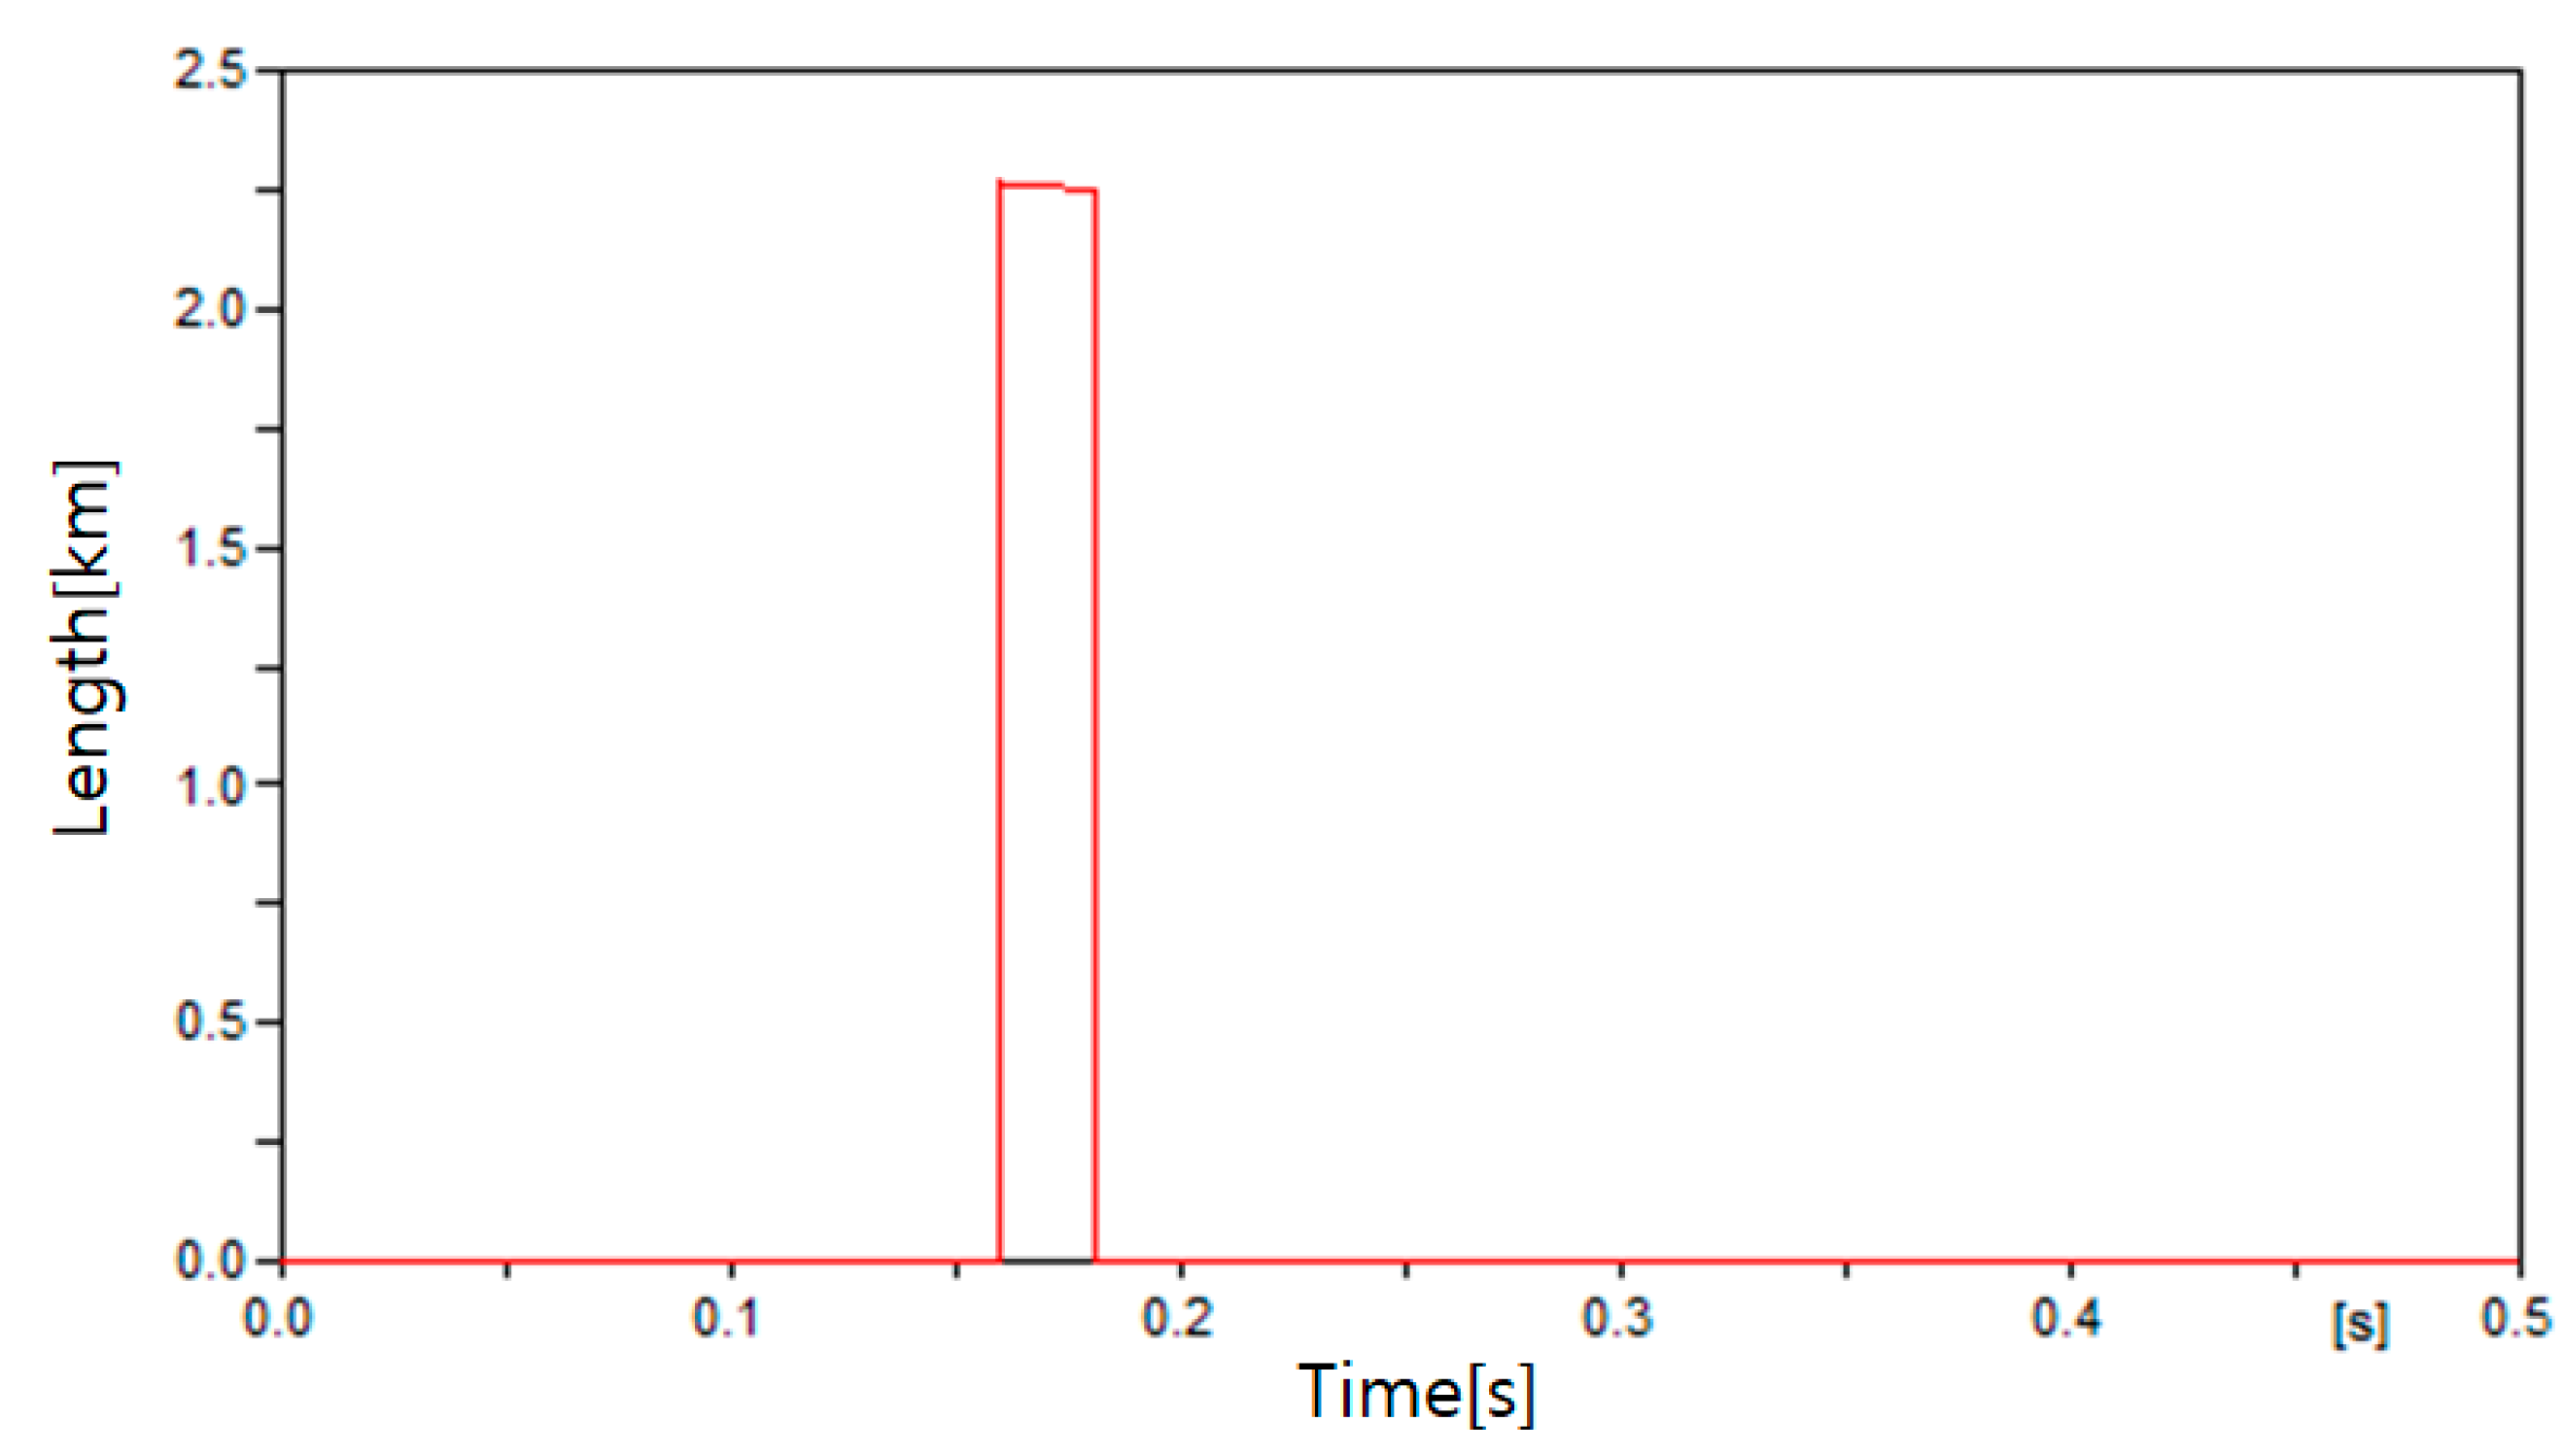
Figure 20.
Current measured at I2 in Case 5.

Figure 21.
Current measured at Load 6 in Case 5.

Figure 22.
Fault location in Case 6.
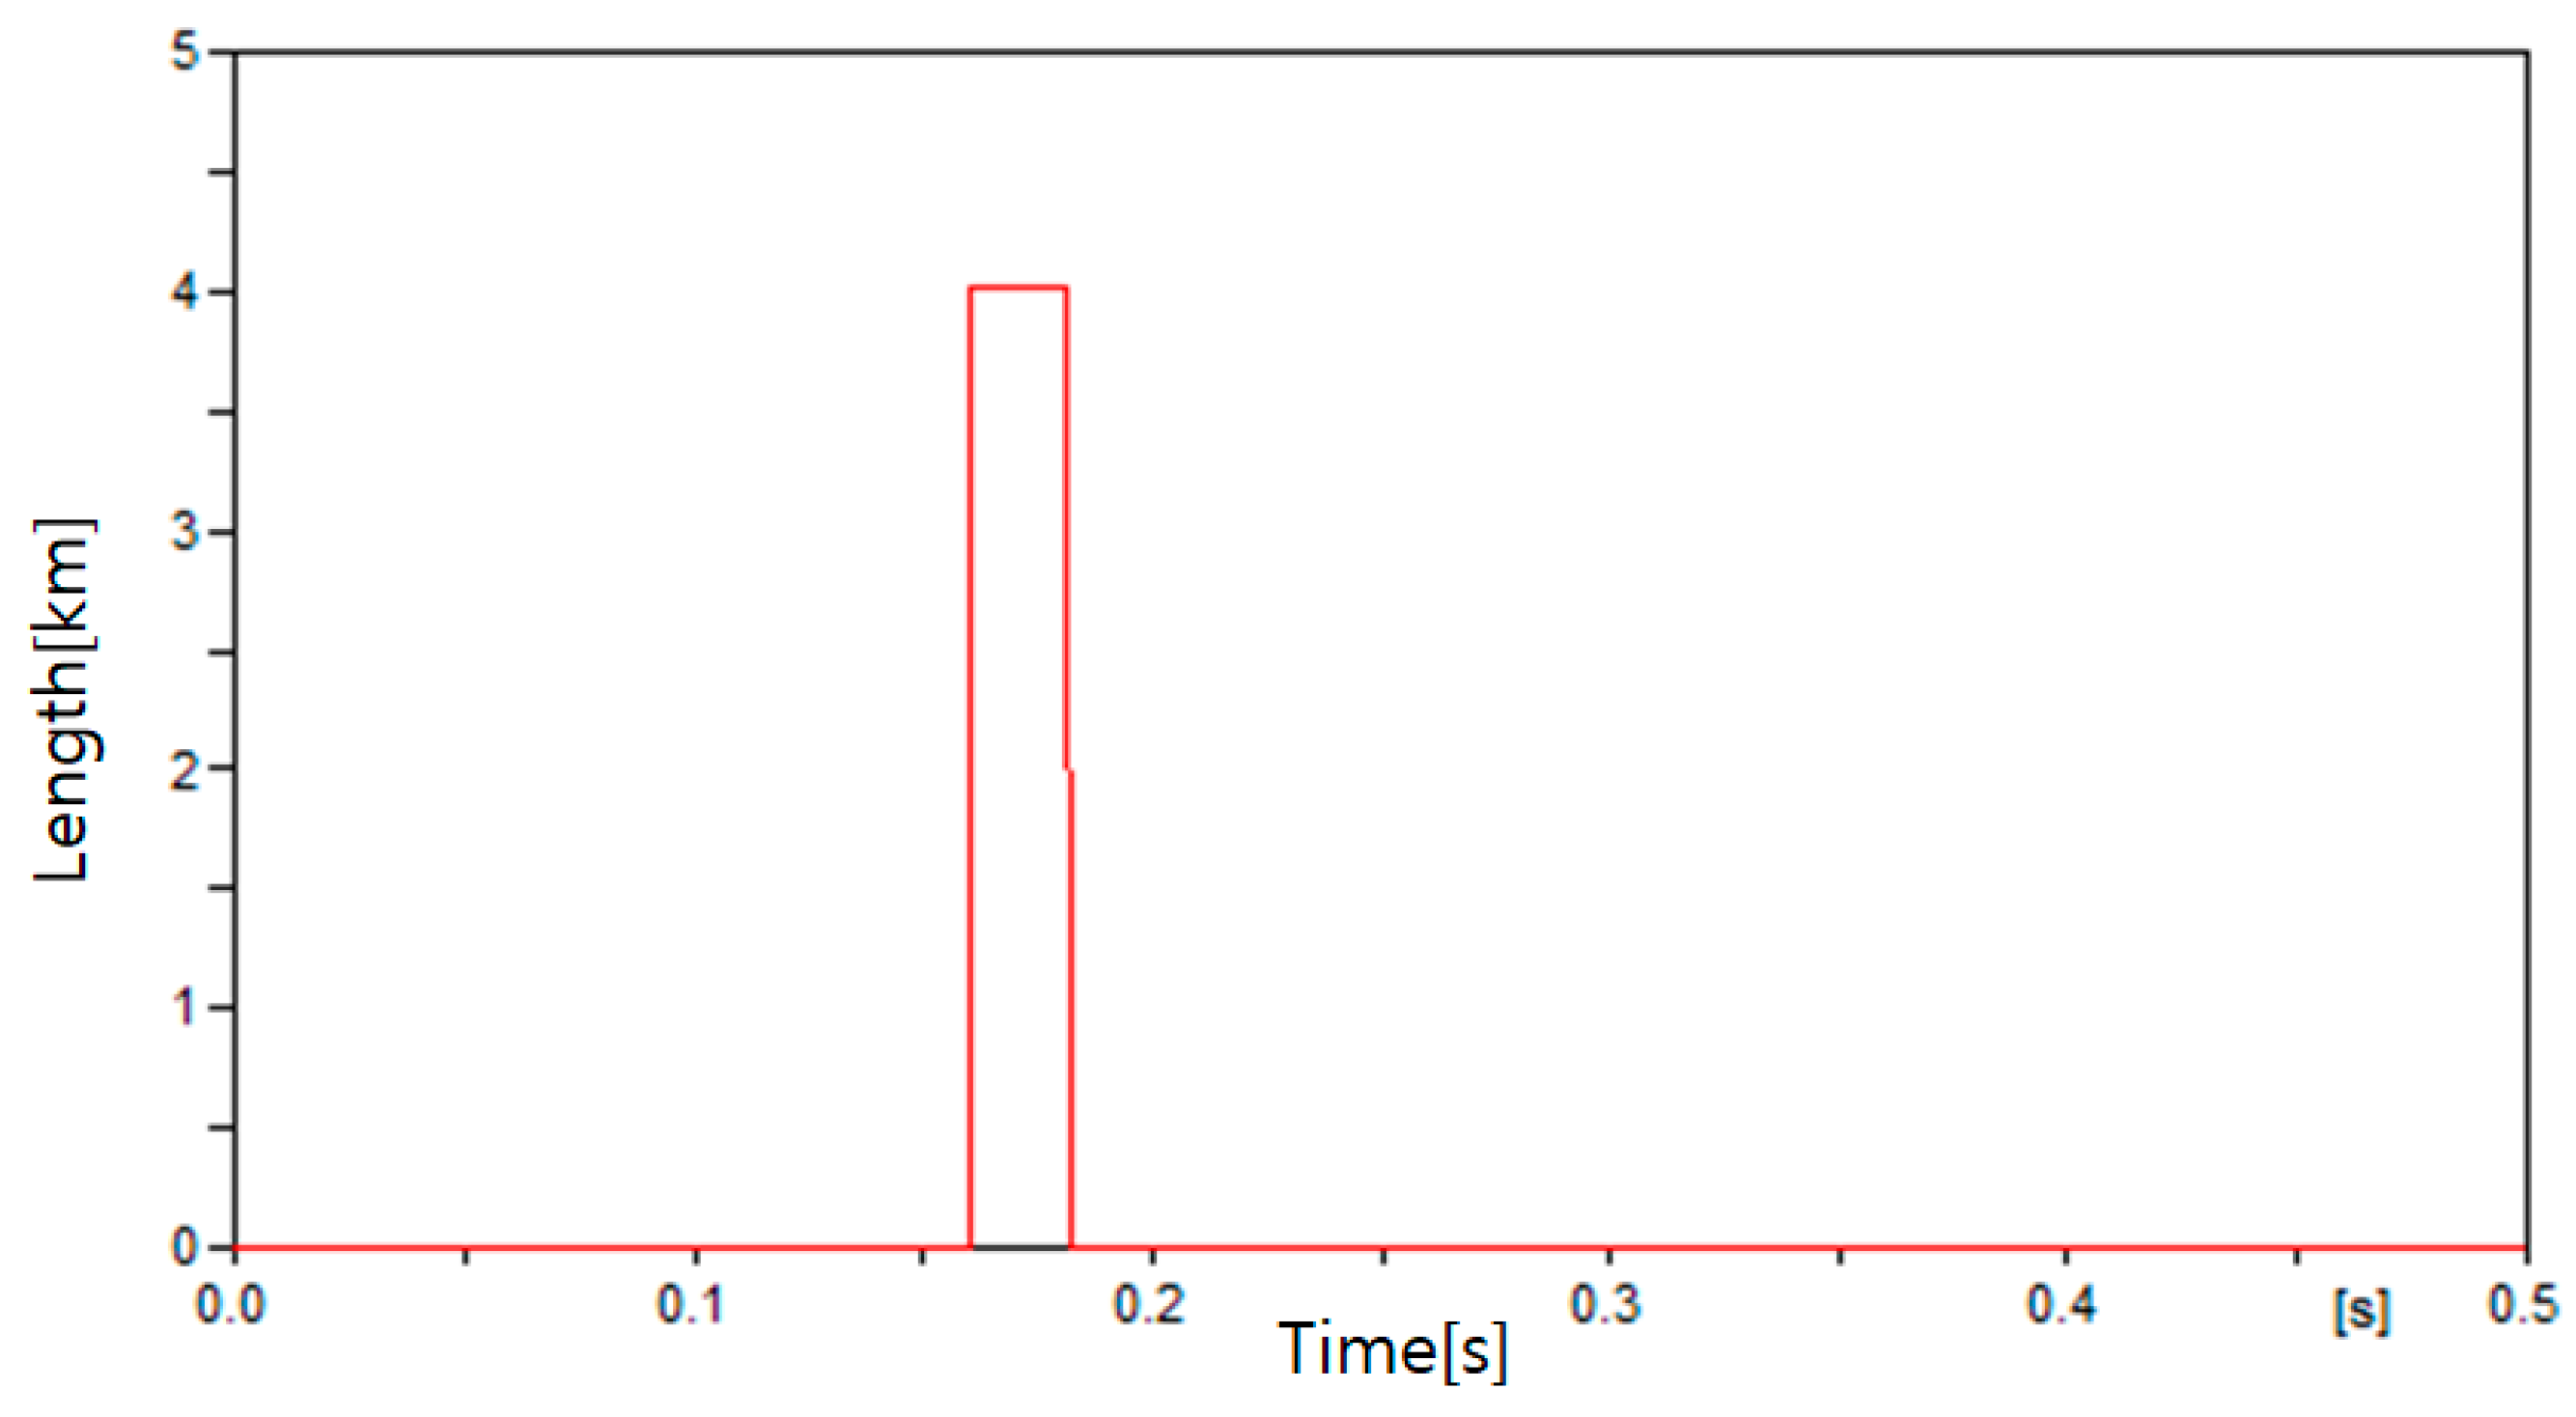
Figure 23.
Current measured at I2 in Case 6.
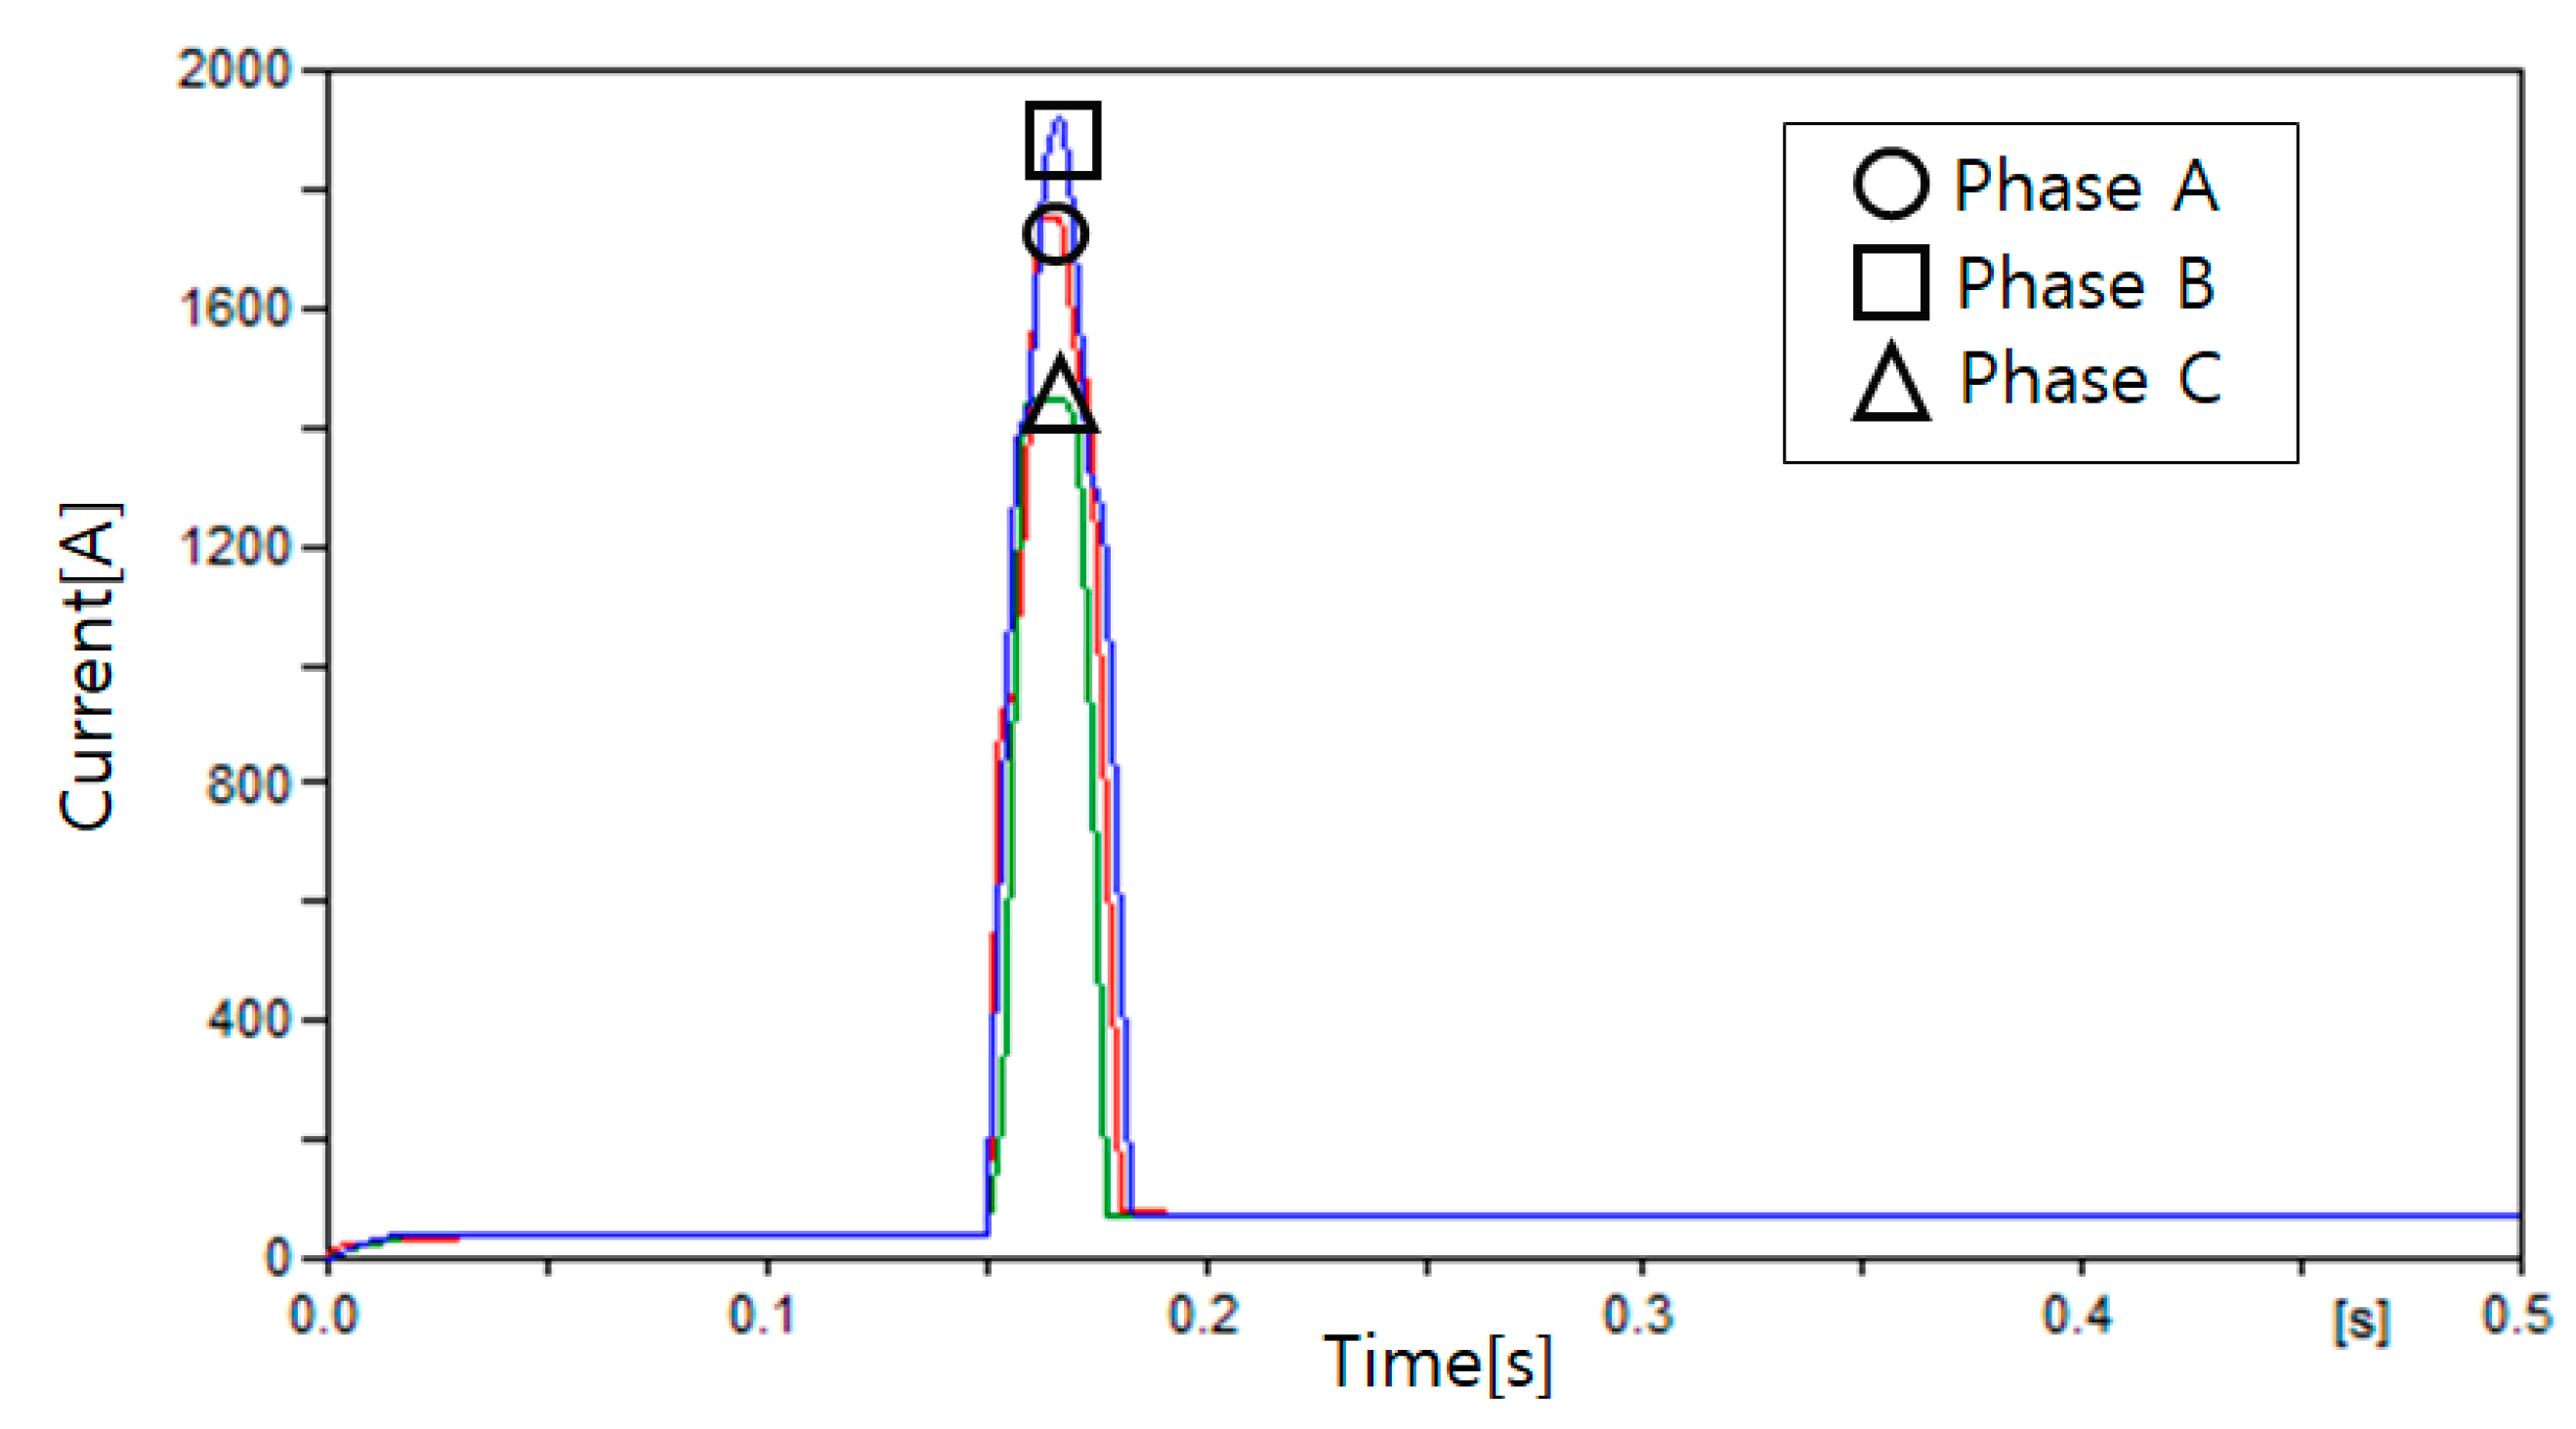
Figure 24.
Current measured at Load 6 in Case 6.
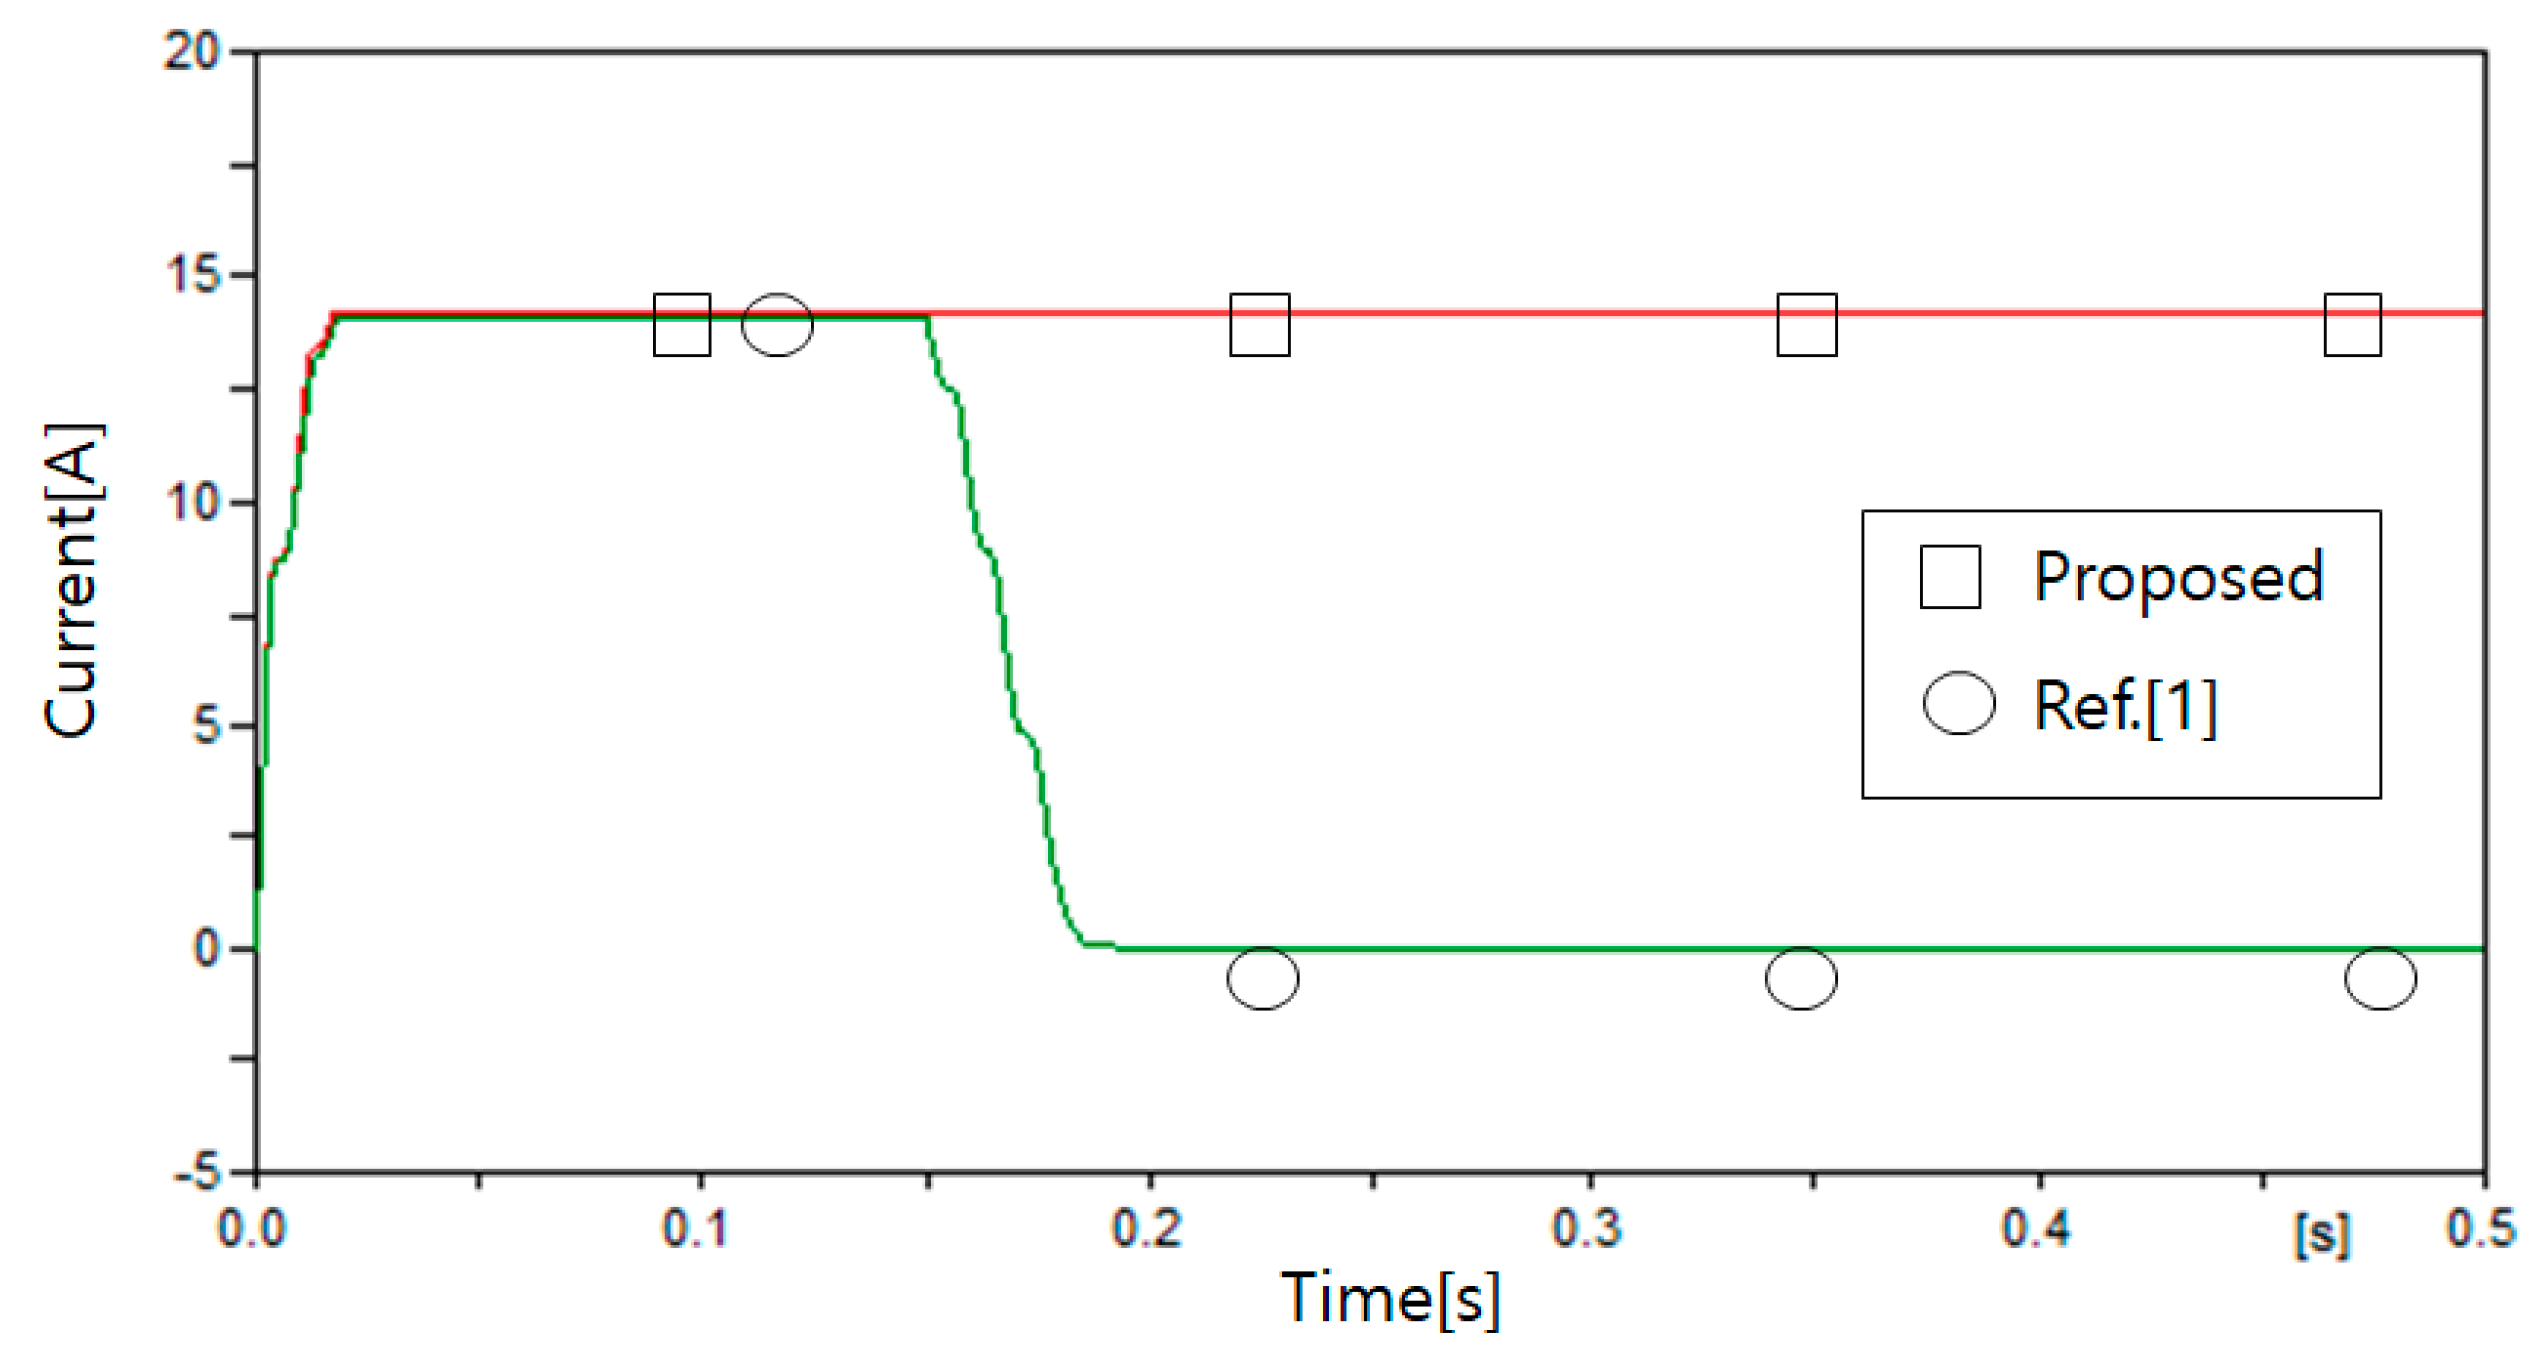
Figure 25.
Fault location in Case 7.
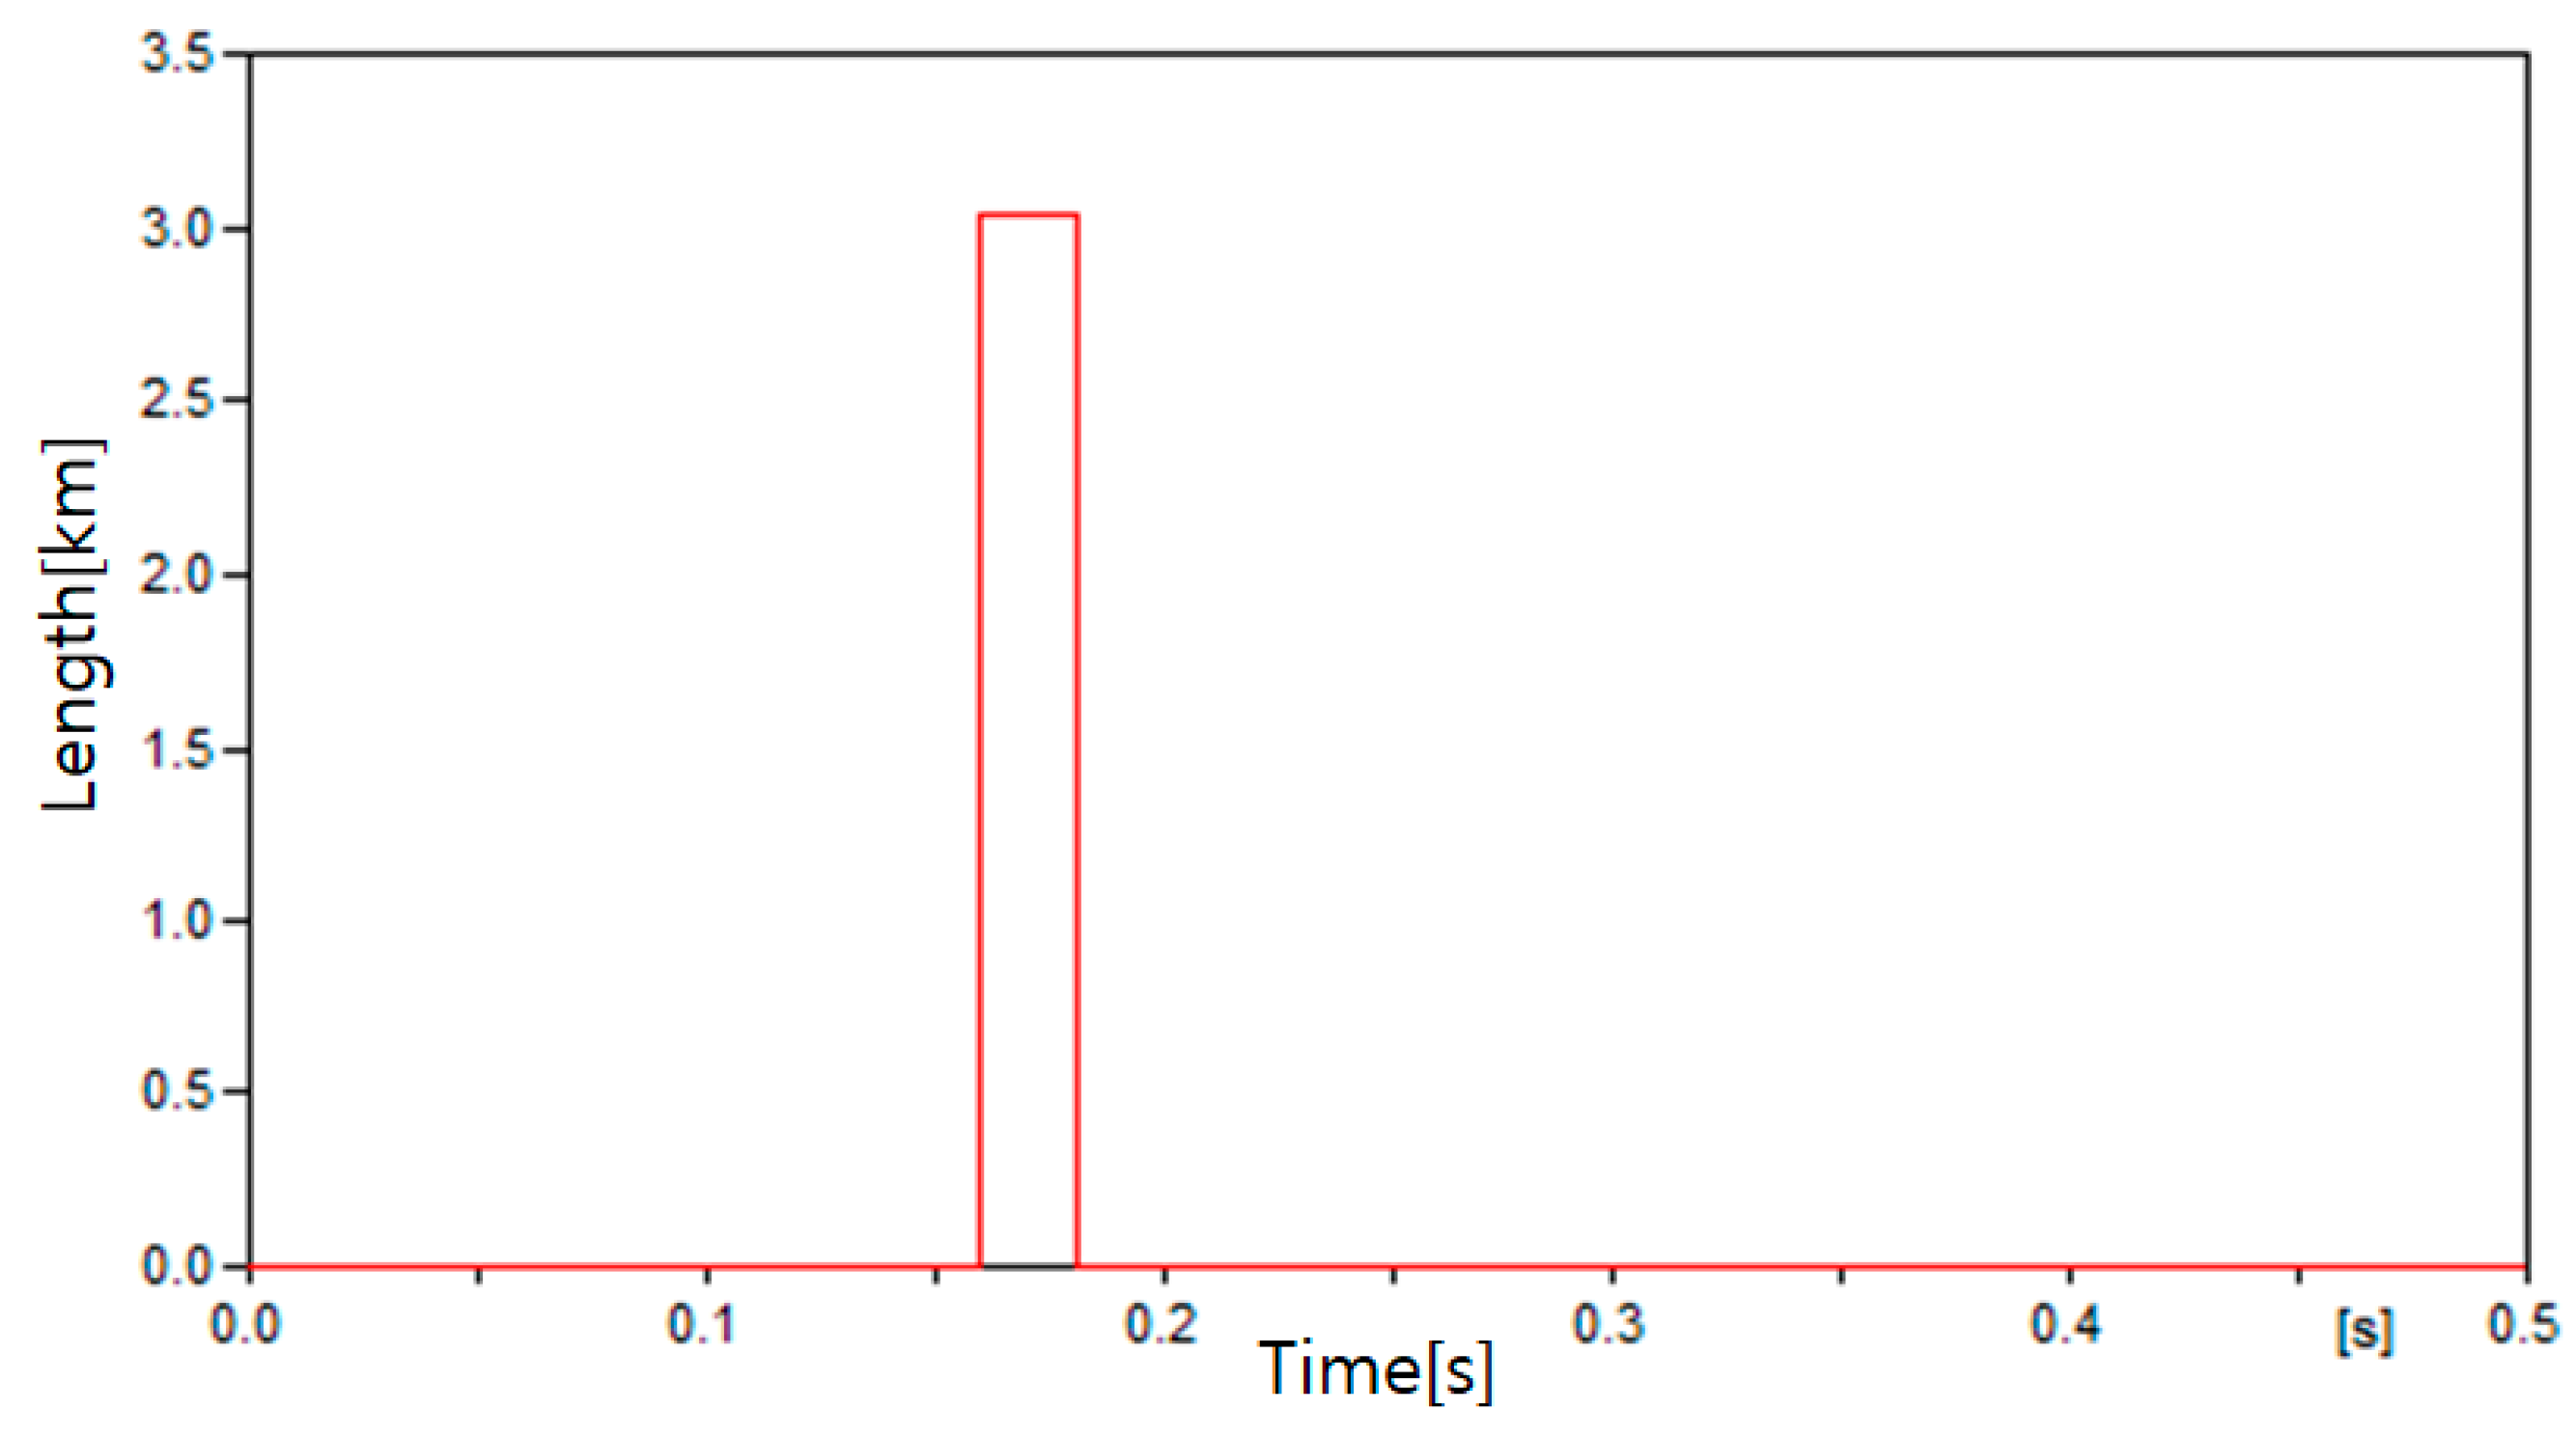
Figure 26.
Current measured at I1 in Case 7.

Figure 27.
Current measured at Load 3 in Case 7.

Figure 28.
Fault location in Case 8.
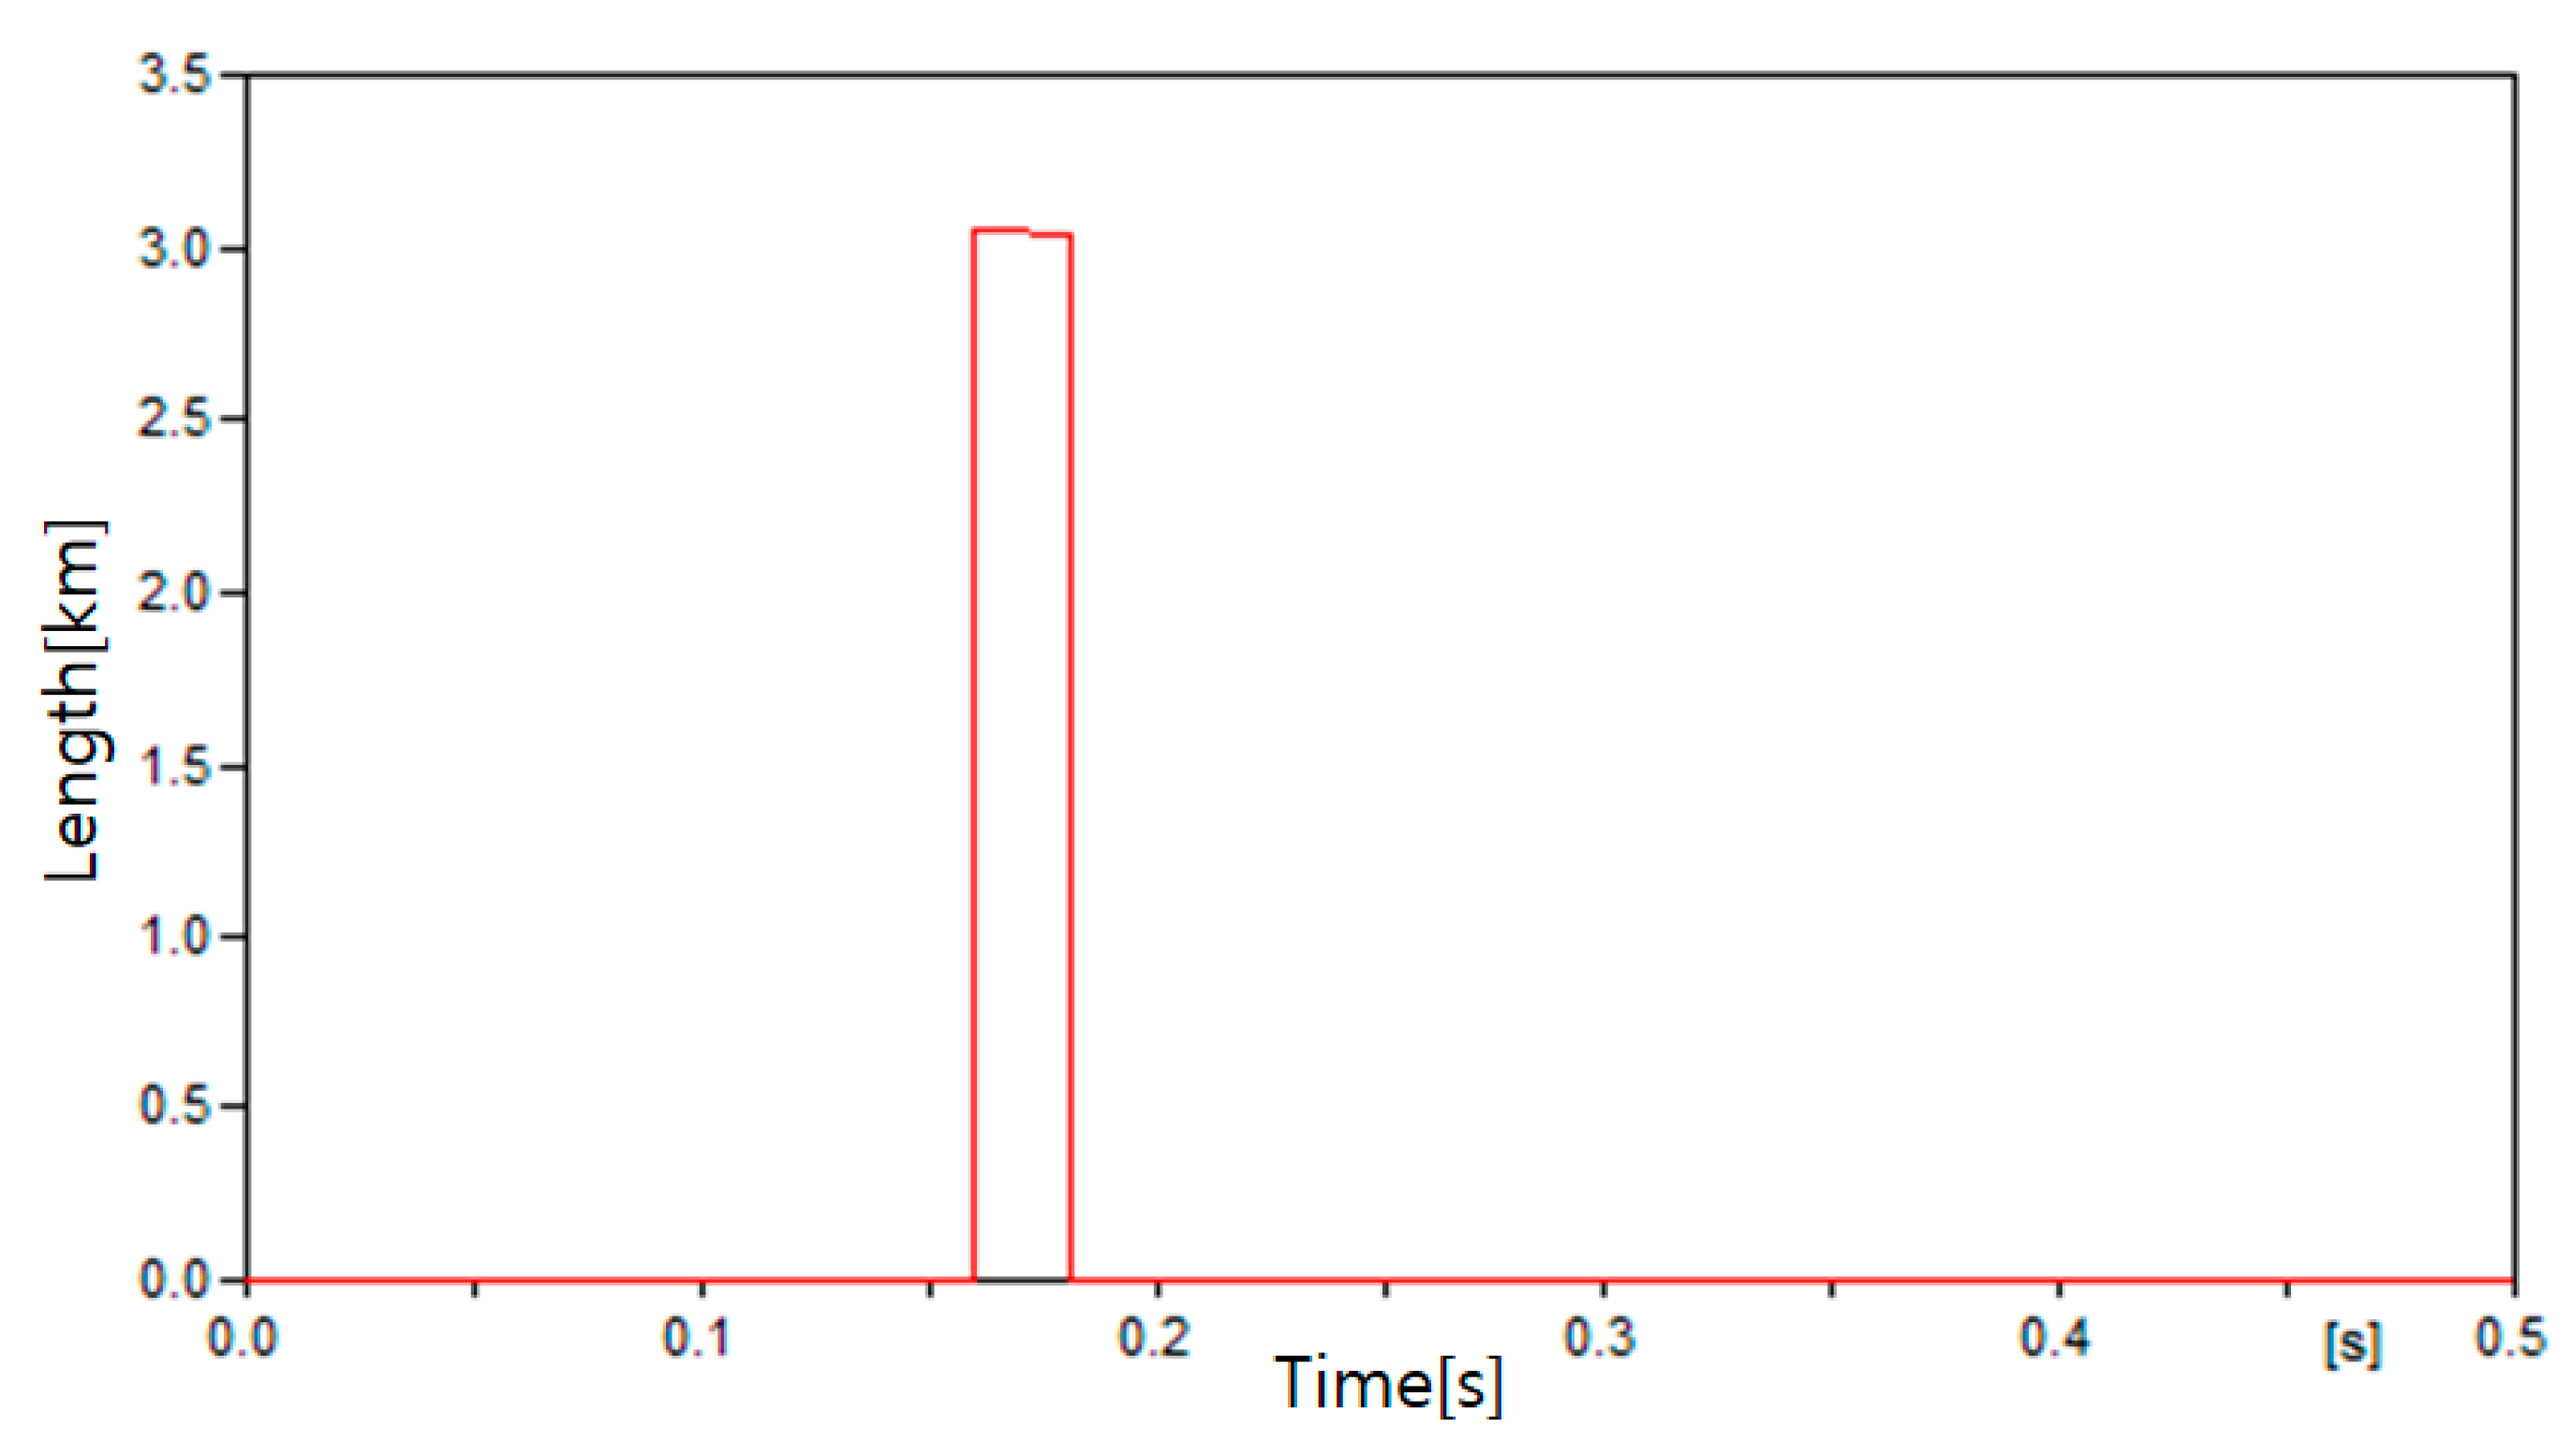
Figure 29.
Current measured at I2 in Case 8.
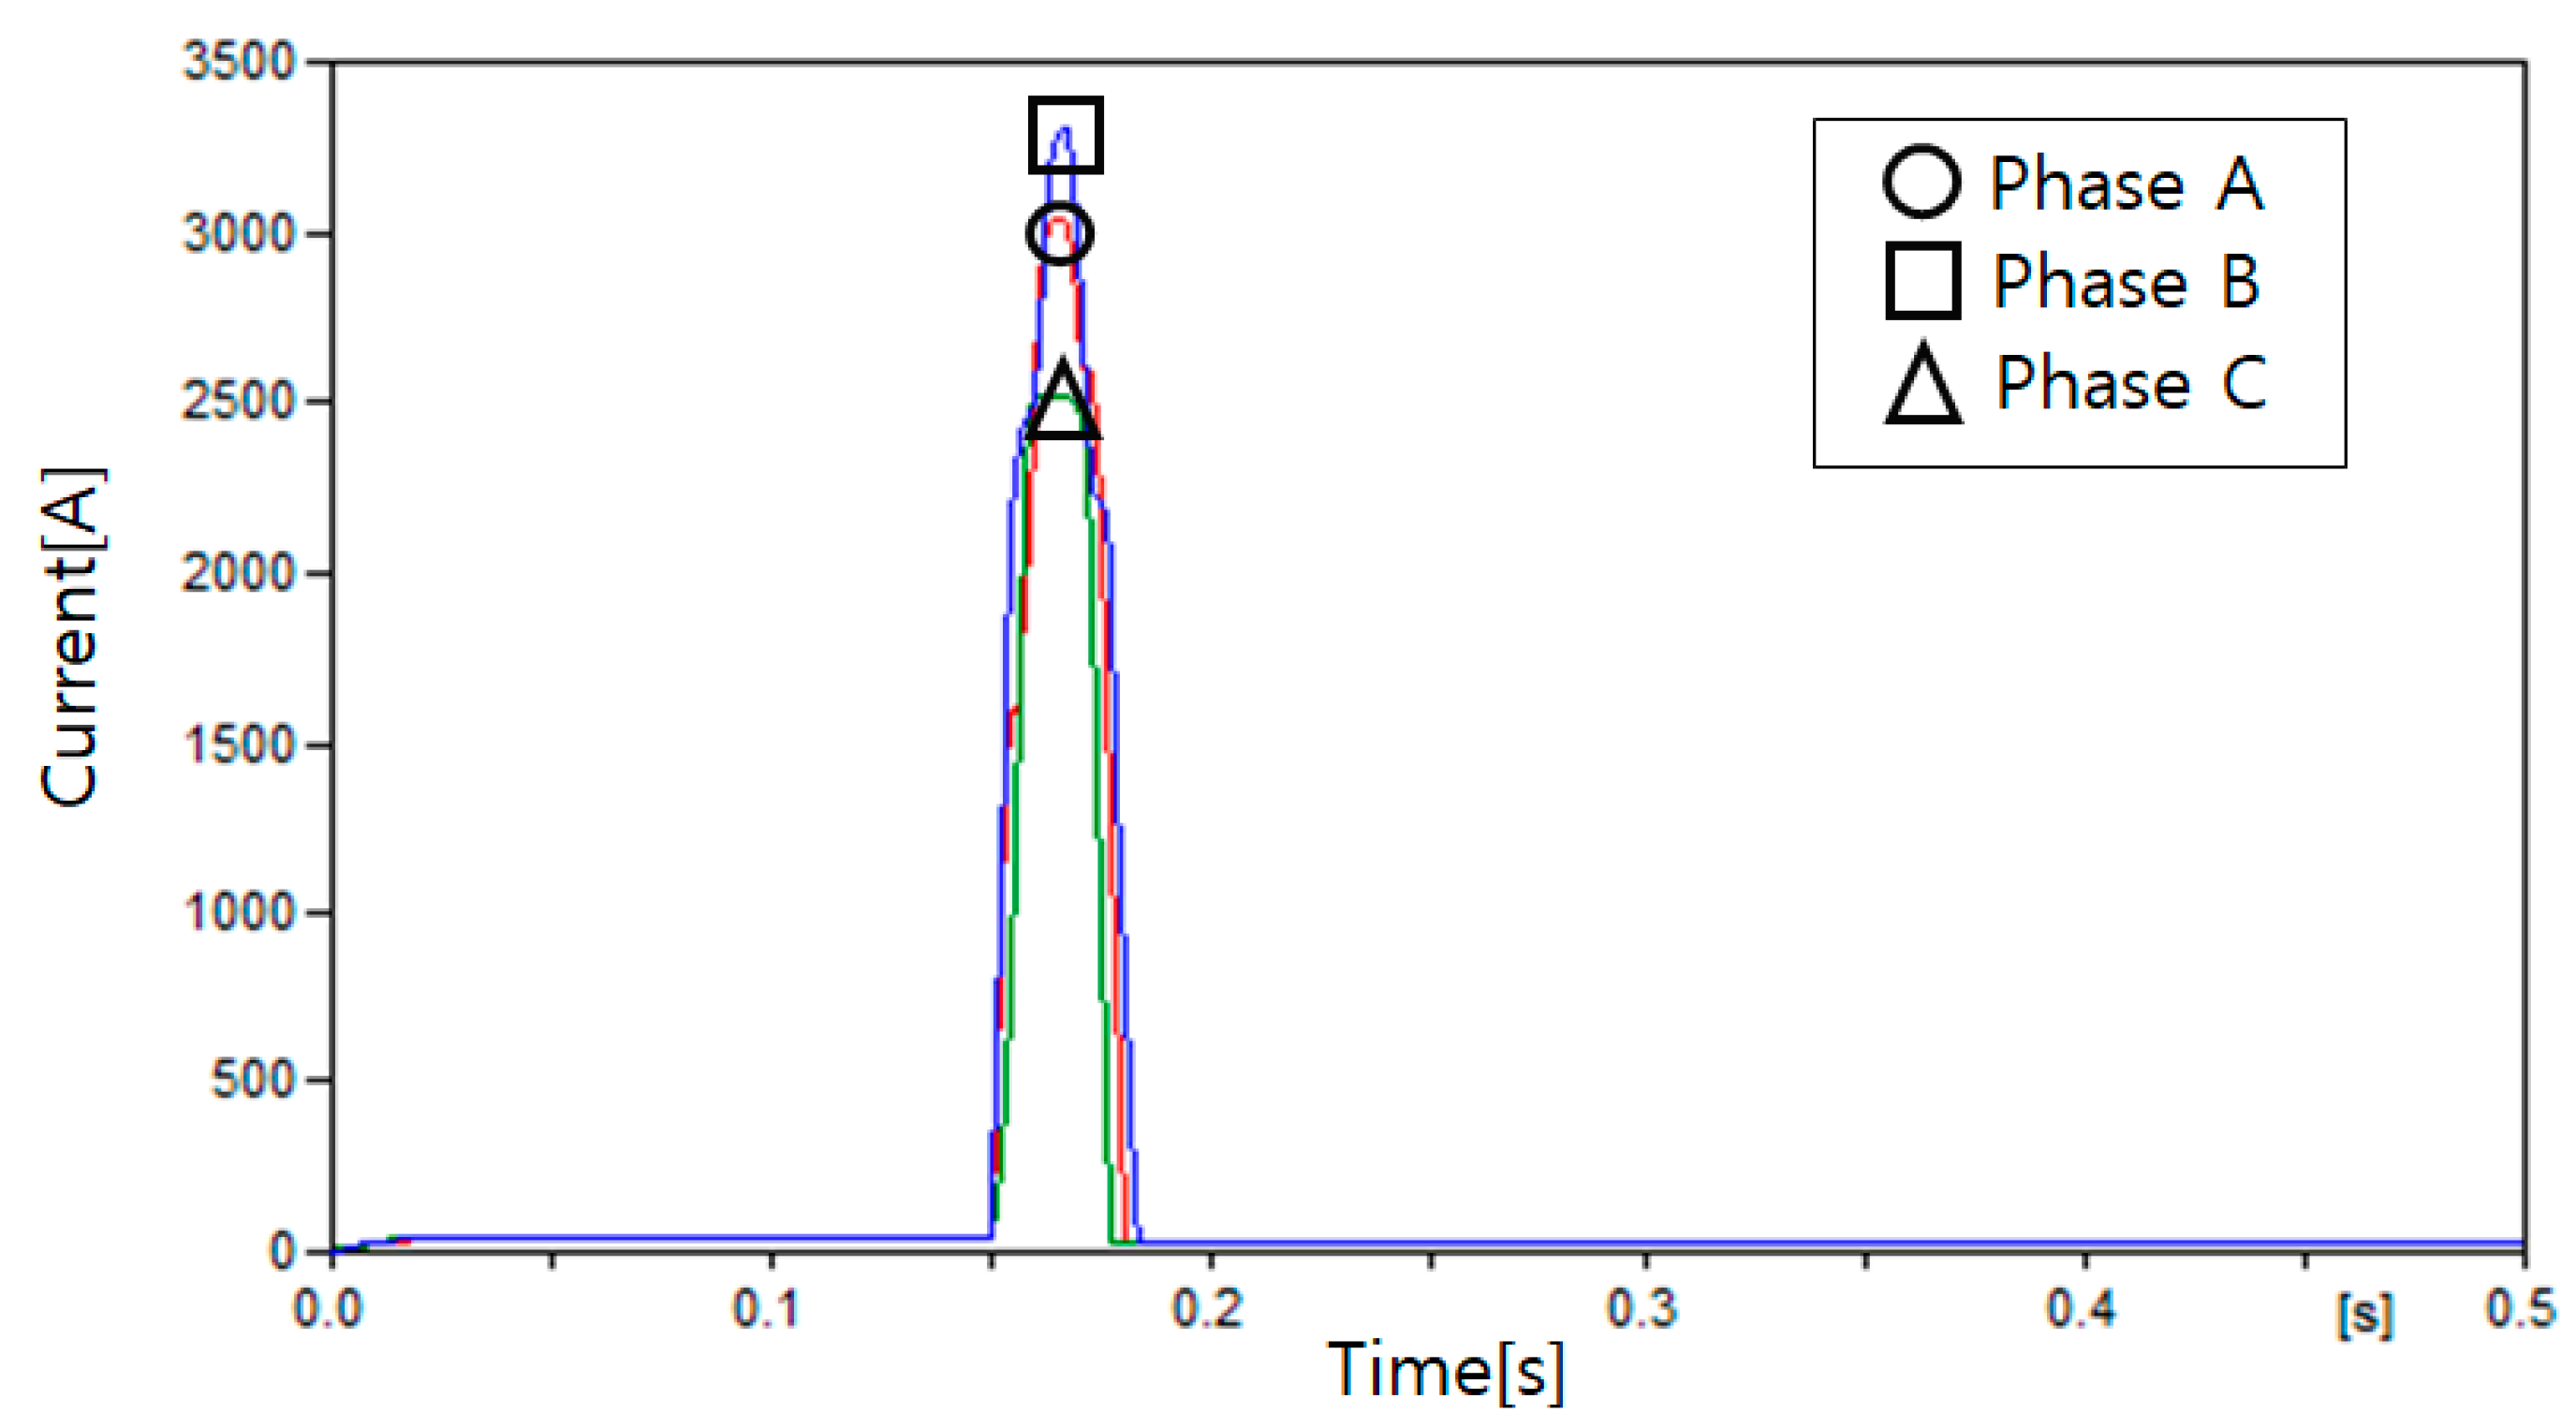
Figure 30.
Current measured at Load 6 in Case 8.


Table 1.
Simulation conditions.
| Case | Fault Location |
|---|---|
| Case 1 | 1 km point in Line 1 (1 km from Source 1) |
| Case 2 | 0.8 km in Line 2 (2.8 km from Source 1) |
| Case 3 | 1 km point in Line 3 (4 km from Source 1) |
| Case 4 | 1 km point in Line 4 (1 km from Source 2) |
| Case 5 | 0.2 km in Line 5 (2.2 km from Source 2) |
| Case 6 | 1 km point in Line 6 (4 km from Source 2) |
| Case 7 | Bus 2 (3 km from Source 1) |
| Case 8 | Bus 5 (3 km from Source 1) |
Publisher’s Note: MDPI stays neutral with regard to jurisdictional claims in published maps and institutional affiliations. |
© 2020 by the author. Licensee MDPI, Basel, Switzerland. This article is an open access article distributed under the terms and conditions of the Creative Commons Attribution (CC BY) license (http://creativecommons.org/licenses/by/4.0/).
Share and Cite
MDPI and ACS Style
Seo, H.-C. New Protection Scheme in Loop Distribution System with Distributed Generation. Energies 2020, 13, 5897. https://doi.org/10.3390/en13225897
AMA Style
Seo H-C. New Protection Scheme in Loop Distribution System with Distributed Generation. Energies. 2020; 13(22):5897. https://doi.org/10.3390/en13225897
Chicago/Turabian StyleSeo, Hun-Chul. 2020. "New Protection Scheme in Loop Distribution System with Distributed Generation" Energies 13, no. 22: 5897. https://doi.org/10.3390/en13225897
Note that from the first issue of 2016, this journal uses article numbers instead of page numbers. See further details here.