Article

Improved Hydrogen-Production-Based Power Management Control of a Wind Turbine Conversion System Coupled with Multistack Proton Exchange Membrane Electrolyzers †

by
Damien Guilbert
1,* and
Gianpaolo Vitale
2
1
Group of Research in Electrical Engineering of Nancy (GREEN), Université de Lorraine, GREEN, F-54000 Nancy, France
2
Institute for high performance computing and networking, (ICAR), Italian National Research Council of Italy, 90146 Palermo, Italy
*
Author to whom correspondence should be addressed.
This paper is an extended version of our paper published in 2019 IEEE International Conference on Environment and Electrical Engineering and 2019 IEEE Industrial and Commercial Power Systems Europe (EEEIC/I & CPS Europe), Genova, Italy, 10–14 June 2019, pp. 1–6.
Energies 2020, 13(5), 1239; https://doi.org/10.3390/en13051239
Submission received: 7 February 2020 / Revised: 29 February 2020 / Accepted: 6 March 2020 / Published: 7 March 2020

Abstract

:
This paper deals with two main issues regarding the specific energy consumption in an electrolyzer (i.e., the Faraday efficiency and the converter topology). The first aspect is addressed using a multistack configuration of proton exchange membrane (PEM) electrolyzers supplied by a wind turbine conversion system (WTCS). This approach is based on the modeling of the wind turbine and the electrolyzers. The WTCS and the electrolyzers are interfaced through a stacked interleaved DC–DC buck converter (SIBC), due to its benefits for this application in terms of the output current ripple and reliability. This converter is controlled so that it can offer dynamic behavior that is faster than the wind turbine, avoiding overvoltage during transients, which could damage the PEM electrolyzers. The SIBC is designed to be connected in array configuration (i.e., parallel architecture), so that each converter operates at its maximum efficiency. To assess the performance of the power management strategy, experimental tests were carried out. The reported results demonstrate the correct behavior of the system during transient operation.

Graphical Abstract

1. Introduction

Hydrogen is considered one of the most attractive sustainable energy carriers available to cope with global warming and depletion of fossil fuels, thanks to its ability to store and deliver usable energy [1]. It has to considered that the gas storage volume is almost 1000 times larger than the electricity storage volume in analyzed countries [2], and that the annual demand for hydrogen is expected to increase ten-fold by 2050—from 8 exajoule (EJ) in 2015 to almost 80 EJ in 2050 [3]. Hydrogen is crucial in power-to-X applications, such as electricity conversion, energy storage, and reconversion pathways that exploit surplus electric power, mainly during periods where fluctuating renewable energy generation exceeds load [4,5,6,7,8].
Hydrogen can be produced from various processes, such as natural gas reforming, coal and biomass gasification, or water electrolysis. Water electrolysis is considered the most attractive and promising solution when renewable energy sources (RES) are used to generate electricity to supply an electrolyzer (EL). The operation of ELs is based on the water electrolysis principle, where de-ionized water is split into hydrogen and oxygen by using electricity from RES [9].
Different EL technologies can be differentiated based on their electrolyte and charge carriers, such as alkaline ELs, proton exchange membrane (PEM) ELs (PEM-ELs), and solid oxide (SO) ELs (SO-ELs) [9]. Alkaline and PEM technologies are currently commercially available on the market, unlike SO technology, which is still in the research and development phase. On one hand, alkaline ELs are currently the most mature and widespread technology, while PEM technology is still under development. On the other hand, PEM technology exhibits several advantages over alkaline technology, such as high current densities, good compromise in terms of power-to-weight ratio, faster response to dynamic operations, wider current range, and high flexibility in operation [10]. Therefore, this technology is particularly fit for insertion into grids, including renewable energy generation systems. This is the reason why a PEM-EL was considered to carry out this work.
The integration of RES into hydrogen production systems results in new design constraints on ELs. These are mainly related to electronic power systems used to supply and control the hydrogen production systems, the performance of ELs, and the electrical requirements involved in the integration. The aim is the improvement of the energy efficiency of the complete system [11]. In this scenario, both the efficiency of the power conversion system and the EL must be investigated, including the effects of generated harmonics, which lead to additional heat losses in the water electrolysis process [12]. In the past, hydrogen production has been based on large current rectifiers [13], of which two main categories can be recognized: thyristor-based rectifiers with hybrid filters (TRHF) and diode rectifiers with multiphase IGBT-based choppers (CRPF). The large rectifier approach exploits the power available from the grid to supply a high-current EL [14,15]. Nowadays, the spreading of distributed power generation together with the availability of low-power PEM-EL, along with new converter topologies, have partially modified this approach. Indeed, the power available from RES can be lower or higher than the rated power of an EL, requiring the management of loads [16,17] or hybrid combinations of two or more renewable power generation systems in stand-alone or grid-connected configuration, with the storage being based on a hydrogen carrier [18]. For instance, the need for suitable modeling and a management system is assessed in [19], whereas in [20] the issues related to the intermittency of wind generation are investigated. On the other hand, it is possible to obtain high conversion efficiency with the use of an array of converters and PEM-ELs [21]. In a survey focused on multistack and modular fuel cells [22], an array configuration (i.e., parallel architecture, in which each fuel cell is connected to the DC bus through a power converter) presents several advantages, such as having better reliability (i.e., in the case of a faulty converter) and flexibility from a control point of view. In this work, each power converter can be controlled according to the available power from the wind turbine conversion system (WTCS). As a result, the energy efficiency of the system can be enhanced, since the Faraday efficiency improves by increasing the current density [23,24].
Since the DC–DC converters are important components for PEM-ELs, a stacked interleaved DC–DC buck converter (SIBC) has been chosen to carry out this work. Based on previous work [25], it offers better reliability and power density. Additionally, the output current ripple can be canceled regardless of the operation of the converter due to the use of an additional capacitor (located between the two main phases), while the control of the two power switches is performed in the opposite way. The minimization or cancellation of the output current ripple is one of the main features expected to optimize the efficiency of the PEM-EL [26]. Even if the literature for PEM-ELs [12,26,27,28] does not show papers in which the reduction of the hydrogen production is evaluated, all ELs exhibit an impedance-versus-frequency curve that diminishes by increasing the frequency. This means that voltage harmonics superimposed onto the DC component result in a low current, which in turn causes poor hydrogen production due to the degradation of the Faraday efficiency. For this reason, it would be preferable to supply an EL with a pure DC source; unfortunately, this is often unfeasible due to the need for power conversion. The amount of power loss into the harmonics depends on the impedance curve, the measurement methods for which are stated in [29].
This article proposes an array architecture based on a SIBC in parallel configuration, allowing the operation of several converters, depending on the available power. This number is chosen so that each converter always operates at its maximum efficiency. The parallel architecture is particularly suitable when exploiting RES, where the available power is subjected to variations over time. The design of SIBC takes into account the dynamic model of the PEM-EL and the model of the wind generator. This converter is fit to face the high voltage of the RES, with a reduced voltage ripple supplying the EL. The remaining power surplus can be used for energy storage devices (e.g., batteries).
This article is divided into seven sections. After this introduction, which provides the current state-of-the-art and reasons for carrying out this work, Section 2 introduces the system under study and highlights the main feature required for the DC–DC converter. Then, in Section 3, the specifications, modeling, and characterization of the studied wind turbine are given. In Section 4, the studied PEM-EL is presented, along with its model. In Section 5, details are provided regarding the SIBC and the system specifications. In Section 6, the developed power management strategy is introduced. Finally, in Section 7, the experimental test bench is presented and experimental results are provided to validate the performance of the developed power management strategy.

2. Wind Turbine Conversion System Coupled with Multistack PEM Electrolyzers

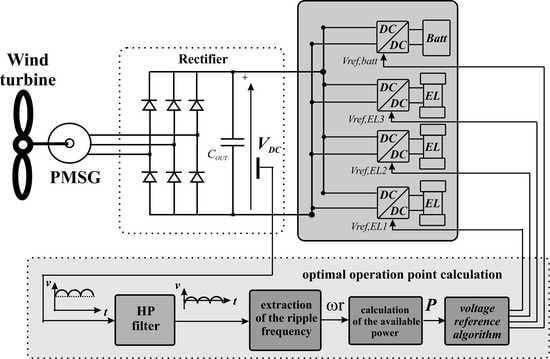
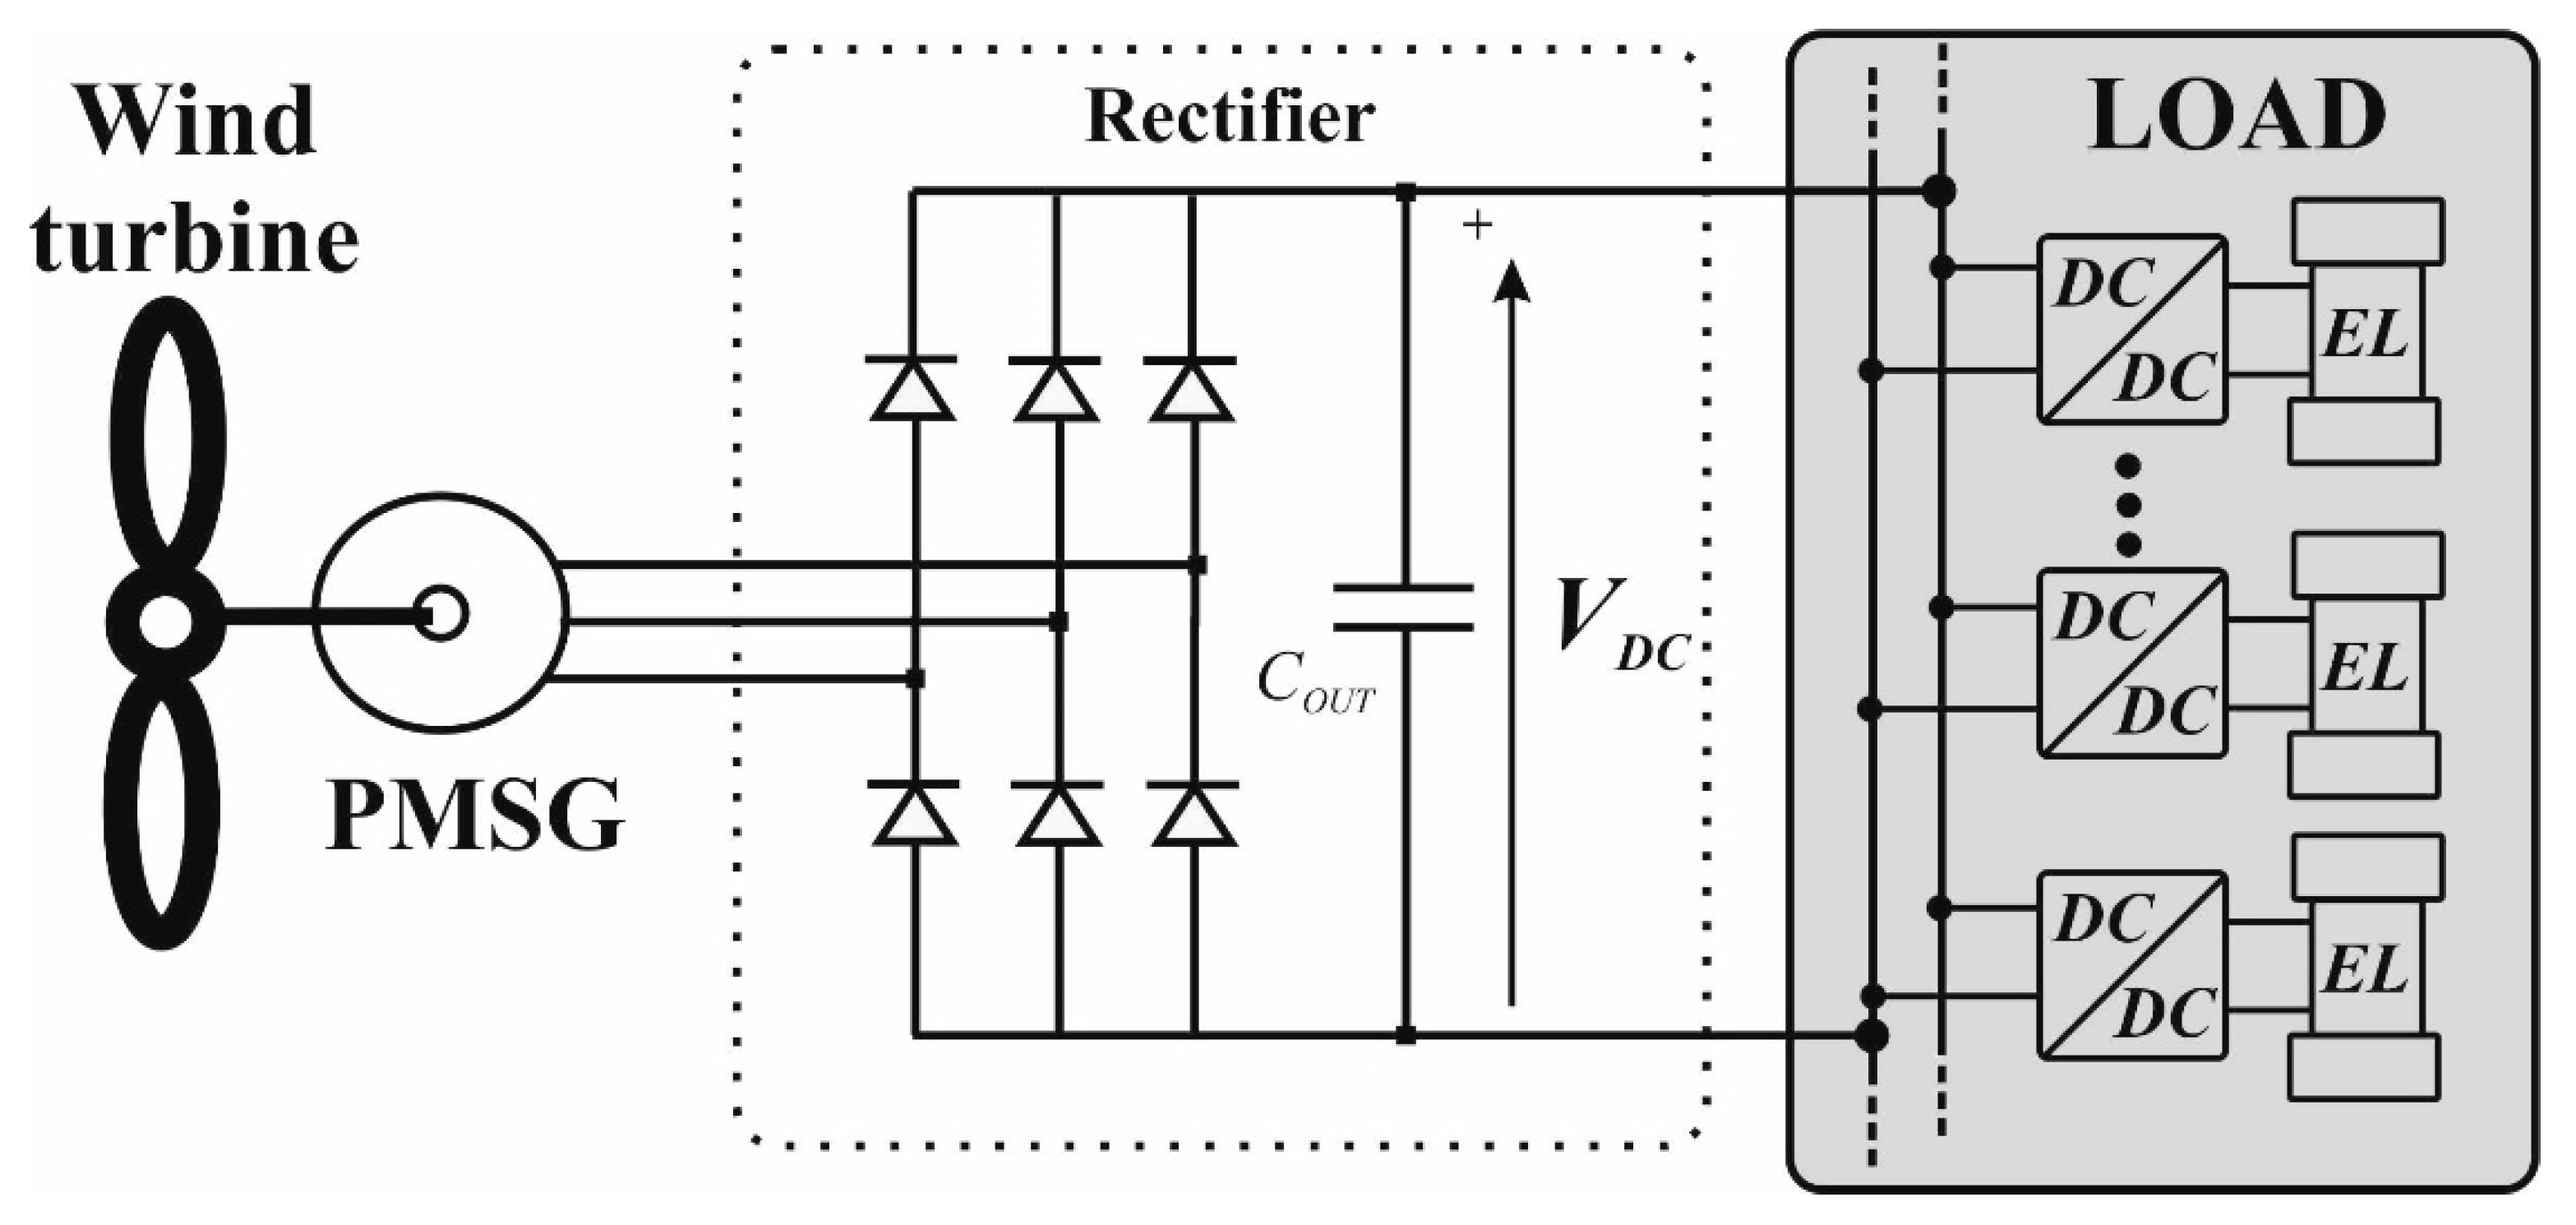
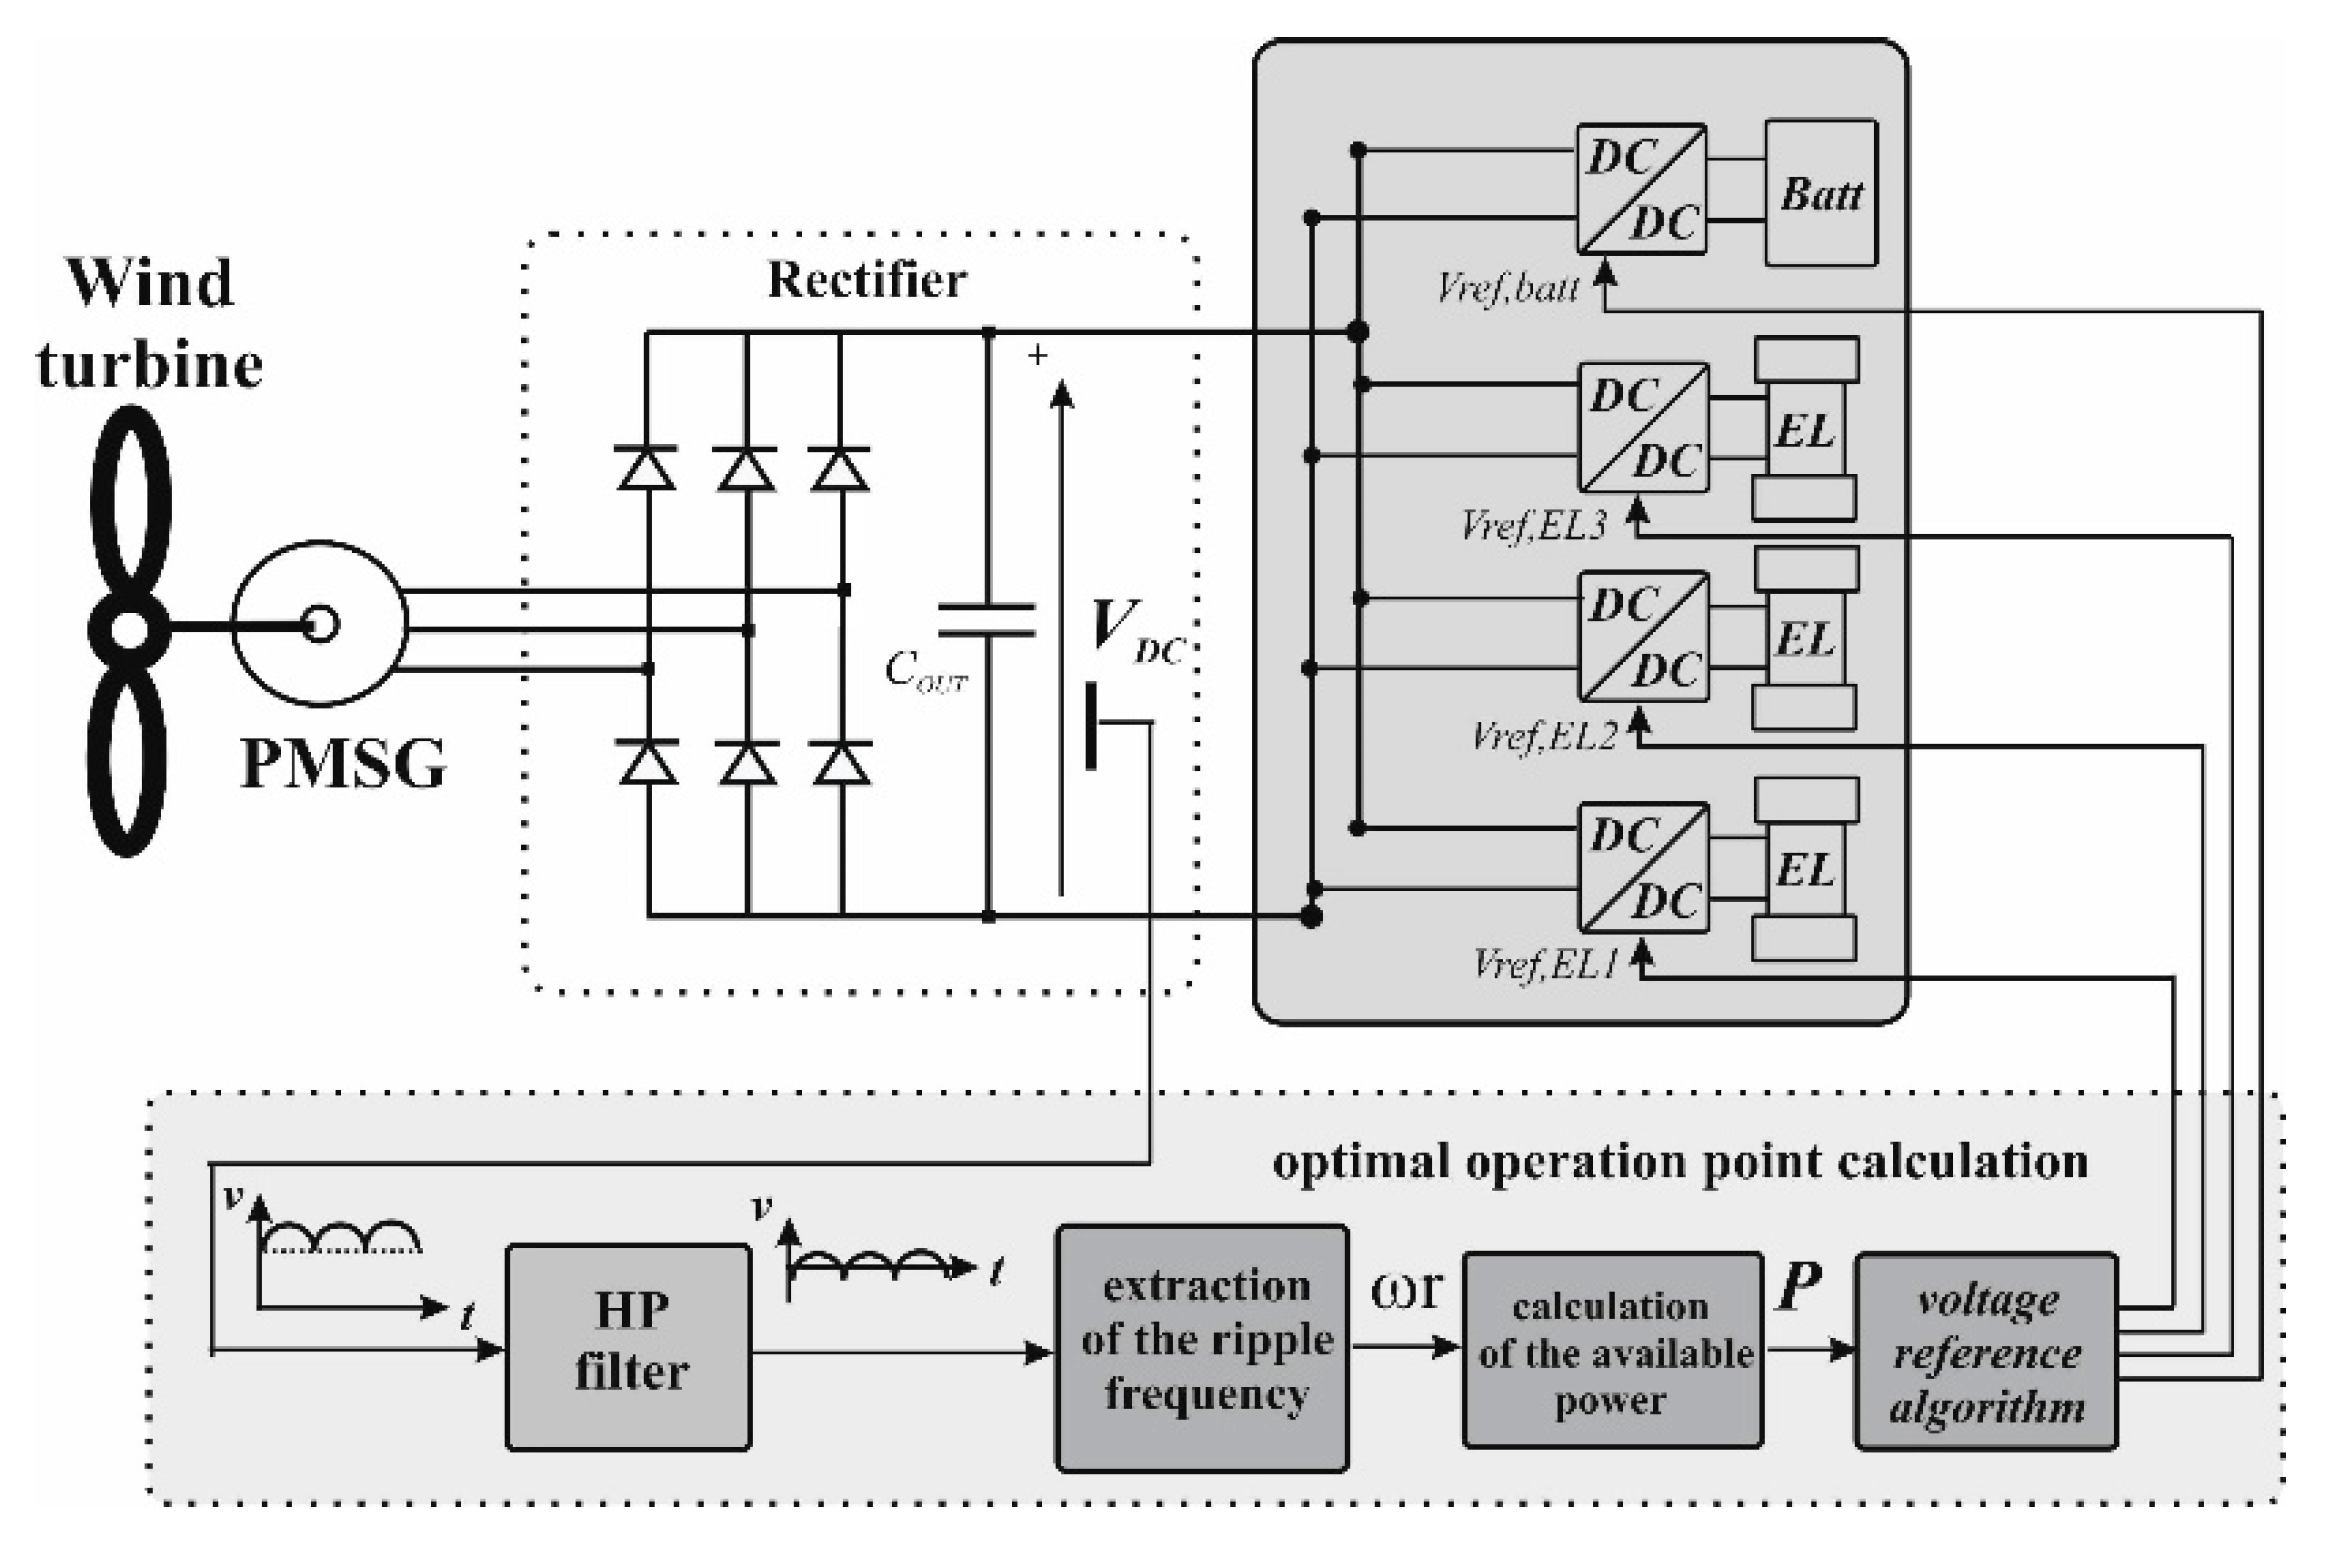
The investigated hydrogen production system is shown in Figure 1 and the technical data of the wind turbine are summarized in Table 1. The wind turbine is set up on the campus of the University of Technology in Longwy, France, a department of the University of Lorraine [30]. The hydrogen production system is composed of a 5-kW wind turbine conversion system (WTCS), based on a permanent magnet synchronous generator (PMSG), a three-phase diode rectifier, and DC–DC converters connected to multistack PEM-ELs (every PEM-EL has a rated power of 400 W). The studied configuration is in the form of an array (parallel architecture, where each DC–DC converter is connected to a single PEM-EL), resulting in better reliability and flexibility from a control point of view. Based on Figure 1, since the system is composed of three PEM-ELs, the total power of the multistack system is equal to 1200 W. As a result, each DC–DC converter can be controlled separately to transfer the energy from the WTCS to the different PEM-ELs. This enables the available electrical power to be managed between the different PEM-ELs through the DC–DC converters to optimize the hydrogen production. The AC voltage output of the PMSG strongly depends on the wind speed, and consequently its amplitude and frequency change according to the operating conditions (i.e., the wind speed). The three-phase diode rectifier is mandatory in order to convert the AC voltage from the PMSG into a DC voltage; unfortunately, a superimposed residual voltage ripple is generated by the rectifier. Generally, the DC bus voltage from a rectifier is quite high (as shown in Figure 2), and the voltage changes according to the wind speed. Since the DC output voltage from the rectifier is higher than the rated stack voltage of a single PEM-EL (i.e., around 8 V), the most important feature required for the DC–DC converter is a high voltage reduction ratio [30].

3. Characterization of the Wind Turbine

The wind turbine is the electric power generator, which is connected to a PMSG, the output of which supplies a three-phase uncontrolled rectifier. In this section, the model of the wind turbine is retrieved based on both manufacturer data and experimental measurements to obtain an estimation of the maximum available power based on the wind speed [30].

3.1. Turbine Modeling

The mechanical power extracted from the wind by the wind turbine is expressed as follows [4]:
P w = 1 2 ρ π R 2 V w 3 C p ( λ , β )
where Pw is the output mechanical power of the wind turbine, ρ is the air density (kg/m3), R is the radius of the blade (m), VW is the wind speed (m/s), and Cp is the power coefficient, which is the ratio of the actual electric power produced by a wind turbine divided by the total wind power flowing into the turbine blades at a specific wind speed; this is a measure of wind turbine efficiency and depends mainly on the geometrical configuration [30].
A wind turbine is characterized by a set of curves in the diagram torque according to the rotational speed, with the wind speed acting as a parameter. For each wind speed value, an optimal operating point at which the wind turbine generates the maximum power can be computed. Hence, the maximum available power is obtained by the rotational speed of the turbine [9,30].
P m a x = = 1 2 ρ π R 2 ( ω r R λ o p t ) 3 C p _ o p t

3.2. Experimental Characterization

The wind turbine under study was experimentally modeled. The wind turbine power according to the wind speed is provided in Figure 3. The experimental data were sampled and interpolated to obtain an analytic curve model [30].
It can be noted that the available power shows a wide variation depending on the wind speed. Since the adopted EL (described in Section 4) has a lower rated power than the power provided by the turbine, it cannot exploit the generator’s optimal value. For this reason, an array with an additional load made by an auxiliary traditional battery is devised. Knowledge of the available power is required to manage the system. In this article, this is obtained using a sensorless estimation algorithm (provided in Section 6) [30].
The wind speed is also linked with the turbine speed; this relationship is shown in Figure 4. By using these data, the curve replicating the optimal power provided by the wind turbine on the basis of its speed is obtained, which is shown in Figure 3. This allows the available optimal power based on the turbine speed to be assessed, which in turn is extracted by the voltage ripple pulsation superimposed onto the DC voltage at the output of the rectifier. Based on the curve reproducing the turbine power versus wind speed and the wind speed versus the turbine speed, a relationship between the turbine speed and the turbine power can be determined [30].

4. Characterization of the Electrolyzer

4.1. Static Characterization

The investigated EL is a NMH2 1000 PEM-EL from Heliocentris, the features of which are given in Table 2. The produced hydrogen is stored in three metal hydride storage tanks made by Heliocentris, which are based on metal hydride alloys. The model of the PEM-EL was experimentally validated to obtain the curve, giving the PEM-EL stack voltage according to the available power, as shown in Figure 5. This curve is used to estimate the voltage reference of the SIBC on the basis of the available power from the wind turbine. It is interpolated using a second-order polynomial equation [30]:
V r e f = 0.0005 P 2 + 0.0951 P + 3.9486

4.2. Dynamic Characterization

The dynamic model of the PEM-EL was first introduced in previous work [31]. It takes into consideration the dynamic reactions at both the anode and the cathode (i.e., activation overvoltage) using an equivalent circuit. This model enables accurate replication of the PEM-EL stack voltage shape when a sudden change of the supply current occurs. The equivalent circuit of the PEM-EL is shown in Figure 6 and the values of the parameters are given in Table 3. The method used to determine the parameters, which involves both static and dynamic identification, is reported in [31]. In Figure 6, the electromotive force Vint represents the reversible voltage, the two resistive-capacitive (RC) branches model the dynamics at both the anode and the cathode (representing the activation overvoltage), and finally the resistor Rint models the ohmic overvoltage [30]. Generally, the ohmic overvoltage takes into consideration the membrane resistance (due to the movement of protons through the membrane), as well as the resistance of interconnects, end-plates, and contacts (due to the movement of electrons through the electrodes and cell components). However, as highlighted in [32], the main ohmic overvoltage is caused by the membrane. Since these parameters are retrieved by external measurements, in principle the end-plates and contact resistances are enclosed in the ohmic overvoltage; however, in the case under study, it has been verified that they do not affect ohmic overvoltage. For this reason, interconnects, end-plates, and contact resistances were neglected in the proposed model in [31] (shown in Figure 6).

5. Converter Modeling and Characterization

The DC–DC converter, which interfaces with the output of the three-phase diode rectifier (DC bus) and the PEM-EL load, has several requirements: (a) a good efficiency value, (b) a lower ripple in the output current, (c) fast dynamic performance, and (d) fault robustness. The first requirement is needed to maintain a low pay-back time and to assess the advantage of the storage; it has to be noted that in this application, this must be achieved with a strong reduction of the rectified voltage available, using the turbine to supply the EL. As far as the ripple is concerned, it is known that harmonics superimposed onto the DC current worsen the specific energy consumption of the EL, as well as its reliability [12,26,27,28]. It is preferable to adopt a power converter with an inherently low harmonic content, since the passive or active filters used to suppress it are bulky [12,30]. The dynamic performance has to fit the power variation meaning that the dynamic behavior of the converter must be faster than the dynamic of the generator to preserve the DC bus capacitor by additional voltage stress. Finally, the fault robustness enhances the overall reliability. These requirements can be satisfied with the use of a SIBC. Unlike a classic interleaved DC–DC buck topology, in a SIBC, the two phases present a current ripple that is equal in amplitude but with opposing phase and the current ripple is canceled regardless of the duty cycle. A detailed description of this converter is given in [
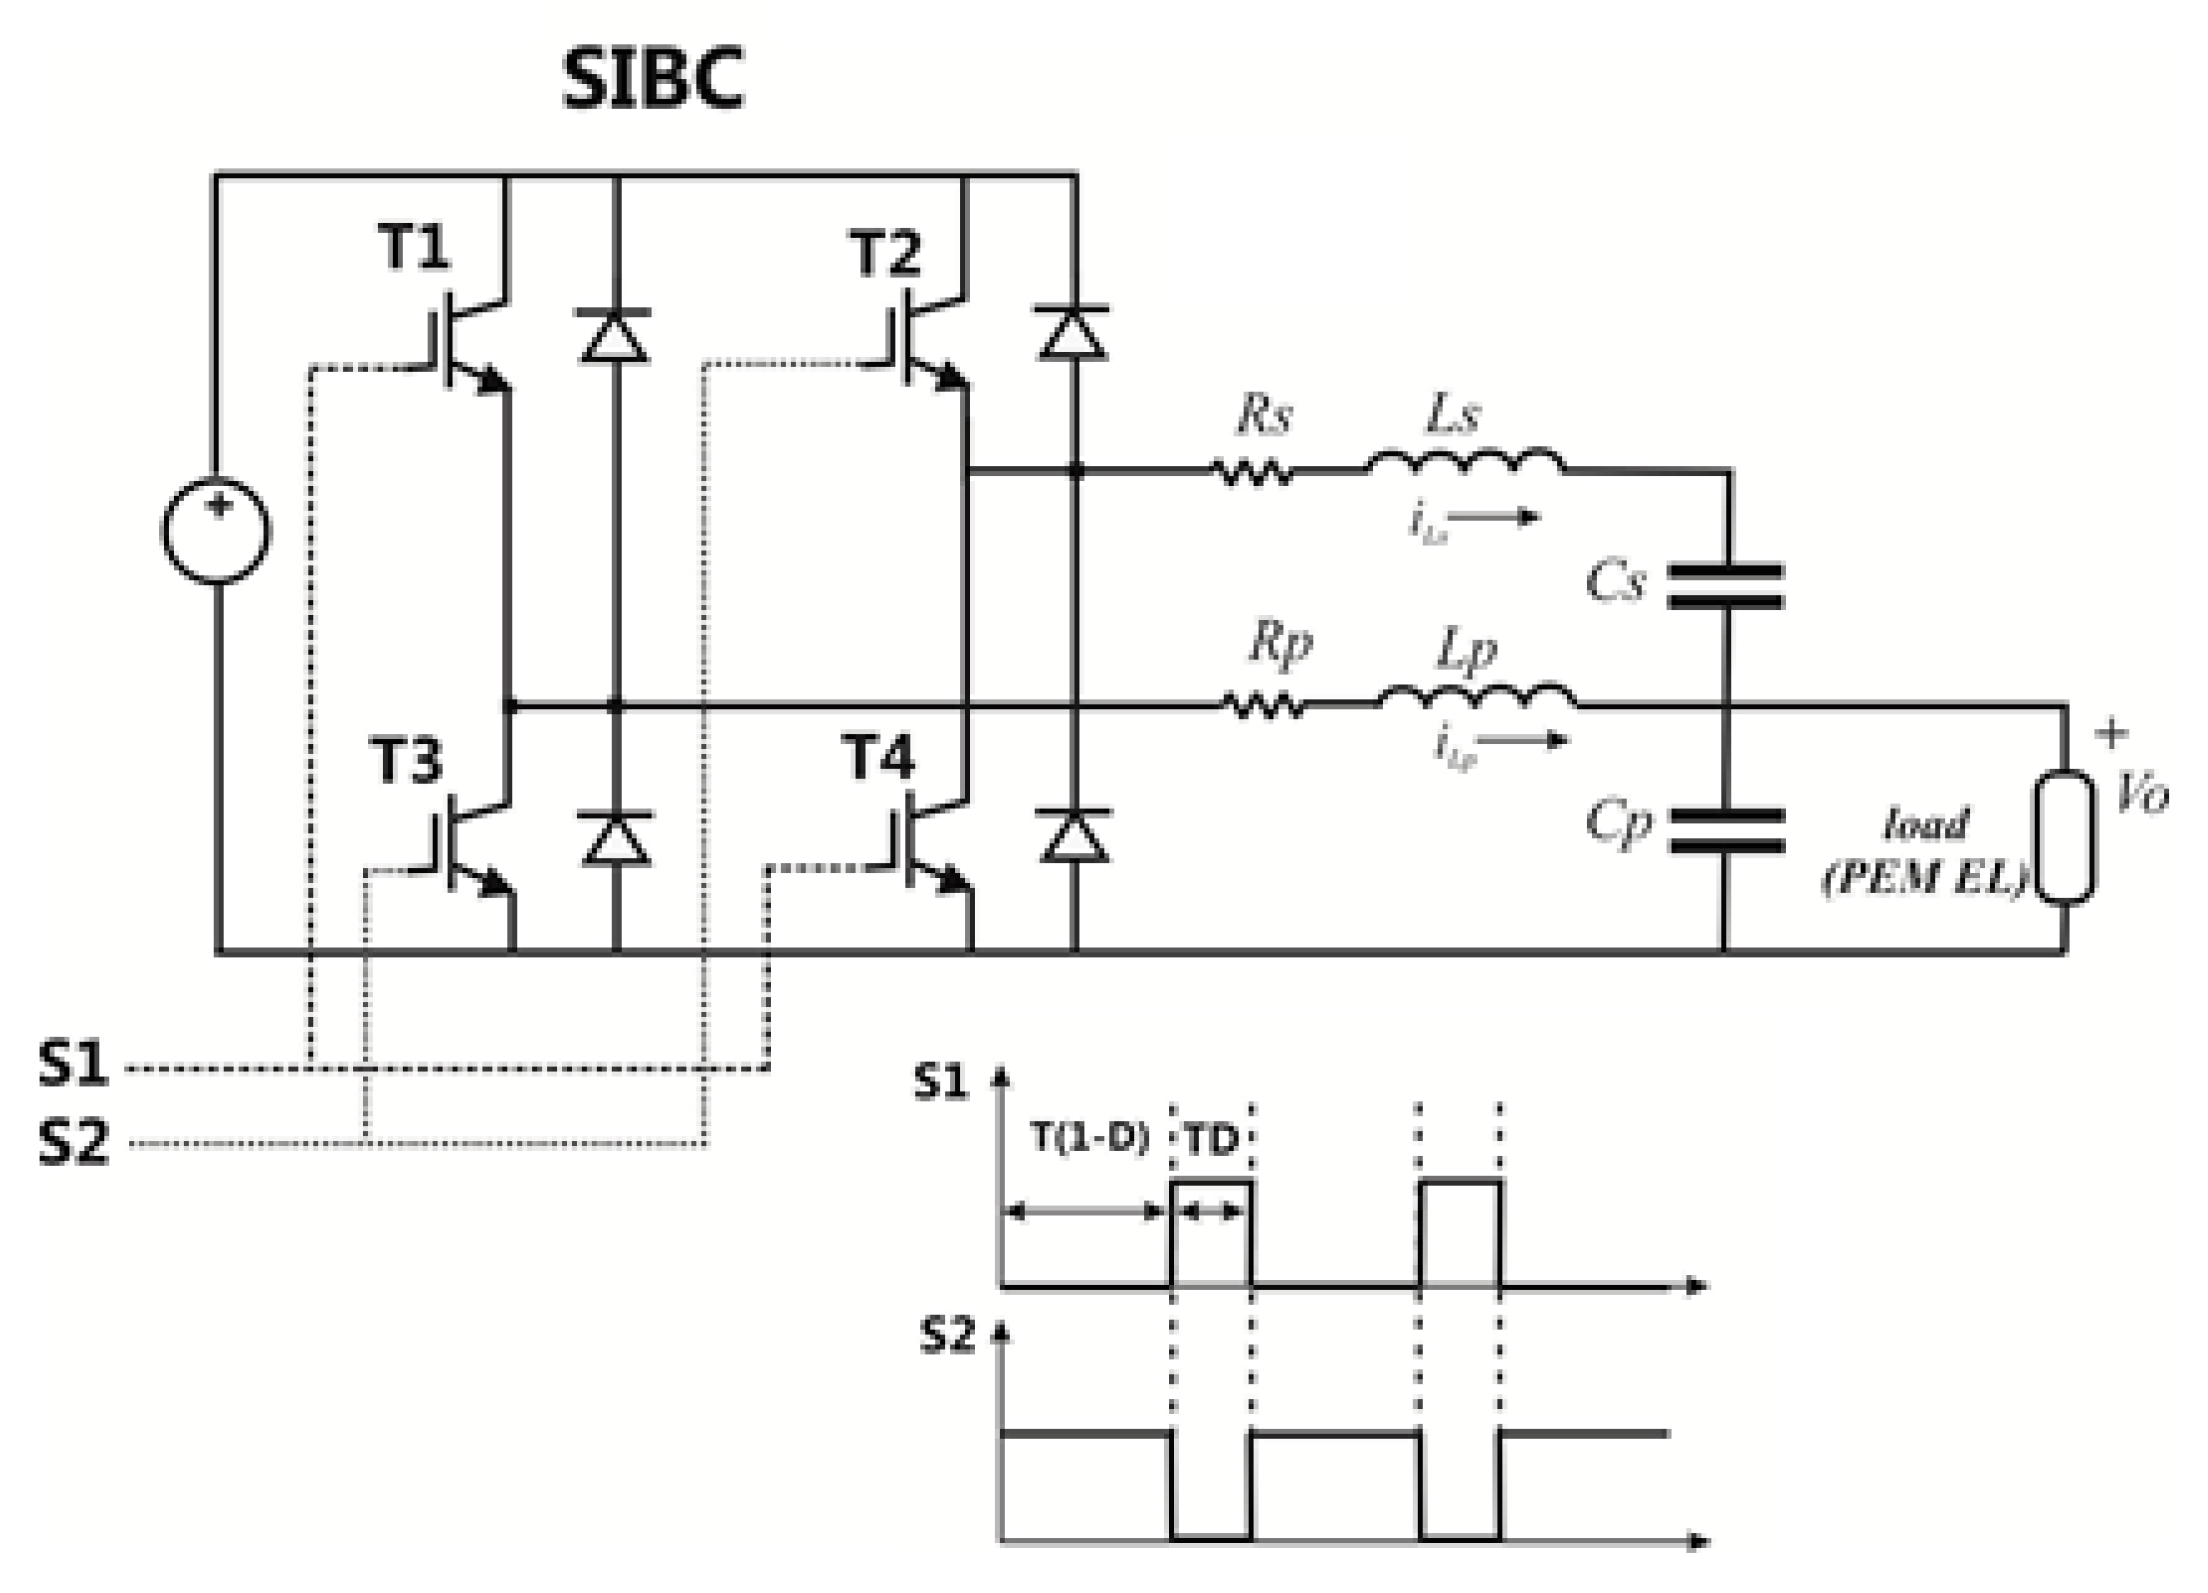
25]. The circuit of the proposed SIBC is shown in Figure 7 [30]. Where T1 and T3 are the power switches of the first leg, T2 and T4 are the power switches of the second leg, the other symbols are defined in Table 6.
The equivalent circuit model of the PEM-EL adopted in this work is represented in Figure 8 (symbols correspond to Figure 6) It takes into consideration the reversible voltage Vi, the resistance of the membrane Ri, and the RC branch modeling of the cathode reaction. The anode reaction was neglected as its reaction is slower than the cathode reaction and does not affect the dynamic behavior of the converter [30].
It has to be emphasized that accurate knowledge of the PEM-EL model is crucial in order to define the dynamic performance of the system. Indeed, static models do not accurately represent the behavior of the EL, since the dynamic issues are neglected. A comparison of the voltage measured at the terminal of the PEM-EL and the voltages obtained by the static and dynamic models when a step current is supplied is shown in Figure 9 [30]. It can be noted that different shapes are obtained as a result of the step current in particular. Additionally, it has been demonstrated that the step response of the converter with a static or dynamic load is very different in terms of both the steady-state value and dynamic behavior [25,30]. In summary, with the static model, the step response shows an underdamped oscillatory response, whereas for the dynamic model the step response is overdamped, corresponding to a dominant negative pole. The open loop poles of the system composed of the SIBC converter and the EL are provided in Table 4.

6. Power Management Strategy

As highlighted in the previous sections, the available power of the wind turbine exceeds the rated power of the EL. For this reason, an array of ELs connected to a dedicated SIBC converter was designed. In this way, each converter can supply the EL so that it can always operate at rated power, optimizing the hydrogen production. As a result of the estimation of the available power by the wind turbine, it is divided by the number of ELs; the integer part of the results corresponds to the ELs that are to be activated. If the number of available ELs is not sufficient to absorb the power from the wind turbine, the remaining power would be used to charge an auxiliary battery system. In this case, all of the available energy is transferred to the different PEM-ELs and the additional energy storage device.

6.1. Turbine Power Estimation

The estimation of the available power from the wind turbine is performed based on the wind turbine rotational speed, which is calculated using the residual voltage ripple in the DC bus. Indeed, the voltage measured at the output of the three-phase diode rectifier is composed of a DC component with a superimposed ripple, the frequency of which depends on the wind turbine rotational speed. This voltage is processed by a high-pass (HP) filter to eliminate the DC components, and then the frequency is estimated by a zero-crossing-based frequency demodulator to obtain the rotational speed of the turbine, ωr [30]. The frequency demodulator is based on a comparator, the output of which is connected to a monostable circuit. When the input signal becomes positive, the monostable circuit generates a single pulse with a duration of Tm. Both the output and the negated signal are then processed by a low-pass filter (LP), and the difference produces a signal based on the ripple frequency. The output signal is proportional to the difference between the input frequency and a central frequency, which is defined by the length of the pulse generated by the monostable circuit [30]:
ω r = C [ f i ( t ) f c ]
where C is a constant, fi is the input frequency, and fc is the central frequency of the demodulator, defined by fc=1/(2Tm). The block diagram of the demodulator is shown in Figure 10. The input of the frequency demodulator is the signal coming from the voltage sensor connected at the output of the three-phase rectifier after is has been processed by a high-pass filter to eliminate the DC component.
The curve of Figure 3 is implemented as a look-up table to calculate the available power from the wind turbine.

6.2. Power Sharing Strategy

During normal operation, the assessed available power from the wind turbine is compared with the rated power of the EL, which is equal to 400 W. If the power is greater than 400 W, the EL operates at its rated power and the remaining power is used for the next EL. This continues until a power lower than 400 W remains. By using Equation (3), the voltage reference of the last SIBC is obtained. In this case there are no ELs available, and as a result the additional battery system is used to store the remaining energy. To interface the battery system and the DC bus, a stacked interleaved buck–boost converter (SIBBC) can be used. The principle of the control strategy of the SIBC is shown in Figure 11. The power-sharing strategy according to the available power from the wind turbine is summarized in Table 5 and the flow chart of the energy-sharing algorithm is shown in Figure 12.

7. Experimental Validation of the Power Management Strategy

7.1. Test Rig Description

To assess the performance of the development power management strategy of the SIBC converter, an experimental test rig was constructed in the laboratory, as shown in Figure 13. The experimental test rig was composed of the following components: (1) an autotransformer (input), (2) dSPACE ControlDesk software, (3) a pure water tank from SGWATER (Berlin, Germany), (4) a dSPACE DS1104 board from dSPACE (Bièvres, France), (5) an interface board, (6) an IGBT module stack from Semikron (Nuremberg, Germany) with a three-phase diode rectifier and SIBC, (7) inductive components (i.e., Lp, Ls), (8) capacitive components (i.e., Cp, Cs), (9) a PEM-EL (output) from Heliocentris (Berlin, Germany), (10) an E3N current probe from Chauvin Arnoux (Kehl, Germany), (11) an MTX 1032-B voltage probe from Metrix (Dubuque, IA, USA), and (12) a 4-channel digital oscilloscope from Keysight (Santa Rosa, CA, USA) [30]. The power management strategy for the SIBC was developed in Matlab and Simulink environments, and then implemented into a dSPACE DS1104 board. The control of the SIBC converter was based on the DC bus voltage measurement (i.e., Vdc) at the output of the rectifier and was acquired using a voltage differential probe. The pulse-width-modulation (PWM) gate control signals used to control the SIBC were generated by the dSPACE DS1104 board.
However, the voltage levels of the generated PWM signals from the dSPACE board (0–5 V) were not fit to drive the Semikron SKHI 22 driver boards, which require 0–15 V. As a result, an interface board was used between the dSPACE board and the driver boards to convert the control signals from 0–5 V to 0–15 V. In the next subsection, experimental results are presented and discussed. The system specifications are summarized in Table 6 [30].

7.2. Experimental Results

The aim was for the experimental results to show both the voltage and current measured at the EL terminals in different operating conditions. In particular, the test in the steady-state condition showed the operation of the SIBC supplying the EL at rated power, whereas the test in transient conditions demonstrated the ability of the converter to vary the power delivered to the EL based on the power delivered by the turbine.
Figure 14 shows the voltage and current at the terminals of the EL with rated power. This occurs when the available power from the turbine exceeds the rated power of the EL; as explained before, the first EL was supplied with a power equal to 400 W, which represents the worst case for the SIBC converter. Despite this, both the voltage and current remain constant, and no appreciable ripple is noticeable, as can be noted in Figure 15, which shows the same waveforms with AC coupling. It can also be noted that the voltage ripple measures about 4 mV from peak to peak. This is a satisfactory performance, since it maximizes the hydrogen production, improving the reliability of the EL [26,27,28].
Figure 16 and Figure 17 show the voltage and current in transient conditions. This occurs when the power available from the turbine varies; as a result, the control algorithm adjusts the voltage reference of the SIBC converter to track the power.
In particular, Figure 16 shows a dynamic test performed when the available power varied from 50 to 160 W. This corresponds to a voltage reference level ranging from 5.2 to 6.5 V. It can be noted that the SIBC converter varies the supplied power in about 20 ms and the current rises from 8 to 23 A. The power measured at the terminals of the EL is lower due to the losses in the conversion chain.
Despite the abrupt power transient, the voltage does not exhibit any overdamping. This is another important result achieved by the control system of the converter; it preserves the EL since it avoids that a power step variation up to the rated power could produce a voltage higher than the rated voltage of the EL.
Finally, Figure 17 shows a dynamic test performed when the available power decreased from 130 to 25 W. Additionally, in this case, the transient both of voltage and current was very fast, confirming the dynamic performance of the converter.

7.3. Discussion

The approach proposed in this paper consists of a distributed hydrogen production system, including multistack PEM-ELs. It aims to maximize the produced hydrogen by utilizing the operation of the ELs at rated power to achieve the best Faraday efficiency and to deliver a voltage with a reduced ripple. This approach is particularly advantageous when a RES is used as a power source, since the improvement of the conversion efficiency reduces the pay-back time, making the plant more efficient. The use of a RES to produce hydrogen minimizes the CO2 production; however, on the other hand, it imposes additional constraints for the designer. Differing from the supply from the grid, both the available power and the voltage vary during the operation, the rated power of the source usually overcomes the rated power of the EL, and the voltage depends on the source, often resulting in a significantly higher voltage than the voltage required by the EL. This is because a high source voltage lowers the delivered current and minimizes joule loss, which increases with the square of the current. Finally, tracking of the maximum power point (MPP) is required; this can be done using load management.
Both the efficiency of the converter and the EL are crucial in the conversion chain. In the case under study, the SIBC shows higher efficiency compared to a traditional buck converter, since the output voltage ripple is canceled by the auxiliary compensating leg. In a traditional buck converter, the output ripple could be lowered by either increasing the output capacitance or by using a high switching frequency. However, these approaches have some drawbacks. Indeed, the output capacitance is a short-circuit for harmonics that are dissipated into its internal resistance. Even if this is usually a small amount of power due to the low value of the internal resistance, this stresses the capacitance, producing heat that reduces its lifetime. Additionally, a high value of the output capacitance slows down the dynamic behavior of the converter. As a result, this could be problematic if the input power varies and the converter is forced to change its operating point. Slow dynamic behavior jeopardizes the operation of the MPP tracker, causing mismatching losses. Hence, a traditional buck designed with a low output ripple, achieved by increasing the output capacitance, will show poor dynamic behavior and a small amount of power loss in the same capacitance. On the other hand, the adoption of a high switching frequency has a dramatic impact on switching losses in power switches, since they depend linearly on this parameter. The improvement in efficiency can be estimated by considering the efficiency η, which can be written as:
η = P o u t p u t P i n p u t 1 P l o s t P o u t p u t  
Hence, if Plost is diminished, for example by a factor 0 < k < 1, it follows that the new efficiency η’ is given by:
η = 1 ( 1 η ) k
For example, a 20% reduction of the power loss (meaning k = 0.8) is achievable by lowering the switching frequency; this gives an increase in the efficiency of about 1%. It can be noted that this can be considered a good result, since the switching converters normally show an efficiency value higher than 93%. A more detailed discussion on improving the efficiency of the power converter can be found in [33].
Regarding the influence of voltage harmonics on the efficiency of the PEM-EL, this is not directly addressed in literature, although [12] and [26,27,28] investigate this issue for alkaline water ELs. However, some general observations can be made. First of all, the response of an EL in terms of a periodic input signal fits a low-pass curve, which is shown in [29] and related papers. This means that increasing the frequency reduces the impedance of the EL, progressively short-circuiting the harmonics. In addition, a variable current causes oscillation of the ions and consequent heat production, subtracting energy from the hydrogen production. Even if quantitative analysis is not possible from a qualitative point of view, it can be stated that even in the case of PEM-EL, the harmonics degrade the Faraday efficiency.
The Faraday efficiency is also optimized by sharing the power that is channeled to the array of ELs to operate them at rated power (meaning at the maximum current density). Since the Faraday efficiency increases with the current density, this allows the efficiency to be improved. In this case, as an example, typical phenomena occurring when electrons are diverted to the production of hydrogen peroxide are minimized. It can be noted that this is different from dividing the same power into equal parts for all the ELs, since in this case they would be operated with a lower current than the rated current, and hence with a lower Faraday efficiency, obtaining a lower amount of produced hydrogen.
A critical operating point for the system could be in proximity to the rated power of the EL when fluctuating power oscillates around this value (this could happen in the presence of wind gusts). To avoid switching on the next EL with a low amount of power, the battery can be used with a threshold at the minimum power that can be delivered to the EL. In any case, the delay introduced in estimating the power, as shown in the cycle of Figure 12, avoids the trapping phenomena. A detailed study is out of the scope of this paper, however it will be discussed in future works.
The experimental setup proposed in this paper is designed at the laboratory scale, meaning a wind turbine with 5 kW of rated power and ELs with 400 W of rated power. However, it can be scaled to a higher power system. The bottleneck is caused by the SIBC converter, particularly by the maximum current allowed by the inductor, which is limited by joule loss. It is worth noting that our approach encourages the use of multiple converters in an array configuration, since it is not suitable to increase the power of a single converter, rather it is preferable to increase the number of converters to increase the overall power. Even if it seems that the number of components dramatically increases, it must be considered that their cost shows an increase lower than linear, particularly for the power inductor; hence, it is better to have multiple converters. Finally, the modularity of the system easily allows for the power to be increased, improving the overall reliability, since a fault in a single converter does not stop the plant and because maintenance can be properly scheduled.

8. Conclusions

A distributed system for producing hydrogen with multistack PEM electrolyzers supplied by a wind turbine has been devised and tested. This system is based on a stacked interleaved buck converter able to supply an electrolyzer with a DC voltage, resulting in a reduced ripple in the output. This increases the lifespan of the electrolyzer and increases the production of hydrogen. The available power is managed so that the highest number of electrolyzers is operated at rated power to maximize the Faraday efficiency. The power available from the turbine is calculated based on the rotor speed. This is estimated by extracting the ripple, which is superimposed with the DC voltage at the output of the three-phase rectifier connected to the PMSM, using a zero-crossing-based frequency demodulator. A management algorithm provides each stacked interleaved buck converter with the voltage reference, so that only one electrolyzer tracks while the remaining electrolyzers are operated at rated power or are turned off. When the available power exceeds the power of all electrolyzers, the remaining power is exploited in an auxiliary battery system. The surplus energy is stored in the auxiliary battery system, which can be used to directly supply the loads or alternatively to supply the multistack electrolyzers when hydrogen is requested by a fuel cell.

Author Contributions

Conceptualization, D.G. and G.V.; methodology, D.G. and G.V.; validation, D.G. and G.V.; investigation, D.G. and G.V.; writing—original draft preparation, D.G. and G.V.; writing—review and editing, D.G. and G.V. All authors have read and agreed to the published version of the manuscript.

Funding

This research received no external funding.

Acknowledgments

The authors would like to thank Serge Merafina (technical staff at the IUT de Longwy), for his valuable advice regarding the development and realization of the experimental test bench.

Conflicts of Interest

The authors declare no conflict of interest.

References

  1. Panwar, N.L.; Kaushik, S.C.; Kothari, S. Role of renewable energy sources in environmental protection: A review. Renew. Sustain. Energy Rev. 2011, 15, 1513–1524. [Google Scholar] [CrossRef]
  2. Available online: https://www.cleantech.com/the-role-of-green-hydrogen-in-global-decarbonization/ (accessed on 26 September 2019).
  3. Available online: https://www.iea.org/tcep/energyintegration/hydrogen/ (accessed on 26 September 2019).
  4. Byfield, S.; Vetter, D. Flexibility Concepts for the German Power Supply in 2050: Ensuring Stability in the Age of Renewable Energies; Acatech–Deutsche Akademie der Technikwissenschaften: Munich, Germany, 2016. [Google Scholar]
  5. Lund, P.; Lindgren, J.; Mikkola, J.; Salpakari, J. Review of energy system flexibility measures to enable high levels of variable renewable electricity. Renew. Sustain. Energy Rev. 2015, 45, 785–807. [Google Scholar] [CrossRef] [Green Version]
  6. Mohanpurkar, M.; Luo, Y.; Terlip, D.; Dias, F.; Harrison, K.; Eichman, J.; Hovsapian, R.; Kurtz, J. Electrolyzers Enhancing Flexibility in Electric Grids. Energies 2017, 10, 1836. [Google Scholar] [CrossRef] [Green Version]
  7. Wang, F.-C.; Lin, K.-M. Impacts of Load Profiles on the Optimization of Power Management of a Green Building Employing Fuel Cells. Energies 2019, 12, 57. [Google Scholar] [CrossRef] [Green Version]
  8. Valencia, G.; Benavides, A.; Cárdenas, Y. Economic and Environmental Multiobjective Optimization of a Wind–Solar–Fuel Cell Hybrid Energy System in the Colombian Caribbean Region. Energies 2019, 12, 2119. [Google Scholar] [CrossRef] [Green Version]
  9. Sarrias-Mena, R.; Fernández-Ramírez, L.M.; García-Vásquez, C.A.; Jurado, F. Electrolyzer models for hydrogen production from wind energy systems. Int. J. Hydrog. Energy 2015, 40, 2927–2938. [Google Scholar] [CrossRef]
  10. Zhou, T.; François, B.; El Hadi Lebbal, M.; Lecoeuche, S. Real-Time Emulation of a Hydrogen-Production Process for Assessment of an Active Wind-Energy Conversion System. IEEE Trans. Ind. Electron. 2009, 56, 737–746. [Google Scholar] [CrossRef]
  11. Gandia, L.M.; Arzamedi, G.; Diéguez, P.M. Renewable Hydrogen Technologies: Production, Purification, Storage, Applications and Safety; Newnes: London, UK, 2013. [Google Scholar]
  12. Koponen, J.; Ruuskanen, V.; Kosonen, A.; Niemelä, M.; Ahola, J. Effect of Converter Topology on the Specific Energy Consumption of Alkaline Water Electrolyzers. IEEE Trans. Power Electron. 2018, 34, 6171–6182. [Google Scholar] [CrossRef]
  13. Rodriguez, J.; Pontt, J.; Silva, C.; Wiechmann, E.; Hammond, P.; Santucci, F.; Alvarez, R.; Musalem, R.; Kouro, S.; Lezana, P. Large current rectifiers: State of the art and future trends. IEEE Trans. Ind. Electron. 2005, 52, 738–746. [Google Scholar] [CrossRef]
  14. Solanki, J.; Fröhleke, N.; Böcker, J.; Wallmeier, P. Comparison of Thyristor-Rectifier with Hybrid Filter and Chopper-Rectifier for High-Power High-Current Application. In Proceedings of the PCIM Europe 2013, Nuremberg, Germany, 14–16 May 2013; pp. 1391–1398. [Google Scholar]
  15. Solanki, J.; Fröhleke, N.; Böcker, J. Implementation of hybrid filter for 12-pulse thyristor rectifier supplying high-current variable-voltage DC load. IEEE Trans. Ind. Electron. 2015, 62, 4691–4701. [Google Scholar] [CrossRef]
  16. Muyeen, S.M.; Takahashi, R.; Tamura, J. Electrolyzer switching strategy for hydrogen generation from variable speed wind generator. Electr. Power Syst. Res. 2011, 81, 1171–1179. [Google Scholar] [CrossRef] [Green Version]
  17. Pascuzzi, S.; Anifantis, A.; Blanco, I.; Scarascia, G. Electrolyzer performance analysis of an integrated hydrogen power system for greenhouse heating. A Case Study. Sustainability 2016, 8, 629. [Google Scholar] [CrossRef] [Green Version]
  18. Haruni, A.O.; Negnevitsky, M.; Haque, M.E.; Gargoom, A. A novel operation and control strategy for a standalone hybrid renewable power system. IEEE Trans. Sust. Energy 2013, 4, 402–413. [Google Scholar] [CrossRef]
  19. Trifkovic, M.; Sheikhzadeh, M.; Nigim, K.; Daoutidis, P. Modeling and control of a renewable hybrid energy system with hydrogen storage. IEEE Trans. Control Syst. Technol. 2014, 22, 169–179. [Google Scholar] [CrossRef]
  20. Takahashi, R.; Kinoshita, H.; Murata, T.; Tamura, J.; Sugimasa, M.; Komura, A.; Ide, K. Output power smoothing and hydrogen production by using variable speed wind generators. IEEE Trans. Ind. Electron. 2010, 57, 485–493. [Google Scholar] [CrossRef]
  21. Yamashita, D.; Nakao, H.; Yonezawa, Y.; Nakashima, Y.; Ota, Y.; Nishioka, K.; Sugiyama, M. A New Solar to Hydrogen Conversion System with High Efficiency and Flexibility. In Proceedings of the IEEE 6th International Conference on Renewable Energy Research and Applications (ICRERA) 2017, San Diego, CA, USA, 5–8 November 2017; pp. 441–446. [Google Scholar]
  22. Marx, N.; Boulon, L.; Gustin, F.; Hissel, D.; Agbossou, K. A review of multistack and modular fuel cell systems: Interests, application areas and on-going research activities. Int. J. Hydrog. Energy 2014, 39, 12101–12111. [Google Scholar] [CrossRef]
  23. Liso, V.; Savoia, G.; Araya, S.S.; Cinti, G.; Kær, S.K. Modelling and Experimental Analysis of a Polymer Electrolyte Membrane Water Electrolysis Cell at Different Operating Temperatures. Energies 2018, 11, 3273. [Google Scholar] [CrossRef] [Green Version]
  24. Onda, K..; Murakami, T.; Hikosaka, T.; Kobayashi, M.; Notu, R.; Ito, K. Performance Analysis of Polymer-Electrolyte Water Electrolysis Cell at a Small-Unit Test Cell and Performance Prediction of Large Stacked Cell. J. Electrochem. Soc. 2002, 149, A1069–A1078. [Google Scholar] [CrossRef]
  25. Guilbert, D.; Sorbera, D.; Vitale, G. A stacked interleaved DC–DC buck converter for proton exchange membrane electrolyzer applications: Design and experimental validation. Int. J. Hydrogen Energy 2020, 45, 64–79. [Google Scholar] [CrossRef]
  26. Dobo, Z.; Bence Palotas, Á.; Toth, P. The effect of power supply ripple on dc water electrolysis efficiency. Mater. Sci. Eng. 2016, 41, 23–31. [Google Scholar]
  27. Ursúa, A.; Sanchis, P.; Marroyo, L. Chapter 14—Electric conditioning and efficiency of hydrogen production systems and their integration with renewable energies. In Renewable Hydrogen Technologies; Gandía, L., Arzamendi, G., Diéguez, P., Eds.; Elsevier: Amsterdam, The Netherlands, 2013; pp. 333–360. [Google Scholar]
  28. Ursúa, A.; Marroyo, L.; Gubía, E.; Gandía, L.M.; Diéguez, P.M.; Sanchis, P. Influence of the power supply on the energy efficiency of an alkaline water electrolyser. Int. J. Hydrog. Energy 2009, 34, 3221–3233. [Google Scholar] [CrossRef]
  29. Malkow, T.; Pilenga, A.; Tsotridis, G. EU Harmonised Test Procedure: Electrochemical Impedance Spectroscopy for Water Electrolysis Cells; EUR 29267 EN; Publications Office of the European Union: Brussels, Belgium, 2018. [Google Scholar] [CrossRef]
  30. Guilbert, D.; Vitale, G. Optimal Hydrogen Production from Direct Coupled Variable Speed Wind Generator with a Stacked Interleaved Buck Converter. In Proceedings of the IEEE International Conference on Environment and Electrical Engineering and 2019 IEEE Industrial and Commercial Power Systems Europe (EEEIC / I&CPS Europe), Genova, Italy, 11–14 June 2019; pp. 1–6. [Google Scholar]
  31. Guilbert, D.; Vitale, G. Dynamic Emulation of a PEM-ELectrolyzer by Time Constant Based Exponential Model. Energies 2019, 12, 750. [Google Scholar] [CrossRef] [Green Version]
  32. Ayivor, P.; Torres, J.; Meijden, M.V.; Stouwie, B. Modelling of Large Size Electrolyzer for Electrical Grid Stability Studies in Real Time Digital Simulation. In Proceedings of the 3rd International Hybrid Power Systems Workshop, Tenerife, Spain, 8–9 May 2018. [Google Scholar]
  33. Kolar, J.W.; Krismer, F.; Lobsiger, Y.; Muhlethaler, J.; Nussbaumer, T.; Minibock, J. Extreme Efficiency Power Electronics. In Proceedings of the IEEE 7th International Conference on Integrated Power Electronics Systems (CIPS), Nuremberg, Germany, 6–8 March 2012; pp. 1–22. [Google Scholar]
Figure 1. Representation of the turbine connected to the permanent magnet synchronous generator (PMSG) and the three-phase rectifier. EL, electrolyzer.
Energies 13 01239 g001
Figure 2. The DC voltage available at the output of the rectifier versus the wind speed.
Energies 13 01239 g002
Figure 3. Optimal turbine power versus wind speed.
Energies 13 01239 g003
Figure 4. Optimal turbine speed versus wind speed.
Energies 13 01239 g004
Figure 5. PEM-EL stack voltage and current versus the available power.
Energies 13 01239 g005
Figure 6. Equivalent circuit of the PEM-EL [31].
Energies 13 01239 g006
Figure 7. Electric scheme of the stacked interleaved DC–DC buck converter (SIBC).
Energies 13 01239 g007
Figure 8. Picture of the adopted equivalent model (left) and PEM-EL (right).
Energies 13 01239 g008
Figure 9. Comparison of different voltage profiles obtained at the terminals of the PEM-EL.
Energies 13 01239 g009
Figure 10. Block diagram of the frequency demodulator used to estimate the rotor speed based on residual ripple outputs from the rectifier.
Energies 13 01239 g010
Figure 11. Principle of the control strategy of the SIBC based on the available power. HP, high-pass; PMSG, permanent magnet synchronous generator.
Energies 13 01239 g011
Figure 12. Flow chart of the energy-sharing algorithm.
Energies 13 01239 g012
Figure 13. Experimental test rig in the laboratory.
Energies 13 01239 g013
Figure 14. Voltage and current at the terminals of the electrolyzer with rated power.
Energies 13 01239 g014
Figure 15. AC component of the voltage and current at the terminals of the electrolyzer with rated power.
Energies 13 01239 g015
Figure 16. Voltage and current at the terminals of the electrolyzer.
Energies 13 01239 g016
Figure 17. Voltage and current at the terminals of the electrolyzer.
Energies 13 01239 g017
Table 1. Main parameters of the wind turbine [30].
SpecificationData
Rated power (W)5000
Max power (W)5800
Wind speed (m/s)
Cut in2.5
Rated17
Survival60
Rotor blades
Number3
Diameter (m)5
Swept area (m2)19.63
AirfoilE387
Tip speed ratio7
MaterialGlass-fiber reinforced epoxy
Generator
TypeBrushless permanent
magnet 9-pole
Revolutions per minute operating range120–450 rpm
Frequency (Hz)0–70
GearboxNone
Table 2. Specifications of the proton exchange membrane electrolyzer (PEM-EL) [30].
SpecificationData
Maximum H2 flow rate at standard temperature and pressure (STP).(20 °C/1 bar absolute)1 L/min
Delivery output pressure0.1–10.5 bar
H2 purity>99.9999%
Electrolysis cellSolid polymer membrane
WaterDeionized or distilled
Weight (dry)20 kg
Stack weight6 kg
Number of cells3
Operating conditions:
Temperature
Relative humidity
15 °C to 40 °C
0–80%
Stack operating voltage range4.4–8 V
Stack current range0–50 A
Stack rated electrical power400 W
Table 3. Values of the components of the equivalent circuit model of the PEM-EL (referred to figure 6) [30].
ParameterValueUnit
Vint4.38(V)
Rint0.088(Ω)
R10.035(Ω)
R20.318(Ω)
C137.26(F)
C237.26(F)
Table 4. Comparison of the poles of the open loop system with static and dynamic models of the load [30].
Open Loop Poles of SIBC Loaded by a Static Model (104 rad/s)Open Loop Poles of SIBC Loaded by a Dynamic Model (105 rad/s)
−0.0477 ± 1.6403i−1.1320 + 0.0000i
−0.4803 ± 0.1252i−0.0018 ± 0.1582i
-−0.0037 + 0.0000i
-−0.0000 + 0.0000i
Table 5. Power-sharing strategy according to the available power from the wind turbine.
CasePEL1EL2EL3Batt
1P < 400 WVref,optOFFOFFOFF
2400 W < P < 800 WRated PVref,optOFFOFF
3800 W < P < 1200 WRated PRated PVref,optOFF
4P > 1200 WRated PRated PRated PON
Table 6. Components of the SIBC converter [30].
SpecificationData
IGBT4xSKM 50 GB 123D
Rectifier1xSKD 51/14
DC capacitor bank (at the output of the three-phase rectifier)2 × 2200 µF/400 V
Semikron driver boards4xSKHI 22 (0–15 V)
Passive components:
Primary inductor, Lp400 µH
Secondary inductor, Ls400 µH
Parasitic resistances, Rp and Rs60 mΩ
Primary capacitor, Cp100 µF
Secondary capacitor, Cs10 µF

