One-Dimensional Study on Hydrate Formation from Migrating Dissolved Gas in Sandy Sediments

1
State Key Laboratory of Heavy Oil Processing, China University of Petroleum-Beijing at Karamay, Karamay 834000, China
2
State Key Laboratory of Heavy Oil Processing, China University of Petroleum, Beijing 102249, China
*
Authors to whom correspondence should be addressed.
†
These authors contributed equally to this work.
Energies 2020, 13(7), 1570; https://doi.org/10.3390/en13071570
Submission received: 18 February 2020
/
Revised: 25 March 2020
/
Accepted: 26 March 2020
/
Published: 30 March 2020
(This article belongs to the Special Issue Integration of Theoretical, Laboratory, and Field Studies for Efficient Gas Hydrate Assessment and Acquisition)
Abstract
:Upward migration of gas-dissolved pore fluid is an important mechanism for many naturally occurring hydrate reservoirs. However, there is limited understanding in this scenario of hydrate formation in sediments. In this preliminary work, hydrate formation and accumulation from dissolved gas in sandy sediments along the migration direction of brine was investigated using a visual hydrate simulator. Visual observation was employed to capture the morphology of hydrates in pores through three sapphire tubes. Meanwhile, the resistivity evolution of sediments was detected to characterize hydrate distribution in sediments. It was observed that hydrates initially formed as a thin film or dispersed crystals and then became a turbid colloidal solution. With hydrate growth, the colloidal solution converted to massive solid hydrates. Electrical resistivity experienced a three-stage evolution process corresponding to the three observed hydrate morphologies. The results of resistivity analysis also indicated that the bottom–up direction of hydrate growth was consistent with the flow direction of brine, and two hydrate accumulation centers successively appeared in the sediments. Hydrates preferentially formed and accumulated in certain depths of the sediments, resulting in heterogeneous hydrate distribution. Even under low saturation, the occurrence of heterogeneous hydrates led to the sharp reduction of sediment permeability.

1. Introduction
Natural gas hydrates are icelike crystalline compounds comprising small guest molecules, such as methane or other light hydrocarbons, which are trapped in the cages of a hydrogen-bonded water framework under relatively low temperature and high pressure [1]. Natural gas hydrate deposits are widely distributed in permafrost regions and marine sediments. Natural gas hydrates are considered as a future source of energy because large concentrated gas hydrate accumulations may be profitably recovered in the future [2]. In order to safely and effectively recover methane from hydrate reservoirs, great efforts have been devoted to study hydrate formation and dissociation behaviors in laboratories and field tests, as previously reviewed [3,4,5]. These works have greatly improved the understanding of natural-gas hydrates and given hope of unlocking “fire in ice” for humans’ daily lives. However, realizing long-term commercial gas production from natural-gas hydrate reservoirs still comes with many challenges. Further works should be carried out to narrow knowledge gaps between laboratory-scale studies and reservoir-scale tests [6].
It is important to fully assess the possibility of exploitation by studying hydrate occurrence and physical properties in different scenarios. Hydrate formation from gaseous methane has been intensively studied [7,8,9,10,11,12,13], but there is still limited understanding on the behaviors of hydrate formation from dissolved gas. Upward migration of gas-saturated pore fluids is an important mechanism for many naturally occurring hydrate reservoirs [14]. However, for the low solubility of methane in water, the artificial synthesis of gas hydrates from dissolved gas within sediments in the laboratory is challenging. So far, very few successful attempts have been reported. Buffett and Zatsepina [15] investigated dissolved CO2 hydrate formation in natural porous media by monitoring the response of sample resistance, and found that resistance increased with the increase of hydrate concentration. Experiments demonstrated that hydrate crystals could nucleate in the absence of free gas. Tohidi et al. [16] observed hydrate growth in synthetic porous media, and provided conclusive evidence that hydrate could form in systems without a free gas phase. They also reported that hydrate preferentially occupied the center of pore spaces. Spangenberg carried out sets of experiments to form hydrates by circulating methane-saturated water through a cold glass bed [17,18]. Waite and Spangenberg conducted a series of gas hydrate formation tests in which methane-supersaturated water circulated through three vessels with different scales containing glass beads or unconsolidated sand [19]. Results showed that the rate-limiting step of hydrate formation dissolved gaseous phase methane into the circulating water to form a methane-supersaturated fluid. By applying enhancing methods, they successfully prepared a 200 L specimen with a volume of high hydrate saturation of about 90%. To track hydrate distribution in sediments, electrical properties were always applied by inserting electrodes in the sediments [20,21,22]. Hydrate saturation could be inversed from measured resistivity via Archie’s equation [23]. As hydrates present different morphologies in pores [24], attention should be paid to measured-data analysis.
The presence of a solid hydrate phase in pores reduces sediment permeability by reducing sediment porosity, shrinking the area for fluid flow, and even changing the flow pattern of the pore fluid. Permeability evolution during hydrate formation in sediments is key to hydrate accumulation and distribution in nature [25]. In addition, the permeability of hydrate-bearing sediments governs fluid flow during gas production, which also has significant influence on production efficiency [26,27]. Therefore, as reviewed by Ren et al. [28], great efforts have been made to experimentally and numerically study the permeability of hydrate-bearing sediments (synthesized and cored samples). Measurements were mainly carried out by methods such as flow tests, NMR, CT, and their combination to obtain the intrinsic and relative permeability of hydrate-bearing sediments in which (water or gas) flow tests are widely used. Modelling studies attempted to establish a relationship between hydrate occurrence and measured permeability data. Pore habits of hydrates in sediments were mainly the focus of classical models [29]. However, at present, the prediction range of various correlation models is narrow relative to the permeability data of hydrate deposits with a wide distribution range. Hydrate polymorphism and the nonuniformity of hydrate distribution in sediments are the main causes of this phenomenon. Among the proposed models, the simplest ones are parallel capillary models in which porous sediments consist of a bundle of cylindrical capillary tubes. Hydrates can uniformly coat the capillary tube’s wall (capillary coating) or occupy the center of the tubes (capillary filling). Flow patterns in the capillary tubes are pipe flow for a capillary-coating habit, and annular flow for a capillary-filling habit. Further, considering the effect of pore shape, tortuosity, and surface area, models for grain-coating and pore-filling hydrates were built. In addition, microfactors such as pore-size distribution, throat radii, and capillarity were considered in recent works, as reviewed by Ren et al. [28].
In this work, in order to understand the behaviors of hydrate formation and accumulation along the upward fluid-migration direction, a one-dimensional visual hydrate simulator (ODVHS) with height/diameter ratios of about 40 was applied. In this preliminary experimental work, a flow test was carried out to form hydrates from upward-migrating dissolved gas in sediments. Visual observation and measurements of pressure, temperature, and electrical properties were combined to characterize the formation of gas hydrates in sediments. The evolution of sediment permeability during hydrate growth and accumulation was also analyzed.
2. Materials and Methods
2.1. Apparatus
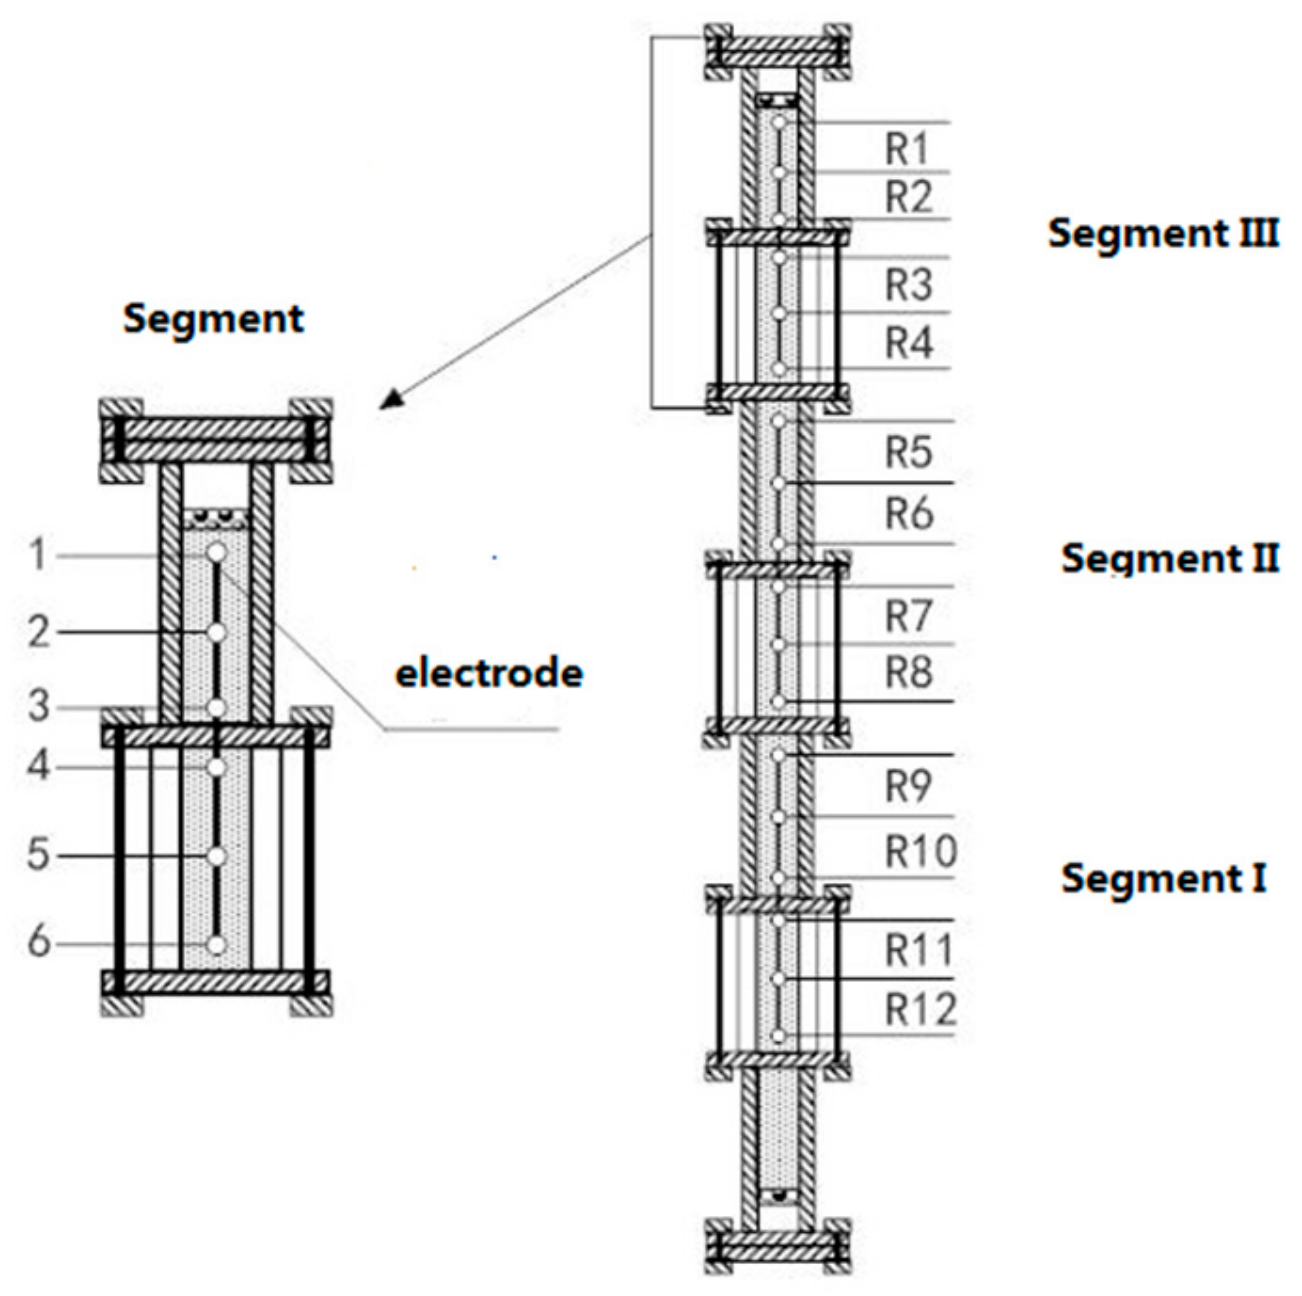
The schematic diagram for the one-dimensional visual hydrate simulator applied in this work is presented in Figure 1. A detailed description of this three-dimensional hydrate simulator (TDHS) was given in our previous work [13]. It mainly consisted of four parts: the formation, dissolved-gas-supply, sensor, and temperature-control systems. The main component of the formation system was a visual high-pressure reactor assembled by three cylinder sapphire tubes (2.54 cm inner diameter, 6.0 cm out diameter, 10.0 cm height) and four stainless-steel tubes (316 L, 2.54 cm inner diameter, 15.0 or 20.0 cm height), as shown in Figure 2. The length of the reactor was 1.0 m, and the volume was about 0.51 L. The seven tubes (sapphire and stainless steel) were assembled to form a vertical tubular simulator that was fixed on a steel frame. Four flanges as a thread guide were mounted in the middle part of every stainless-steel tube (Figure 2). Two porous plates were fixed at the bottom and top of the reactor for uniformly distributing the inlet or outlet fluid and separating a zone to load porous media and sensors. As displayed in Figure 2, the reactor was divided to 3 segments that were labeled as Segments I–III from bottom to top.
For the dissolved-gas-supply system, an interface chamber with a volume of 10 L was used as gas reservoir to supply methane-containing brine. Two 1 L interface chambers were connected to the outlet of the pump for further saturating the brine drips and entrapping gas bubbles possibly produced by the fluid-swabbing process. The two small chambers were also used as the buffer container of the injected flow from the pump. An interface between methane gas and brine was created in these chambers, and the gas-to-brine volume ratios in the 10 and 1 L interface chambers were 1:4 and 1:5, respectively. To prevent clogging caused by hydrate formation before brine entered the sediments, a warm bath was used to cautiously keep the inlet line’s temperature slightly higher than that in the sediments, but less than that in the interface chambers. A constant flow pump was used to drive the flow loop in the whole system.
For the sensor system, four resistance temperature detectors (RTD, type PT100, T1, T2, T3, and T4) were inserted into stainless-steel tubes through a port set in the middle section of the external wall from the top to bottom of reactor (Figure 1). Two pressure transducers (Trafag 8251 model) were employed to measure pressure (P1, P2) inside the reactor at the bottom and top of the reactor, respectively. Temperature-measurement accuracy was ±0.1 K, and pressure-measurement accuracy was ±0.05 MPa. In addition, three rods containing 18 cyclic electrodes were inserted into the sand bed to detect the variation of electrical resistance of 12 depths denoted by R1–R12 in the sediments from the top down during hydrate formation (Figure 1 and Figure 2). Six electrodes were configured in one rod, making up four pairs of measuring circuit, as shown in Figure 2. The electrical resistance of sediments between electrodes was detected using a digital electrical bridge (DF-2819 model, Ningbo Zhongce Electronics, Ltd.). Resistance-measurement accuracy was 0.05%. The temperature, pressure, and electrical resistance were collected by a monitor and control generated system (MCGS) in real time. A digital camera was used to capture the morphology changes of hydrate crystals in pores through the sapphire tubes.
For temperature control, the whole formation system was placed in a constant cooling room which was 3.5 m long, 2.2 m wide, and 2.8 m high. The refrigeration and heat system enabled room temperature to be maintained at 258–293.15 K with an accuracy of ±0.5 K.
2.2. Materials and Experiment Procedure
Natural coarse sand (20–40 meshes, porosity 0.39) was packed to simulate sandy sediments. Sand was washed with deionized water and then thoroughly dried. Brine with a salinity of 3.5% (NaCl aqueous solution, weight percentage) was used as the liquid in the experiment. CH4 (99.9% purity) was purchased from Beijing AP BAIF Gases.
The following are the protocol steps of the hydrate-formation test. First, coarse sand was compactly packaged in the reactor and evacuated. Then, fresh brine containing no methane was pressurized into the sand bed in the formation reactor, and the sediment sample was prepared. Afterwards, the cooling room was cooled to the desired temperature. Meanwhile, brine in the three interface chambers was presaturated by CH4 gas under the desired pressure and temperature (7.4 MPa and 284 K). When temperature in the sand bed was stable, the whole system was connected, and the flow loop was started. The preinjected fresh brine was first displaced by the methane-containing brine, which could avoid the presence of free gas during injection. Then, the warm methane-containing brine was circulated through the cold sediments under a constant flow rate. Excess methane in the brine was converted to the hydrate phase. The supersaturation of methane could be calculated by Duan’s model [30], as shown in Figure 3. Brine from the top outlet of the reactor was saturated again by dripping through the free gas in the top part of the interface chambers. The flow loop was shut down when the differential pressure reached to 9 MPa, indicating sediment impermeability. A digital camera was used to record hydrate crystal growth in the porous media. Electrical-resistivity values at 12 depths in the reactor were used to characterize hydrate distribution inside the sediments. Resistivity values in the sediments were also used to monitor the presence of free gas during the initial injection process. The presence of free gas (possibly a bubble phase as insulator in pore space) during injection could have caused the sharp rise in resistivity and led to rapid clogging after hydrate formation (hydrate shell) in the inlet.
Experiment conditions are listed in Table 1. Higher pressure and lower temperature always resulted in rapid clogging after hydrate formation in a very short time due to the higher supersaturation of methane in the brine, which was averse to the investigation of hydrate evolution in sediments. Most importantly, rapid hydrate accumulation may not be achieved in natural environments due to the difficult availability of the dissolved gas, especially in shallow sediments far away from the gas source. Therefore, on the basis of several preliminary tests, the conditions chosen in this study were relatively mild. This clearly revealed the slow hydrate accumulation and evolution process in sediments. We also found that mild experiment conditions were helpful to repeat the experiment data. Our experiment was performed at least twice under similar conditions. The following results and discussion are based on all these repeatable experiments.
3. Results
3.1. Pressure Variation
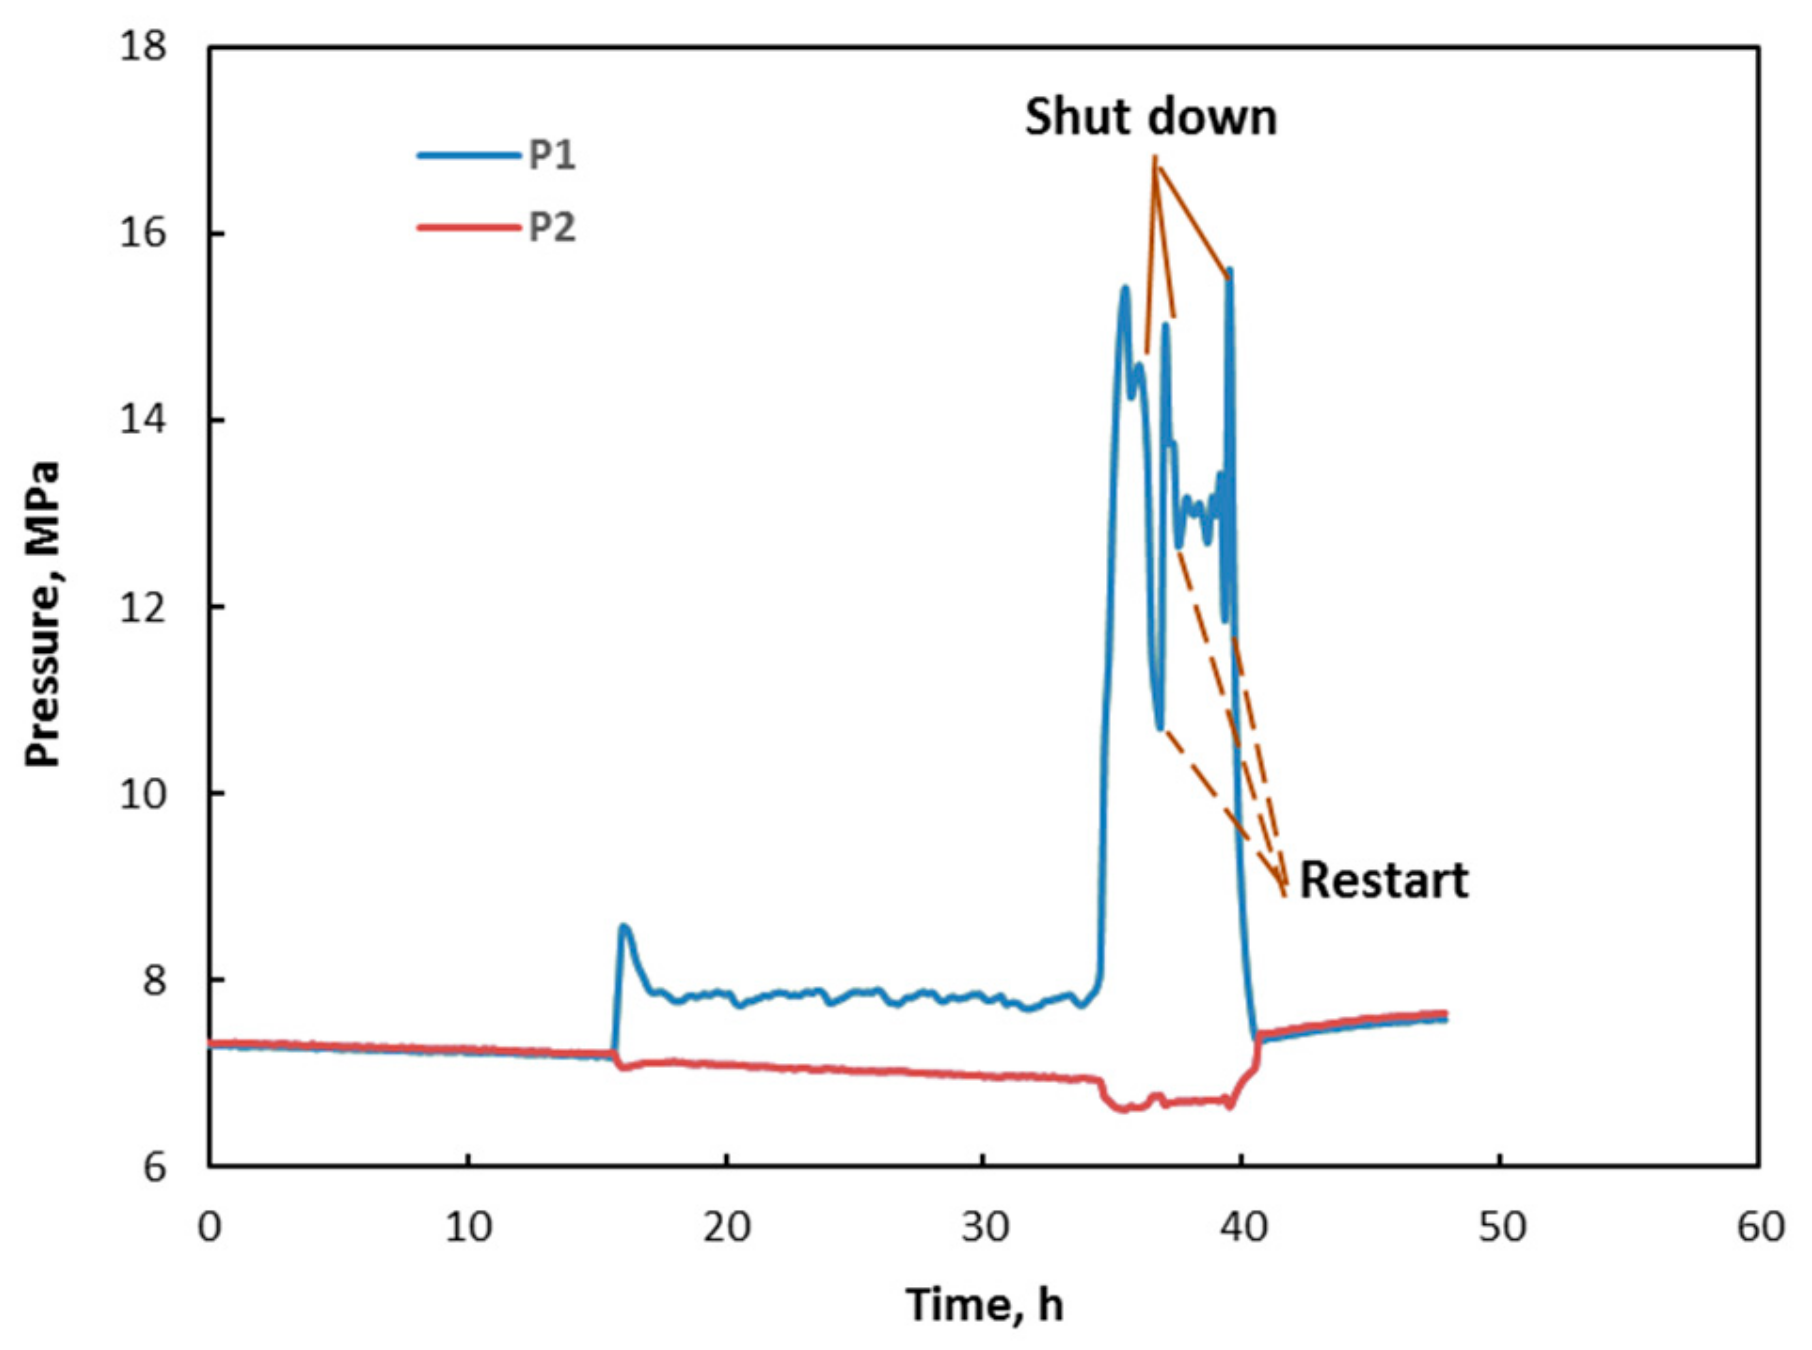
Figure 4 shows the pressure variation in the reactor during the circulation process. After the start of circulation, pressure in the reactor was stable in the first 15 h. However, at 15 h, inlet pressure P1 abruptly began to rise. This was thought to be an indication of hydrate formation that resulted in a decrease of sediment permeability. Afterwards, pressure in the reactor was stable again. Continuous hydrate formation could further reduce sediment permeability. Therefore, at 35 h, inlet pressure abruptly increased to 16 MPa; for safety reasons, circulation was stopped. When pressure P1 dropped to 8 MPa, circulation was restarted, and the inlet pressure of the reactor rapidly rose to 14.9 MPa again. Then, circulation was stopped again, and it was restarted at 37.5 h. Subsequently, inlet pressure slightly fluctuated around 13MPa. At 39 h, inlet pressure abruptly rose without a stopping trend; then, circulation was stopped, and the liquid was excluded from the reactor to decrease pressure. Pressure in the inlet (P1) was higher than that in the outlet (P2) from 16 to 39 h. Thus, at this time period, the theoretical solubility of methane in sediment brine was much higher than that in the interface chamber (pressure in the interface chamber was close to P2 in the outlet) [30]. However, the concentration (supersaturation) of methane in the flow loop was limited by the concentration of dissolved methane in the interface chamber with stable pressure. This indicated that methane-containing brine in the sediments was highly unsaturated under higher pressure, so no excess dissolved gas was liberated as a free gas phase during hydrate formation. This could also be verified by the resistivity curves.
3.2. Electrical Resistivity and Hydrate Morphology
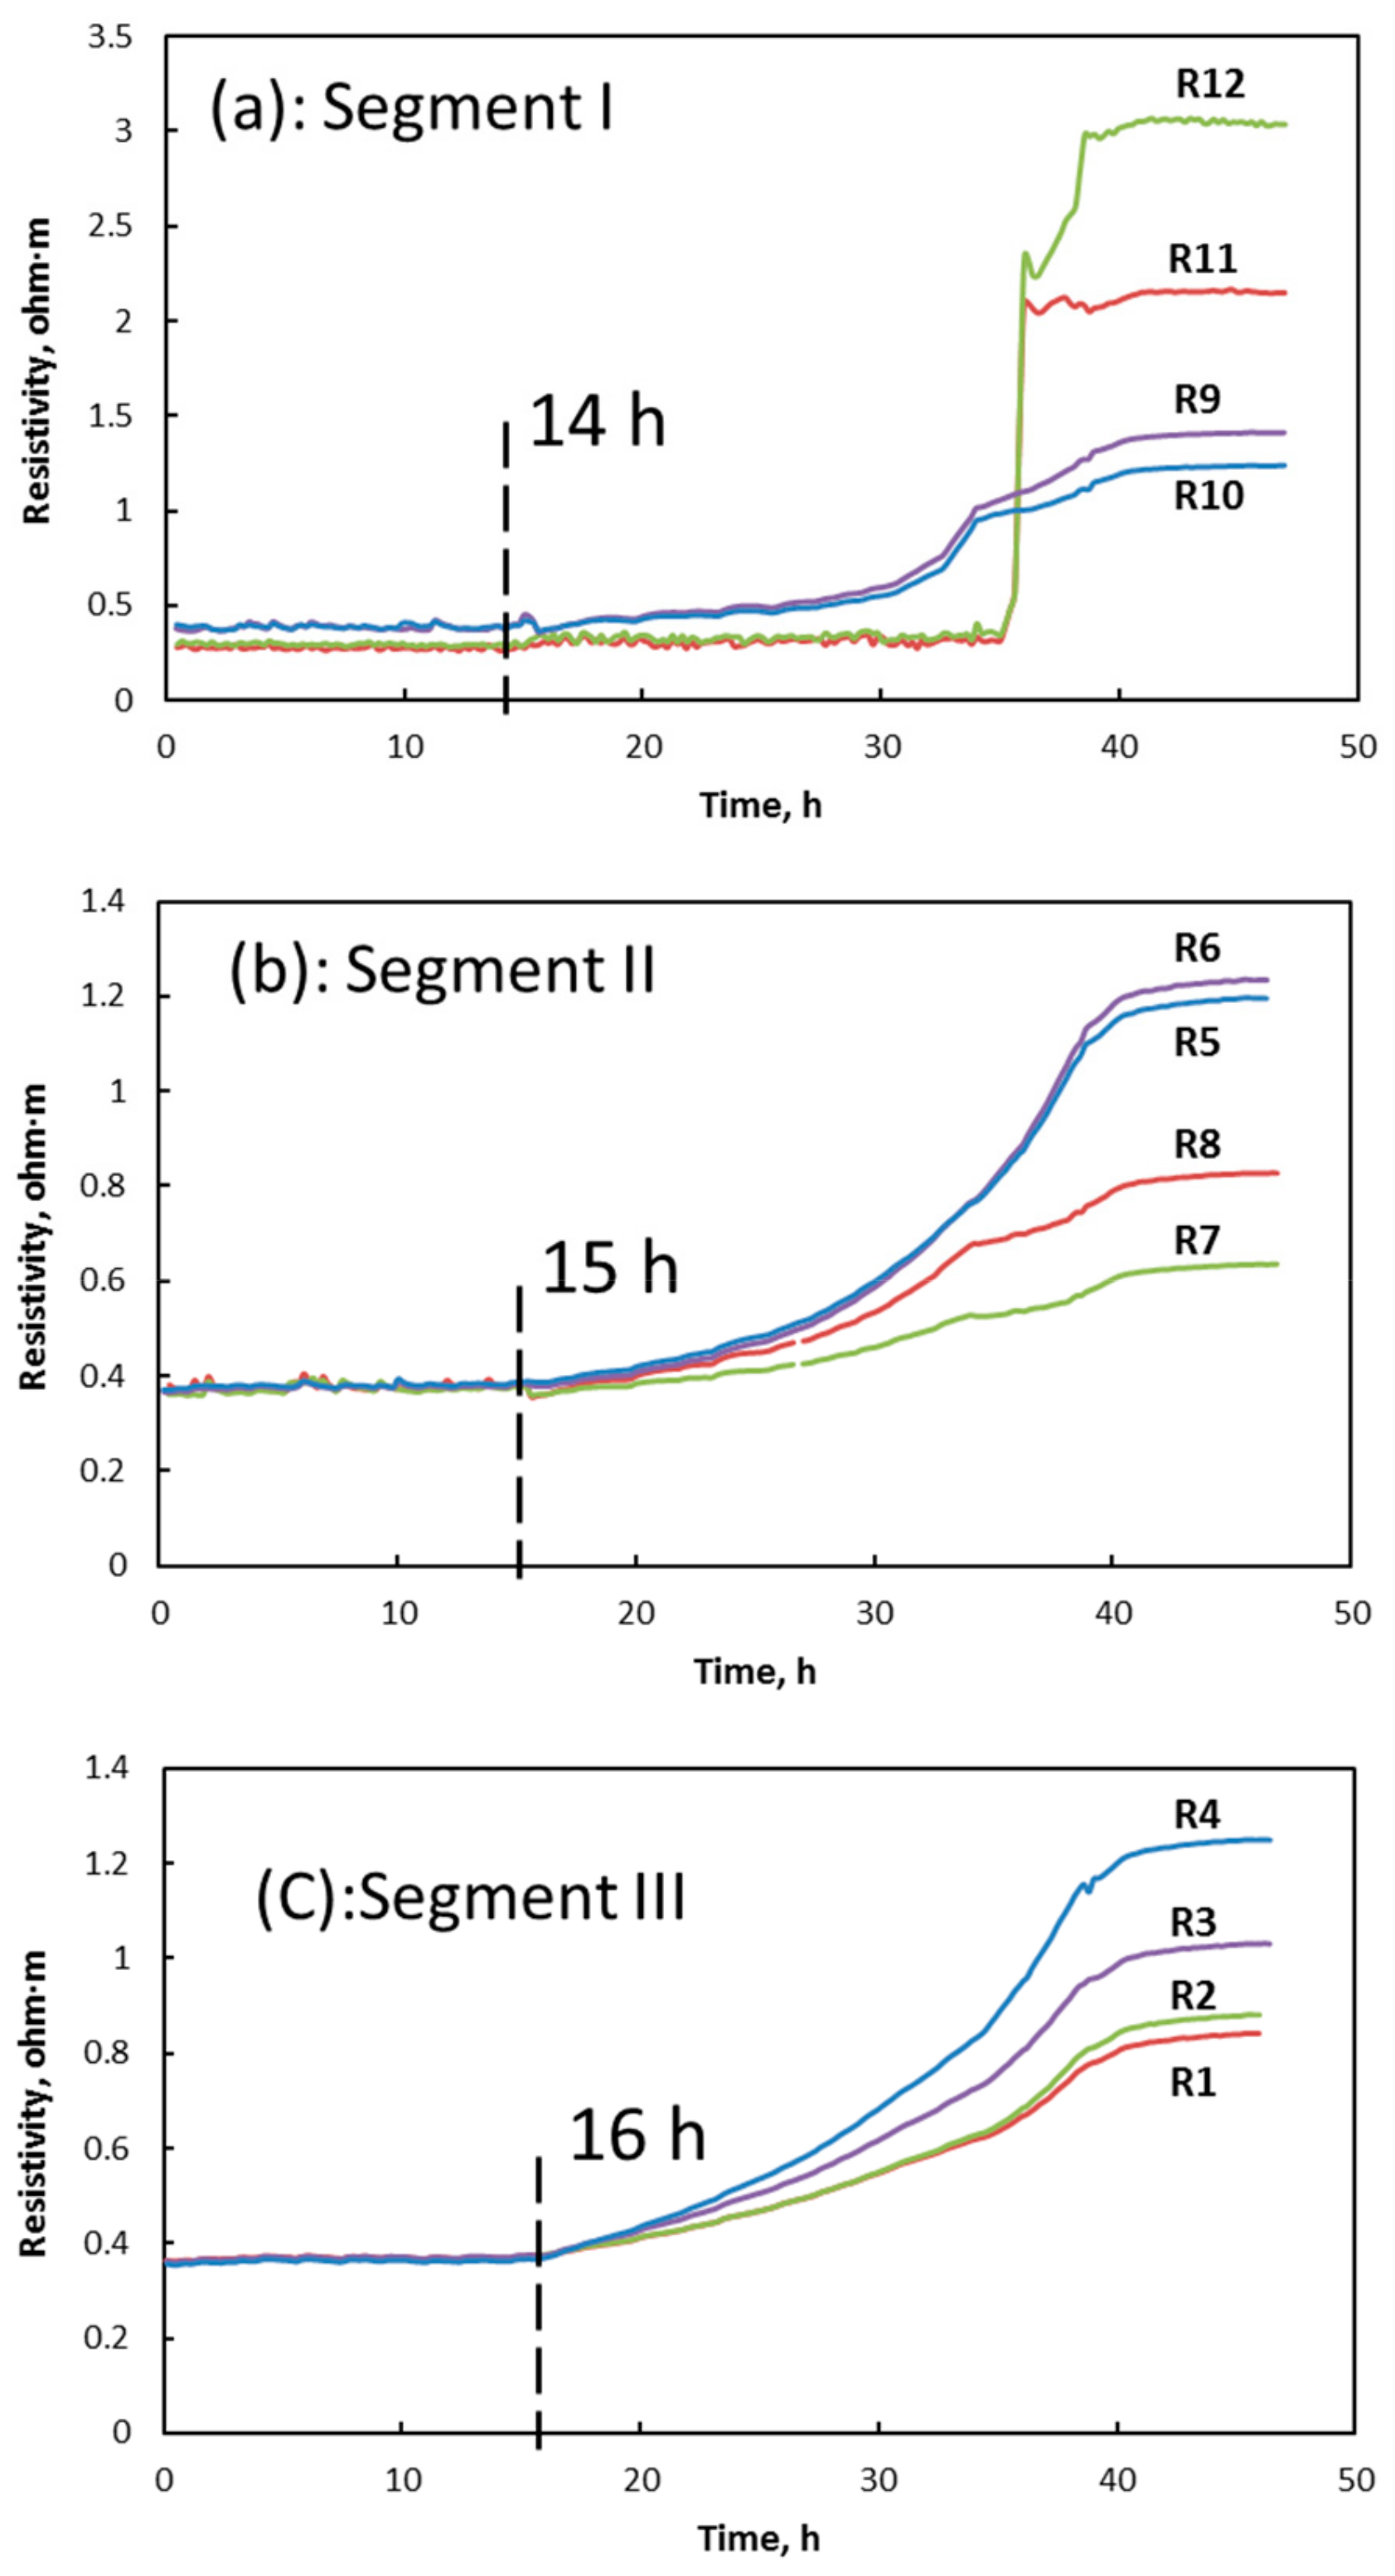
Hydrate formation could increase the salinity of residual brine, increasing electrical conductivity. On the other hand, hydrate presence decreases the hydraulic conductivity of fluid pathways because they may block pore throats in the sediments. In this experiment, brine water in the sediments was refreshed in 2 minutes by fresh brine water in interface chambers with a volume of about 10 times the pore volume. Therefore, hydrate formation in the reactor had a slight effect on brine salinity in the whole system. Thus, when hydrates formed in the continuous flow, electrical resistivity at every depth was mainly controlled by the connectivity of the fluid pathways. The evolution of electrical-resistivity values in the sediments is shown in Figure 5.
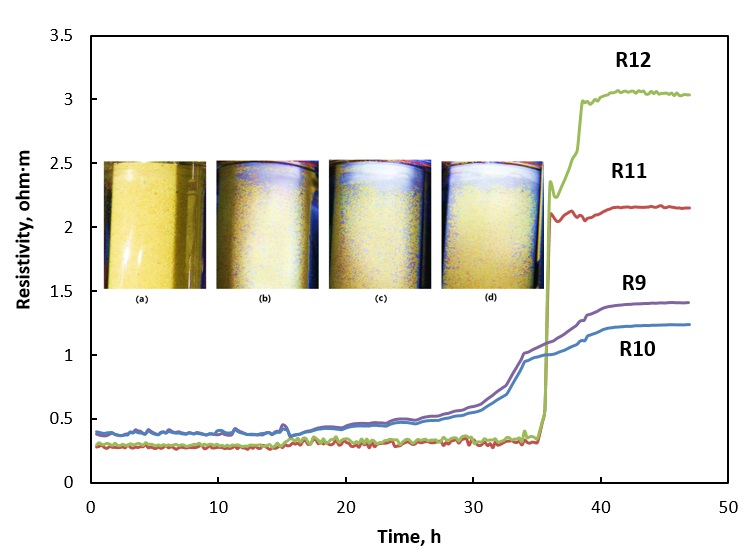
Electrical resistivity at all 12 depths experienced a three-stage evolution process. After the start of circulation, it stayed nearly stable. This could also verify the absence of free gas in the sediments during the initial stage of brine circulation. In the second stage, as presented in Figure 5, from down to up, a slow increase in electrical resistivity successively occurred in three segments at 14, 15, and 16 h, which indicated a bottom–up direction of hydrate growth that was consistent with the direction of brine flow. Specially, electrical resistivity R11 and R12 in the vicinity of the inlet of saturated brine had not revealed an obviously rapid growth trend until 35 h when a sharp increase emerged. In the second stage, different to hydrate formation from free gas [13], no obvious fluctuation in resistivity at different depths was observed. Smooth resistivity curves were also thought as an indication of the absence of free gas during hydrate formation in this flow loop. In the third stage, resistivity values in the whole reactor tended to be stable. Resistivity changes indicated ongoing slow hydrate formation and accumulation process in the sediments. The captured hydrate morphologies through the sapphire tubes also verified the hydrate-formation process.
Figure 6 displays the hydrate morphologies captured in the sapphire tube in Segment I corresponding to R11 and R12. After the start of circulation, the warm fluid entered the hydrate-formation zone, and hydrates gradually nucleated in the sediments. As shown in Figure 6a, at the initial stage, thin hydrate film gradually emerged on the inner walls of the sapphire tube. Small-size hydrate particles did not contribute to the sediment’s electrical-resistivity increase. Afterwards, with rapid in situ hydrate growth occurring, large hydrate particles gradually occupied the pores, and part of the upward-migrating small particles accumulated in the throat pores. Figure 6b shows that the formed hydrates presented as a turbid colloidal solution accumulated at the top part of the sapphire tube. These caused a slight decline in the conductivity of the pathways and an increase in electrical-resistivity sediments. With hydrate growth, Figure 6c shows that the colloidal solution became massive white solid hydrates filling up the pore space, resulting in serious clogging in the flow pathways, leading to electrical resistivity rapidly increasing to a peak value. After circulation was stopped, as shown in Figure 6d, part of the dispersed hydrates vanished in the pores due to a recrystallization effect.
In the case of hydrate formation from free gas [13], the start point of hydrate formation was film formation at the gas–water interface. Further hydrate growth was mainly in the form of film thickening. In addition, the formed hydrate film could absorb water from the surrounding environment, promoting the film-thickening process and resulting in the redistribution of gas and water phases in the sediments. Hydrates formed from the free gas were observed to cement the particles and fill the pore space. Hydrate formation from the dissolved gas was initially in the form of small-size crystals dispersed in brine, which tended to aggregate to large-size massive hydrates filling up the pores. These two scenarios are both important for hydrate occurrence in nature.
3.3. Hydrate Distribution
Resistivity values with different levels indicated that hydrates were heterogeneous in the vertical sediment bed. The behavior of hydrate accumulation determined hydrate vertical distribution in the sediments. In this study, hydrate saturation at different depths was interpreted from the measured electrical resistivity using Archie’s law (Equation (1)) that is widely used in hydrate research [23]:
where, R0 is the reference resistivity of sediments totally saturated by brine; Rti is measured electrical resistivity at different depths at time t; is inversed hydrate saturation at different depths; and n is a saturation exponent, which is 1.774 under experiment conditions. Total hydrate saturation in the sediments could be calculated by Equation (2):
Figure 7 shows the inversed bulk hydrate saturation in the sediment bed. Hydrate saturation in the whole bed was basically zero in the first 14 h, which was the induction time of hydrate nucleation. In the range of 14–40 h, hydrate saturation gradually increased to about 47%. When circulation stopped, hydrate growth stopped, and hydrate saturation basically remained unchanged due to an insufficient gas supply. In free gas mode, the interaction between gas and water in the sediment was limited by the formed hydrates, resulting in low hydrate formation [31,32]. In this study, hydrate growth was limited by the difficult availability of dissolved gas rather than the transfer of methane between water and hydrate phases. However, when rapid hydrate preparation was demanded, it could be realized by adjusting the interface of gas and water in the interface chamber using enhanced technologies, such as a nozzle, to create microdrops when brine entered the interface chamber [19].
Hydrate distribution in the sediment is mapped in Figure 8. Two hydrate accumulation centers at depths of 275 and 575 mm (corresponding to R4 and R9, respectively, which were used to later denote the depths) gradually emerged in the sediments. Retardation of hydrate growth was observed at depths of 725 and 775 mm (corresponding to R11 and R12, respectively, which were later used to denote the depth) in the vicinity of the flow inlet. This was due to two aspects: higher entry velocity and the temperature of the migrating fluid. Due to relatively fast liquid velocity, it would not be easy for the formed hydrate crystals to stay and accumulate in sediments near the inlet. The supersaturation of the warmer brine was much lower at the bottom part, which also limited the amount of hydrate formation. During the process of upward migration, the velocity and temperature of methane-containing brine were both reduced, which helped hydrate formation and accumulation at depths of 575 mm (corresponding to R9) and 625 mm (corresponding to R10). At 15 h, although it had a certain distance from the inlet, the site at the R9 depth was the first hydrate-accumulation center with an initial saturation of about 9%. However, from 15 to 20 h, hydrate saturation at R9 increased by just about 1%. This is because methane supersaturation in the brine at R9 was not high enough for further hydrate growth. In addition, the formed hydrates reduced the porosity of sediments and the flow cross-sectional area at depth R9. As a result, the velocity of the upward brine was accelerated when it flowed through R9, which was also averse to hydrate accumulation. At 20 h, R4 became the second hydrate-accumulation center where hydrate saturation rapidly increased to 11.5%. This is because sediments at the top of reactor (Segment III) had a higher subcooling degree than that of the bottom part (Segment I), providing the highest theoretical methane supersaturation in brine. In the period of 34–35 h, hydrate saturation at growth center R9 reached 45%. Then, the permeability of the sediments decreased sharply, and the pressure difference between inlet and outlet increased to 9 MPa. It was very difficult for the fluid to pass through R9, so the residence time of brine in Segment I was further extended. With the continuous entrance of methane-containing brine, hydrates were formed and accumulated in Segment I, which blocked most of the pore channels as shown in Figure 6c, and caused a sharp rise in resistivity in R11 and R12, as shown in Figure 5a.
3.4. Permeability of Hydrate-Bearing Sediment
The permeability of hydrate-bearing sediments k was calculated by Dacy’s law
where is the flow rate, A is the cross-sectional area of the sample, µ is the dynamic viscosity of the brine, ΔP is the pressure difference, and L is the sample length.
Permeability evolution of the sediments is displayed in Figure 9a, which shows that permeability initially remained stable or was slightly decreased. Then, a sharp drop emerged at 16 h with total hydrate saturation of less than 10%. Finally, the curve tended to be stable again. From resistivity and morphology analysis, at the initial stage, the formed thin hydrate film or fine hydrate crystals had weak influence on sediment conductivity. Because of rapid hydrate growth and accumulation in the pores, hydrate particles converted to massive solid hydrates, causing a sharp decline in sediment permeability. Relative water permeability under different saturations in this study is shown in Figure 9b, which was compared with the predicted values of four models (capillary coating, capillary filling, grain coating, and pore filling) [29]. Experiment values were much less than those in the model prediction. The assumption of the four models is that hydrates were homogeneously distributed in the sediments, and hydrate saturation and pore habit controlled sediment permeability. Current experiment studies on hydrate formation and dissociation were always conducted in a static system (in situ synthesis of hydrate-bearing sediments in laboratory), which could easily obtain homogeneous hydrates. However, in this work, the formed hydrates were heterogeneously distributed in the sediments and preferentially accumulated in certain depths; thus, the exponential decline of sediment permeability was induced even at very low bulk hydrate saturation (10%). Similar unusual permeability characteristics of samples with heterogeneous hydrates were also observed by Okwananke et al. [33]. They found that hydrates preferentially occupied the large pores of silica sand core samples, which caused rapid reduction in sample permeability with an increase in hydrate saturation. Interestingly, they also found that higher saturation of methane hydrates could lead to relatively higher gas permeability for unconsolidated sand-clay core samples due to hydrate-forced heave phenomenon. These results indicated that studies on permeability of hydrate-bearing sediment should consider hydrate heterogeneity in sediments, as well as channel structures and hydrate pore habits.
4. Conclusions
Hydrate formation and accumulation from dissolved gas in sandy sediments along the migration direction of brine was investigated using a one-dimensional visual hydrate simulator. Electrical resistivity at all 12 depths experienced a three-stage evolution process, which indicated three morphologies of hydrates presented in the sediments. It was observed from the sapphire tube that hydrates initially formed as a thin film and then became a turbid colloidal solution; with hydrate growth occurring, the colloidal solution was finally converted to massive solid hydrates. The results of resistivity analysis indicated that the bottom–up direction of hydrate growth was consistent with the flow direction of brine, and two hydrate accumulation centers appeared successively in the sediments. The hydrates preferentially formed and accumulated in certain depths of the sediments, resulting in heterogeneous hydrate distribution. Analysis of the permeability of hydrate-bearing sediments indicated that the occurrence of heterogeneous hydrates could induce the exponential decline of sediment permeability even under low hydrate saturation. Studies on the permeability of hydrate-bearing sediment should consider hydrate heterogeneity in sediments.
Author Contributions
Conceptualization, N.L. and C.S.; methodology, N.L. and R.R.; validation, N.L.; formal analysis, N.L. and R.R.; investigation, R.R. and J.Z.; resources, C.S.; data curation, R.R.; writing—original draft preparation, R.R.; writing—review and editing, N.L. and C.S.; visualization, R.R.; supervision, C.S.; project administration, N.L. All authors have read and agreed to the published version of the manuscript.
Funding
This research was funded by the National Natural Science Foundation of China (nos. 51676207 and 51576209), the Research Foundation of China University of Petroleum, Beijing at Karamay (YJ2018B02007), and the Scientific Research Program of Universities in the Xinjiang Uygur Autonomous Region (XJEDU2019Y069).
Conflicts of Interest
The authors declare no conflicts of interest.
References
- Sloan, E.D.; Koh, C.A. Clathrate Hydrates of Natural Gases, 3rd ed.; CRC Press: Boca Raton, FL, USA, 2007. [Google Scholar]
- Milkov, A.V. Global estimates of hydrate-bound gas in marine sediments: How much is really out there? Earth-Sci. Rev. 2004, 66, 183–197. [Google Scholar] [CrossRef]
- Waite, W.F.; Santamarina, J.C.; Cortes, D.D.; Dugan, B.; Espinoza, D.N.; Germaine, J.; Jang, J.; Jung, J.W.; Kneafsey, T.J.; Shin, H.; et al. Physical properties of hydrate-bearing sediments. Rev. Geophys. 2009, 47, RG4003. [Google Scholar] [CrossRef]
- Li, X.S.; Xu, C.G.; Zhang, Y.; Ruan, X.K.; Li, G.; Wang, Y. Investigation into gas production from natural gas hydrate: A review. Appl. Energy 2016, 172, 286–322. [Google Scholar] [CrossRef] [Green Version]
- Yang, L.; Liu, Y.; Zhang, H.; Xiao, B.; Guo, X.; Wei, R.; Xu, L.; Sun, L.; Yu, B.; Leng, S.; et al. The status of exploitation techniques of natural gas hydrate. Chin. J. Chem. Eng. 2019, 27, 2133–2147. [Google Scholar] [CrossRef]
- Yin, Z.; Linga, P. Methane hydrates: A future clean energy resource. Chin. J. Chem. Eng. 2019, 27, 2026–2036. [Google Scholar] [CrossRef]
- Madden, M.E.; Ulrich, S.; Szymcek, P.; McCallum, S.; Phelps, T. Experimental formation of massive hydrate deposits from accumulation of CH4 gas bubbles within synthetic and natural sediments. Mar. Petrol. Geol. 2009, 26, 369–378. [Google Scholar] [CrossRef]
- Li, H.; Wei, N.; Jiang, L.; Zhao, J.; Cui, Z.; Sun, W.; Zhang, L.; Zhou, S.; Xu, H.; Zhang, X.; et al. Evaluation of experimental setup and procedure for rapid preparation of natural gas hydrate. Energies 2020, 13, 531. [Google Scholar] [CrossRef] [Green Version]
- Babu, P.; Yee, D.; Linga, P.; Palmer, A.; Khoo, B.C.; Tan, T.S.; Rangsunvigit, P. Morphology of methane hydrate formation in porous media. Energy Fuels 2013, 27, 3364–3372. [Google Scholar] [CrossRef]
- Fandiño, O.; Ruffine, L. Methane hydrate nucleation and growth from the bulk phase: Further insights into their mechanisms. Fuel 2014, 117, 442–449. [Google Scholar] [CrossRef] [Green Version]
- Ruffine, L. Exploring methane-hydrate formation and dissociation in geologic materials through laboratory experiments: Kinetic behavior and morphology. Fuel 2015, 141, 173–184. [Google Scholar] [CrossRef] [Green Version]
- Xue, K.H.; Yang, L.; Zhao, J.F.; Li, Y.H.; Song, Y.C.; Yao, S. The study of flow characteristics during the decomposition process in hydrate-bearing porous media using magnetic resonance imaging. Energies 2019, 12, 1736. [Google Scholar] [CrossRef] [Green Version]
- Chen, L.T.; Li, N.; Sun, C.Y.; Chen, G.J.; Koh, C.A.; Sun, B.J. Hydrate formation in sediments from free gas using a one-dimensional visual simulator. Fuel 2017, 197, 298–309. [Google Scholar] [CrossRef]
- Hyndman, R.D.; Davis, E.E. A mechanism for the formation of methane hydrate and seafloor bottom simulating_reflectors. J. Geophy. Res. 1992, 97, 7025–7041. [Google Scholar] [CrossRef]
- Buffett, B.; Zatsepina, O. Formation of gas hydrate from dissolved gas in natural porous media. Mar. Geol. 2000, 164, 69–77. [Google Scholar] [CrossRef]
- Tohidi, B.; Anderson, R.; Clennell, M.B.; Burgass, R.W.; Biderkab, A.B. Visual observation of gas-hydrate formation and dissociation in synthetic porous media by means of glass micromodels. Geology 2001, 29, 867–870. [Google Scholar] [CrossRef]
- Spangenberg, E.; Kulenkampff, J.; Naumann, R.; Erzinger, J. Pore space hydrate formation in a glass bead sample from methane dissolved in water. Geophys. Res. Lett. 2005, 32, L24301. [Google Scholar] [CrossRef]
- Spangenberg, E.; Kulenkampff, J. Influence of methane hydrate content on electrical sediment properties. Geophys. Res. Lett. 2006, 33, L24315. [Google Scholar] [CrossRef]
- Waite, W.F.; Spangenberg, E. Gas hydrate formation rates from dissolved-phase methane in porous laboratory specimens. Geophys. Res. Lett. 2013, 40, 4310–4315. [Google Scholar] [CrossRef]
- Li, X.S.; Yang, B.; Zhang, Y.; Li, G.; Duan, L.P.; Wang, Y.; Chen, Z.Y.; Huang, N.S.; Wu, H.J. Experimental investigation into gas production from methane hydrate in sediment by depressurization in a novel pilot-scale hydrate simulator. Appl. Energy 2012, 93, 722–732. [Google Scholar] [CrossRef]
- Lin, Z.; Dong, H.; Fang, H.; Sun, J.; Wang, X. Sensitivity Analysis of Rock Electrical influencing factors of natural gas hydrate reservoir in permafrost region of Qilian Mountain, China. Energies 2019, 12, 4592. [Google Scholar] [CrossRef] [Green Version]
- Priegnitz, M.; Thaler, J.; Spangenberg, E.; Rucker, C.; Schicks, J.M. A cylindrical electrical resistivity tomography array for three-dimensional monitoring of hydrate formation and dissociation. Rev. Sci. Instrum. 2013, 84, 104502. [Google Scholar] [CrossRef] [PubMed]
- Archie, G.E. The electrical resistivity log as an aid in determining some reservoir characteristics. J. Pet. Sci. Technol. 1942, 5, 1–8. [Google Scholar] [CrossRef]
- Priest, J.A.; Rees, E.V.L.; Clayton, C.R.I. Influence of gas hydrate morphology on the seismic velocities of sands. J. Geophys. Res. 2009, 114, B1205. [Google Scholar] [CrossRef] [Green Version]
- Nimblett, J. Permeability evolution during the formation of gas hydrates in marine sediments. J. Geophys. Res. 2003, 108, B10. [Google Scholar] [CrossRef]
- Konno, Y.; Yoneda, J.; Egawa, K.; Ito, T.; Jin, Y.; Kida, M.; Suzuki, K.; Fujii, T.; Nagao, J. Permeability of sediment cores from methane hydrate deposit in the Eastern Nankai Trough. Mar. Petrol. Geol. 2015, 66, 487–495. [Google Scholar] [CrossRef]
- Boswell, R.; Collett, T.S. Current perspectives on gas hydrate resources. Energy Environ. Sci. 2011, 4, 1206. [Google Scholar] [CrossRef]
- Ren, X.; Guo, Z.; Ning, F.; Ma, S. Permeability of hydrate-bearing sediments. Earth-Sci. Rev. 2020, 202, 103100. [Google Scholar] [CrossRef]
- Kleinberg, R.L. Deep sea NMR: Methane hydrate growth habit in porous media and its relationship to hydraulic permeability, deposit accumulation, and submarine slope stability. J. Geophys. Res. 2003, 108, B9. [Google Scholar] [CrossRef]
- Duan, Z.H.; Mao, S.D. A thermodynamic model for calculating methane solubility, density and gas phase composition of methane-bearing aqueous fluids from 273 to 523 K and from 1 to 2000 bar. Geochim. Cosmochim. Acta 2006, 70, 3369–3386. [Google Scholar] [CrossRef]
- Hassanpouryouzband, A.; Yang, J.; Tohidi, B.; Chuvilin, E.; Istomin, V.; Bukhanov, B.; Cheremisin, A. CO2 Capture by Injection of Flue Gas or CO2–N2 Mixtures into Hydrate Reservoirs: Dependence of CO2 Capture Efficiency on Gas Hydrate Reservoir Conditions. Environ. Sci. Technol. 2018, 52, 4324–4330. [Google Scholar] [CrossRef]
- Hassanpouryouzband, A.; Yang, J.; Tohidi, B.; Chuvilin, E.; Istomin, V.; Bukhanov, B.; Cheremisin, A. Geological CO2 capture and storage with flue gas hydrate formation in frozen and unfrozen sediments: Method development, real time-scale kinetic characteristics, efficiency, and clathrate structural transition. ACS Sustain. Chem. Eng. 2019, 7, 5338–5345. [Google Scholar] [CrossRef]
- Okwananke, A.; Hassanpouryouzband, A.; Farahani, M.V.; Yang, J.; Tohidi, B.; Chuvilin, E.; Istomin, V.; Bukhanov, B. Methane recovery from gas hydrate-bearing sediments: An experimental study on the gas permeation characteristics under varying pressure. J. Petrol. Sci. Eng. 2019, 180, 435–444. [Google Scholar] [CrossRef]
Figure 1.
One-dimensional visual hydrate simulator. 1: sapphire tube; 2, 9: pressure transducer; 3, 6: interface chamber; 4: gas-supply cylinder; 5: constant flow pump; 7: coiler; 8: warm bath; 10: resistance temperature detectors.
Figure 1.
One-dimensional visual hydrate simulator. 1: sapphire tube; 2, 9: pressure transducer; 3, 6: interface chamber; 4: gas-supply cylinder; 5: constant flow pump; 7: coiler; 8: warm bath; 10: resistance temperature detectors.

Figure 2.
Hydrate-formation system.

Figure 3.
Methane solubility in brine calculated by Duan’s model [30].
Figure 3.
Methane solubility in brine calculated by Duan’s model [30].

Figure 4.
Pressure variation in reactor during hydrate formation.

Figure 5.
Electrical-resistivity evolution at different depths in sediments: Electrical resistivity distribution in (a) Segment I, (b) Segment II, and (c) Segment III.
Figure 5.
Electrical-resistivity evolution at different depths in sediments: Electrical resistivity distribution in (a) Segment I, (b) Segment II, and (c) Segment III.

Figure 6.
Hydrate morphologies in sediments of segment I: (a) thin hydrate film gradually emerged on inner walls of sapphire tube; (b) formed hydrates presented as turbid colloidal solution accumulated in top part of sapphire tube; (c) massive solid hydrates filled up pore space; (d) dispersed hydrates vanished in pore space.

Figure 7.
Variation of bulk hydrate saturation in sediments.

Figure 8.
Hydrate-saturation distribution in sediments at different times.

Figure 9.
Permeability and relative water permeability of hydrate-bearing sediments: (a) Variation of permeability during hydrate formation in the sediments. (b) Comparison of relative water permeability under different hydrate saturations between experiment and predicted values.
Figure 9.
Permeability and relative water permeability of hydrate-bearing sediments: (a) Variation of permeability during hydrate formation in the sediments. (b) Comparison of relative water permeability under different hydrate saturations between experiment and predicted values.


Table 1.
Experiment conditions in this study.
| Items | Value |
|---|---|
| Pressure | 7.4 MPa |
| Interface chamber temperature | 284 K |
| Sediment temperature | 280 K |
| Warm-bath temperature | 282 K |
| Sediment porosity | 0.39 |
| Flow rate | 105 cm3/min |
| Aqueous brine | 3.5 wt % |
© 2020 by the authors. Licensee MDPI, Basel, Switzerland. This article is an open access article distributed under the terms and conditions of the Creative Commons Attribution (CC BY) license (http://creativecommons.org/licenses/by/4.0/).
Share and Cite
MDPI and ACS Style
Li, N.; Rehemituli, R.; Zhang, J.; Sun, C. One-Dimensional Study on Hydrate Formation from Migrating Dissolved Gas in Sandy Sediments. Energies 2020, 13, 1570. https://doi.org/10.3390/en13071570
AMA Style
Li N, Rehemituli R, Zhang J, Sun C. One-Dimensional Study on Hydrate Formation from Migrating Dissolved Gas in Sandy Sediments. Energies. 2020; 13(7):1570. https://doi.org/10.3390/en13071570
Chicago/Turabian StyleLi, Nan, Rezeye Rehemituli, Jie Zhang, and Changyu Sun. 2020. "One-Dimensional Study on Hydrate Formation from Migrating Dissolved Gas in Sandy Sediments" Energies 13, no. 7: 1570. https://doi.org/10.3390/en13071570
Note that from the first issue of 2016, this journal uses article numbers instead of page numbers. See further details here.