Li-Ion Battery Performance Degradation Modeling for the Optimal Design and Energy Management of Electrified Propulsion Systems


1
Department of Mechanical Engineering, Institute for Integrated Energy Systems, University of Victoria, Victoria, BC V8W 2Y2, Canada
2
State-assigned Electric Vehicle Power Battery Center, Beijing 100072, China
*
Author to whom correspondence should be addressed.
Energies 2020, 13(7), 1629; https://doi.org/10.3390/en13071629
Submission received: 1 March 2020
/
Revised: 18 March 2020
/
Accepted: 20 March 2020
/
Published: 2 April 2020
(This article belongs to the Special Issue Energy Storage Systems for Electric Vehicles)
Abstract
:Heavy-duty hybrid electric vehicles and marine vessels need a sizeable electric energy storage system (ESS). The size and energy management strategy (EMS) of the ESS affects the system performance, cost, emissions, and safety. Traditional power-demand-based and fuel-economy-driven ESS sizing and energy management has often led to shortened battery cycle life and higher replacement costs. To consider minimizing the total lifecycle cost (LCC) of hybrid electric propulsion systems, the battery performance degradation and the life prediction model is a critical element in the optimal design process. In this work, a new Li-ion battery (LIB) performance degradation model is introduced based on a large set of cycling experiment data on LiFePO4 (LFP) batteries to predict their capacity decay, resistance increase and the remaining cycle life under various use patterns. Critical parameters of the semi-empirical, amended equivalent circuit model were identified using least-square fitting. The model is used to calculate the investment, operation, replacement and recycling costs of the battery ESS over its lifetime. Validation of the model is made using battery cycling experimental data. The new LFP battery performance degradation model is used in optimizing the sizes of the key hybrid electric powertrain component of an electrified ferry ship with the minimum overall LCC. The optimization result presents a 12 percent improvement over the traditional power demand-driven hybrid powertrain design method. The research supports optimal sizing and EMS development of hybrid electric vehicles and vessels to achieve minimum lifecycle costs.
1. Introduction
With the increasing concerns on the emissions of greenhouse gases (GHG) and other air pollutants, the automotive and marine industry are adopting hybrid electric or pure electric propulsion systems for vehicles and marine vessels with large onboard battery energy storage system (ESS) at an increasing pace. Today lithium-ion batteries (LIBs) become the primary type of batteries used in various electric ESS due to their significant longer life and much higher energy density. Among different kinds of LIBs, the LiFePO4 (LFP) battery has been widely used in heavy-duty transportation applications, due to its lower cost and non-toxicity, well-defined performance, better long-term stability, and capability to fit for more extensive variations in temperature. The service life of battery ESSs is a critical issue for various types of electrified vehicles (EV), as well as their marine counterparts. Considerable efforts have been devoted to capturing the performance degradation and extending the operating life of batteries. However, there are limited efforts on the quantitative analysis of how battery capacity loss would influence the optimization on the sizing of key powertrain components and the powertrain energy management system (EMS), and how improperly sized powertrain components and an inflexible EMS would accelerate the battery capacity loss.
Large vehicles, ships and smart local power grids share a common feature that is entirely different from conventional passenger cars and light trucks, having case-dependent driving and load cycles and an enormous energy demand. The high power and energy requirements of those applications can significantly aggravate the total cost of hybrid electric propulsion systems with a large battery ESS. Though the price of LIBs has been considerably reduced in recent years, it is still one of the most expensive components in the hybrid electric and pure electric propulsion systems, compared to the internal combustion engines (ICE) and electrical machines (EM), etc. [1]. The battery ESS is also the component with the shortest life in the powertrain system, likely needing replacements. The lifecycle cost of battery ESSs includes investment, operation, replacements, and recycling costs. The cost and performance of battery ESSs remain the main concerns of adopting hybrid electric propulsion for heavy-duty vehicular and marine applications. Optimal sizing and energy management of battery ESSs can reduce the overall lifecycle costs (LCC) of the electrified propulsion system of the vehicle or vessel, and these tasks cannot be accomplished without an accurate battery performance degradation model to predict its deterioration rate and the remaining useful life (RUL) of the batteries.
The performance degradation of LIBs are relevant to battery materials, manufacturing quality, use patterns, and many other factors. The anode and cathode materials used in the LIB are the main factors that determine battery performance, and hence the degradation during the use of the battery [2,3,4]. With lower cost and the ability to resist thermal runaway at elevated temperatures, the LFP battery is popular for light vehicles and the dominant choice for heavy-duty transportation applications. The use pattern of a LIB, determined by the operating temperature, charge and discharge currents, stage of charge (SOC) variation in a cycle, working time, etc., can prominently affect the degradation rate and life of the LIB. Specifically, battery life can be categorized into cycle life and calendar life, in which the battery will be charged/discharged, and stored, respectively. Battery cycle life performance degradation is an inevitable process that happens right after the first charge/discharge process. The capacity of a battery will be reduced due to many reasons. The formation of a solid electrolyte layer (SEI) on carbon-based anodes, though it can help the active carbon material resist further corrosion from the electrolyte, will consume available cyclic ions and increase cell impedance [5]. Ramadass, et al. [6] showed that battery film resistance rises with the cycling numbers. Furthermore, it has been concluded that battery cyclic capacity fading has a direct link with the thickness of the SEI layer [7]. The loss of available lithium is the main reason for cyclic capacity decay. Moreover, microscopic electrochemical side reactions happen all the time inside the battery, leading to reduced calendar life [5].
Temperature, SOC, and operating current rate are key elements causing battery performance degradation. Operations under high temperatures not only aggravate side reactions and material exfoliations but also cause battery deformation and affect the battery’s overall performance [8]. Storage of a battery at an elevated temperature can also accelerate the decay of its calendar life [9]. Battery charging at a low temperature below −10 ºC decreases its reaction rate, causing Li plating along the carbon surface. Dendritic Li plate not only consumes available capacity but also can penetrate the separator and cause inner short circuit [10]. The charge and discharge current rate () is another factor that profoundly affects battery life. If a battery is cycled at a higher current rate, a large amount of Li ions will accumulate on the surface of active materials over a short time. If the diffusion process of ion is restricted, dendrite Li might be generated [11]. Low , on the other hand, is more favorable for safer performance and longer life. The SOC indicates the percentage of remaining energy that the battery can release compared to the rated capacity. The range of SOC variation in a cycle, referred to as the depth of discharge (DOD), can also affect battery life. Higher DOD means harsher usage of the battery, thus accelerating its degradation [12]. Battery performance degradation, might be caused by the loss of active material (LAM) of electrodes, the loss of lithium inventory (LLI), and the increase of the internal resistance of the cell [13]. The observed degradation involves complicated electro-chemical processes, making its mathematical quantification very difficult. All of the stated factors must be considered if an accurate performance degradation model is to be introduced to predict the remaining lifetime of the battery under given operating conditions.
The models for capturing battery performance degradation and predicting its RUL can be classified into the chemistry-physics-based models, or the data-driven, machine-learning-based models. In the physics-based models, mechanical fatigue and chemical degradation are mathematically quantified individually [12] or jointly [14]. The thermal analysis [15] and electro-thermal coupled modelling [16] of LIBs can reveal how temperature affects battery capacity fading. The commonly-used semi-empirical modelling method is based on the Arrhenius kinetics equations, such as those reported by Bloom, Cole, Sohn, Jones, Polzin, Battaglia, Henriksen, Motloch, Richardson and Unkelhaeuser [12] and Wang, et al. [17]. More detailed molecular or atomist models were introduced to describe the electrochemical reactions and represent battery degradation at a fine-grained level [18,19]. However, the complexity of an electrochemical model usually led to intensive computation, making their applications in real-time energy management difficult. The data-driven modelling method was introduced recently with the advance of machine-learning techniques [13,20]. However, the complete ignorance of the battery degradation mechanism and the complex inter-linked factors inside of the machine-learning models may result in irrational prediction outcomes, and the approach requires careful verification and review for even a slightly different batch of products. Many researchers focused on modelling the battery capacity fading at different operating temperatures [9,21], different SOC [22], or their combinations [23]. These modelling methods require a significant amount of battery test data [17,24] to cover different current rates, temperatures, and depth of discharges, but the time and efforts needed to conduct these costly experiments remain a significant challenge.
In developing a hybrid electric propulsion system, determining the optimal powertrain component sizes, particularly of the engine and battery ESS, and developing the optimal power control and energy management strategy (EMS) are significant challenges. The design of other powertrain and power system components, such as electric machines and power electronic converters, are directly related to the engine and the ESS. The growing level of powertrain hybridization with increased battery capacity for achieving better fuel efficiency and emission improvements further demands the optimal sizing of powertrain components and optimal EMSs. The performance degradation of the LIB heavily influences the system performance and LCC of the propulsion system. However, there is not yet a systematic approach to link battery performance degradation to the optimal design and control of hybrid electric propulsion systems at present, due to the lack of an accurate battery performance degradation model [25,26].
This research focuses on the introduction of an accurate LIB performance degradation and life prediction model that can be used to support optimal component sizing and energy management of hybrid electric propulsion systems. Specifically, the special cycling experiments and data analysis of a typical LFP battery is presented; a battery performance degradation and life prediction model using the obtained experimental data and other supplementary data is introduced, and the use of the newly introduced battery performance degradation and life prediction model in optimizing the ESS design and EMS development of a hybrid electric propulsion system of a ferry ship is demonstrated. The LCC improvements in the globally optimized hybrid propulsion system compared to the pure energy efficiency driving hybrid system (without considering battery performance degradation), and compared to the conventional mechanical propulsion system are presented to demonstrate the benefits of the new method.
2. Battery Performance Degradation Experiments
2.1. Design of the Experiments
In this work, sample commercial lithium-ion phosphate/graphite (LFP/C) prismatic cells with 18 Ah nominal capacity, produced by Liyuan New Energy, were used in the extensive battery cycling tests at the State-assigned Electric Vehicle Power Battery Testing Center in Beijing, China. These cells are designed and built for hybrid and pure electric vehicular and marine propulsion applications. The detailed specifications of tested LFP batteries are given in Table 1.
The main purposes of the tests include (a) measuring battery capacity deterioration through repeated cycling profiles; (b) supporting battery modelling for the quantitative prediction of battery performance degradation rates under different use patterns; and, (c) accurately predicting the (remaining) operation life of the battery in a hybrid electric propulsion system under a given load profile. Two types of charge and discharge profiles were used in these tests, the cycling test profile and the capacity test profile. Both types of tests were conducted repeatedly in the environmental chambers with a controlled temperature at 25 ºC. These battery test cycles consisted of four steps (a) charging at the designed constant current (CC) followed by a constant voltage (CV) until the current reaches 0; (b) resting for 20 minutes; (c) discharging at the designed CC until the cut-off voltage is reached; and (d) resting for 20 minutes. The cut-off voltage, as shown in Table 1, is 3.6 V for charging and 2.5 V for discharging.
The cycling tests were performed at 1 C charge and 2 C discharge current rates and the capacity tests were performed at 1/3 C charge and 1/3 C discharge rates, respectively. As usual, 1 C means fully discharging the battery in 1 hour. The higher current rate (or ) can reduce experimental time, while the lower can better measure the available battery capacity. The tested battery went through 25 cycling tests, followed by a capacity test until the battery reaches its end-of-life (EOL). Following the general rule used by the automotive industry, the battery’s EOL is defined as the state at which the measured charge/discharge capacity of the battery falls to 80 percent of its nominal capacity, and the battery needs to be replaced. The cycling test only needs about 25 percent of the time for conducting a capacity test, leading to much-reduced experiment time. Moreover, the cut-off voltage during 2 C discharge in the cycling tests was defined at 3.0 V to prevent potential over-discharge under the high current rate.
2.2. Experiment Results and Data Analysis
The open-circuit voltages, of fresh LFP batteries under charges and discharges were measured under low current rate (1/50 C) before the start of the cycling tests. Based on the measured voltage variations at such a low current, the differential voltage for capacity analysis could be carried out. The voltage variation vs. capacity variation, dV/dQ, at different battery SOCs showed distinct peaks as illustrated in Figure 1. These peaks revealed the anode (C) and cathode (LFP) material phase transitions during ion’s intercalation and de-intercalation, and also visually qualified the total capacity that this battery can store at its beginning-of-life (BOL). As the battery is cycled from its BOL to the EOL, these peaks would shift due to the structural deterioration of the active material and capacity reduction.
The tested battery terminal voltage was measured in each cycle under designed testing profiles. Testing data obtained during the first 2000 test cycles were used in the performance degradation modelling and validation. A few typical capacity cycling test data under the 1/3 C current rate were plotted in Figure 2. The experiment results showed that with the increase in cycling number, experimental time became shorter, indicating that the battery’s maximum capacity, , became lower and therefore less energy could be stored. The reduced cell voltage with higher cycling numbers indicated increased inner resistance.
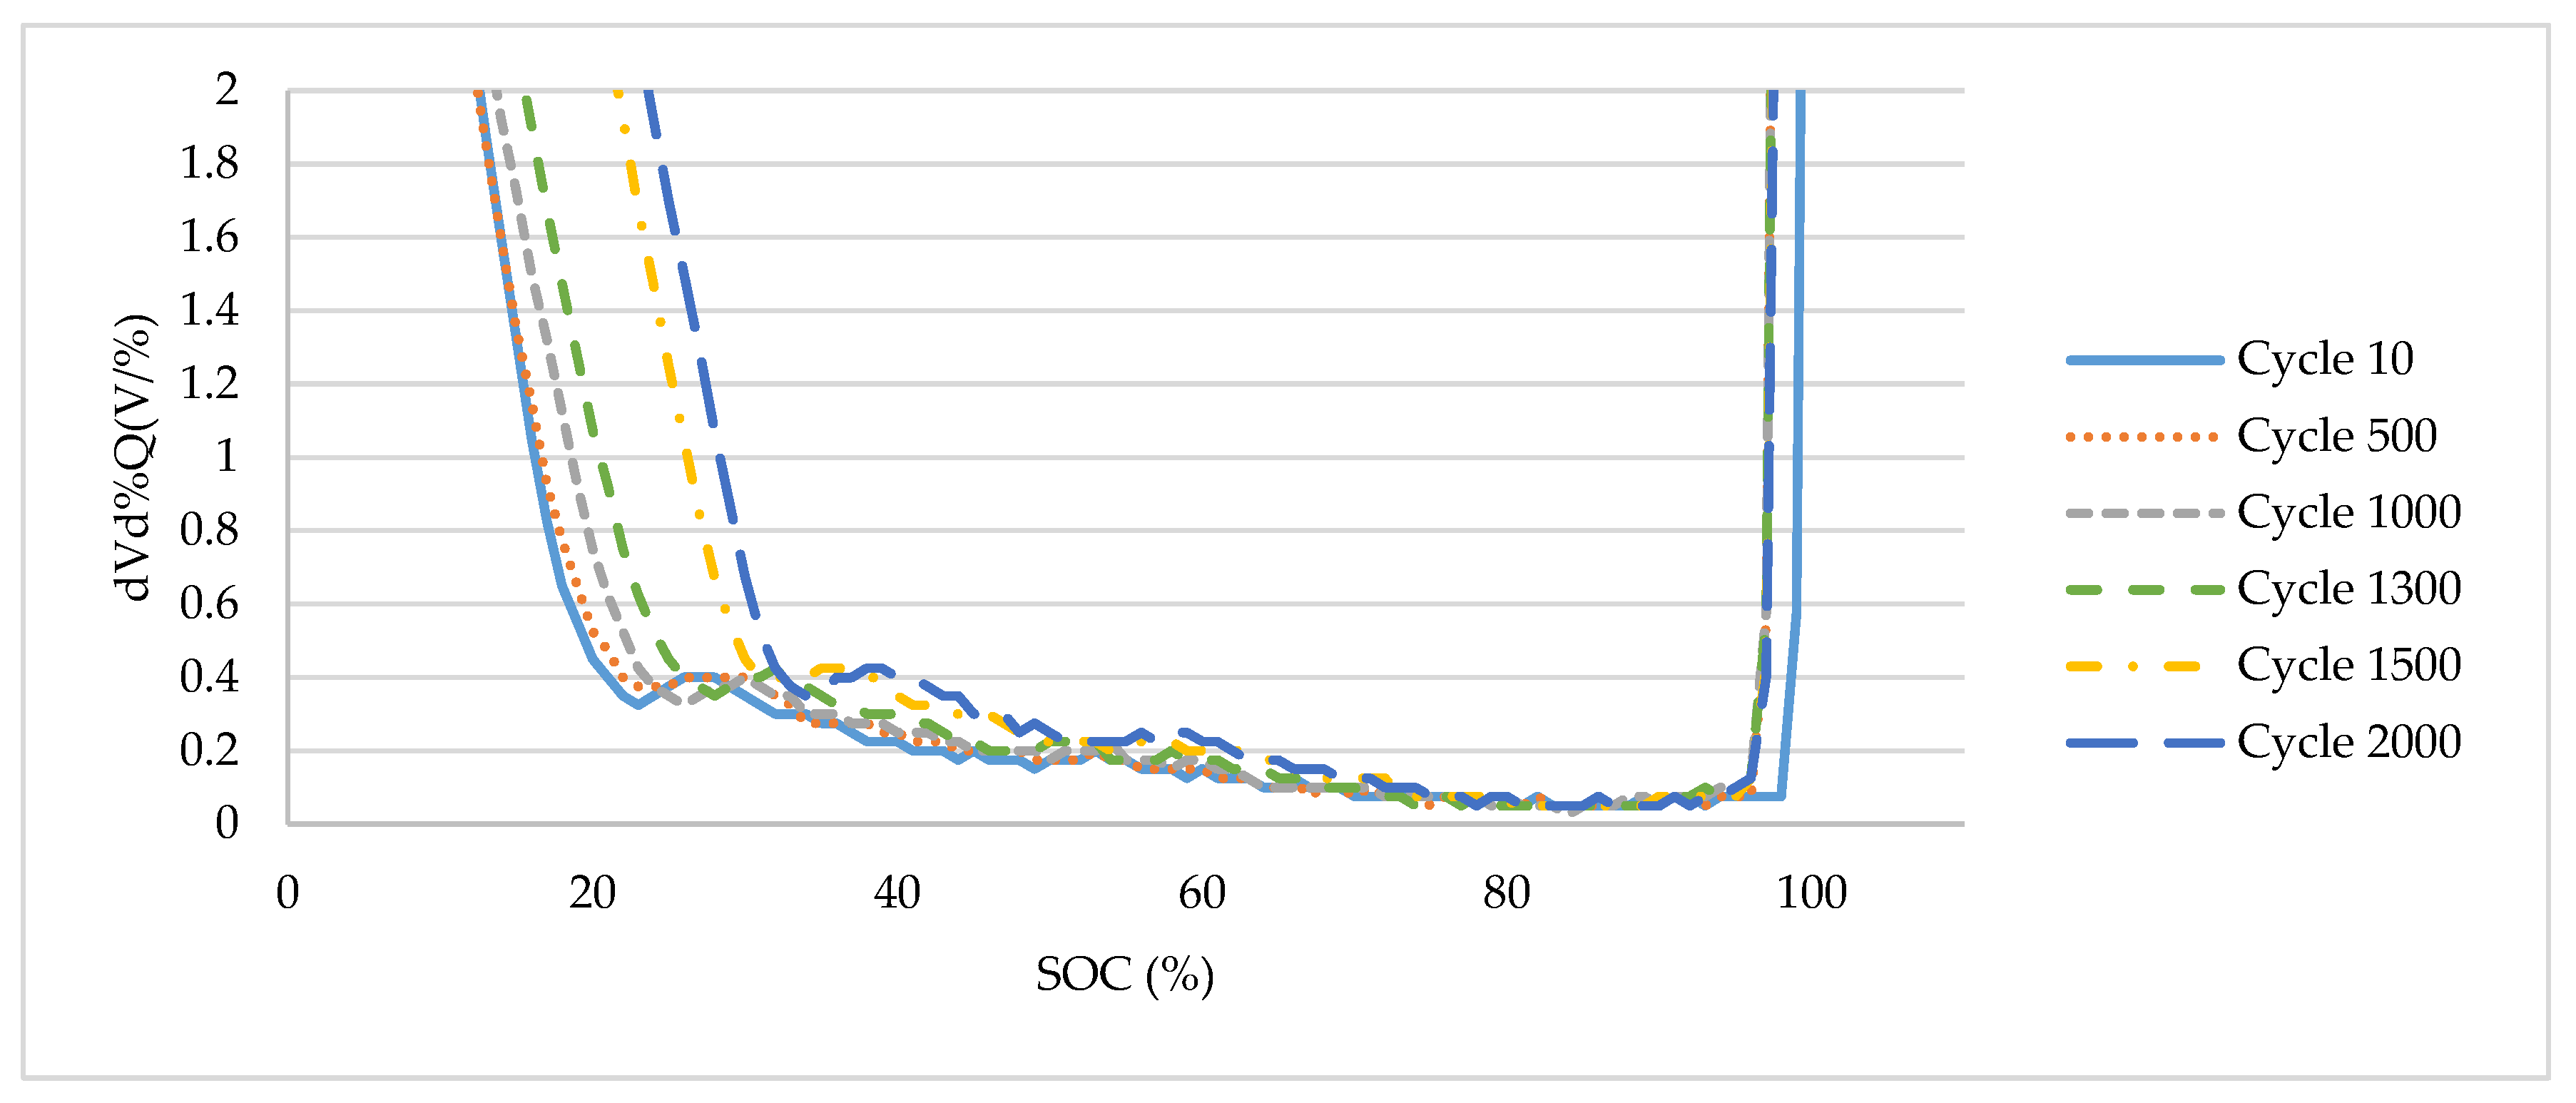
The capacity loss during battery cycle life tests can also be revealed by the differential voltage analysis, i.e., the dV/dQ ratio of the discharge profiles recorded at a different number of cycles. Figure 3 shows the variations of the differential voltage of the tested C-LFP battery, cycled from its BOL to EOL at 1/3 C rate. The small peaks of the dV/dQ curves at the bottom shifted to the center as the number of the charge/discharge cycle increased, leading to a narrower span of the curve with a reduced distance between the two boundaries, indicating capacity reduction [14].
The measured discharge capacity of tested LIB exhibited a clear decreasing trend as the cycling numbers grew, as shown in Figure 4.
The level of battery performance degradation is indicated using a measure of battery state of health (SOH) in this work. The SOH value measures the ratio of the actual maximum capacity of a battery at time t over the rated capacity of the fresh cell. When the SOH decreases to 80%, the battery is considered as a dead battery for the transportation applications and is to be replaced to meet the required power and/or energy demands of the applications.
where is the maximum available discharge capacity a battery can provide when fully charged at 100% SOC. is the rated capacity specified by the battery manufacturer, which is 18 Ah in this study.
The SOC of a battery indicates the remaining available capacity and can be affected by the current maximum capacity. The actual maximum capacity will gradually decrease during the usage due to its ageing phenomena, as shown in Figure 5. For a fresh battery, is equal to the rated capacity .
where to are the start and end time of each cycle (s); is the time step (s); is the initial SOC at the beginning; is the current (A) which is a function of time, assuming discharge current is positive and charge current is negative; is the maximum battery capacity (Ah).
The cycle-induced capacity loss , as the ratio of the battery’s reduced capacity to its nominal capacity, is directly linked to the battery’s ampere-hour throughput (Ah-throughput, or ). Ah-throughput represents the total amount of electric charge of the battery during cycling [24], and acts as a critical factor in measuring the cyclic capacity loss. The value of is calculated by:
where is the depth of discharge , and is the cycle numbers.
The relation of measured capacity loss and Ah-throughput from test data is plotted in Figure 5, showing a clear trend of battery performance degradation.
In the experiments, 2095 cycles of battery testing data have been obtained, including about 2019 sets of cycling tests under a 1 C/2 C charge/discharge current and 76 sets of capacity test data under a 1/3 C charge and discharge current. The 76 sets of capacity test data were used to build the battery performance degradation model which will be discussed in detail in the following section. Among them, about 80% of the data (60 cycles) have been used for building the performance degradation model, shown as the blue dots in Figure 5, while the rest 20% of the test data (16 cycles) were used for modelling accuracy validation, shown as the orange triangles in Figure 5. The sudden change of the cycle-induced capacity loss and sharp capacity loss at around 25,000 Ah might be caused by the cycle-induced material deterioration of the specific LFP battery that was tested.
3. Battery Performance Degradation and Life Prediction Model
The purpose of introducing a battery performance degradation model is to accurately predict the operation life and resulting lifecycle cost of the battery under different given operating temperatures and use patterns. In recent years, considerable research efforts have been devoted to understanding the influence of temperature on battery performance and operating life, and to develop effective thermal management techniques to allow the battery ESS to operate within the desired range of temperature. This work thus focuses on modelling the influence of use patterns on the operating life and resulting lifecycle cost of batteries. Due to the many influencing factors and the not yet fully understood performance decay mechanism of batteries’ charge and discharge operations, generation of the model is largely based on experimental data, either by fitting a semi-empirical, multiphysics model [12,19], or by training an artificial neural network (ANN) using machine learning techniques [13]. The semi-empirical, multiphysics model combines generic formula related to the degradation mechanism and detailed model parameters determined by the battery test data, providing a relatively accurate and straightforward modelling method as used in this work. The RUL of a battery under different use patterns is modelled by combining the battery testing data obtained in this research and the results from the literature [24].
The development of performance degradation models for Li-ion batteries has been reported in many pieces of literature, forming three main categories:
- The empirical modelling method that is primarily used in the early study stage of LIB development due to its simplicity [12].This modelling method requires a large amount of experimental data and does not have broad applications.
- The equivalent circuit model that is capable of capturing the dynamic behaviors of the battery using resistance and capacitance to represent battery charge/discharge characteristics [27].These models are of the semi-empirical, multiphysics type.
- The electrochemical models that simulate the electrochemical reactions using time and space coupled partial differential equations to describe the ion diffusion process, overall potential variation, and current distribution during the charge and discharge of the battery.This type of model includes the Doyle–Fuller–Newman model [28], the pseudo-two-dimensional model [29], and the single particle model [30]. However, the use of these more detailed and more accurate models require extensive numerical computations, thus they are not suitable to serve as an element in the algorithms for hybrid powertrain control and battery energy management.
The two-order, equivalent circuit battery performance model is thus amended to form the new model for predicting battery performance degradation in this work. This amended equivalent circuit performance model is used later for the design and control optimization of hybrid electric powertrain systems. As shown in Figure 6, the variation of battery capacity and resistance can affect battery voltage and SOC calculation in each cycle carried out using the equivalent circuit performance model. The calculation results are fed into the semi-empirical life prediction model to obtain the estimated remaining useful cycle life.
3.1. Amended Equivalent Circuit Performance Model
In the equivalent circuit model, the two resistor-capacitor (RC) electrical circuits represent the activation and concentration depolarizations during battery charge and discharge operations. The Ohmic resistance is decided by the internal resistance, . At any required current, , the voltage drops for each element can be calculated by:
where , , and are voltage drops caused by the first RC circuit ( and ), the second RC circuit ( and ) and the inner resistance ().
The battery output voltage () is determined by the Kirchhoff’s law:
where is the open-circuit voltage. The discharge and charge of an LFP battery is plotted in Figure 1.
The six parameters of the equivalent circuit model, , , are determined by fitting the battery testing data with minimum root-mean-squared error (RMSE) between the measured voltage and model output voltage.
where is the measured output voltage, is the model simulated output voltage, are the unknown parameters, i is the time step from 1 to n, and is the constraint on the design variables.
The genetic algorithm (GA) heuristic global optimization algorithm was used to solve the RMSE minimization problems and to deal with the noise of the test data, as is widely reported [28,30,31]. The algorithm searched all possible solutions and the best results were identified for all unknown parameters. The variation of battery maximum capacity, , and inner resistance, , at different numbers of cycles is plotted in Figure 7.
3.2. Battery Remaining Lifetime Prediction
The combined study of battery SOC (in each mission cycle with varying ) and SOH (over the battery lifespan) is important to estimate battery RUL under different use patterns. The cycle life experiment in this study is for battery cycled at 1C charge and 2C discharge for 100 percent DOD, therefore, the RUL prediction may not be valid for other charges/discharge patterns. However, to conduct experiments at a continuously varying current (e.g., from 0.5C to 3C), DOD (e.g., from 10 to 100 percent) and operating temperature would cost years of testing, causing such experiments to become infeasible. The lack of complete experimental data would be an obstacle to building accurate battery performance and life prediction models.
This research utilized the 2000 cycling data acquired above and other accessible experimental results of LFC/C battery from well-cited literatures to deal with the scarcity of battery performance degradation data, including cycle-life experiments from Wang, Liu, Hicks-Garner, Sherman, Soukiazian, Verbrugge, Tataria, Musser and Finamore [24], Deshpande, Verbrugge, Cheng, Wang and Liu [14], and Han, et al. [32] to build the LFP battery cycle life prediction model. These researchers have identified and successfully illustrated the key features of cycle-induced battery performance degradation under different cycling patterns. According to previous studies, the calendar life of the battery has a minor influence on performance degradation [33,34], therefore, it has not been considered in the new model. It was assumed that the operating temperature of the batteries could be adequately controlled by the advanced thermal management system of the hybrid electric vehicles and vessels.
The proposed model has considered both voltage and capacity decay in estimating the remaining cycling numbers of a battery. Based on Arrhenius kinetics, the capacity fading rate is affected by the previously discussed factors. The earlier study [33] modelled the battery capacity loss by:
where, and are pre-determined coefficients; is the coefficient of ; is ideal gas constant; and, is the temperature in .
After combining the capacity loss model with a previously defined Ah-throughput equation, the remaining cycling number of battery () can be derived based on the previous function:
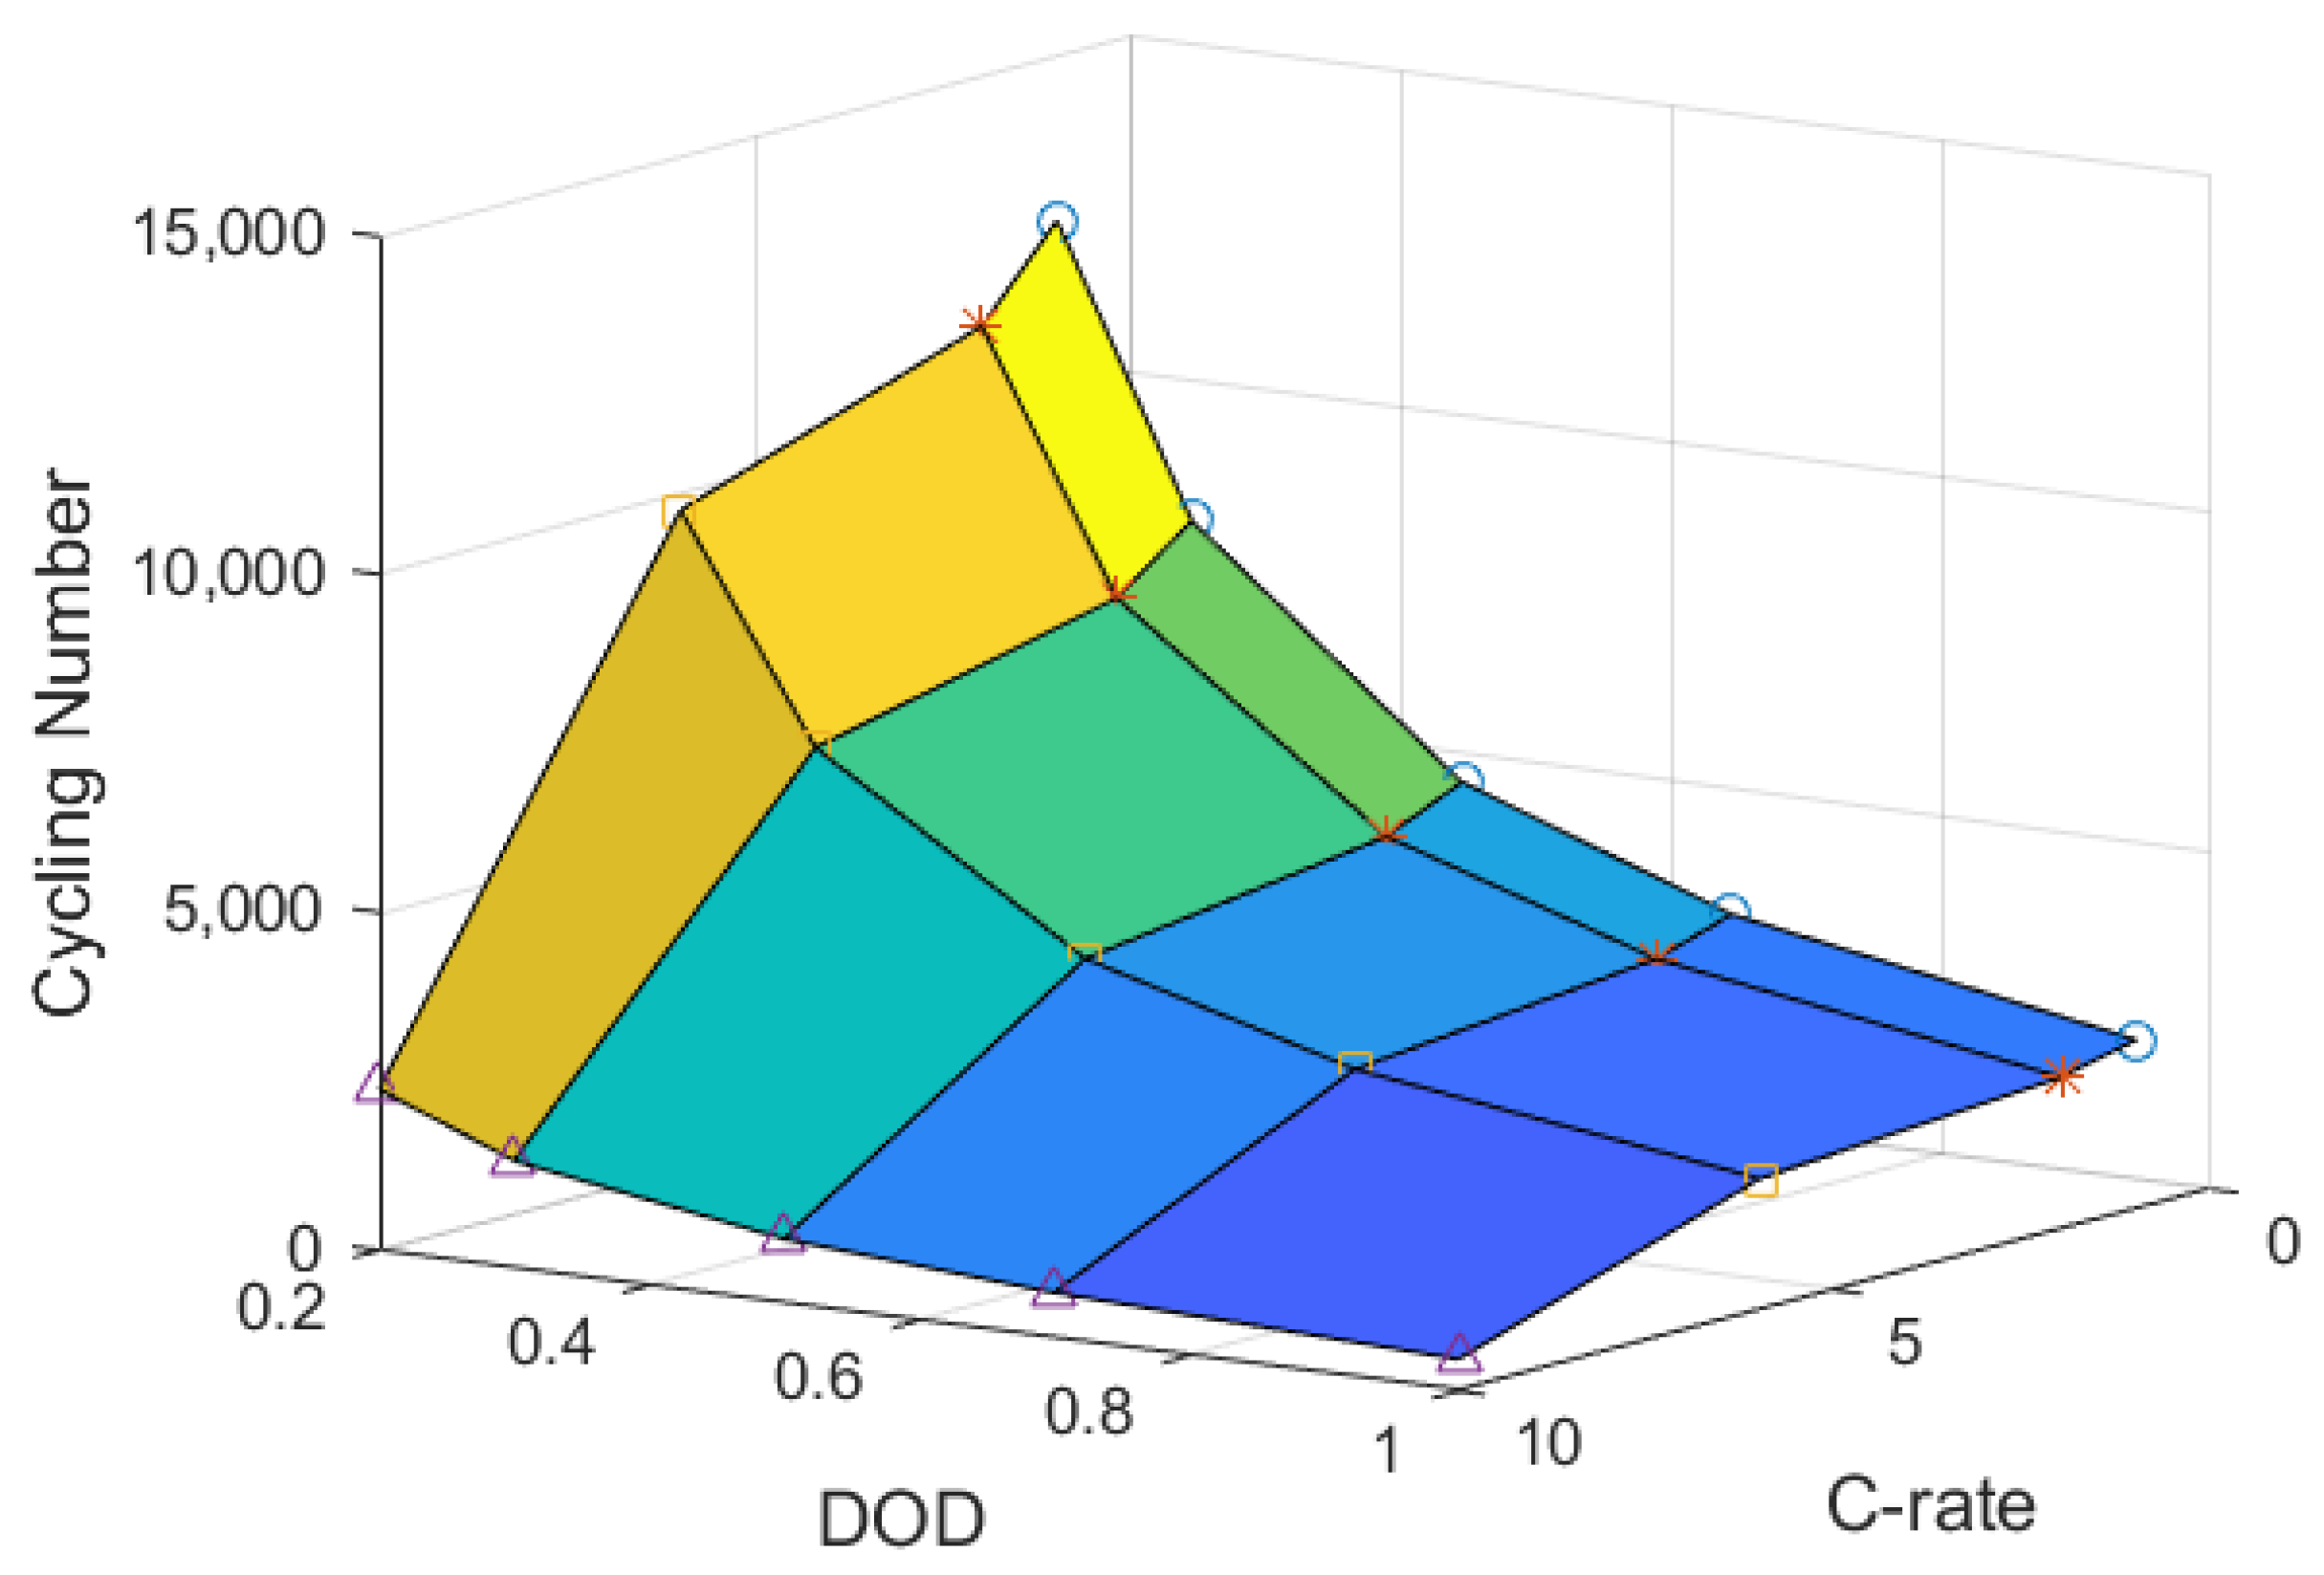
The newly introduced battery life prediction model was implemented in MATLAB/Simulink. The result of total cycling number for the LFP battery, as a function of and , is shown in Figure 8.
The performance degradation rate in the LIB cycling lifespan can be predicted using the battery performance model, and the RUL can be calculated using the resulting life prediction model. The former model calculates the battery performance (include current, voltage, SOC, etc.) under a given charge/discharge profile with updated maximum available capacity . The predicted results are fed into the life prediction model to estimate the remaining cycling numbers under the accumulated deterioration.
The performance degradation of the battery ESS under different use patterns was compared and shown in Figure 9. Harsh use of the battery with a discharge current rate of 2C at 100% DOD would result in fast capacity decay, as shown by the blue dash curve. The life of the battery would be extended if the battery was used gently by reducing the discharge current rate or operating time, as shown by the other two curves. This quantitative model shows that a more conscious use of the battery ESS may be an effective way to strike the best balance between reducing engine fuel consumption and lowering the cost induced by the shortening of battery life due to aggressive battery charges/discharges in a hybrid electric propulsion system. The quantitative model also supports the more appropriate engine and battery ESS sizing in a hybrid powertrain to form the globally optimal design solution considering the investment, operation, and replacement costs over the entire lifecycle.
3.3. Model Validation
In this work, about 2000 sets of experimental cycle data of a commercialized LFP battery have been acquired and used. A large portion (80%) of the capacity test data have been used to build the battery performance degradation model, and the remaining 20% of data have been used to validate the accuracy of the introduced models. The life prediction model under different discharging and DOD has been built for calculating the remaining useful cycle life of the LFP battery. The predicted capacity loss () from the RUL model and the battery testing data are shown in Figure 10. In this figure, the data points labelled as blue dots were used to build the model, and the data points represented by the yellow triangles were the original test data for model validation.
The predicted capacity losses at the very beginning of battery life were slightly higher than the measured results. When the capacity deteriorates over 10%, the predicted results showed slightly lower than the measured values. Ideally, these results would be equal to the measured data, as indicated by the ideal diagonal line. Overall, the absolute mean percentage error of developed LIB performance degradation and the life prediction model is about 13%.
4. An Application Example–Lifecycle Cost-based Design Optimization of a Hybrid Electric Ferry Ship
Li-ion battery ESSs are one of the critical components in a hybrid electric marine propulsion system. With the battery performance degradation model, the actual life of a given size ESS under the specific operation profile of the vehicle or vessel can be predicted. Thus, the initial investment cost, replacement cost, operation cost, and recycling cost of the battery ESS can be calculated. It is, therefore, possible to perform the optimal design and energy management of the hybrid powertrain system to achieve minimum LCC of the hybrid electric vehicle/vessel, in addition to higher system efficiency and lower emissions. This section will compare the total LCC of a hybrid electric propulsion system with or without using the newly introduced battery performance degradation model.
4.1. Design of a Hybrid Electric Marine Propulsion System
The design optimization of the hybrid electric propulsion system for a medium-size vehicle and passenger ferry, Skeena Queen, operated by BC Ferries in B.C. Canada, is used as a test platform. The general information of the ship is given in Table 2.
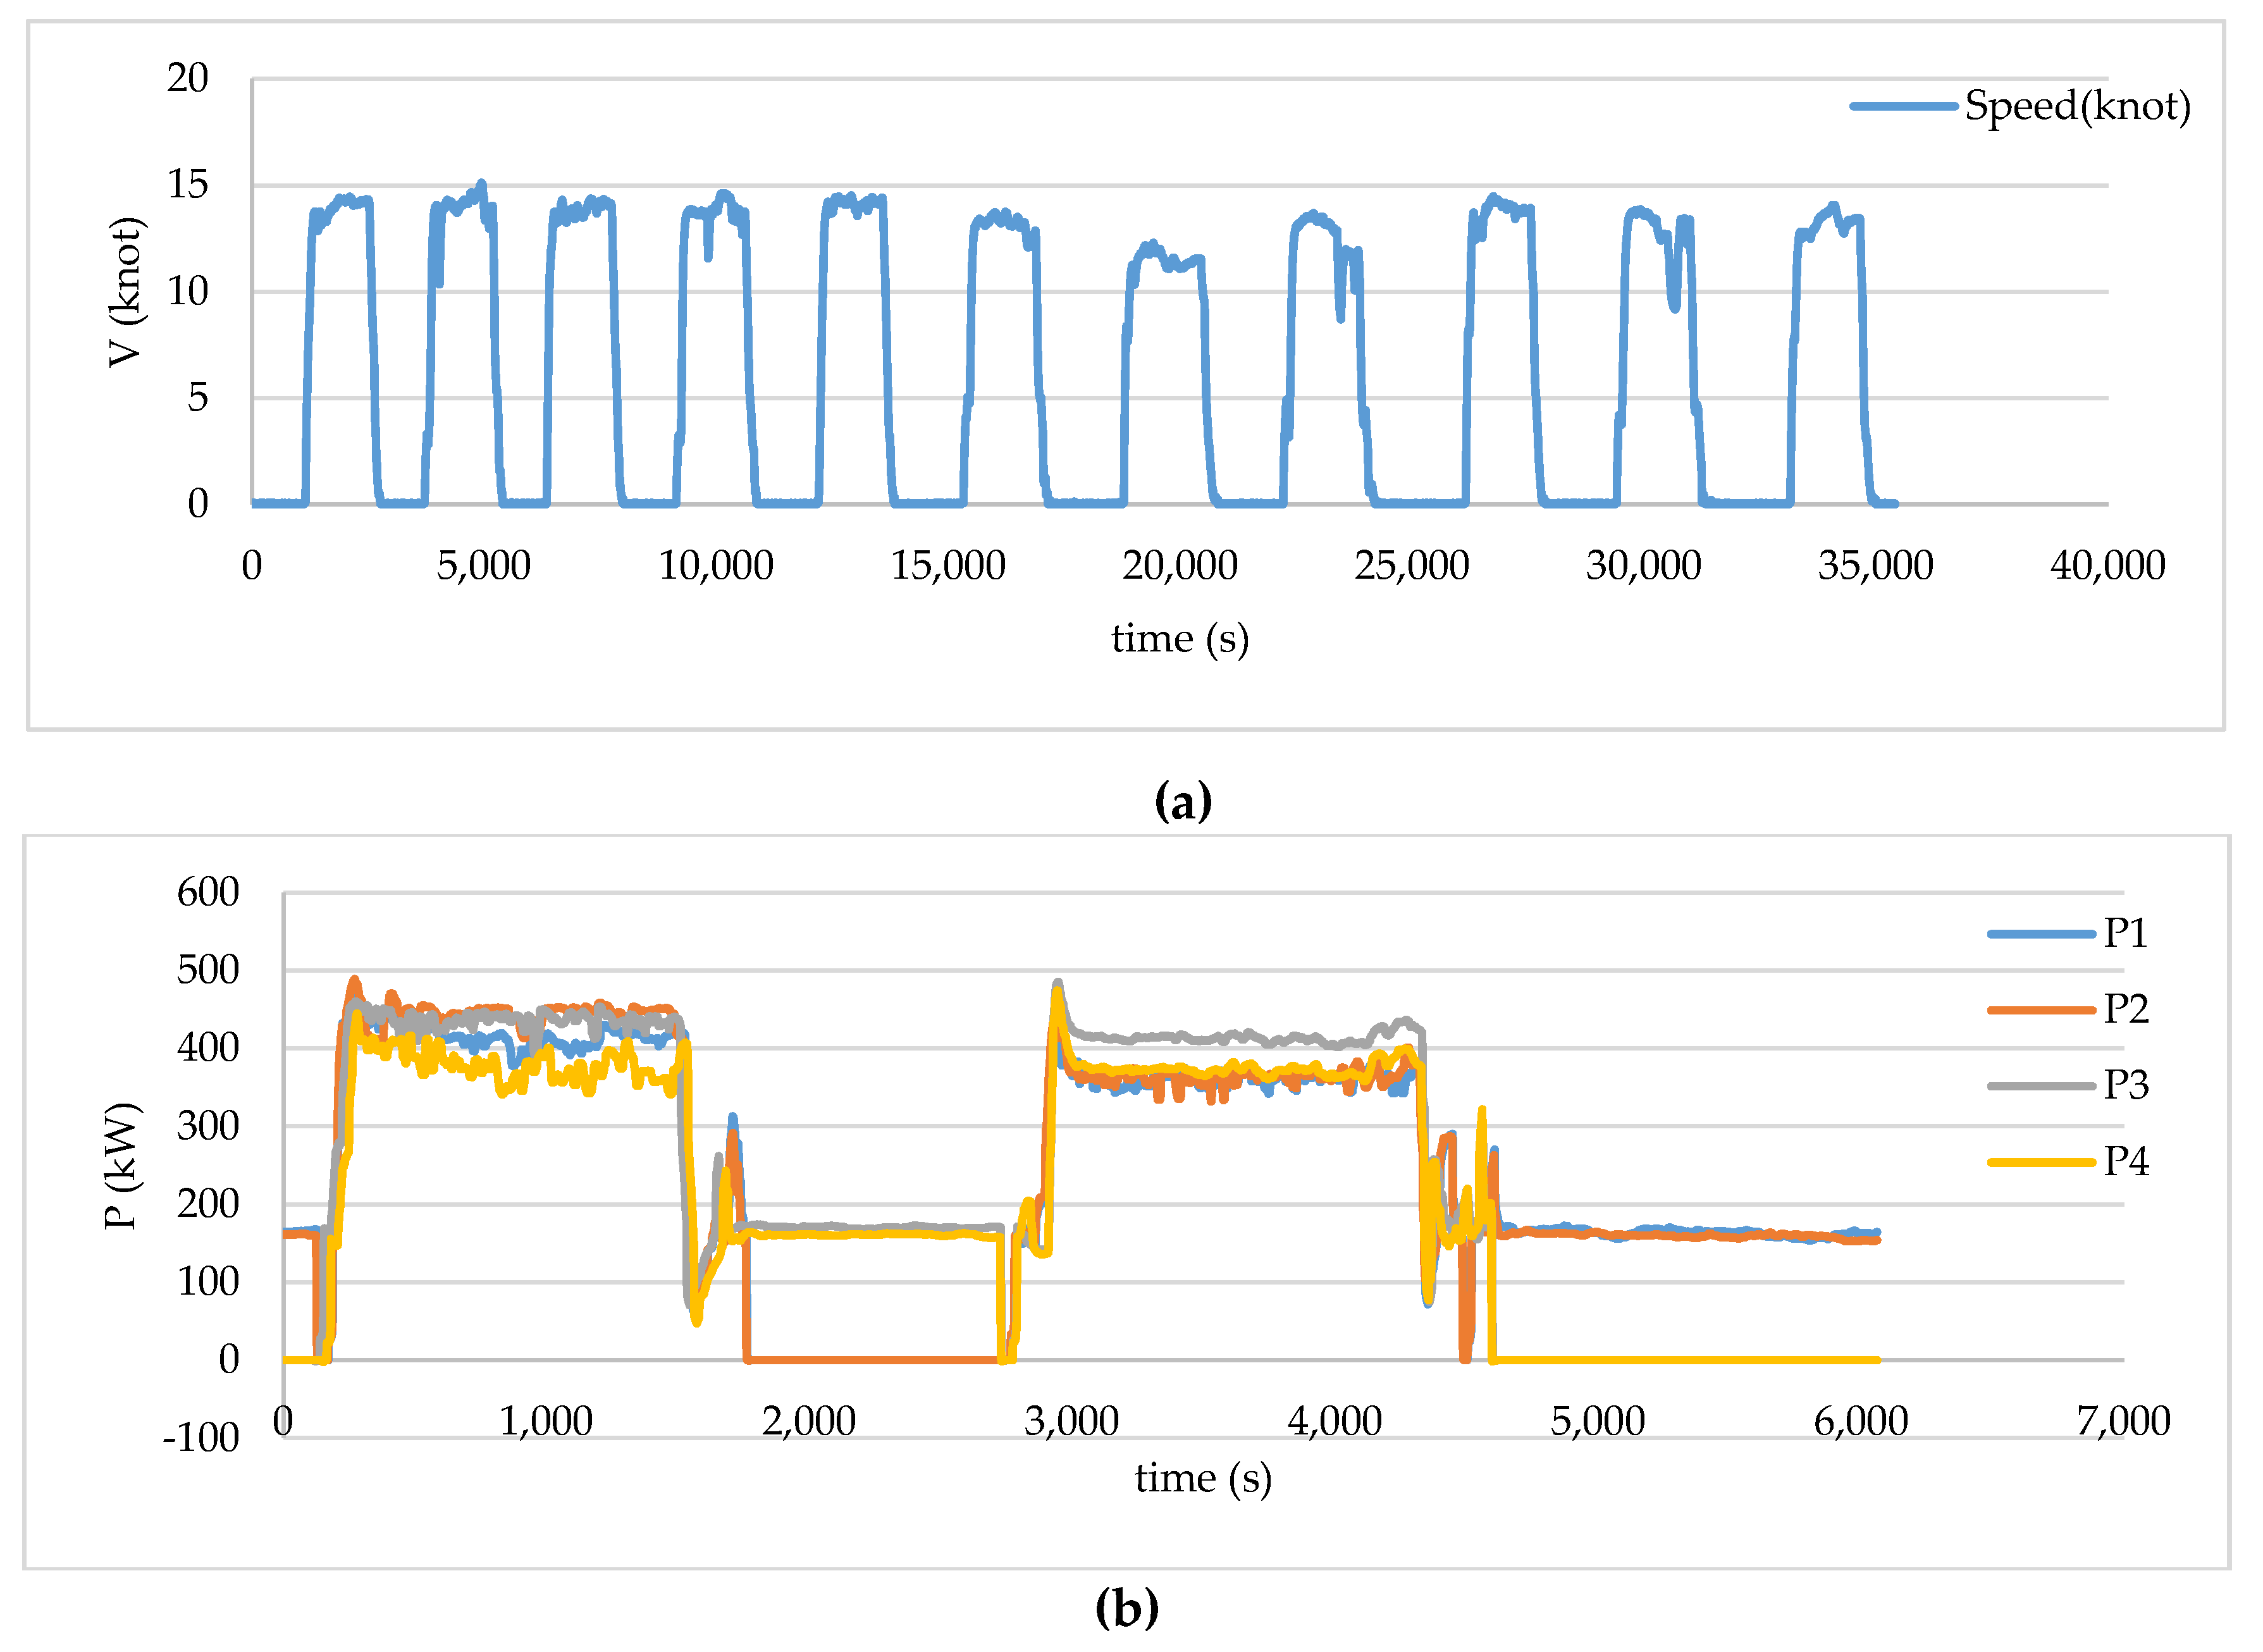
Daily operation data from the ferry have been collected as shown in Figure 11. The average sailing speed is about 15 knots as shown in Figure 11a. The total propulsion power requested during a roundtrip sailing from the four diesel engines has been measured and plotted in Figure 11b, where P1 to P4 represents the power outputs from engine number 1 to 4.
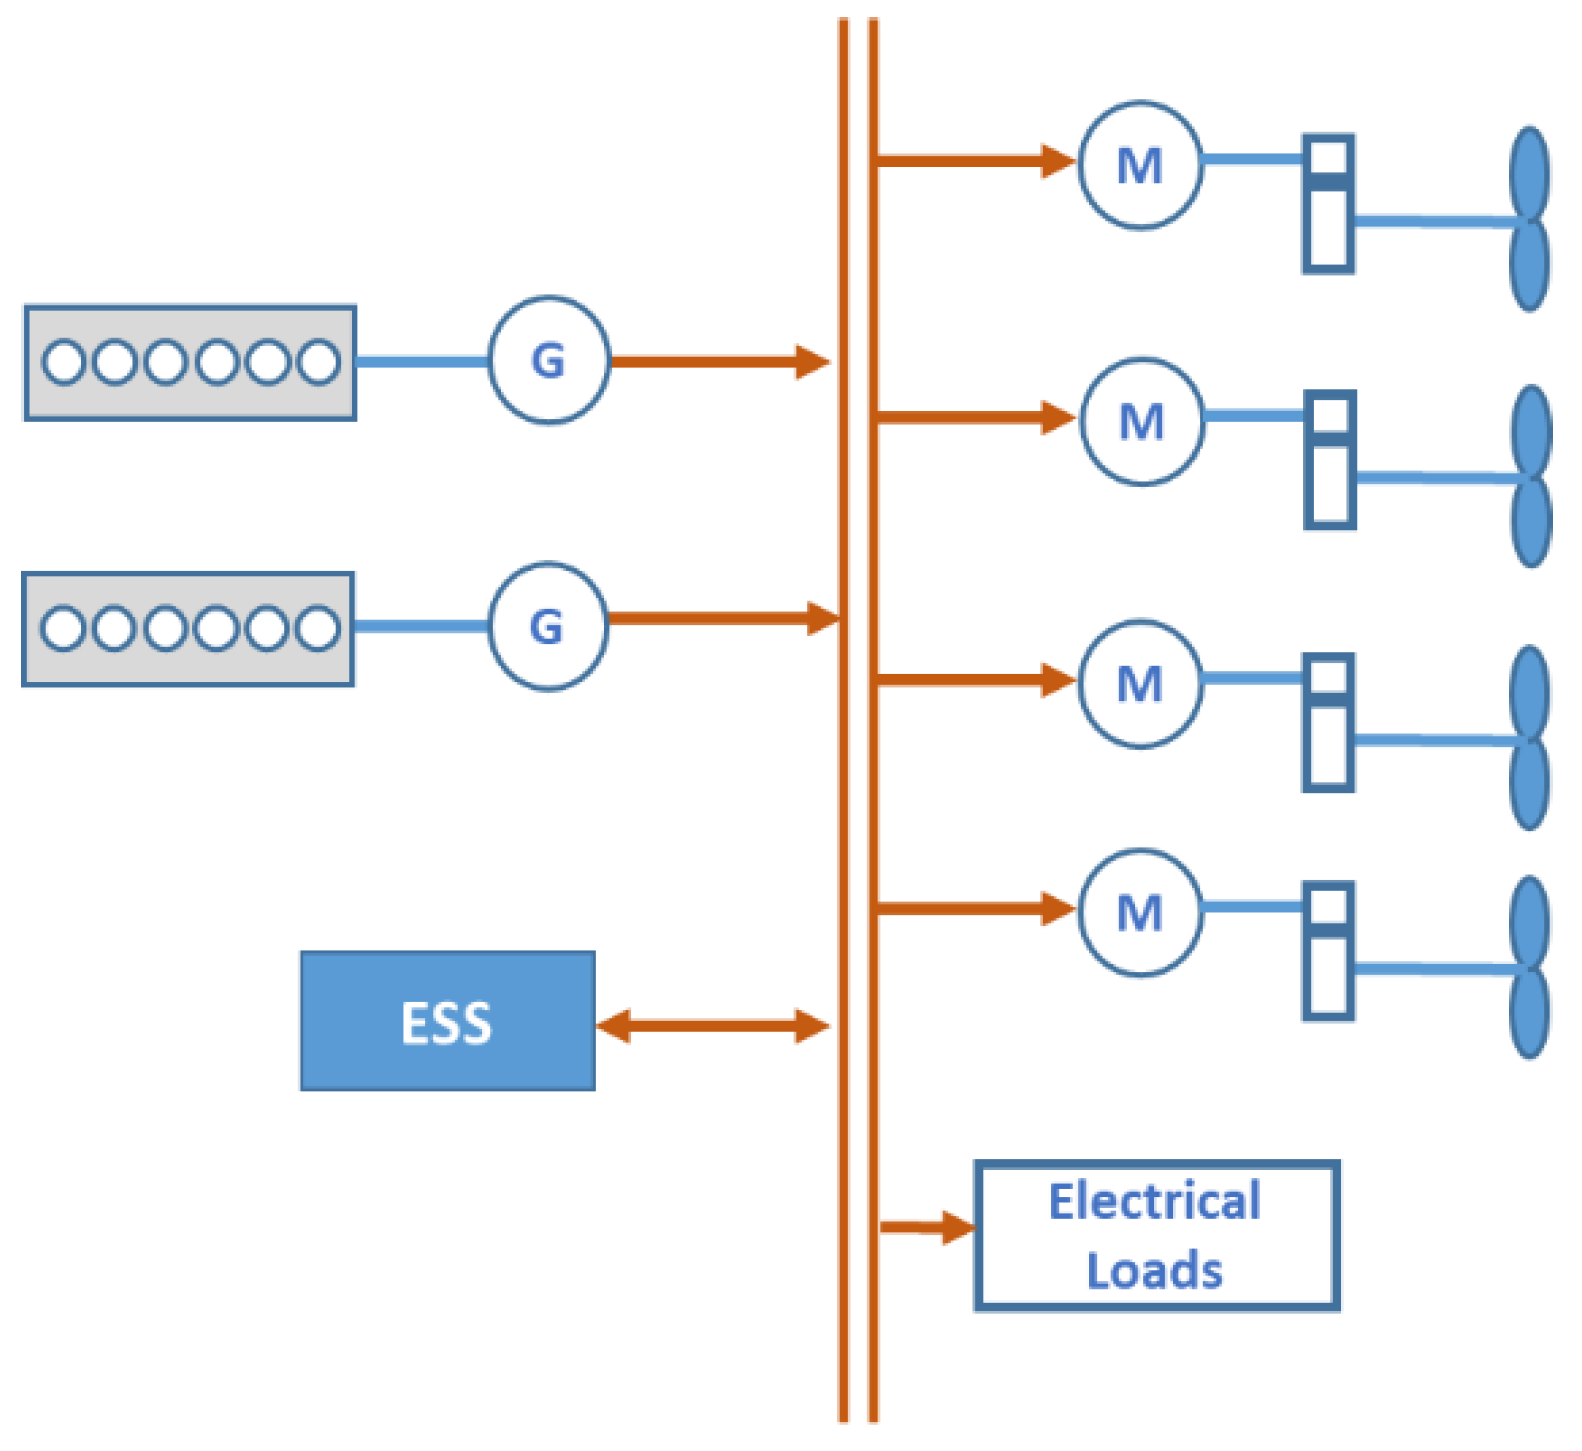
The new hybrid electric propulsion system design for this ferry is aimed at improving its fuel efficiency, reducing emissions, and achieving the minimum LCC. Reducing battery ESS replacements and extending battery ESS lifetime would contribute to a lower LCC of hybrid conversion. The proposed hybrid electric propulsion system for the ferry is shown in Figure 12. The conversion is aimed at producing a series of hybrid powertrains powered by the diesel gen-sets and propelled by electric motors, using the battery ESS as an energy buffer to store and supply electric power. The new hybrid propulsion system would improve engine fuel economy and system efficiency, provide more flexible operation and redundant power, lower fuel consumption and emissions, eliminate the original auxiliary gen-sets, and reduce engine operation time during docking.
4.2. LCC Model Developed for the Hybrid Electric Marine Propulsion System
The new LIB performance degradation and life prediction model can help evaluate the battery investment, replacement and residual costs during the entire life cycle of the hybrid propulsion systems. The LCC of the proposed hybrid electric marine propulsion, considering all costs from engines, ESS, and other electrical machines, can be developed as part of the total ownership costs (TOC) of the vessel. The main elements of the LCC model include the capital cost (), operation cost (), and residual cost ():
The capital cost () includes all the purchase costs for the main propulsion components. The reinvestment cost of Li-ion battery ESS must be considered due to its short lifespan compared to engines and other powertrain components.
where, is the engine cost; is the battery ESS cost; is the cost for hybridization and electrification, including purchasing the electric motors/generators and power converters; is the reinvestment cost due to the replacing of battery ESS; is the reinvestment cost, counting for the replacement cost of battery ESS due to the reduced lifetime. The operation life of battery ESS () is calculated based on the developed battery life prediction model in the previous section.
where is the replacement frequency, which is a function of the battery lifetime . is the annual inflation rate. is the key parameter that determines the reinvestment capital costs. The optimal result of must be determined at the system level considering both engine and ESS operation conditions.
where is the year when replacement occurs in the whole lifespan , i.e., when the battery life is ended. is integer numbers, When the battery needs to be replaced in year , then = 1, otherwise, is 0.
The system operation cost consists of fuel consumption and engine maintenance costs. Other costs related to ship insurance, registration, etc., are excluded.
where are the cost of fuel consumption and engine maintenance. is the annual inflation rate. is the year from 0 to .
The fuel cost is mainly determined by the operating efficiency of the engine that can be affected by the system design, component sizing, and power control. In this work, it is assumed that engine maintenance cost is closely related to its working time and the engine size [35].
The residual value (or salvage cost) of replaced Li-ion batteries is nontrivial for this expensive component. Retired batteries from hybrid vehicles with 80% remaining capability could be reused for residential energy storage and load levelling in a smart power grid [36]. In this study, the residual cost is the remaining value in the replaced battery ESS, which is also determined by the replacement time and residual price.
where is the price for the remaining value ($/kWh), is the residual capacity (kWh), and is the annual inflation rate.
More detailed information of LCC model, such as the price of marine fuels, the evaluation of fuel consumption cost and engine maintenance cost, etc. can be found in [35].
4.3. A Comparison of Different ESS Sizing Methods
Two different propulsion system and ESS sizing methods are used and compared, including the traditional power-demand-based and fuel consumption minimization-driven approach, and the new minimum LCC-based design using the battery performance degradation model.
The power-demand-based and fuel-economy-driven hybrid electric propulsion design is the predominant method for designing and sizing the hybrid electric propulsion system [37,38] due to the lack of an accurate battery performance degradation model. It determines the battery ESS size based upon the electrical energy required to achieve the best engine fuel economy. Specifically, the hybrid electric propulsion is design to allow the engine to operate at a higher power level (above 80% of maximum continuous rated power) to improve fuel economy and reduce air pollutants. For this purpose, the requested power from battery ESS is needed to substitute engine operation whenever the engine is operated below an 80% load. Due to the lack of optimal sizing of the ESS, the investment cost and replacement cost of battery could rise since no considerations have been made to ease the battery degradation in usage. The approach aims entirely at meeting the electrical energy requirement, the size of the ESS used in the hybrid ferry is then to be at least 500 kWh with about 1C discharge rate and 80% DOD usage in one roundtrip voyage. Based on acquired experimental results, the battery can last for 3.8 years. Therefore, the battery ESS would need to be replaced about every four years during the ship’s operational lifetime.
The use of the LIB performance degradation model in the hybrid electric propulsion system design enables the optimization-based ESS sizing to achieve the minimum system LCC. The LCC of the hybrid marine propulsion system includes the initial investment cost of the main powertrain components; the replacement cost of battery ESS that can be determined by the battery performance degradation model; the residual cost of battery when it is recycled; the total operational costs over the 20 years of ship operation with engine fuel consumption and maintenance costs. The optimal design of the ship’s hybrid powertrain involves different size combinations of major powertrain components. In this study, the size of the battery ESS is the primary variable that needs to be optimized, considering both system performance and the total LCC, as battery replacements may occur during the vessel’s lifespan. A multi-objective optimization problem is formulated as:
where , x1 is the ESS size and is the DOD in one trip; w1 and w2 are user-defined weighted factors for total LCC and emissions; is the propulsion system lifecycle cost over 20 years’ operation, which is affected by fuel consumptions (), battery lifetime () and operational time (); is the total mass of emissions (including equivalent CO2, PM and SO2); and are the minimum and maximum battery ESS capacity; and are the minimum and maximum battery DOD variation, respectively.
The optimal size of battery ESS, for this case, is 670 kWh. With this design, the vessel will consume 284 kg fuel during a round trip sailing, and battery ESS will sustain 7.5 years. This optimized hybrid propulsion system led to reduced investment cost due to minimum LLC battery ESS size optimization, supported by the performance degradation model of the LIB. The larger ESS led to a longer lifetime and improved LCC. Both hybrid propulsion system designs require a higher total capital cost compared to the traditional mechanical propulsion system. However, the optimized hybrid system requires less additional investment costs. Under the constrained SOC variation, and DOD, the design leads to extended battery life and lower placement cost.
A comparison of the LCC for the two different hybrid propulsion design approaches is presented in Table 3. As a reference, the capital and operational costs of a traditional mechanical propulsion system were also evaluated and listed. The initial investment cost, battery ESS replacement cost and battery residual cost (shown as a negative value) compose the total investment cost. The design with optimal battery ESS size, requires less additional investment cost and lower operating costs over 20 years. Overall, the total LCC of the battery performance degradation considering optimal hybrid electric propulsion system is 26 percent lower than the original mechanical propulsion system and represents a 12 percent additional cost-saving over the traditional power-demand-based and fuel consumption minimization-driven hybrid electric system design.
5. Conclusions
The optimizations of the size and EMS of the battery ESS in a hybrid electric propulsion system have been significant interest and focal point of research for years. These optimizations cannot be achieved without an accurate model for predicting the performance degradation and operating life of the battery under different use patterns. Traditional and present power-demand based and fuel-economy driven ESS sizing and EMS optimization methods often led to shortened battery operation life and higher overall lifecycle cost of the propulsion system. The Li-ion battery performance degradation model and its supported battery ESS size optimization, introduced in this work, can effectively address this issue.
The new semi-empirical, amended equivalent circuit model is introduced based on a large set of 18 Ah LiFePO4 battery cycling experiment data, and learning from previous research, in order to predict battery capacity decay and resistance increase during its lifespan and the remaining useful cycle life under various use patterns. The method for calculating the investment, operation, replacement and recycling costs of the battery ESS using the new model over its lifetime operation under given use patterns is presented. Validation of the new model using battery cycling experimental data showed good accuracy with about 13 percent error.
To demonstrate the use and benefits of the newly introduced LFP battery performance degradation model, the LCC of a hybrid electric passenger and vehicle ferry design using the traditional power-demand based and fuel-economy driven optimal ESS sizing method and the new overall LCC minimization method are compared. With the LIB model supported, minimum LCC battery sizing, the optimized hybrid propulsion system has 12 percent less LCC. The research forms a foundation for the optimal sizing and EMS development of hybrid electric vehicles and marine vessels to achieve minimum lifecycle costs.
Author Contributions
Conceptualization, L.C. and Z.D.; Data curation, Y.T.; Formal analysis, L.C.; Funding acquisition, Z.D.; Methodology, L.C. and Z.D.; Validation, L.C.; Writing – original draft, L.C.; Writing – review and editing, Z.D. All authors have read and agreed to the published version of the manuscript.
Funding
This research was funded by the Natural Science and Engineering Research Council of Canada, Transport Canada, and Washington Foundation.
Acknowledgments
The authors gratefully acknowledge the assistance from the British Columbia Ferry Service Inc. and Haijia Zhu from our UVic Clean Transportation Research team for acquiring the ferry ship operating data.
Conflicts of Interest
The authors declare no conflict of interest.
References
- Nelson, P.A.; Gallagher, K.G.; Bloom, I.D.; Dees, D.W. Modeling the Performance and Cost of Lithium-Ion Batteries for Electric-Drive Vehicles; Argonne National Laboratory (ANL): Lemont, IL, USA, 2012.
- Nitta, N.; Wu, F.; Lee, J.T.; Yushin, G. Li-ion battery materials: Present and future. Mater. Today 2015, 18, 252–264. [Google Scholar] [CrossRef]
- Scrosati, B.; Garche, J. Lithium batteries: Status, prospects and future. J. Power Sources 2010, 195, 2419–2430. [Google Scholar] [CrossRef]
- Dai, X.; Zhou, A.; Xu, J.; Lu, Y.; Wang, L.; Fan, C.; Li, J. Extending the High-Voltage Capacity of LiCoO2 Cathode by Direct Coating of the Composite Electrode with Li2CO3 via Magnetron Sputtering. J. Phys. Chem. C 2016, 120, 422–430. [Google Scholar] [CrossRef]
- Arora, P.; White, R.E.; Doyle, M. Capacity fade mechanisms and side reactions in lithium-ion batteries. J. Electrochem. Soc. 1998, 145, 3647–3667. [Google Scholar] [CrossRef] [Green Version]
- Ramadass, P.; Haran, B.; White, R.; Popov, B.N. Mathematical modeling of the capacity fade of Li-ion cells. J. Power Sources 2003, 123, 230–240. [Google Scholar] [CrossRef]
- Ashwin, T.; Chung, Y.M.; Wang, J. Capacity fade modelling of lithium-ion battery under cyclic loading conditions. J. Power Sources 2016, 328, 586–598. [Google Scholar] [CrossRef] [Green Version]
- Ramadass, P.; Haran, B.; White, R.; Popov, B.N. Capacity fade of Sony 18650 cells cycled at elevated temperatures: Part I. Cycling performance. J. Power Sources 2002, 112, 606–613. [Google Scholar] [CrossRef] [Green Version]
- Broussely, M.; Herreyre, S.; Biensan, P.; Kasztejna, P.; Nechev, K.; Staniewicz, R. Aging mechanism in Li ion cells and calendar life predictions. J. Power Sources 2001, 97, 13–21. [Google Scholar] [CrossRef]
- Linde, D.; Reddy, T. Lithium-Ion Batteries. In Handbook of batteries, 3rd ed.; McGraw-Hill: New York, NY, USA, 1995; p. 265. [Google Scholar]
- Vetter, J.; Novák, P.; Wagner, M.; Veit, C.; Möller, K.-C.; Besenhard, J.; Winter, M.; Wohlfahrt-Mehrens, M.; Vogler, C.; Hammouche, A. Ageing mechanisms in lithium-ion batteries. J. Power Sources 2005, 147, 269–281. [Google Scholar] [CrossRef]
- Bloom, I.; Cole, B.; Sohn, J.; Jones, S.; Polzin, E.; Battaglia, V.; Henriksen, G.; Motloch, C.; Richardson, R.; Unkelhaeuser, T. An accelerated calendar and cycle life study of Li-ion cells. J. Power Sources 2001, 101, 238–247. [Google Scholar] [CrossRef]
- Severson, K.A.; Attia, P.M.; Jin, N.; Perkins, N.; Jiang, B.; Yang, Z.; Chen, M.H.; Aykol, M.; Herring, P.K.; Fraggedakis, D. Data-driven prediction of battery cycle life before capacity degradation. Nat. Energy 2019, 4, 383–391. [Google Scholar] [CrossRef] [Green Version]
- Deshpande, R.; Verbrugge, M.; Cheng, Y.-T.; Wang, J.; Liu, P. Battery cycle life prediction with coupled chemical degradation and fatigue mechanics. J. Electrochem. Soc. 2012, 159, A1730–A1738. [Google Scholar] [CrossRef]
- Chen, S.; Wan, C.; Wang, Y. Thermal analysis of lithium-ion batteries. J. Power Sources 2005, 140, 111–124. [Google Scholar] [CrossRef]
- Pesaran, A.A.; National Renewable Energy Laboratory (U.S.). Electrothermal analysis of lithium ion batteries. In Nrel/Pr 540-39503; National Renewable Energy Laboratory: Golden, CO, USA, 2006; p. 26. [Google Scholar]
- Wang, J.; Purewal, J.; Liu, P.; Hicks-Garner, J.; Soukazian, S.; Sherman, E.; Sorenson, A.; Vu, L.; Tataria, H.; Verbrugge, M.W. Degradation of lithium ion batteries employing graphite negatives and nickel–cobalt–manganese oxide+ spinel manganese oxide positives: Part 1, aging mechanisms and life estimation. J. Power Sources 2014, 269, 937–948. [Google Scholar] [CrossRef]
- Doyle, M.; Fuller, T.F.; Newman, J. Modeling of galvanostatic charge and discharge of the lithium/polymer/insertion cell. J. Electrochem. Soc. 1993, 140, 1526–1533. [Google Scholar] [CrossRef]
- Ramadass, P.; Haran, B.; Gomadam, P.M.; White, R.; Popov, B.N. Development of first principles capacity fade model for Li-ion cells. J. Electrochem. Soc. 2004, 151, A196–A203. [Google Scholar] [CrossRef]
- Ren, L.; Zhao, L.; Hong, S.; Zhao, S.; Wang, H.; Zhang, L. Remaining useful life prediction for lithium-ion battery: A deep learning approach. IEEE Access 2018, 6, 50587–50598. [Google Scholar] [CrossRef]
- Ning, G.; Popov, B.N. Cycle life modeling of lithium-ion batteries. J. Electrochem. Soc. 2004, 151, A1584–A1591. [Google Scholar] [CrossRef] [Green Version]
- Ecker, M.; Gerschler, J.B.; Vogel, J.; Käbitz, S.; Hust, F.; Dechent, P.; Sauer, D.U. Development of a lifetime prediction model for lithium-ion batteries based on extended accelerated aging test data. J. Power Sources 2012, 215, 248–257. [Google Scholar] [CrossRef]
- Smith, K.; Saxon, A.; Keyser, M.; Lundstrom, B.; Cao, Z.; Roc, A. Life prediction model for grid-connected Li-ion battery energy storage system. In Proceedings of the American Control Conference (ACC), Seattle, WA, USA, 24–26 May 2017; pp. 4062–4068. [Google Scholar]
- Wang, J.; Liu, P.; Hicks-Garner, J.; Sherman, E.; Soukiazian, S.; Verbrugge, M.; Tataria, H.; Musser, J.; Finamore, P. Cycle-life model for graphite-LiFePO4 cells. J. Power Sources 2011, 196, 3942–3948. [Google Scholar] [CrossRef]
- Hou, C.; Ouyang, M.; Xu, L.; Wang, H. Approximate Pontryagin’s minimum principle applied to the energy management of plug-in hybrid electric vehicles. Appl. Energy 2014, 115, 174–189. [Google Scholar] [CrossRef]
- Ebbesen, S.; Elbert, P.; Guzzella, L. Engine downsizing and electric hybridization under consideration of cost and drivability. Oil Gas Sci. Technol. Rev. d’IFP Energies Nouv. 2013, 68, 109–116. [Google Scholar] [CrossRef]
- Liaw, B.Y.; Nagasubramanian, G.; Jungst, R.G.; Doughty, D.H. Modeling of lithium ion cells—A simple equivalent-circuit model approach. Solid State Ion. 2004, 175, 835–839. [Google Scholar]
- Forman, J.C.; Moura, S.J.; Stein, J.L.; Fathy, H.K. Genetic identification and fisher identifiability analysis of the Doyle–Fuller–Newman model from experimental cycling of a LiFePO 4 cell. J. Power Sources 2012, 210, 263–275. [Google Scholar] [CrossRef]
- Jokar, A.; Rajabloo, B.; Désilets, M.; Lacroix, M. Review of simplified Pseudo-two-Dimensional models of lithium-ion batteries. J. Power Sources 2016, 327, 44–55. [Google Scholar] [CrossRef]
- Ahmed, R.; El Sayed, M.; Arasaratnam, I.; Tjong, J.; Habibi, S. Reduced-order electrochemical model parameters identification and SOC estimation for healthy and aged Li-ion batteries Part I: Parameterization model development for healthy batteries. IEEE J. Emerg. Sel. Top. Power Electron. 2014, 2, 659–677. [Google Scholar] [CrossRef]
- Hassan, R.; Cohanim, B.; De Weck, O.; Venter, G. A comparison of particle swarm optimization and the genetic algorithm. In Proceedings of the 46th AIAA/ASME/ASCE/AHS/ASC Structures, Structural Dynamics and Materials Conference, Austin, TX, USA, 18–21 April 2005; p. 1897. [Google Scholar]
- Han, X.; Ouyang, M.; Lu, L.; Li, J.; Zheng, Y.; Li, Z. A comparative study of commercial lithium ion battery cycle life in electrical vehicle: Aging mechanism identification. J. Power Sources 2014, 251, 38–54. [Google Scholar] [CrossRef]
- Liu, P.; Wang, J.; Hicks-Garner, J.; Sherman, E.; Soukiazian, S.; Verbrugge, M.; Tataria, H.; Musser, J.; Finamore, P. Aging mechanisms of LiFePO4 batteries deduced by electrochemical and structural analyses. J. Electrochem. Soc. 2010, 157, A499–A507. [Google Scholar] [CrossRef]
- Bourlot, S.; Blanchard, P.; Robert, S. Investigation of aging mechanisms of high power Li-ion cells used for hybrid electric vehicles. J. Power Sources 2011, 196, 6841–6846. [Google Scholar] [CrossRef]
- Chen, L. Integrated Design and Control Optimization of Hybrid Electric Marine Propulsion Systems Based on Battery Performance Degradation Model. Ph.D. Thesis, University of Victoria, Victoria, BC, Canada, 2019. [Google Scholar]
- Heymans, C.; Walker, S.B.; Young, S.B.; Fowler, M. Economic analysis of second use electric vehicle batteries for residential energy storage and load-levelling. Energy Policy 2014, 71, 22–30. [Google Scholar] [CrossRef]
- Raustad, R. Electric Vehicle Life Cycle Cost Assessment; Report No. FSEC-CR-1984-14; University of Central Florida: Orlando, FL, USA, 2014. [Google Scholar]
- Solem, S.; Fagerholt, K.; Erikstad, S.O.; Patricksson, Ø. Optimization of diesel electric machinery system configuration in conceptual ship design. J. Mar. Sci. Technol. 2015, 20, 406–416. [Google Scholar] [CrossRef]
Figure 1.
Battery beginning-of-life (BOL) voltage curves.

Figure 2.
Measured voltage variances under 1/3 C charge and discharge in cycling experiments.

Figure 3.
Differential voltages at different number of cycles.

Figure 4.
Battery capacity measured in different cycle numbers.

Figure 5.
Cycle-induced capacity loss plotted as a function of ampere-hour throughput (Ah-throughput). The blue dots indicate data used for building the performance degradation model, while the orange triangles indicate data used for model validation.
Figure 5.
Cycle-induced capacity loss plotted as a function of ampere-hour throughput (Ah-throughput). The blue dots indicate data used for building the performance degradation model, while the orange triangles indicate data used for model validation.

Figure 6.
Illustration of battery performance degradation and life prediction model.

Figure 7.
Variations of lithium-ion battery (LIB) maximum capacity and inner resistance.

Figure 8.
Prediction of remaining cycling numbers under different and depth of discharge (DOD).

Figure 9.
Battery state of health (SOH) variation under different usage patterns.

Figure 10.
Accuracy of battery performance degradation and lifetime prediction model: blue dots indicate modelling results, orange triangles indicate validation results.
Figure 10.
Accuracy of battery performance degradation and lifetime prediction model: blue dots indicate modelling results, orange triangles indicate validation results.

Figure 11.
Ferry ship operation profile. (a) Ferry operation speed profile in one day, (b) Power measured from the four engine shafts in one roundtrip.
Figure 11.
Ferry ship operation profile. (a) Ferry operation speed profile in one day, (b) Power measured from the four engine shafts in one roundtrip.

Figure 12.
Integrated hybrid electric propulsion system designed for the ferry ship.


Table 1.
Tested lithium-ion phosphate/graphite (LFP/C) battery specifications.
| Parameter | Value |
|---|---|
| Nominal Voltage | 3.2 V |
| Nominal Capacity | 18 Ah |
| Energy Density | 120 Wh/kg |
| Charge/Discharge Cut-off Voltage | 3.6 V/2.5 V |
| Max. Normal/Fast Charge Current Rate | 1 C/2 C |
| Max. Continuous/Max. 30-sec Discharge Current Rate | 3 C/15 C |
Table 2.
General information about ferry ship Skeena Queen.
 |  | |
| Skeena Queen | ||
| Overall Length | 110 m | |
| Car Capacity | 92 | |
| Passenger and Crew Capacity | 450 | |
| Maximum Power | 4474 kW | |
| Cross Distance | 5 nautical miles | |
Table 3.
LCC breakdown and comparison for the optimal hybrid propulsion system.
| Cost/Increment | Mechanical Propulsion | Hybrid Propulsion (Minimizing Fuel Consumption) | Optimal Hybrid Propulsion (Minimizing Total LCC) | ||
|---|---|---|---|---|---|
| ($M) | ($M) | (%) | ($M) | (%) | |
| Initial Investment($M) | 2 | 1.88 | 1.97 | ||
| Battery Replacement($M) | 0 | 1.38 | 0.68 | ||
| Battery Residual($M) | 0 | −0.53 | −0.37 | ||
| Total Investment | 2 | 2.73 | +37% | 2.28 | +14% |
| Total Operation (20 yrs) | 17.94 | 14.38 | −20% | 12.44 | −31% |
| Total LCC | 19.94 | 17.11 | −14% | 14.72 | −26% |
© 2020 by the authors. Licensee MDPI, Basel, Switzerland. This article is an open access article distributed under the terms and conditions of the Creative Commons Attribution (CC BY) license (http://creativecommons.org/licenses/by/4.0/).
Share and Cite
MDPI and ACS Style
Chen, L.; Tong, Y.; Dong, Z. Li-Ion Battery Performance Degradation Modeling for the Optimal Design and Energy Management of Electrified Propulsion Systems. Energies 2020, 13, 1629. https://doi.org/10.3390/en13071629
AMA Style
Chen L, Tong Y, Dong Z. Li-Ion Battery Performance Degradation Modeling for the Optimal Design and Energy Management of Electrified Propulsion Systems. Energies. 2020; 13(7):1629. https://doi.org/10.3390/en13071629
Chicago/Turabian StyleChen, Li, Yuqi Tong, and Zuomin Dong. 2020. "Li-Ion Battery Performance Degradation Modeling for the Optimal Design and Energy Management of Electrified Propulsion Systems" Energies 13, no. 7: 1629. https://doi.org/10.3390/en13071629
Note that from the first issue of 2016, this journal uses article numbers instead of page numbers. See further details here.