Implementation of Particle Swarm Optimization (PSO) Algorithm for Tuning of Power System Stabilizers in Multimachine Electric Power Systems

 and
and
Abstract
:1. Introduction
2. Description of the Problem
3. Methodology for Fitting Parameters
3.1. Optimization Problem
3.2. Algorithm Used for Fitting the PSS Parameters
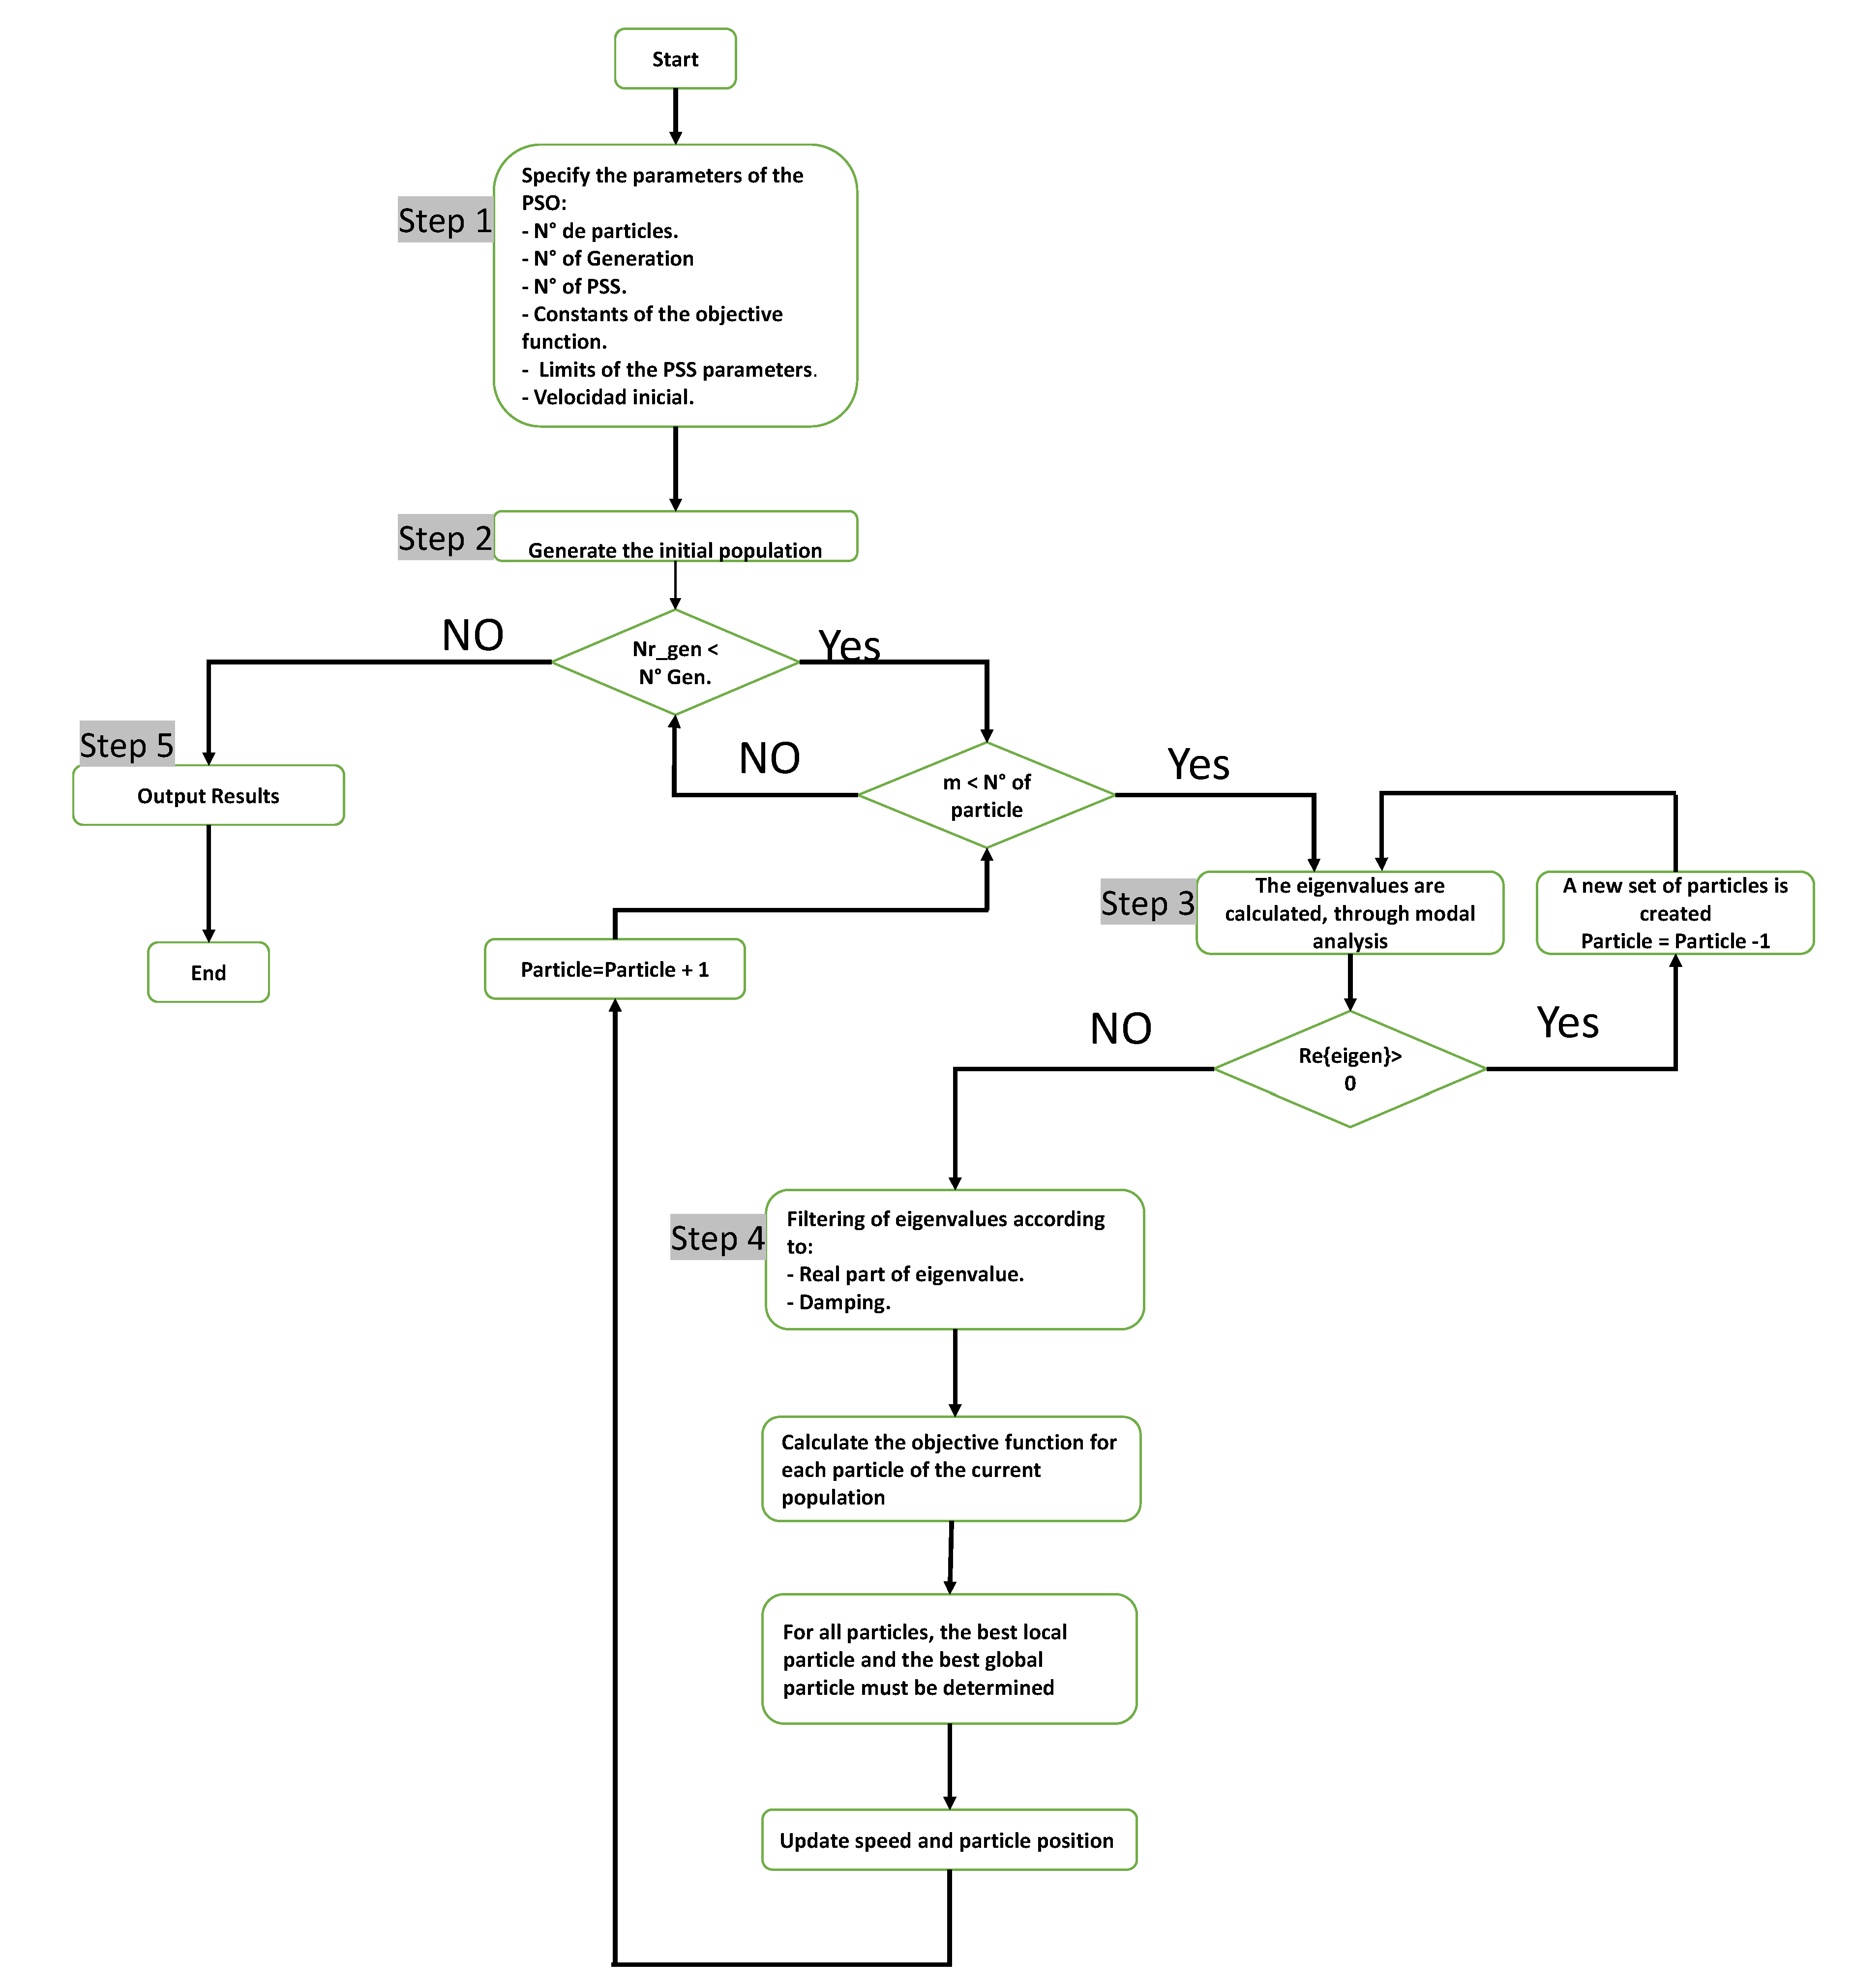
- Step 1: Definition of parameters of the PSO algorithm, such as: of generations, of particles, of controllers, objective function constant, initial speed, limits of the controller parameters, etc.
- Step 2: From the parameters entered in stage 1, the program creates the initial population; this is a set of vectors and matrices which will be updated during the iterative process.
- Step 3: The iterative process starts where the charge flux and modal analysis for each particle is calculated. Moreover, it has to be validated that not only the adopted values do not foster the emergence of unstable oscillation modes but also that the proposed fittings meet the restrictions established in Stage 1.
- Step 4: During this stage the optimization process starts. Firstly, the complex eigenvalues are filtered by oscillation frequency and damping factor. Once the fitting is obtained for every iteration, the proposed set in the objective function is evaluated, establishing the best solution for every particle and every generation.
- Step 5: After completing the optimization process, the plant models of the system generators under study are loaded with the optimal controller parameters and the values of the objective function for each iteration are shown.
4. Case Study
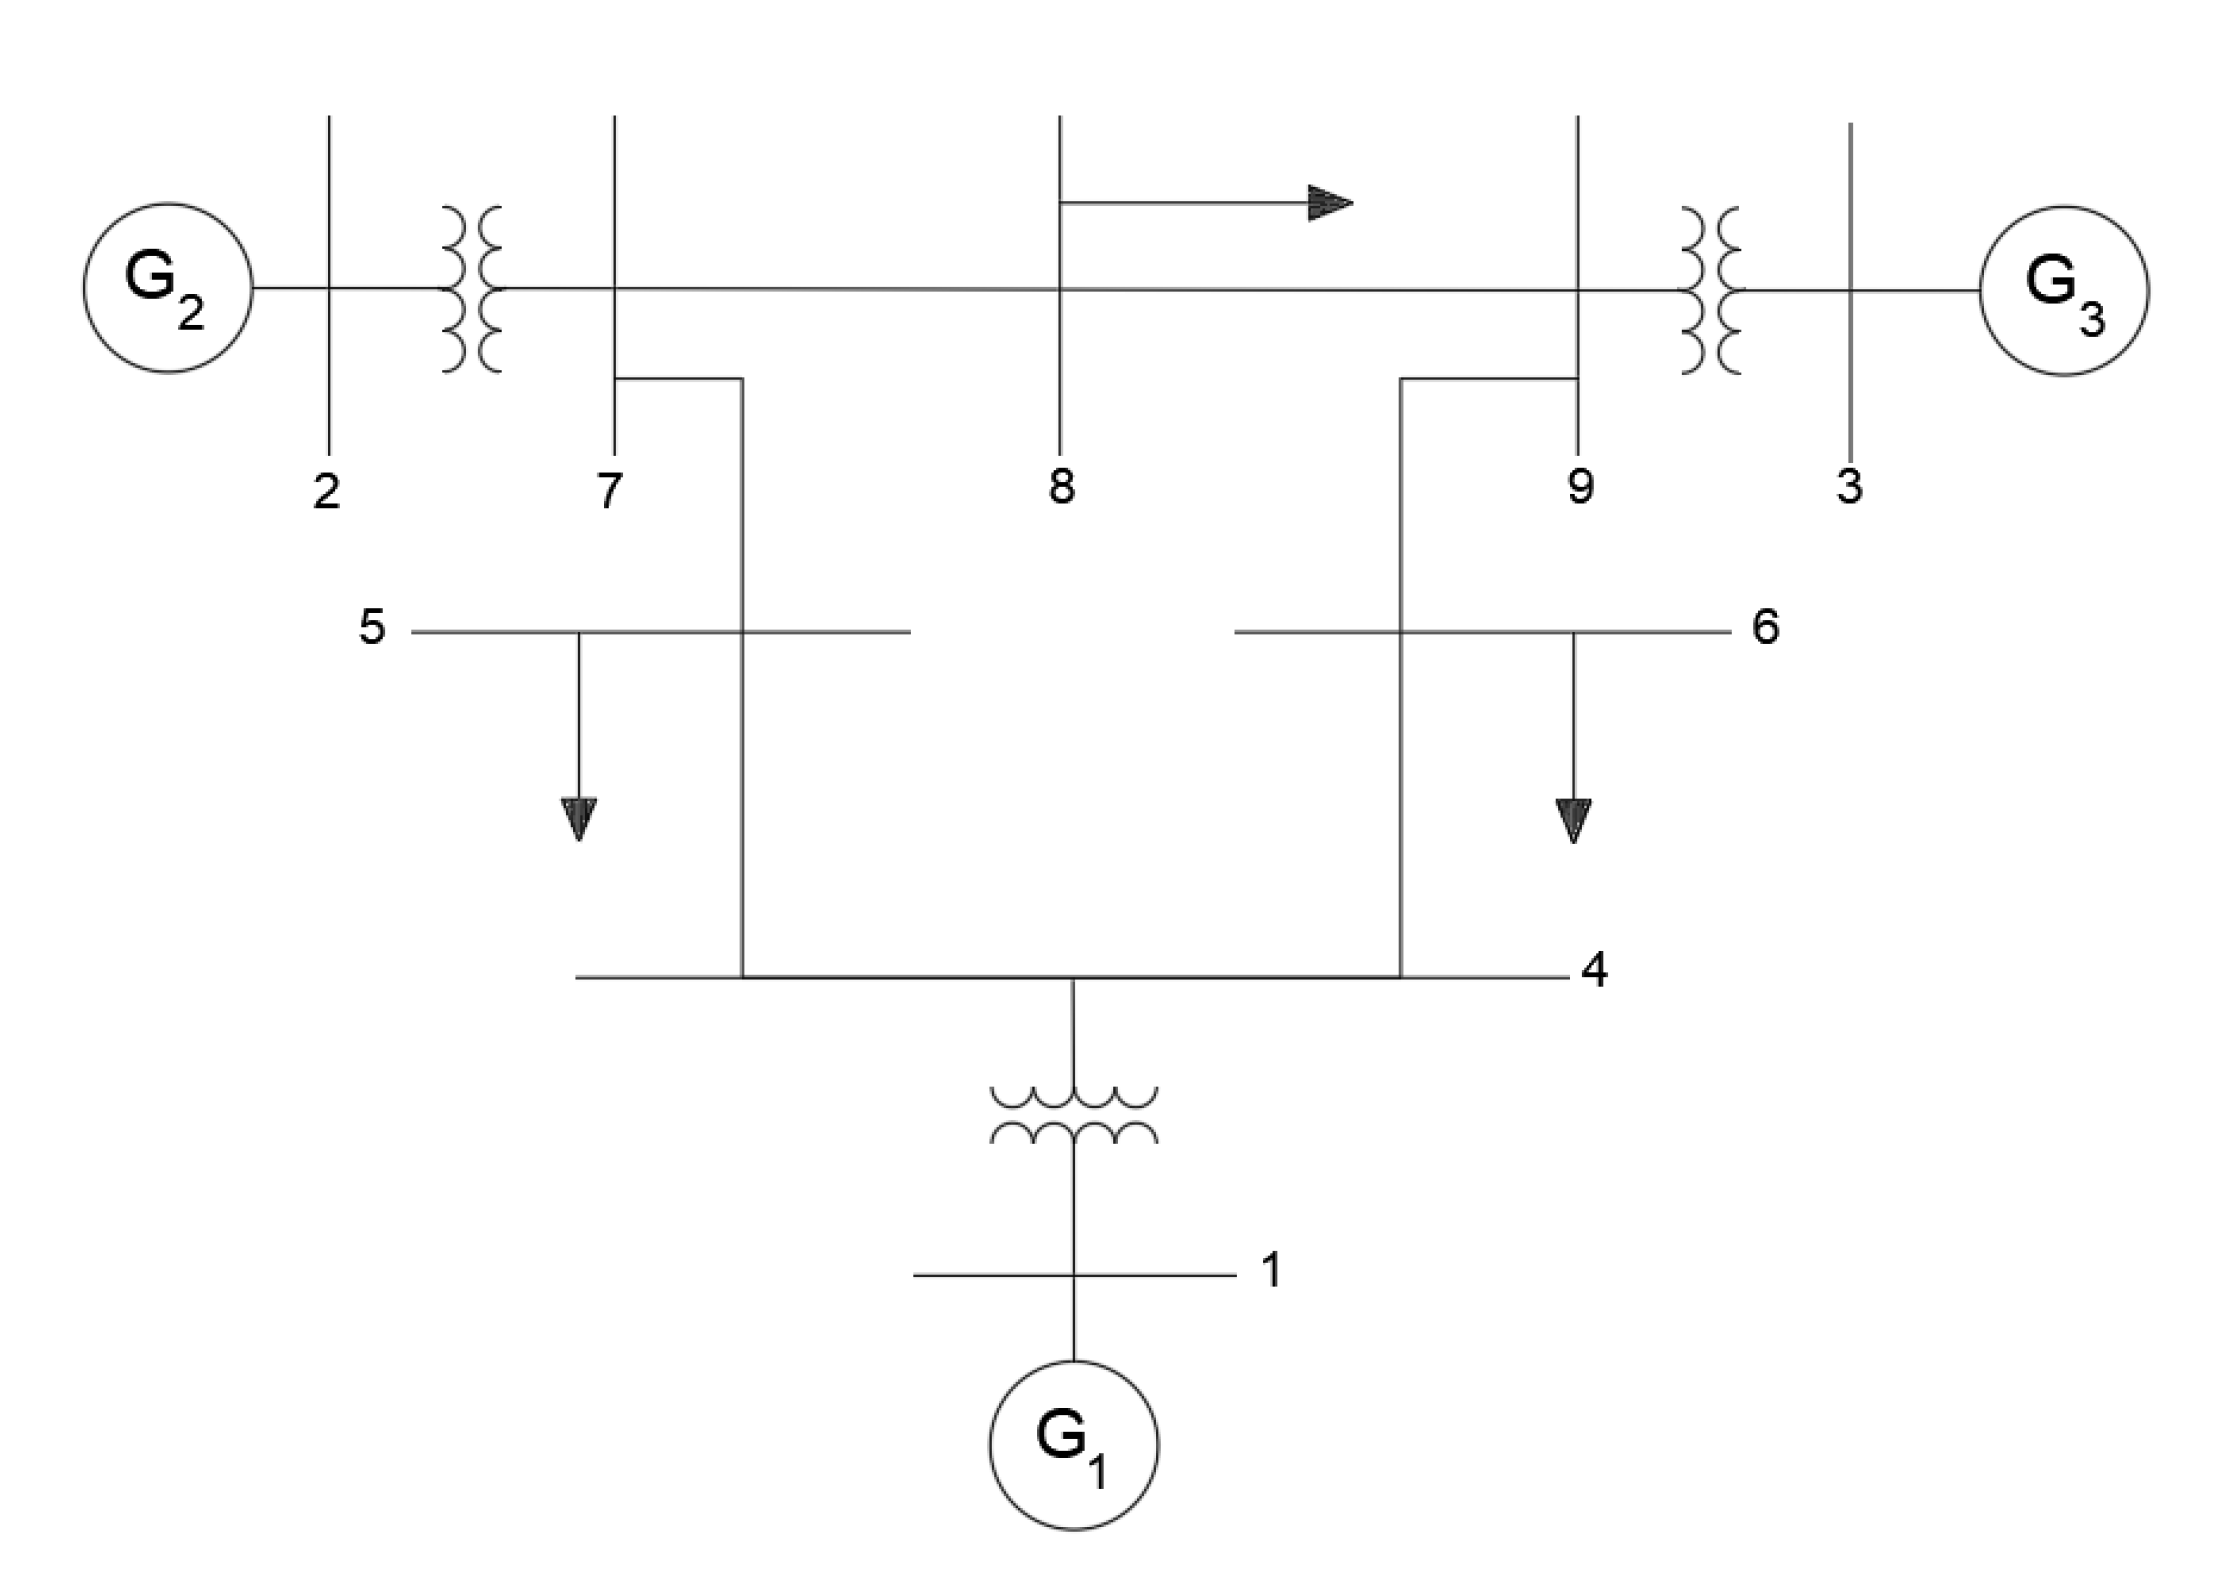
- System I: IEEE 3-machine, 9 bus system. In Figure 1 an unilinear diagram of the 3-machine, 9-bus system is presented.
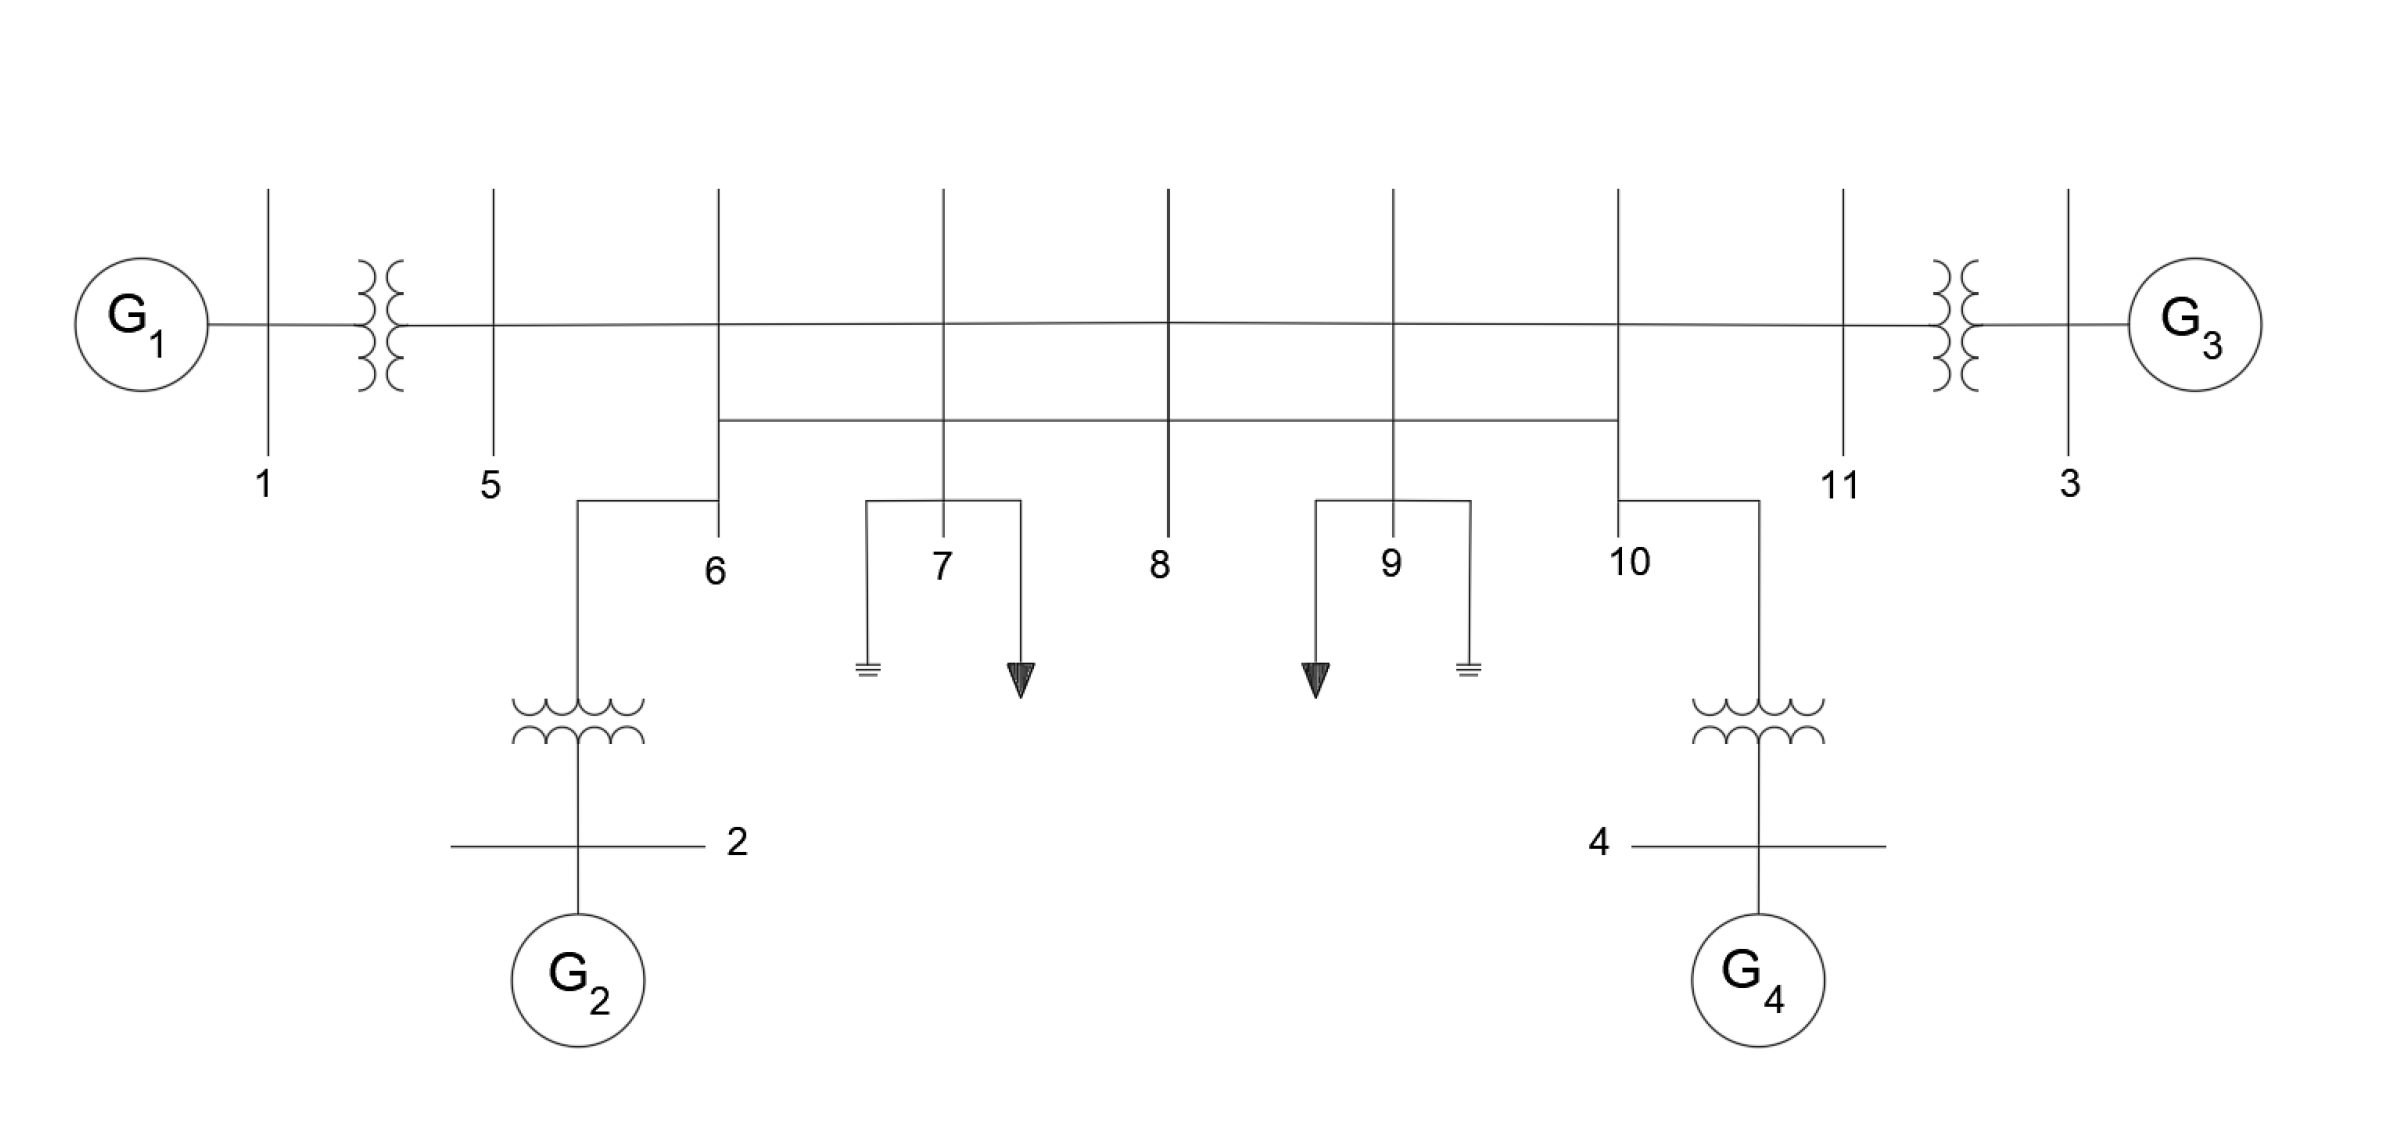
- System II: 4-machine system. Figure 3 displays a unilinear diagram of the 4-machine system.
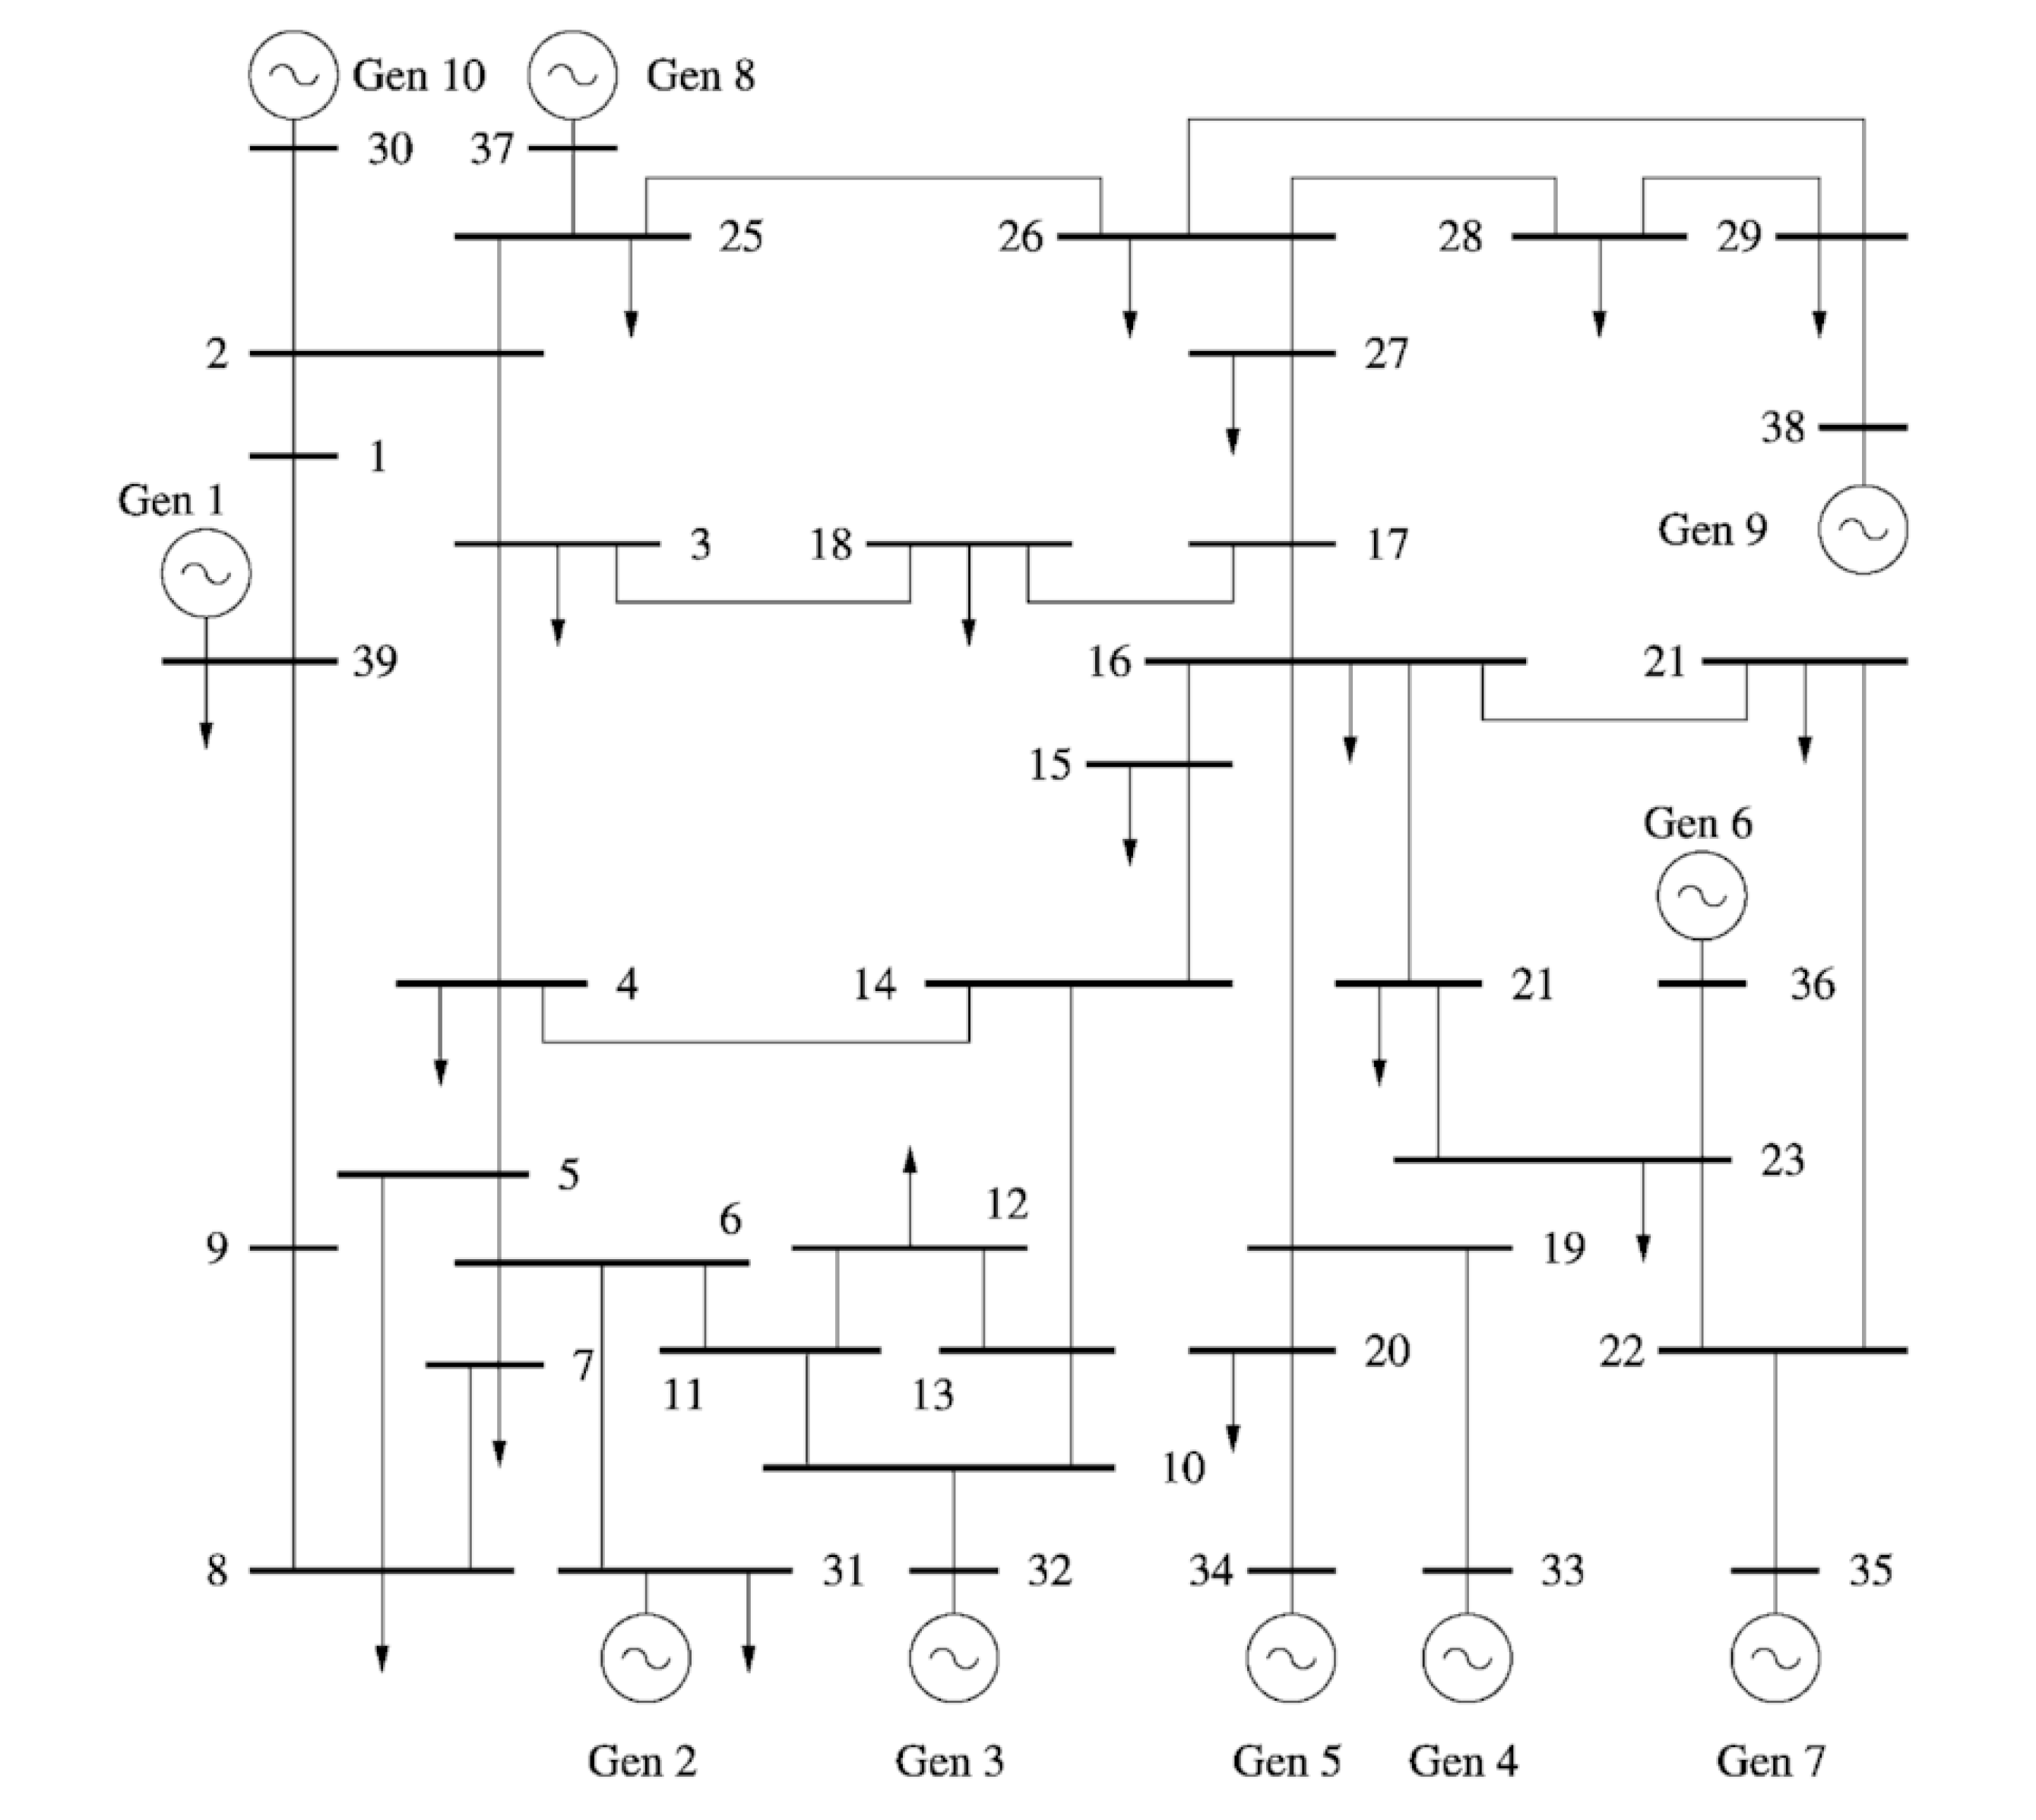
- System III: 10-machine, 39-bus system. In Figure 4 a unilinear diagram of the 10-machine, 39-bus system, is shown.
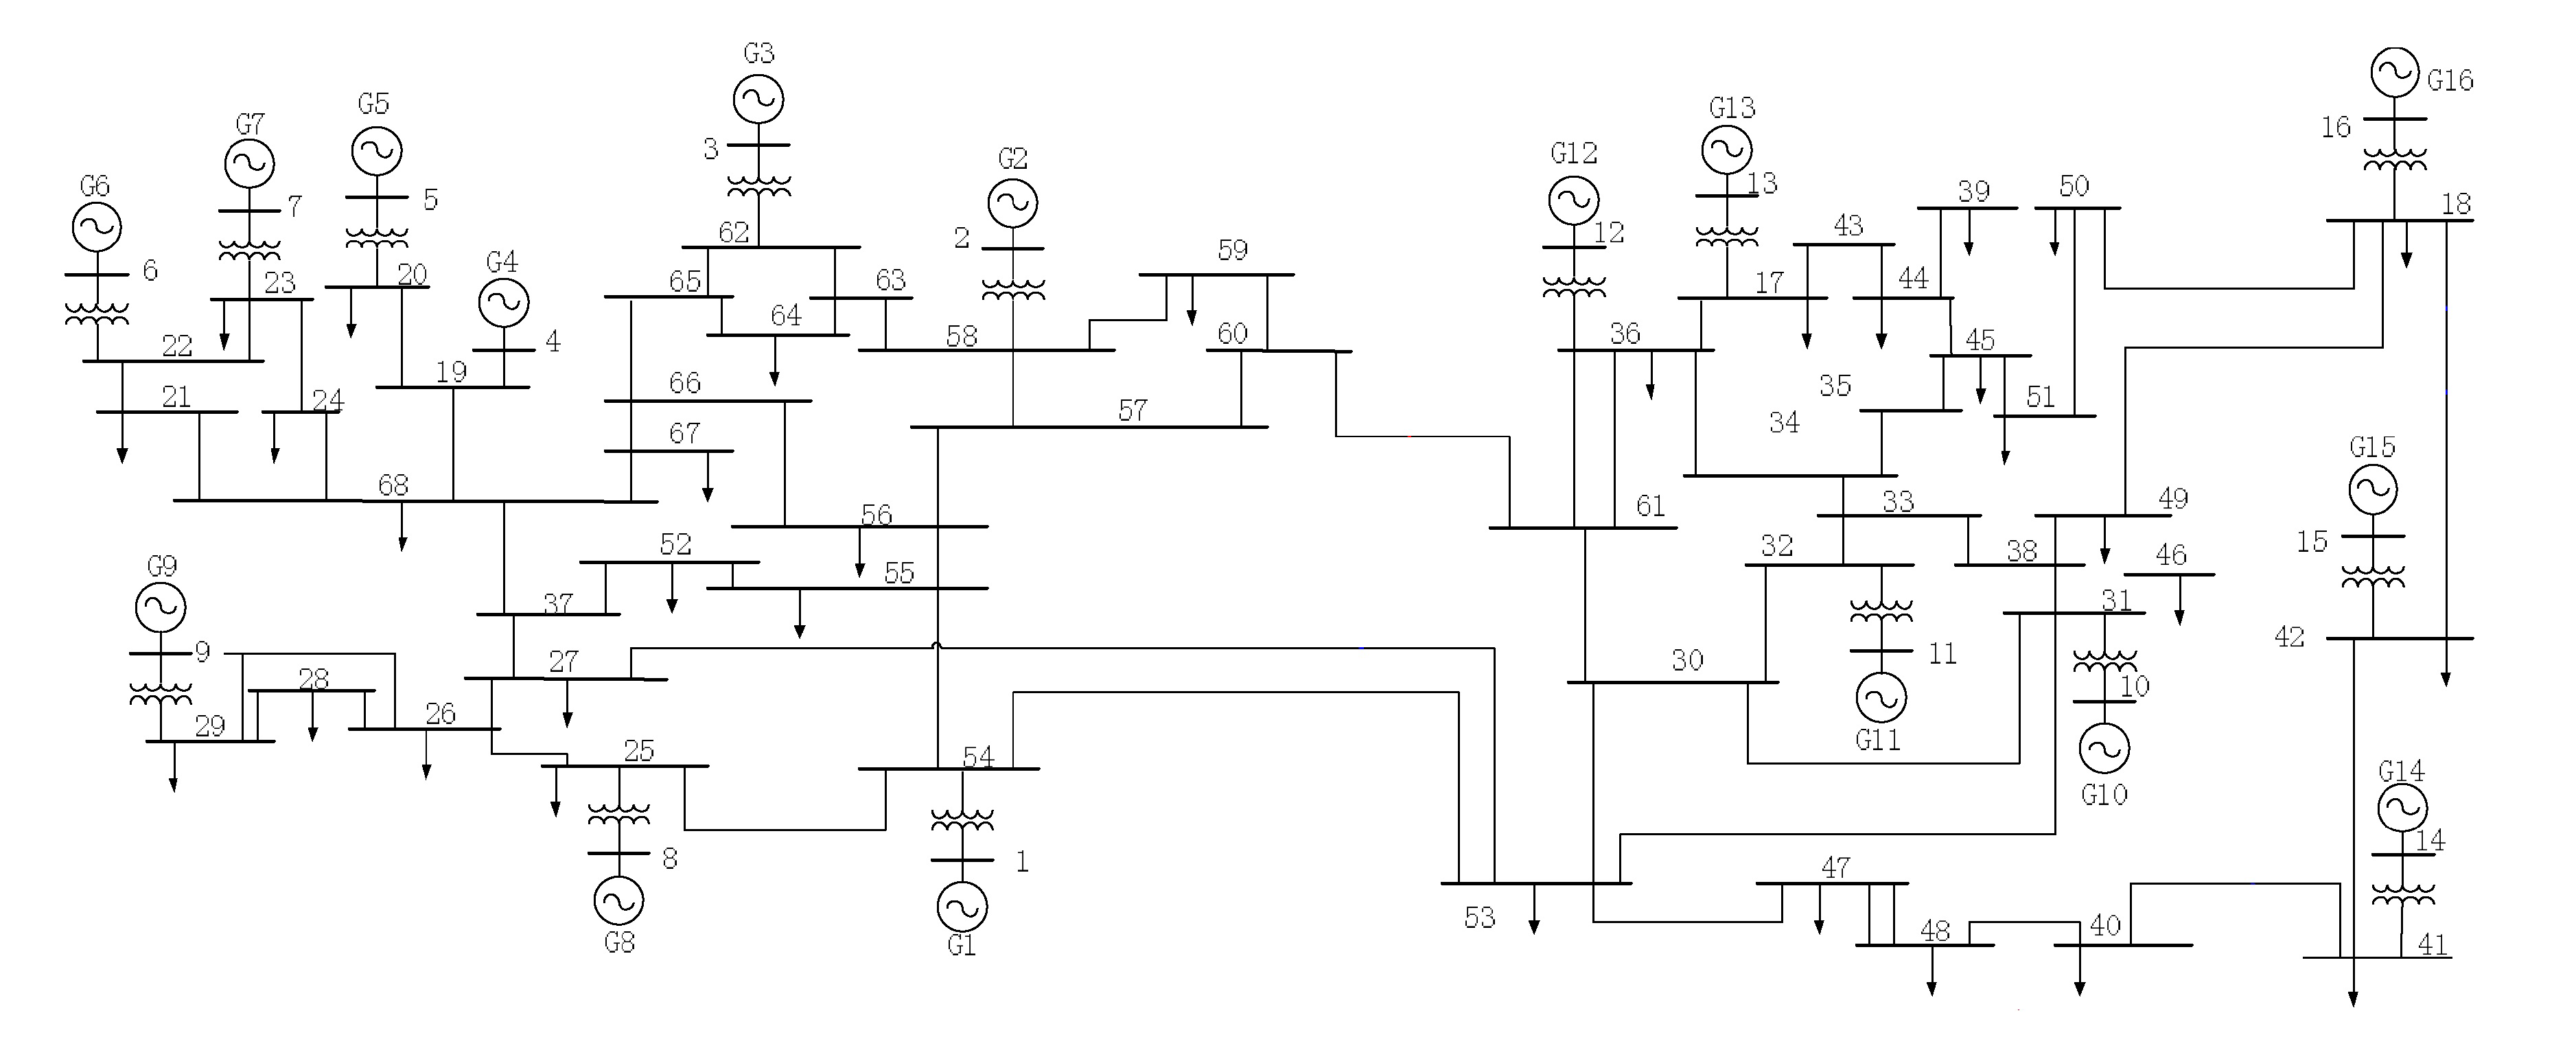
- System IV: 16-machine, 68-bus system.In Figure 5 a unilinear diagram of the 16-machine, 68-bus system, is presented.
4.1. Results Obtained for System I
4.2. Results obtained for System II
4.3. Results Obtained for System III
4.4. Results obtained for System IV
5. Analysis and Validation of Results
5.1. System I Analysis: Three-Machine, 9-Bus
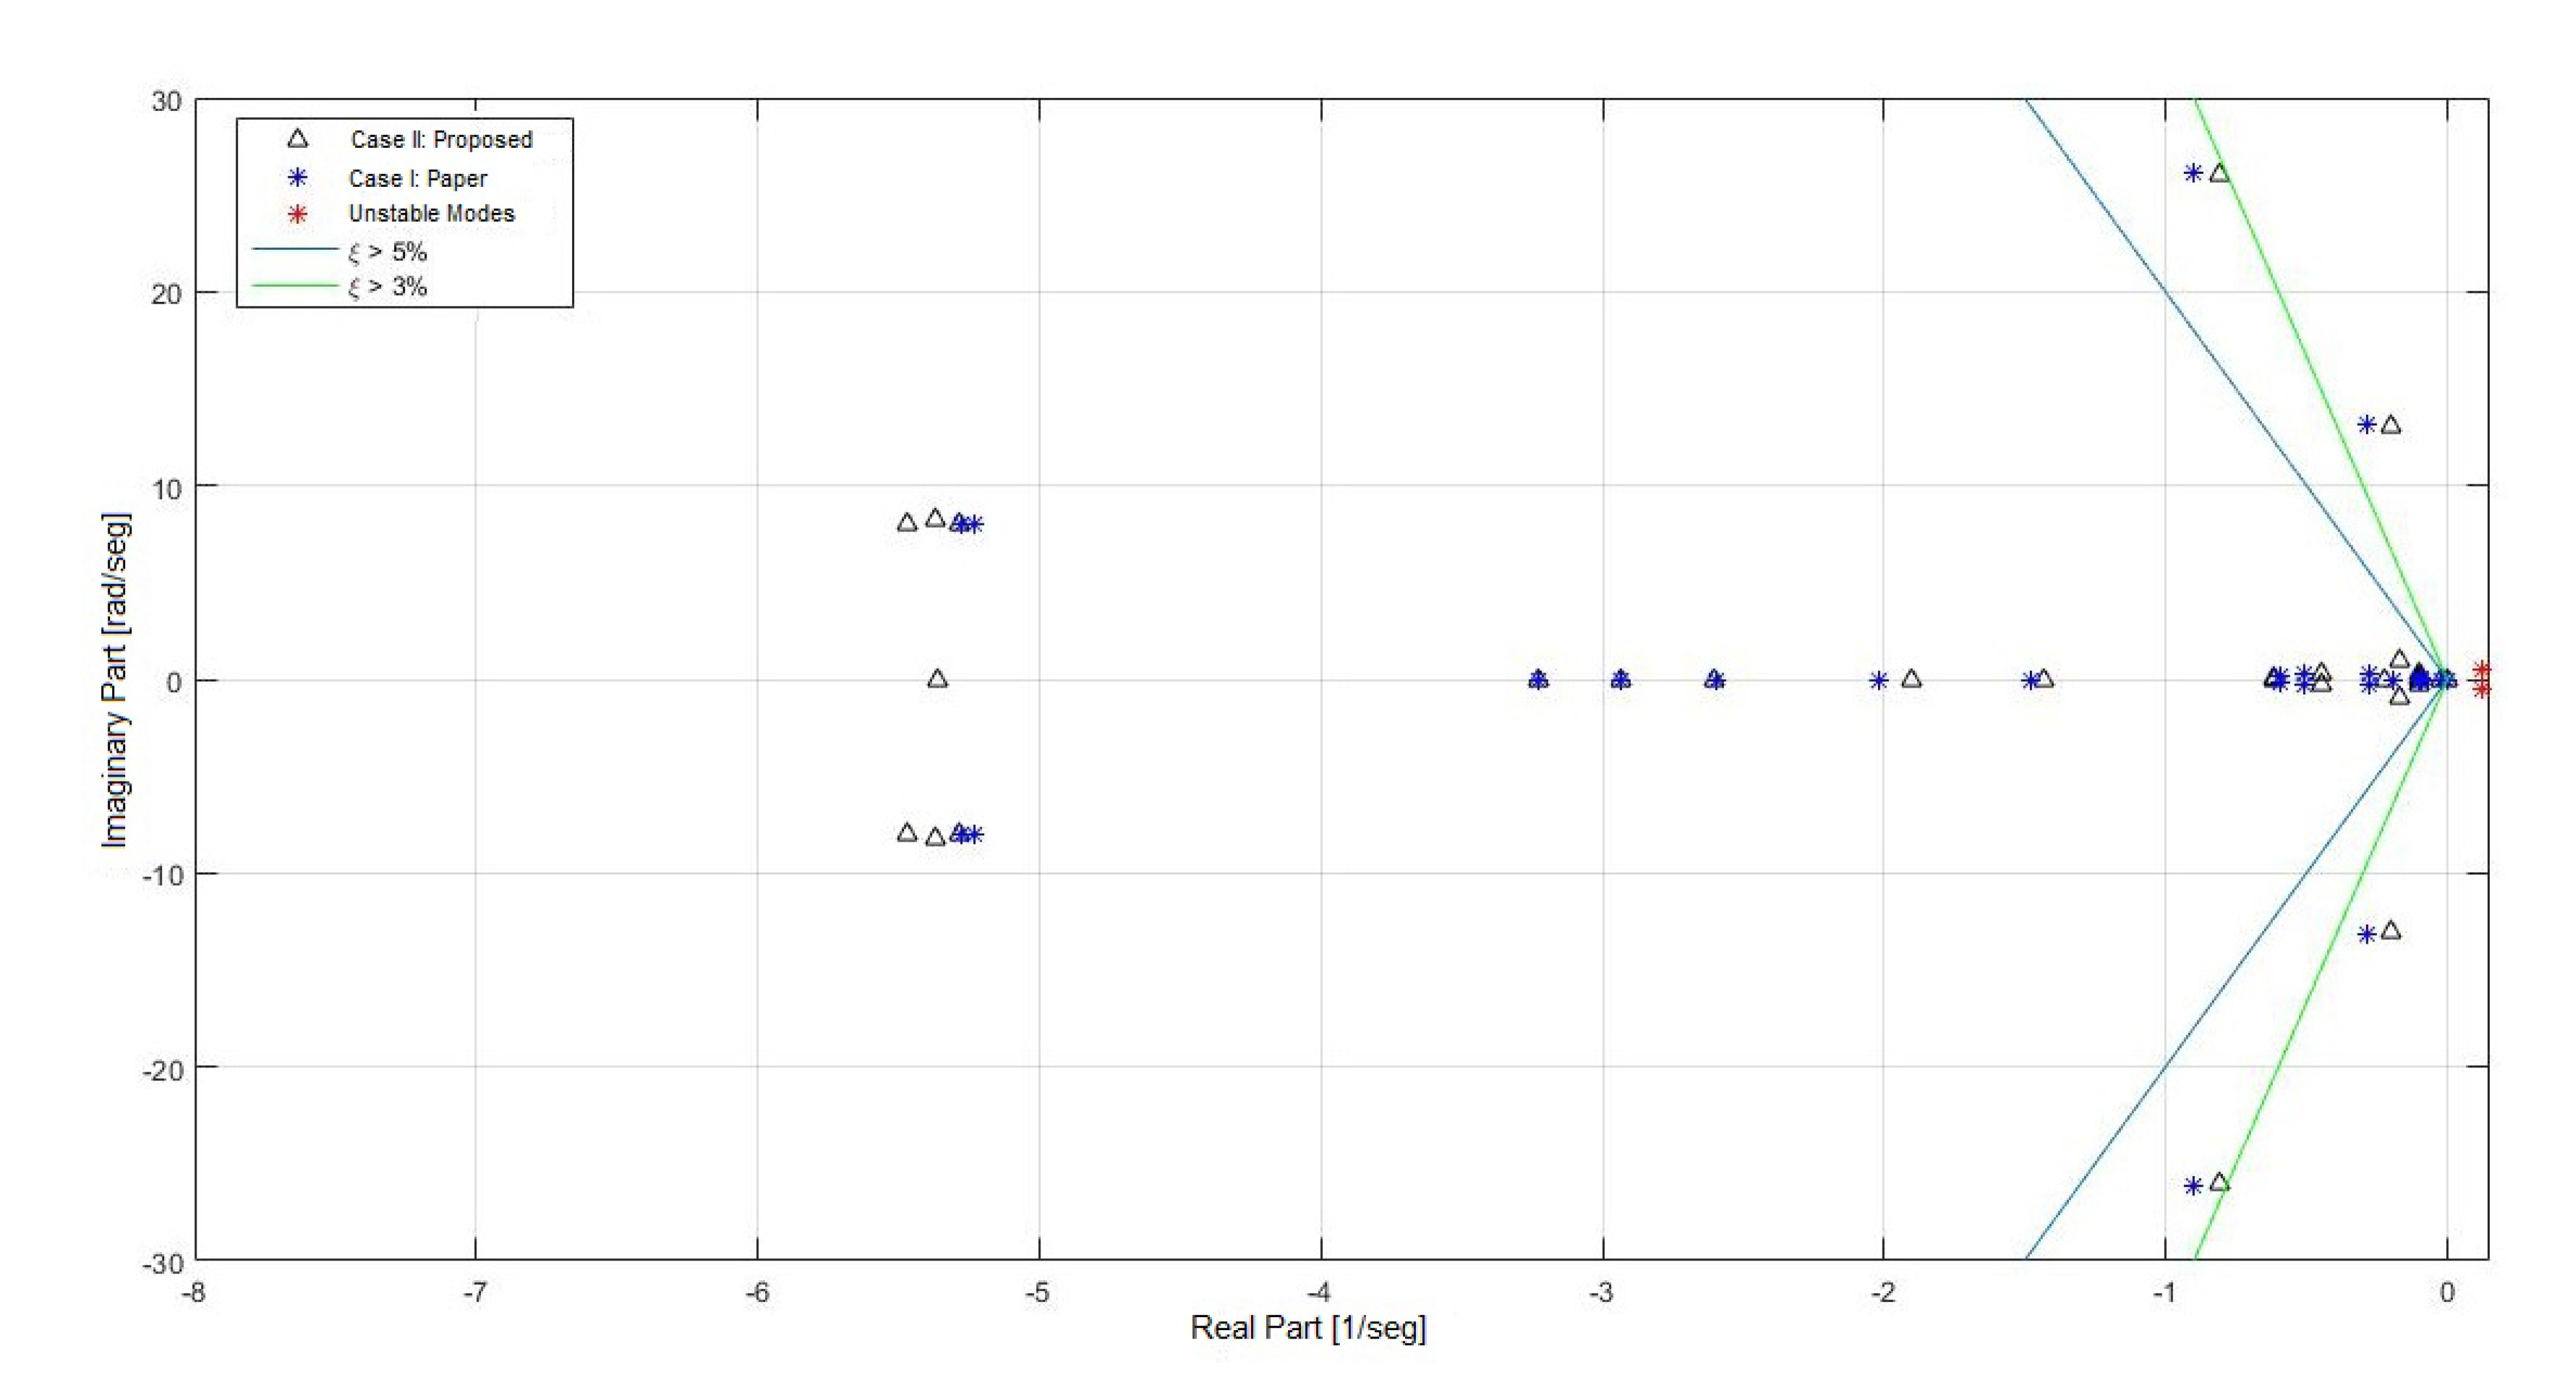
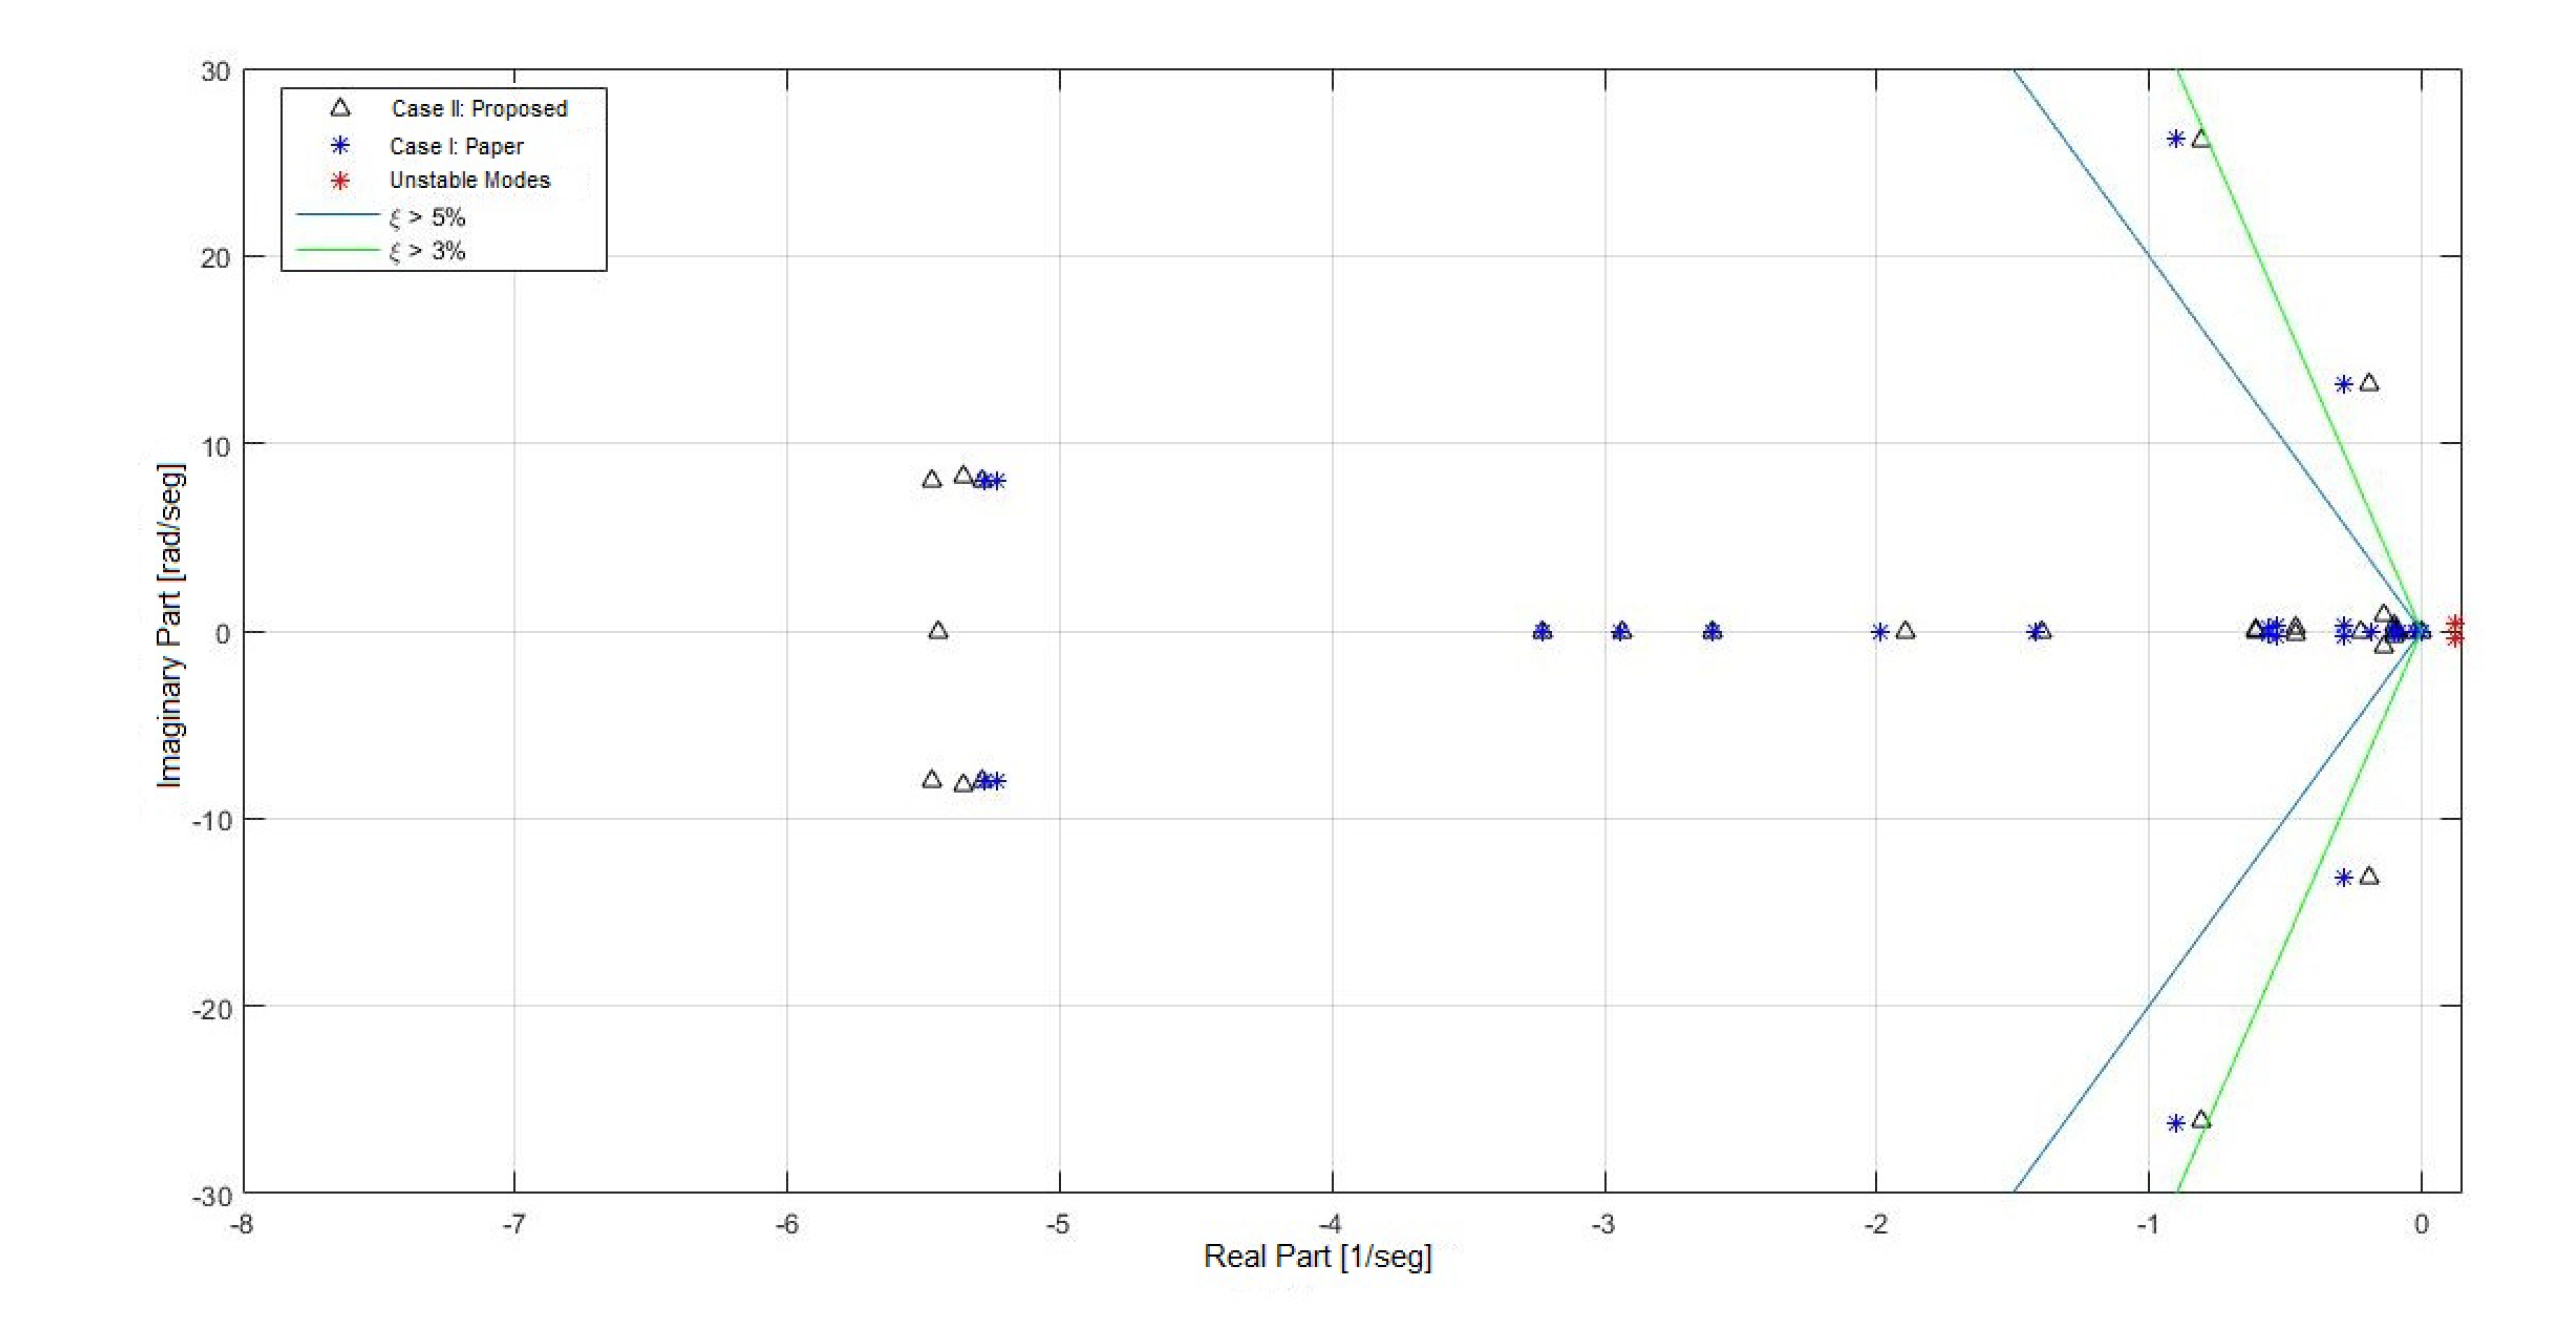
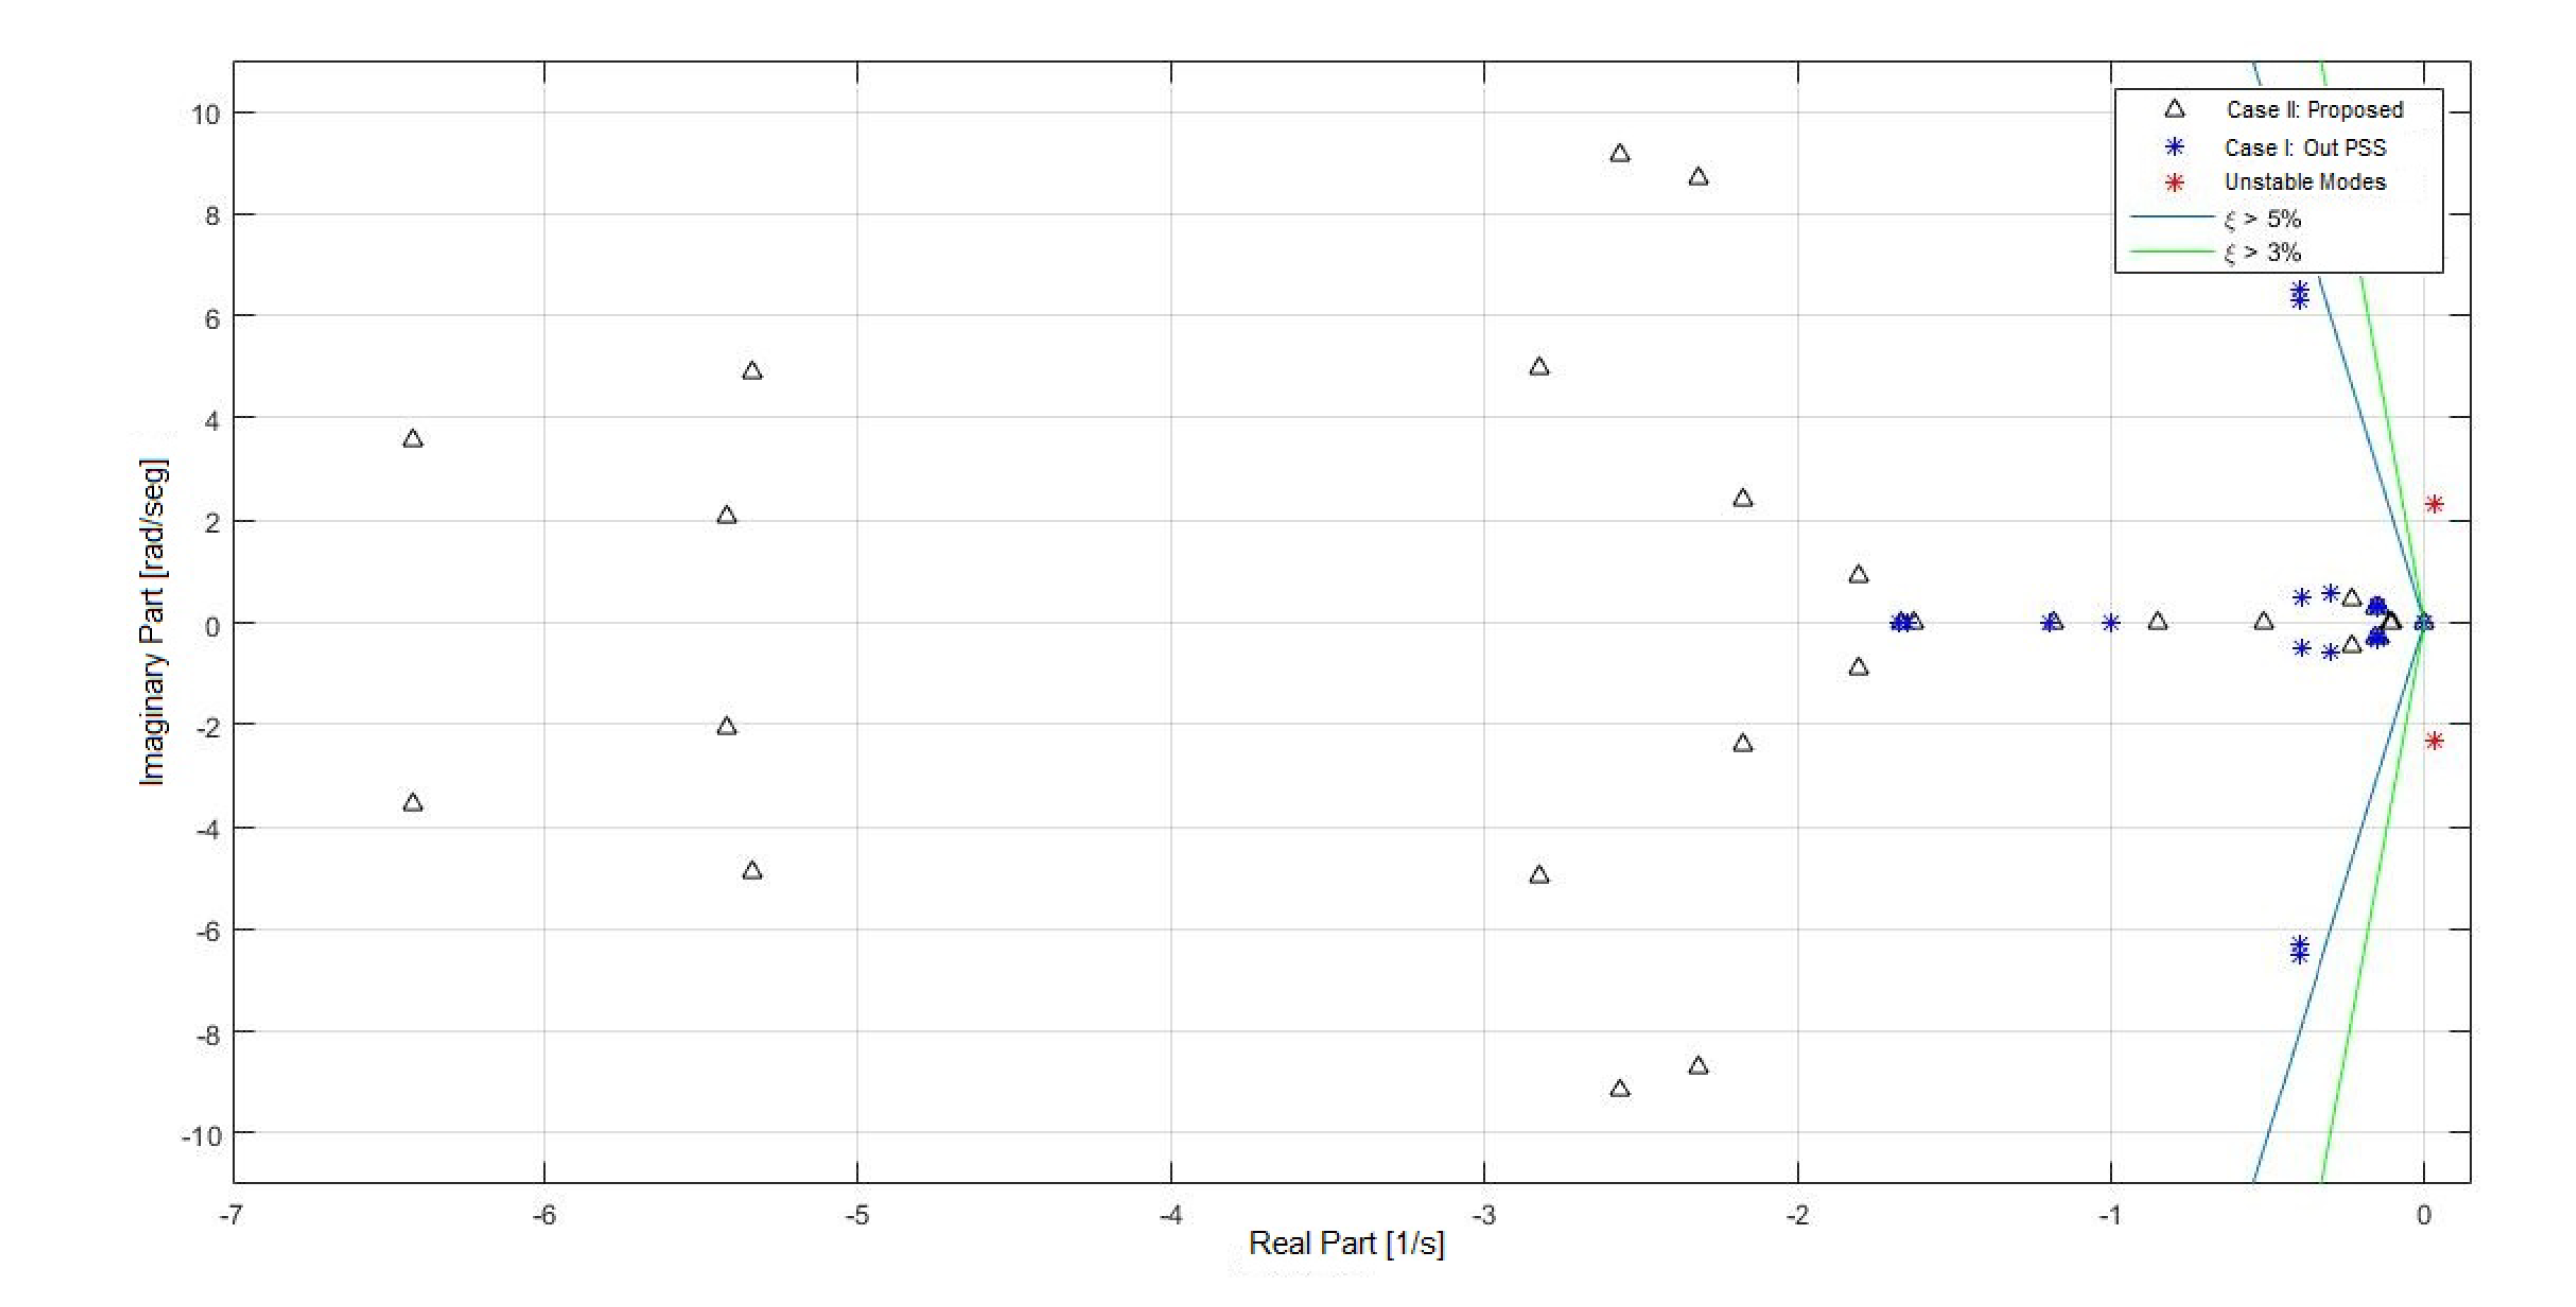
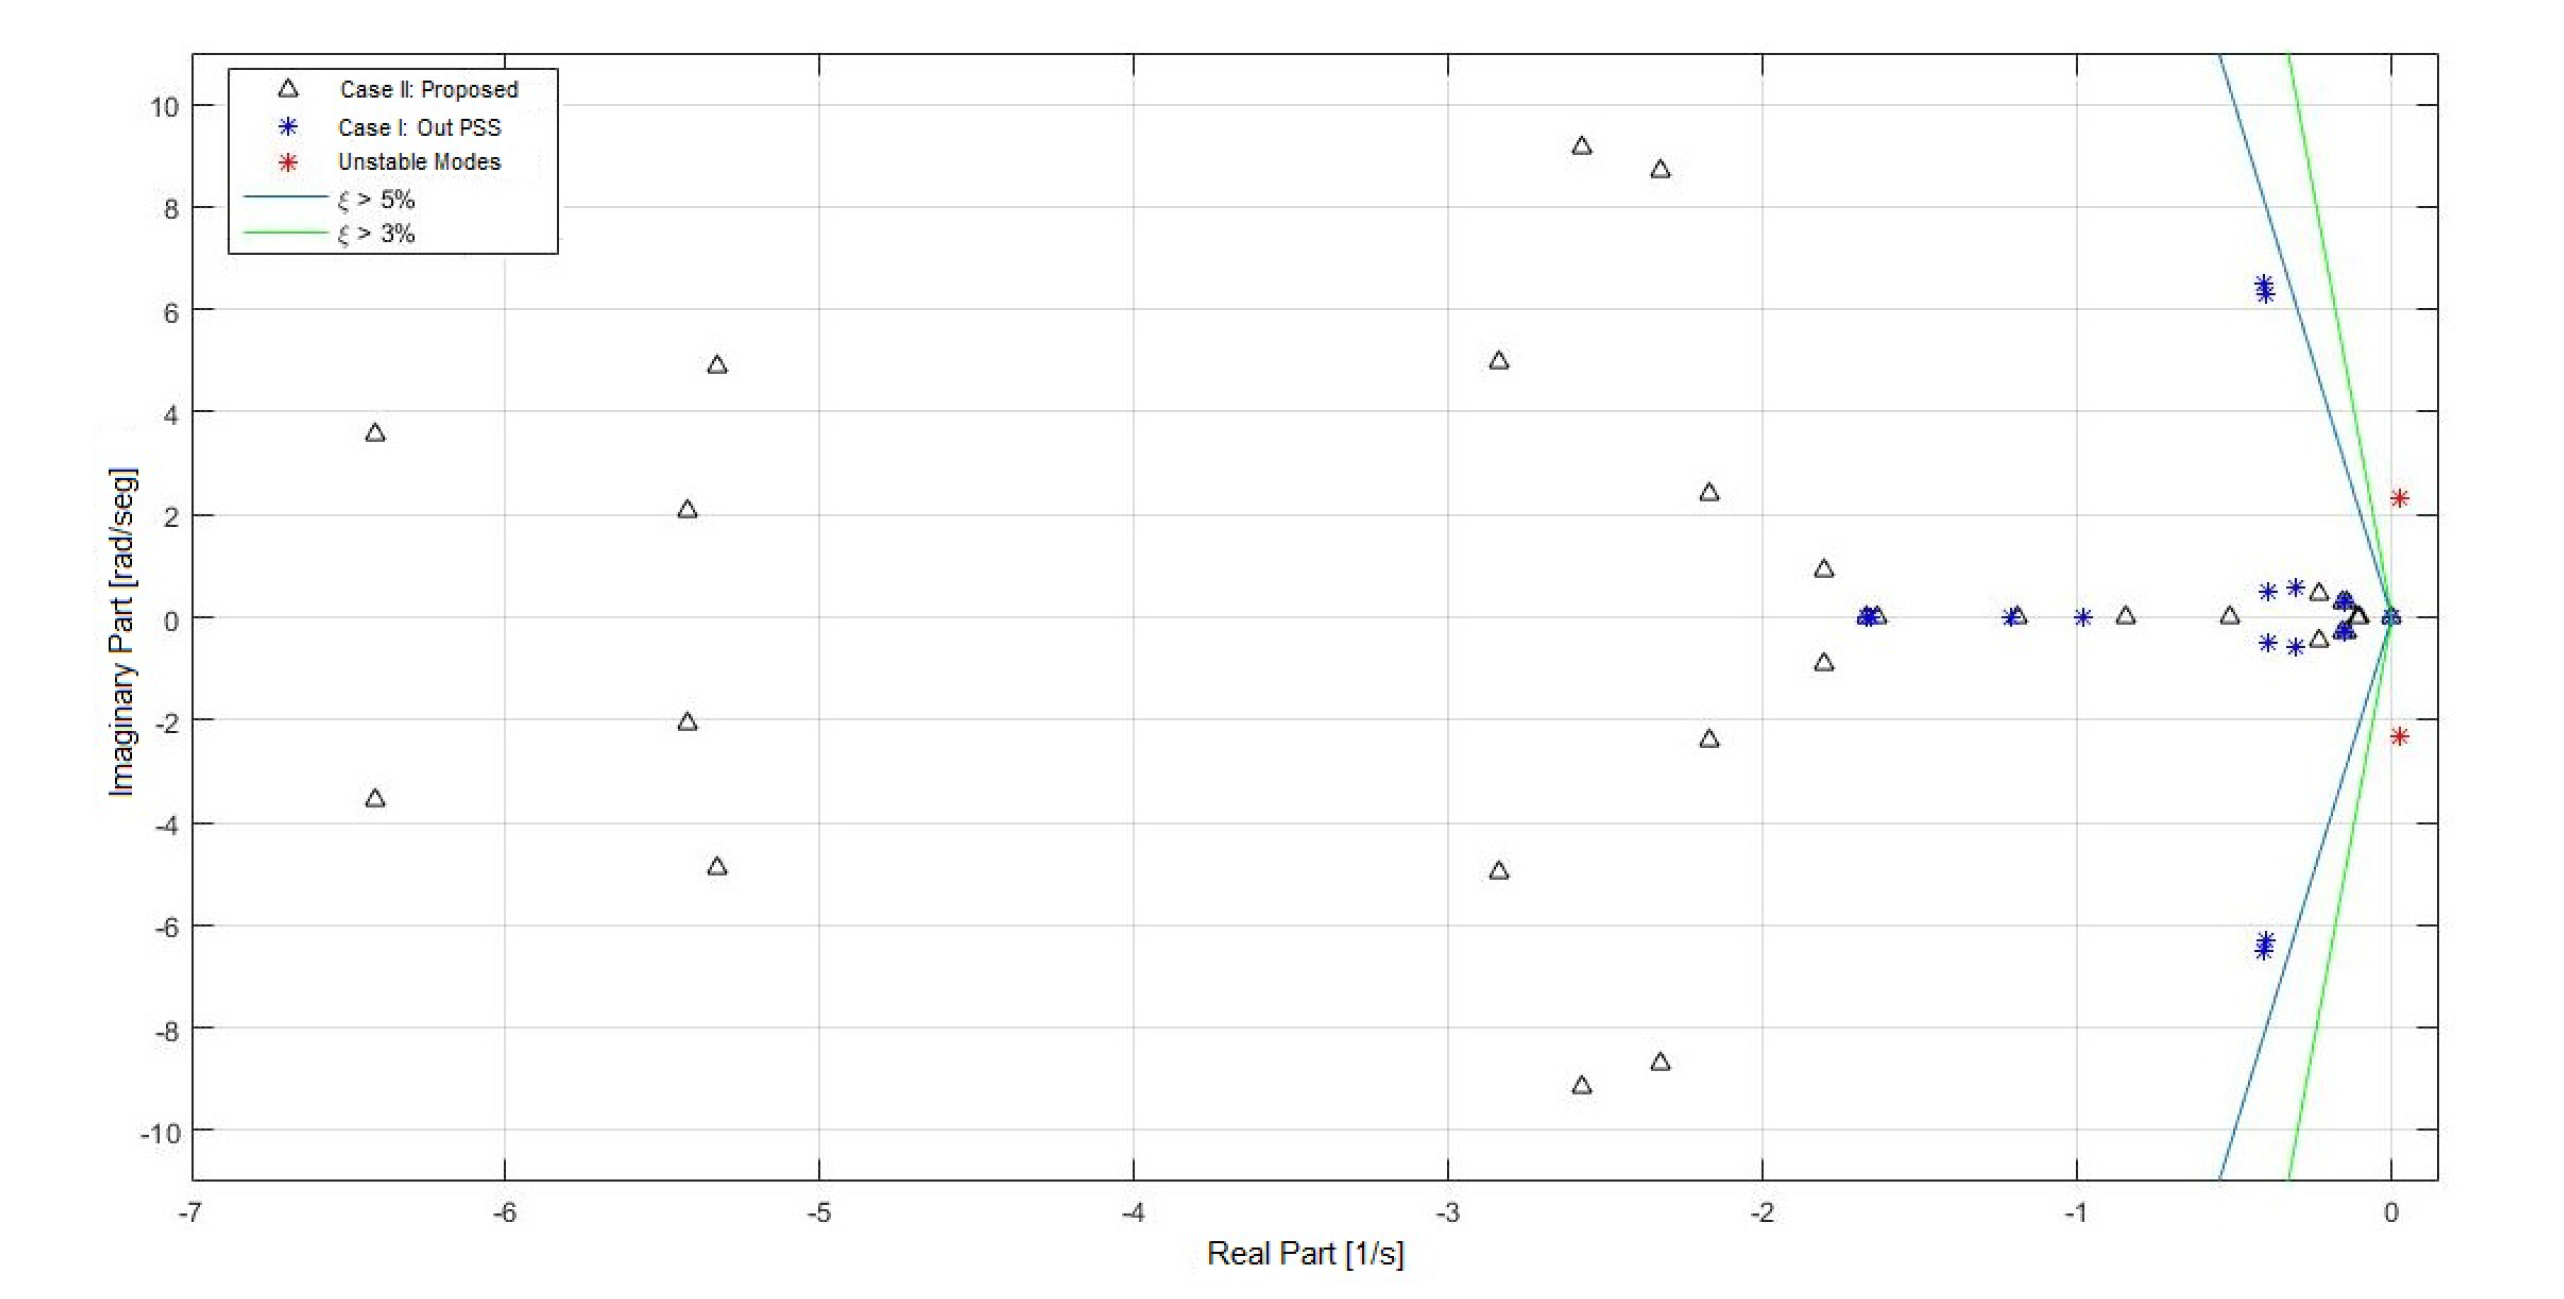
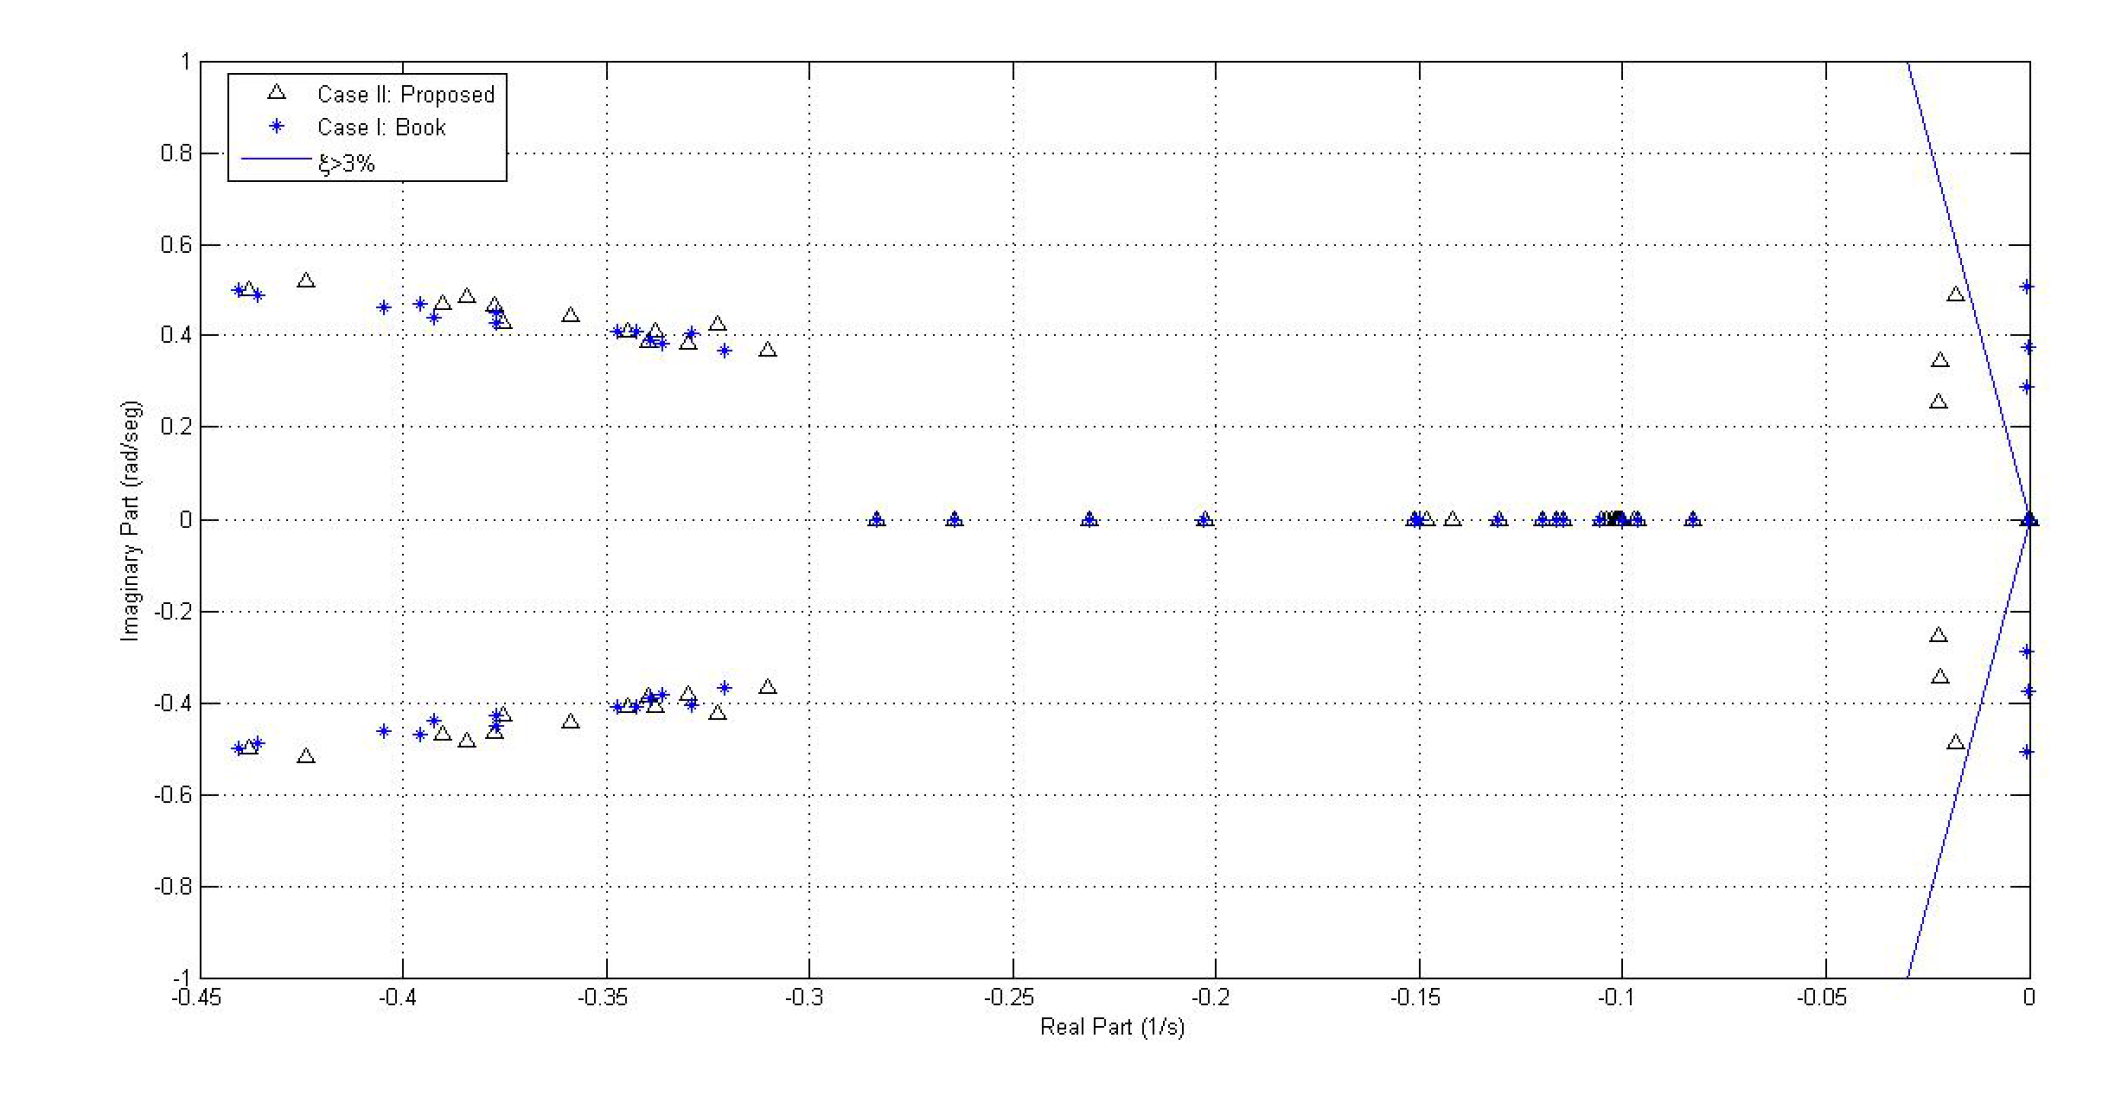
- Eigenvalues of the linearized systemTable 9 displays the eigenvalues of system I, with the respective oscillation frequencies and damping factor:From Table 9 it can be seen that in system 1 there are two pairs of high-frequency, low-damping oscillation modes (1–2 and 3–4) which do not belong to the electro mechanic mode classification and that are present in case 1 as well as in case II. Thus, this is explained as this oscillation modes are not affected by the damping actions of the power stabilizer and are related to other control action.However, it is possible to notice that for case I, because of the inclusion of power stabilizers, two unstable oscillation modes appear, which are a product of the fitting proposed in case I. Nevertheless, after fitting the PSS controllers with the proposed case, the electro mechanic oscillation mode damping increases, moving the eigenvalues towards the left of the complex plane.In Figure 10 the comparison among the eigenvalues of case I and case II can be appreciated.
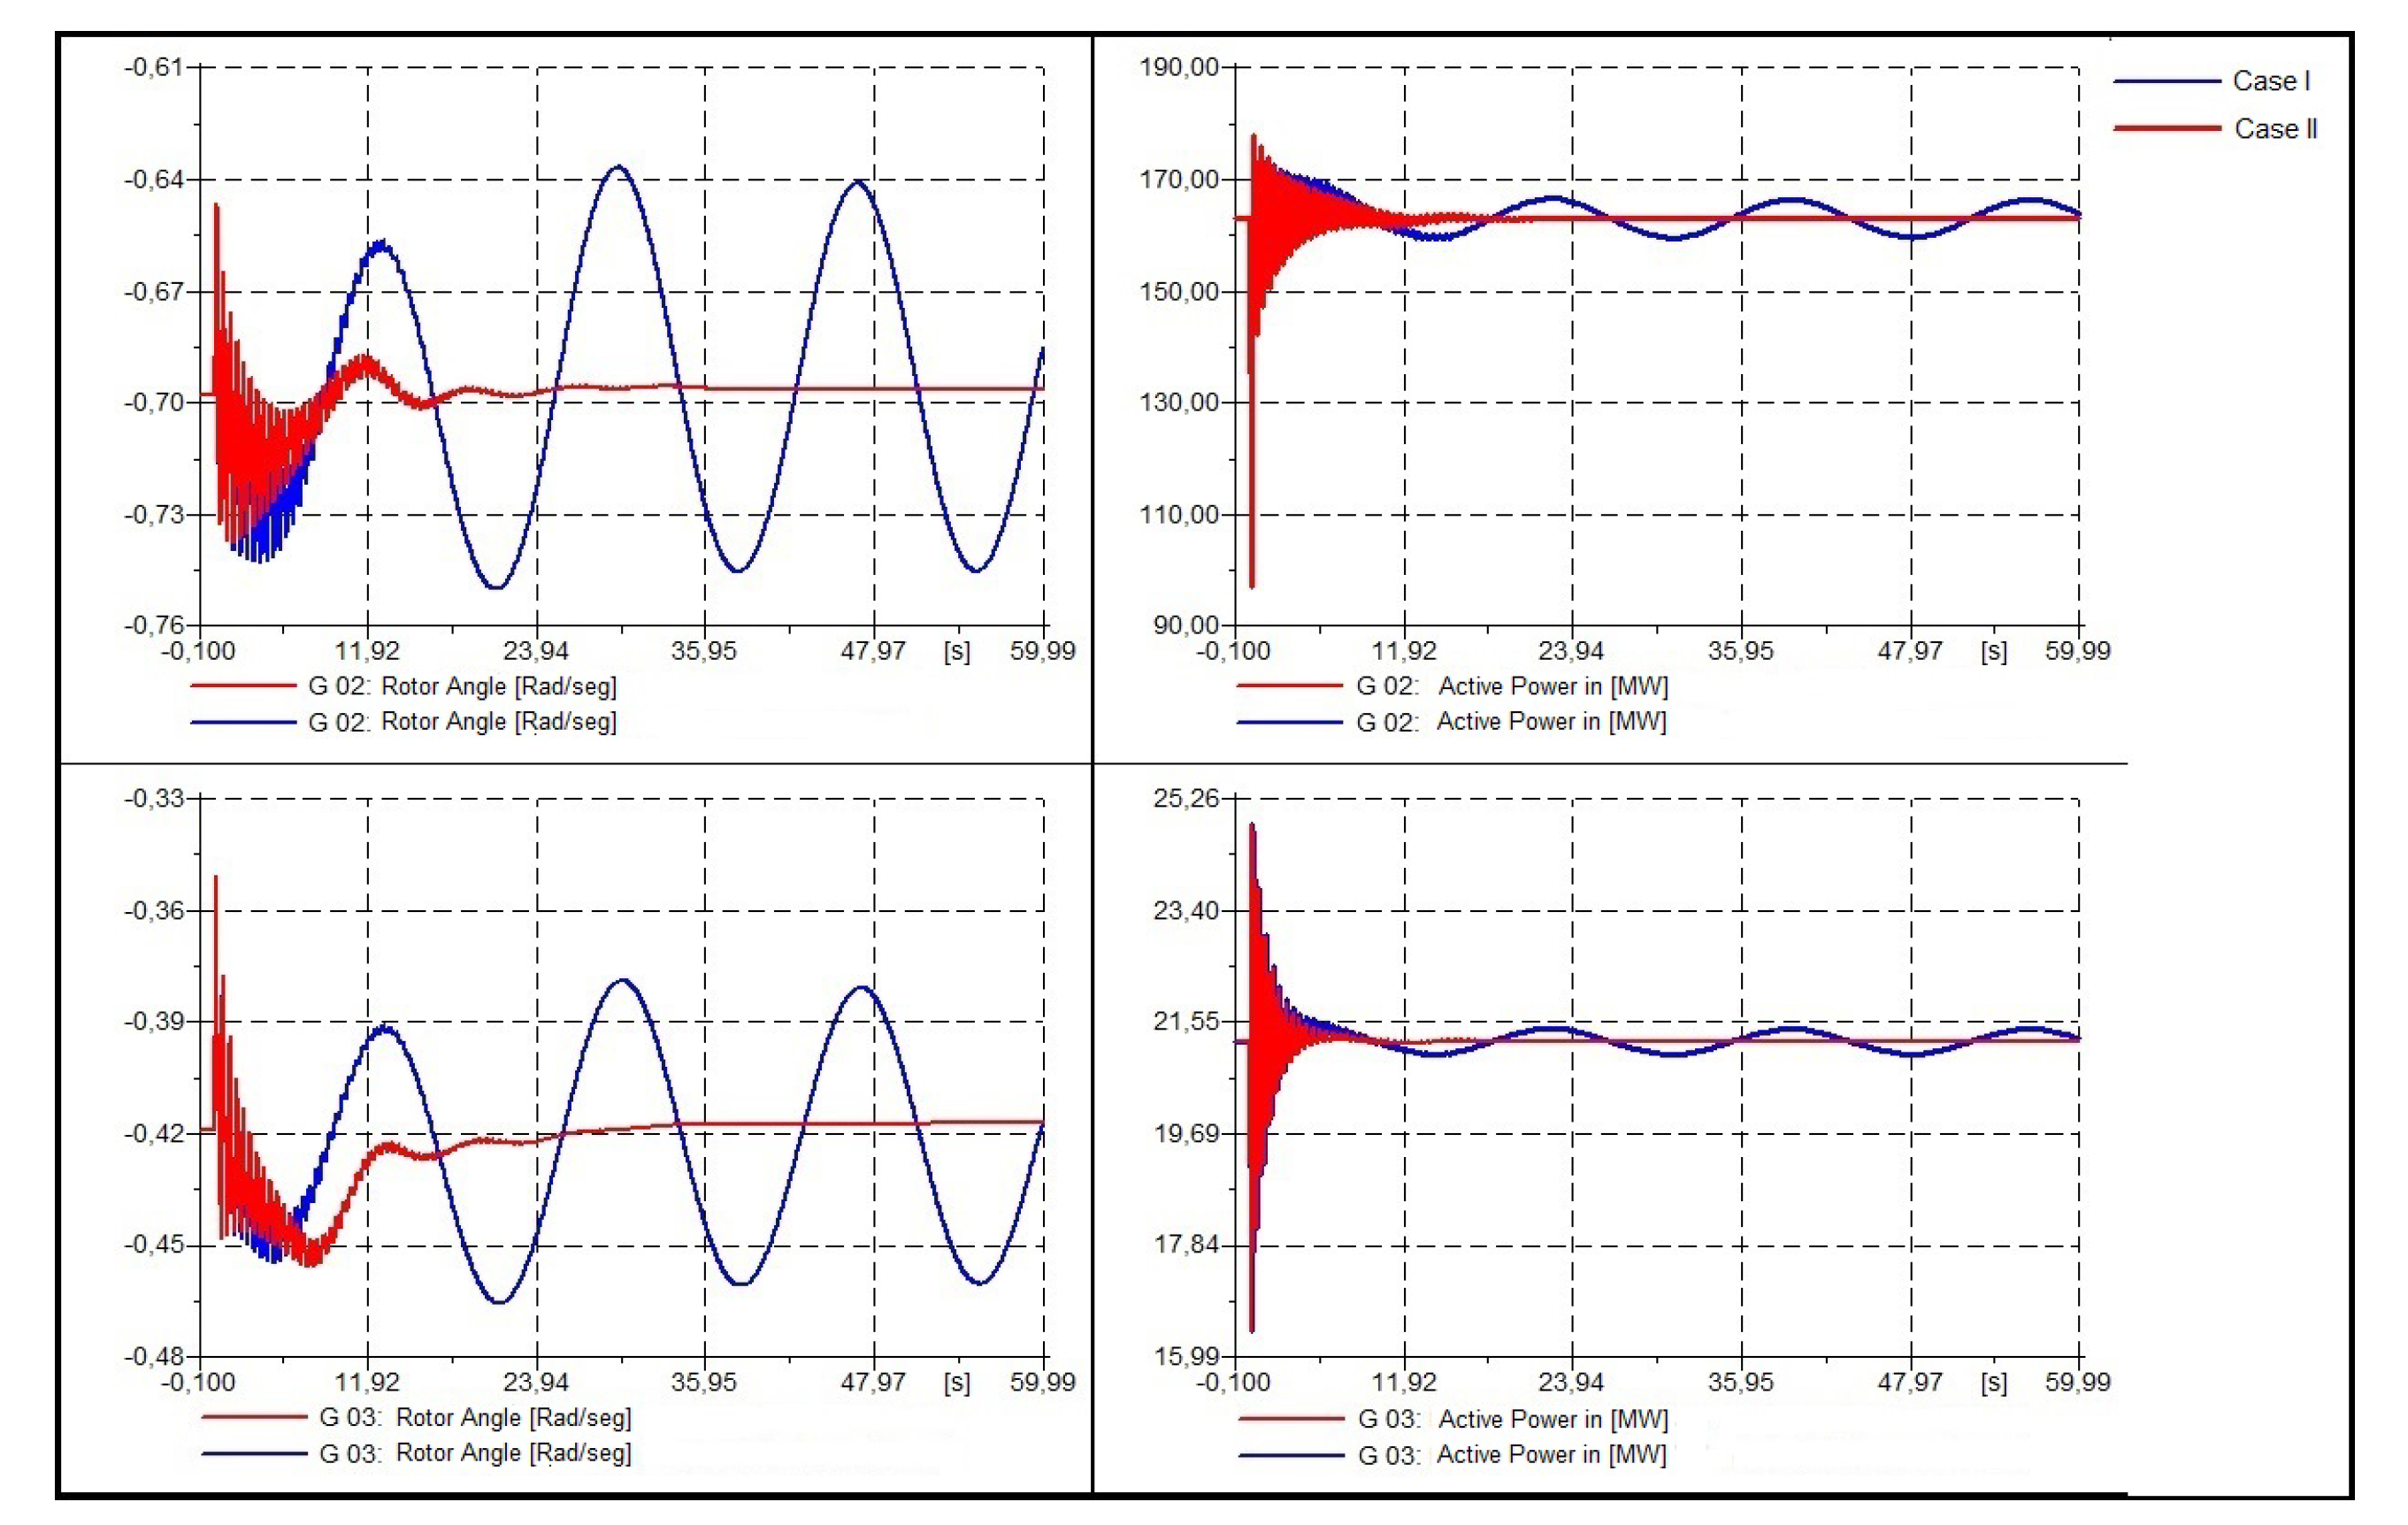
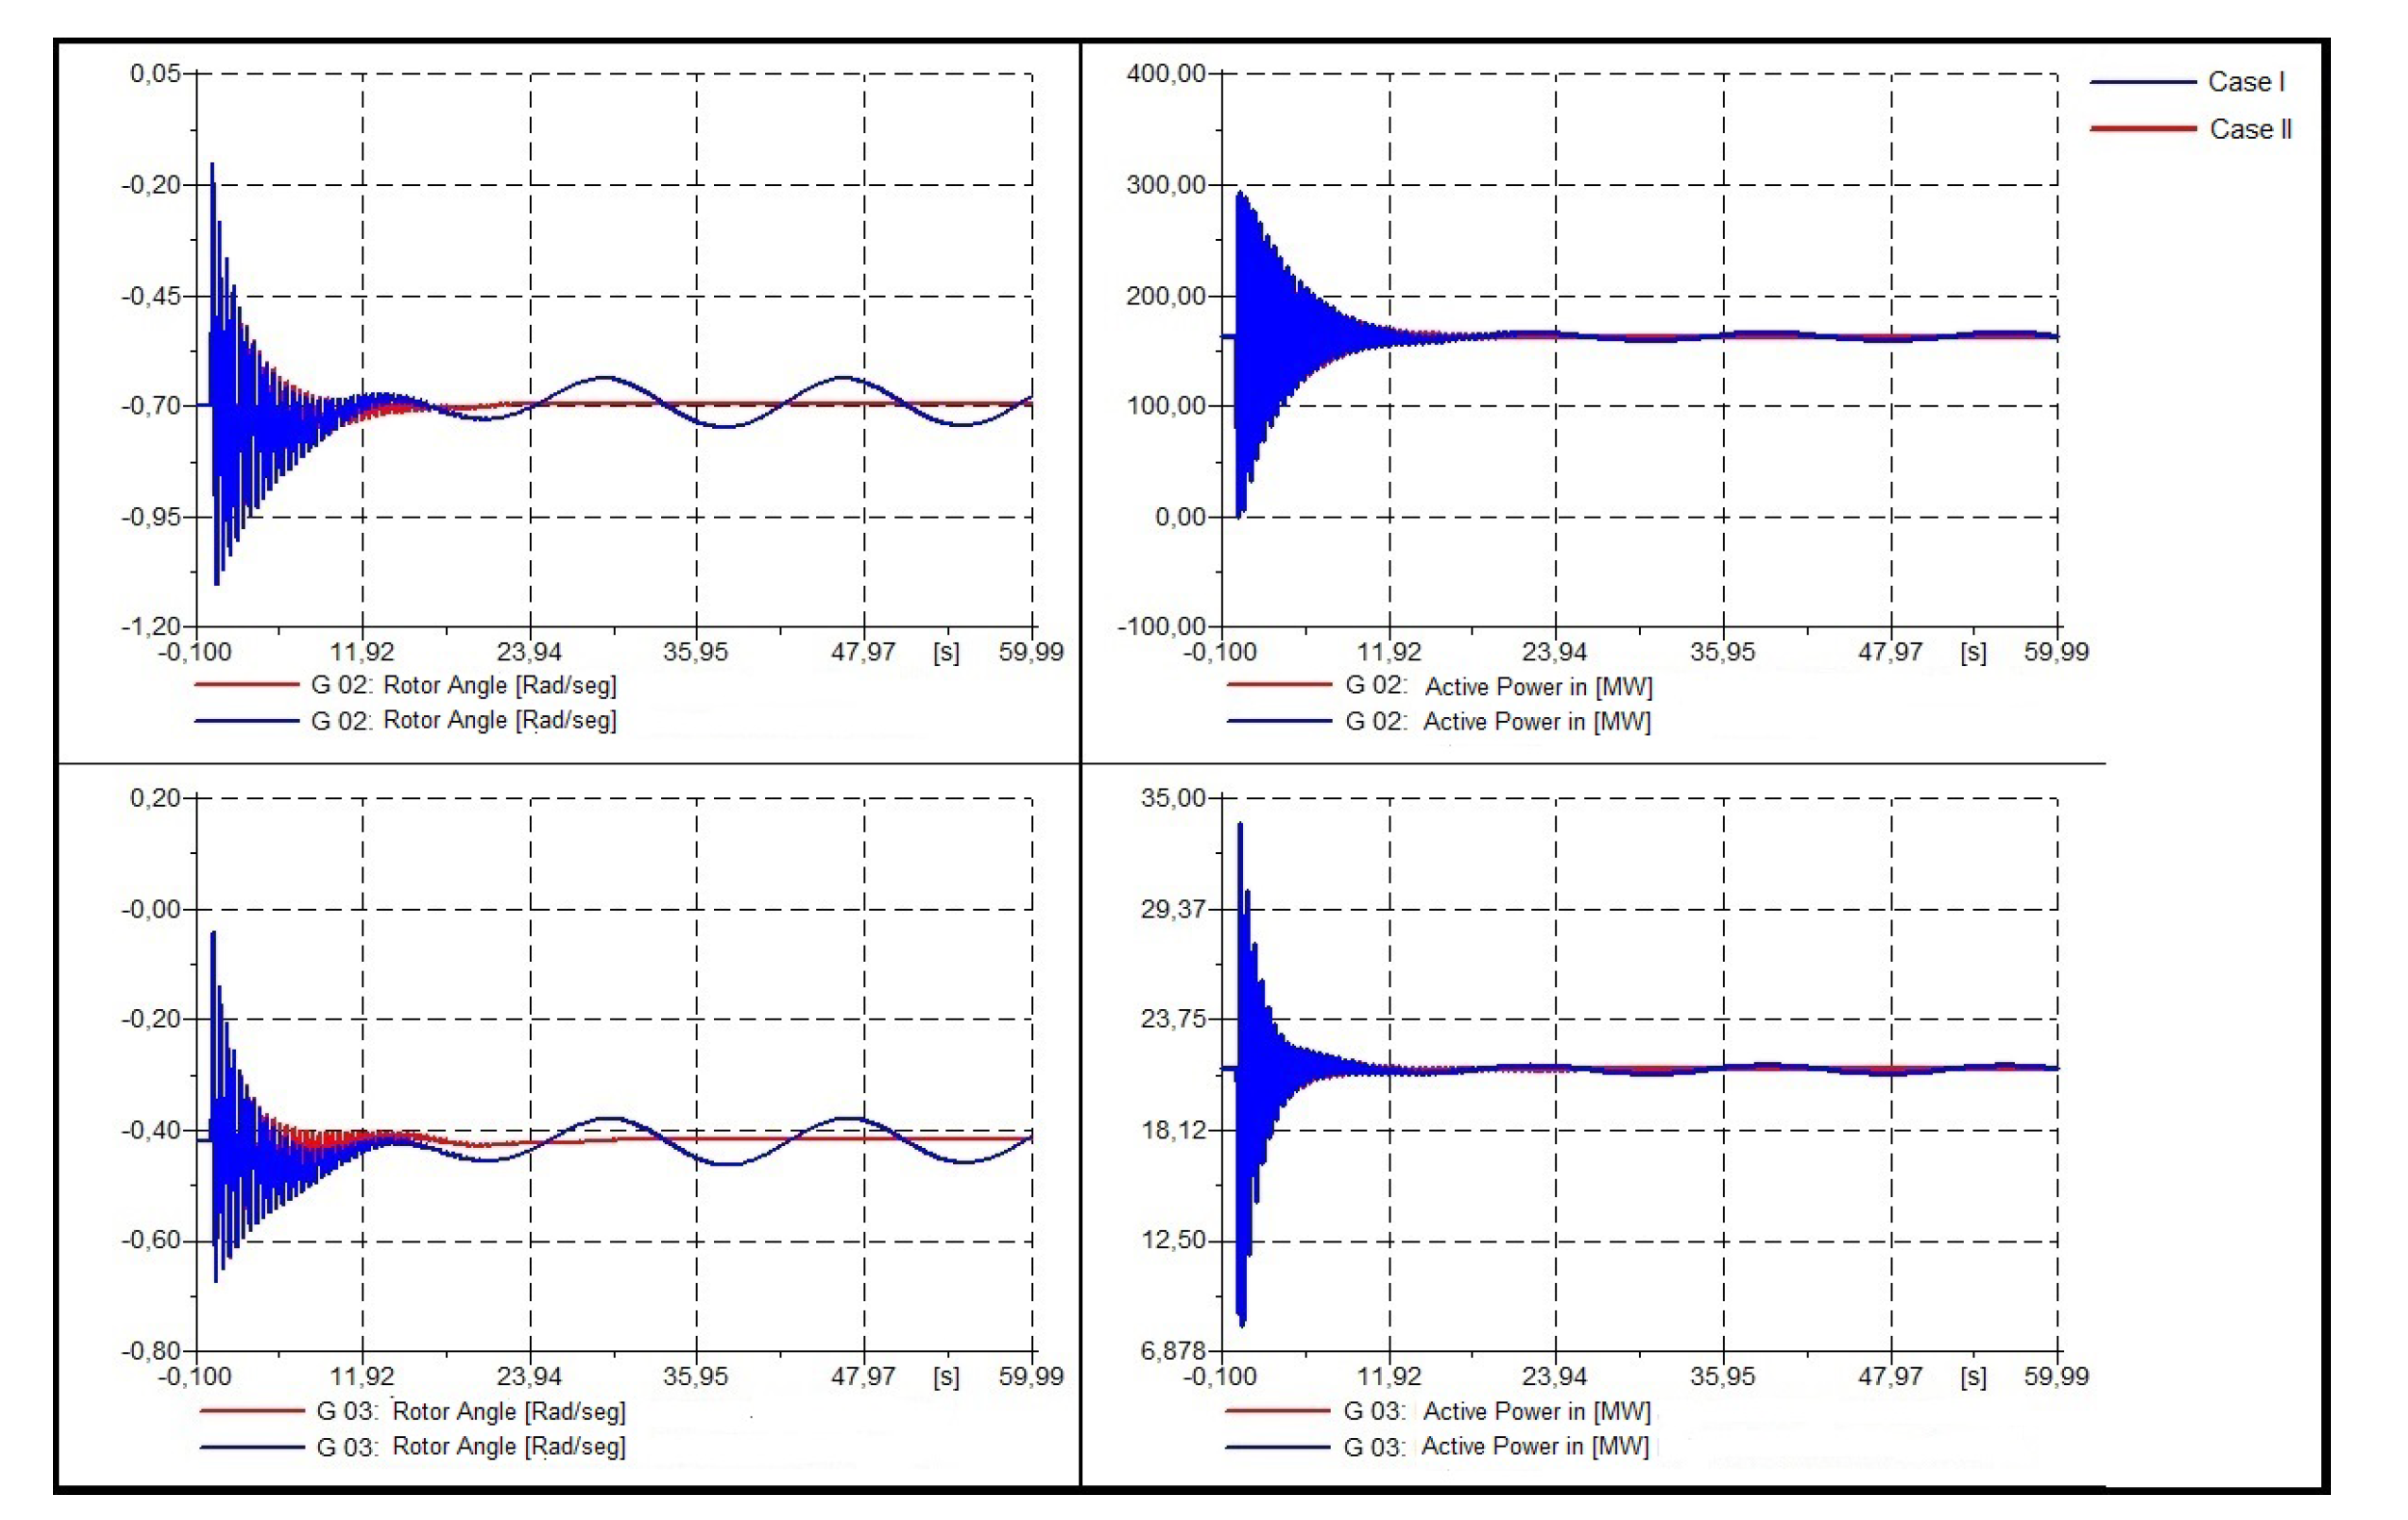
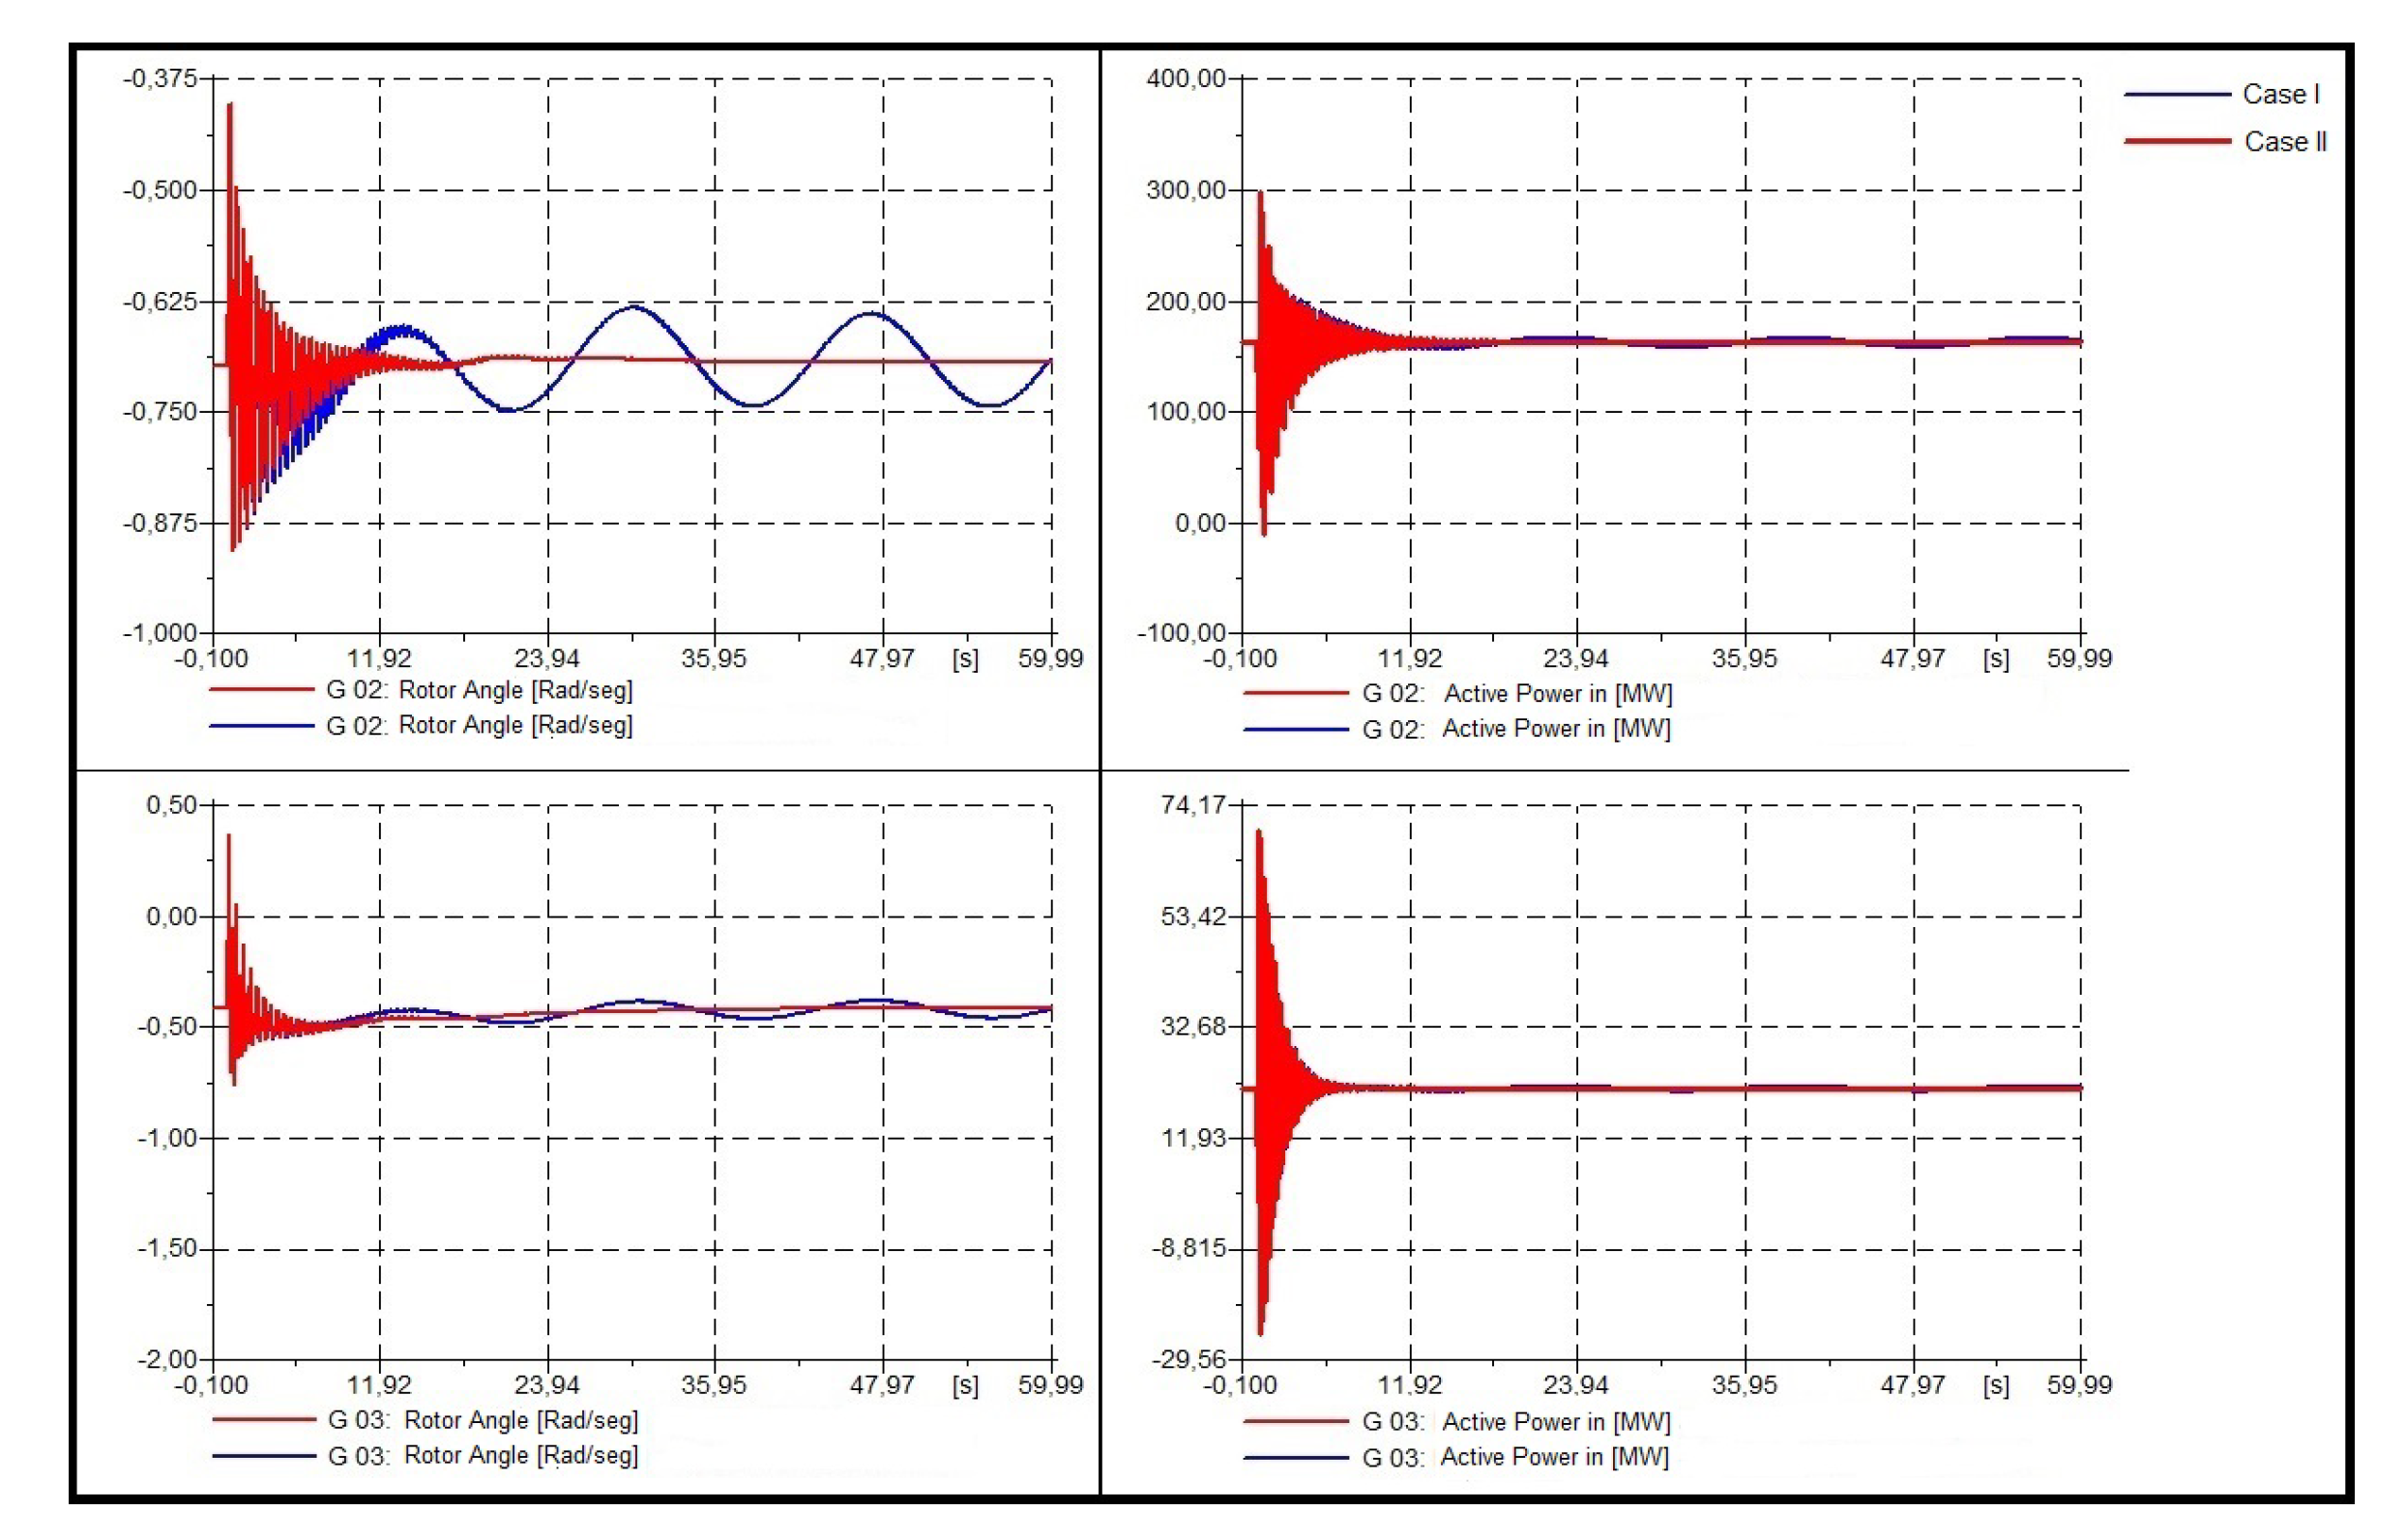
- Dynamic response of the system.To validate the results obtained, three 3-phased faults were modeled in bus 4, bus 7, and bus 9, in order to analyze the dynamic response of the oscillation modes (see Figure 11, Figure 12 and Figure 13). Each fault has been applied in t = 1 [s] and cleared in 5 cycles, that is to say, t = 1.1 [s]. Henceforth, color blue will show case I and color red case II.
- Dynamic response at bar 4.
- Dynamic response at bus 7.
- Three phase fault at bus 9.
- Heavy and light load conditions.Thirdly, the eigenvalues of the system for heavy and light load are presented, where an increase and reduction of the 20% for each load was considered. Both cases are displayed in Figure 14 and Figure 15, respectively.From the above presented figures, it can be seen that the proposed tuning for case II provides a response in which the system is stable; however, it does not reach the 3% damping of the oscillation modes, similarly to the operational normal condition. However, it is possible to notice that for case I, the system has values with a positive real part for both heavy and light loads. Therefore, the fitting proposed for this study improves the stability of the system for the simple contingency conditions.
5.2. System II Análisis: 4-Machine System
- Dynamic response of the system.For this system two three-phase faults were modeled in order to validate the results. The first one is a three-phase fault in 50% of circuit 1 of line 7–8 (see Figure 17), while the second one is a three-phase fault in 50% of circuit 1 of line 8-9 (see Figure 18). Both faults occur at t=1 [s] and are cleared off at t=1,1 [s] (5 cycles). The reference machine of the system was not analyzed in this study.
- Three phase fault at C1 line 7–8.
- Three phase fault at C1 line 8–9.
- Simple contingency conditions.As a complement of the previous analysis, the eigenvalues obtained for system II under simple contingency conditions are presented; in particular, circuits 1 of line 7–8 and line 8–9, respectively, will be taken out of service, as can be seen in Figure 19 and Figure 20.From the above figures, the proposed fitting can be noticed, providing a good system response since the damping eigenvalues exceed the minimum 5% proposed in the methodology.
5.3. System III Validation
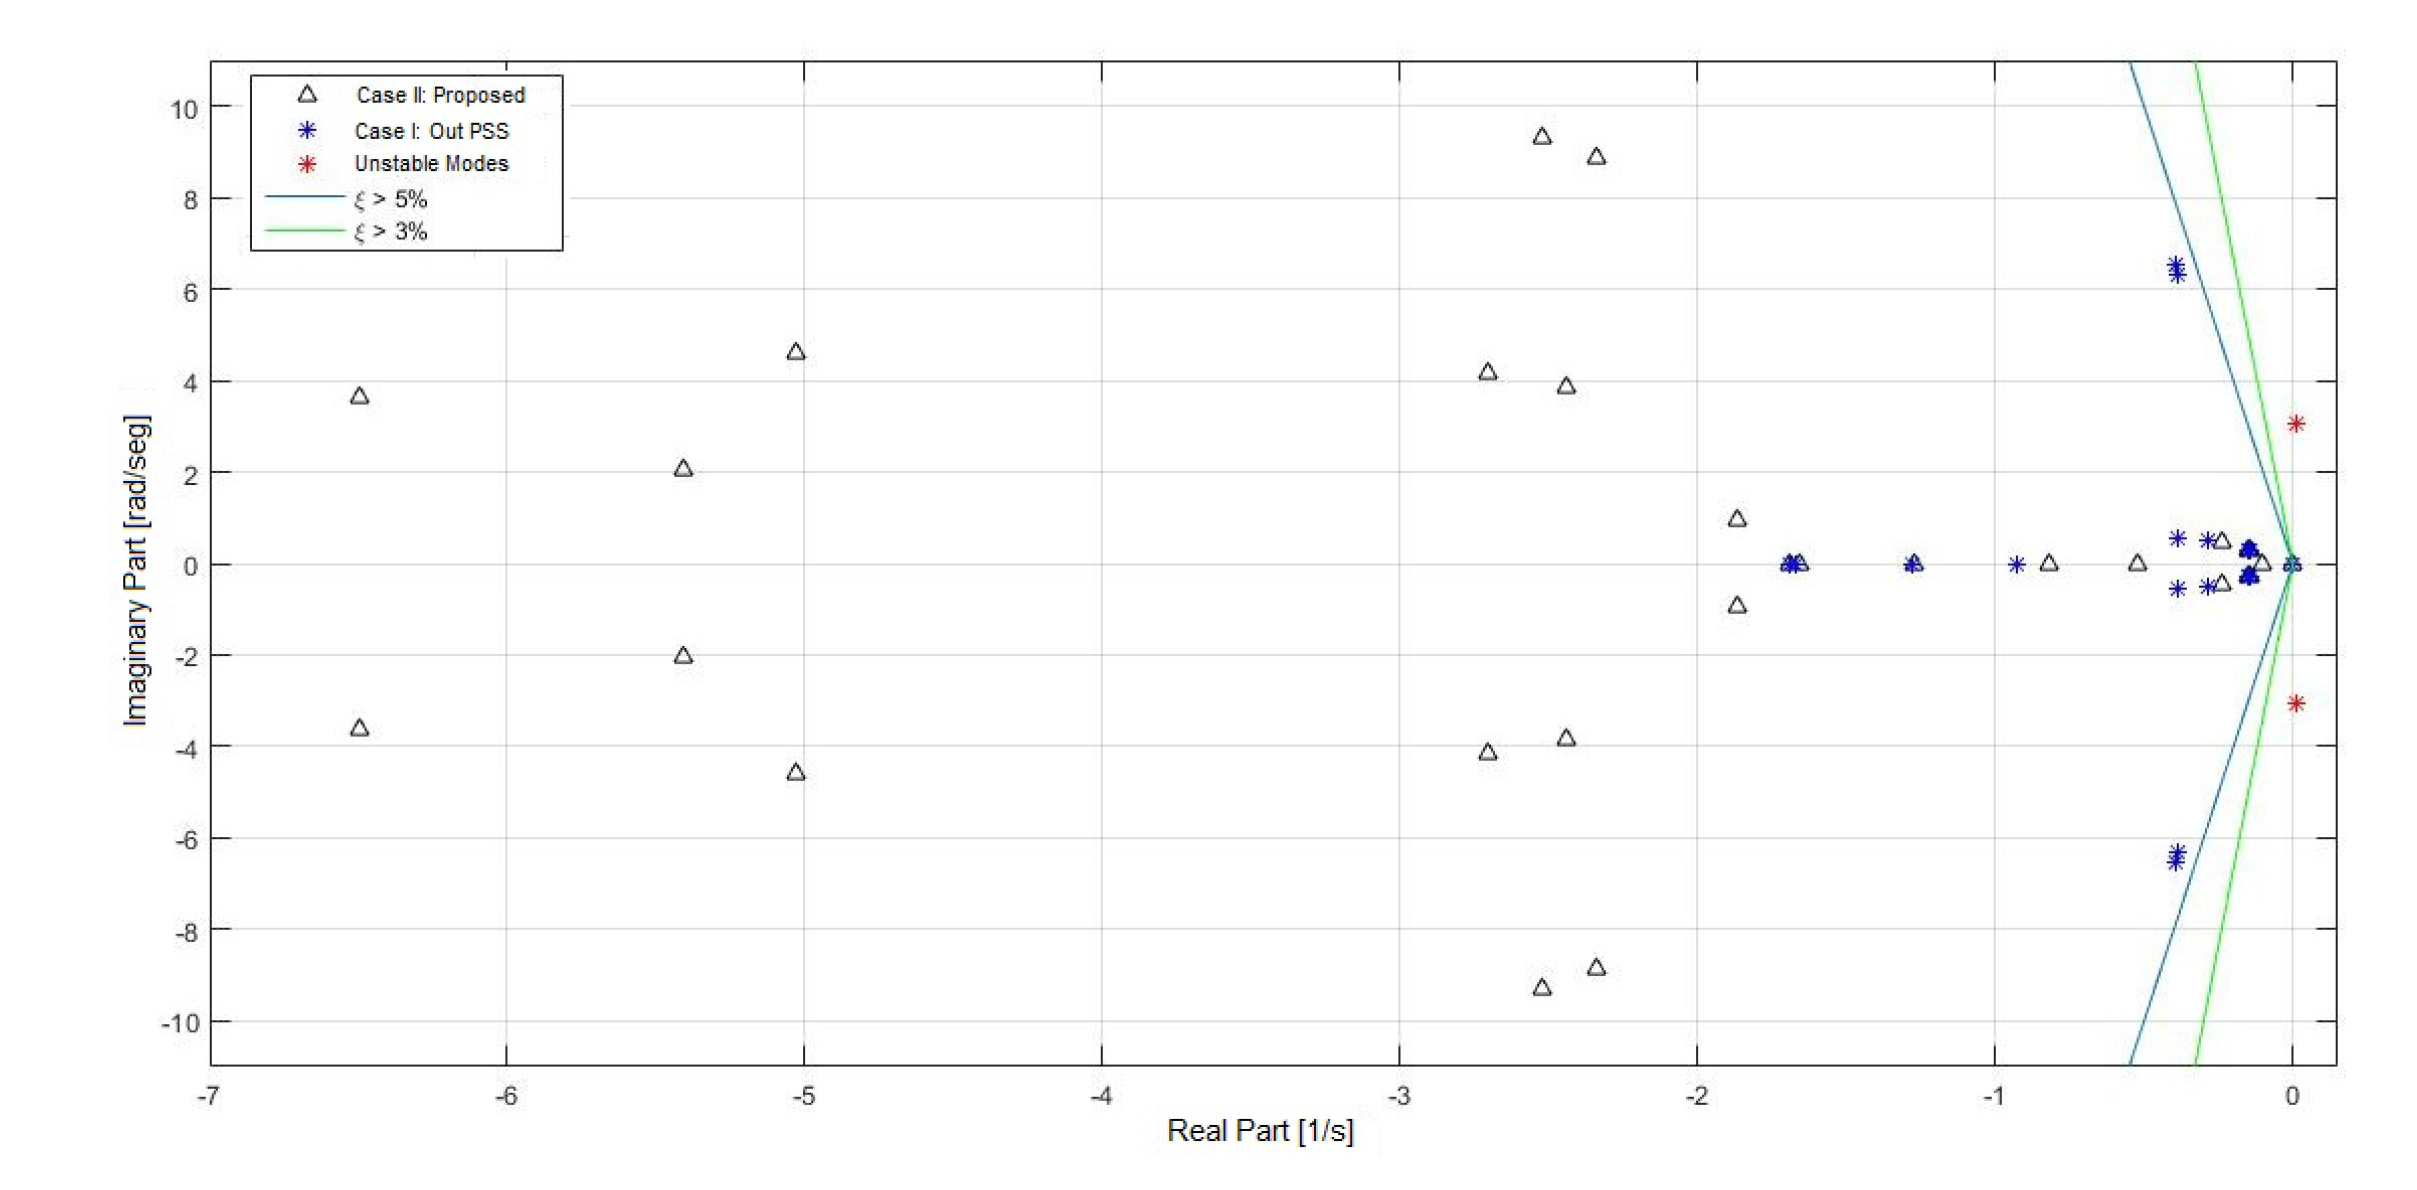
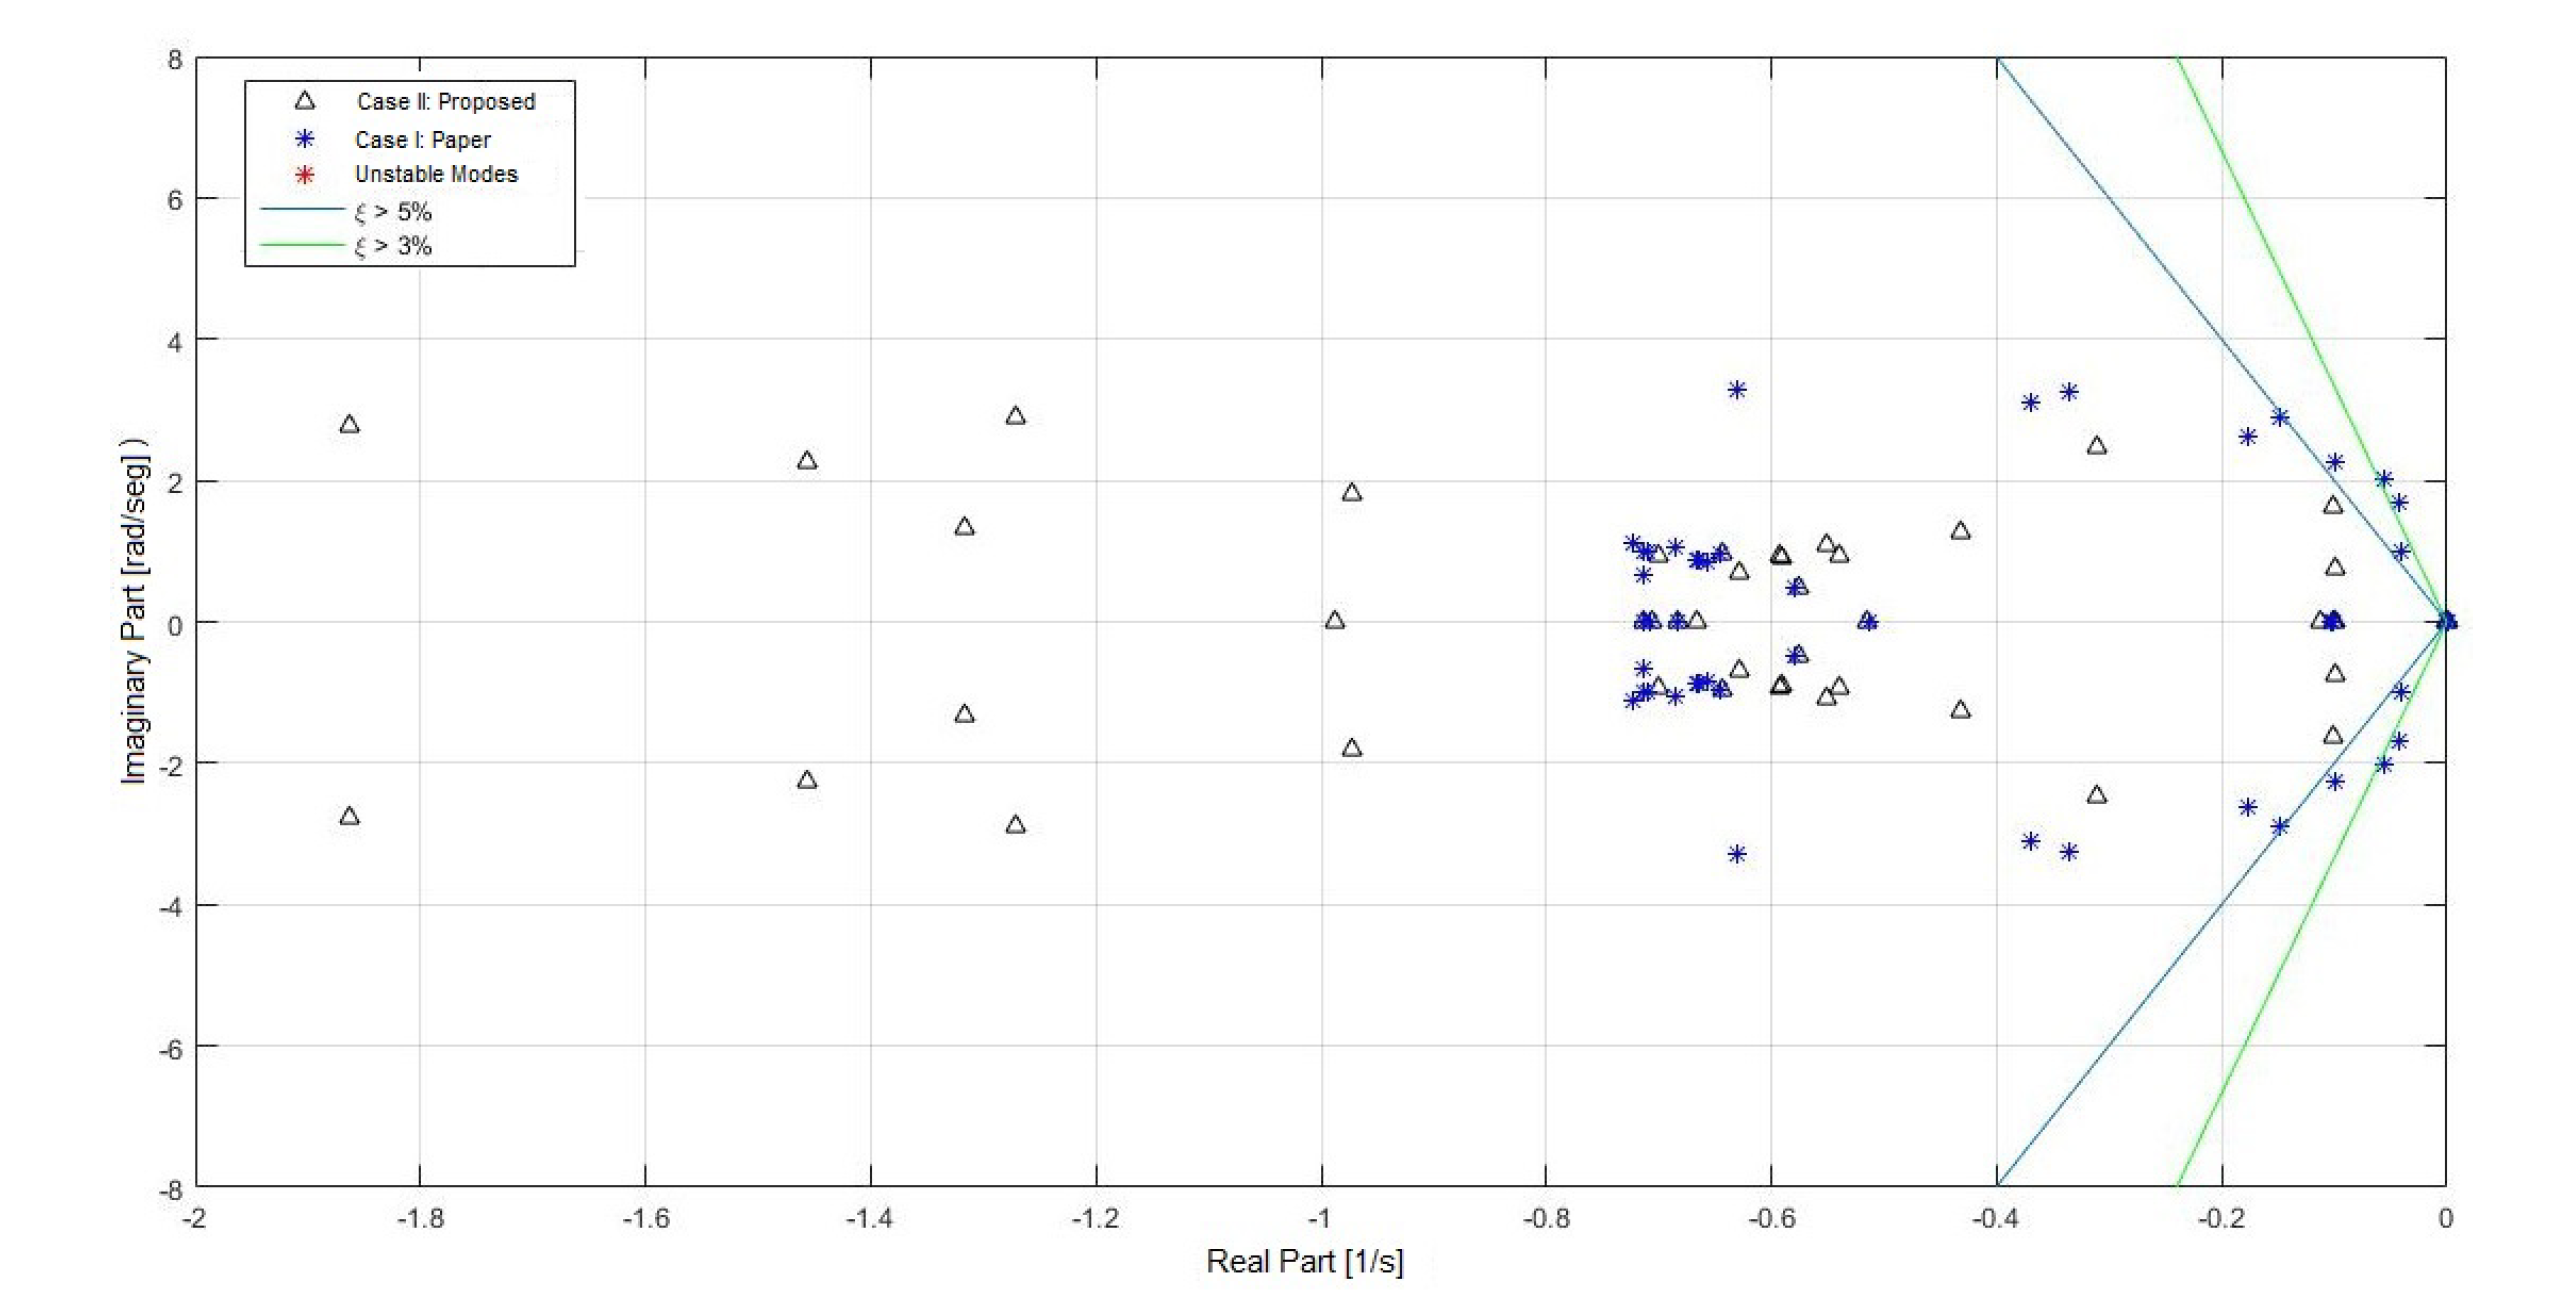
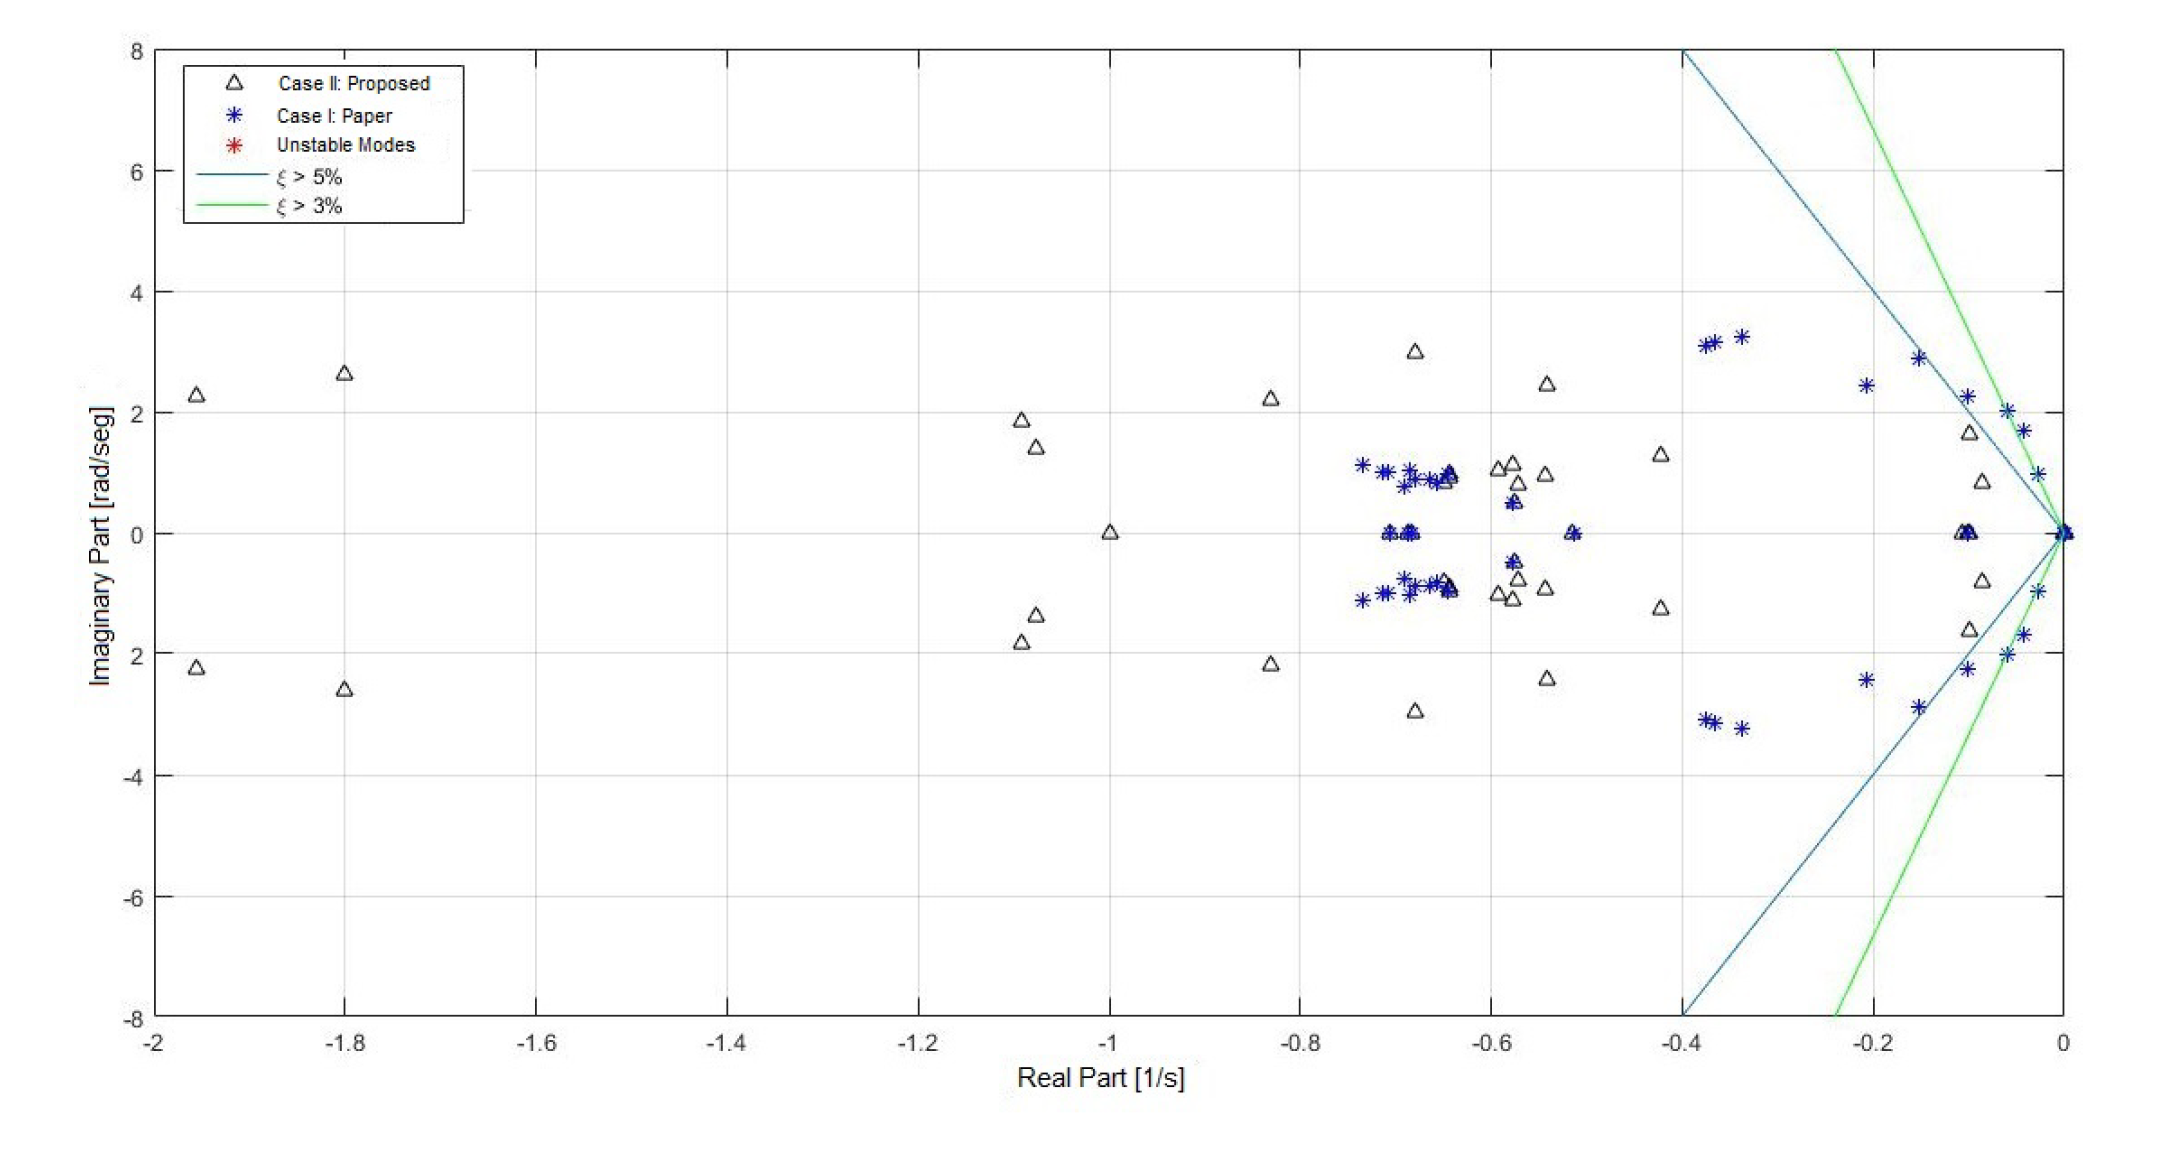
- Eigenvalues of the linearized system.In Table 11, the eigenvalues of system III are presented with the respective oscillation frequency and damping.In Table 11, it is possible to see how the proposed tuning considerably improves the damping of the system’s eigenvalues. Similarly to system II, the oscillation modes showing low damping correspond to electro mechanic modes; hence, the damping action of the PSS controller is effective. Figure 21 displays the comparison between cases I and II.
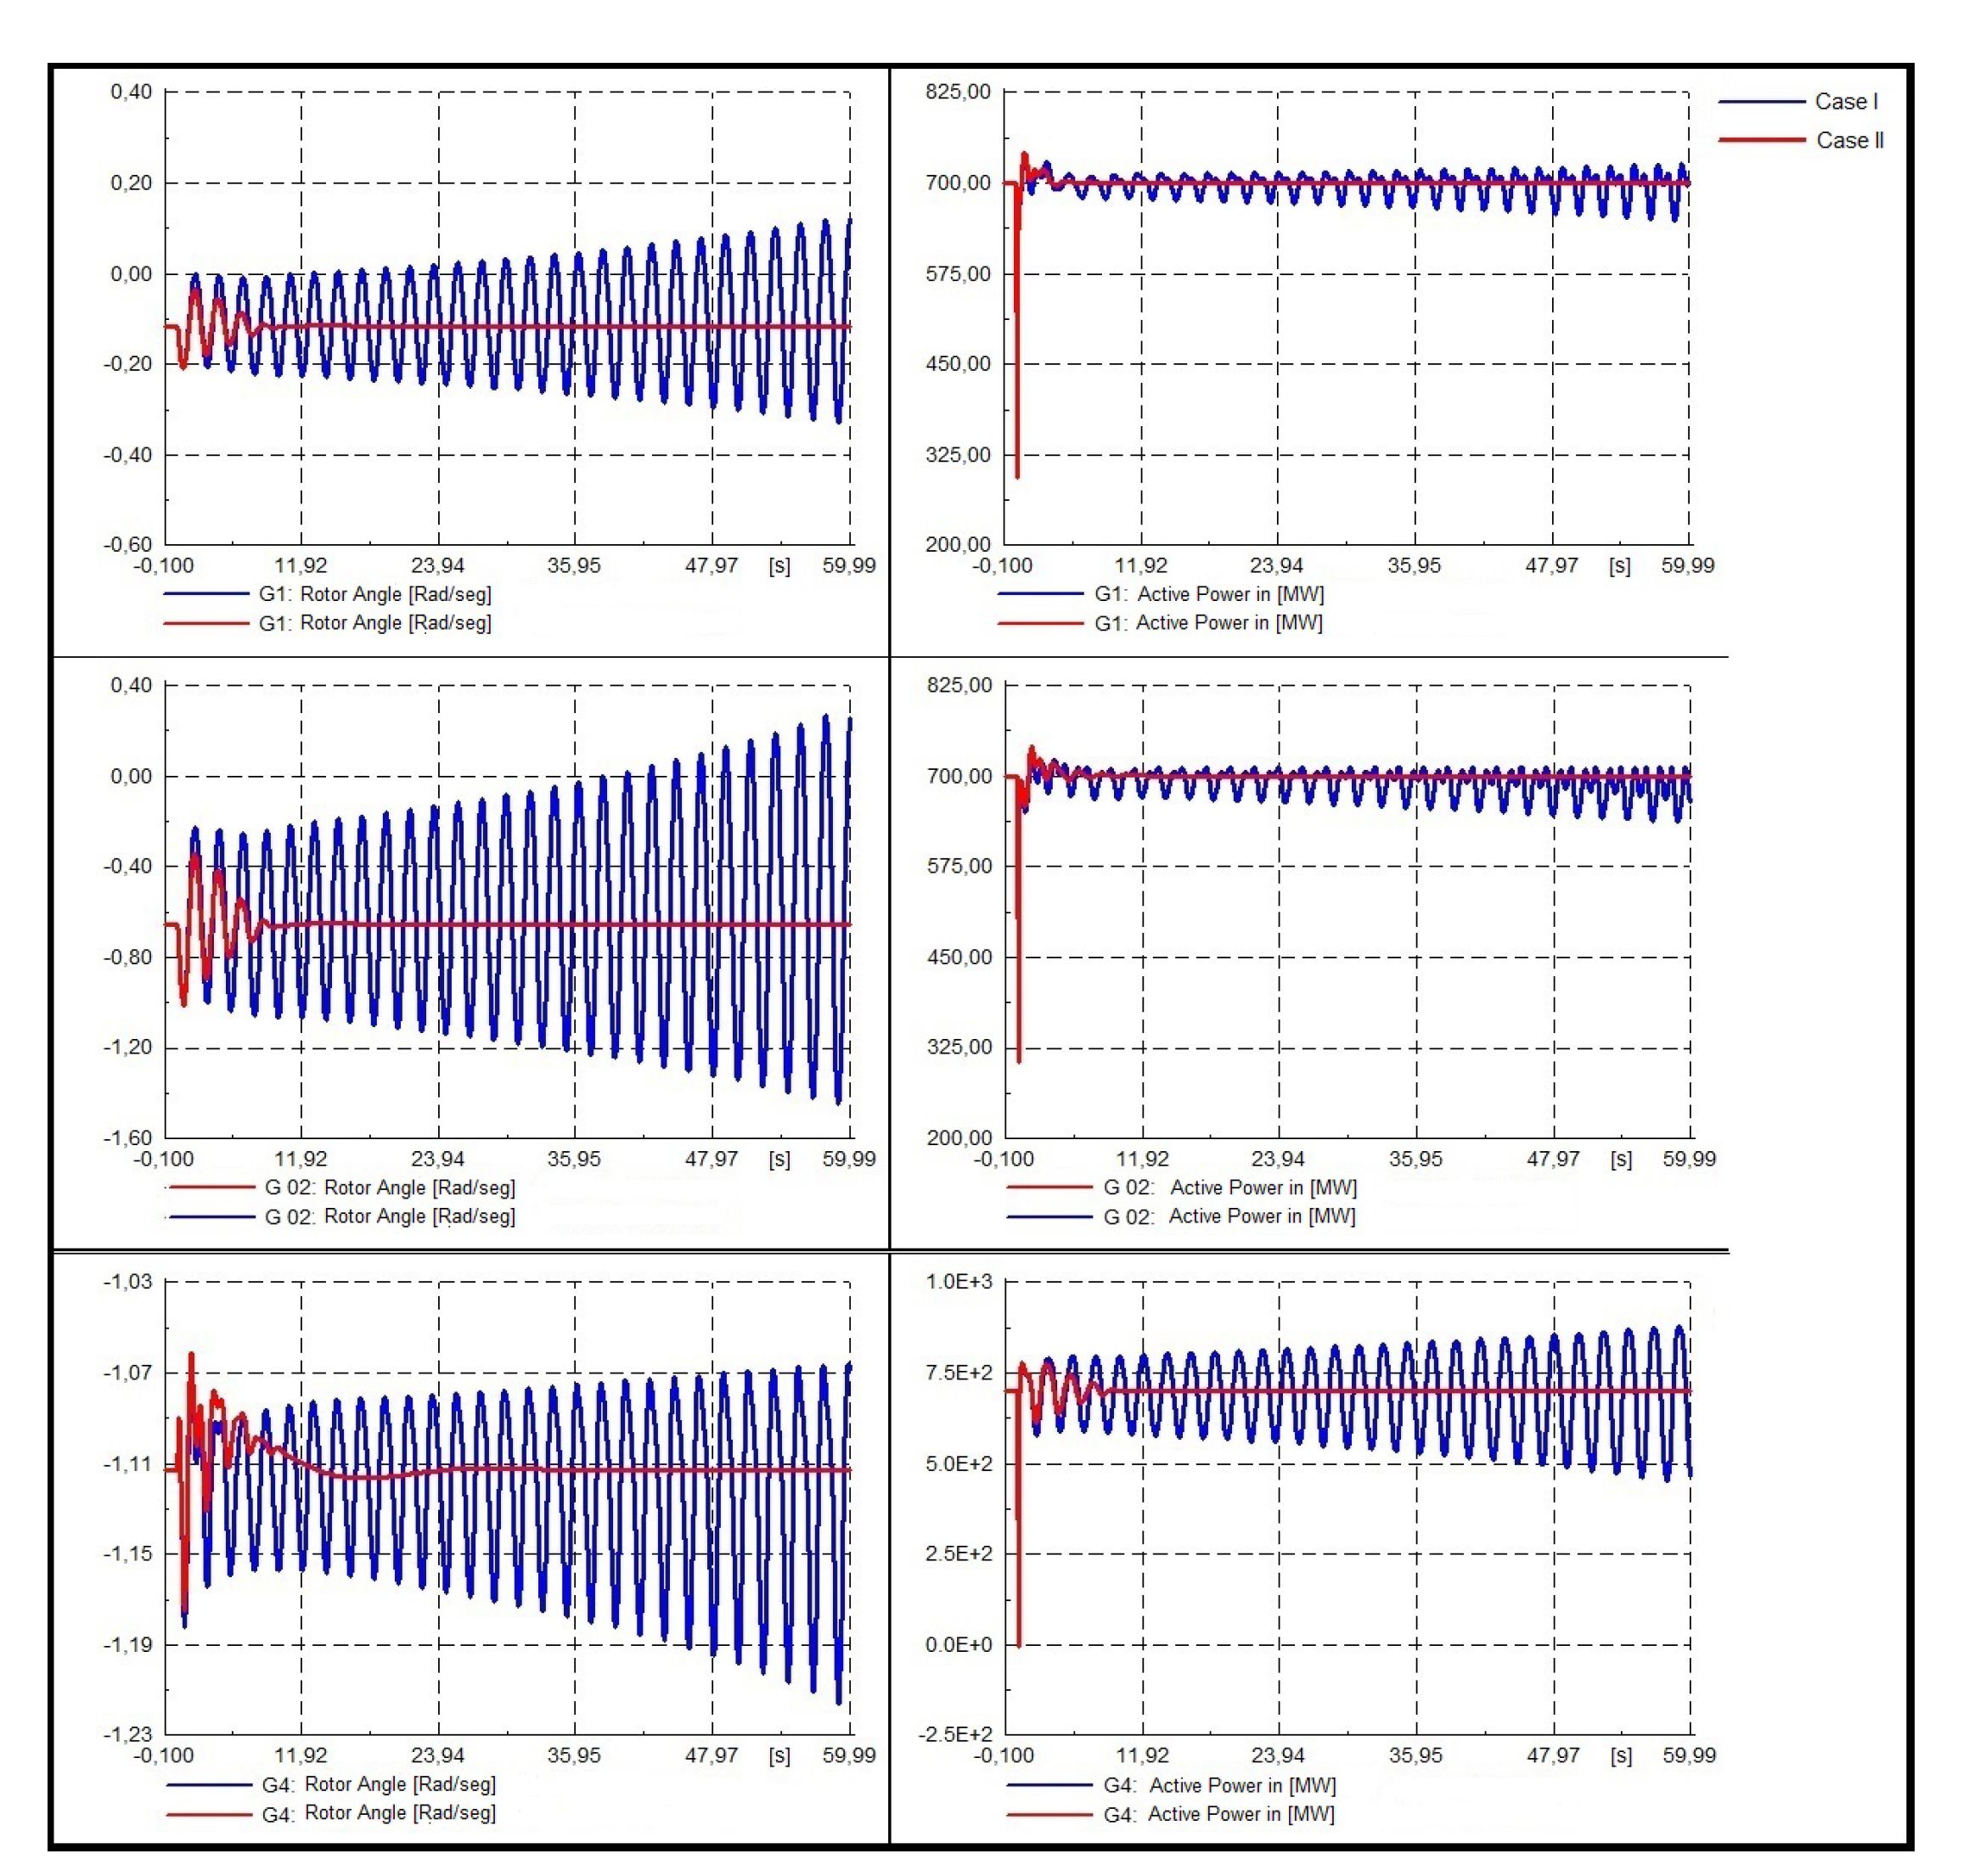
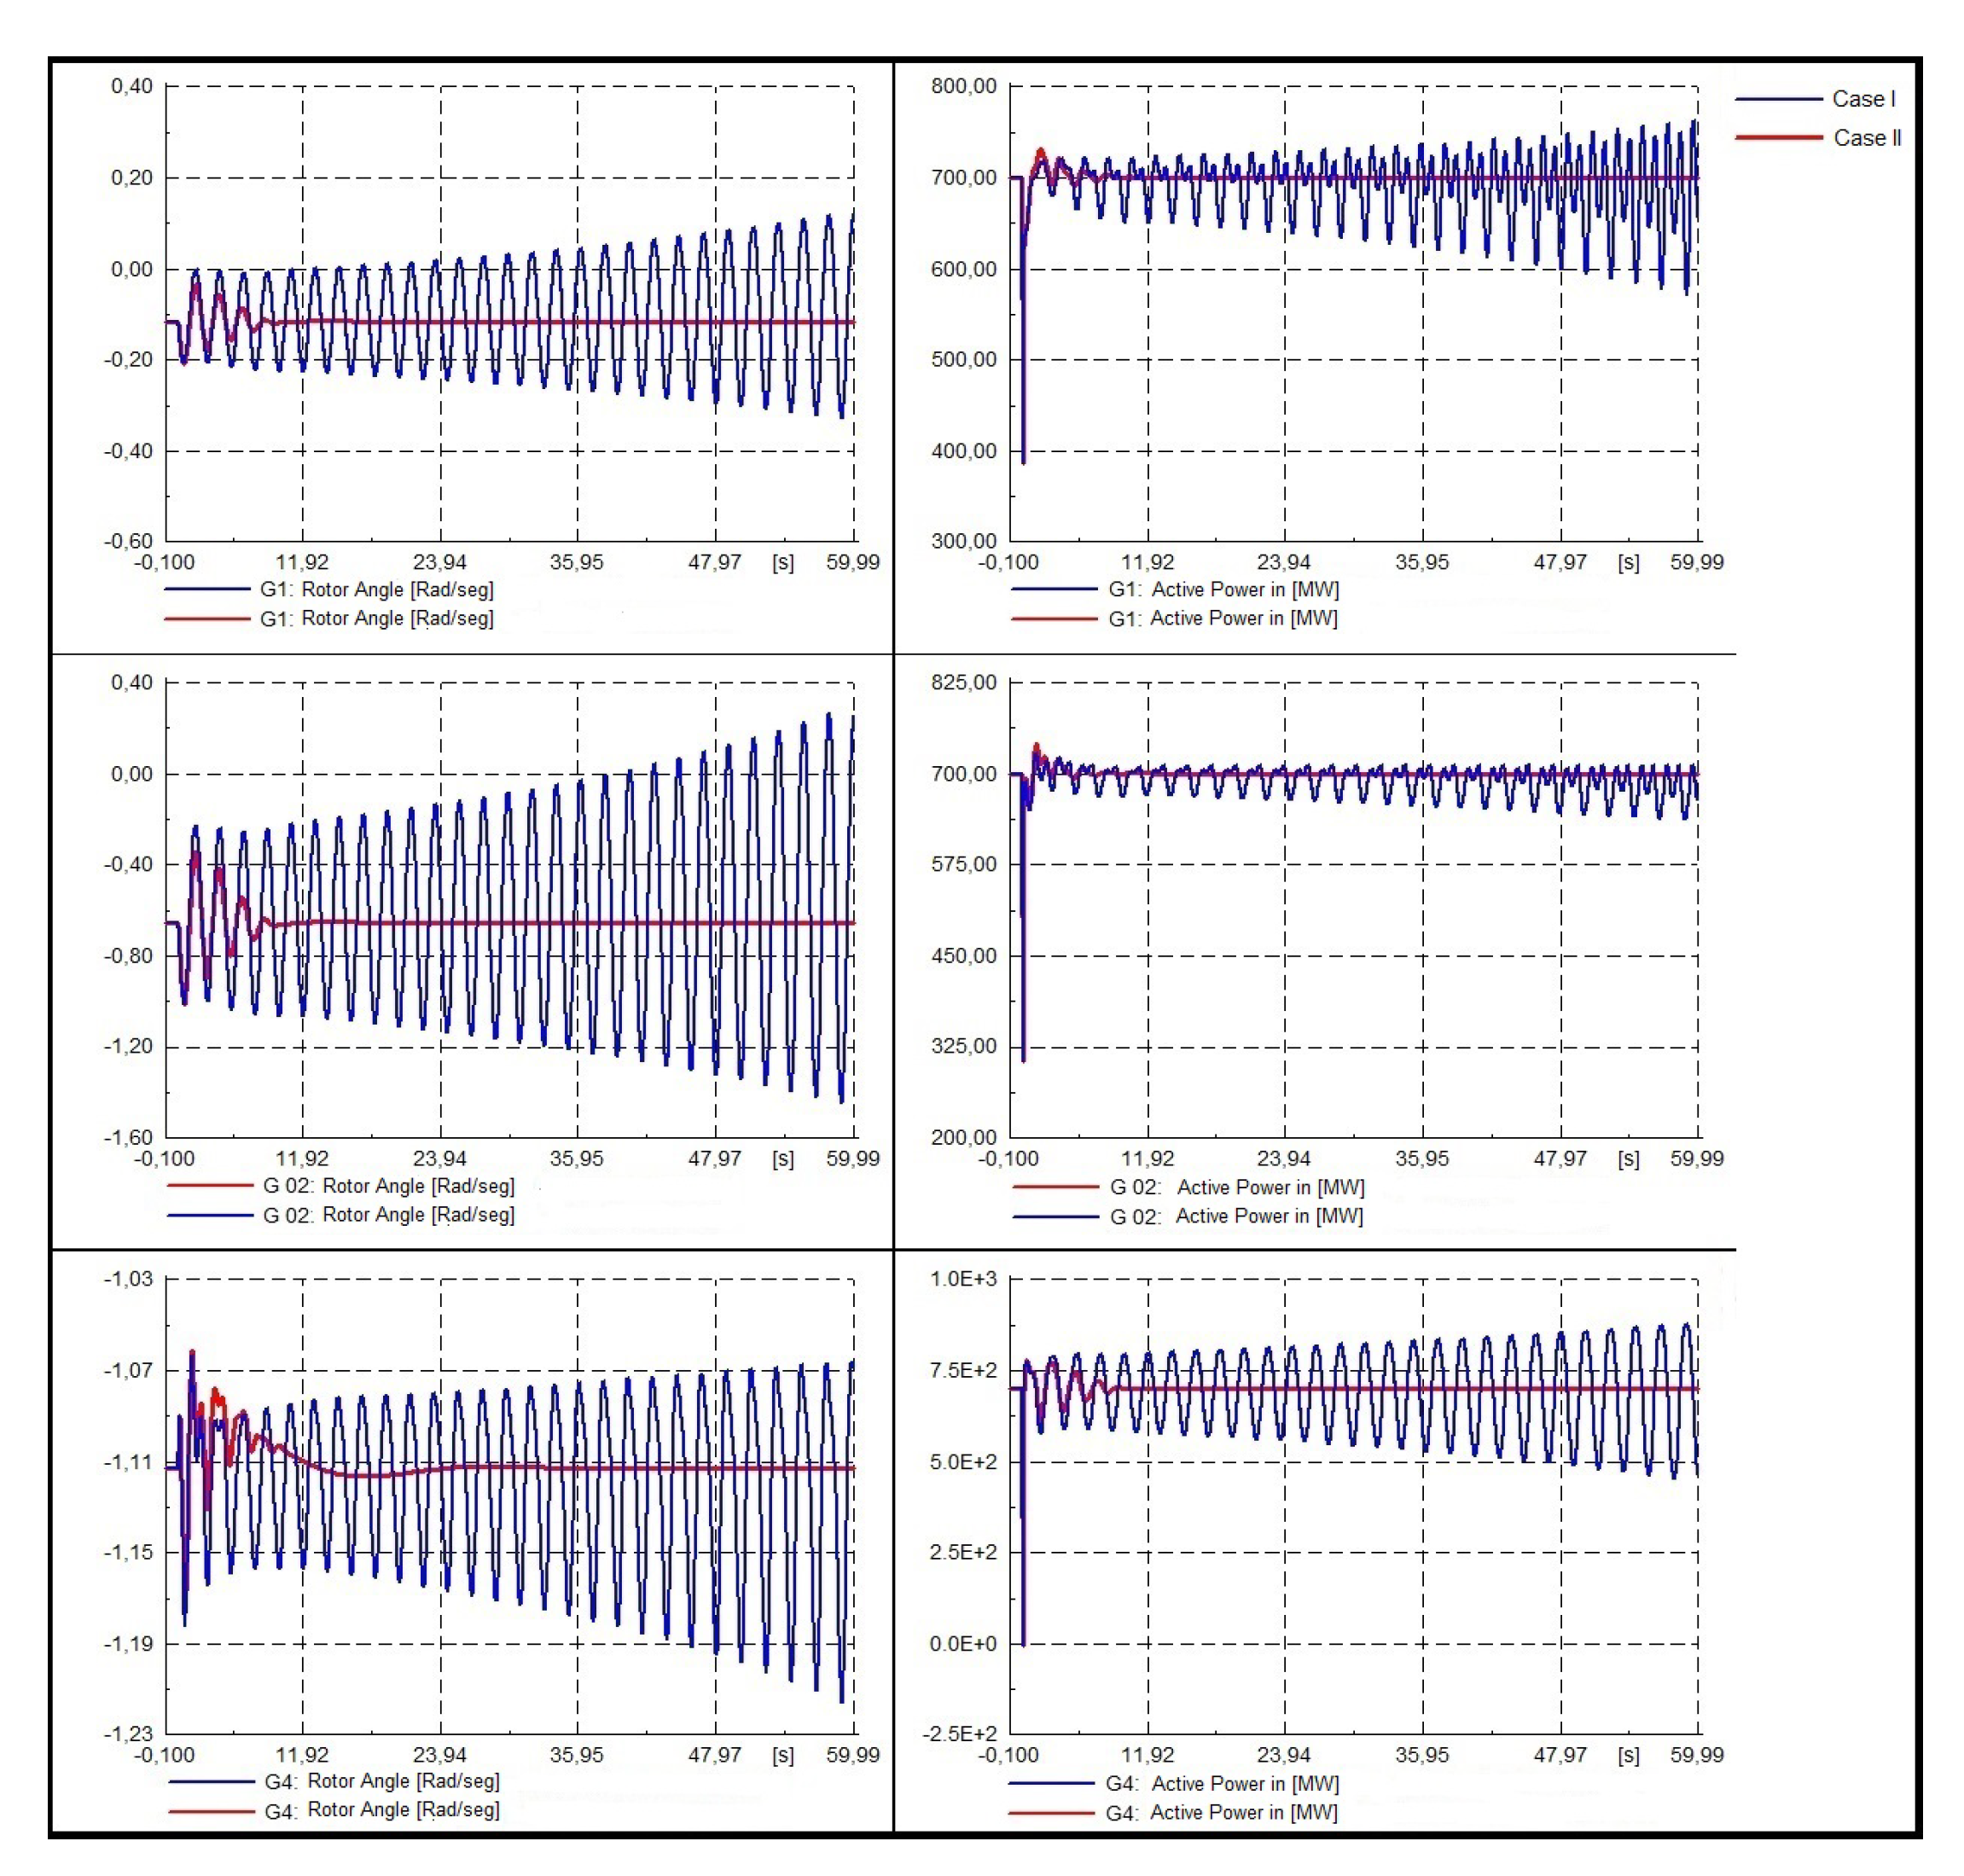
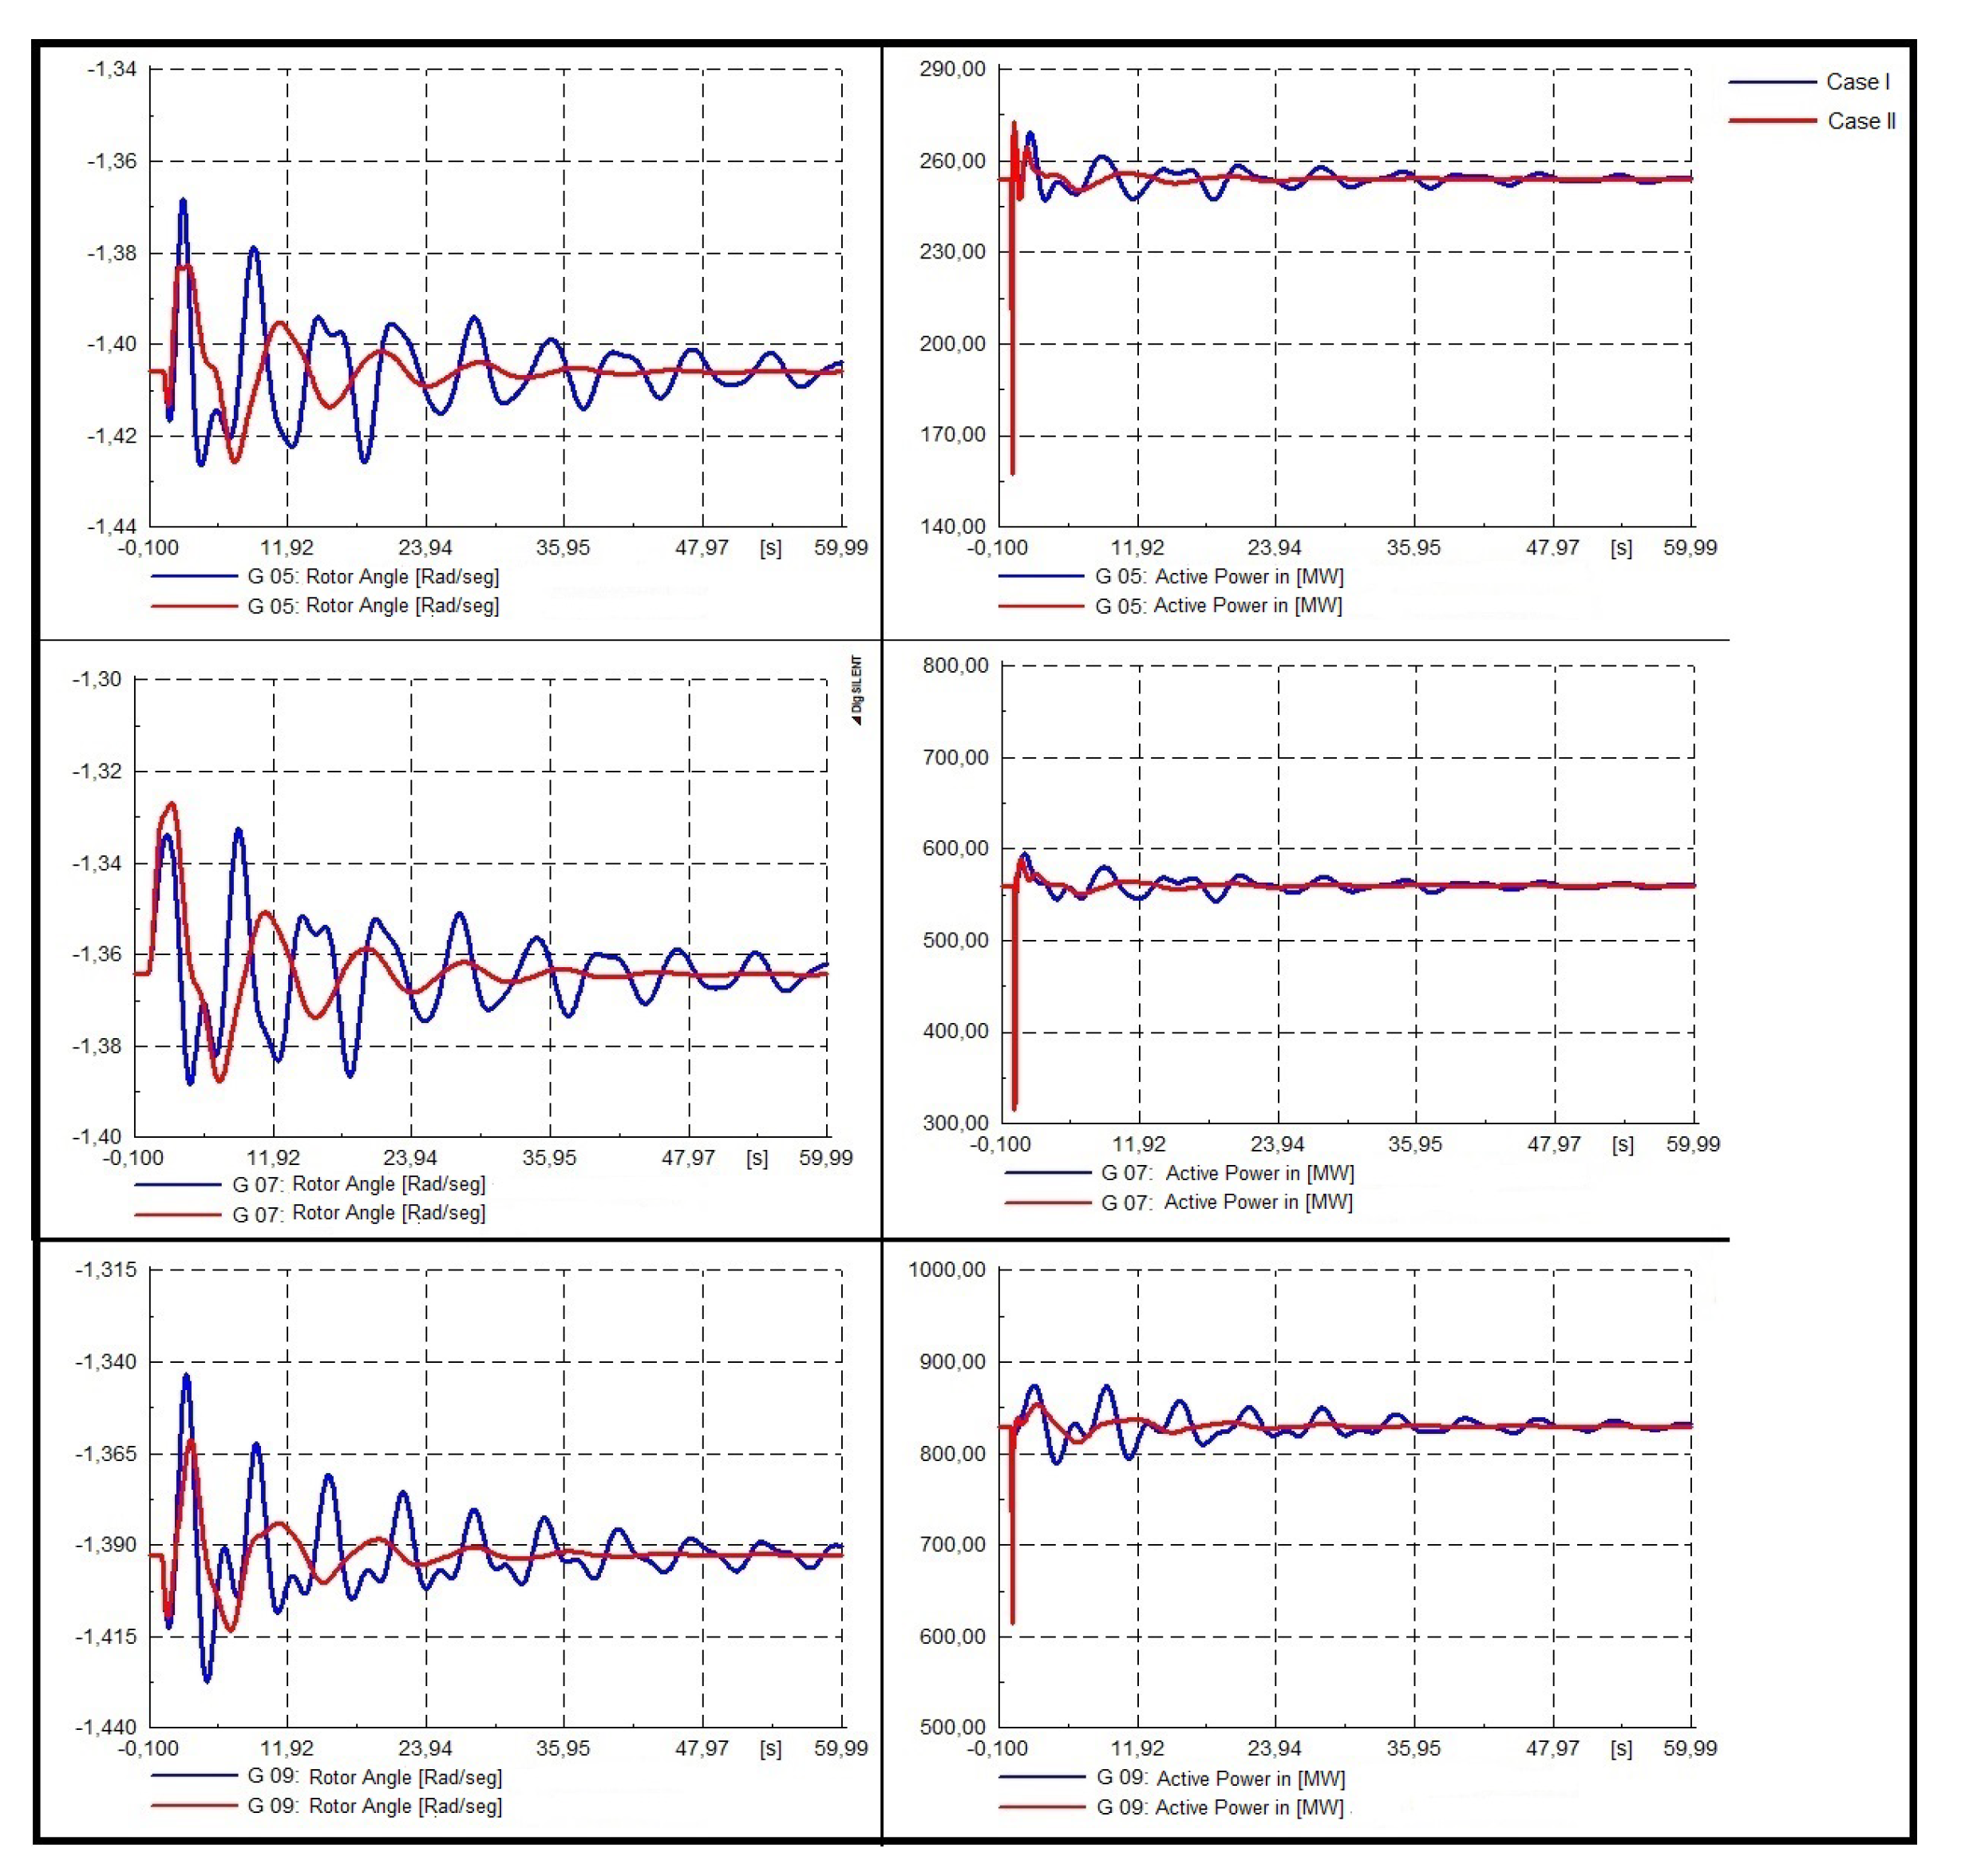
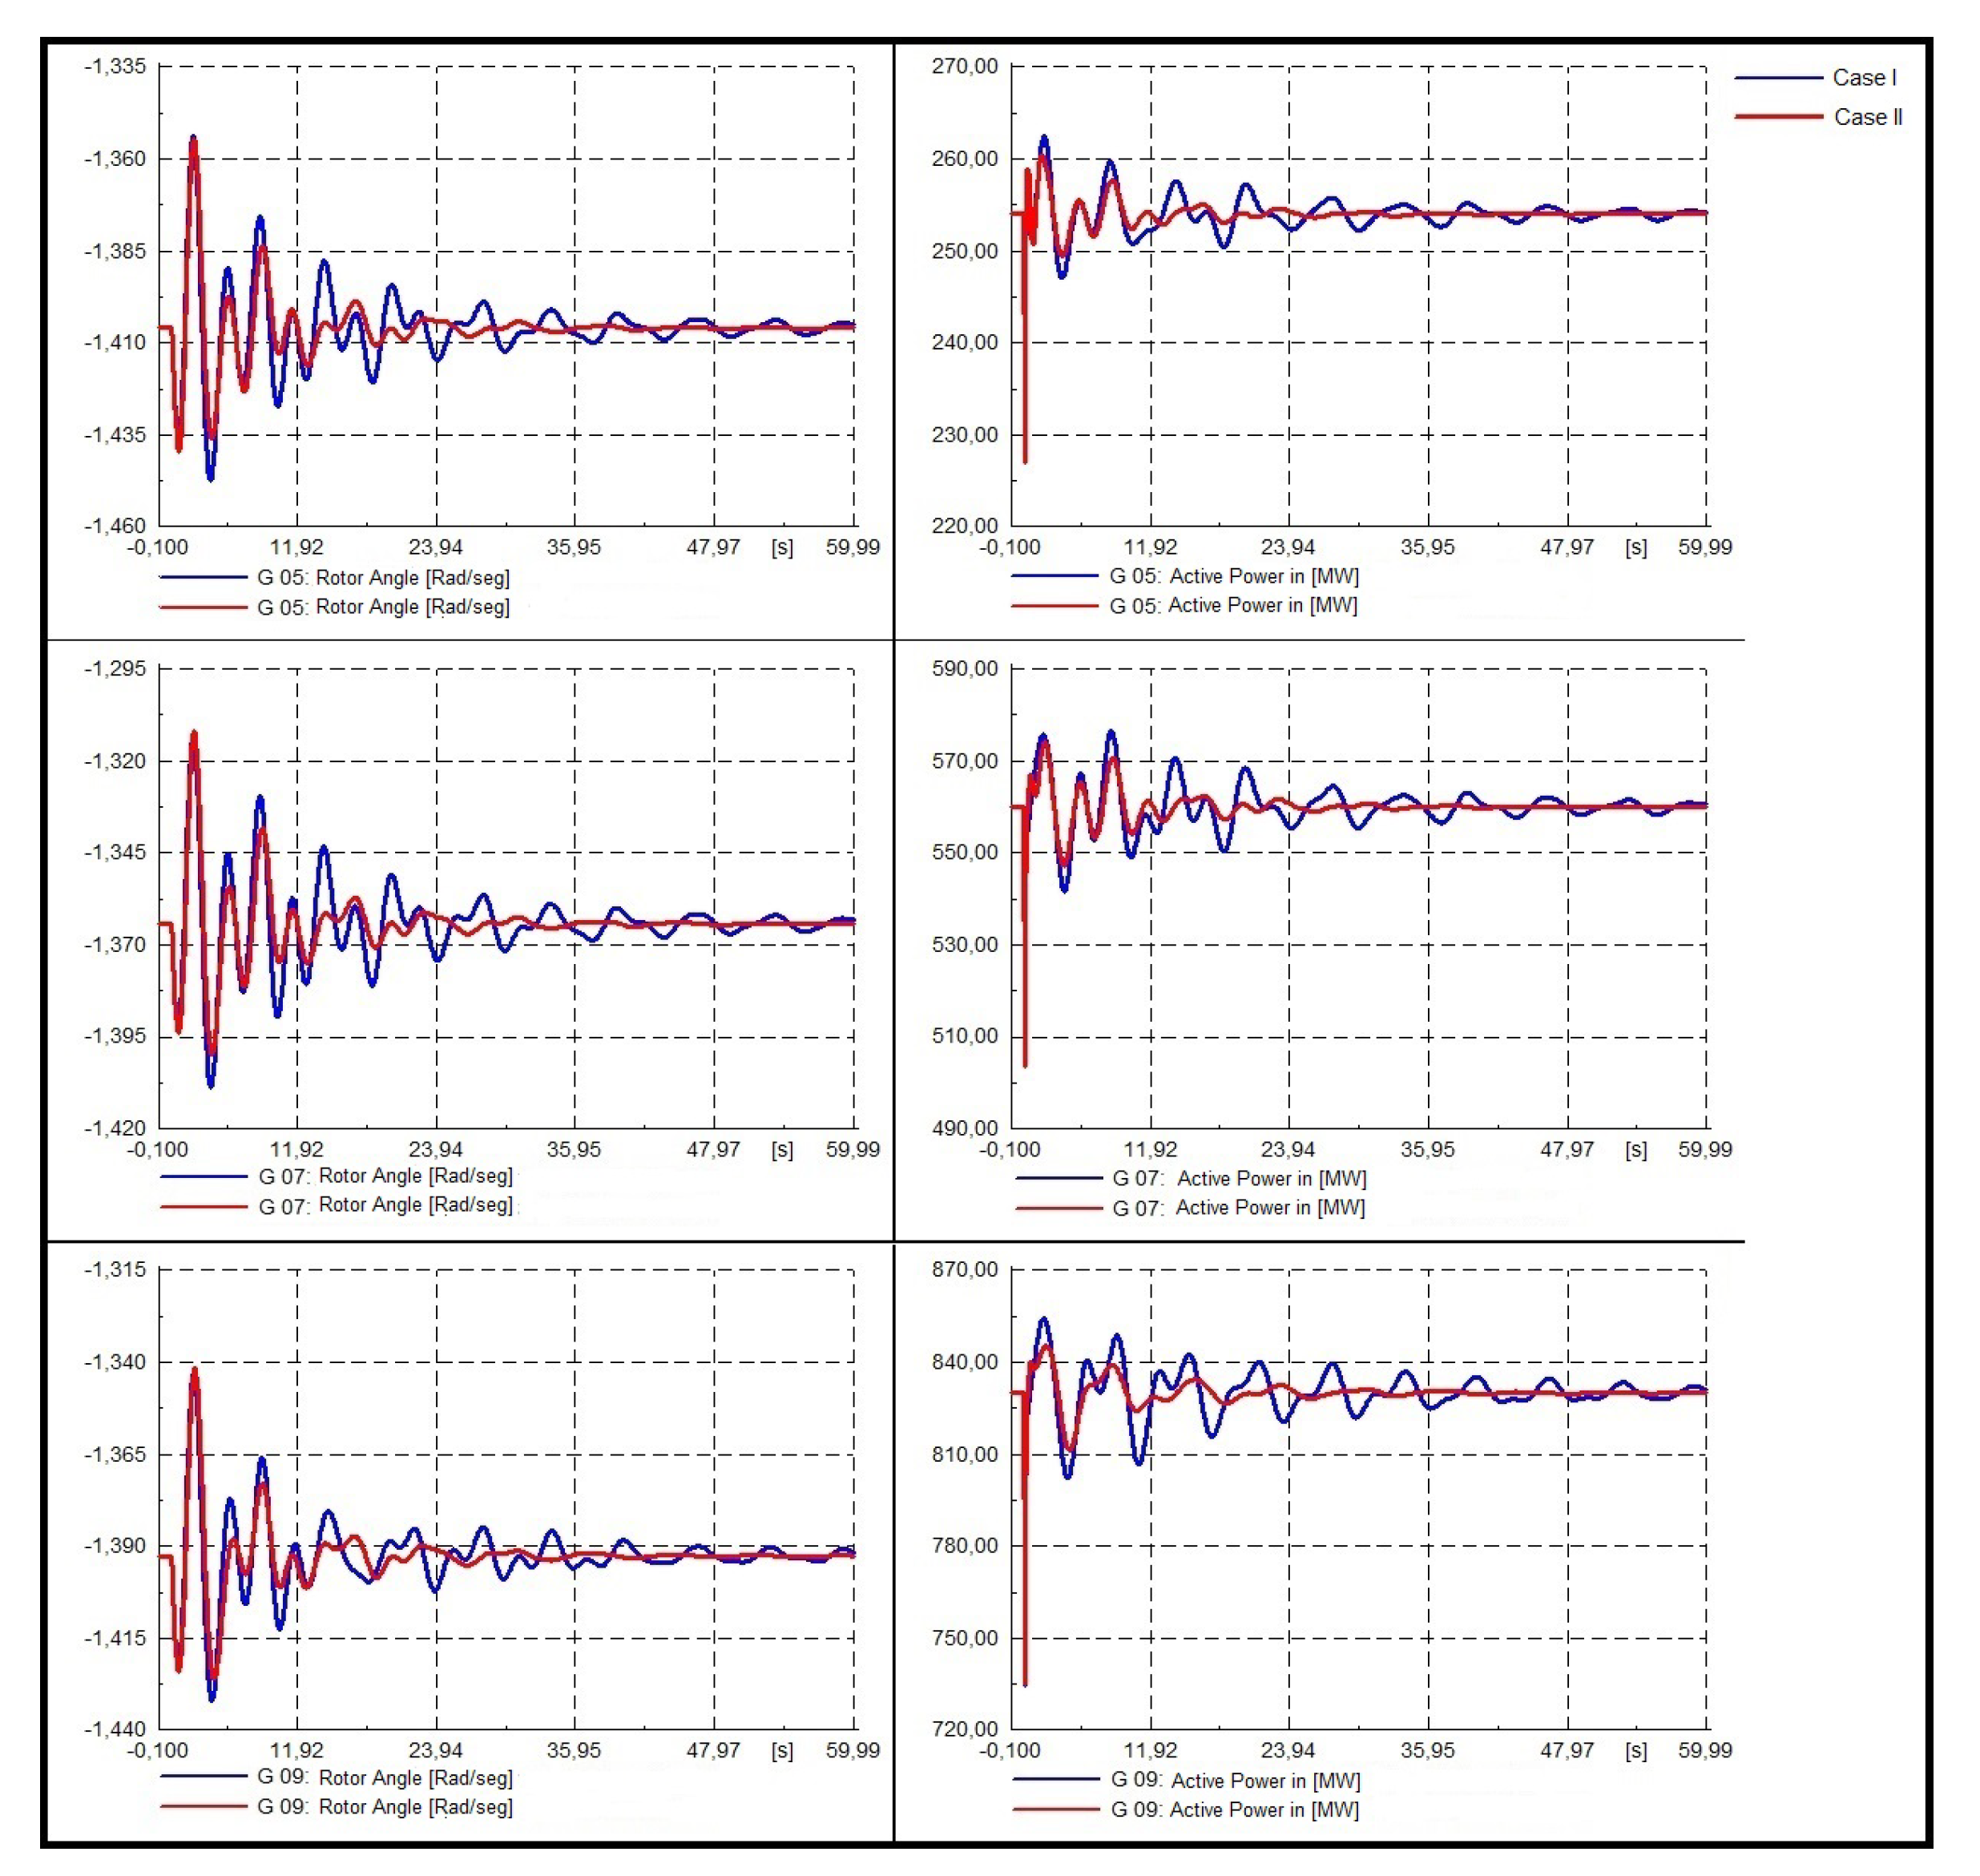
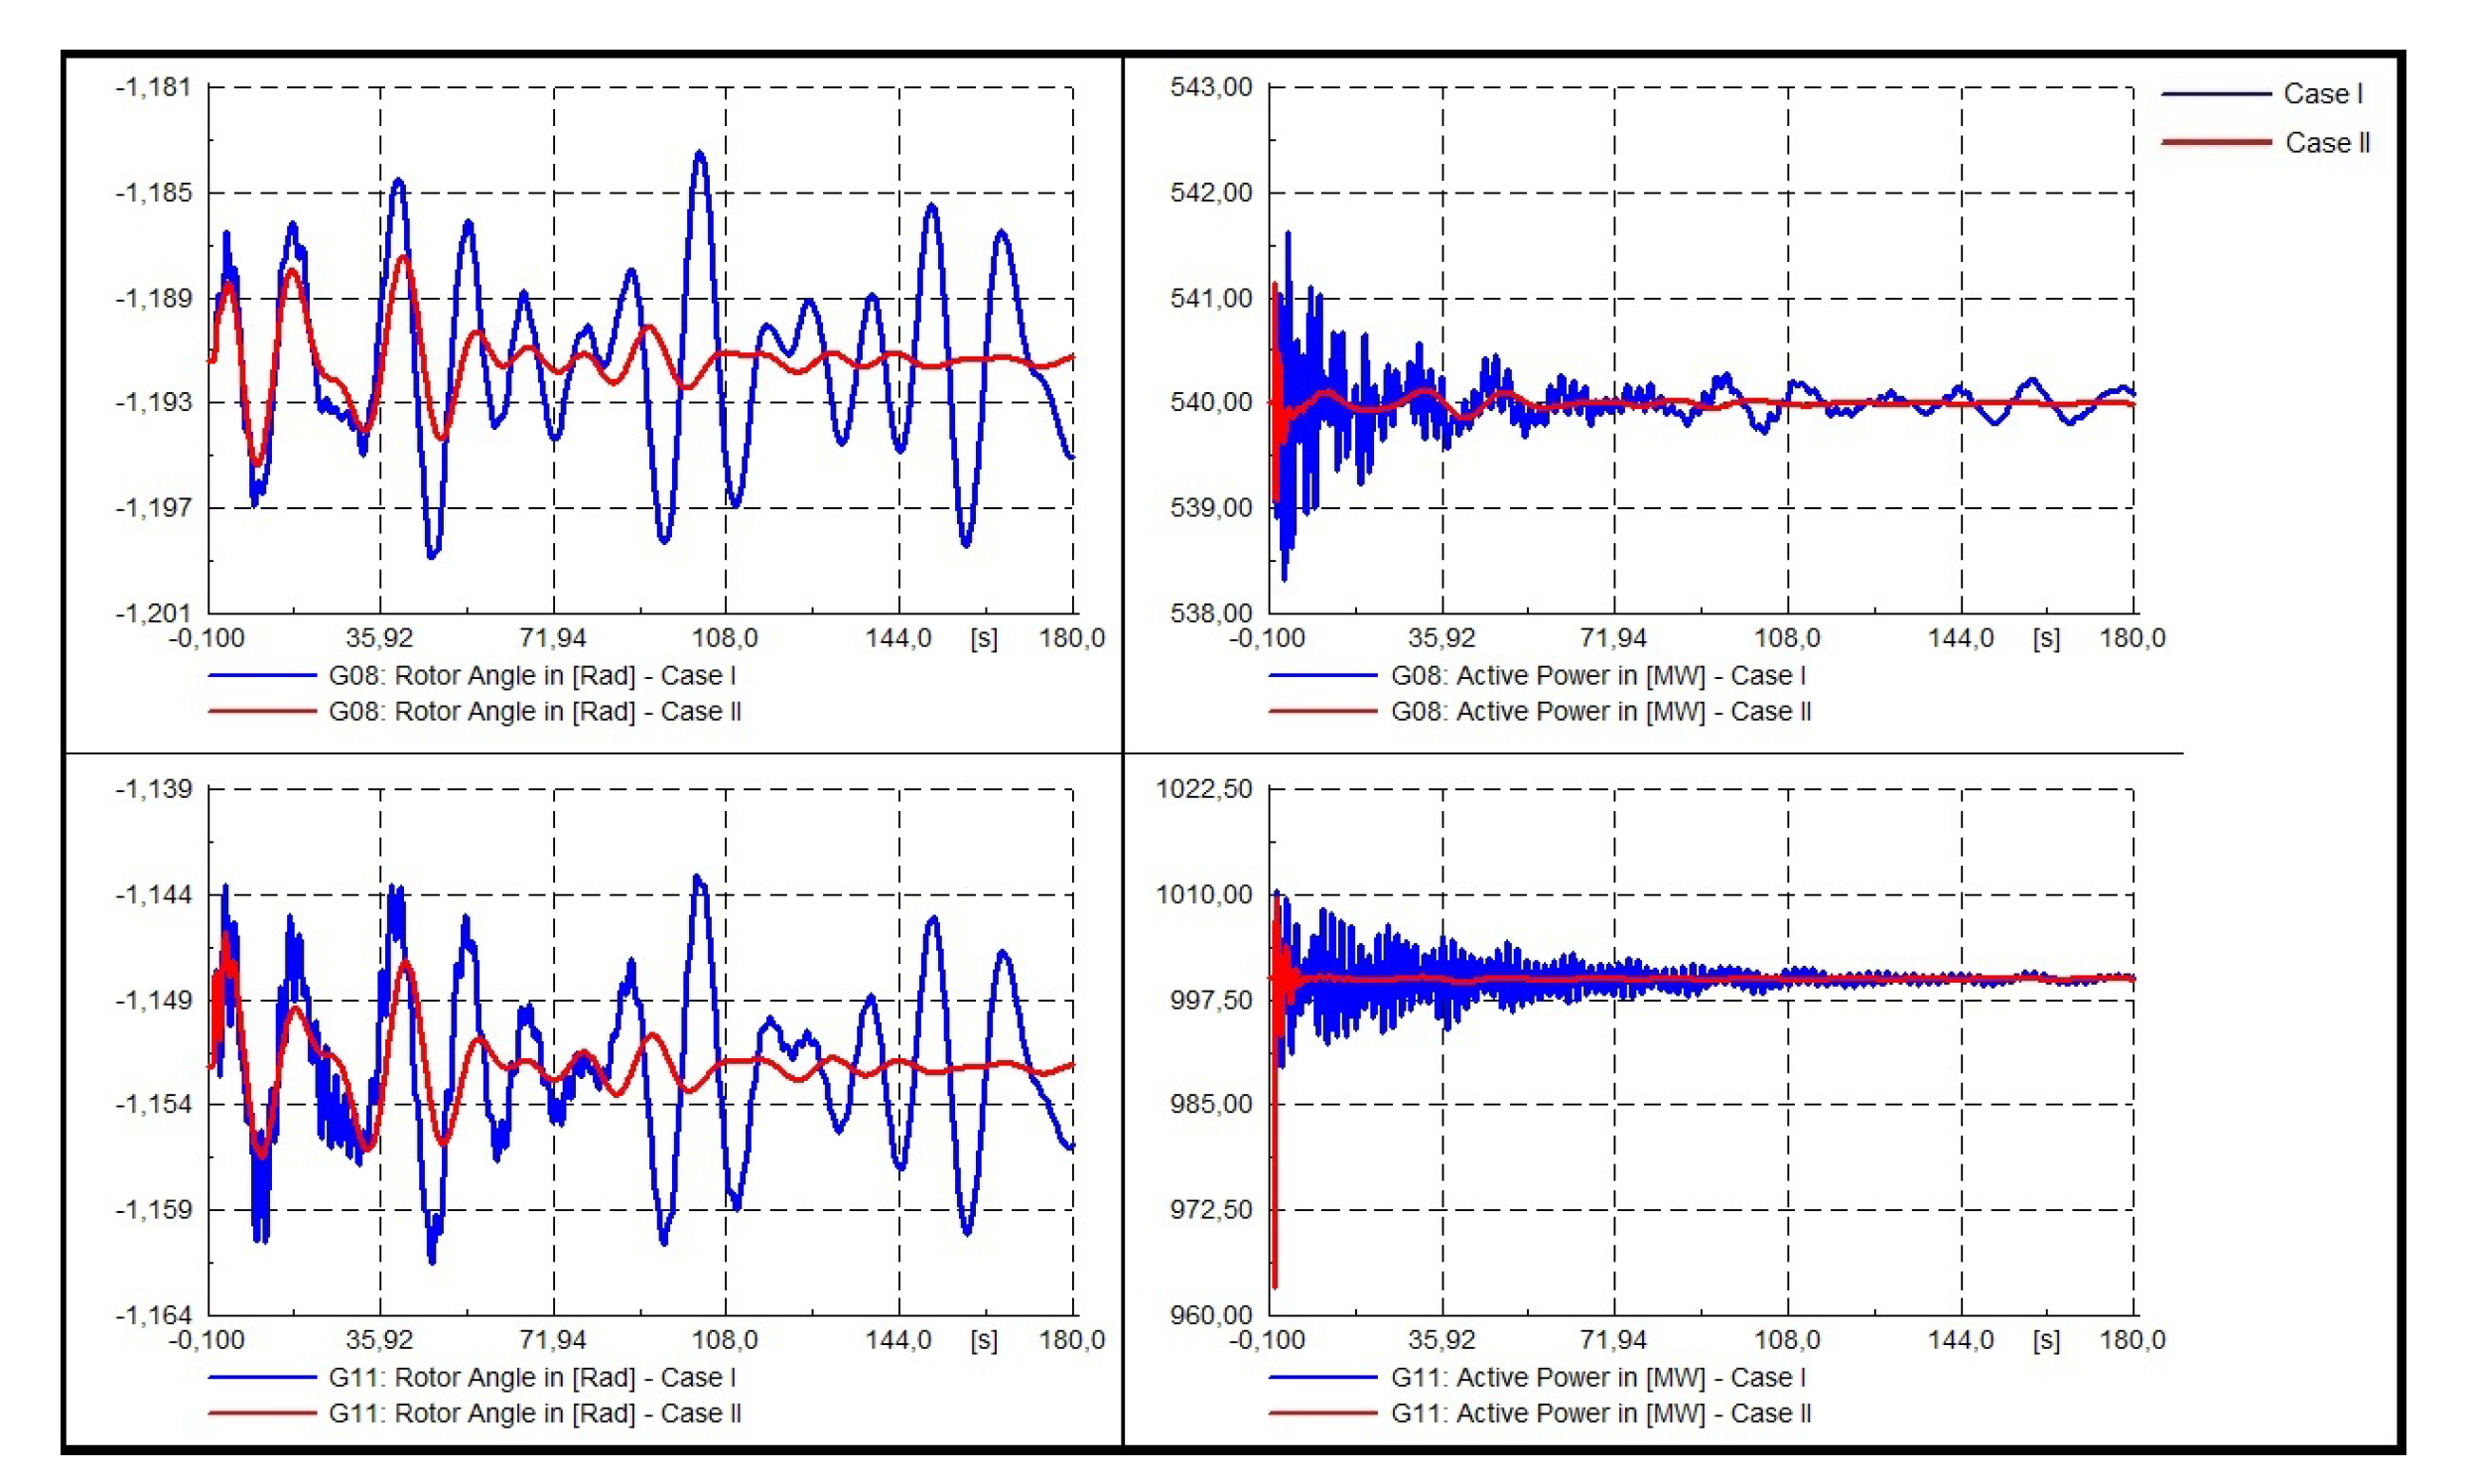
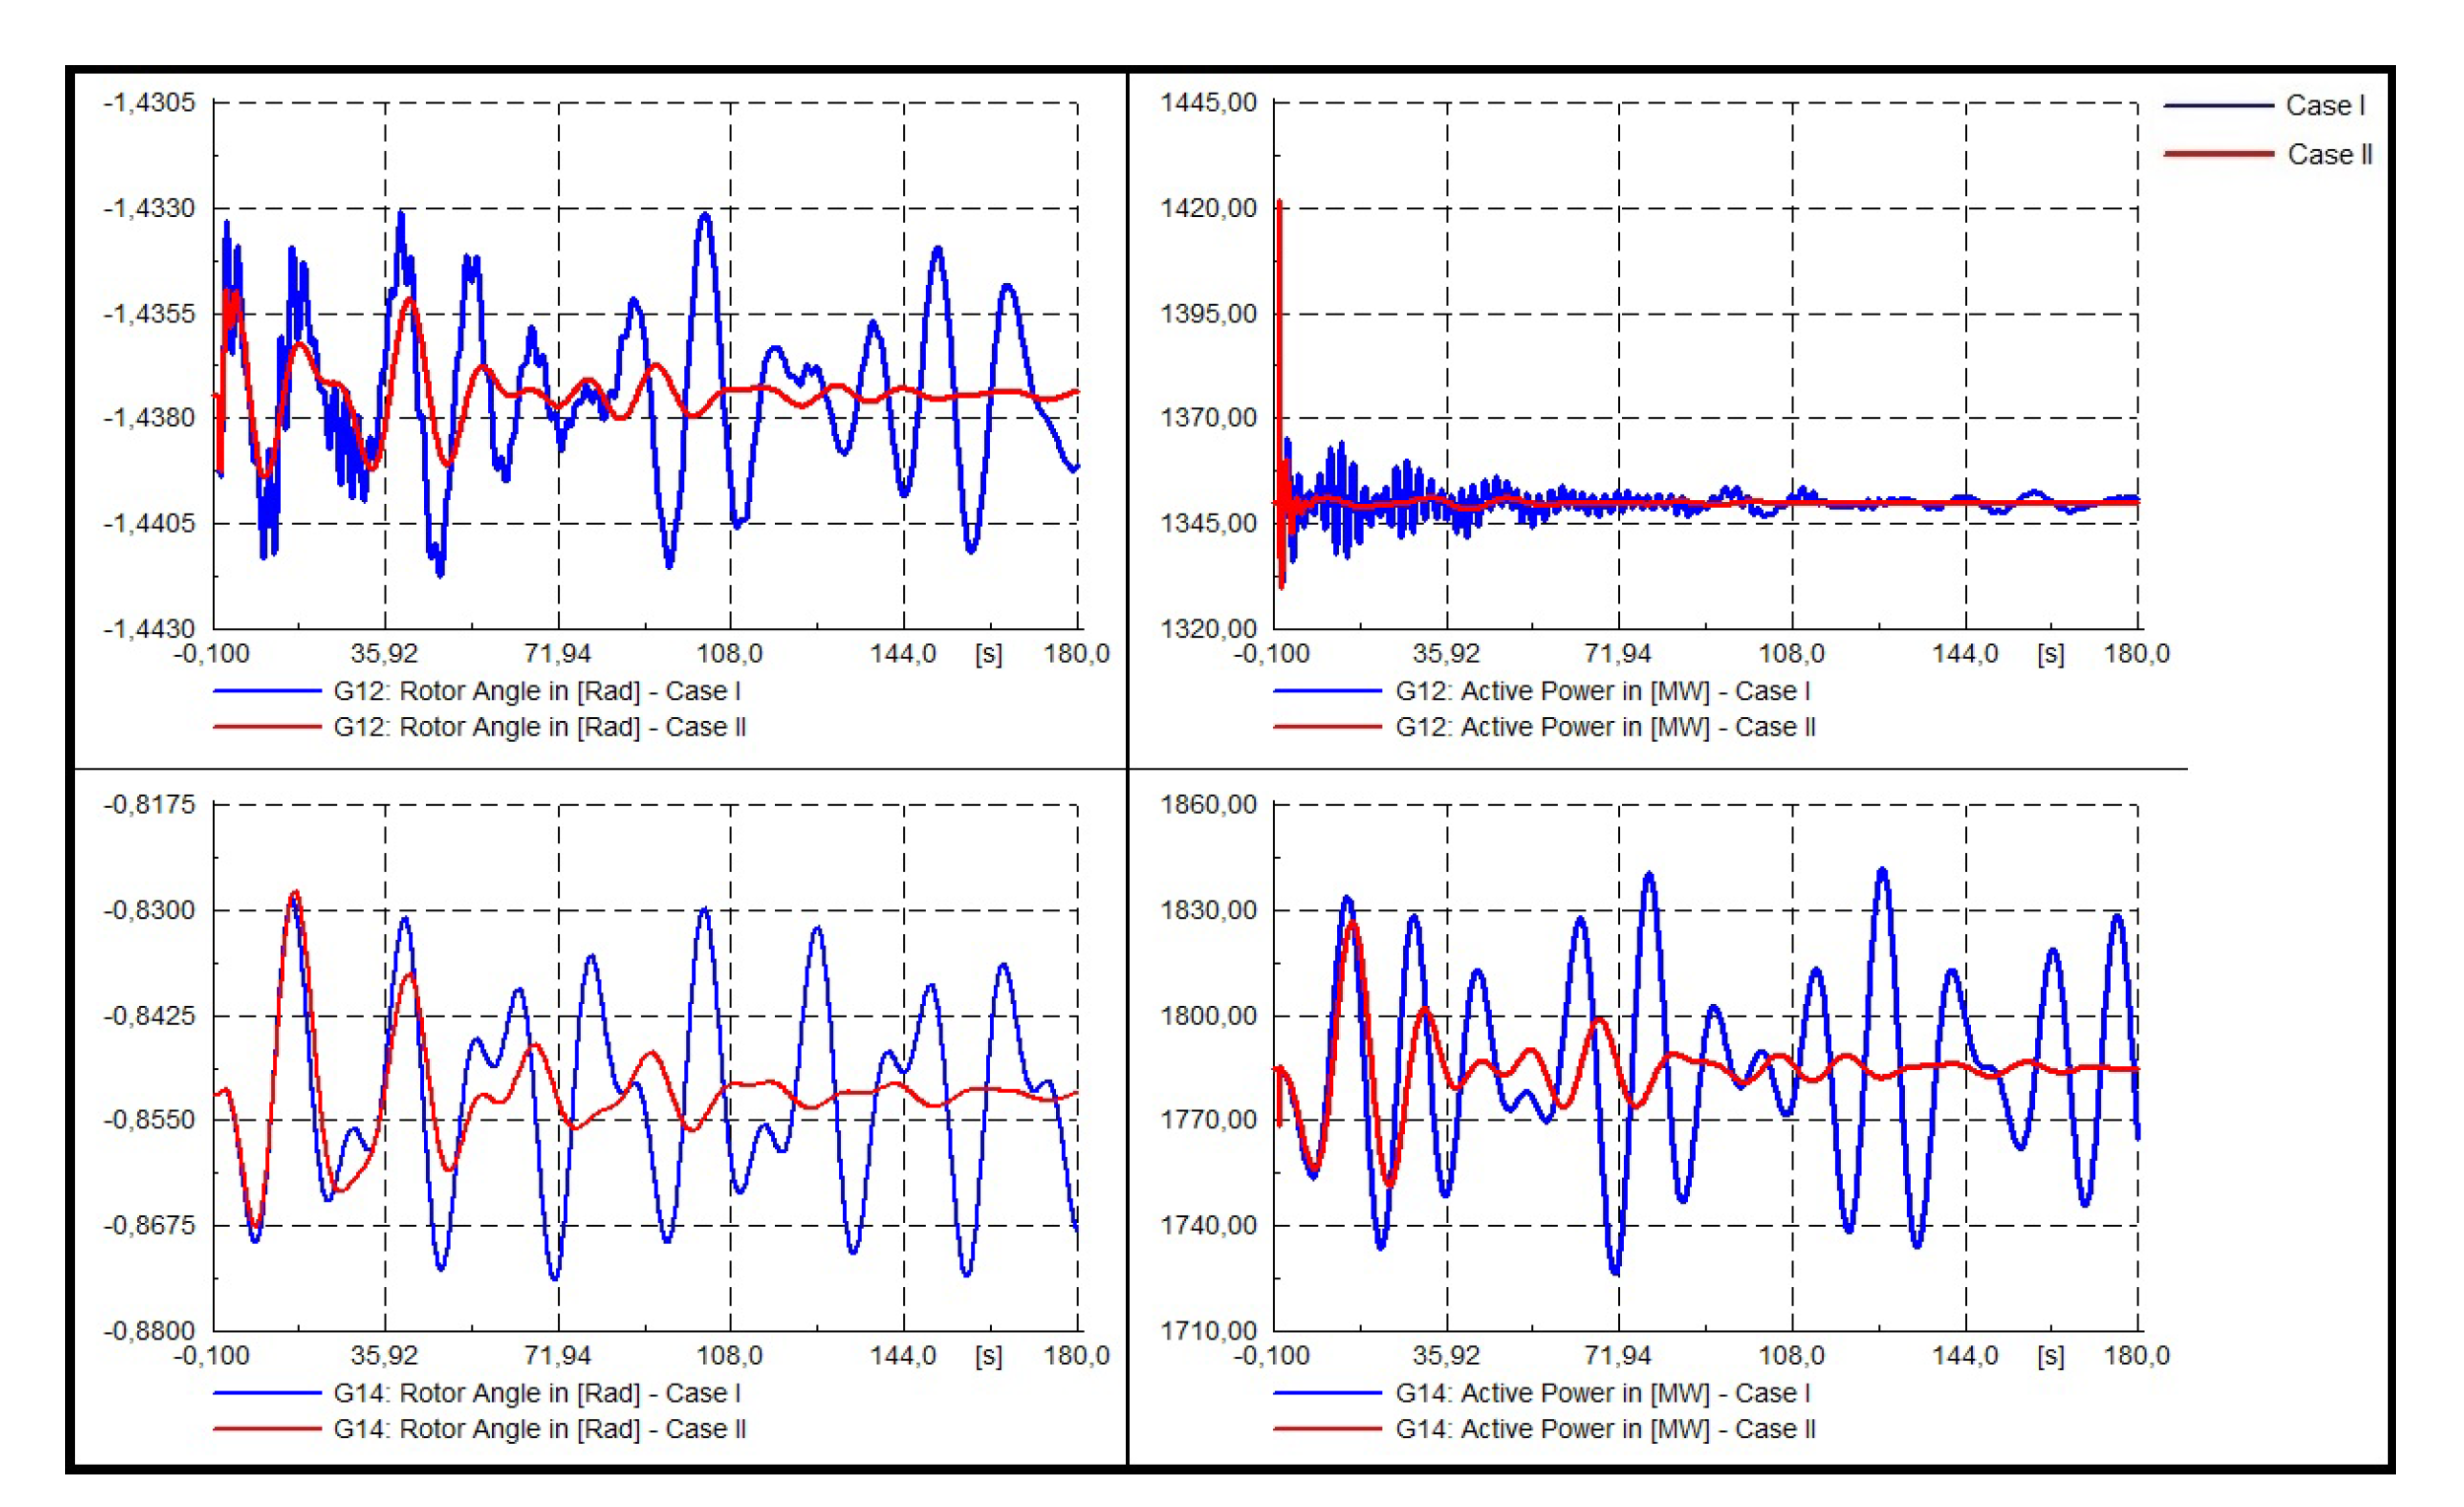
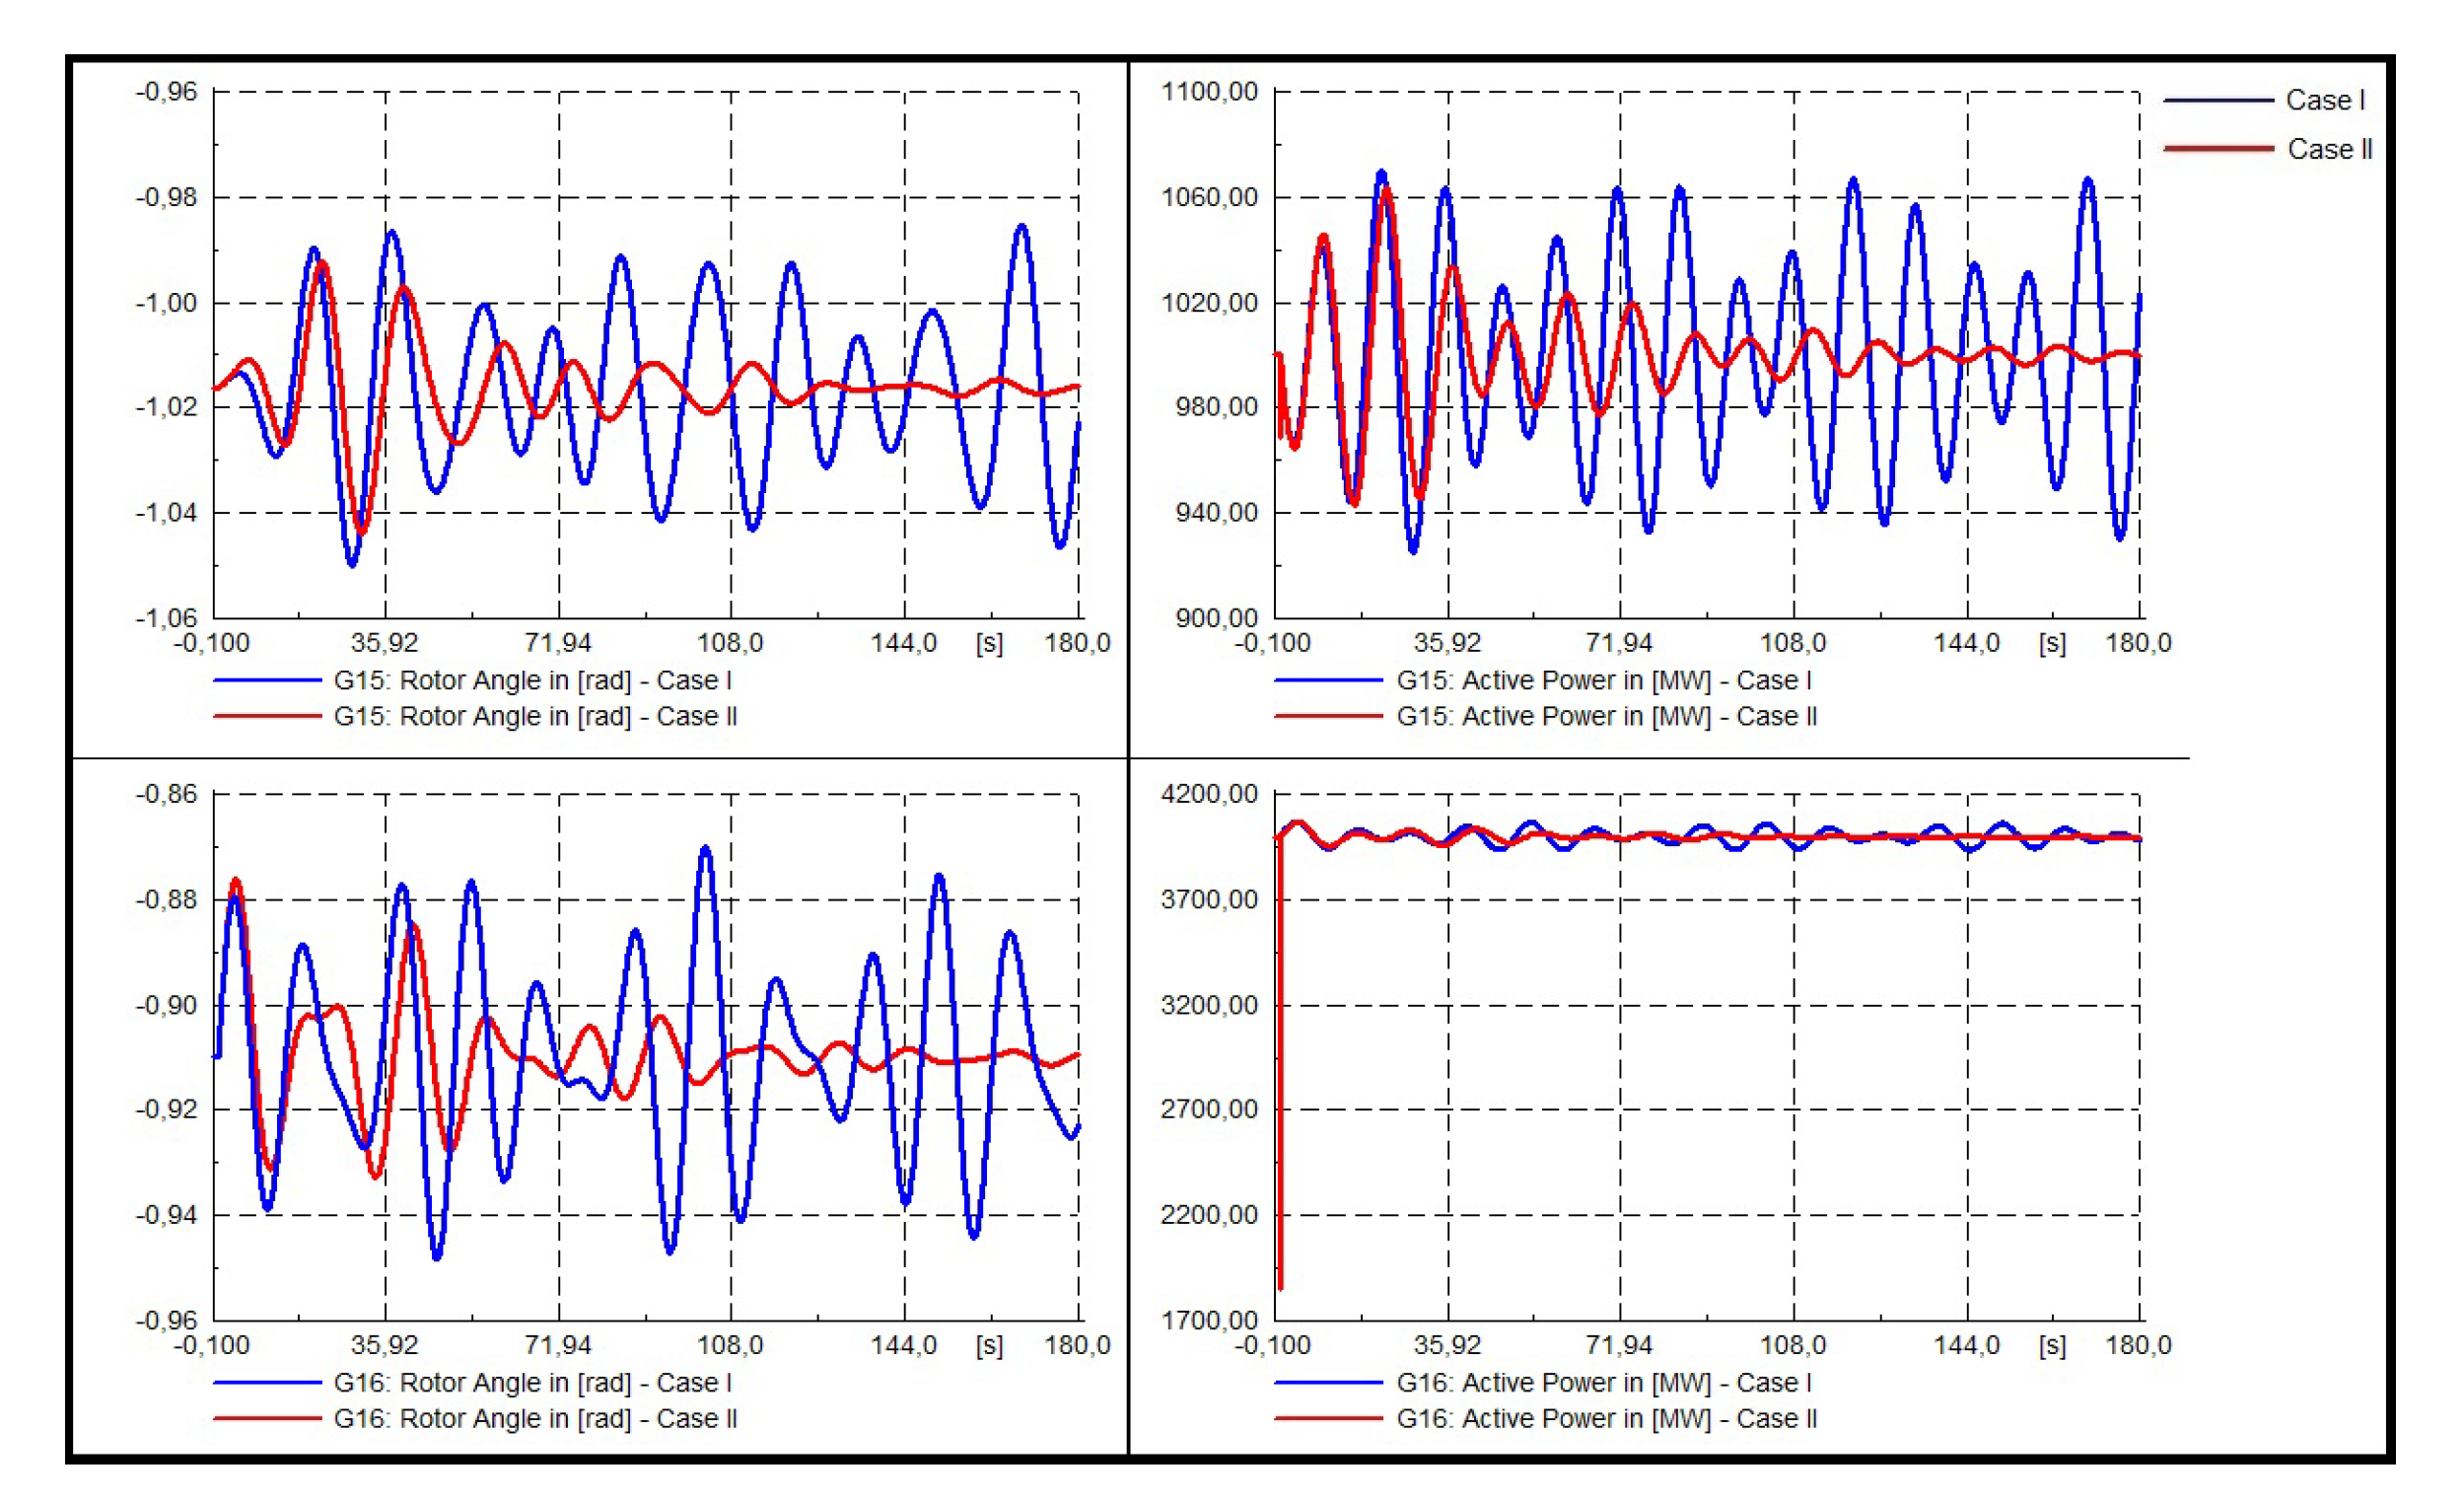
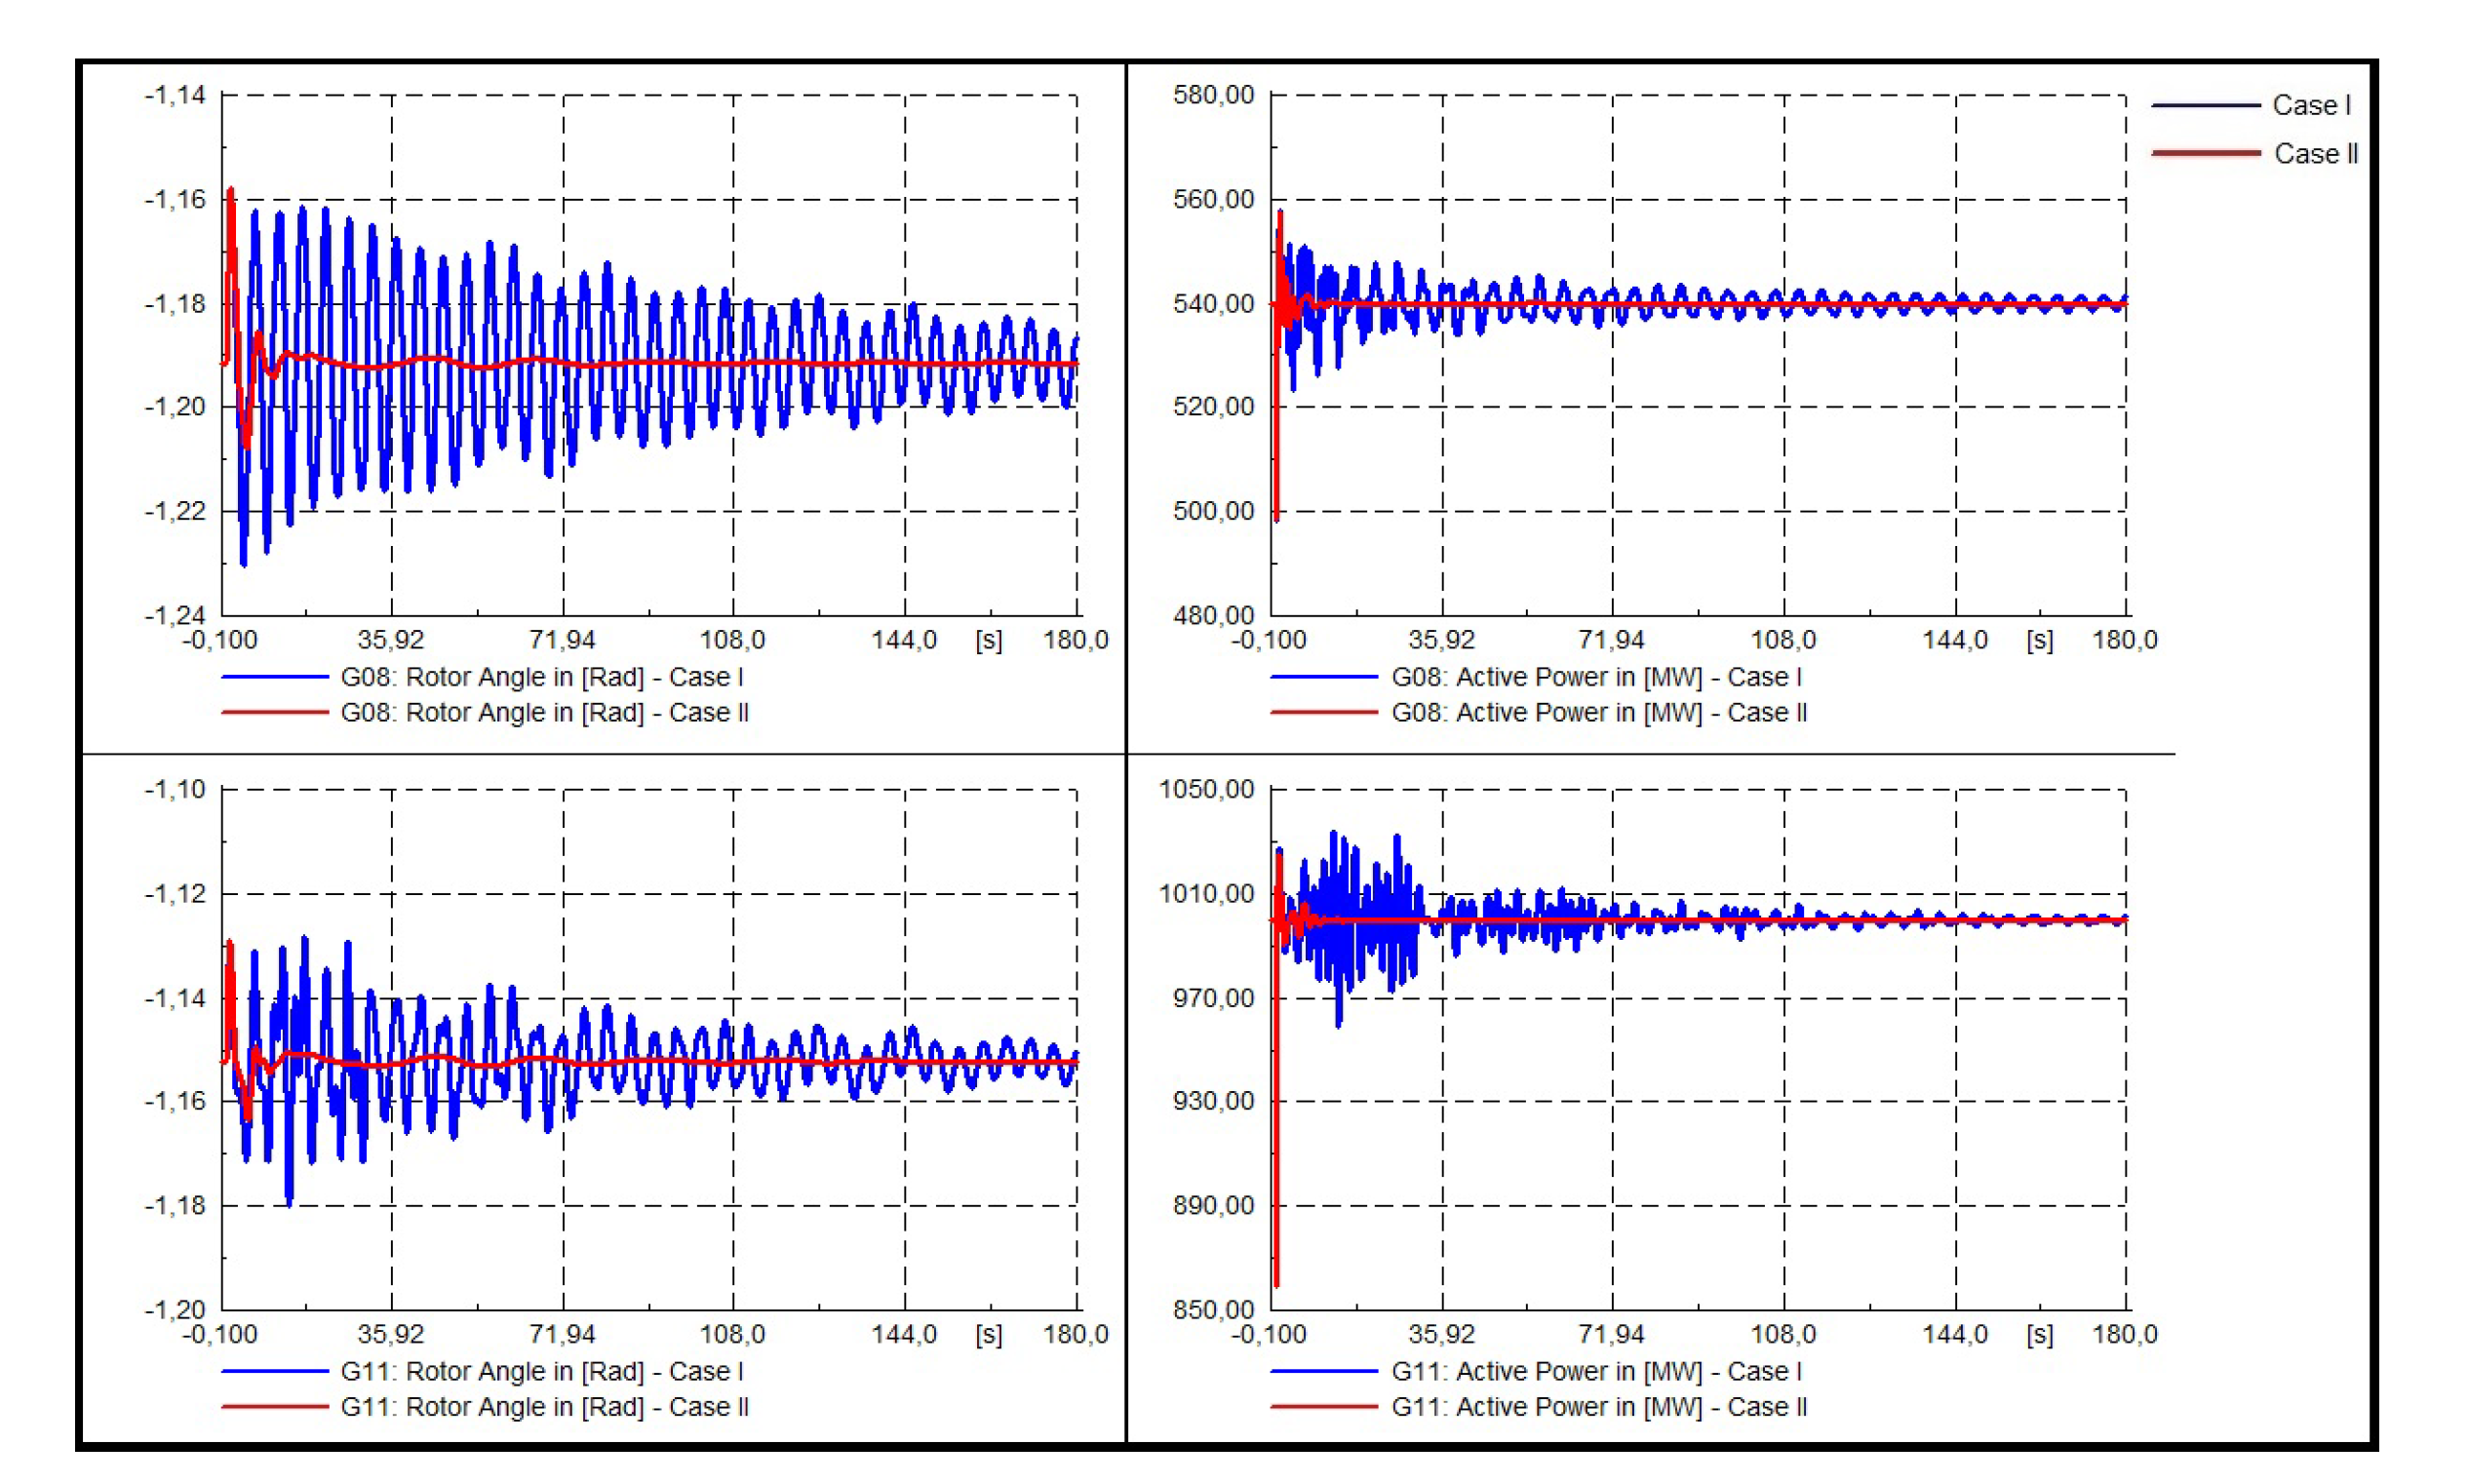
- Dynamic response of the system.In Figure 22, Figure 23 and Figure 24 the dynamic responses of system III are presented. For this system, three 3-phased faults in buses 15, 29, and 39 were modeled. Each fault has been applied at t = 1.0 and cleared at t = 1.1 [s] (5 cycles). The dynamic response of generators 5, 7, and 9 will be analyzed as they are those in which the optimal location of the PSS is proposed, as seen in reference [11].
- Three phase fault at bus 15.
- Three phase fault at bus 29.
- Three phase fault at bus 39.It is possible to clearly visualize that for each system, the proposed tuning improves the non-linear system response, not only in the rotor angle but also in the active power of the synchronic machines to the three modeled contingencies considered in the present study.
- Heavy and light load conditions.
5.4. System Iv Validation
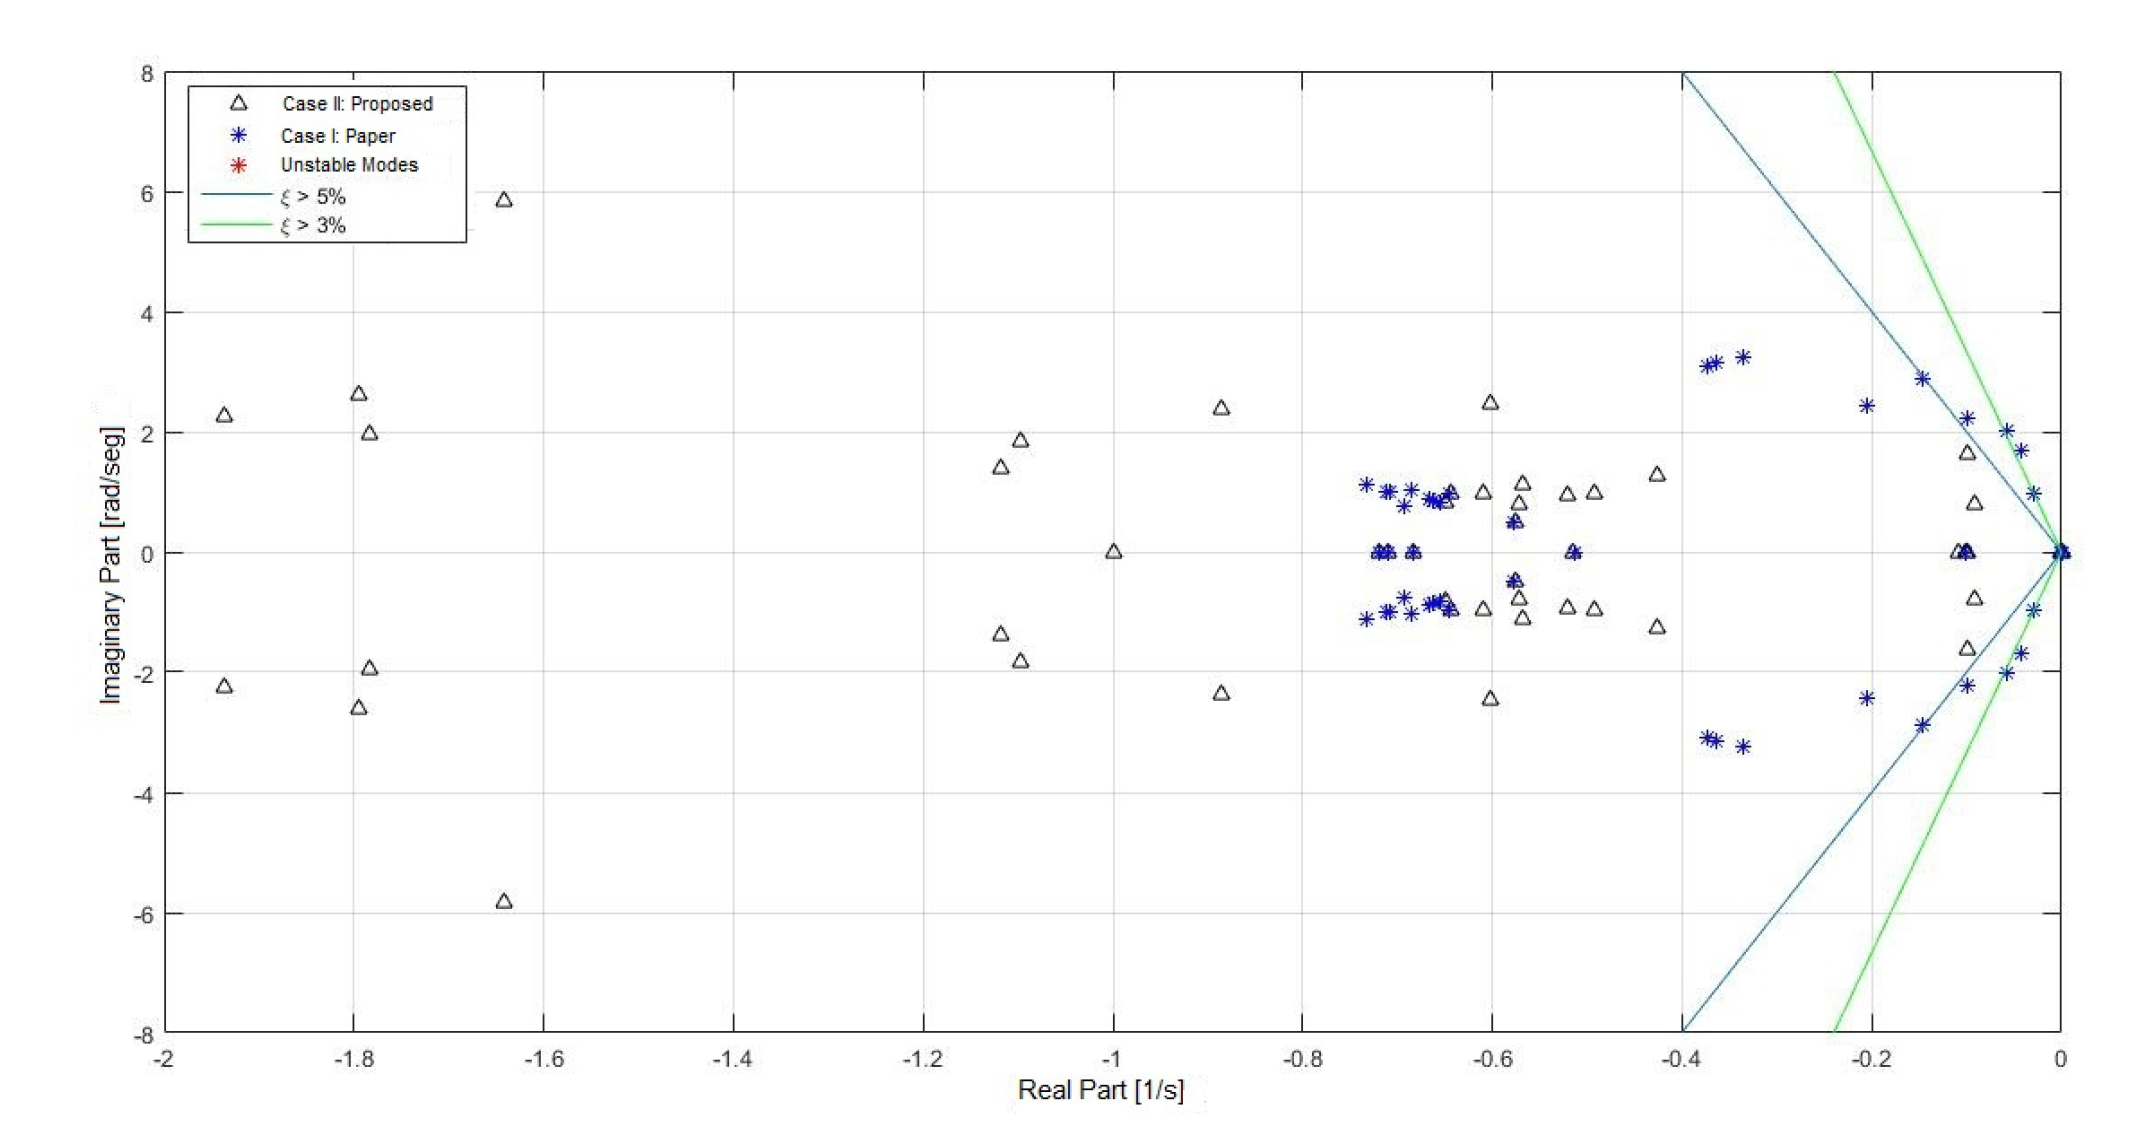
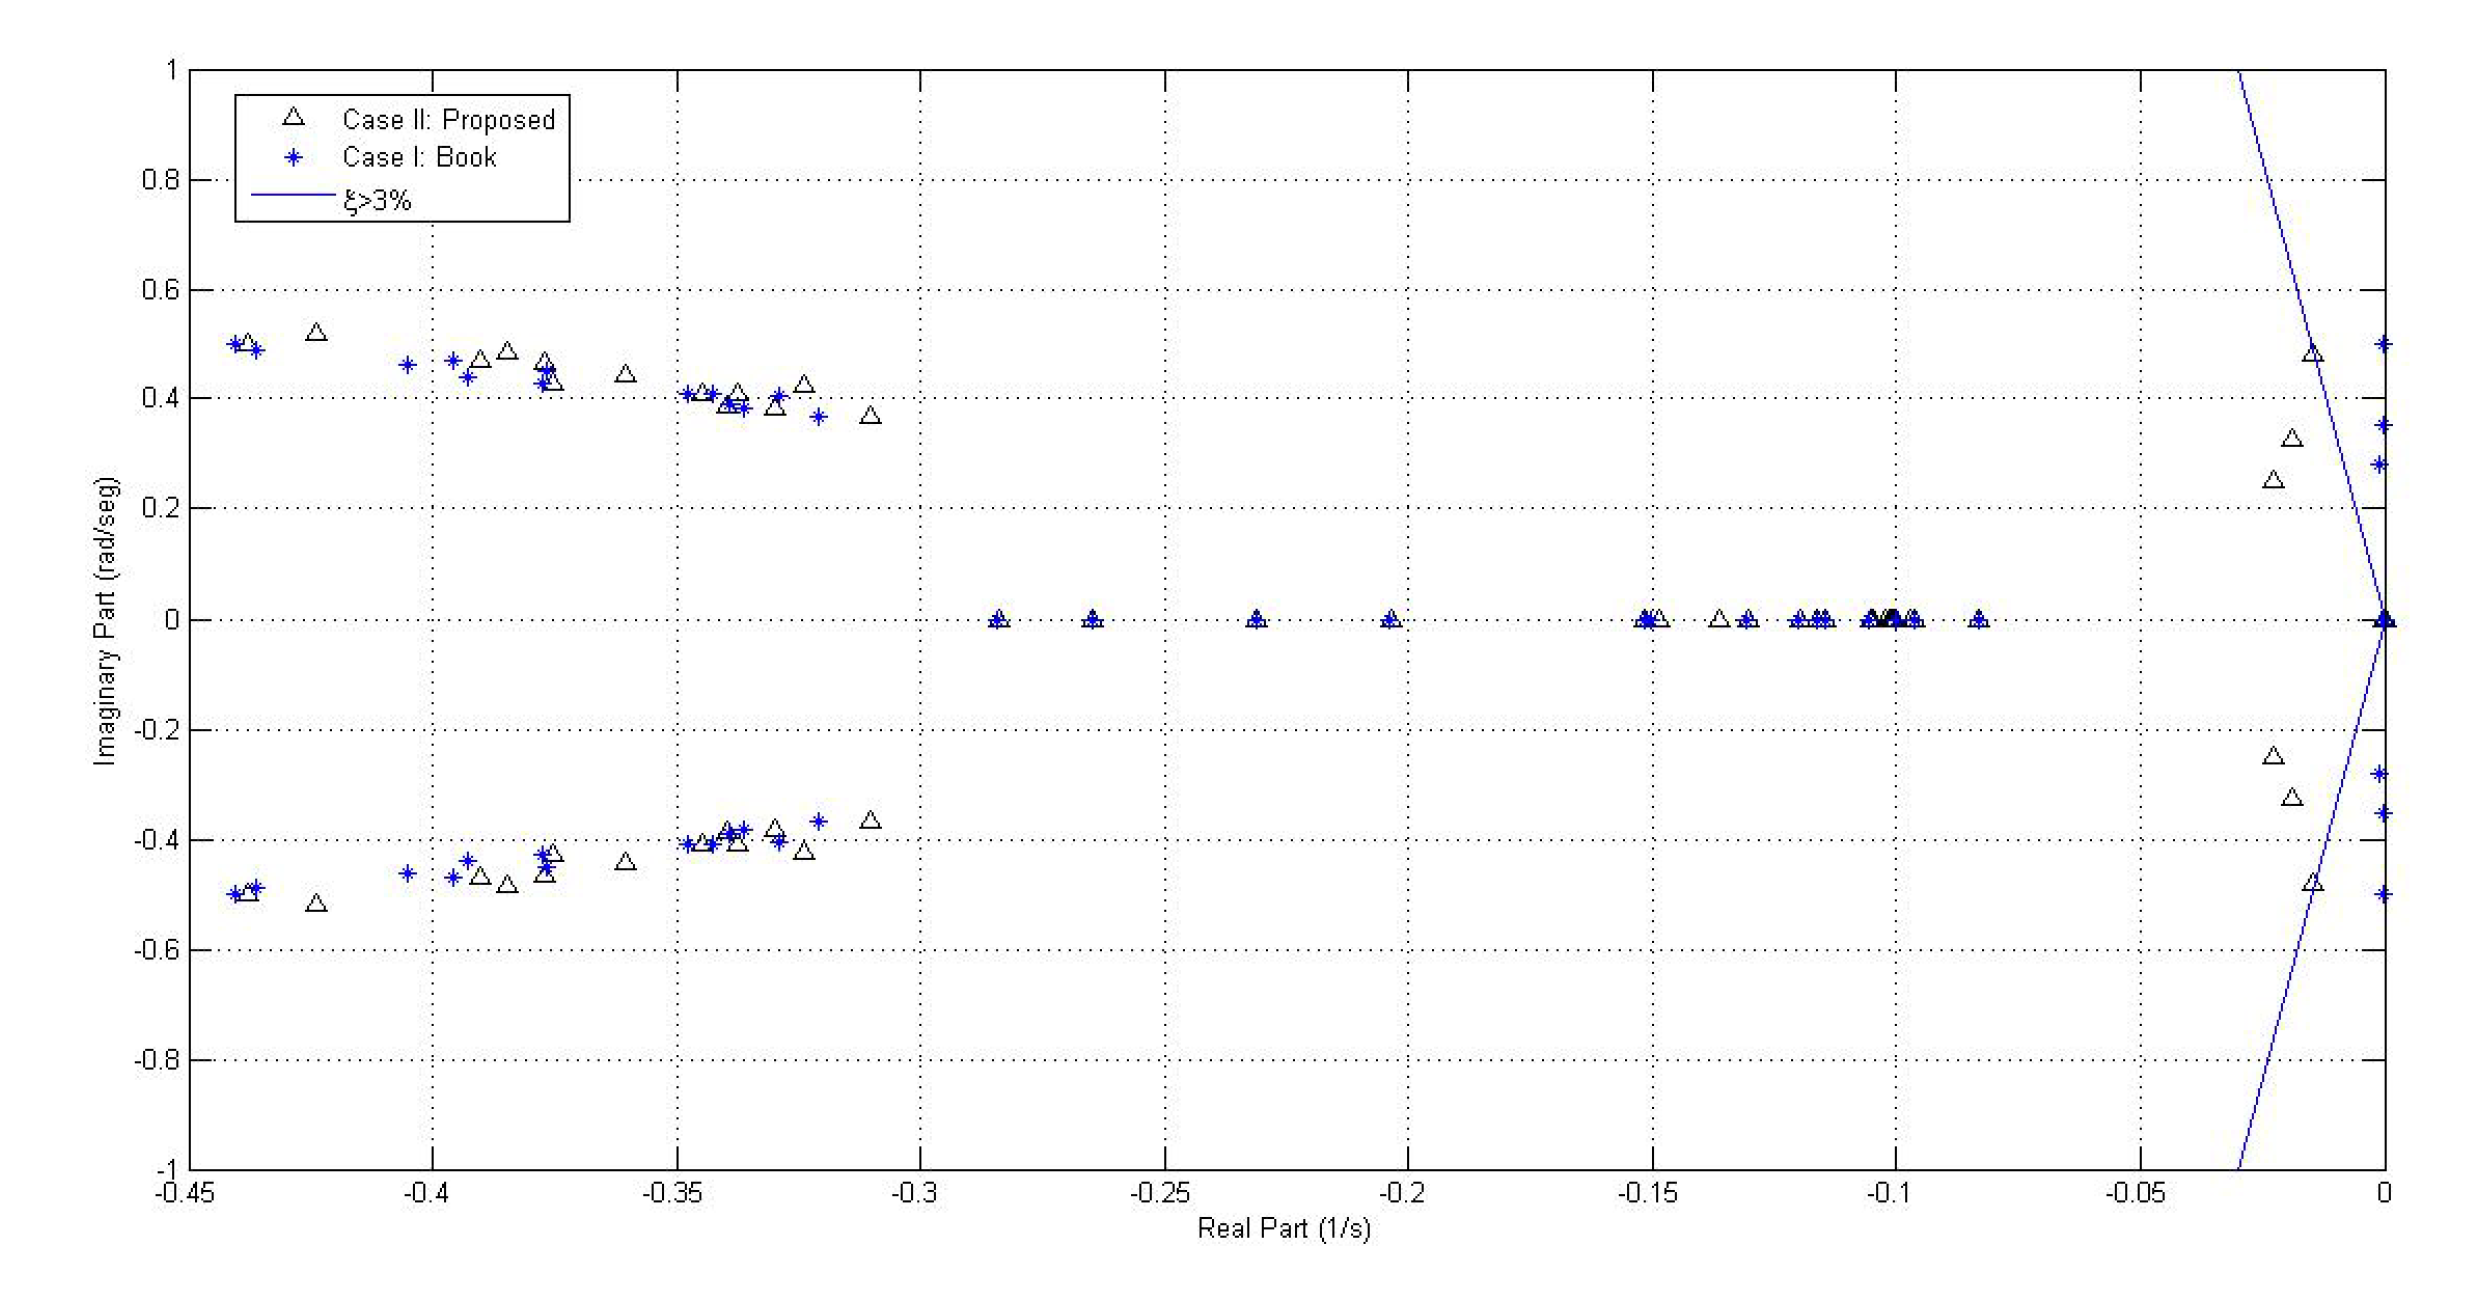
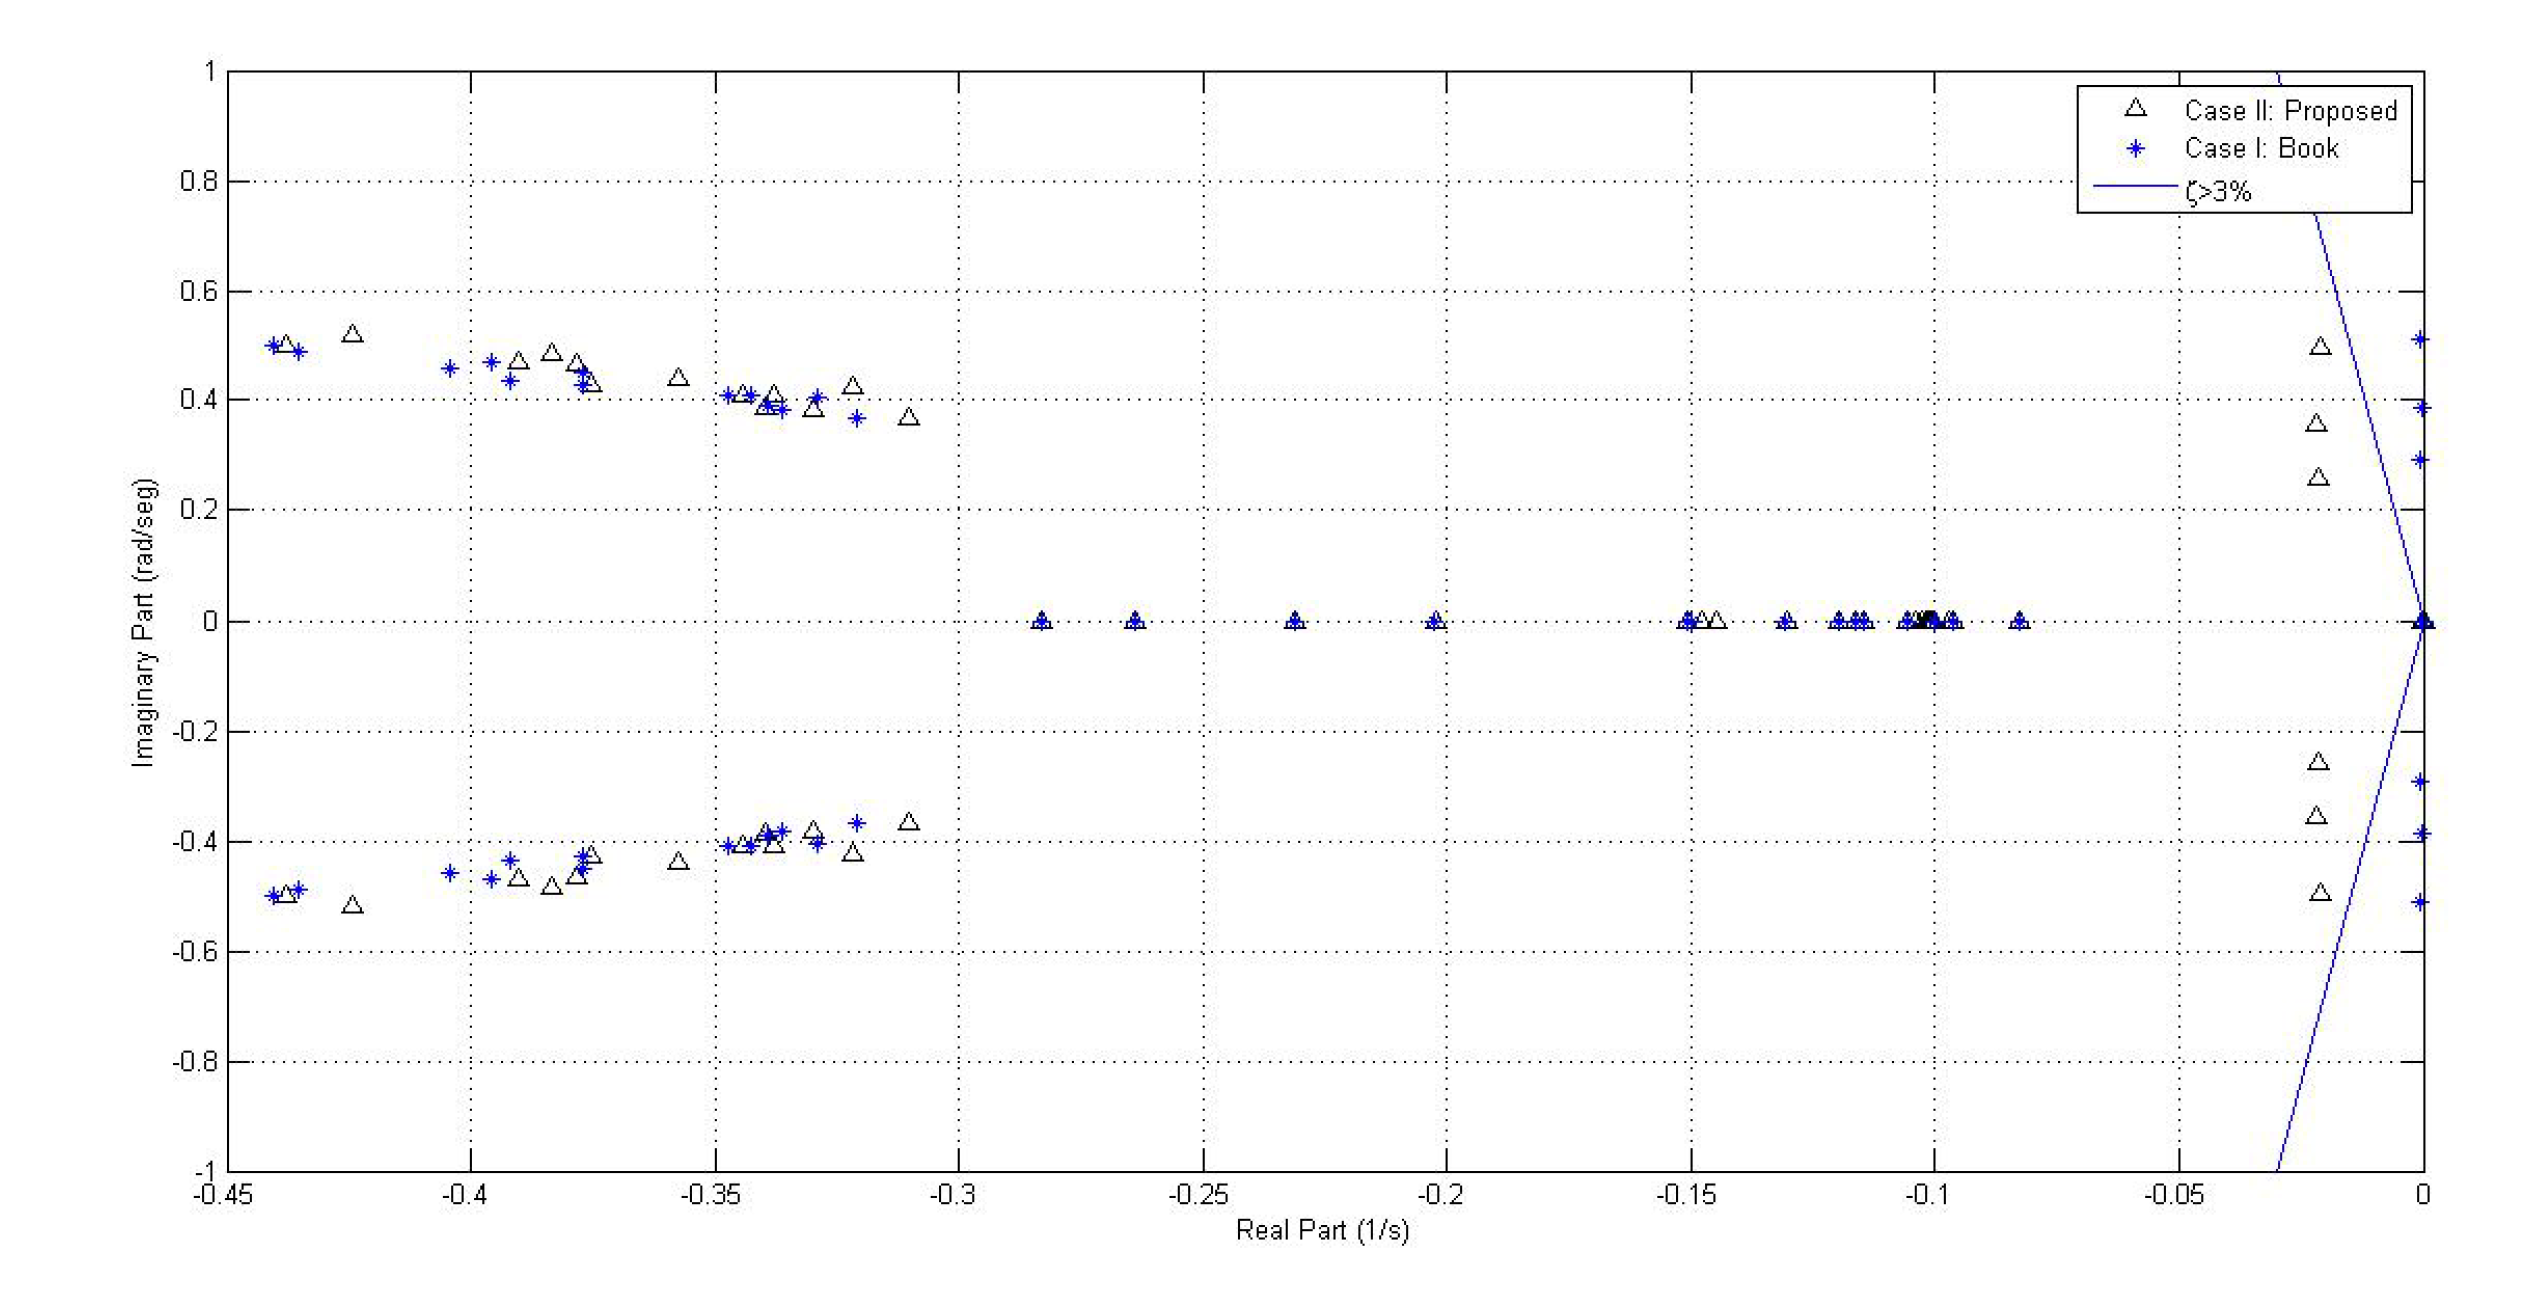
- Eigenvalues of system IV. Table 12 displays the eigenvalues for system IV with the respective oscillation frequency and damping.From Table 12 it is possible to see that some of the eigenvalues of system IV for case I do not reach the minimum damping; therefore, it can be established that the proposed fitting significantly improves the stability of the system, although it does not reach the minimum 5% damping established in the methodology.Similarly to the abovementioned cases, it is possible to notice that the eigenvalues presenting low damping correspond to electro-mechanic modes validating the damping action of the PSS controller.The previous situation can be clearly seen in Figure 27.
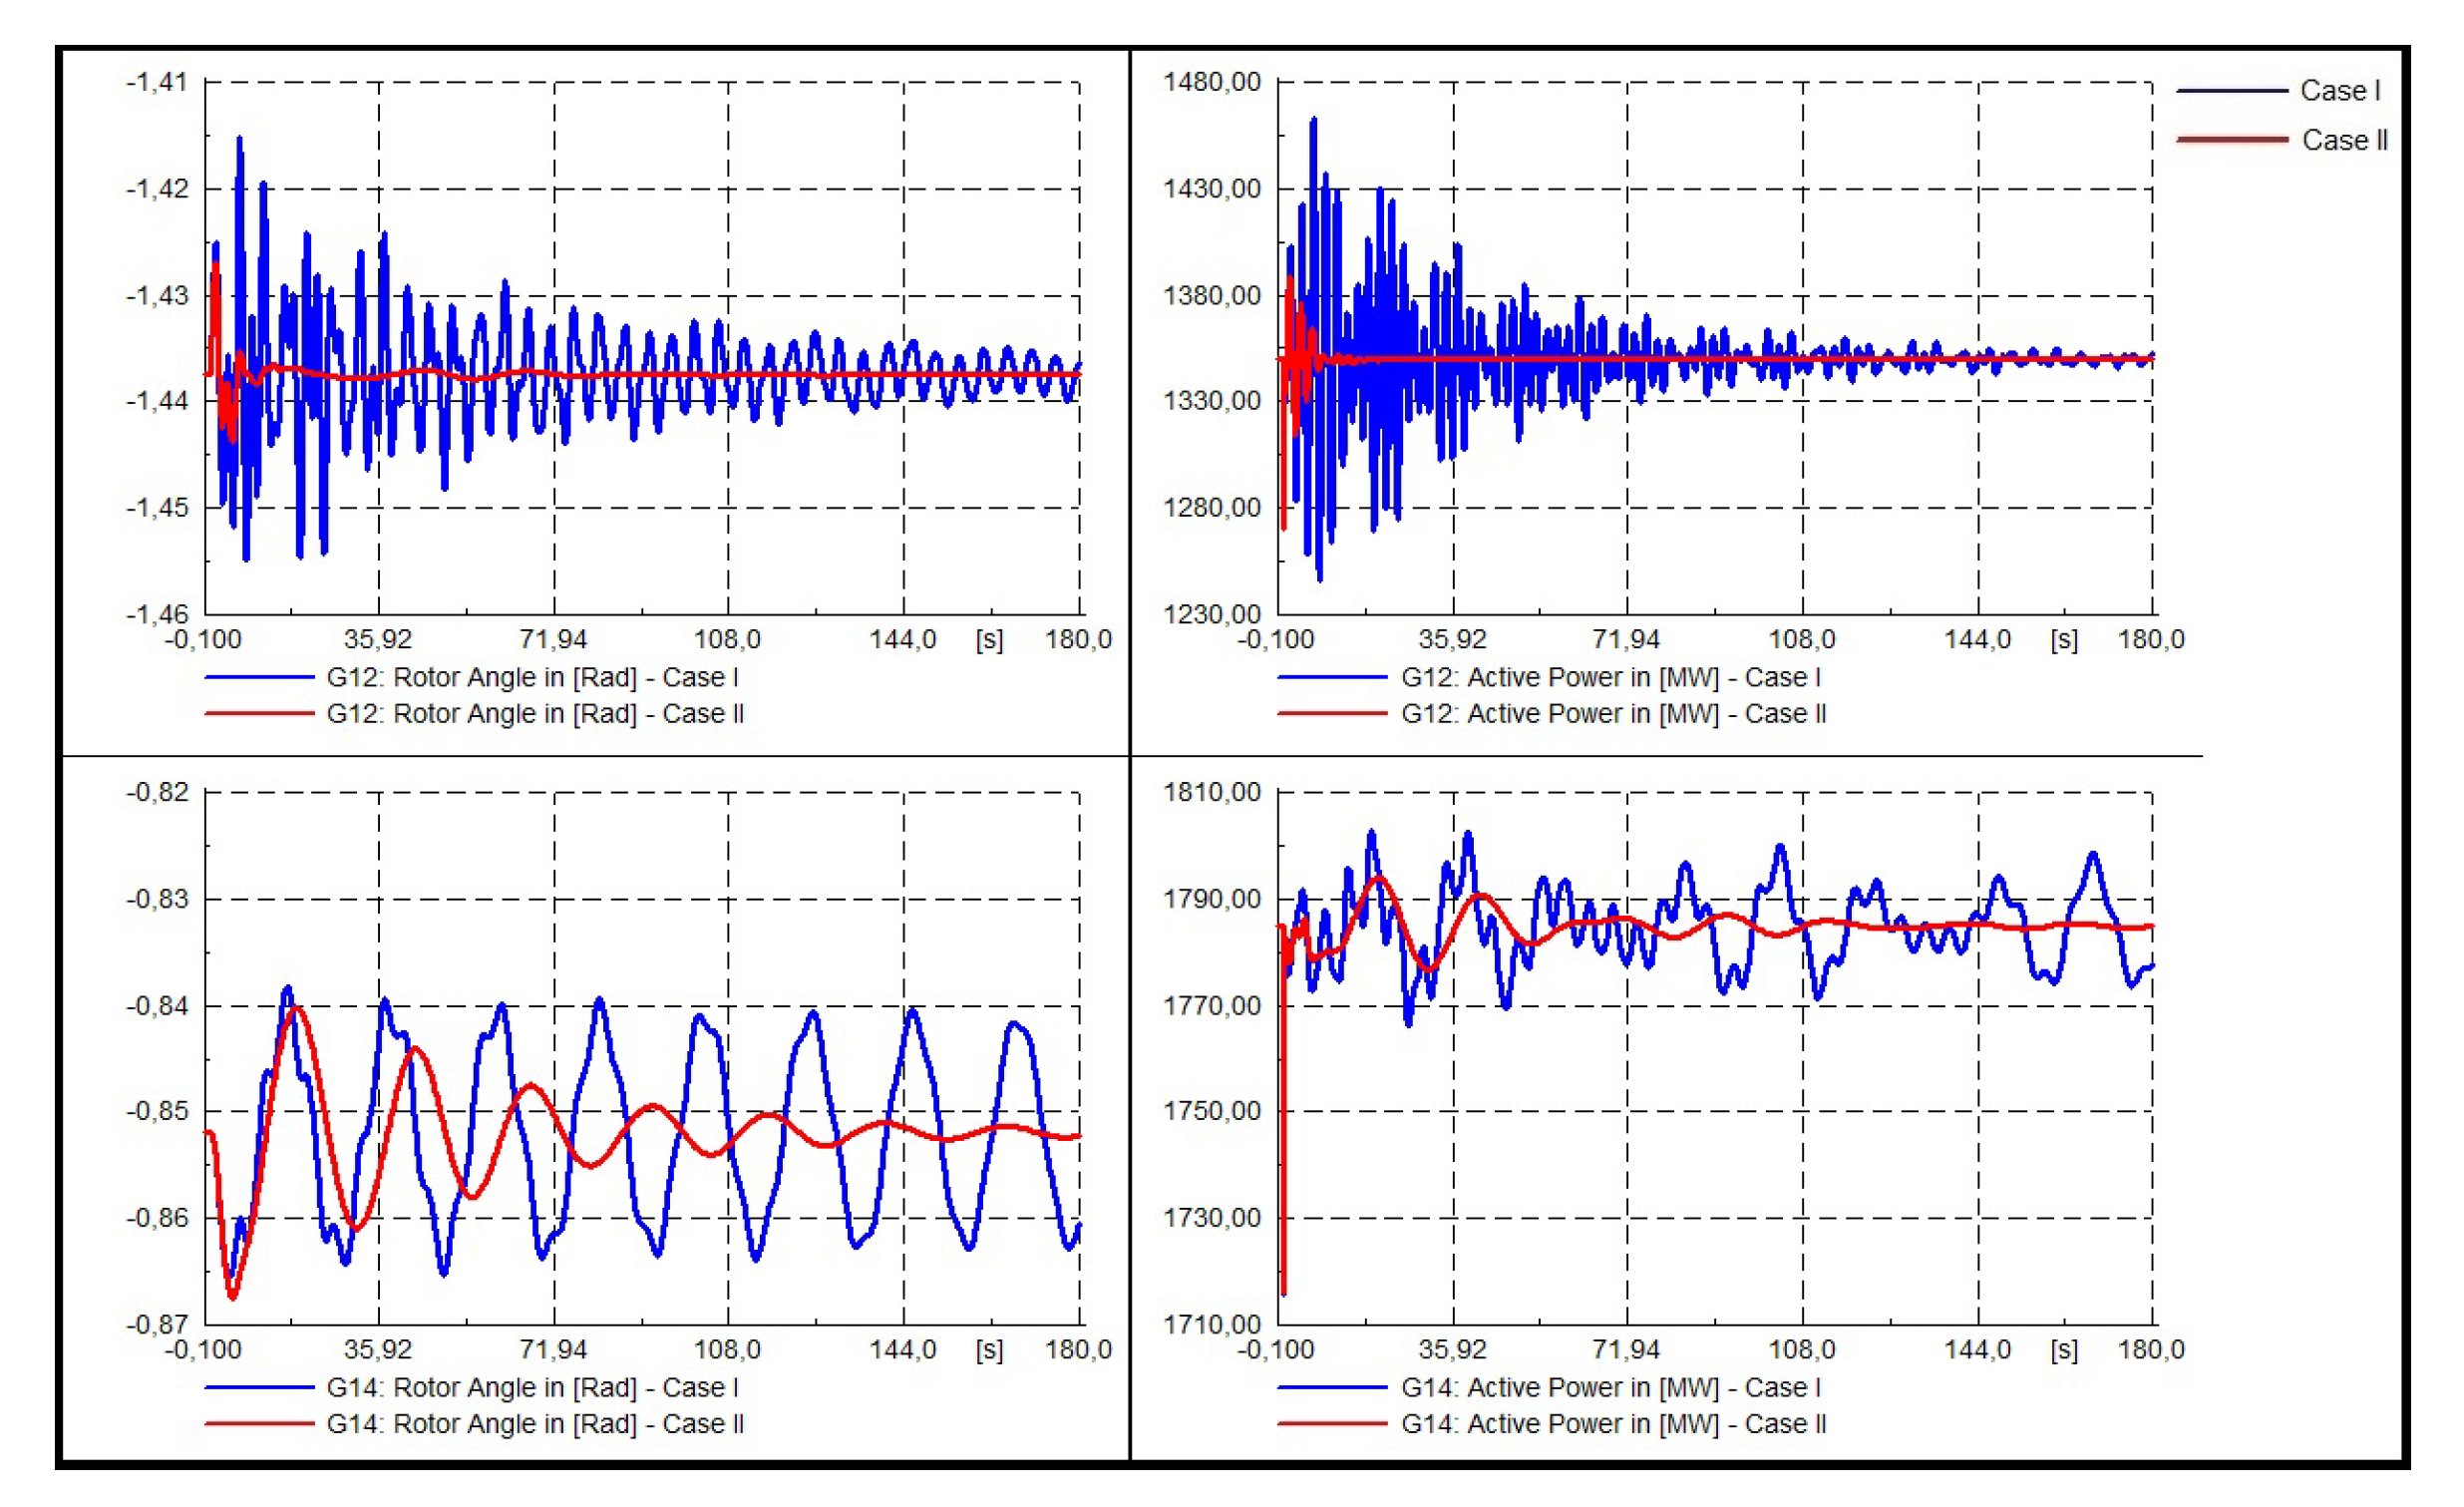
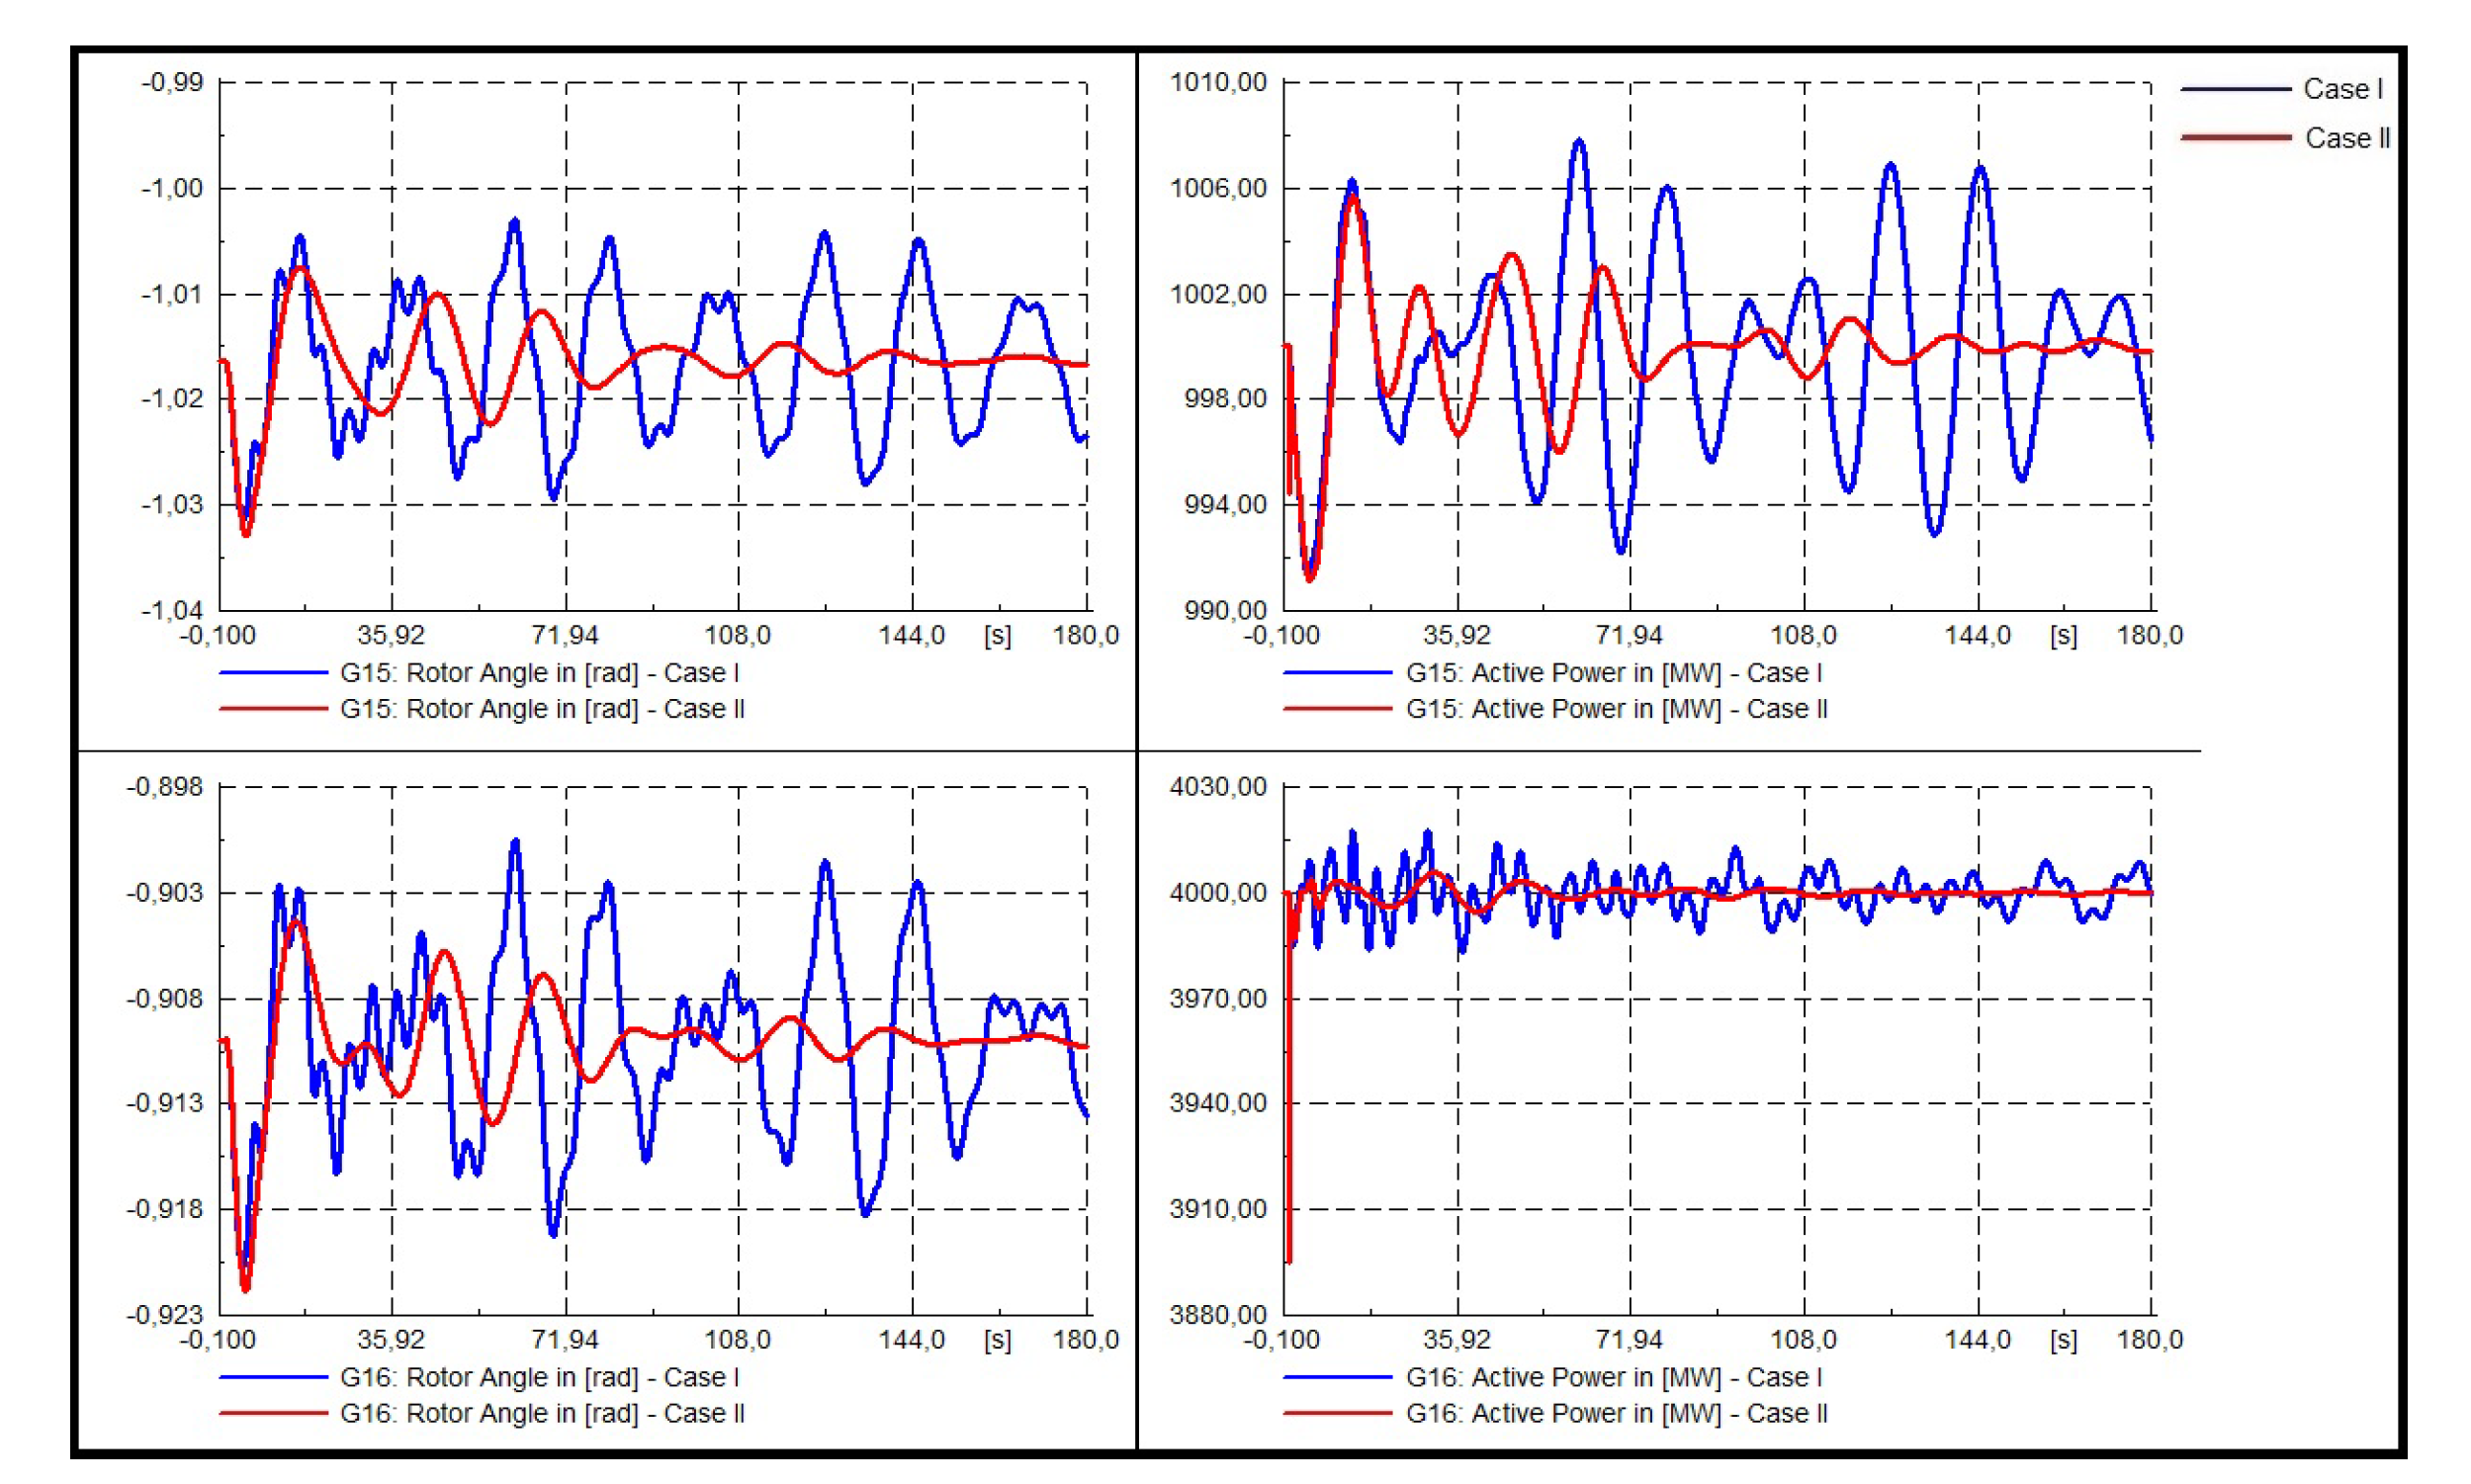
- Dynamic response of the system.For this system, and in order to validate the results, two 3-phase faults were modeled. The first one is a three phase fault in 50% of line 18–50 (see Figure 28, Figure 29 and Figure 30), whereas the second one is a three phase fault in 50% of line 60–61(see Figure 31, Figure 32 and Figure 33). Such locations were considered as these transmission lines transport large amounts of energy, and they respectively connect two areas of the system under study. Each fault has been applied at t = 1 [s] and cleared at t = 1.1 (5 cycles) [s]
- Three phase fault at Line 18–50
- Three phase fault at Line 60-61
- and heavy load operation conditionsFinally, the eigenvalues of the system for heavy and light operation conditions are presented considering an increase and decrease of 5% for each load. The response of the system is shown in Figure 34 and Figure 35.From the above presented figures, it is possible to see that the suggested fitting improves the stability of the system for both heavy and light load conditions. However, it does not reach the minimum 5% damping.
6. Conclusions
Author Contributions
Funding
Acknowledgments
Conflicts of Interest
References
- Verdugo, P.; PABLO, X. Metodologia de Sintonizacion del Estabilizador de Potencia; Escuela Politecnica Nacional: Quito, Ecuador, 2012. [Google Scholar]
- Talaq, J. Optimal power system stabilizers for multi machine systems. Int. J. Electr. Power Energy Syst. 2012, 43, 793–803. [Google Scholar] [CrossRef]
- Gomes, S., Jr.; Guimarães, C.H.C.; Martins, N.; Taranto, G.N. Damped Nyquist Plot for a pole placement design of power system stabilizers. Int. J. Electr. Power Energy Syst. 2018, 158, 158–169. [Google Scholar] [CrossRef]
- Mohandes, B.; Abdelmagid, Y.L.; Boiko, I. Development of PSS tuning rules using multi-objective optimization. Int. J. Electr. Power Energy Syst. 2018, 100, 449–462. [Google Scholar] [CrossRef]
- Gurrala, G.; Sen, I. Indranee, Power System Stabilizers Design for Interconnected Power System. IEEE Trans. Power Syst. 2010, 25, 1042–1051. [Google Scholar] [CrossRef]
- Verdejo, H.; Gonzalez, D.; Becker, C. Tuning of Power System Stabiliziers using Multiobjective Optimization NSGA II. IEEE Lat. Am. Trans. 2015, 8, 2653–2660. [Google Scholar] [CrossRef]
- Farah, A.; Guesmi, T.; Abdallah, H.H.; Ouali, A. Optimal Design of Multimachine Power System Stabiliziers Using Evolutionary Algorithms. In Proceedings of the 2012 First International Conference on Renewable Energies and Vehicular Technology, Hammamet, Tunisia, 26–28 March 2012; Volume 10, pp. 497–501. [Google Scholar]
- Abido, M.A. Parameter optimization of multimachine power system stabilizers using genetic local search. Int. J. Electr. Power Energy Syst. 2001, 23, 785–794. [Google Scholar] [CrossRef]
- Hajizadeh, M.; Sadeh, J. Simultaneous coordination and tuning of PSS and FACTS for improving damping by genetic algorithm. In Proceedings of the 2011 4th International Conference on Electric Utility Deregulation and Restructuring and Power Technologies (DRPT), Weihai, China, 6–9 July 2011; Volume 2, pp. 1311–1315. [Google Scholar]
- Kahouli, O.; Jebali, M.; Alshammari, B.; Abdallah, H.H. PSS design for damping low-frequency oscillations in a multi-machine power system with penetration of renewable power generations. IET Renew. Power Gener. 2018, 13, 116–127. [Google Scholar] [CrossRef]
- Abdel-Magid, Y.L.; Abido, M.A.; Mantaway, A.H. Robust tuning of power systema stabilizers in multimachine power systems. IEEE Trans. Power Syst. 2000, 2, 735–740. [Google Scholar] [CrossRef] [Green Version]
- Karthikeyan, K.; Dhal, P.K. Dynamic stability enhancement by selecting optimal location of STATCOM and tuned of Power System Stabilizer (PSS) using Firefly Algorithm. In Proceedings of the 2016 Biennial International Conference on Power and Energy Systems: Towards Sustainable Energy (PESTSE), Bangalore, India, 21–23 January 2016; Volume 2, pp. 1–7. [Google Scholar]
- Singh, M.; Patel, R.N.; Neema, D.D. Robust tuning of excitation controller for stability enhancement using multi-objective metaheuristic Firefly algorithm. Swarm Evol. Comput. 2019, 44, 136–147. [Google Scholar] [CrossRef]
- Karthikeyan, K.; Dhal, P.K. Analysis of the simultaneous coordinated design of STATCOM-based damping stabilizers and PSS in a multi-machine power system using the seeker optimization algorithm. Int. J. Electr. Power Energy Syst. 2013, 2, 1003–1017. [Google Scholar]
- Abido, M.A. Robust design of multimachine power system stabilizers using simulated annealing. IEEE Trans. Energy Convers. 2000, 2, 297–304. [Google Scholar] [CrossRef]
- Eke, Ī.; Taplamacıoğ, M.C.; Lee, K.Y. Robust tuning of power system stabilizer by using orthogonal learning artificial bee colony. IFAC-PapersOnLine 2006, 48, 149–154. [Google Scholar] [CrossRef]
- Shafiullah, M.; Rana, M.J.; Alam, M.S.; Abido, M.A. Online tuning of power system stabilizer employing genetic programming for stability enhancement. J. Electr. Syst. Inf. Technol. 2018, 5, 287–299. [Google Scholar] [CrossRef]
- Dey, P.; Bhattacharya, A.; Das, P. Priyanath, Tuning of power system stabilizer for small signal stability improvement of interconnected power system. Appl. Comput. Inform. 2017, in press. [Google Scholar] [CrossRef]
- Elazim, S.A.; Ali, E.S. Optimal power system stabilizers design via cuckoo search algorithm. Int. J. Electr. Power Energy Syst. 2016, 75, 99–107. [Google Scholar] [CrossRef]
- Wang, S.K. Coordinated parameter design of power system stabilizers and static synchronous compensator using gradual hybrid differential evaluation. Int. J. Electr. Power Energy Syst. 2016, 81, 165–174. [Google Scholar] [CrossRef]
- Ali, E.S. Optimization of power system stabilizers using BAT search algorithm. Int. J. Electr. Power Energy Syst. 2014, 61, 683–690. [Google Scholar] [CrossRef]
- Peres, W.; Júnior, I.C.S.; Passos Filho, J.A. Gradient based hybrid metaheuristics for robust tuning of power system stabilizers. Int. J. Electr. Power Energy Syst. 2018, 95, 47–72. [Google Scholar] [CrossRef]
- Rahmatian, M.; Seyedtabaii, S. Multi-machine optimal power system stabilizers design based on system stability and nonlinearity indices using Hyper-Spherical Search method. Int. J. Electr. Power Energy Syst. 2019, 105, 729–740. [Google Scholar] [CrossRef]
- Islam, N.N.; Hannan, M.A.; Shareef, H.; Mohamed, A. An application of backtracking search algorithm in designing power system stabilizers for large multi-machine system. Neurocomputing 2017, 237, 175–184. [Google Scholar] [CrossRef]
- Panda, S. Robust coordinated design of multiple and multi-type damping controller using differential evolution algorithm. Int. J. Electr. Power Energy Syst. 2011, 33, 1018–1030. [Google Scholar] [CrossRef]
- Abd-Elazim, S.M.; Ali, E.S. Coordinated design of PSSs and SVC via bacteria foraging optimization algorithm in a multimachine power system. Int. J. Electr. Power Energy Syst. 2012, 41, 44–53. [Google Scholar] [CrossRef]
- Miotto, E.L.; de Araujo, P.B.; de Vargas Fortes, E.; Gamino, B.R.; Martins, L.F.B. Coordinated tuning of the parameters of PSS and POD controllers using bioinspired algorithms. Int. J. Electr. Power Energy Syst. 2018, 54, 334–341. [Google Scholar]
- Costa Filho, R.N.D.; Paucar, V.L. Robust and Coordinated Tuning of PSS and FACTS-PODs of Interconnected Systems Considering Signal Transmission Delay Using Ant Lion Optimizer. J. Control. Autom. Electr. Syst. 2018, 29, 625–639. [Google Scholar] [CrossRef]
- Matsukawa, Y.; Watanabe, M.; Takahashi, H.; Mitani, Y. Optimal Placement and Tuning Approach for Design of Power System Stabilizers and Wide Area Damping Controllers Considering Transport Delay. IFAC-PapersOnLine 2018, 51, 534–539. [Google Scholar] [CrossRef]
- Eberhart, R.C.; Shi, Y.; Kennedy, J. Swarm Intelligence; Elsevier: Amsterdam, The Netherlands, 2001. [Google Scholar]
- Abido, M.A. Optimal design of power-system stabilizers using particle swarm optimization. IEEE Trans. Energy Convers. 2002, 3, 406–413. [Google Scholar] [CrossRef]
- Abido, A.A. Particle swarm optimization for multimachine power system stabilizer design. In Proceedings of the 2001 Power Engineering Society Summer Meeting. Conference Proceedings (Cat. No. 01CH37262), Vancouver, BC, Canada, 15–19 July 2001; Volume 3, pp. 1346–1351. [Google Scholar]
- Horng, H.Y. Lead-lag compensator design based on greedy particle swarm optimization. In Proceedings of the 2013 International Symposium on Next-Generation Electronics, Kaohsiung, Taiwan, 25–26 February 2013; Volume 3, pp. 579–581. [Google Scholar]
- Jagadeesh, P.; Veerraju, M.S. Particle swarm optimization based power system stabilizer for SMIB system. In Proceedings of the 2016 International Conference on Emerging Trends in Engineering, Technology and Science (ICETETS), Pudukkottai, India, 24–26 February 2016. [Google Scholar]
- Sidartha, P.; Narayana, P. Optimal location and controller design of STATCOM for power system stability improvement using PSO. J. Frankl. Inst. 2007, 2, 166–181. [Google Scholar]
- Abd-Elazim, S.M.; Ali, E.S. A hybrid particle swarm optimization and bacterial foraging for optimal power system stabilizers design. Int. J. Electr. Power Energy Syst. 2013, 46, 334–341. [Google Scholar] [CrossRef]
- Patel, A.; Gandhi, P.R. Damping Low Frequency Oscillations Using PSO Based Supplementary Controller and TCSC. In Proceedings of the 2018 International Conference on Power Energy, Environment and Intelligent Control (PEEIC), Greater Noida, India, 13–14 April 2018; pp. 38–43. [Google Scholar]
- Guo, S.; Zhang, S.; Song, J.; Zhao, Y.; Zhu, W. Tuning Approach for Power System Stabilizer PSS4B using Hybrid PSO. In IOP Conference Series: Earth and Environmental Science; IOP Publishing: Bristol, UK, 2018. [Google Scholar]
- Hemmati, R. Power system stabilizer design based on optimal model reference adaptive system. Neurocomputing 2018, 9, 311–318. [Google Scholar] [CrossRef]
- Stativă, A.; Gavrilaş, M.; Stahie, V. Optimal tuning and placement of power system stabilizer using particle swarm optimization algorithm. In Proceedings of the 2012 International Conference and Exposition on Electrical and Power Engineering, Iasi, Romania, 25–27 October 2012; pp. 242–247. [Google Scholar]
- El-Zonkoly, A.M.; Khalil, A.A.; Ahmied, N.M. Optimal tunning of lead-lag and fuzzy logic power system stabilizers using particle swarm optimization. Expert Syst. Appl. 2009, 36, 2097–2106. [Google Scholar] [CrossRef]
- Anderson, P.M.; Aziz, A. Power System Control and Stability, 2nd ed.; IEEE Press Power Engineering Series; El-Hawary, M.E., Ed.; John Wiley & Sons: Hoboken, NJ, USA, 2003. [Google Scholar]


| PSO | ||
|---|---|---|
| Name | Description | Value |
| nr_gen | N of generations | 80 |
| m | N of particles | 150 |
| nr_PSS | N of PSS | 3 |
| y | N parameter of PSS | 5 |
| Re ( | Threshold of real part of eigenvalue | −2.5 |
| Threshold of damping | 10% | |
| Scaling factor | 0.01 | |
| Upper limit of inertial coefficient | 0.7 | |
| Lower limit of intertial coefficient | 0.5 | |
| Upper limit of parameter | 0.8 | |
| Lower limit of parameter | 0.2 | |
| parameter | 0.3 | |
| Parameter | |||||
|---|---|---|---|---|---|
| Machine | Kpss | T1 | T2 | T3 | T4 |
| G1 | 29.8764 | 0.922815 | 0.062614 | 0.731436 | 0.106753 |
| G2 | 21.079585 | 1.18626 | 0.15 | 1.4752 | 0.134293 |
| G3 | 31.400599 | 0.488757 | 0.028397 | 0.884152 | 0.068939 |
| PSO | ||
|---|---|---|
| Name | Description | Value |
| nr_gen | N of generator | 80 |
| m | N of particles | 120 |
| nr_PSS | N of PSS | 4 |
| y | N parameter of PSS | 5 |
| Re ( | Threshold of real part of eigenvalue | −2.5 |
| Threshold of damping | 10% | |
| Scaling factor | 10 | |
| Upper limit of inertial coefficient | 0.7 | |
| Lower limit of intertial coefficient | 0.5 | |
| Upper limit of parameter | 0.8 | |
| Lower limit of parameter | 0.2 | |
| parameter | 0.3 | |
| Parameter | |||||
|---|---|---|---|---|---|
| Machine | Kpss | T1 | T2 | T3 | T4 |
| G1 | 37.49117 | 0.205705 | 0.072277 | 1.497174 | 0.15 |
| G2 | 39.22102 | 0.271944 | 0.144364 | 1.5 | 0.098224 |
| G3 | 24.64729 | 0.250473 | 0.15 | 1.314953 | 0.15 |
| G4 | 49.87273 | 1.5 | 0.084379 | 0.236174 | 0.15 |
| PSO | ||
|---|---|---|
| Name | Description | Value |
| nr_gen | N of generator | 80 |
| m | N of particles | 120 |
| nr_PSS | N of PSS | 4 |
| y | N parameter of PSS | 5 |
| Re ( | Threshold of real part of eigenvalue | −2.5 |
| Threshold of damping | 10% | |
| Scaling factor | 10 | |
| Upper limit of inertial coefficient | 0.7 | |
| Lower limit of intertial coefficient | 0.5 | |
| Upper limit of parameter | 0.8 | |
| Lower limit of parameter | 0.2 | |
| parameter | 0.3 | |
| Parameter | |||||
|---|---|---|---|---|---|
| Machine | Kpss | T1 | T2 | T3 | T4 |
| G1 | 10.432044 | 1.478861 | 0.15 | 0.374913 | 0.023914 |
| G2 | 36.033489 | 1.437871 | 0.15 | 1.5 | 0.15 |
| G3 | 14.506266 | 1.5 | 0.119038 | 0.850424 | 0.072852 |
| G4 | 48.169617 | 1.145656 | 0.15 | 1.345786 | 0.15 |
| G5 | 35.260967 | 1.5 | 0.149995 | 0.86816 | 0.087417 |
| G6 | 45.541835 | 1.5 | 0.122513 | 1.5 | 0.102206 |
| G7 | 39.085862 | 1.129667 | 0.131482 | 1.5 | 0.15 |
| G8 | 29.838559 | 1.416323 | 0.114394 | 1.153558 | 0.02 |
| G9 | 19.210443 | 1.5 | 0.144287 | 1.5 | 0.091659 |
| G10 | 7.793736 | 1.127694 | 0.023142 | 0.2 | 0.02 |
| PSO | ||
|---|---|---|
| Name | Description | Value |
| nr_gen | N of generator | 200 |
| m | N of particles | 200 |
| nr_PSS | N of PSS | 16 |
| y | N parameter of PSS | 5 |
| Re ( | Threshold of real part of eigenvalue | −2.5 |
| Threshold of damping | 10% | |
| Scaling factor | 100 | |
| Upper limit of inertial coefficient | 0.7 | |
| Lower limit of intertial coefficient | 0.5 | |
| Upper limit of parameter | 0.8 | |
| Lower limit of parameter | 0.2 | |
| parameter | 0.3 | |
| Parameter | |||||
|---|---|---|---|---|---|
| Machine | Kpss | T1 | T2 | T3 | T4 |
| G1 | 48.01576 | 1.5 | 0.02 | 1.5 | 0.02 |
| G2 | 0.1 | 0.2 | 0.060114 | 0.662426 | 0.115397 |
| G3 | 50 | 1.498526 | 0.029475 | 1.354577 | 0.15 |
| G4 | 2.756064 | 1.481677 | 0.02 | 0.2 | 0.020079 |
| G5 | 50 | 0.924893 | 0.02 | 1.5 | 0.101533 |
| G6 | 50 | 1.5 | 0.02 | 1.5 | 0.113546 |
| G7 | 0.1 | 0.201944 | 0.023486 | 0.2 | 0.15 |
| G8 | 25.78055 | 1.5 | 0.052775 | 1.5 | 0.01 |
| G9 | 22.71305 | 1.499211 | 0.02 | 0.2 | 0.15 |
| G10 | 37.30629 | 1.485579 | 0.109351 | 1.084629 | 0.13113 |
| G11 | 16.01183 | 1.5 | 0.049857 | 1.5 | 0.067552 |
| G12 | 48.71725 | 1.5 | 0.139063 | 1.499829 | 0.15 |
| G13 | 49.65499 | 0.559447 | 0.144376 | 1.20308 | 0.149818 |
| G14 | 12.30563 | 49.65499 | 0.15 | 1.322034 | 0.12098 |
| G15 | 12.73468 | 0.2 | 0.144677 | 0.518055 | 0.037773 |
| G16 | 43.09003 | 1.5 | 0.02 | 1.211042 | 0.15 |
| Mode N | Real Part (1/s) | Imaginary Part (rad/s) | Oscilation Frequency (Hz) | Damping (%) |
|---|---|---|---|---|
| 1 | −0.9127 | 26.312 | 4.1877 | 3.47% |
| 2 | −0.9127 | −26.312 | 4.1877 | 3.47% |
| 3 | −0.2927 | 13.2341 | 2.1063 | 2.21% |
| 4 | −0.2927 | −13.2341 | 2.1063 | 2.21% |
| 5 | −0.0926 | 0.1648 | 0.0262 | 48.96% |
| 6 | −0.0926 | −0.1648 | 0.0262 | 48.96% |
| Case with no controllers | ||||
| 1 | −0.8964 | 25.9609 | 4.1318 | 3.45% |
| 2 | −0.8964 | −25.9609 | 4.1318 | 3.45% |
| 3 | −0.2899 | 13.0791 | 2.0816 | 2.22% |
| 4 | −0.2899 | −13.0791 | 2.0816 | 2.22% |
| 5 | 0.1253 | 0.4867 | 0.0775 | −24.93% |
| 6 | 0.1253 | −0.4867 | 0.0775 | −24.93% |
| Case I | ||||
| 1 | −0.8102 | 25.9037 | 4.1227 | 3.13% |
| 2 | −0.8102 | −25.9037 | 4.1227 | 3.13% |
| 3 | −0.2023 | 13.0085 | 2.0704 | 1.55% |
| 4 | −0.2023 | −13.0085 | 2.0704 | 1.55% |
| 5 | −0.2028 | 0.9933 | 0.1581 | 20.01% |
| 6 | −0.2028 | −0.9933 | 0.1581 | 20.01% |
| Case II | ||||
| Caso I | Caso II | |||||||
|---|---|---|---|---|---|---|---|---|
| Modo | Real Part (1/seg) | Imaginary Part (rad/seg) | Frecuency of Oscilation (Hz) | Damping(%) | Real Part (1/seg) | Imaginary Part (rad/seg) | Frecuency of Oscilation (Hz) | Damping (%) |
| 1 | 0.0118 | 3.0557 | 0.4863 | −0.39% | −2.3430 | 8.8669 | 1.4112 | 25.55% |
| 2 | 0.0118 | −3.0557 | 0.4863 | −0.39% | −2.3430 | −8.8669 | 1.4112 | 25.55% |
| 3 | −0.3941 | 6.5169 | 1.0372 | 6.04% | −2.5201 | 9.3260 | 1.4843 | 26.09% |
| 4 | −0.3941 | −6.5169 | 1.0372 | 6.04% | −2.5201 | −9.3260 | 1.4843 | 26.09% |
| 5 | −0.3874 | 6.3195 | 1.0058 | 6.12% | −6.4945 | 3.6168 | 0.5756 | 87.37% |
| 6 | −0.3874 | −6.3195 | 1.0058 | 6.12% | −6.4945 | −3.6168 | 0.5756 | 87.37% |
| Caso I | Caso II | |||||||
|---|---|---|---|---|---|---|---|---|
| Modo | Parte Real (1/seg) | Parte Imag (rad/seg) | Frecuencia Oscilacion (Hz) | Factor de Amortiguamiento (%) | Parte Real (1/seg) | Parte Imag (rad/seg) | Frecuencia Oscilacion (Hz) | Factor de Amortiguamiento (%) |
| 75 | −0.0434 | 1.6900 | 0.2690 | 2.565% | −0.1009 | 1.6146 | 0.2570 | 6.237% |
| 76 | −0.0434 | −1.6900 | 0.2690 | 2.565% | −0.1009 | −1.6146 | 0.2570 | 6.237% |
| 73 | −0.0565 | 2.0304 | 0.3232 | 2.780% | −0.3116 | 2.4606 | 0.3916 | 12.564% |
| 74 | −0.0565 | −2.0304 | 0.3232 | 2.780% | −0.3116 | −2.4606 | 0.3916 | 12.564% |
| 77 | −0.0402 | 0.9823 | 0.1563 | 4.091% | −2.5051 | 5.8045 | 0.9238 | 39.6249% |
| 78 | −0.0402 | −0.9823 | 0.1563 | 4.091% | −2.5051 | −5.8045 | 0.9238 | 39.6249% |
| 71 | −0.0999 | 2.2478 | 0.3578 | 4.438% | −1.2704 | 2.8987 | 0.4613 | 40.142% |
| 72 | −0.0999 | −2.2478 | 0.3578 | 4.438% | −1.2704 | −2.8987 | 0.4613 | 40.142% |
| 65 | −0.1486 | 2.8968 | 0.4610 | 5.1222% | −2.3481 | 5.1789 | 0.8242 | 41.2937% |
| 66 | −0.1486 | −2.8968 | 0.4610 | 5.1222% | −2.3481 | −5.1789 | 0.8242 | 41.2937% |
| 67 | −0.1773 | 2.6070 | 0.4149 | 6.7853% | −0.5507 | 1.0815 | 0.1721 | 45.374% |
| 68 | −0.1773 | −2.6070 | 0.4149 | 6.7853% | −0.5507 | −1.0815 | 0.1721 | 45.374% |
| Case I | Case II | |||||||
|---|---|---|---|---|---|---|---|---|
| Modo | Real Part (1/s) | Imaginary Part (rad/seg) | Oscilation Frecuency (Hz) | Damping (%) | Real Part (1/s) | Imaginary Part (rad/seg) | Osilation Frecuency (Hz) | Damping (%) |
| 1 | −0.0181 | 0.4896 | 0.0779 | 0.052% | −0.0181 | 0.4896 | 0.0779 | 3.69% |
| 2 | −0.0181 | −0.4896 | 0.0779 | 0.052% | −0.0181 | −0.4896 | 0.0779 | 3.69% |
| 3 | −0.0221 | 0.3445 | 0.0548 | 0.068% | −0.0221 | 0.3445 | 0.0548 | 6.39% |
| 4 | −0.0221 | −0.3445 | 0.0548 | 0.068% | −0.0221 | −0.3445 | 0.0548 | 6.39% |
| 5 | −0.2943 | 3.4198 | 0.5443 | 0.346% | −0.2943 | 3.4198 | 0.5443 | 8.57% |
| 6 | −0.2943 | −3.4198 | 0.5443 | 0.346% | −0.2943 | −3.4198 | 0.5443 | 8.57% |
| 7 | −0.0226 | 0.2559 | 0.0407 | 0.405% | −0.0226 | 0.2559 | 0.0407 | 8.81% |
| 8 | −0.0226 | −0.2559 | 0.0407 | 0.405% | −0.0226 | −0.2559 | 0.0407 | 8.81% |
| 9 | −0.3364 | 3.3184 | 0.5281 | 0.603% | −0.3364 | 3.3184 | 0.5281 | 10.08% |
| 10 | −0.3364 | −3.3184 | 0.5281 | 0.603% | −0.3364 | −3.3184 | 0.5281 | 10.08% |
| 11 | −0.3579 | 2.8499 | 0.4536 | 0.832% | −0.3579 | 2.8499 | 0.4536 | 12.46% |
| 12 | −0.3579 | −2.8499 | 0.4536 | 0.832% | −0.3579 | −2.8499 | 0.4536 | 12.46% |
| 13 | −0.3203 | 2.5211 | 0.4012 | 0.905% | −0.3203 | 2.5211 | 0.4012 | 12.60% |
| 14 | −0.3203 | −2.5211 | 0.4012 | 0.905% | −0.3203 | −2.5211 | 0.4012 | 12.60% |
| 15 | −0.7600 | 4.3524 | 0.6927 | 0.935% | −0.7600 | 4.3524 | 0.6927 | 17.20% |
| 16 | −0.7600 | −4.3524 | 0.6927 | 0.935% | −0.7600 | −4.3524 | 0.6927 | 17.20% |
| 17 | −0.5179 | 2.2902 | 0.3645 | 1.037% | −0.5179 | 2.2902 | 0.3645 | 22.06% |
| 18 | −0.5179 | −2.2902 | 0.3645 | 1.037% | −0.5179 | −2.2902 | 0.3645 | 22.06% |
| 19 | −0.9296 | 3.5917 | 0.5716 | 1.475% | −0.9296 | 3.5917 | 0.5716 | 25.06% |
| 20 | −0.9296 | −3.5917 | 0.5716 | 1.475% | −0.9296 | −3.5917 | 0.5716 | 25.06% |
| 21 | −1.6683 | 5.7382 | 0.9133 | 1.640% | −1.6683 | 5.7382 | 0.9133 | 27.92% |
| 22 | −1.6683 | −5.7382 | 0.9133 | 1.640% | −1.6683 | −5.7382 | 0.9133 | 27.92% |
| 23 | −1.1723 | 3.7517 | 0.5971 | 1.962% | −1.1723 | 3.7517 | 0.5971 | 29.82% |
| 24 | −1.1723 | −3.7517 | 0.5971 | 1.962% | −1.1723 | −3.7517 | 0.5971 | 29.82% |
| 25 | −0.4211 | 1.0782 | 0.1716 | 2.429% | −0.4211 | 1.0782 | 0.1716 | 36.38% |
| 26 | −0.4211 | −1.0782 | 0.1716 | 2.429% | −0.4211 | −1.0782 | 0.1716 | 36.38% |
| 27 | −2.2125 | 4.3697 | 0.6955 | 2.450% | −2.2125 | 4.3697 | 0.6955 | 45.17% |
| 28 | −2.2125 | −4.3697 | 0.6955 | 2.450% | −2.2125 | −4.3697 | 0.6955 | 45.17% |
| 29 | −2.2253 | 4.2843 | 0.6819 | 2.759% | −2.2253 | 4.2843 | 0.6819 | 46.09% |
| 30 | −2.2253 | −4.2843 | 0.6819 | 2.759% | −2.2253 | −4.2843 | 0.6819 | 46.09% |
© 2020 by the authors. Licensee MDPI, Basel, Switzerland. This article is an open access article distributed under the terms and conditions of the Creative Commons Attribution (CC BY) license (http://creativecommons.org/licenses/by/4.0/).
Share and Cite
Verdejo, H.; Pino, V.; Kliemann, W.; Becker, C.; Delpiano, J. Implementation of Particle Swarm Optimization (PSO) Algorithm for Tuning of Power System Stabilizers in Multimachine Electric Power Systems. Energies 2020, 13, 2093. https://doi.org/10.3390/en13082093
Verdejo H, Pino V, Kliemann W, Becker C, Delpiano J. Implementation of Particle Swarm Optimization (PSO) Algorithm for Tuning of Power System Stabilizers in Multimachine Electric Power Systems. Energies. 2020; 13(8):2093. https://doi.org/10.3390/en13082093
Chicago/Turabian StyleVerdejo, Humberto, Victor Pino, Wolfgang Kliemann, Cristhian Becker, and José Delpiano. 2020. "Implementation of Particle Swarm Optimization (PSO) Algorithm for Tuning of Power System Stabilizers in Multimachine Electric Power Systems" Energies 13, no. 8: 2093. https://doi.org/10.3390/en13082093