Article

Building a Decision-Making Support Framework for Installing Solar Panels on Vertical Glazing Façades of the Building Based on the Life Cycle Assessment and Environmental Benefit Analysis

1
Faculty of Civil Engineering, Ho Chi Minh City University of Technology, VNU-HCM, Ho Chi Minh City 700000, Vietnam
2
Faculty of Project Management, The University of Danang, University of Science and Technology, Danang 550000, Vietnam
3
Faculty of Electrical Engineering, The University of Danang, University of Science and Technology, Danang City 550000, Vietnam
*
Authors to whom correspondence should be addressed.
Energies 2020, 13(9), 2376; https://doi.org/10.3390/en13092376
Submission received: 31 March 2020 / Revised: 30 April 2020 / Accepted: 6 May 2020 / Published: 9 May 2020
(This article belongs to the Section G: Energy and Buildings)

Abstract

:
Glazing is considered as a preferred solution for the buildability, aesthetic, and comfort of commercial buildings since glass cover can protect occupants from external environmental conditions, ensure the light transmission, and provide view and ventilation. At the same time, in the context of climate change and global warming, the use of renewable solar energy, such as solar and wind power, are encouraged to be utilized. Specifically, solar energy has become a renewable energy source that is clean and endless, at reasonable cost, to contribute to energy security as well as ensure sustainable development. Therefore, the study proposes a method for supporting the decision making in installing solar panels on vertical glazing façades of the building in the worst case that the remaining radiant energy from the sun was only transferred to the inside of the building. The Life Cycle Assessment and the Life Cycle Costing methodologies are applied to consider both environmental and economic aspects. The proposed method can (1) minimize the project cost (including initial investment cost and operation cost) during the building lifetime; (2) analyze the optimal budget to minimize the total life-cycle cost of the building over its lifespan and maximize the renewable energy generated from the sunlight entering buildings in different directions. The results show that with different initial investments, the investor will have a corresponding solution for choosing an optimal installation ratio for each type of glass combined with the installation ratio of solar panels on the façades to reach the optimal energy efficiency as well as environmental performance. This study is beneficial for investors in selecting energy-saving solutions in office buildings in the beginning phase of the project life cycle.

Graphical Abstract

1. Introduction

In recent years, climate change has become a global concern. Global climate change has become more and more severe with the noticeable phenomena of global warming, ice melting, sea rising, unusual phenomena, such as floods, tsunamis, earthquakes, droughts, and prolonged cold spells. Those issues lead to a lack of food and a series of epidemics on humans, cattle, and poultry. One of the most important causes of this phenomenon is that people are using more and more energy derived from fossil raw materials (coal, oil, and gas), which leads to greenhouse gas emissions effects on the environment and an increase in the temperature of the Earth.
Energy consumption during economic development is necessary because most production processes must use energy. Therefore, the establishment of energy policies is an important issue affecting each country’s economy [1]. Currently, countries around the world have been paying attention to a combination of energy efficiency solutions and the use of renewable energy, thereby mitigating environmental impacts.
In particular, energy saving in commercial buildings is an issue that receives more interest from many nations because they often consume a considerable amount of energy [2]. For example, the green roofs solution was presented by Scharf and Kraus (2019) to trade off urban heat and the building designs solution in an urban microclimate context [3]. According to Mateus [4], buildings account for a significant share of global energy consumption with an average of 30% and one-third of CO 2 emissions. Therefore, governments in many countries tend to encourage the use of renewable energy in the building energy system. In particular, solar is one of the most abundant and clean sources of renewable energy on Earth [5] with a reasonable cost of installing solar energy technology in buildings.
Although various studies were carried out to prove the energy efficiency of using solar cells on glazing surfaces in a building, there have been no studies on the analysis of economic efficiency and environmental benefits of this solution during a PV cell lifetime. Therefore, this study presented a decision support framework to optimize the ratio of solar panels on building façades for each type of glass with the aid of the life cycle assessment and life cycle costing (LCC) methods. A genetic algorithm (GA) was used as an optimization engine in this framework. A case study of a building in Danang city, Vietnam, was used to assess the effectiveness of the proposed framework. Particularly, the optimal ratio of solar panels was determined by the two following objectives.
(1) Minimizing the project cost (including initial investment cost and operation cost) during the building’s lifetime in the case of installing solar panels on building façades.
(2) Analyzing the optimal budget to minimize the total life-cycle cost of the building over its lifespan and maximize the renewable energy generated from the sunlight entering the building from different directions. Some uncertainties, such as the life of the building, electricity price, residual value, or disposal cost at the end of the project, are taken into consideration in a sensitivity analysis.
A developed decision support framework in this study contributes to the body of knowledge in three aspects. Firstly, energy efficiency in buildings was improved by installing solar panels on the building facades. Secondly, economic efficiency of buildings was evaluated holistically regarding building life cycle costs that include revenue of renewable energy and revenue of selling certified emission reductions. Thirdly, economic conditions of the energy unit price and the residual value of solar cells at the end of the project life cycle were also considered in this study. The findings of this study provide the stakeholders such as investors and designers with the knowledge and useful tools to achieve the highest energy efficiency in buildings with the constraint of budget.

2. Literature Review
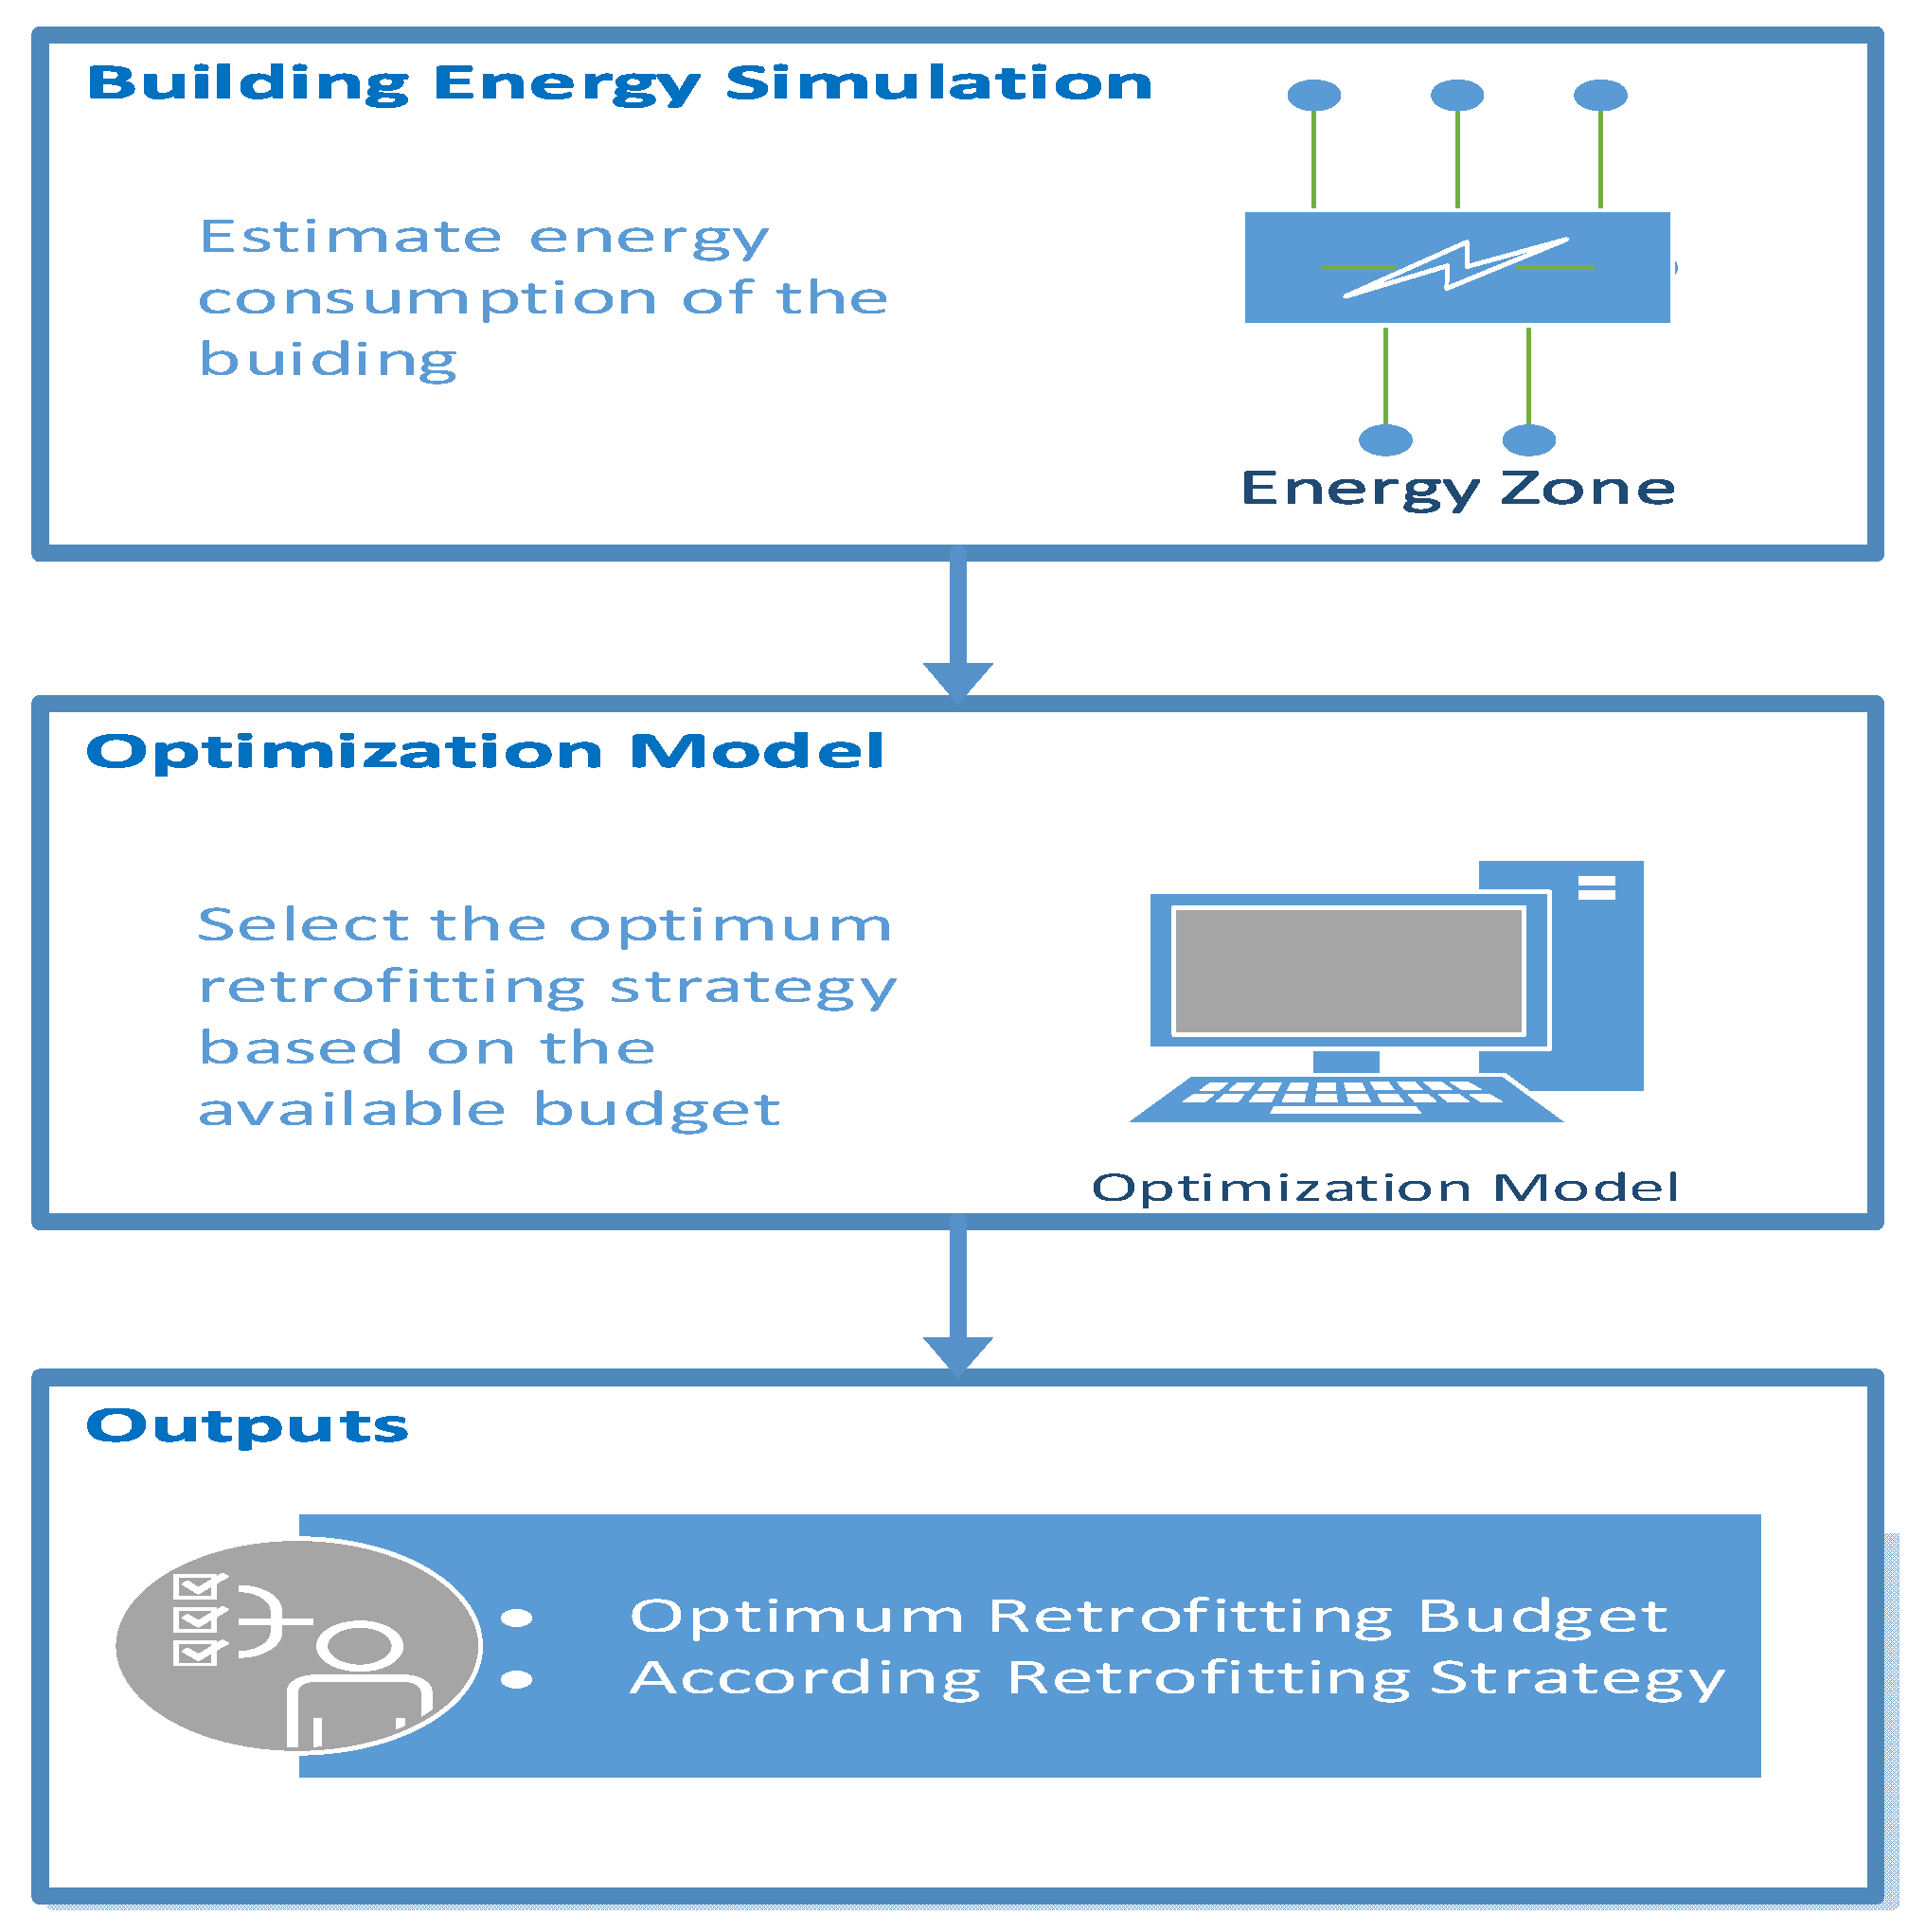
According to Wang et al. [6], commercial buildings consume up to 30% of the world’s energy. For example, commercial buildings in the United States consumed about 18% of the nation’s main energy source in 2017 [7]. The figure is predicted to reach to 2.23 EJ by 2050. Lu et al. [8] showed that commercial buildings consume a greater amount of energy demand for cooling, heating, and lighting than residential areas. Therefore, various studies aim to improve the energy efficiency of buildings, most of which focused on the selection of the building’s cover layers to minimize energy consumption in buildings. Table 1 below illustrates a few studies related to the design of building covers to use energy efficiently.
Reducing the use of conventional energy produced from fossil fuels is imperative globally because of its adverse impact on the environmental and global climate. Renewable energy sources such as solar and wind power, are potential solutions. Currently, due to the development of science and technology, renewable energy sources have been increasingly concerned and accepted by society. Renewable energy sources have proven the ability to meet clean energy for the energy needs of many countries around the world [19]. Besides, sun is one of the most abundant sources of renewable energy on Earth. According to Zhou et al. [20], solar energy impacts on the Earth’s surface at a rate of 120 petawatts, which means the amount of energy received from the sun in just one day can serve the world’s energy demand for more than 20 years. Therefore, solar energy has become a source of energy which is clean and endless, with reasonable cost, to contribute to energy security as well as ensure the sustainable development of nations [21].
The envelope of a building can be shifted from an energy consumption system to an energy producer, and this is considered a design solution for active building envelope systems. Relevant studies and reviews on photovoltaics (solar façades) [22,23,24] are various. In order to install a standard double/single façade with integrated solar energy, the PV cell is set as the priority selection. A PV cell with a transparent or semi-transparent module can retain the transparency and light transmission of the glass cover. A number of researchers have tried to combine PV modules, shading devices, and glazing façades to provide a flexible daylight operation. According to Luo et al. [25], a review on active building envelope systems using PV cells on building surfaces was presented in Table 2, as follows.
Life cycle assessment (LCA) is a system-oriented tool to control and monitor all project phases and processes over the project life cycle. The process-based LCA method (P-LCA) [42], EIO-LCA method [43], and hybrid LCA methods [44] are three common methods to environmental assess the impacts of projects. The P-LCA is commonly applied according to guidelines and principles proposed by the International Standards Organization (ISO) while the EIO-LCA is a top-down approach. Both of them have limitations [44]. Therefore, the hybrid LCA approach that integrates the P-LCA and EIO-LCA is promising to eliminate their limitations.
In this study, the hybrid LCA approach was proposed to assess the environmental impacts of projects over their holistic life cycle. The LCC of buildings is considered and evaluated by building owners or investors along with design and construction costs during making an investment decision. Pombo et al. [45] proposed the multi-criteria methodology in which the net present value (NPV) of the LCC and environmental impact (LCA) was considered to optimize the retrofitting strategies for buildings. In Wang et al. [46], maximizing energy saving, minimizing LCC, and minimizing the payback period were performed by a multi-objective optimization model. Antipova et al. [47] optimized total costs and environmental impact for retrofitting buildings based on systematic tools.
Although various studies were carried out to prove the energy efficiency of using solar cells on glazing surfaces in a building, a holistic framework for the analysis of economic efficiency and environmental impact during a PV cell’s lifetime is needed. Therefore, this study proposes the LCC method to calculate the installation area of solar cells on vertical façades of the building to reduce energy demand for building operation in the consideration of different situations and changing conditions.

3. Model Framework

The proposed decision support framework for energy improvement consists of three phases, as shown in Figure 1. The first phase estimates the building’s energy consumption using an energy simulation program. Phase 2 is to develop an optimization method that aims to select the ratio of solar cells installed on different vertical sides of the building, in order to minimize the total energy used in the building and maximize the economic benefits for the investor. Finally, the results are obtained, and a sensitivity analysis is conducted in the third phase.
In order to prove the efficiency of the model proposed in Figure 1, the authors applied a case study of an office building for the analysis.

3.1. Energy Analysis

Energy analysis is essential to estimate the baseline energy consumption for existing buildings in the operation stage. The reliable estimation of energy is critical for a decision support system to prioritize energy-saving solutions toward sustainable construction.
According to Zhang [48], a solar panel, which was installed on the vertical glazing façades of buildings, not only generates a considerable amount of renewable energy but also reduces unexpected solar heat gain in buildings. Therefore, the net annual actual energy consumption in buildings at the year t (Eat) was determined based on the annual building energy consumption at the year t (Et) without the installation of the PV system and the energy demand reduction in buildings by reducing the heat transfer due to the PV system. According to some research [49,50], the amount of renewable energy production produced by the PV system (Esi,t) accounted for 15–18% of the radiant energy from the sun. The remaining radiant energy from the sun transferred to both the inside and outside of the PV system.
In this study, a worse case was considered in which the remaining radiant energy from the sun was only transferred to the inside of the building. Consequently, the net annual actual energy consumption in buildings was determined by the difference between the annual energy consumption (Ei) and renewable energy (Esi,t) as shown in Equation (1).
Eai,t = Ei,tEsi,t
E s i , t = j = 1 4 ( S p i , j × K s j ) × K t
  • Ei,t: The amount of annual energy consumption in the building in the year t for glass type i (kWh/year)
  • Esi,t: The renewable electricity generated by solar cells in the year t for glass type i (kWh/year)
  • Eai,t: The actual energy consumption in the building in the year t for glass type i after installing solar panels (kWh/year)
  • Spi,j: Area of solar cells of glass type i on each side j with j = 1 (east), j = 2 (west), j = 3 (south), j = 4 (north) ( m 2 )
  • Ksj: Solar energy coefficient for 1 m2 of surface in direction j per year, with j = 1 (east), j = 2 (west), j = 3 (south), j = 4 (north) (kWh/ m 2 .year)
  • Kt: Solar cell performance coefficient in year t.

3.2. Economic Analysis

In terms of the economic aspect of energy-saving solutions, all the costs related to constructing, operating, and maintaining a construction project need to consider during a project life cycle. Based on previous LCC assessment (LCCA) studies, construction costs are mainly initial construction costs, maintenance costs, special repair costs, operating costs, replacement costs, cleaning costs, energy costs, renovation costs, and handling costs [38,51].
For the purpose of this study, the following cost factors are selected for the project life cycle costing (LCC), as below:
Initial investment cost (IC): including the cost of installing glass and solar cells.
Annual operating cost (OC): Power consumption (EC), panel maintenance cost (MC). However, during operation, revenue from renewable energy (RRE) and the sale of CERs (Certified Emission Reductions) must be included.
The residual value or disposal cost of solar cells at the end of the project’s life cycle (Si) are considered.
In addition, in order to assess economic efficiency, it is necessary to consider Net Present Value (NPV) to build up the cumulative cash flow or, in other words, the life of the building. Depending on the type of building, the building lifespan ranges from 25 to 50 years [38]. However, the lifespan of a solar panel on average ranges from 25 to 30 years [52,53]. Therefore, in this study, it is assumed that the lifetime of the building is 30 years. The following formula is below:
L C C i , n = I C i + t = 1 n O C i , t ( 1 + r ) t S i ( 1 + r ) n
where
  • I C i : Initial investment of each type of glass i (including installation cost of glass and solar cells);
  • O C i , t : Annual operating cost each year, including annual electricity costs (after deducting profits from renewable electricity and selling CERs), and maintenance costs;
  • t : Calculation period (year);
  • r : The discount rate (r = 10%);
  • Si: Residual value or disposal cost of solar cells at the end of the project’s life cycle (USD);
  • n: the calculation period of buildings.

3.2.1. Initial Investment Costs (ICi)

The initial investment cost (IC) includes the cost of installing glass and solar cells and is calculated according to the following formula:
I C i = F g × C g i + j = 1 4 ( x i , j × F g j × C p )
where
  • Fg: The installation area of glass ( m 2 );
  • Fgj: The area of glass on the side j of the building, where j = 1 is the east, j = 2 is the west, j = 3 is the south, j = 4 is the north ( m 2 );
  • Cgi: Unit price of glass i (USD/ m 2 ); Cp: Unit price of installing solar panels (USD/ m 2 );
  • xi,j: Percentage of solar panels on the type of glass i and on the side j (%)

3.2.2. Annual Operating Costs (OCi,t)

The operating cost is calculated according to the following formula:
O C i , t = E C i , t + M C i , t R R E i , t C C E R s i , t
  • Annual electricity costs in a building (ECi)
The annual cost of electricity for energy consumption in the building is calculated based on the total amount of electricity used and the electricity price. The use of solar panels has reduced the amount of electricity consumed significantly during the operation of buildings (Eue). According to research by Jordan et al. [54], the efficiency of solar cells will decrease by 0.5%/year. Therefore, electricity costs are calculated by the following formula:
E C i , t = E a i , t × C e = E i , t = E s i , t × C e
E s i , t = ( j = 1 4 ( x i , j × F g j × K s j ) ) × K t
where
  • Ksj: Solar energy on 1 m2 of surface area j (1 m 2 ) per year, with j = 1 (east), j = 2 (west), j = 3 (south), j = 4 (north) (kWh/ m 2 .year);
  • Kt: Solar cell performance coefficient in year t;
  • Ce: Electricity price (USD/kWh).
b.
Maintenance costs of solar panels (MCi,t)
The solar panel system requires minimal maintenance throughout the year, which mainly comes from the annual inspection and cleaning to keep the system operating at peak performance. It is assumed that the system of solar panels will be maintained twice per year. Therefore, the total maintenance costs of solar panels throughout the project life cycle is determined as follows:
M C i , t = 2 × C MCi × j = 1 4 ( x i , j × F g j )
  • C MCi : Unit price of inspecting and cleaning solar panels (USD/ m 2 )
c.
Revenue of renewable energy (RREi,t)
Due to the solar cell system, the sunlight will be absorbed by photovoltaic cells as it enters the building and is converted directly to electricity. This can save the operating cost for the building due to the reduction in electricity usage equivalent to the amount of energy absorbed by solar cells. Therefore, it can be seen as a source of revenue by using renewable energy from solar batteries, and can be calculated as follows:
R R E i , t = j = 1 4 ( x i , j × F g j × K s j ) × K t × C e
  • Ce: Electricity price (USD/kWh)
d.
Revenue by selling CERs (certificate of greenhouse gas emissions reduction)
CERs (Certified Emission Reductions) is a certificate issued by the Clean Development Mechanism (CDM) organization for a CDM project and 1 CER unit identified by one ton of carbon dioxide emissions. In this study, the amount of carbon dioxide emissions reduction is calculated based on the renewable electricity generated from the solar panels system on building surfaces. In order to identify the profits from the sale of CERs certificates throughout the project life cycle, the formula is presented below:
C C E R s i , t = [ j = 1 4 ( x i , j × F g j × K s j ) ] × K t × K e × C C E R s
  • CCERs: Price per ton CO 2 (USD/t CO 2 )
  • Ke: CO2 emission factor (converting kWh electricity to CO 2 emission) (according to Vietnam’s Ministry of Natural Resources and Environment [55]: Ke = 0.6612 kg CO 2 /kWh).

3.2.3. The Residual Value of Solar Cells at the End of the Project Life Cycle (Si)

Over the years, the renewable energy industry has developed rapidly, and solar energy has emerged as the first choice of renewable technology with many advantages and opportunities. However, one problem needs to be considered how to solve waste solar panels after their life expectancy. Currently, there are two methods of disposing of old solar panels, including landfilling and recycling to reuse part of the solar cells. Regarding the landfill method, it can have negative impacts on the living environment; for instance, toxic substances from solar panels will penetrate the soil and groundwater, causing environmental pollution [56]. In addition, costs for landfilling waste solar panels are required at the end of the project life cycle [57].
The recycling method of solar panels will be economically impactful, because some components of solar cells can be recycled to provide secondary raw materials for the production of energy cell systems [58]. Therefore, this method has been receiving more attention by research scientists. Previous studies have proved that the proportion of recycled components in solar panels depends on the type of material; details are shown in Table 3 that were adapted from [59].
Table 3 revealed that although the percentage of recycled components may be different, the recycling of solar panels will bring a significant revenue source in the future [60]. Therefore, at the end of a solar panel’s lifetime, a part of the initial investment cost can be recovered due to solar panel recycling. The residual value or disposal cost of solar cells is calculated as follows:
S i = K r ×   j = 1 4 ( x i , j × F g , j × C P s )
where Kr is the value of recovery or cost of destroying solar cells at the end of the project life cycle. It is a percentage value of the initial investment cost of PV systems.

3.3. Building a Decision Support Framework for the Installation Area of Solar Cells on Building Façades
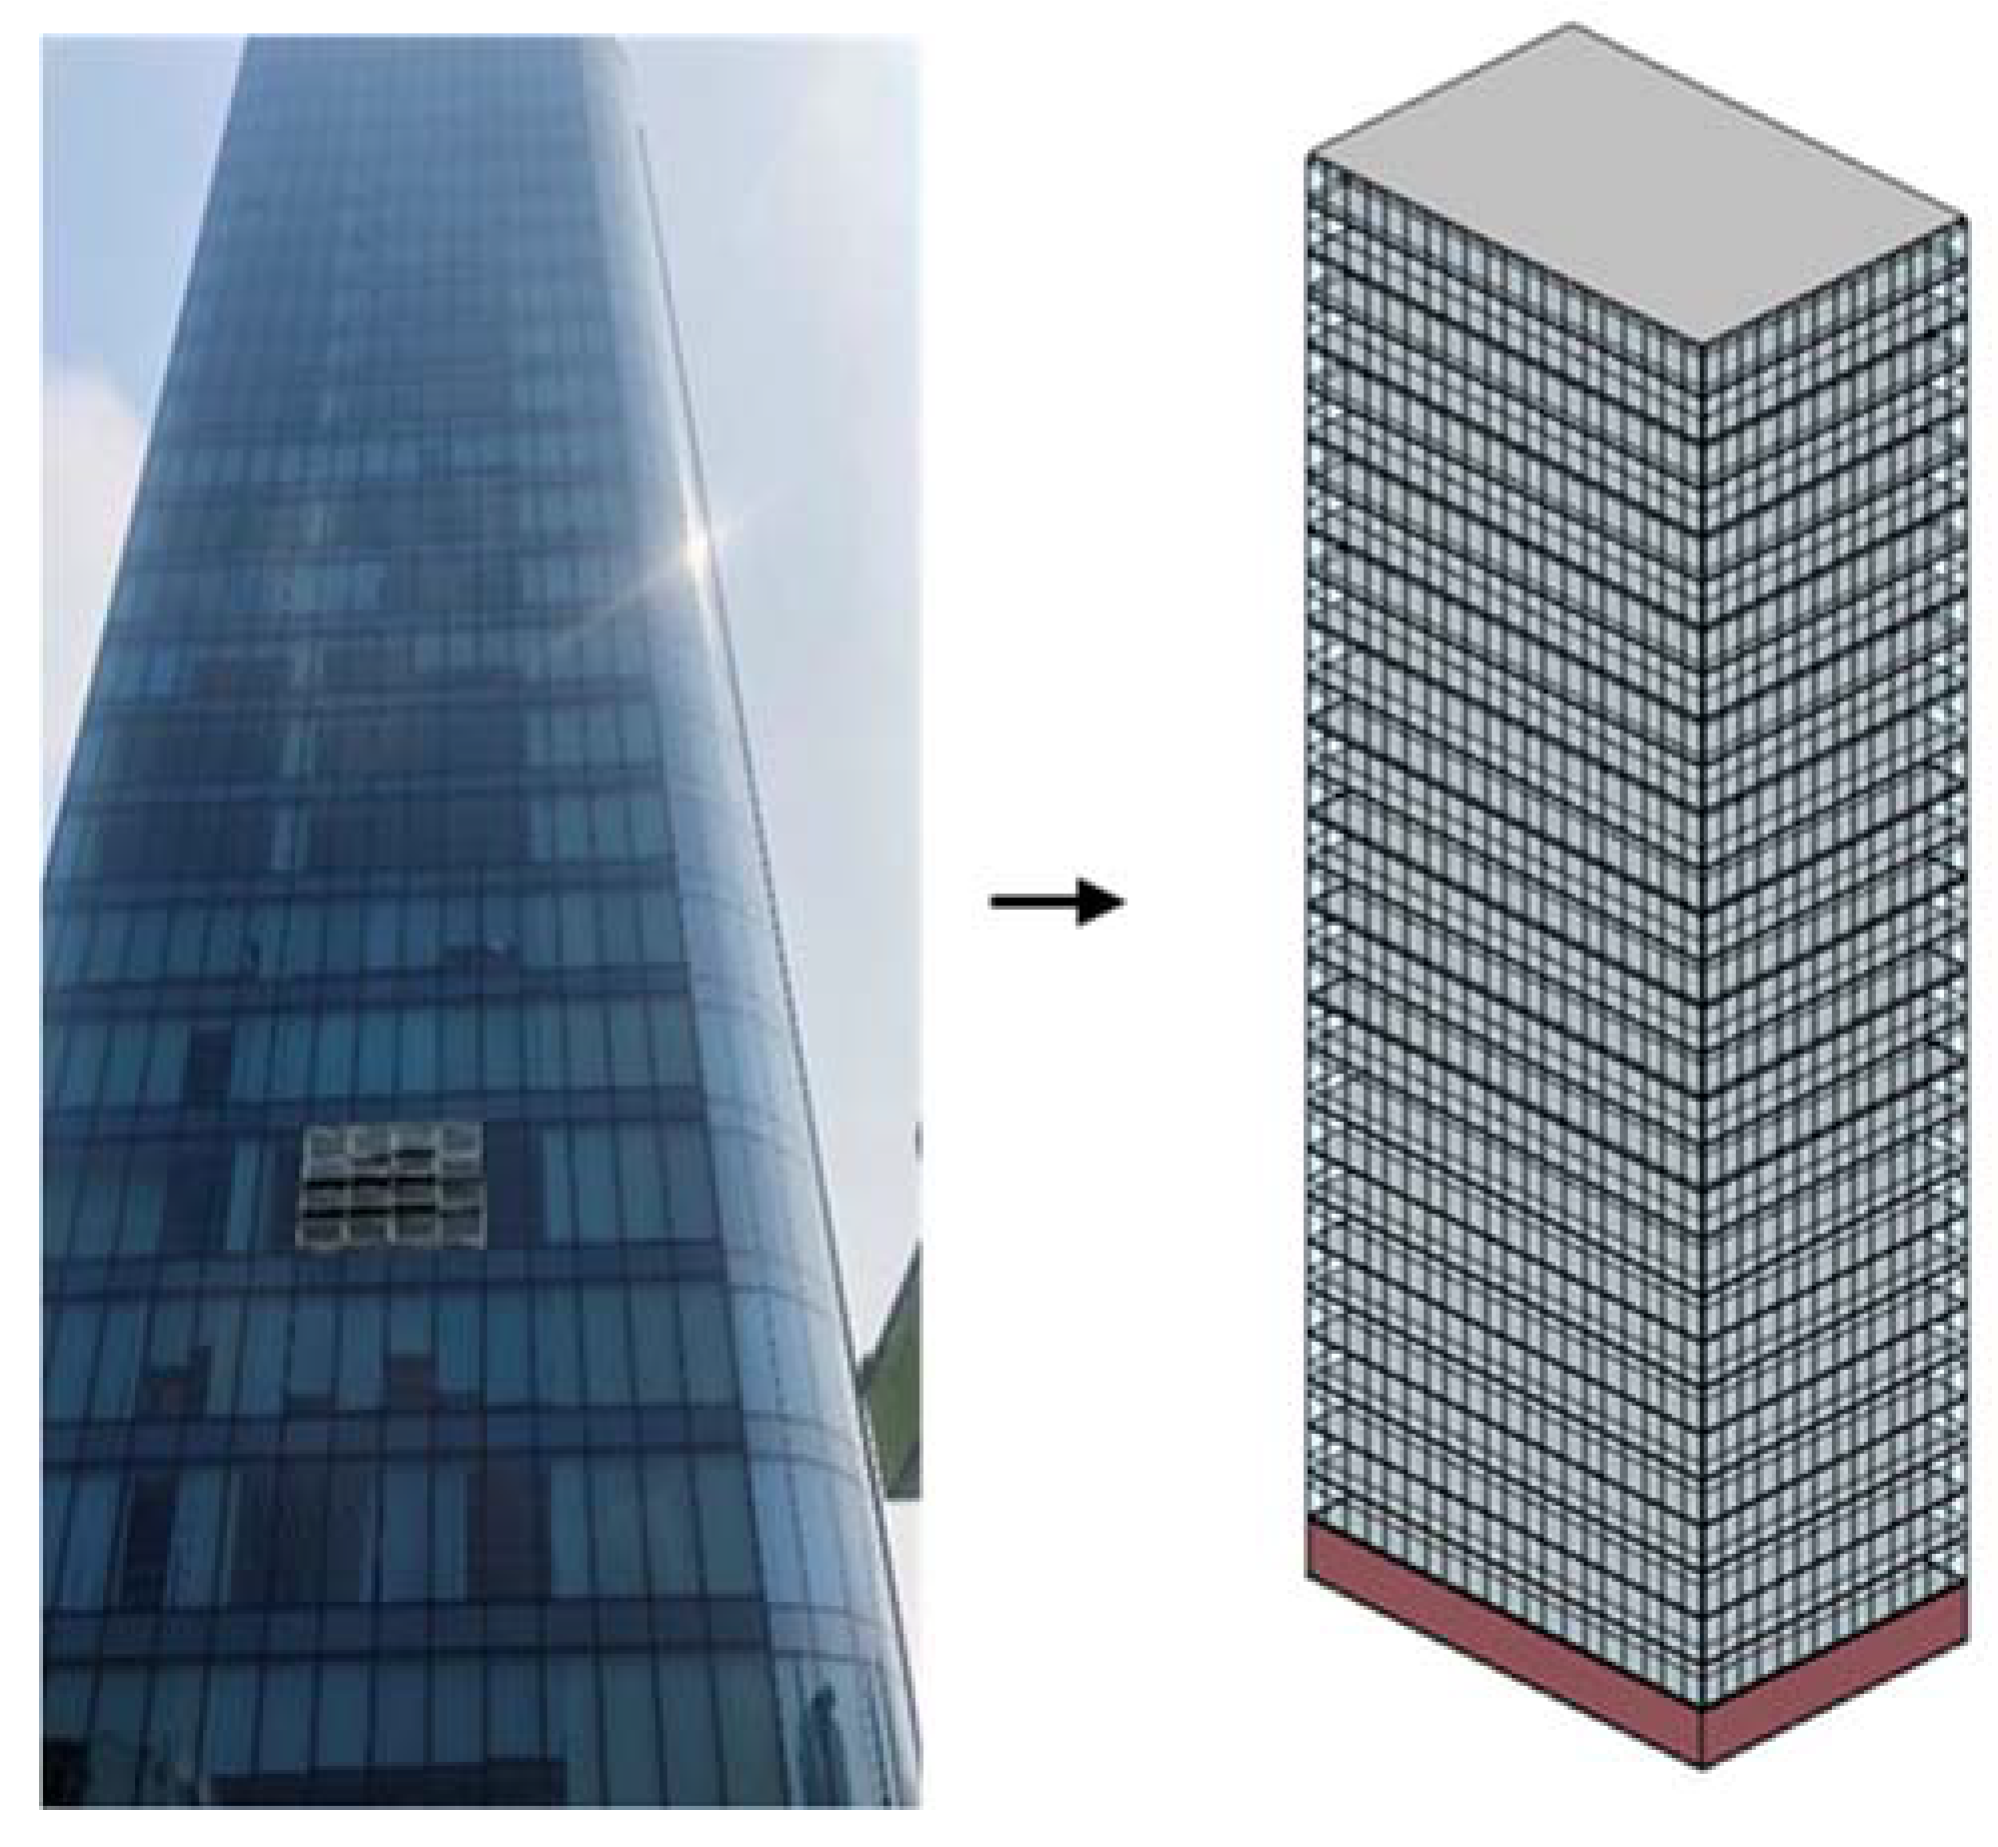
Figure 2 presents an optimization model for the installation area of solar cells on building façades. A set of X = [xi,j] includes decisive variables to choose the energy-saving strategy of solar cells in the building to maximize economic and environmental benefits for the owner. Therefore, the model must meet two main requirements: (1) the total cost (LCC) of a building, including the total initial investment and operating costs should be lowest for the building lifetime; (2) the amount of renewable energy (solar energy—Es) generated during the building lifespan is the largest.
However, in order to meet these requirements, it is necessary to resolve two issues: (1) the owner will have a limited budget to invest initially in energy-saving solutions because, according to Arditi [61] and Salem [62], most of the decisions made during a project lifecycle are usually based on initial investment cost instead of project life cycle cost (LCC). Therefore, the initial investment cost for each alternative should be smaller than the planned budget; (2) the ratio of installed solar cells also needs to ensure the ability to transmit light in the building.
The optimization model considers the installation ratio of solar panels on different façades in a commercial building. The input module of the model will be the parameters related to the building (number of floors, floor area), climatic conditions, features of the cover glass, and a set of unit prices such as unit price of glass, unit price of solar panels, and electricity price, as well as the selling price of CERs.
The model must solve the following target functions:
Project life cycle cost is lowest:
M i n   L C C i , n = I C i + t = 1 n O C i , t ( 1 + r ) t S i ( 1 + r ) n
Renewable energy is the most every year: Maximining the generated renewable energy in the lifetime of PV systems
M a x   E s i , n = t = 0 n j = 1 4 ( x i , j × F g j × K s j ) × K t
General objective function:
M a x   f i , t = E s i , t L C C i , t
Constraints:
L o b   x i , j U b
I C i = F g × C g i + j = 1 4 ( x i , j × F g j × C p ) < L i B g
where xi,j is percentage of solar cells installed on the the face j of glass i (%); this is the critical variable of the optimization problem; n is the calculation period of buildings.
LiBg is the limited budget (USD); Lob is the lower bound (%); and Ub is the upper bound (%).
In order to find an optimal investment decision to minimize the project cost, a support model is conducted with various constraints on the initial investment budget. In this study, the team used a Genetic algorithm (GA) which is an add-on in excel to perform the optimization for the model. After inputting all input data, the optimization module will build a model that satisfies two goals: (1) maximizing the amount of solar energy generated in the calculation period of a building which is a single value, as well as (2) minimizing the project life cycle costing. The stop condition is based on the stop condition of the GA algorithm based on the maximum number of loops 1000 times installed in the algorithm. The output of the optimization model are the percentages of solar cells on the façades of commercial buildings for each different type of glass. In addition, the result aims to find the optimal budget for investment to bring the highest economic benefits in using renewable energy and ensure the sustainability of the building as well.

4. Case Study

4.1. Model Setting

Energy consumption analysis was performed in a simulation model of an actual building located in Danang city, Vietnam. Figure 3 presents a 3D building model in Revit that is a 30-storey building (the 1st floor is 4.00 m in height, the other floors are 3.6 m height). The first floor is designed to be built with bricks and stone tiles. The building size is 20 m × 30 m and the building orientation is east–west. The space inside the building is completely empty to serve as offices for the business Figure 4 presents a model of building energy simulation. The weather condition of the building is shown in Table 4.

4.2. Data Description for the Case Study

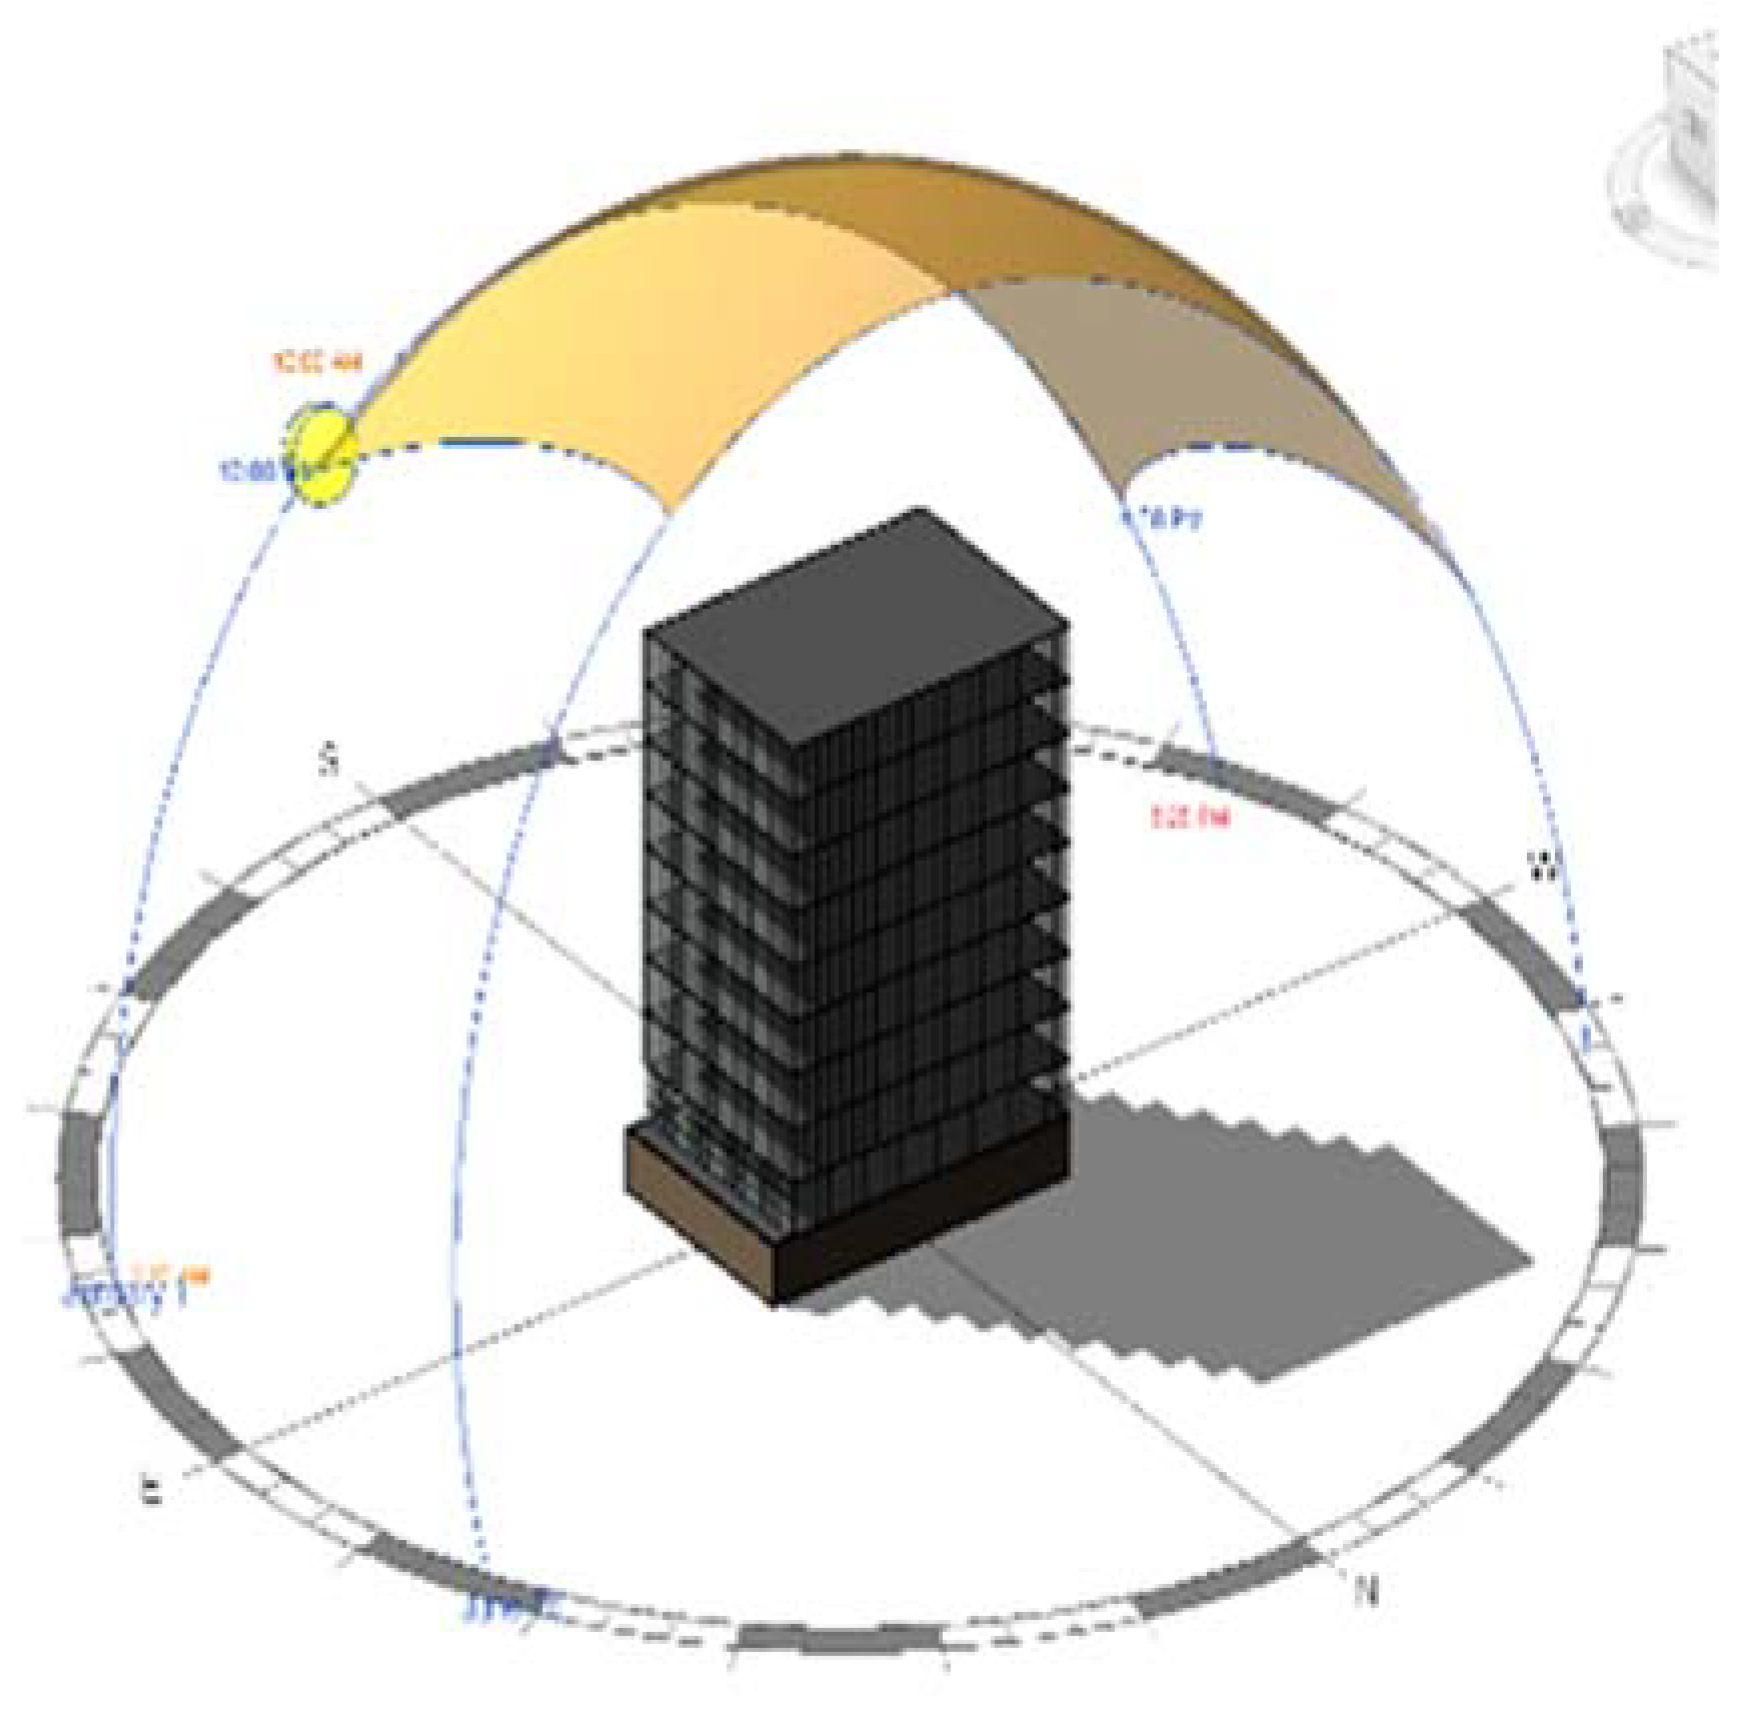
4.2.1. Simulation of Energy Consumption in the Building Used for Each Type of Cover Glass Case (Ei,t)

In this study, three common types of glasses on the market are selected, with the main functions of light-transmission, heat-insulation, and force-resistance ability. Table 5 shows the main specifications of the three types of glass. Due to the simulation, the building established by the energy simulation software of Energyplus works on Autocad Revit and Green Building Studio platforms. Specifically, the function of energy analysis was run with three types of glass cover: Tempered glass, Solar control Green, and Low-E during a year. Figure 5 show that for each type of glass, the total energy used in the building is different, hence the selection of glazing type greatly affects the energy consumption in the building.

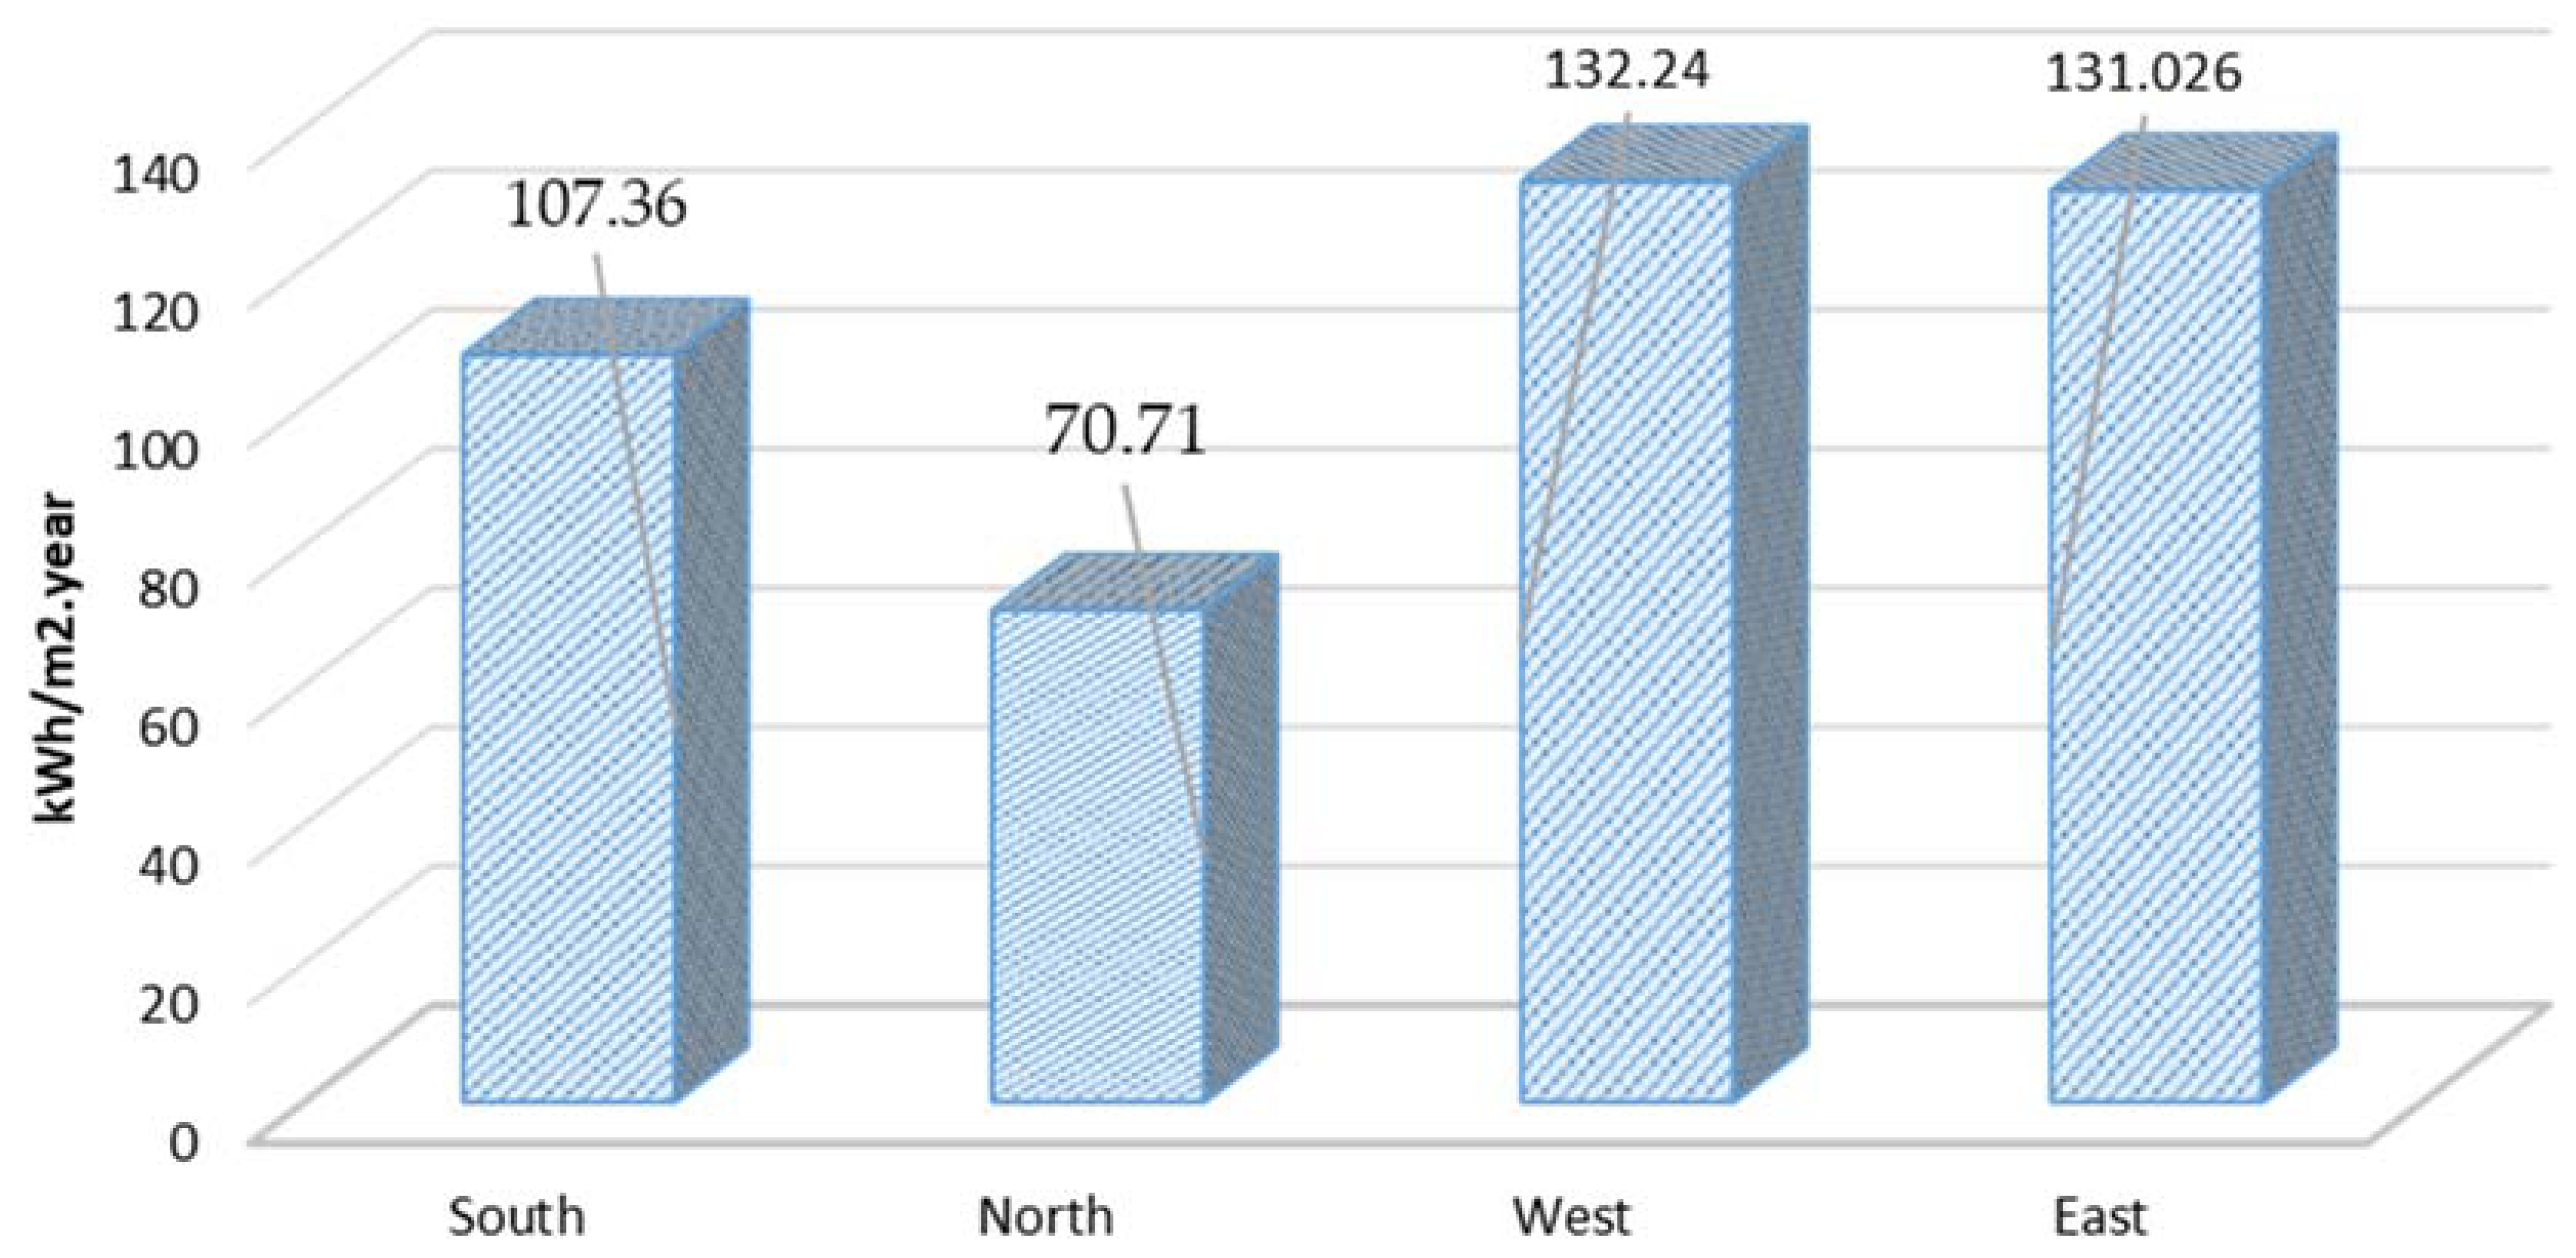
4.2.2. Determine the Average Solar Energy Generated on 1 m 2 of Solar Cells (Ksj)

The average solar power generated on 1 m 2 of solar cells depends greatly on the geographical location where the building is located. In this study, this data was analyzed by the energy simulation software of Polytechnic Solar Investment and Development Joint Stock Company [63]. The result is shown in Figure 6.

4.3. Research Results

After collecting data on relevant information and costs for case studies, the model was carried out with a budget of 600,000 USD to 1,3000,000 USD and a project duration of up to 30 years (corresponding to the life of a solar panel [52,53]). Besides, according to previous studies [64], and in order to ensure the light transmission of the building, the authors propose the lower and upper bounds of the solar cell ratio on the façades as follows: Lob = 0% and Ub = 80%.
In addition, due to the development of the solar energy industry, the disposal of solar cells with the recycling method will be potential in the future. Therefore, it is assumed that at the end of the project life cycle, the investor can receive a liquidation value for solar cells to recover part of the investment cost. As shown in Table 3, the average percentage of recyclables from solar cell systems is 69%, depending on types of materials. Therefore, in this study, it is assumed that the remaining value of the solar cell system at the end of the project life cycle is Kr = 20% of the initial investment cost. In addition, some costs mentioned in economic analysis (Section 3.2) are shown in Table 6. For each situation, the optimal installation area of solar cells on vertical sides of the building is proposed to minimize the cost of the entire project life cycle. Results are shown in Table 7 and Figure 7.
In Figure 7, the results show the ratio of renewable solar energy to the project life cycle cost during the project lifespan.
To sum up, the project life cycle costing has a significant change depending on the type of glass and the installation area of solar panels on glazing façades. Specifically, if the initial investment is less than 1,000,000 USD, the application of solar batteries attached to tempered glass (normal glass) will bring benefits for both objectives of maximizing renewable energy generated and minimizing cost over the life of the project.
For example, with LB = 800,000 USD at t = 30 years, fA = 2.37 (ESA = 15,708,000 kWh and LCCA = 6,065,643 USD), fB = 2.027 (ESB = 13,000,000 kWh and LCCB = 6,410,394 USD), also with fSC = 0.69 (ESC = 6,267,000 kWh and LCCC = 9,039,840 USD). This shows that, with the same initial investment cost, Low E glass (type C) produces the lowest generated energy and the largest life-cycle cost. For ordinary glass (type A), not only is the life cycle cost 1.03 times lower than Tempered glass (type B) but the renewable energy generated annually is also 1.2 times higher than Tempered glass (type B). Therefore, in the consideration of economic and environmental benefits, the authors realized that with the cost of LB = 800,000 USD, the use of ordinary glass (type A) with the calculated percentage of solar panels will bring more efficiency
In contrast, if the total investment is >1,000,000 USD, although the combination between PV cells and Solar control glass will obtain less renewable energy compared to Tempered glass, for optimizing two targeted objectives as mentioned above, this solution is much more effective than the other types of glass.
For example, with LB = 1,200,000 USD at t = 30 years, fA = 5.94 (ESA = 21,861,000 kWh and LCCA = 3,674,478 USD), fB = 6.74 (ESB = 20,076,000 kWh and LCCB = 2,974,520 USD), also with fC = 3.28 (ESC = 15,159,000 kWh and LCCC = 4,613,660 USD). This shows that, with the same initial investment cost, Low E glass (type C) also produces the lowest generated energy and the largest life cycle cost. As for ordinary glass (type A), although renewable energy generated annually is 1.08 times higher than tempered glass (type B), the life cycle cost is 1.23 times higher than tempered glass (type B). Therefore, in the consideration of economic and environmental benefits, the authors realized that with the cost of LB = 1,200,000 USD, the use of tempered glass (type B) with the calculated percentage of solar panels is more effective.
Regarding Low-E glass, the combination with solar panels will not be effective compared to other types of glass.

4.4. Sensitivity Analysis

The main objectives of the proposed model are to maximize renewable energy (solar energy) and assess the life cycle cost of the project with the constraint of the initial investment. However, changes in market conditions such as government policies on electricity prices, CERs purchase prices, or the cost of recycling or disposal of solar batteries at the end of the project’s life cycle will have an effect on the optimal problem. Therefore, the sensitivity analysis of these external changes will provide valuable information to make better decisions in the context of constantly changing policies.
In recent years, the electricity industry in Vietnam has changed significantly with the increasing trend of attracting more investors into the electricity market to meet the requirements of energy security. Due to this, it is assumed that if the electricity price increases from 0% to 20% compared to the initial price; hence, the results would change. In addition, during the LCC analysis, the residual value of the solar cell system at the end of the project life cycle was calculated at 20% of the initial investment cost. This is also an uncertain factor, so in order to consider the influence of this factor on the results, the value of the PV system in the end its lifetime will be changed from −20% (the investor must spend more cost to destroy) to +20% (the investor receives part of the cost) compared to the initial investment cost. The results of the sensitivity analysis with the fluctuation of electricity price (0% to 20%) and the value of the PV system in the end its lifetime (−20% to +20%) are shown in Figure 8.
A sensitivity analysis shows that, although the cost of electricity varies from 0% to 20% and the recovery value ranges from −20% to +20%, the conclusion is still unchanged from the original study. This shows that the increase in electricity prices does not affect the decision to choose the type of glass as well as the solar cell area installed on building façades in order to maximize the amount of solar energy generated and minimizing the project life cycle cost.

5. Conclusions

For energy-saving solutions in buildings, the following issues must be solved: (1) the amount of investment needed to optimize the building’s façade, (2) the analysis of economic benefits to reduce LCC over the life of the project, and (3) the energy analysis to maximize the renewable energy generated. This paper analyzes the influence of the characteristics of cover glass and the application of solar batteries to achieve the goal of generating the highest amount of solar power and lowest project cost with the constraint of the initial budget.
The results have proven that with different initial investments, the investor can have a variety of options for choosing the types of glass combined with the solar panels used for the façades of the building. According to the study, if the investment cost is less than 1,000,000 USD, the investor should use solar cells combined with tempered glass, while if the investment is over 1,000,000 USD, the combination of solar cells with Solar control Green glass will bring greater benefits for both economic and environmental aspects. In addition, the study also proved that the common glass (Low-E), if combined with solar panels, it is not as effective as other types of glass.
Additionally, the study also developed a decision-making model that supports users in selecting the optimal design option in the constraint of budget. For instance, for each type of cover glass, there will be corresponding installation rates of solar cells on each direction of the building façades to meet the initial investment requirements. Based on that, decision-makers will establish a design and purchasing plan for combining the type of glass and solar cells selected in order to not exceed the planned budget. The validated instance is conducted at the building located in Danang city, Vietnam. Through the proposed approach, essential material cost is offered.
As a novelty of this study, building energy efficiency was enhanced by installing solar panels on the building facades. Economic efficiency of buildings was evaluated holistically using the life cycle costs method. In addition, economic conditions of the energy unit price and the residual value of solar cells at the end of the project life cycle were also considered in this study. The findings of this study help investors and designers to achieve the highest energy efficiency in buildings with the constraint of budget.
As a limitation, uncertainty of building parameters such as material characteristics was not considered in this study. The study did not consider the sense of light that might impact energy consumption and the work productivity of staff in the building, as well as lack of the consideration on the symmetrical aesthetics of a building. The impact of the surrounding buildings might create a shadow on the façades causing solar cell performance decrease, which did not take into consideration in the study. In addition, in calculating the residual value of solar batteries Si, the authors did not consider the costs of generating CO2 during their dismantlement and reconstruction. This study is only used in one specific case, future studies can expand this model by many different types of buildings with different budget limits. Therefore, it is necessary to consider additional issues to address the limitations of this study in future works.

Author Contributions

D.L.L.: Conceptualization, Formal analysis, Resources. Q.T.N.: Writing - original draft, Conceptualization, Methodology, Validation, Project administration, Funding acquisition. A.D.P.: Writing - review & editing, Conceptualization. Q.C.T.: Investigation, Writing - review & editing. M.Q.D.: Methodology, Validation, Visualization. All authors have read and agreed to the published version of the manuscript.

Funding

This research is funded by Funds for Science and Technology Development of the University of Danang under project number B2018-DN02-47.

Conflicts of Interest

The authors declare no conflict of interest.

References

  1. Lu, M.; Lai, J.H.K. Building energy: A review on consumptions, policies, rating schemes and standards. Energy Procedia 2019, 158, 3633–3638. [Google Scholar] [CrossRef]
  2. Jafari, A.; Valentin, V. An optimization framework for building energy retrofits decision-making. Build. Environ. 2017, 115, 118–129. [Google Scholar] [CrossRef]
  3. Scharf, B.; Kraus, F. Green Roofs and Greenpass. Buildings 2019, 9, 205. [Google Scholar] [CrossRef] [Green Version]
  4. Mateus, R.; Silva, S.M.; de Almeida, M.G. Environmental and cost life cycle analysis of the impact of using solar systems in energy renovation of Southern European single-family buildings. Renew. Energy 2019, 137, 82–92. [Google Scholar] [CrossRef]
  5. Parida, B.; Iniyan, S.; Goic, R. A review of solar photovoltaic technologies. Renew. Sustain. Energy Rev. 2011, 15, 1625–1636. [Google Scholar] [CrossRef]
  6. Wang, Z.; Srinivasan, R.S. A review of artificial intelligence based building energy use prediction: Contrasting the capabilities of single and ensemble prediction models. Renew. Sustain. Energy Rev. 2017, 75, 796–808. [Google Scholar] [CrossRef]
  7. Ye, Y.; Zuo, W.; Wang, G. A comprehensive review of energy-related data for U.S. commercial buildings. Energy Build. 2019, 186, 126–137. [Google Scholar] [CrossRef]
  8. Lu, M.; Lai, J. Review on carbon emissions of commercial buildings. Renew. Sustain. Energy Rev. 2020, 119, 109545. [Google Scholar] [CrossRef]
  9. Allen, K.; Connelly, K.; Rutherford, P.; Wu, Y. Smart windows—Dynamic control of building energy performance. Energy Build. 2017, 139, 535–546. [Google Scholar] [CrossRef]
  10. Cao, S.; Zhang, S.; Zhang, T.; Yao, Q. A Visible Light-Near-Infrared Dual-Band Smart Window with Internal Energy Storage. Joule 2019, 3, 1152–1162. [Google Scholar] [CrossRef] [Green Version]
  11. Xiong, J.; Xiong, J.; Tzempelikos, A.; Bilionis, I.; Karava, P. A personalized daylighting control approach to dynamically optimize visual satisfaction and lighting energy use. Energy Build. 2019, 193, 111–126. [Google Scholar] [CrossRef]
  12. Carletti, C.; Sciurpi, F.; Pierangioli, L.; Asdrubali, F.; Pisello, A.L.; Bianchi, F.; Sambuco, S.; Guattari, C. Thermal and lighting effects of an external venetian blind: Experimental analysis in a full scale test room. Build. Environ. 2016, 106, 45–56. [Google Scholar] [CrossRef]
  13. Karlsen, L.; Heiselberg, P.; Bryn, I.; Johra, H. Solar shading control strategy for office buildings in cold climate. Energy Build. 2016, 118, 316–328. [Google Scholar] [CrossRef]
  14. Zhu, N.; Hu, N.; Hu, P.; Lei, F.; Li, S. Experiment study on thermal performance of building integrated with double layers shape-stabilized phase change material wallboard. Energy 2019, 167, 1164–1180. [Google Scholar] [CrossRef]
  15. De Matteis, V.; Cannavale, A.; Martellotta, F.; Rinaldi, R.; Calcagnile, P.; Ferrari, F. Nano-encapsulation of phase change materials: From design to thermal performance, simulations and toxicological assessment. Energy Build. 2019, 188–189, 1–11. [Google Scholar] [CrossRef]
  16. Thalfeldt, M.M.; Pikas, E.; Kurnitski, J.; Voll, H. Facade design principles for nearly zero energy buildings in a cold climate. Energy Build. 2013, 67, 309–321. [Google Scholar] [CrossRef]
  17. Moretti, E.; Belloni, E. Evaluation of energy, thermal, and daylighting performance of solar control films for a case study in moderate climate. Build. Environ. 2015, 94, 183–195. [Google Scholar] [CrossRef]
  18. Marino, C.; Nucara, A.; Pietrafesa, M. Does window-to-wall ratio have a significant effect on the energy consumption of buildings? A parametric analysis in Italian climate conditions. J. Build. Eng. 2017, 13, 169–183. [Google Scholar] [CrossRef]
  19. Khan, J.; Arsalan, M.H. Solar power technologies for sustainable electricity generation – A review. Renew. Sustain. Energy Rev. 2016, 55, 414–425. [Google Scholar] [CrossRef]
  20. Chu, Y. Review and Comparison of Different Solar Energy Technologies; Global Energy Network Institute: San Diego, CA, USA, 2011. [Google Scholar]
  21. Devabhaktuni, V.; Alam, M.; Depuru, S.S.S.R.; Green, R.C.; Nims, D.; Near, C. Solar energy: Trends and enabling technologies. Renew. Sustain. Energy Rev. 2013, 19, 555–564. [Google Scholar] [CrossRef]
  22. Lai, C.-M.; Hokoi, S. Solar façades: A review. Build. Environ. 2015, 91, 152–165. [Google Scholar] [CrossRef]
  23. Biyik, E.; Araz, M.; Hepbasli, A.; Shahrestani, M.; Yao, R.; Shao, L.; Atlı, Y.B. A key review of building integrated photovoltaic (BIPV) systems. Eng. Sci. Technol. Int. J. 2017, 20, 833–858. [Google Scholar] [CrossRef]
  24. Shukla, A.K.; Sudhakar, K.; Baredar, P. Recent advancement in BIPV product technologies: A review. Energy Build. 2017, 140, 188–195. [Google Scholar] [CrossRef]
  25. Luo, Y.; Zhang, L.; Bozlar, M.; Liu, Z.; Guo, H.; Meggers, F. Active building envelope systems toward renewable and sustainable energy. Renew. Sustain. Energy Rev. 2019, 104, 470–491. [Google Scholar] [CrossRef]
  26. Maneewan, S.; Hirunlabh, J.; Khedari, J.; Zeghmati, B.; Teekasap, S. Heat gain reduction by means of thermoelectric roof solar collector. Sol. Energy 2005, 78, 495–503. [Google Scholar] [CrossRef]
  27. Maneewan, S.; Khedari, J.; Zeghmati, B.; Hirunlabh, J.; Eakburanawat, J. Experimental investigation on generated power of thermoelectric roof solar collector. In Proceedings of the ICT’03. 22nd International Conference on Thermoelectrics (IEEE Cat. No.03TH8726), La Grande Motte, France, 17–21 August 2003. [Google Scholar]
  28. Liu, Z.; Zhang, L.; Gong, G.; Han, T. Experimental evaluation of an active solar thermoelectric radiant wall system. Energy Convers. Manag. 2015, 94, 253–260. [Google Scholar] [CrossRef]
  29. Liu, Z.; Zhang, L.; Gong, G.; Luo, Y.; Meng, F. Evaluation of a prototype active solar thermoelectric radiant wall system in winter conditions. Appl. Therm. Eng. 2015, 89, 36–43. [Google Scholar] [CrossRef]
  30. Liu, Z.; Zhang, L.; Gong, G.; Li, H.; Tang, G. Review of solar thermoelectric cooling technologies for use in zero energy buildings. Energy Build. 2015, 102, 207–216. [Google Scholar] [CrossRef]
  31. Luo, Y.; Zhang, L.; Liu, Z.; Wu, J.; Zhang, Y.; Wu, Z.; He, X. Performance analysis of a self-adaptive building integrated photovoltaic thermoelectric wall system in hot summer and cold winter zone of China. Energy 2017, 140, 584–600. [Google Scholar] [CrossRef]
  32. Luo, Y.; Zhang, L.; Liu, Z.; Wang, Y.; Meng, F.; Wu, J. Thermal performance evaluation of an active building integrated photovoltaic thermoelectric wall system. Appl. Energy 2016, 177, 25–39. [Google Scholar] [CrossRef]
  33. Luo, Y.; Zhang, L.; Wu, J.; Liu, Z.; Wu, Z.; He, X. Dynamical simulation of building integrated photovoltaic thermoelectric wall system: Balancing calculation speed and accuracy. Appl. Energy 2017, 204, 887–897. [Google Scholar] [CrossRef]
  34. Xu, X.; Dessel, S.V. Evaluation of an Active Building Envelope window-system. Build. Environ. 2008, 43, 1785–1791. [Google Scholar] [CrossRef]
  35. Xu, X.; Van Dessel, S. Evaluation of a prototype active building envelope window-system. Energy Build. 2008, 40, 168–174. [Google Scholar] [CrossRef]
  36. Harren-Lewis, T.; Rangavajhala, S.; Messac, A.; Zhang, J. Optimization-based feasibility study of an active thermal insulator. Build. Environ. 2012, 53, 7–15. [Google Scholar] [CrossRef]
  37. Wang, M.; Peng, J.; Li, N.; Lu, L.; Ma, T.; Yang, H. Assessment of energy performance of semi-transparent PV insulating glass units using a validated simulation model. Energy 2016, 112, 538–548. [Google Scholar] [CrossRef]
  38. Kang, S.; Hwang, T.; Kim, J.T. Theoretical analysis of the blinds integrated photovoltaic modules. Energy Build. 2012, 46, 86–91. [Google Scholar] [CrossRef]
  39. Kim, S.-H.; Kim, I.-T.; Choi, A.-S.; Sung, M. Evaluation of optimized PV power generation and electrical lighting energy savings from the PV blind-integrated daylight responsive dimming system using LED lighting. Sol. Energy 2014, 107, 746–757. [Google Scholar] [CrossRef]
  40. Luo, Y.; Zhang, L.; Wang, X.; Xie, L.; Liu, Z.; Wu, J.; He, X. A comparative study on thermal performance evaluation of a new double skin façade system integrated with photovoltaic blinds. Appl. Energy 2017, 199, 281–293. [Google Scholar] [CrossRef]
  41. Luo, Y.; Zhang, L.; Liu, Z.; Su, X.; Lian, J.; Luo, Y. Coupled thermal-electrical-optical analysis of a photovoltaic-blind integrated glazing façade. Appl. Energy 2018, 228, 1870–1886. [Google Scholar] [CrossRef]
  42. Dong, L.; Wang, Y.; Li, H.X.; Jiang, B.; Al-Hussein, M. Carbon Reduction Measures-Based LCA of Prefabricated Temporary Housing with Renewable Energy Systems. Sustainability 2018, 10, 718. [Google Scholar] [CrossRef] [Green Version]
  43. Meng, L.; Sager, J. Energy Consumption and Energy-Related CO2 Emissions from China’s Petrochemical Industry Based on an Environmental Input-Output Life Cycle Assessment. Energies 2017, 10, 1585. [Google Scholar] [CrossRef] [Green Version]
  44. Wang, C.; Zhang, L.; Yang, S.; Pang, M. A Hybrid Life-Cycle Assessment of Nonrenewable Energy and Greenhouse-Gas Emissions of a Village-Level Biomass Gasification Project in China. Energies 2012, 5, 2708–2723. [Google Scholar] [CrossRef]
  45. Pombo, O.; Allacker, K.; Rivela, B.; Neila, J. Sustainability assessment of energy saving measures: A multi-criteria approach for residential buildings retrofitting—A case study of the Spanish housing stock. Energy Build. 2016, 116, 384–394. [Google Scholar] [CrossRef] [Green Version]
  46. Wang, B.; Xia, X.; Zhang, J. A multi-objective optimization model for the life-cycle cost analysis and retrofitting planning of buildings. Energy Build. 2014, 77, 227–235. [Google Scholar] [CrossRef] [Green Version]
  47. Antipova, E.; Boer, D.; Guillén-Gosálbez, G.; Cabeza, L.F.; Jiménez, L. Multi-objective optimization coupled with life cycle assessment for retrofitting buildings. Energy Build. 2014, 82, 92–99. [Google Scholar] [CrossRef]
  48. Zhang, W.; Lu, L.; Peng, J. Evaluation of potential benefits of solar photovoltaic shadings in Hong Kong. Energy 2017, 137, 1152–1158. [Google Scholar] [CrossRef]
  49. Nguyen, B.N.; Nguyen, V.T.; Duong, M.Q.; Le, K.H.; Nguyen, H.H.; Doan, A.T. Propose a MPPT Algorithm Based on Thevenin Equivalent Circuit for Improving Photovoltaic System Operation. Front. Energy Res. 2020, 8, 14. [Google Scholar] [CrossRef] [Green Version]
  50. Duong, M.Q.; Tran, N.T.N.; Sava, G.N.; Tanasiev, V. Design, performance and economic efficiency analysis of the photovoltaic rooftop system. Techn.–Électrotechn. Et Énerg. 2019, 64, 229–234. [Google Scholar]
  51. Ammar, M.; Zayed, T.; Moselhi, O. Fuzzy-Based Life-Cycle Cost Model for Decision Making under Subjectivity. J. Constr. Eng. Manag. 2013, 139, 556–563. [Google Scholar] [CrossRef]
  52. Kim, S.; Jeong, B. Closed-Loop Supply Chain Planning Model for a Photovoltaic System Manufacturer with Internal and External Recycling. Sustainability 2016, 8, 596. [Google Scholar] [CrossRef] [Green Version]
  53. McDonald, N.C.; Pearce, J.M. Producer responsibility and recycling solar photovoltaic modules. Energy Policy 2010, 38, 7041–7047. [Google Scholar] [CrossRef] [Green Version]
  54. Jordan, D.C.; Kurtz, S.R.; VanSant, K.; Newmiller, J. Compendium of photovoltaic degradation rates. Prog. Photovolt. Res. Appl. 2016, 24, 978–989. [Google Scholar] [CrossRef]
  55. Gielen, D.; Boshell, F.; Saygin, D.; Bazilian, M.D.; Wagner, N.; Gorini, R. The role of renewable energy in the global energy transformation. Energy Strategy Rev. 2019, 24, 38–50. [Google Scholar] [CrossRef]
  56. Auer, A. Photovoltaic Module Decommissioning and Recycling in Europe and Japan: Current Methodologies, Norms and Future Trends. Master’s Thesis, Swedish University of Agricultural Science, Uppsala, Sweden, February 2015. [Google Scholar]
  57. Deng, R.; Chang, N.L.; Ouyang, Z.; Chong, C.M. A techno-economic review of silicon photovoltaic module recycling. Renew. Sustain. Energy Rev. 2019, 109, 532–550. [Google Scholar] [CrossRef]
  58. Huang, B.; Zhao, J.; Chai, J.; Xue, B.; Zhao, F.; Wang, X. Environmental influence assessment of China’s multi-crystalline silicon (multi-Si) photovoltaic modules considering recycling process. Sol. Energy 2017, 143, 132–141. [Google Scholar] [CrossRef]
  59. Domínguez, A.; Geyer, R. Photovoltaic waste assessment in Mexico. Resour. Conserv. Recycl. 2017, 127, 29–41. [Google Scholar] [CrossRef]
  60. Wade, A.; Sinha, P.; Drozdiak, K.; Brutsch, E. Beyond waste – the fate of end-of-life photovoltaic panels from large scale PV installations in the EU the socio-economic benefits of high value recycling compared to re-use. In Proceedings of the 33rd European Photovoltaic Solar Energy Conference and Exhibition, Amsterdam, The Netherlands, 25–29 September 2017. [Google Scholar]
  61. Arditi, D.; Messiha, H.M. Life Cycle Cost Analysis (LCCA) in Municipal Organizations. J. Infrastruct. Syst. 1999, 5, 1–10. [Google Scholar] [CrossRef]
  62. Salem, O.; AbouRizk, S.; Ariaratnam, S. Risk-based Life-cycle Costing of Infrastructure Rehabilitation and Construction Alternatives. J. Infrastruct. Syst. 2003, 9, 6–15. [Google Scholar] [CrossRef]
  63. Available online: https://solarbk.vn/en/ (accessed on 1 May 2020).
  64. Aste, N.; Buzzetti, M.; Del Pero, C.; Leonforte, F. Glazing’s techno-economic performance: A comparison of window features in office buildings in different climates. Energy Build. 2018, 159, 123–135. [Google Scholar] [CrossRef]
Figure 1. Overall flowchart of the study.
Energies 13 02376 g001
Figure 2. Decision-making support optimization model.
Energies 13 02376 g002
Figure 3. Building and simulation model.
Energies 13 02376 g003
Figure 4. A Simulation model of building energy.
Energies 13 02376 g004
Figure 5. Total energy used in the simulation building in 1 year application (Ei).
Energies 13 02376 g005
Figure 6. Average annual solar energy generated per square meter of solar cells.
Energies 13 02376 g006
Figure 7. The ratio of renewable energy and life cycle cost with t = 30 years.
Energies 13 02376 g007
Figure 8. fi,n with t = 30 years in the most disadvantaged situation (electricity price increasing by +20% and residual value by −20%).
Energies 13 02376 g008
Table 1. Review of relevant researches about building cover design.
Design ApproachAuthorsFeatures and Performance of the Method
Smart windowsKaitlin Allen [9]Thermostropic windows utilize the window temperature to change the transmission and reflection of sunlight and visible light, which can reduce the increase of solar heat and then lessen the cooling load in case of outside conditions exceeding user necessity.
Smart windowsSheng Cao [10]It is about the integration of electrochromic smart windows with energy storage, which is capable of independent control of visible light and near-infrared (NIR, solar heat) transmittance with high internal charge storage.
Solar shading technologiesJie Xiong [11], Cristina Carletti [12], Line Karlsen [13]A personalized shading control framework was proposed to maximize occupant satisfaction while minimizing lighting energy consumption per day in offices with automated shading systems.
Double layers wallboardNa Zhu [14], Valeria De Matteis [15]In order to build indoor thermal comfort in different seasons, double layers shape-stabilized phase change material wallboard was suggested.
Window designM. Thalfeldt [16]It was discovered that window size and type have a significant effect on heating load more than the cooling load.
Solar control filmsE. Moretti [17]Based on the experimental results, an unsteady state model of the building was implemented using EnergyPlus software in order to evaluate the impact of solar control films on yearly energy demand. Thanks to the application of the solar control film systems, the cooling energy demand decreasing was significant (about 29%); nevertheless, an increasing of the heating energy demand (about 15%) was observed, due to the reduction in heat gain from windows.
Window to wall ratioC. Marino [18]The analysis was performed using the Energy Plus simulation code and an office building, structured and configured to represent a typical reference case. The results show that the optimal value of WWR (WWRopt) is slightly affected by the climatic conditions and the insulation features of the envelope also seem to adversely affect this parameter.
Green roofsScharf and Kraus (2019) [3]A method of green performance assessment system (GREENPASS®) was used to compared and optimize the design solution by evaluating urban heat and the quality of various designs in urban microclimate context.
Table 2. Previous studies related to solar panels.
First Author and ReferenceEnergy Resources and TypologyResearch MethodsFunctions, Performance and Limitations
Maneewan [26,27]Solar thermal energy, roofTesting and commercial simulation softwareEnergy is generated by using thermoelectricity on the roof.
Liu [28,29,30]
Luo [31,32,33]
Solar, dim wallExperiments and numerical simulationsPV cells are installed to produce electrical energy for TE modules. About 70% of the daily increase in the heat was reduced compared to traditional walls, and an energy savings rate of 172% was achieved in Shanghai’s climate conditions.
Xu [34,35] Harren-Lewis [36]Solar, glass frontExperiments and numerical simulationsThe overall system can provide 35–45 W of energy-efficient to regulate the room temperature. The overall efficiency is 5% and 13% in cooling mode and heating, respectively.
Wang [37]Solar, glass frontTesting and commercial simulation softwarePV cells are semi-transparent. Energy saving potential of the optimized PV glazing was 25.3% and 10.7% respectively in comparison with transparent glass windows and Low-E glass windows.
Kang [38], Kim [39]Solar, glass frontTesting and commercial simulation softwarePV cells are attached to the blinds. Ventilation can reduce the PV cell temperature by 20 °C and achieve better efficiency at 11.7%. Electricity production and energy saving in laboratories are approximately 32% higher and 35% less than reference rooms, respectively.
Luo [40,41]Solar, glass frontTesting and commercial simulation softwarePV cells are used as blinds in the glazing façades. The energy-saving (in the summer) can be achieved at 12.16% and 25.57% compared to traditional glass surfaces with and without shading blinds, respectively.
Table 3. The study of the proportion of recycled solar materials [59].
MaterialRecovery Yields %MaterialRecovery Yields %MaterialRecovery Yields %
Ag95%Zn27%Glass95%
Al99.7%Pb96%Fe90%
Cu100%Mg33%Cr20%
Ni41%Si99.9%Mn37%
Ti52%Se89%Cd95%
Sn32%Ga90%In90%
Mo18%Te95%
Table 4. Geographic and climatic data at the building location.
ParmenterValue
Altitude above sea level (m)5 m
Latitude (°)16.05° N
Longitude (°)108.2° E
Yearly average temperature (°C)25.8 °C
The average number of sunny hours in a year2182 (h)
Table 5. Main specifications of the three types of glasses.
Type of GlassThickness
(mm)
Light Transmission Coefficient (%)Heat Transfer CoefficientThe Coefficient of Solar Heat AbsorptionShading Coefficient
Tempered glass (A)888%5.7 W/ m 2 ·K0.820.94
Solar control Green (B)851%3.9 W/ m 2 ·K0.490.56
Low-E (C)832%1.4 W/ m 2 ·K0.270.31
Table 6. Costs in economic analysis.
ParametersSymbolValues
Unit cost for installing tempered glass (USD/ m 2 )A12
Unit cost for installing Solar control Green glass (USD/ m 2 )B26
Unit cost for installing Low-E glass (USD/ m 2 )C53
Unit cost for installing solar panel (USD/ m 2 )Cp150
Cleaning and maintenance costs of solar panels (USD/ m 2 )CMCi0.5
Electricity price (USD/Kwh)Ce0.082
Price for selling CERs (USD/T CO 2 ) (According to a recent study [64], it is analyzed to select an average cost at 50 USD/T CO 2 during the calculation period)CCERs50
The value of recovery or cost of destroying solar cells at the end of the project life cycleKr20%
Table 7. The results of data analysis.
OrientationLiBg (USD)Tempered Glass (A)Solar Control Green (B)Low-E (C)
x i , j A EsA,30 (kWh)LCCA,30 (USD) x i , j B EsB,30 (kWh)LCCB,30 (USD) x i , j C EsC,30 (kWh)LCCC,30 (USD)
East600,0000.8011,726,8988,566,1410.398,493,1898,656,6430.001,365,83511,502,243
West0.800.800.19
South0.040.000.00
North0.000.000.00
East700,0000.8013,718,3517,585,8920.7310,923,7267,436,8300.003,818,83410,269,170
West0.800.800.53
South0.270.000.00
North0.000.000.00
East800,0000.8015,709,8046,605,6430.8012,999,8356,410,3940.806,166,8189,039,843
West0.800.800.80
South0.500.180.00
North0.000.000.00
East900,0000.8017,701,2575,625,3940.8014,991,2885,430,1450.428,697,3557,820,031
West0.800.800.80
South0.720.410.00
North0.000.000.00
East1,000,0000.8019,238,0704,893,1960.8016,982,7414,449,8960.7611,127,8916,600,219
West0.800.800.80
South0.800.640.00
North0.150.000.00
East1,100,0000.8020,549,7394,283,8370.8018,764,8203,583,8810.8013,167,1175,593,906
West0.800.800.80
South0.800.800.20
North0.380.070.00
East1,200,0000.8021,861,4073,674,4770.8020,076,4892,974,5210.8015,158,5704,613,657
West0.800.800.80
South0.800.800.43
North0.610.300.00
East1,300,0000.8022,950,6163,168,4650.8021,388,1572,365,1620.8017,150,0233,633,408
West0.800.800.80
South0.800.800.66
North0.800.530.00

