Evaluation of Anaerobic Digestion of Dairy Wastewater in an Innovative Multi-Section Horizontal Flow Reactor


1
Department of Environmental Engineering, Faculty of Geoengineering, University of Warmia and Mazury in Olsztyn, 10-719 Olsztyn, Poland
2
Department of Water Supply and Sewage Systems, Faculty of Civil Engineering and Environmental Sciences, Bialystok University of Technology, 15-351 Bialystok, Poland
*
Author to whom correspondence should be addressed.
Energies 2020, 13(9), 2392; https://doi.org/10.3390/en13092392
Submission received: 11 April 2020
/
Revised: 5 May 2020
/
Accepted: 6 May 2020
/
Published: 11 May 2020
(This article belongs to the Special Issue Biomass Wastes for Energy Production)
Abstract
:The aim of this study was the performance evaluation of anaerobic digestion of dairy wastewater in a multi-section horizontal flow reactor (HFAR) equipped with microwave and ultrasonic generators to stimulate biochemical processes. The effects of increasing organic loading rate (OLR) ranging from 1.0 g chemical oxygen demand (COD)/L·d to 4.0 g COD/L·d on treatment performance, biogas production, and percentage of methane yield were determined. The highest organic compounds removals (about 85% as COD and total organic carbon—TOC) were obtained at OLR of 1.0–2.0 g COD/L·d. The highest biogas yield of 0.33 ± 0.03 L/g COD removed and methane content in biogas of 68.1 ± 5.8% were recorded at OLR of 1.0 g COD/L·d, while at OLR of 2.0 g COD/L·d it was 0.31 ± 0.02 L/COD removed and 66.3 ± 5.7%, respectively. Increasing of the OLR led to a reduction in biogas productivity as well as a decrease in methane content in biogas. The best technological effects were recorded in series with an operating mode of ultrasonic generators of 2 min work/28 min break. More intensive sonication reduced the efficiency of anaerobic digestion of dairy wastewater as well as biogas production. A low nutrient removal efficiency was observed in all tested series of the experiment, which ranged from 2.04 ± 0.38 to 4.59 ± 0.68% for phosphorus and from 9.67 ± 3.36 to 20.36 ± 0.32% for nitrogen. The effects obtained in the study (referring to the efficiency of wastewater treatment, biogas production, as well as to the results of economic analysis) proved that the HFAR can be competitive to existing industrial technologies for food wastewater treatment.
1. Introduction
Bioenergy production from waste substrates supports the circular economy [1] and contributes to improvement of economic and ecological indicators [2]. Anaerobic digestion (AD) is an effective method for biogas production from wastewater with high concentration organic compounds, e.g., from meat industry, the fruit and vegetable sector, the sugar industry, and dairy processing [3]. Currently, many different constructions and solutions of anaerobic bioreactors are used in wastewater treatment systems. The commonly used reactors types are UASB (Upflow Anaerobic Sludge Blanket) ones with biomass in the form of granules and EGSB (Expanded Granular Sludge Bed) ones as a variant of UASB reactor. Their disadvantages are the long start-up period (lasting from 3 to 5 months) and the necessity to pre-treat wastewater with high fat and suspensions concentrations [4]. Frequently used reactors are CSTRs (Continuous-flow Stirred Tank Reactors) with suspended biomass. The operational problems of CSTRs result from the flotation of biomass in settling tanks and its washing out from the reaction chamber. The low concentration of biomass determines the reactors’ operation at relatively low OLRs [5]. Other reactors are anaerobic biological beds (ABBR—Anaerobic Biological Bed Reactors) characterized by long start-up period due to the prolonged formation of anaerobic biological membrane and large dimensions. However, a risk of clogging the filter spaces often takes place [6]. In turn, Anaerobic Fluidized Biological Bed (AFBB) reactors are very energy-consuming as a result of intensive wastewater recirculation [7]. In hybrid reactors, the advantages of individual anaerobic reactors are combined [8]. The problems and limitations of anaerobic reactors encourage a search for improvements to make them more effective and economic [9]. According to the literature, AD can be effectively intensified by physical factors, including microwave radiation (MR), ultrasound (US), constant magnetic field (CMF), as well as electromagnetic field (EM) [10].
Considering previous studies, MR and US have been demonstrated as the promising technologies enhancing AD [11]. MR can be used as an alternative heating method for anaerobic reactors [12]. Advantages of technologies based on MR include high heating effectiveness, fast heat transfer, selective and uniform heating performance, short reaction time, easy operation, increasing the speed of biochemical reactions, and low formation of hazardous products [13]. Moreover, MR produces non-thermal effects, which means a number of phenomena that appear in heated bodies, and whose presence or intensity cannot be explained only by heating alone. In AD, these phenomena are the acceleration of enzymatic reactions, as well as the formation of specific anaerobic bacterial communities [14]. Many literature data presents numerous technologies assisted by US [15]. Ultrasonic irradiation has been successfully used in ammonia recovery from wastewater [16], in increasing biodegradation of organic pollutants [17], in disinfecting water [18], in supporting the membrane filtration process [19] and in preparing sewage sludge before fermentation or dewatering [20]. US generates monolithic cavitation by passage of ultrasonic waves through the liquid medium, which results in various physical and chemical changes in liquid solutions [21]. Thus, US can be used for degassing of anaerobic sludge and removing the gaseous products from the reaction chamber. Using of the small and carefully selected doses of ultrasonic energy may allow to break down the compact structure of anaerobic flocs and granules, which finally enhance the biogas discharge from anaerobic reactors.
Ultrasound application in wastewater treatment technology aiming at the intensification of biogas and methane production has been confirmed in preliminary research as well as by other researchers [22,23]. However, recent studies have not specified clearly the parameters of sonication process for achieving the highest efficiency of wastewater treatment and biogas production with high methane content. Moreover, laboratory tests often do not provide reliable data to design and operate installations on an industrial scale. Thus, there is a need to study a pilot-scale or semi-technical scale installations.
The purpose of the study was to determine the efficiency of dairy wastewater treatment and the biogas production in the multi-section horizontal flow anaerobic reactor (HFAR) equipped with MR and US devices.
2. Materials and Methods
2.1. Research Station
The experiments were carried out in the multi-section horizontal flow anaerobic reactor (HFAR), (Figure 1). The internal axis of reactor was a shaft rotating at 1 rpm, to which the stirring rods were attached. The reaction chamber was divided with perforated partitions into the four sections.
The HFAR design parameters were as follows: total length—4.0 m, total diameter—0.3 m, total cross-sectional area—0.070 m2, working cross-sectional area—0.063 m2, height of filling—0.25 m, total volume—0.28 m3, working volume—0.25 m3.
The reactor was heated using microwave generators (GM), (Plasmatronics) with magnetrons (Figure 2a). There was a possibility of smooth regulation from 0 to 800 W. This type of magnetrons is commonly used in microwave heating techniques due to their high performance, low price, and small dimensions. Electricity was converted into microwave energy with a conversion efficiency of 52% at 2.45 GHz. The positive effects of microwaves on biological processes with using magnetrons has also been confirmed in other studies [24]. A microprocessor integrated with temperature detectors controlled the temperature inside each section of the HFAR. The temperature was maintained at 38 °C, and when it dropped below, the microwave generators automatically started. Their work was finished when the defined temperature inside the reactor was achieved.
The ultrasonic generators (GU) used in the study were installed at each section of the HFAR (Figure 2b). Sections were equipped with a package of the four ultrasonic transducers with a frequency of 20 kHz and a power of 95 W. Each GU was integrated with a control panel to control its work. In the upper part of HFAR, in all sections, there were ports for substrate supplementation, sludge, and biogas collection, as well as the temperature and pH measurement, which created the possibility of wastewater dosing to the various sections of HFAR, anaerobic sludge recirculation, and biogas analyzing. The biogas was collected in the sealed containers. The dairy wastewater was dosed by pumps to the first section of reactor. The digestate was collected in the thickener with working volume of 3.0 m3. The sludge from the bottom of the thickener was recycled and then mixed with the raw wastewater. Effluent was discharged outside the technological system.
2.2. Concept of Experimental Design
The study was divided into four stages differing in OLR applied: stage 1—OLR of 1.0 g COD/L d, stage 2—2.0 g COD/L d, stage 3—3.0 g COD/L d, stage 4—4.0 g COD/L d. Each stage of the experiment was additionally divided into the four series differing in the sonication time regimes. In series 1, AD was carried out without the use of ultrasounds. In series 2, the operating mode of ultrasonic generators was 10 min work/20 min break, while in series 3 and 4, it was respectively 5 min work/25 min break and 2 min work/28 min break. A constant processing temperature of 38 ± 1 °C was maintained. The hydraulic retention time (HRT) was 24 h. Each series of the experiment lasted 30 days, which allowed for 30-fold exchange of the reactors content.
2.3. Materials
The wastewater used for AD originated from the retention tank of a dairy processing plant and was diluted with tap water to achieve the required OLRs. The characteristics of wastewater used in each stage of the experiment is shown in Table 1.
Anaerobic sludge from an anaerobic reactor treating the dairy wastewater and exploited on a technical scale was used as inoculum in the study. The concentration of inoculum in HFAR was 44 g total solids (TS)/L. The characteristics of the anaerobic inoculum used in the study is presented in Table 2.
2.4. Analytical Methods and Statistical Procedures
The influent and effluent were analyzed once a day for COD, total phosphorus (TP), total nitrogen (TN) using the cuvette tests for spectrophotometer DR 2800 with mineralizer (HACH Lange, Düsseldorf, Germany), VSS according to the gravimetric method (part E of EPA Standard Method 2540), TOC with the use of TOC 1200 analyzer (Thermo Scientific, Waltham, USA). The analyzer determined the content of TC in the sample by combustion and then in the same sample determined the IC content in infrared analytical cycle. The organic carbon content in the sample was calculated by subtracting the TC value and IC value. The pH was determined by using the pH-meter VWR 1000 L.
The biomass yield was determined as the ratio of the amount of biomass produced to the amount of COD removed. The biomass production was determined as the change in biomass concentration in the reactor and the biomass concentration in the effluent. In order to determine the concentration of biomass in the whole reactor, samples were taken from each reactor section and then the measured concentrations were averaged. The biomass yield was estimated as follows (1):
where: VSS’—sum of the concentration of VSS in the reactor and VSS in the effluent in the next day (g/L); VSS—sum of the concentration of VSS in the reactor and VSS in the effluent in the current day (g/L); C—the concentration of COD in the influent (g/L); Ce—the concentration of COD in the effluent (g/L).
Throughout the experiment, the amount of biogas was monitored by biogas meters installed at each reactor’s section. The composition of biogas produced at each section of reactor was measured every 24 h using a gastight syringe (20 mL injection volume) and a gas chromatograph (GC, 7890A Agilent) equipped with a thermal conductivity detector (TCD). The GC was fitted with the two Hayesep Q columns (80/100 mesh), two molecular sieve columns (60/80 mesh), and Porapak Q column (80/100) operating at a temperature of 70 °C. The temperature of the injection and detector ports were 150 °C and 250 °C, respectively. Helium and argon were used as the carrier gases at a flow of 15 mL/min. Additionally, biogas was analyzed by the GMF 430 Gas Data analyzer. The content of methane (CH4), and carbon dioxide (CO2) were measured.
The results were processed statistically with the Statictica 13.1 PL package (StatSoft, Inc., Tulsa, OK, USA). The hypothesis on the distribution of each analyzed variable was verified based on the W Shapiro–Wilk’s test. One way analysis of variance (ANOVA) was conducted to determine the significance of differences between the variables. The homogeneity of variance in groups was tested with Levene’s test, whereas Tukey’s RIR test was used to determine the significance of differences between the analyzed variables. In all tests, differences were considered significant at p = 0.05.
3. Results and Discussion
3.1. Organic Compounds and Nutrient Removal
The application of increasing OLRs to anaerobic reactor directly influences the reduction of its performance. In the study, the highest COD and TOC removal efficiencies higher than 85% were found at OLR of 2.0 g COD/L·d (Table 3). Comparable effects were obtained at OLR of 1.0 g COD/L·d. Further increase in OLR caused a deterioration in wastewater treatment efficiency. The lowest removal efficiencies of COD and TOC were recorded in stage 4 at OLR of 4.0 g COD/L·d (Table 3).
In the study, the most effective operating mode of GU was 2 min work/28 min break. Generally, the application of GU enhanced COD and TOC removal in all experimental stages in series 3 and 4. However, the highest efficiencies of removal were noted at OLR ranging from 1 g COD/L·d to 2 g COD/L·d (Table 3, Figure 3). The operating mode of the ultrasonic generators of 10 min work/20 min break was too long to enhance biological processes. Thus, in series 2 of all stages of the experiment, the efficiencies of organic compounds removal were lower than that in the control sample (Table 3, Figure 3).
Regardless of the experimental series, low efficiencies of nitrogen and phosphorus removal were obtained (Table 3). The highest efficiency of TN removal was found in series 4 of stage 2 and it was 20.36 ± 0.62% (52.0 ± 4.1 mg/L in the effluent), while the lowest of 9.67 ± 3.36% was obtained in series 2 of the stage 2 (56.5 ± 4.5 mg/L in the effluent) (Table 3, Figure 3). However, the highest efficiency of TP removal of 4.59 ± 0.68% (107.2 ± 7.2 mg/L in the effluent) was recorded in series 4 of stage 3. The lowest efficiency of TP removal was noted in series 2 of stage 2, and it was as low as 2.04 ± 0.38% (77.2 ± 5.8 mg/L in the effluent) (Table 3, Figure 3). Other authors also confirm low nutrient removal in anaerobic conditions, which is limited to the nutrient demand for biomass growth [25,26].
The effectiveness of dairy wastewater treatment in anaerobic conditions was also analyzed by other researchers [27]. After two years of experiments, they obtained a reduction of about 90% in COD content, exploiting an anaerobic filter at OLR of 5–6 g COD/L∙d. Moreover, the effect of the HRT from 20 d at the beginning of the study to 3.33 d at the end was also analyzed. Shortening the HRT did not decrease the efficiency of organic compounds’ removal, indicating a steady-state of reactor. Other authors also found high efficiency of organic compounds removal, up to 98% from whey using anaerobic filters [28]. At HRT of 142 days and OLR of 9.8 g COD/L∙d, high treatment efficiency in mesophilic conditions was obtained. While testing a wide range of OLRs from 7.9 to 45.42 g COD/L∙d, the removal efficiency of organic compounds from whey was as high as 98% [29].
Anaerobic reactors are often used for treating wastewater from dairy processing because of its high content of easily degradable organic compounds [30]. However, the efficiency of anaerobic wastewater treatment is a result of many factors, including reactor design, process temperature, and wastewater composition. For example, the treatment of textile wastewater by using an UASB reactor allowed to achieve COD removal efficiency of 9% to 51% [31]. The treatment of starch wastewater resulted in a reduction of COD in the range of 77% to 93% [32]. Other studies examined the effects of OLRs (0.82 and 6.11 g COD/L∙d) and HRT ranging from 4.1 d to 1.7 d on UASB reactor performance using wastewater with a COD concentration of 10 g/L [33]. In mesophilic conditions, the COD removal efficiency varied from 90% to 97%. The obtained results are similar to those with anaerobic trickling filters. At OLR of 4.45 g COD/L∙d and HRT of 2.64 d, removal efficiency of COD was 81% [34]. The OLR during anaerobic degradation of acid whey ranged from 1.6 to 12.8 g COD/L∙d. The efficiency depended on the OLR. The highest COD removal rate was observed at the lowest OLR applied (about 100%) and at maximum OLR, COD removal efficiency was 68% [35].
3.2. Biogas Yield and Its Composition
The lowest biogas production was observed in stage 1 at OLR of 1.0 g COD/L∙d, ranging from 48.18 ± 4.5 L/d in series 2 to 70.25 ± 6.1 L/d in series 4 (Figure 4). The biogas yield in these series was from 0.29 ± 0.02 L/g COD removed and 0.86 ± 0.11 L/g TOC removed to 0.33 ± 0.03 L/g COD removed and 0.95 ± 0.12 L/g TOC removed (Table 4). Taking into account the amount of biogas produced per gram of COD or TOC removed, this stage of experiment was the most advantageous. In this stage, the highest methane content in biogas ranged from 63.4 ± 5.2% in series 1 to 68.1 ± 5.8% in series 4 was achieved (Figure 4).
In stage 2, the lowest biogas production was obtained in series 2 and it was 87.61 ± 7.4 L/d (0.25 ± 0.02 L/g COD removed, 0.66 ± 0.10 L/g TOC removed), and methane content in biogas reached 62.3 ± 5.5% (Figure 4, Table 4). In turn, the highest biogas production of 130.25 ± 12.5 L/d and the methane content of 66.3 ± 5.7% were noted in series 4 (Figure 4). The biogas yield was 0.31 ± 0.02 L/g COD removed and 0.87 ± 0.12 L/g TOC removed (Table 4). In stage 3, the lowest biogas production of 91.52 ± 7.9 L/d (0.20 ± 0.01 L/g COD removed, 0.58 ± 0.08 L/g TOC removed) and methane content of 49.7 ± 5.5% were obtained in series 2 (Figure 4, Table 4). In turn, the highest biogas production (187.74 ± 18.4 L/d, 0.30 ± 0.02 L/g COD removed, 0.86 ± 0.07 L/g TOC removed) and methane content (55.2 ± 5.8%) were noted in series 4 (Figure 4, Table 4). In stage 4, the lowest and the highest biogas production was as 80.17 ± 9.5 L/d (0.15 ± 0.01 L/g COD removed, 0.40 ± 0.05 L/g TOC removed) and 187.57 ± 19.1 L/d (0.24 ± 0.01 L/g COD removed, 0.68 ± 0.08 L/g TOC removed), respectively, while the methane content in biogas ranged from 30.2 ± 4.5% to 46.9 ± 4.8% (Figure 5, Table 4).
It has been proven that sudden changes in temperatures significantly affect methanogenesis [36]. In this study, microwave heating was used as a method to create a stable thermal condition for anaerobic reactors [37]. While analyzing the effects of MR on biological processes, a positive impact on methanogenesis process was indicated [38]. Banik et al. (2003) studied the exposition of Methanosarcina barkeri DS-804 to microwave radiation of frequencies ranging from 13.5 to 36.5 for 2 h. Then the samples were incubated for 20 days. Radiated bacterial culture showed an increase in colony numbers and cell size. The biogas composition varied depending on the frequency of the radiation used. Maximum methane concentration in biogas was 76.5% at 31.5 GHz. In comparison to unirradiated setup, it was only 52.3%. Growth curves for both irradiated and unirradiated cultures were typical for the initial phase, the growth phase, as well as the stationary and decline phases. However, in irradiated culture, the growth phase was much faster. The results indicate that microwave radiation may induce specific metabolic activity of microorganisms to enhance their growth rate [38].
Parker et al. (1996) studied the effects of microwaves on the activity of a hydrated lipase enzyme. The enzyme was suspended in a solvent that was also the reactant. Then, the solution was heated to 50 °C by microwaves (2.45 GHz) and, for comparisation, conventionally. It was found that the rate of enzymatic reaction of irradiated enzyme increased up to 2–3 times in relation to conventional heating. However, other enzymes, such as lymphocytic protein kinases or phosphatases were inhibited by microwaves [39]. Other researchers found the increase of stability of immobilized enzymes in the microwave field [40,41]. According to the literature, the exposure of biomass to microwave radiation increased its solubilization and disrupted the network of exopolysaccharides, thus enhancing its subsequent anaerobic digestion [42]. Microwave pretreatment of waste activated sludge at frequency of 2.45 GHz increased the release of extracellular and intracellular biopolymers from the cells [43]. As a result, microwaved sludge produced more biogas in anaerobic digestion than conventionally pretreated sludge.
In the study, it was found that the main factor affecting biogas yield and composition was OLR. However, ultrasonication was also an important factor. There was a very strong relationship between biogas and methane production and the removal of organic compounds from dairy wastewater (Figure 5). Other authors [22] investigated the possibility of ultrasonic pretreatment for improving biogas production from olive mill wastewater. They found that using a low-frequency US enhanced both biogas production by about 20% and methane content in biogas. In other studies [23], US was used to support methane production from raw molasses wastewater; 441.6 L CH4/kg VS was obtained. The results demonstrated that US may be a suitable solution for treating this kind of wastewater. Low-frequency US pre-treatment significantly improved (by 40%) biogas and methane production from landfill leachate in anaerobic batch reactors [44]. In turn, other authors found that US enhanced biogas and methane production from the same wastewater only by 7% and 4%, respectively [45]. According to the literature, the application of ultrasound pretreatment had a positive effect on biogas yield from confectionery wastewater [46].
Ultrasounds have positive effects on biological processes and, on the other hand, they are often used to disrupt and inhibit microorganisms (e.g., in sludge stabilization and hygienization) [47,48]. An important issue is therefore to point appropriate ultrasound performance parameters. In the study, in series 2, the sonication process was in mode of 10 min work/20 min break, while in series 4, it was 2 min work/28 min break. The results revealed that 10 min of sonication was too long to enhance biological processes. The negative effects were probably related to partial cell destruction. Disintegration of the cells in various bacterial communities was also confirmed by other researchers [45]. The highest enhancement in biogas and methane production was reported in sonication time regime of 5 min work/25 min break and 2 min work/25 min break (Figure 5, Table 4). Ultrasounds improved the removal of gaseous products outside the reaction medium, and did not have a destructive effect on anaerobic microflora.
The results also confirmed the significant impact of the OLR value on the yields of biogas and methane production. Increase in OLR decreased biogas production per gram of COD and TOC removed and also influenced the reduction of methane content in biogas. This can be explained by volatile fatty acids (VFAs) accumulation in the reaction medium at high OLRs [49]. High VFAs concentrations caused a decrease in pH, resulting in inhibition of methanogens. Thus, the reduction in biogas and methane production were observed [50].
3.3. Biomass Growth
In the study, the highest biomass yield was recorded in stages 3 and 4, and it varied from 0.123 ± 0.01 g/g COD removed in series 2 of both stages to 0.1558 ± 0.01 g/g COD removed in series 1 of stage 4 and 0.1476 ± 0.01 g/g COD removed series 1 of stage 3 (Figure 6). A smaller increase in biomass growth yield was found at lower OLR values in stages 1 and 2. In stage 1, the biomass yield coefficient ranged from 0.0984 ± 0.01 g/g COD removed in series 2 to 0.1230 ± 0.01 g/g COD removed in series 1 of stage 1 (Figure 6). In stage 2, these values were similar and ranged from 0.1066 ± 0.01 g/g COD removed to 0.1312 ± 0.01 g/g COD removed in the same series (Figure 6). During the study, there were no significant differences in the biomass growth yield coefficients observed in the individual stages and series of experiment. Even in series 2, in which the biomass yields were the lowest, the differences were not significant (Figure 6).
Anaerobic digestion is characterized by low biomass production (less excess sludge), which is 3 to 20 times lower than in aerobic treatment systems. Under anaerobic conditions, the yield of biomass per gram of COD removed is from 0.02 to 0.15 g/g, whereas in aerobic conditions, it was from 0.5 to 0.7 g/g [51].
3.4. Energy Balance
The energy balance of experimental series has been made to determine the amount of energy consumed for biogas production and for organic compound (as COD) removal. It can also be used to assess the whole technological and economic effectiveness of the presented technology. The reactor presented in the study corresponds to TRL 5 (Technology Readiness Level), which means that the technology was validated in a relevant environment. The basic equipment is integrated with the real supporting elements and the technology has been tested under simulated operating conditions. Thus, the estimated energy consumption can still be significantly optimized. The basic energy balance of wastewater treatment in HFAR was presented in Table 5.
The most favourable energy balance was noted in series 4, stage 3 (2 min sonification/28 min break. ORL 3.0 g COD/L·d). In this variant of the experiment, daily energy demand was 1.676 kWh/d (Table 5). The most energy-efficient variant without sonication was in series 1, stage 2, but energy consumption was higher (1.942 kWh/day). The least energy-efficient variant (−2.708 kWh/day) was at ORL of 4.0 g COD/L·d and the sonication regime of 10 min sonification/20 min break (Table 5). It was found that a unit energy consumption per unit of COD removed decreased, while OLR was increasing. In all stages of the experiment, the lowest unit energy expenditure requirement was observed in series 4 and ranged from 2.357 kWh/kg COD removed (ORL of 4.0 g COD/L·d) to 10.336 kWh/kg COD removed (ORL of 1.0 g COD/L·d).
In conclusion, the presented technology is competitive to other wastewater treatment solutions. Ozay et al. (2018) recorded a unit energy consumption of 7.80 kWh/kg COD removed [52]. Energy expenditure in the process of electrochemical wastewater treatment from the leather industry was 9.88 kWh/kg COD removed [53]. In studies on degradation of pyrrole in wastewater, the energy demand was 7.7 kWh/kg COD removed [54]. Ribera-Pi et al. (2018) operated a single-stage anaerobic membrane bioreactor (AnMBR) for dairy wastewater treatment and the unit energy consumption (kWh) per unit of COD removed (kg) was 2.4 [55]. Masłoń (2017) determined energy consumption for wastewater treatment plants ranging from 0.528 kWh/kg COD removed for plants with Imhoff tanks to 2.297 kWh/kg COD removed in SBR-type plants [56]. Generally, electric energy consumption in facilities below 2000 RLM was as 3.01 kWh/kg COD removed, while with size of RLM = 2000 ÷ 10.000, it was lower by half (1.54 kWh/kg COD removed) [57].
4. Conclusions
It was found that OLRs had the greatest impact on the effects of anaerobic digestion of dairy wastewater in terms of organic compound removal and biogas and methane yields. The highest efficiency of COD and TOC removal of 85.13 ± 1.05% and 85.62 ± 1.04%, respectively, was found at OLR of 2.0 g COD/L·d. The lowest organic compounds removals of 52.75 ± 0.42% as COD and 52.75 ± 0.42% as TOC were noted at OLR of 4.0 g COD/L·d.
The highest biogas yield of 0.33 ± 0.03 L/g COD removed and 0.95 ± 0.12 L/g TOC removed, and the methane content in biogas of 68.1 ± 5.8% were noted at OLR of 1.0 g COD/L·d. Comparable biogas production of 0.31 ± 0.02 L/g COD removed and 0.87 ± 0.12 L/g TOC removed (66.3 ± 5.7% of methane in biogas) was achieved at OLR of 2.0 g COD/L·d. Increase in OLR reduced biogas productivity and methane content in biogas. The lowest methane content was noted at OLR of 4.0 g COD/L·d and it ranged from 30.2 ± 4.5% to 46.9 ± 4.8% depending on the experimental series.
The study showed a significant impact of ultrasonication on the effects of anaerobic digestion of dairy wastewater. The highest technological effects were recorded with sonification mode of 2 min work/28 min break. Increase in ultrasonic intensity significantly reduced the efficiency of organic compounds’ removal from wastewater, as well as biogas yield.
Regardless of the experimental series, low nutrient removal efficiency was observed. The total phosphorus removal ranged from 2.04 ± 0.38 to 4.59 ± 0.68%, while the total nitrogen removal varied from 9.67 ± 3.36 to 20.36 ± 0.32%. The differences in biomass growth yield coefficients were not significant during the study and ranged from 0.12 ± 0.01 g/g COD removed to 0.19 ± 0.01 g/g COD removed.
The effects obtained in the study (referring to the efficiency of wastewater treatment, biogas production, as well as to the results of economic analysis) proved that an innovative multi-section horizontal flow reactor can be competitive to existing industrial technologies of food wastewater treatment.
Author Contributions
Conceptualization, M.D., M.Z., and J.K.; Data curation, M.D., M.Z., M.K., and J.K.; Formal analysis, M.D., M.Z., and J.K.; Funding acquisition, M.D. and M.Z.; Investigation, M.D., M.Z., and M.K.; Methodology, M.D., M.Z., M.K., and J.K.; Project administration, M.D., M.Z., and M.K.; Resources, M.D., M.Z., M.K., and J.K.; Software, M.D., M.Z., M.K., and J.K.; Supervision, M.D., M.Z., and M.K.; Validation, M.D., M.Z., and M.K.; Visualization, M.D., M.Z., and J.K.; Writing—original draft, M.D., M.Z., M.K., and J.K.; Writing—review & editing, M.D., M.K., and J.K. All authors have read and agreed to the published version of the manuscript.
Funding
The study was carried out in the framework of the statutory funds for research no. 29.610.023, financed by the Ministry of Science and Higher Education.
Conflicts of Interest
The authors declare no conflict of interest. The funders had no role in the design of the study; in the collection, analyses, or interpretation of data; in the writing of the manuscript, or in the decision to publish the results.
References
- Ekanthalu, V.S.; Morscheck, G.; Narra, S.; Nelles, M. Hydrothermal Carbonization—A Sustainable Approach to Deal with the Challenges in Sewage Sludge Management. In Urban Mining and Sustainable Waste Management; Springer: Singapore, 2020; pp. 293–302. [Google Scholar]
- Smol, M.; Adam, C.; Preisner, M. Circular economy model framework in the European water and wastewater sector. J. Mater. Cycles Waste Manag. 2020, 22, 682–697. [Google Scholar] [CrossRef] [Green Version]
- Bot, F.; Plazzotta, S.; Anese, M. Chapter 16—Treatment of Food Industry Wastewater with Ultrasound: A Big Opportunity for the Technology. Ultrasound Adv. Food Process. Preserv. 2017, 391–408. [Google Scholar] [CrossRef]
- Bhatti, Z.A.; Maqbool, F.; Malik, A.H.; Mehmood, Q. UASB reactor startup for the treatment of municipal wastewater followed by advanced oxidation process. Braz. J. Chem. Eng. 2014, 31, 715–726. [Google Scholar] [CrossRef] [Green Version]
- Schnürer, A.; Bohn, I.; Moestedt, J. Protocol for Start-Up and Operation of CSTR Biogas Processes. In Hydrocarbon and Lipid Microbiology Protocols; McGenity, T., Timmis, K., Nogales, B., Eds.; Springer Protocols Handbooks; Protocol for Start-Up and Operation of CSTR Biogas Processes; Springer: Berlin/Heidelberg, Germany, 2016; pp. 171–200. [Google Scholar]
- Rajeshwari, K.V.; Balakrishnan, M.; Kansal, A.; Lata, K.; Kishore, V.V.N. State-of-the-art of anaerobic digestion technology for industrial wastewater treatment. Renew. Sustain. Energy Rev. 2000, 4, 135–156. [Google Scholar] [CrossRef]
- Nelson, M.J.; Nakhla, G.; Zhu, J. Fluidized-Bed Bioreactor Applications for Biological Wastewater Treatment: A Review of Research and Developments. Engineering 2017, 3, 330–342. [Google Scholar] [CrossRef]
- Goli, A.; Shamiri, A.; Khosroyar, S.; Talaiekhozani, A.; Sanaye, R.; Azizi, K. A Review on Different Aerobic and Anaerobic Treatment Methods in Dairy Industry Wastewater. J. Environ. Treat. Tech. 2019, 6, 113–141. [Google Scholar]
- Leyva-Díaz, J.C.; Monteoliva-García, A.; Martín-Pascual, J.; Munio, M.M.; García-Mesa, J.J.; Poyatos, J.M. Moving bed biofilm reactor as an alternative wastewater treatment process for nutrient removal and recovery in the circular economy model. Bioresour. Technol. 2020, 299, 122631. [Google Scholar] [CrossRef]
- Cravotto, G.; Binello, A.; Di Carlo, S.; Orio, L.; Wu, Z.L.; Ondruschka, B. Oxidative degradation of chlorophenol derivatives promoted by microwaves or power ultrasound: A mechanism investigation. Environ. Sci. Pollut. Res. 2010, 17, 674–687. [Google Scholar] [CrossRef]
- Mishra, R.R.; Sharma, A.K. Microwave–material interaction phenomena: Heating mechanisms, challenges and opportunities in material processing-Review. Compos. Part A 2016, 81, 78–97. [Google Scholar] [CrossRef]
- Rocky Flats Technology Summary. 2001. Available online: http://www.nttc.edu/env/Rock–Flats/RF–chap1.html (accessed on 25 March 2020).
- Remya, N.; Lin, J.G. Current status of microwave application in wastewater treatment—A review. Chem. Eng. J. 2011, 166, 797–813. [Google Scholar] [CrossRef]
- Kappe, C.O. Controlled microwave heating in modern organic synthesis. Angew. Chem. 2004, 43–46, 6250–6284. [Google Scholar] [CrossRef]
- Gogate, P.R. Cavitation: An auxiliary technique in wastewater treatment schemes. Adv. Environ. Res. 2002, 6, 335–358. [Google Scholar] [CrossRef]
- Matouq, M.A.D.; Al-Anber, Z.A. The application of high frequency ultrasound waves to remove ammonia from simulated industrial wastewater. Ultrason. Sonochem. 2007, 14, 393–397. [Google Scholar] [CrossRef] [PubMed]
- Sangave, C.P.; Pandit, B.A. Ultrasound pre-treatment for enhanced biodegradability of the distillery wastewater. Ultrason. Sonochem. 2014, 11, 197–203. [Google Scholar] [CrossRef] [PubMed]
- Blume, T.; Neis, U. Improved wastewater disinfection by ultrasonic pre-treatment. Ultrason. Sonochem. 2004, 11, 333–336. [Google Scholar] [CrossRef]
- Kyllonen, H.; Pirkonen, P.; Nystrom, M.; Nuortila-Jokinen, J.; Gronroos, A. Experimental aspects of ultrasonically enhanced cross-flow membrane filtration of industrial wastewater. Ultrason. Sonochem. 2006, 13, 295–302. [Google Scholar] [CrossRef] [PubMed]
- Seungmin, N.; Young-Uk, K.; Jeehyeong, K. Physiochemical properties of digested sewage sludge with ultrasonic treatment. Ultrason. Sonochem. 2007, 14, 281–285. [Google Scholar]
- Sangave, C.P.; Pandit, B.A. Ultrasound and enzyme assisted biodegradation of distillery wastewater. J. Environ. Manag. 2006, 80, 36–46. [Google Scholar] [CrossRef]
- Oz, N.A.; Uzun, A.C. Ultrasound pretreatment for enhanced biogas production from olive mill wastewater. Ultrason. Sonochem. 2015, 22, 565–572. [Google Scholar] [CrossRef]
- Mischopoulou, M.; Naidis, P.; Kalamaras, S.; Kotsopoulos, T.A.; Samaras, P. Effect of ultrasonic and ozonation pretreatment on methane production potential of raw molasses wastewater. Renew. Energy 2016, 96, 1078–1085. [Google Scholar] [CrossRef]
- Gude, V.G. Microwave-Meditated Biofuel Production, 1st ed.; CRC Press: Boca-Ratón, FL, USA, 2017. [Google Scholar]
- Amini, A.; Aponte-Morales, V.; Wang, M.; Dilbeck, M.; Lahav, O.; Zhang, Q. Cost-effective treatment of swine wastes through recovery of energy and nutrients. Waste Manag. 2017, 69, 508–517. [Google Scholar] [CrossRef]
- Ma, H.; Guo, Y.; Qin, Y.; Li, Y.Y. Nutrient recovery technologies integrated with energy recovery by waste biomass anaerobic digestion. Bioresour. Technol. 2018, 269, 520–531. [Google Scholar] [CrossRef] [PubMed]
- Omil, F.; Garrido, J.M.; Arrojo, B.; Mendez, R. Anaerobic filter reactorperformance for the treatment of complex dairy wastewater AT industrial scale. Water Res. 2003, 37, 4099–4108. [Google Scholar] [CrossRef]
- Mendez, R.; Blazquez, R.; Lorenzo, F.; Lema, J.M. Anaerobic treatment of cheese whey: Start-up and operation. Water Sci. Technol. 1989, 21, 1857–1860. [Google Scholar] [CrossRef]
- Najafpour, G.D.; Hashemiyeh, B.A.; Asadi, M.; Ghasemi, M.B. Biological Treatment of Dairy Wastewater in an Upflow Anaerobic Sludge-Fixed Film Bioreactor American-Eurasian. J. Agric. Environ. Sci. 2008, 4, 251–257. [Google Scholar]
- Danalewich, J.R.; Papagiannis, T.G.; Belyea, R.L.; Tumbleson, M.E.; Raskin, L. Characterization of dairy waste streams, current treatment practices and potential for biological nutrient removal. Water Res. 1998, 32, 3555–3568. [Google Scholar] [CrossRef]
- Isik, M.; Sponza, D.T. Anaerobic/aerobic sequential treatment of a cotton textile mill wastewater. J. Chem. Technol. Biotechnol. 2004, 79, 1268–1274. [Google Scholar] [CrossRef]
- Sklyar, V.; Epov, A.; Gladchenko, M.; Danilovich, D.; Kalyuzhnyi, S. Combined biologic (anaerobic–aerobic) and chemical treatment of starch industry wastewater. Appl. Biochem. Biotechnol. 2003, 109, 253–262. [Google Scholar] [CrossRef] [Green Version]
- Ramasamy, E.V.; Gajalakshmi, S.; Sanjeevi, R.; Jithesh, M.N.; Abbasi, S.A. Feasibility studies on the treatment of dairy wastewaters with upflow anaerobic sludge blanket reactors. Bioresour. Technol. 2004, 93, 209–212. [Google Scholar] [CrossRef]
- Raj, S.A.; Murthy, D.V.S. Comparison of the trickling filtermodels for the treatment of synthetic dairy wastewater. Bioprocess Eng. 1999, 21, 51–55. [Google Scholar] [CrossRef]
- Göblös, S.; Portörő, P.; Bordás, D.; Kálmán, M.; Kiss, I. Comparison of the effectivities of two-phase and single-phase anaerobic sequencing batch reactors during dairy wastewater treatment. Renew. Energy 2008, 33, 960–965. [Google Scholar] [CrossRef]
- Kotsyurbenko, O.R.; Friedrich, M.W.; Simankova, M.V.; Nozhevnikova, A.N.; Golyshin, P.N.; Timmis, K.N.; Conrad, R. Shift from acetoclastic to H2-dependent methanogenesis in a West Siberian peat bog at low pH values and isolation of an acidophilic Methanobacterium strain. Appl. Environ. Microbiol. 2007, 73, 2344–2348. [Google Scholar] [CrossRef] [PubMed] [Green Version]
- Gabriel, C.; Gabriel, S.; Grant, E.H.; Halstead, B.S.J.; Mingos, D.M.P. Dielectric parameters relevant to microwave dielectric heating. Chem. Soc. Rev. 1998, 27, 213–223. [Google Scholar] [CrossRef]
- Banik, S.; Sharma, A.; Dan, D. Effect of microwave on cell biology of Methanosarcina Barkeri. J. Mycopathol. Res. 2003, 41, 217–219. [Google Scholar]
- Parker, M.C.; Besson, T.; Lamare, S.; Legoy, M.D. Microwave radiation can increase the rate of enzyme catalysed reaction in organic media. Tetrahedron Lett. 1996, 37, 8383–8386. [Google Scholar] [CrossRef]
- Sanjay, G.; Sugunan, S. Enhanced pH and thermal stabilities of invertase immobilized on montmorillonite K-10. Food Chem. 2006, 94, 573–579. [Google Scholar] [CrossRef] [Green Version]
- Fang, Y.; Sun, S.-Y.; Xia, Y.-M. The weakened 1,3-specificity in the consecutive microwave assisted enzymatic synthesis of glycerides. J. Mol. Catal. B Enzym. 2008, 55, 6–11. [Google Scholar] [CrossRef]
- Ahn, J.H.; Shinb, S.G.; Hwangb, S. Effect of microwave irradiation on the disintegration and acidogenesis of municipal secondary sludge. Chem. Eng. J. 2009, 153, 145–150. [Google Scholar] [CrossRef]
- Eskicioglu, C.; Kennedy, K.J.; Droste, R.L. Characterization of soluble organic of waste from sewage sludge before and after thermal pretreatment. Water Res. 2006, 40, 3725–3736. [Google Scholar] [CrossRef]
- Oz, N.A.; Yarimtepe, C.C. Ultrasound assisted biogas production from landfill leachate. Waste Manag. 2014, 34, 1165–1170. [Google Scholar] [CrossRef]
- Yarimtepe, C.C.; Oz, N.A. Investigation of the pretreatment effect of ultrasound on anaerobic sequencing batch reactor treating landfill leachate. WIT Transactions on Ecology and the Environment. Water Resour. Manag. IX 2017, 220, 93–98. [Google Scholar]
- Nivedha Ramanathan, R.M.; Balasubramanian, N.; Chithra, K. Biogas from confectionery wastewater with the application of ultrasound pre-treatment. Energy Sources Part A Recovery Util. Environ. Effects 2019. [Google Scholar] [CrossRef]
- Kavitha, S.; Rajesh Banu, J.; Kumar, G.; Kaliappan, S.; Yeom, I.T. Profitable ultrasonic assisted microwave disintegration of sludge biomass: Modelling of biomethanation and energy parameter analysis. Bioresour. Technol. 2018, 254, 203–213. [Google Scholar] [CrossRef] [PubMed]
- Yin, X.; Lu, X.; Han, P.; Wang, Y. Ultrasonic treatment on activated sewage sludge from petro-plant for reduction. Ultrasonics 2006, 44, e397–e399. [Google Scholar] [CrossRef] [PubMed]
- Witkowska, E.; Buczkowska, A.; Zamojska, A.; Szewczyk, K.W.; Ciosek, P. Monitoring of periodic anaerobic digestion with flow-through array of miniaturized ion-selective electrodes. Bioelectrochemistry 2010, 80, 87–93. [Google Scholar] [CrossRef]
- Begum, S.; Anupoju, G.R.; Sridhar, S.; Bhargava, S.K.; Jegatheesan, V.; Eshtiaghi, N. Evaluation of single and two stage anaerobic digestion of landfill leachate: Effect of pH and initial organic loading rate on volatile fatty acid (VFA) and biogas production. Bioresour. Technol. 2018, 251, 364–373. [Google Scholar] [CrossRef] [PubMed]
- Seghezzo, L.; Zeeman, G.; Van Lier, J.B.; Hamelers, H.V.M.; Lettinga, G. A review: The Anaerobic treatment of sewage in UASB and EGSB reactors. Bioresour. Technol. 1998, 65, 175–190. [Google Scholar] [CrossRef]
- Ozay, Y.; Ünşar, E.K.; Işık, Z.; Yılmaz, F.; Dizge, N.; Perendeci, N.A.; Mazmanci, M.A.; Yalvac, M. Optimization of electrocoagulation process and combination of anaerobic digestion for the treatment of pistachio processing wastewater. J. Clean. Prod. 2018, 196, 42–50. [Google Scholar] [CrossRef]
- Gerek, E.E.; Yılmaz, S.; Koparal, A.S.; Gerek, Ö.N. Combined energy and removal efficiency of electrochemical wastewater treatment for leather industry. J. Water Process Eng. 2019, 30, 100382. [Google Scholar] [CrossRef]
- Hiwarkar, A.D.; Singh, S.; Srivastava, V.C.; Mall, I.D. Mineralization of pyrrole, a recalcitrant heterocyclic compound, by electrochemical method: Multi-response optimization and degradation mechanism. J. Environ. Manag. 2017, 198, 144–152. [Google Scholar] [CrossRef]
- Ribera-Pi, J.; Badia-Fabregat, M.; Calderer, M.; Polášková, M.; Svojitka, J.; Rovira, M.; Jubany, I.; Martínez-Lladó, X. Anaerobic Membrane Bioreactor (AnMBR) for the Treatment of Cheese Whey for the Potential Recovery of Water and Energy. Waste Biomass Valorization 2020, 11, 1821–1835. [Google Scholar] [CrossRef]
- Masłoń, A. Energy Consumption of Selected Wastewater Treatment Plants Located in South-Eastern Poland. Eng. Prot. Environ. 2017, 20, 331–342. [Google Scholar] [CrossRef]
- Longo, S.; d’Antoni, B.M.; Bongards, M.; Chaparro, A.; Cronrath, A.; Fatone, F.; Lema, J.M.; Mauricio-Iglesias, M.; Soares, A.; Hospido, A. Monitoring and diagnosis of energy consumption in wastewater treatment plants. A state of the art. And proposals for improvement. Appl. Energy 2016, 176, 1251–1268. [Google Scholar] [CrossRef]
Figure 1.
Horizontal flow anaerobic reactor (HFAR) (a) schematic diagram, (b) photo. 1—influent; 2—effluent; 3—sludge recirculation; 4—mixing blade; 5—thermal insulation; 6—membrane module; 7—gas meter; 8—digestate; 9—gearmotor; 10—sampling port; GM—microwave generator; GU—ultrasonic generator.
Figure 1.
Horizontal flow anaerobic reactor (HFAR) (a) schematic diagram, (b) photo. 1—influent; 2—effluent; 3—sludge recirculation; 4—mixing blade; 5—thermal insulation; 6—membrane module; 7—gas meter; 8—digestate; 9—gearmotor; 10—sampling port; GM—microwave generator; GU—ultrasonic generator.

Figure 2.
Reactor equipment (a) microwave generator, (b) ultrasound generator.

Figure 3.
Concentrations of analyzed parameters in the effluent (a) COD, (b) TOC, (c) TN and (d) TP.
Figure 3.
Concentrations of analyzed parameters in the effluent (a) COD, (b) TOC, (c) TN and (d) TP.
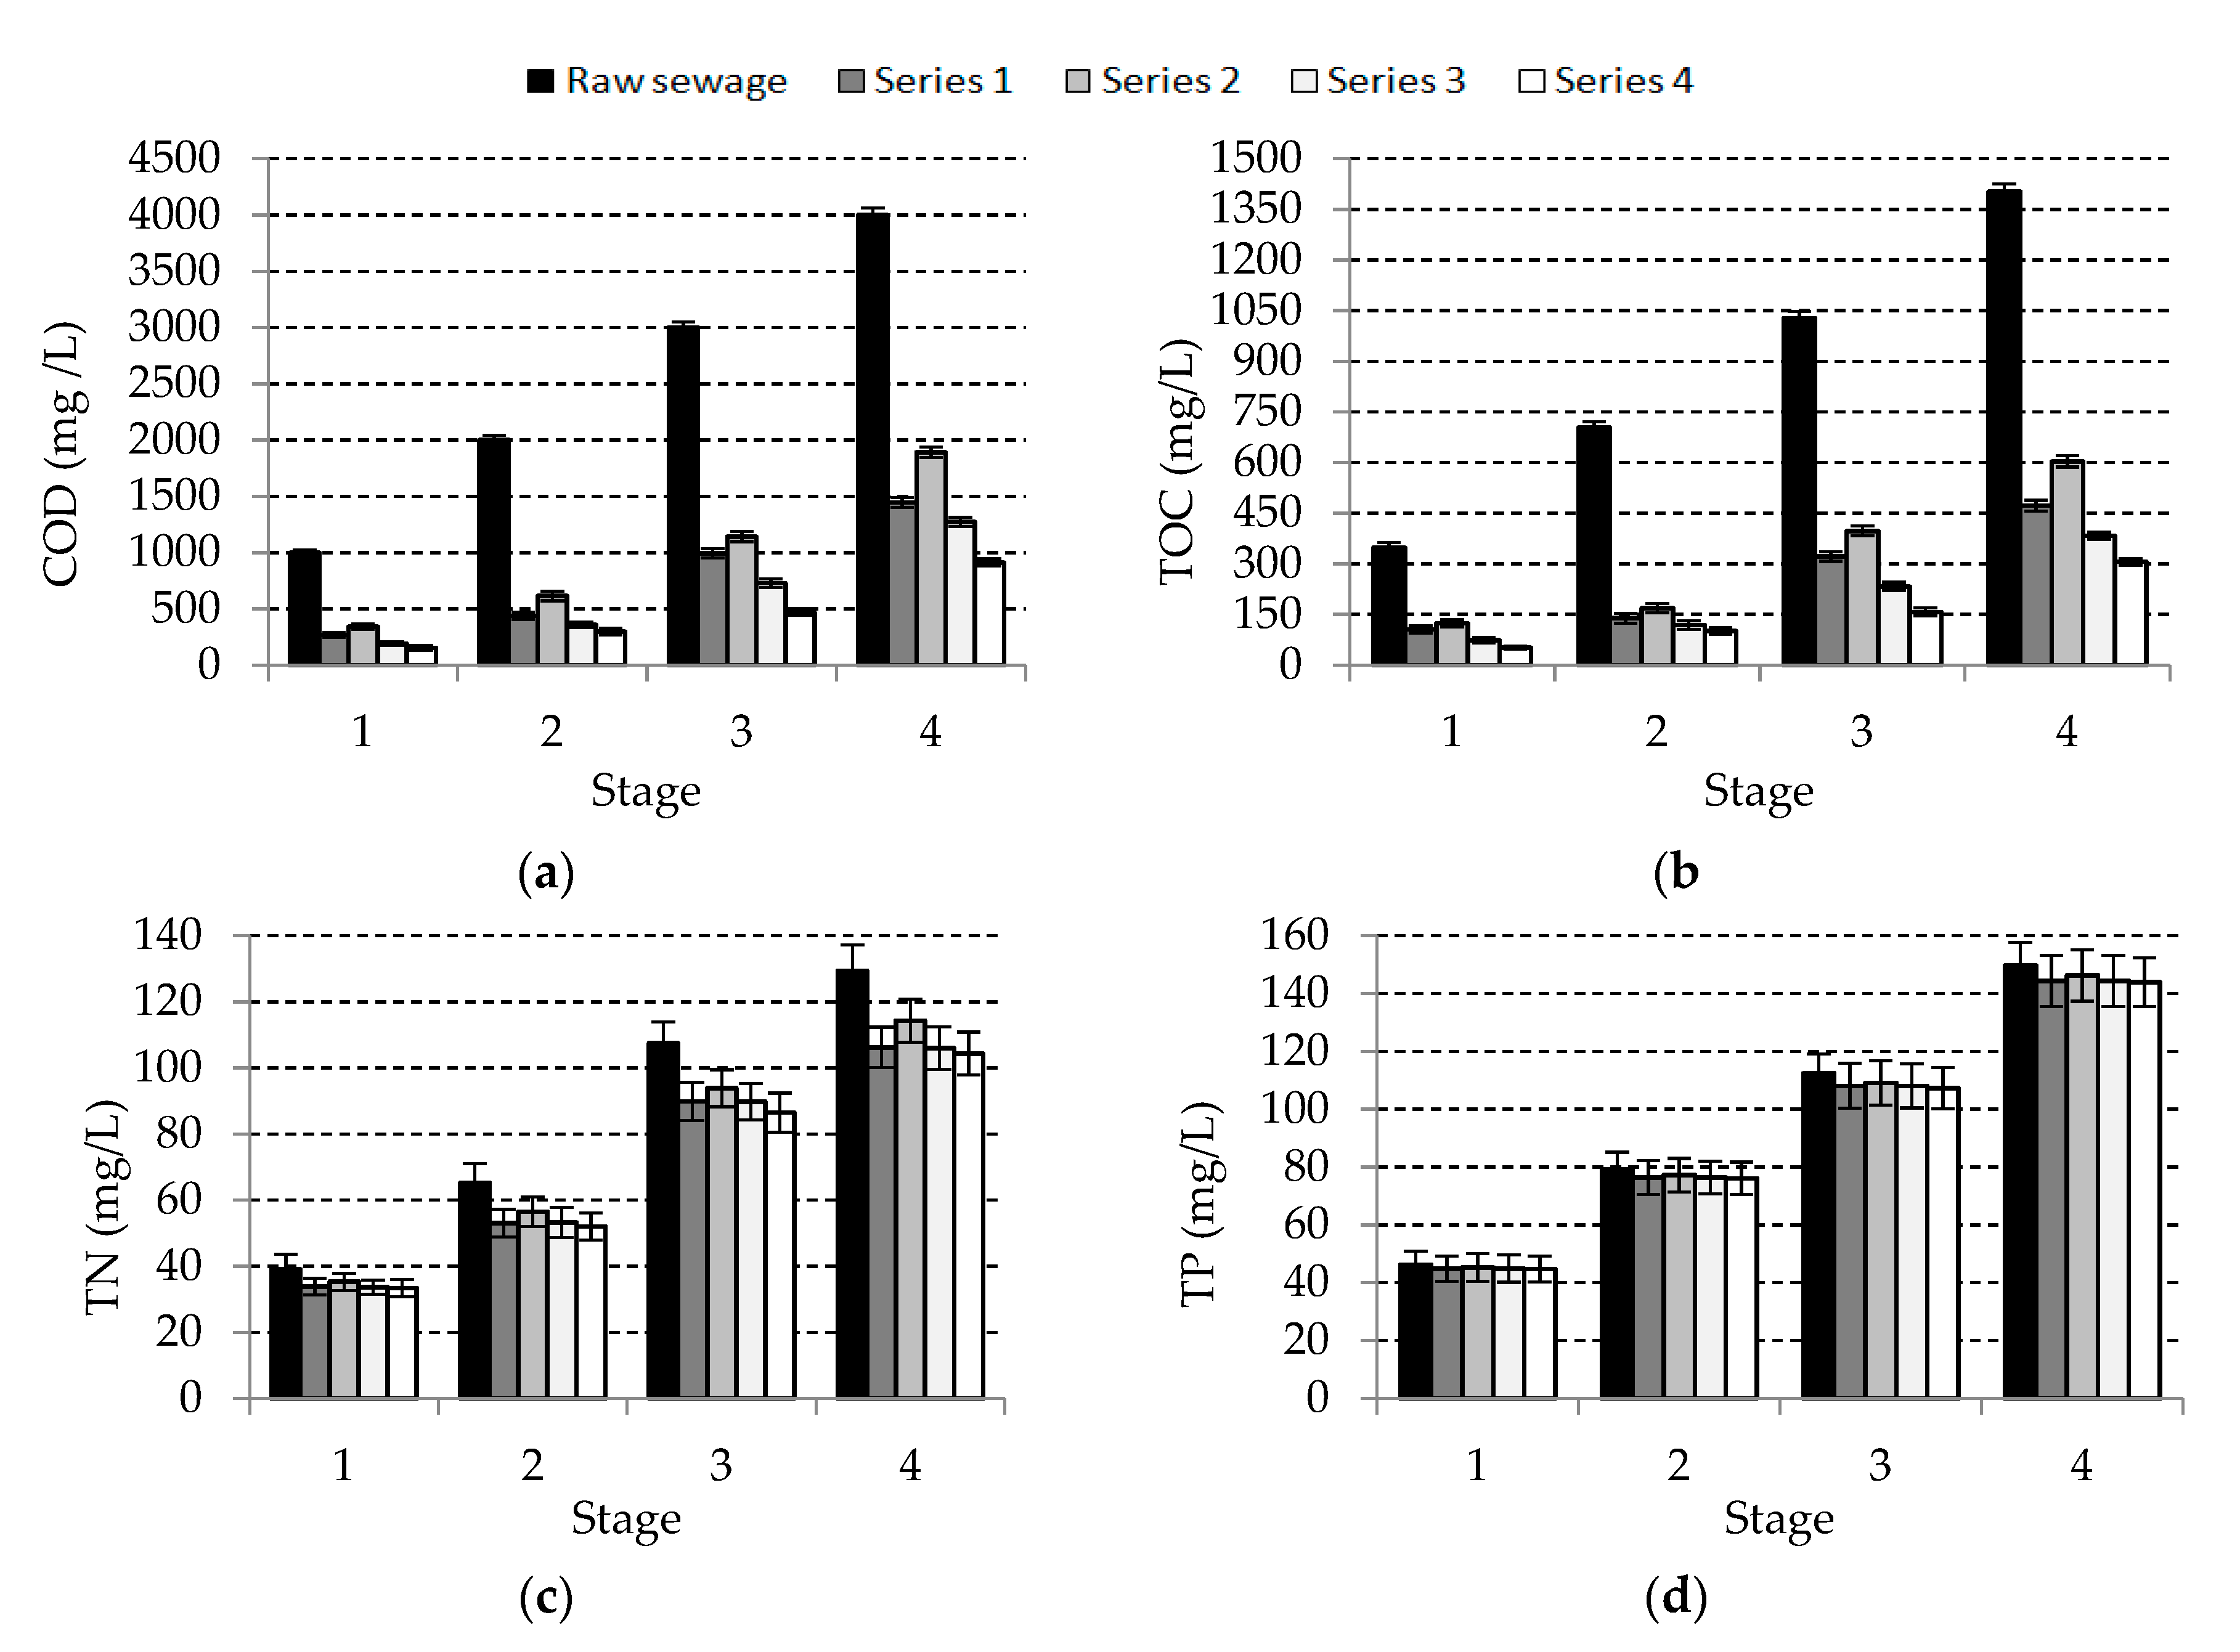
Figure 4.
(a) Daily biogas production and (b) biogas composition depending on experimental stages and series.
Figure 4.
(a) Daily biogas production and (b) biogas composition depending on experimental stages and series.
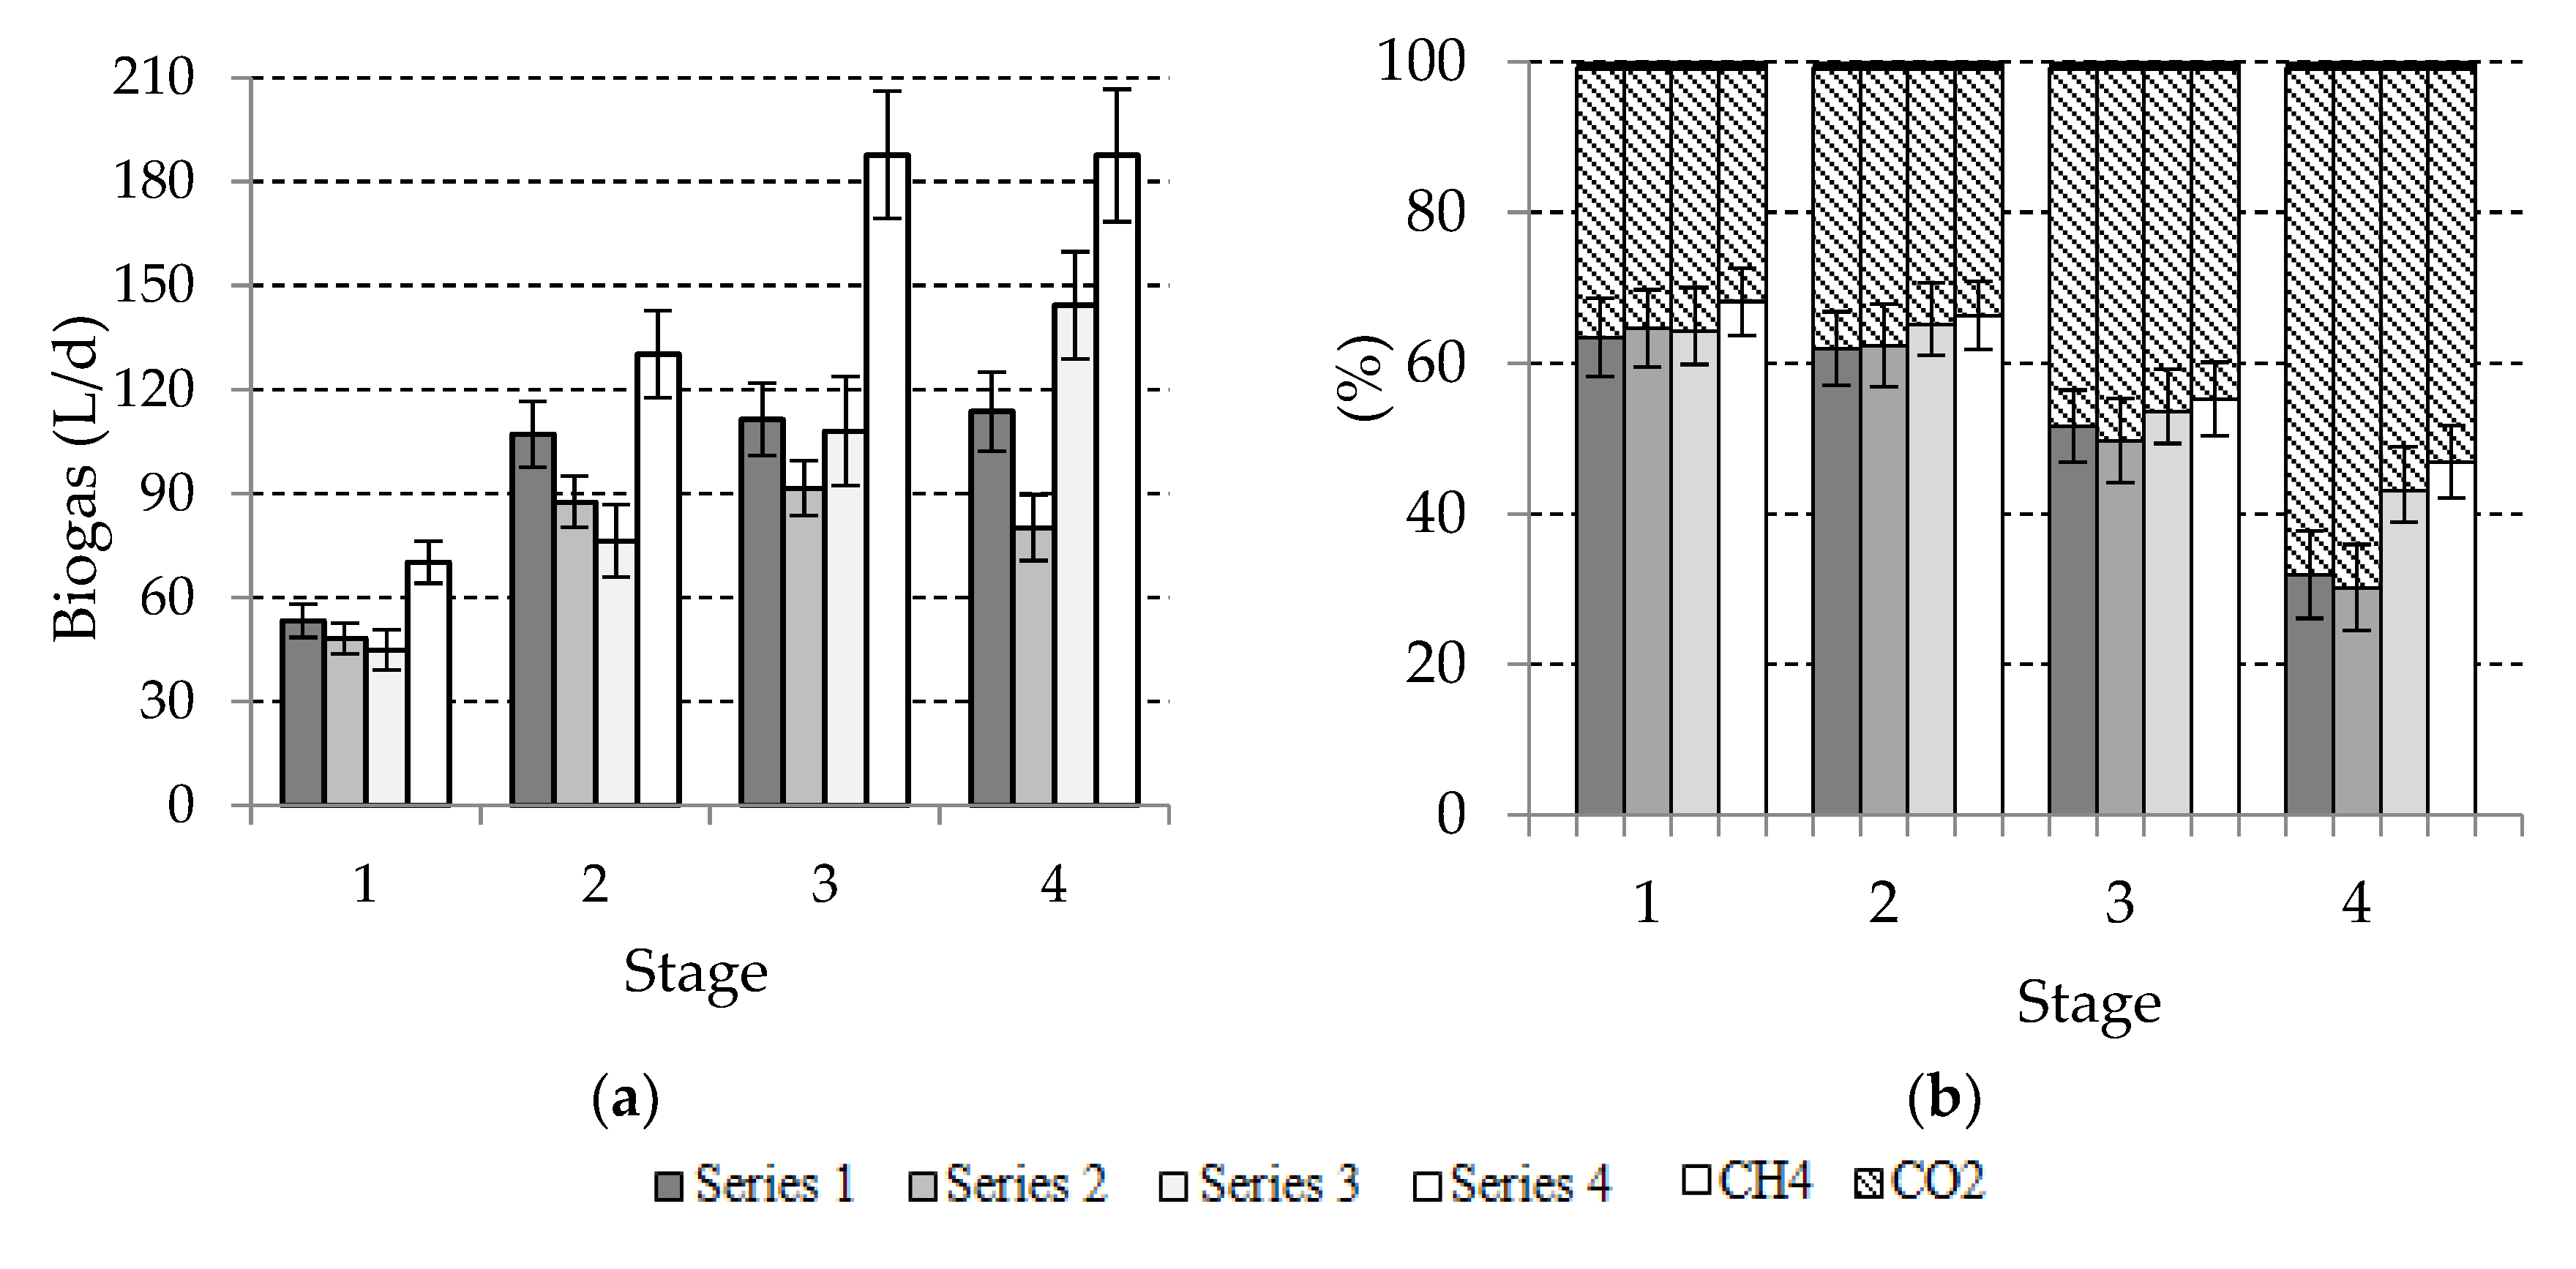
Figure 5.
The relationship between biogas and methane production and organic compounds’ removal (a) as COD, (b) as TOC.
Figure 5.
The relationship between biogas and methane production and organic compounds’ removal (a) as COD, (b) as TOC.
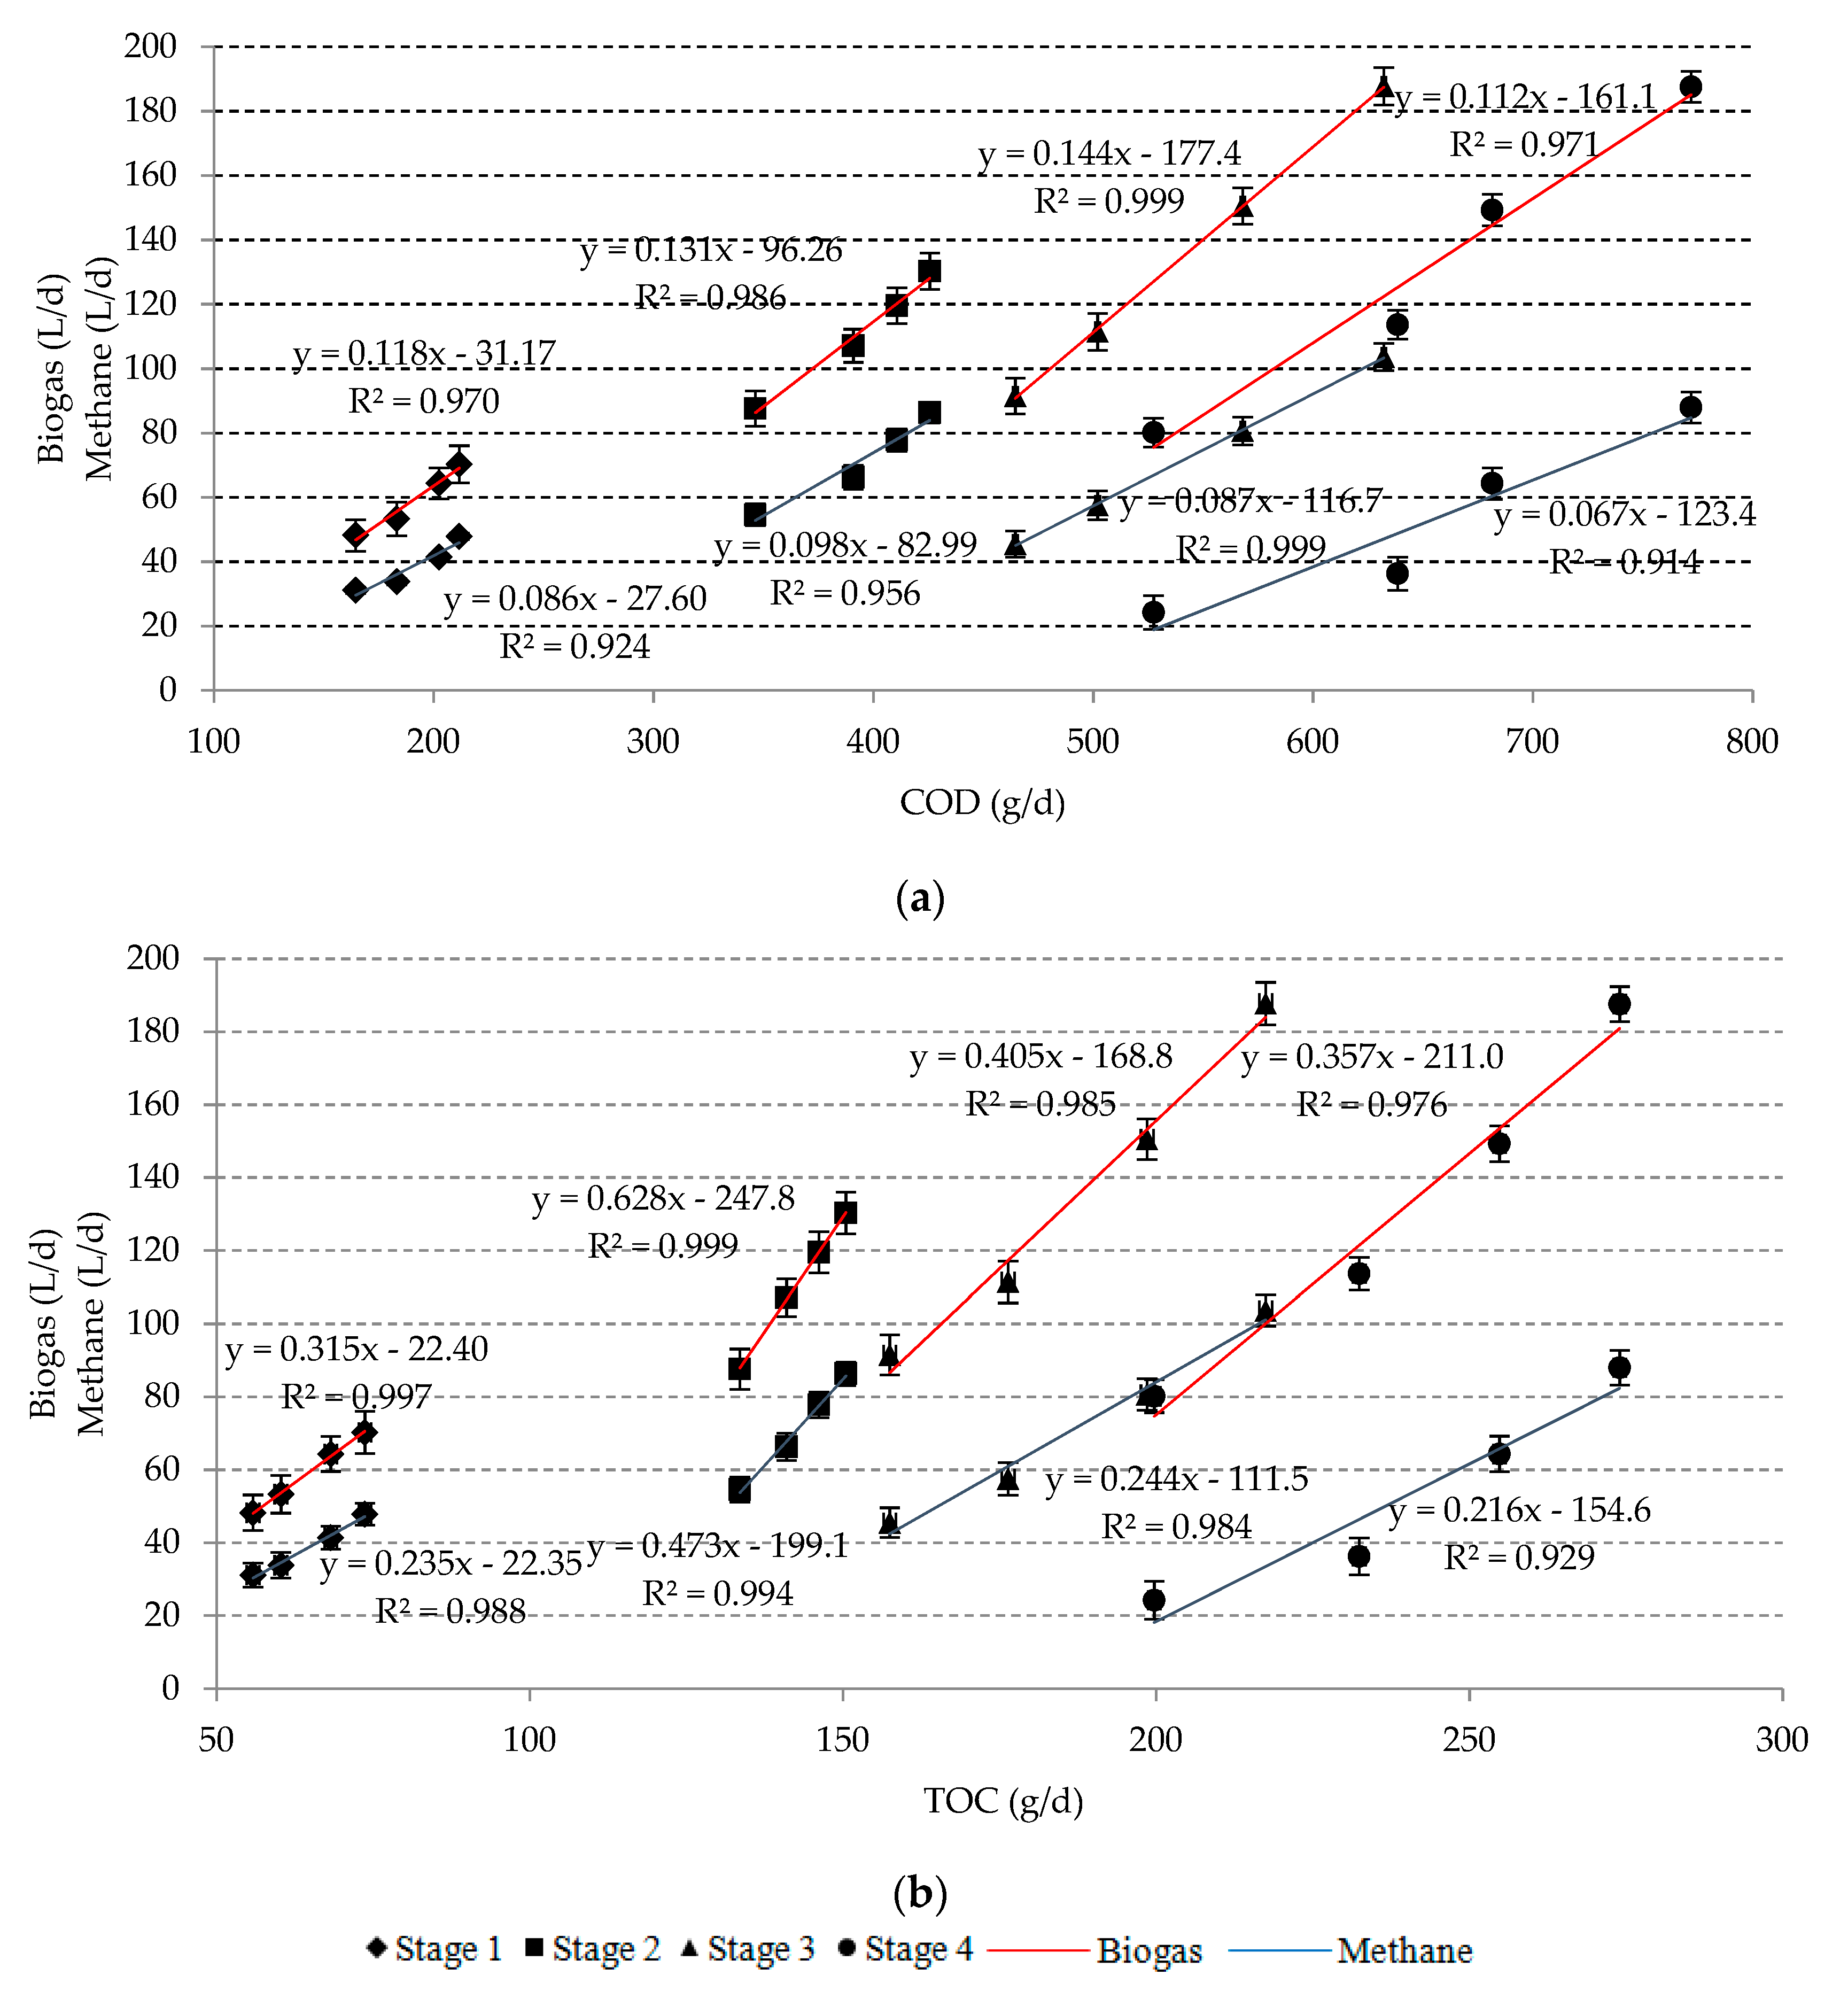
Figure 6.
Biomass growth yield coefficients (y) experimental stages.


Table 1.
Characteristics of dairy wastewater used in the experiment.
| Stage | Parameter | ||||
|---|---|---|---|---|---|
| COD (mg/L) | TOC (mg/L) | TP (mg/L) | TN (mg/L) | pH | |
| Raw Wastewater | 5138.4 ± 53.8 | 1780.9 ± 17.3 | 190.1 ± 7.2 | 164.3 ± 6.7 | 9.06 ± 0.24 |
| 1 | 1029 ± 20.5 | 347.3 ± 15.7 | 46.2 ± 4.7 | 39.1 ± 4.5 | 7.13 ± 0.25 |
| 2 | 2014 ± 40.4 | 703.2 ± 18.2 | 79.3 ± 5.8 | 65.3 ± 5.7 | 7.19 ± 0.22 |
| 3 | 3092 ± 50.2 | 1027.1 ± 20.1 | 112.4 ± 6.7 | 107.5 ± 6.4 | 7.09 ± 0.24 |
| 4 | 4046 ± 60.4 | 1402.3 ± 22.5 | 149.7 ± 7.9 | 129.4 ± 7.8 | 7.13 ± 0.21 |
Table 2.
Characteristics of the anaerobic inoculum used in the study.
| Parameter | Unit | Mean |
|---|---|---|
| Hydration | (%) | 95.6 ± 1.3 |
| Specific resistance to filtration | (m/kg) | 1.768 × 10¹⁵ ± 1.631 × 10¹⁴ |
| Capillary suction time | (s) | 1072 ± 175 |
| Total solids | (g/L) | 44.3 ± 4.9 |
| Mineral solids | (g/L) | 19.0 ± 1.3 |
| Volatile solids | (g/L) | 25.3 ± 3.6 |
| Filtrate COD | (mg/L) | 624.9 ± 84.0 |
| Orthophosphates in filtrate | (mg P-PO4/L) | 105.6 ± 24.0 |
| TN in filtrate | (mg TN/L) | 163.8 ± 17.5 |
| AN in filtrate | (mg N-NH4/L) | 144.2 ± 25.3 |
| pH | - | 7.75 ± 0.16 |
Table 3.
The efficiency of organic compounds and nutrient removal from dairy wastewater.
| Stage | Series | Removal Efficiency (%) | Load Removal (g/d) | ||||||
|---|---|---|---|---|---|---|---|---|---|
| COD | TOC | TN | TP | COD | TOC | TN | TP | ||
| 1 | 1 | 73.26 ± 1.63 | 69.51 ± 1.77 | 13.46 ± 3.20 | 2.84 ± 0.33 | 183.15 ± 18.25 | 60.35 ± 7.13 | 1.32 ± 0.11 | 0.33 ± 0.05 |
| 2 | 65.78 ± 1.71 | 64.38 ± 1.35 | 9.67 ± 3.36 | 2.04 ± 0.38 | 164.45 ± 14.54 | 55.90 ± 6.41 | 0.95 ± 0.12 | 0.24 ± 0.06 | |
| 3 | 80.93 ± 1.26 | 78.66 ± 1.42 | 13.88 ± 4.07 | 2.93 ± 0.27 | 202.33 ± 21.22 | 68.30 ± 6.62 | 1.36 ± 0.23 | 0.34 ± 0.05 | |
| 4 | 84.64 ± 1.73 | 84.94 ± 0.56 | 14.52 ± 2.86 | 3.06 ± 0.11 | 211.60 ± 20.05 | 73.75 ± 6.81 | 1.42 ± 0.24 | 0.35 ± 0.07 | |
| 2 | 1 | 78.18 ± 1.09 | 80.22 ± 1.51 | 18.69 ± 0.61 | 3.72 ± 0.37 | 390.88 ± 25.11 | 141.03 ± 8.91 | 3.05 ± 0.61 | 0.74 ± 0.12 |
| 2 | 69.26 ± 1.52 | 76.00 ± 1.22 | 13.46 ± 0.61 | 2.68 ± 0.18 | 346.28 ± 23.24 | 133.60 ± 8.44 | 2.20 ± 0.53 | 0.53 ± 0.08 | |
| 3 | 82.15 ± 0.92 | 83.18 ± 1.29 | 18.42 ± 0.07 | 3.67 ± 0.13 | 410.73 ± 25.13 | 146.23 ± 9.02 | 3.01 ± 0.60 | 0.73 ± 0.13 | |
| 4 | 85.13 ± 1.05 | 85.62 ± 1.04 | 20.36 ± 0.62 | 4.05 ± 0.04 | 425.65 ± 24.21 | 150.53 ± 9.92 | 3.32 ± 0.63 | 0.80 ± 0.15 | |
| 3 | 1 | 66.93 ± 0.80 | 68.69 ± 0.76 | 16.44 ± 0.40 | 3.86 ± 1.14 | 501.95 ± 21.81 | 176.38 ± 10.11 | 4.42 ± 0.70 | 1.08 ± 0.21 |
| 2 | 61.94 ± 0.85 | 61.33 ± 0.67 | 12.68 ± 0.01 | 2.98 ± 1.01 | 464.55 ± 16.44 | 157.48 ± 10.21 | 3.41 ± 0.62 | 0.84 ± 0.18 | |
| 3 | 75.73 ± 0.84 | 77.33 ± 0.76 | 16.53 ± 0.14 | 3.88 ± 0.97 | 567.98 ± 19.23 | 198.58 ± 11.04 | 4.44 ± 0.71 | 1.09 ± 0.22 | |
| 4 | 84.28 ± 0.74 | 84.70 ± 0.82 | 19.55 ± 0.66 | 4.59 ± 0.68 | 632.13 ± 24.31 | 217.50 ± 12.03 | 5.25 ± 0.82 | 1.29 ± 0.25 | |
| 4 | 1 | 63.84 ± 0.55 | 66.31 ± 0.56 | 17.92 ± 0.22 | 3.57 ± 0.81 | 638.43 ± 26.42 | 232.48 ± 12.64 | 5.80 ± 0.80 | 1.33 ± 0.31 |
| 2 | 52.75 ± 0.42 | 56.98 ± 0.48 | 11.69 ± 0.28 | 2.33 ± 0.75 | 527.45 ± 25.24 | 199.75 ± 10.61 | 3.78 ± 0.63 | 0.87 ± 0.18 | |
| 3 | 68.15 ± 0.53 | 72.70 ± 0.33 | 18.12 ± 0.01 | 3.61 ± 0.75 | 681.53 ± 23.64 | 254.88 ± 13.92 | 5.86 ± 0.81 | 1.35 ± 0.40 | |
| 4 | 77.19 ± 0.43 | 78.17 ± 0.36 | 19.38 ± 0.15 | 3.86 ± 0.51 | 771.90 ± 23.53 | 274.05 ± 14.63 | 6.27 ± 0.73 | 1.44 ± 0.35 | |
Table 4.
Biogas yield obtained in experimental series.
| Stage | Series | Biogas Yield | |||
|---|---|---|---|---|---|
| L/g COD Added | L/g COD Removed | L/g TOC Added | L/g TOC Removed | ||
| 1 | 1 | 0.21 ± 0.01 | 0.29 ± 0.02 | 0.61 ± 0.07 | 0.88 ± 0.12 |
| 2 | 0.19 ± 0.01 | 0.29 ± 0.02 | 0.55 ± 0.08 | 0.86 ± 0.11 | |
| 3 | 0.26 ± 0.01 | 0.32 ± 0.02 | 0.74 ± 0.06 | 0.94 ± 0.13 | |
| 4 | 0.28 ± 0.02 | 0.33 ± 0.03 | 0.81 ± 0.09 | 0.95 ± 0.12 | |
| 2 | 1 | 0.21 ± 0.01 | 0.27 ± 0.03 | 0.61 ± 0.04 | 0.76 ± 0.11 |
| 2 | 0.18 ± 0.01 | 0.25 ± 0.02 | 0.50 ± 0.05 | 0.66 ± 0.10 | |
| 3 | 0.24 ± 0.01 | 0.29 ± 0.02 | 0.68 ± 0.07 | 0.82 ± 0.11 | |
| 4 | 0.26 ± 0.02 | 0.31 ± 0.02 | 0.74 ± 0.11 | 0.87 ± 0.12 | |
| 3 | 1 | 0.15 ± 0.01 | 0.22 ± 0.01 | 0.43 ± 0.06 | 0.63 ± 0.09 |
| 2 | 0.12 ± 0.01 | 0.20 ± 0.01 | 0.36 ± 0.04 | 0.58 ± 0.08 | |
| 3 | 0.20 ± 0.01 | 0.27 ± 0.01 | 0.59 ± 0.05 | 0.76 ± 0.08 | |
| 4 | 0.25 ± 0.02 | 0.30 ± 0.02 | 0.73 ± 0.07 | 0.86 ± 0.07 | |
| 4 | 1 | 0.11 ± 0.01 | 0.18 ± 0.01 | 0.32 ± 0.04 | 0.49 ± 0.06 |
| 2 | 0.08 ± 0.01 | 0.15 ± 0.01 | 0.23 ± 0.03 | 0.40 ± 0.05 | |
| 3 | 0.15 ± 0.01 | 0.22 ± 0.01 | 0.43 ± 0.04 | 0.59 ± 0.06 | |
| 4 | 0.19 ± 0.01 | 0.24 ± 0.01 | 0.54 ± 0.04 | 0.68 ± 0.08 | |
Table 5.
Energy balance of wastewater treatment in HFAR.
| Stage | Series | Ultrasounds (kWh/d) | Mixing (kWh/d) | Microwave Heating (kWh/d) | Total Energy Demand (kWh/d) | Daily Biogas Production (L/d) | CH4 Concentration (%) | Daily CH4 Production (L/d) | Energetic Value of CH4 (kWh/L) | Total Energy Production (kWh/d) | Energy Balance (kWh/d) | Load of COD Removed (kg/d) | kwh/kg COD Removed |
|---|---|---|---|---|---|---|---|---|---|---|---|---|---|
| 1 | 1 | 0 | 1.4 | 1.15 | 2.55 | 53.30 | 63.4 | 33.8 | 0.00917 | 0.310 | −2.240 | 0.183 | 12.230 |
| 2 | 0.38 | 2.93 | 48.18 | 64.6 | 31.1 | 0.285 | −2.645 | 0.164 | 16.084 | ||||
| 3 | 0.19 | 2.74 | 64.34 | 64.3 | 41.4 | 0.379 | −2.361 | 0.202 | 11.669 | ||||
| 4 | 0.076 | 2.626 | 70.25 | 68.1 | 47.8 | 0.439 | −2.187 | 0.211 | 10.336 | ||||
| 2 | 1 | 0 | 1.4 | 1.15 | 2.55 | 107.10 | 61.9 | 66.3 | 0.608 | −1.942 | 0.391 | 4.968 | |
| 2 | 0.38 | 2.93 | 87.61 | 62.3 | 54.6 | 0.500 | −2.430 | 0.346 | 7.017 | ||||
| 3 | 0.19 | 2.74 | 119.52 | 65.1 | 77.8 | 0.714 | −2.026 | 0.411 | 4.933 | ||||
| 4 | 0.076 | 2.626 | 130.25 | 66.3 | 86.4 | 0.792 | −1.834 | 0.423 | 4.309 | ||||
| 3 | 1 | 0 | 1.4 | 1.15 | 2.55 | 111.43 | 51.6 | 57.5 | 0.527 | −2.023 | 0.502 | 4.030 | |
| 2 | 0.38 | 2.93 | 91.52 | 49.7 | 45.5 | 0.417 | −2.513 | 0.464 | 5.410 | ||||
| 3 | 0.19 | 2.74 | 150.51 | 53.6 | 80.7 | 0.740 | −2.000 | 0.568 | 3.521 | ||||
| 4 | 0.076 | 2.626 | 187.74 | 55.2 | 103.6 | 0.950 | −1.676 | 0.632 | 2.651 | ||||
| 4 | 1 | 0 | 1.4 | 1.15 | 2.55 | 113.64 | 31.9 | 36.3 | 0.332 | −2.218 | 0.638 | 3.474 | |
| 2 | 0.38 | 2.93 | 80.17 | 30.2 | 24.2 | 0.222 | −2.708 | 0.527 | 5.134 | ||||
| 3 | 0.19 | 2.74 | 149.25 | 43.1 | 64.3 | 0.590 | −2.150 | 0.681 | 3.155 | ||||
| 4 | 0.076 | 2.626 | 187.57 | 46.9 | 88.0 | 0.807 | −1.819 | 0.772 | 2.357 |
© 2020 by the authors. Licensee MDPI, Basel, Switzerland. This article is an open access article distributed under the terms and conditions of the Creative Commons Attribution (CC BY) license (http://creativecommons.org/licenses/by/4.0/).
Share and Cite
MDPI and ACS Style
Dębowski, M.; Zieliński, M.; Kisielewska, M.; Kazimierowicz, J. Evaluation of Anaerobic Digestion of Dairy Wastewater in an Innovative Multi-Section Horizontal Flow Reactor. Energies 2020, 13, 2392. https://doi.org/10.3390/en13092392
AMA Style
Dębowski M, Zieliński M, Kisielewska M, Kazimierowicz J. Evaluation of Anaerobic Digestion of Dairy Wastewater in an Innovative Multi-Section Horizontal Flow Reactor. Energies. 2020; 13(9):2392. https://doi.org/10.3390/en13092392
Chicago/Turabian StyleDębowski, Marcin, Marcin Zieliński, Marta Kisielewska, and Joanna Kazimierowicz. 2020. "Evaluation of Anaerobic Digestion of Dairy Wastewater in an Innovative Multi-Section Horizontal Flow Reactor" Energies 13, no. 9: 2392. https://doi.org/10.3390/en13092392
Note that from the first issue of 2016, this journal uses article numbers instead of page numbers. See further details here.